Embed Size (px)
Citation preview

REPORT TO SOCIETY
2012 Assurance, Risk and Compliance Supplement

This supplement provides additional information on the production and content of the De Beers Group of Companies’ 2012 Report to Society. De Beers is committed to reporting transparently and accurately on its financial and non-financial performance. We engage with stakeholders on a continuous basis to identify and understand their expectations of us as a business, including our approach to reporting.
This supplement describes our risk-based approach to reporting, and details the sustainability risks that we identified for prioritisation in the 2012 Report to Society. It also provides additional information on the process we undertook in 2012 to shape and inform the content of the Report to Society, and provides
assurance on the information provided in the report. This includes first party assurance on internal audit and risk management by De Beers’ Manager for Internal Audit; third-party assurance on the Best Practice Principles Assurance Programme by SGS; and the third-party assurance and verification opinion of SGS UK Ltd on the 2012 Report to Society.
In their independent assurance of the Report to Society, SGS UK Ltd was of the opinion that De Beers’ reporting was in line with Application level A+ of the Global Reporting Initiative (GRI) (see below). This supplement also provides a GRI Compliance Table, which we have prepared to help stakeholders quickly find the information they are seeking.
These documents are available for download from
www.debeersgroup.com.
Page number references provided in this supplement are for the
2012 Report to Society (RtS), except where noted as being for the
2012 Operating and Financial Review (OFR).
2012 Report to Society 2012 Operating and
Financial Review
SGS United Kingdom Ltd was commissioned by De Beers to conduct an independent assurance of the
2012 De Beers Report to Society.
In addition we have carried out a full evaluation of the GRI Application Level against GRI G3 (2006)
and the requirements of the GRI Mining and Metals Sector supplement. This evaluation includes
the contents of the Report to Society, the GRI compliance table contained in this supplement,
and the 2012 Operating and Financial Review.
We are of the opinion that De Beers’ reporting is in line with Application level A+.
Our full assurance statement can be found in the 2012 Report to Society, p66-67.
FeedbackWe appreciate your feedback on the 2012 Report to Society or any
other aspect of our sustainability performance. Please contact us at:
Corporate Affairs
De Beers UK Ltd, 17 Charterhouse Street, London EC1N 6RA
T +44 (0) 207 404 4444
www.debeersgroup.com
Reports referenced
Independent AssuranceStatement
Introduction
2012 Assurance, Risk, and Compliance Supplement
1

05
09
15
04
08
13
06
1007
11
04 Our approach to
reporting
10 Environment
05 Sustainability risk
matrix
11 Improving our
sustainability
performance
06 Economics
13 First-party assurance
on internal audit and
risk management
07 Ethics15 Third-party assurance
on the BPP Assurance
Programme
08 Employees 17 GRI Compliance Table
09 Communities
Contents
17
03 03 Managing our
sustainability risks
2012 Assurance, Risk, and Compliance Supplement
2

Each year, three interlinked risk review processes are undertaken across
the Group of Companies.
These risk management processes are built on a systematic
‘bottom-up’ reporting process. Individual risk reports are submitted by
each of our operations, consolidated by a network of ‘Risk Champions’,
for review by committees with responsibility for the management of
specific types of risks.
These committees can then mandate additional management steps
to mitigate identified risks, if required, and escalate material risks to
the DBsa Board.
Managing our sustainability risksWe have comprehensive systems in place to manage and mitigate those risks that can adversely aff ect our commercial interests by
undermining consumer confi dence in diamonds, impacting our licence to operate, or restricting access to new resources.
DBsa ExCo
Summaries of
consolidated Group,
ECOHS and reputation and
sustainability risks
Operations
Business units/
Functional Groups
Fig. 1
The risk review process DBsa Board
Group Risk ChampionECA Risk Champion
Principles Committee
Consolidated Reputation and
Sustainability Risk Report
DBsa ECOHS Committee
Consolidated risk summaries for
each ECOHS discipline
DBsa Audit Committee
Consolidated DBsa Risk
Management report
ECOHS discipline leads
A
C
B
Reporting or communication line
Communication back to the business
Risk management summaries presented to the Executive Committee
Three interlinked risk review processes are
undertaken across the business each year. In these
processes, risks reported by operations and
functions are consolidated by a network of ‘Risk
Champions’ for review by committees with
responsibility for the management of specific types
of risks. These committees can then mandate
additional management steps to mitigate identified
risks, if required, and report on risk management to
the DBsa Board.
The three risk review processes cover:
A. Headline risks, strategic and operational risks and
reputation and sustainability risks. Undertaken twice
a year, this is the primary process for identifying and
managing risks across the Group of Companies.
In this process, risks are identified and their
management reviewed at operations and by function.
The risk collection and collation process is managed
by the Group Risk Champion, who reports to the DBsa
Audit Committee and Board through the CEO, with
a summary of risks from this review process then
sent to the Executive Committee.
B. Environment, Community, Occupational Health and
Safety (ECOHS) risks. Each quarter, ECOHS leads report
to the ECOHS Committee on key risks in their discipline,
drawing on information provided by members of their
respective peer groups. A summary of these key risks
is also provided to the Executive Committee.
C. Reputation and sustainability risks. At each Principles
Committee meeting, a summary of reputation and
sustainability risks compiled by the Corporate Affairs
Risk Champion is reviewed, and a report subsequently
submitted to the Executive Committee.
2012 Assurance, Risk, and Compliance Supplement
3

A risk-based approach to reporting
We use a sustainability risk matrix (see p5) to evaluate the short-,
medium- and long-term risks that are most material to our stakeholders
and to our business. The matrix is developed using outputs from our
risk identification process and from our engagement with stakeholders.
Each year we go through a robust process to identify all of the potential
risks we could report on and to prioritise those that are most material.
Firstly, we compare risks identified through our ongoing internal risk
management processes with those reported externally the previous
year, and consult with risk owners across the business on the location
and definition of risks on our sustainability risk matrix.
Following this, we engage with external stakeholders via our annual
Multi-Stakeholder Forum (see p11) to check that our assessment fits
with stakeholder concerns and expectations. Based on this feedback,
we modify the matrix as necessary.
We also complete an annual Managers’ Perception Survey to gather
internal feedback on our approach, and the Report to Society. The 2012
Assurance, Risk and Compliance Supplement gives details on the
specific feedback gained from these two engagement processes.
Material risks in 2012
Each of the chapters within the 2012 Report to Society includes an
individual sustainability risk matrix. The purpose of the matrix is to
articulate the short-, medium-, and longer-term risks most material to
the reputation and sustainability of the business (Fig. 2). Business risk
includes both the likelihood of a risk manifesting itself and the potential
impact that it would have on our business (i.e. direct risk). Stakeholder
materiality is based on the degree to which stakeholders consider an
issue relevant and material, and the ability of those stakeholders to
have an impact on our business (i.e. indirect risk).
In 2012, we identified a total of 29 sustainability risks and these are
shown in the sustainability risk matrix on the following page. We have
prioritised 22 of these risks across all five sustainability areas to cover
in the 2012 Report to Society.
Key changes from the risk matrix presented in 2011 include removal of
the ‘Managing organisational change’ risk, which originally reflected
the impact of the global financial crisis. Aspects of this risk that are still
relevant are now included within the ‘Attracting and retaining talent’
risk. For 2012, we have prioritised two risks previously only highlighted
in the risk matrix; ‘Diversity and inclusion’ and ‘Respect for protected
areas, key biodiversity areas or World Heritage sites’. Full descriptions
of our sustainability risks are provided in the following pages.
An award-winning report
Our 2011 Report to Society again won Best Overall Sustainability
Report and Best Extractive Sector Report in the ACCA South Africa
Sustainability Reporting Awards. This is the third year running that
our Report to Society has won these two awards.
Internal and External Assurance
The 2012 Report to Society, and the data presented within it, is assured
by internal and external parties. De Beers Internal Audit provides
assurance on selected material issues including internal auditing, the
Best Practice Principles, the Kimberley Process, anti-money laundering
and integrated reporting. Principles Committee provides oversight of
the report as a whole, and Audit Committee provides oversight of
our approach to integrated reporting, as recommended by the
South Africa King III Report – an international benchmark on Corporate
Governance.
For the third year, our external assurer, Société Générale de Surveillance
(SGS), has verified our Report to Society. Their assurance statement
for this report can be found on pages 15–16 of this supplement.
Fig. 2
Our risk matrix approach to reporting
Stakeholder materiality
Bu
sin
ess
ris
k
Not reported
LOW RISK
Selectively reported
MEDIUM RISK
Selectively reported
MEDIUM RISK
In-depth focus in this
Report to Society 2012
HIGH RISK
Our approach to reportingOur reporting is focused on disclosing our performance on those risks that are both important
to our stakeholders and have the potential to adversely aff ect the De Beers Group of Companies.
2012 Assurance, Risk, and Compliance Supplement
4

Sustainability risk matrix
Short term (0-3 years)
Medium term (3-10 years)
Long term (10+ years,
or perennial risk)
Risks explored in Report to Society 2012 Risks identified but not reported
2012 Assurance and Compliance Supplement
5
Economics1.1 Delivering value to
producers1.2 Governance and revenue
transparency1.3 Success of beneficiation1.4 Driving local growth,
diversification and capacity building
1.5 Driving and maintaining demand
1.6 Access to new reserves and sustainable relationships in new territories
Ethics2.1 Kimberley Process and
System of Warranties credibility
2.2 Anti-corruption2.3 Illicit trade and diamond
security 2.4 Maintaining pipeline and
sector standards2.5 Legal compliance, e.g.
competition law2.6 Human rights
Employees3.1 Safety performance 3.2 Attracting and retaining
talent3.3 Occupational health and
wellbeing3.4 HIV and tuberculosis3.5 Diversity and inclusion 3.6 Compliance with
international labour standards
Communities4.1 Effective community
relations4.2 Socio-economic benefit4.3 Resettlement4.4 Social impact of closures
and transfer of assets4.5 Managing land claims
Environment5.1 Maintaining environmental
standards5.2 Water and energy security
in a changing climate5.3 Lifecycle planning5.4 Promotion and
maintenance of biodiversity and ecosystems
5.5 Respect for protected areas, key biodiversity areas or World Heritage Sites
5.6 Management of waste and pollution prevention
The matrix below sets out the sustainability risks identified over the course of 2012. We classify these
based on the risk they pose to our business and the degree to which they are material to stakeholders.
The risks in bold are reported in this Report to Society.
All risks identified on the matrix have perennial aspects. The duration, or ‘term’, refers to the time-frame within
which a specific aspect of a risk is expected to manifest or impact the business. For example, uncertainty in the
global economy is a short-term aspect of the risk of not ‘Delivering value to producers’.
Stakeholder materiality
Bu
sin
ess
ris
k (i
mp
act
/lik
eli
ho
od
) 5.3
5.5
5.2
5.4
5.1
5.6
4.1
4.3
4.2
4.4
4.5
3.2
3.5
3.1
3.4
3.3
3.6
2.1
2.3
2.2
2.4
2.5
2.6
1.1
1.2
1.3
1.4
1.5
1.6

Stakeholder materiality
Bu
sin
ess
risk
(im
pac
t/lik
elih
oo
d)
1.1
1.2
1.3
1.4
1.5
1.6
KEY:
Long term Medium term Short term
Risks explored in Report to Society 2012 Risks
www.debeersgroup.com
1.1 Delivering value to producers
Diamonds generate revenue for our producer partners for the life
of our mining activities. Used productively, these revenues are a
catalyst for sustainable development and longer-term economic
value creation. Ongoing economic uncertainty in global markets
highlights the need for resources to be managed prudently. In
producer countries the clear communication of De Beers’ role in
creating long-term value from diamond revenues is essential to
maintaining our reputation and licence to operate.
1.2 Governance and revenue transparency
Strong governance and transparency underpin the reputation of
diamonds, and ensure that diamonds help to drive local development.
Weak governance systems undermine the maximisation of diamond
resources and the equitable distribution of diamond revenues. The
significant role De Beers plays in host country economies means
transparency is vital.
1.3 Success of benefi ciation
Ongoing economic uncertainty can significantly impact on the
success of downstream diamond sorting, cutting and polishing,
local procurement and enterprise development schemes in
producer countries.
1.4 Driving local growth, diversifi cation and capacity building
Operations that are not managed to maximise their contribution to
local growth and capacity building undermine the company’s licence
to operate and the diversification of the economy that will ensure
long-term economic stability and viable post-mining futures.
1.5 Driving and maintaining demand
As a leading participant in the diamond sector, the Group of Companies
seeks to maintain consumer confidence and drive demand for
diamonds in key markets around the world. This means ensuring that
consumers will continue to associate our diamonds with the highest
standards of quality and integrity.
1.6 Access to new reserves and sustainable relationships
in new territories
With no new major diamond discoveries in over a decade outside of
Zimbabwe, and global demand predicted to outstrip supply, access to
new reserves is crucial to the sustainability of the business. Likewise, our
ability to build sustainable relationships with future business partners is
critical to our security of supply.
EconomicsDiamonds have contributed signifi cantly to development in producer countries, but as a fi nite resource the success of diamond mining is ultimately measured by its ability to catalyse sustainable economic and social development
that endures beyond the life of a mine.
Economics Risks
2012 Assurance, Risk, and Compliance Supplement
6

Ethics Risks
KEY:
Long term Medium term Short term
Risks explored in Report to Society 2012 Risks
www.debeersgroup.com
2.1 Kimberley Process and System of Warranties credibility
Threats to the credibility of the Kimberley Process – a certification
scheme to eliminate conflict diamonds from the legitimate diamond
supply chain – present a risk to the reputation and sustainability of the
industry by calling into question the assurances provided to consumers,
governments and regulators in key markets that diamonds are from
conflict-free sources.
2.2 Anti-corruption
Corruption poses serious legal, commercial and reputational risks to our
business, while the corrosive social, political and economic effects of
corruption pose a potential threat to the sustainable development and
enduring stability of the environments in which we operate.
2.3 Illicit trade and diamond security
Global illicit trade by criminal networks affects many luxury goods
categories, undermining legitimate business, trade and undermining
social development. In the diamond industry this is represented
by theft from mining, sorting, valuation and sales operations and
laundering of stolen goods through established trading and
processing facilities.
Product theft at our operations is a multi-faceted risk. The involvement
of criminal syndicates exposes our employees to coercion and
facilitates the entry of diamonds into the illicit economy, including
for potential use in money-laundering activities. Beyond its impact
on our reputation and diamond equity more broadly, product
theft impairs our financial performance, so reducing the revenues
available to our producer governments to maximise the resource
for sustainable development.
2.4 Maintaining pipeline and sector standards
Unethical, illegal or harmful practices in the diamond pipeline have the
potential to undermine the distinct allure of diamonds. However, the
consolidation of ethical codes of conduct across the jewellery industry
presents both a risk and opportunity for the company. De Beers, our
joint venture partners, contractors and Sightholders subscribe to the
Best Practice Principles Assurance Programme (BPPs) – a mandatory
code of ethical business conduct – and a foundational element in the
pipeline integrity promise of Forevermark, De Beers’ proprietary
diamond brand.
2.5 Legal compliance, e.g. competition law
De Beers is committed to ensuring compliance with competition and
anti-trust laws and regulations in all of the jurisdictions in which we
operate. We maintain a ‘zero-tolerance’ stance towards any
non-compliance.
2.6 Human rights
Human rights violations associated with the diamond sector have
the potential to undermine consumer confidence in diamonds.
De Beers takes its responsibility to respect human rights seriously.
Our commitment to respect the human rights of both those in the
diamond industry and those affected by it is embodied in a range
of policies, processes, and mutli-stakeholder initiatives spanning
conflict diamonds, ethical business conduct, and resource revenue
transparency.
EthicsThe ethical integrity of diamonds underpins their fi nancial and emotional value, what we call ‘diamond equity’.
We are fully committed to maintaining diamond equity as it protects our reputation, our businesses and the long-term value that diamonds can deliver for development.
Stakeholder materiality
Bu
sin
ess
risk
(im
pac
t/lik
elih
oo
d)
2.1
2.3
2.2
2.4
2.5
2.6
2012 Assurance, Risk, and Compliance Supplement
7

Employees Risks
KEY:
Long term Medium term Short term
Risks explored in Report to Society 2012 Risks
www.debeersgroup.com
3.1 Safety performance
The safety of our employees and contractors remains one of our top
priorities. The effective management of hazards protects our people
from harm, and ensures our business complies with regulatory and
legal standards.
3.2 Attracting and retaining talent
Our ability to remain agile and responsive to changing market
conditions is dependent on our ability to attract and retain talent in an
increasingly competitive global employment market. Retaining and
supporting the development of all our employees is core to delivering
on our goals as a business, and those of our producer partner countries.
Organisational changes and business developments, such as the
integration of De Beers Group into the Anglo American plc group, and
the relocation of Sightholder Sales to Botswana, present specific risks
and opportunities, in attracting and retaining talent.
3.3 Occupational health and wellbeing
The health of employees has wide-ranging impact both inside and
outside the workplace. Occupational diseases reflect past, not current,
workplace exposures to health hazards, and may manifest long after
employment has ended. Protecting employees from health hazards
and maximising their physical and mental wellbeing are the
cornerstones of our occupational health focus.
3.4 HIV and tuberculosis
The majority of our employees live in countries classified as
hyper-endemic for HIV. Our goal is for all employees to know both their
HIV status, and that of other associated health risks, such as tuberculosis.
The prevention and management of both conditions are our priorities,
for the wellbeing of our employees and their families, the continuity of
our business and continued national development.
3.5 Diversity and inclusion
We are committed, and in some jurisdictions required, to ensure our
workforce is reflective of the diverse societies in which we operate. Our
continued support of government efforts in southern Africa for the
provision of opportunities to previously disadvantaged groups
strengthens our workforce and the communities in which we operate.
3.6 Compliance with international labour standards
Ensuring a safe, respectful and fair workplace is a priority across all
business units. We aim to meet or exceed all relevant global labour
standards in addition to respecting the right of employees to associate
freely and bargain collectively. Compliance serves as a foundation for
employee engagement, and to protect diamond equity.
EmployeesThe ongoing success of our business depends on the talent and passion of our people. We aim to create
a working culture where all employees are engaged and supported to take a shared responsibility for the delivery of our business goals.
Stakeholder materiality
Bu
sin
ess
risk
(im
pac
t/lik
elih
oo
d)
3.2
3.5
3.1
3.4
3.3
3.6
In 2011, ‘Managing organisational change’ was reported as a separate risk. Following this year’s risk review, it was decided that these issues should be included in the ‘Attracting and retaining talent’ risk for 2012, and have been reported as such.
2012 Assurance, Risk, and Compliance Supplement
8

KEY:
Long term Medium term Short term
Risks explored in Report to Society 2012 Risks
www.debeersgroup.com
4.1 Eff ective community relations
Constructive, frank and stable relationships with local communities and
other interested parties are key to maximising the potential local, social
and economic benefits of our operations and reducing the risk of
operational disruption or reputational damage as a result of conflict
with a community. Stable relationships with local communities also
underwrite our efforts to generate lasting socio-economic benefits at
a local level and to maintain our social licence to operate.
4.2 Socio-economic benefi t
Sustainable social investment can help to create a diversified local
post-mining economy. Ensuring that this investment benefits the
community beyond the life of our operations and is in line with broader
regional and national development goals maintains our social licence
to operate, supports a positive legacy from mining, and protects
against future risks to reputation.
4.3 Resettlement
The resettlement of communities without adequate consultation,
conducted on the principles of informed consent and mutual respect,
can create unresolvable tensions and reduce the eligibility of the
project to secure finance from Equator Principles signatory banks.
4.4 Social impact of closures and transfer of assets
Mine closure and the transfer of assets such as hospitals or company
settlements to public administration have multiple socio-economic
impacts and risks. The effective management and mitigation of these
depends to a large extent on a mining operation’s ability to create
consistent local value over the life of the mine and to adapt to changing
economic conditions. The responsible transfer of assets is an important
step in the development of a sustainable post-mining economy.
4.5 Managing land claims
We are committed to ensuring that the legal rights of all
mining-affected communities are upheld at all times, in order to meet
international best practice and to minimise our legal and operational
exposure. A number of communities in South Africa have made formal
land claims to areas in which we operate under the Restitution of Lands
Act. Our Community Policy recognises that peoples’ interests in land
and property may derive from traditional and spiritual association in
addition to legal title.
CommunitiesInvestment in the future of communities beyond the life of our operations is core to receiving our social licence to operate.
We strive to create both economic and social capital through all of our activities and programmes.
Stakeholder materiality
Bu
sin
ess
risk
(im
pac
t/lik
elih
oo
d) 4.1
4.3
4.2
4.4
4.5
Communities Risks
2012 Assurance, Risk, and Compliance Supplement
9

Environment Risks
KEY:
Long term Medium term Short term
Risks explored in Report to Society 2012 Risks
www.debeersgroup.com
5.1 Maintaining environmental standards
We are committed to aligning our environmental policies, systems,
programmes, resourcing and training approach to those of the world’s
leading mining companies. This requires long-term commitment and
sustained effort.
5.2 Water and energy security in a changing climate
Our mines in Africa are mostly located in water-stressed environments.
In southern Africa, shifting rainfall patterns with climate change are
expected to present a challenge to water access for our operations and
local communities, presenting both operational risks and potentially
undermining our social licence to operate. Energy security also presents
a challenge. Our mines in Canada are in water abundant areas and
pristine natural environments; environments that require particular
management approaches, and will be affected differently by climate
change. The trade-off between water and energy efficiency, and the
associated carbon-footprint, applies in all our operations and projects.
5.3 Lifecycle planning
There are environmental risks associated with all stages of the mining
lifecycle. We seek to first avoid, then minimise and finally mitigate the
impacts of our activities when planning, designing and carrying out
exploration, mining and related activities. We seek to integrate all
aspects of closure and associated liabilities into our lifecycle planning
processes. This is motivated both by local regulation and our goal to
achieve operations and closure to the highest environmental standards.
5.4 Promotion and maintenance of biodiversity and ecosystems
Many of our operations are in sensitive or biologically diverse
environments. Managing biodiversity is rarely straightforward and
requires that we take a sophisticated, ecosystems-based approach.
5.5 Respect for protected areas, key biodiversity areas
or World Heritage Sites
We respect legally designated Protected Areas and World Heritage
Sites. We aim to minimise the disturbance of ecosystems
through responsible planning and biodiversity stewardship – from
exploration through to the post-mining phase – in order to mitigate
current and future risks from environmental impacts, litigation and
reputational damage.
5.6 Management of waste and pollution prevention
While diamond mining itself does not require the use of hazardous
substances as it is mostly a physical process, we are focused on
ensuring that all operations and facilities manage effluents, wastes,
emissions and hazardous substances to prevent pollution.
EnvironmentThe sustainable management of the natural environment is vital to the future prosperity of the countries in which we operate.
We are committed to proactively managing our impacts on this shared resource.
Stakeholder materiality
Bu
sin
ess
risk
(im
pac
t/lik
elih
oo
d)
5.3
5.5
5.2
5.4
5.1
5.6
2012 Assurance, Risk, and Compliance Supplement
10

Participants in the 2012 Multi-Stakeholder Forum included representatives from:
Government
• UK Government’s Foreign and Commonwealth Office
NGO sector
• CDP Water Disclosure
• Christian Aid
• WaterAid
• Transparency International
Sustainability service providers
• PricewaterhouseCoopers
• Lifeworth Consulting Services
• SGS UK
Academia
• Middlesex University
Engagement on reporting
We engage with stakeholders on our sustainability performance
management at a Group level in two formal processes on an annual
basis. The insight, recommendations and constructive criticism we
receive through the Managers’ Perception Survey and the
Multi-Stakeholder Forum, shape our sustainability management
strategy and practice. In 2012, findings from the two processes
particularly informed our approach to reporting (see Table 1, p12), and
were used to identify and prioritise issues of concern to stakeholders
(see both tables, p12).
Multi-Stakeholder Forum, 2012
We held our fifth Multi-Stakeholder Forum in December 2012, inviting
external experts to critique our sustainability reporting and approach,
and engage with senior management. Discussions focused on topics
such as engaging with unions and employees, use of water and
natural resources, governance and transparency, and De Beers’ role as
an agent for community development in Africa. As with our previous
reports, participants in the forum (see box right) presented a series of
questions regarding relevant and material issues instead of a formal
assurance statement.
Our answers to some of these questions are presented throughout the
2012 Report to Society in the boxes marked as ‘Stakeholder questions’.
The Forum was facilitated by Salterbaxter, and attended by senior
De Beers’ management including the Executive Director of Human
Resources, Head of Corporate Affairs, Head of Public Affairs, Head of
Government and Industry Relations, Head of Social Performance, and
Group Environmental Principal.
Managers’ Perception Survey, 2012
Each year we implement a Managers’ Perception Survey to learn more
about how employees use our Report to Society and whether it covers
the appropriate issues. Our 2012 survey was sent to over 100
employees, including those who contributed to the 2011 Report to
Society, and all senior leaders across the Group of Companies.
Diamond Dialogues
De Beers has convened an ongoing series of ‘Diamond Dialogues’
since 2007, drawing together industry, civil society and policy actors to
discuss key sustainability issues relevant to mining, development and
Africa. Fourteen dialogues have been held to date in Brussels, London,
and Washington. In 2012, one dialogue was held in London focused on
natural resources management and national development. Issues of
concern raised by stakeholders in this session also informed the
material issues reported in the 2012 Report to Society that this
Supplement accompanies (see Table 2, p12).
Improving our sustainability performanceWe engage with stakeholders in a number of formal processes to inform our approach to sustainability reporting.
2012 Assurance, Risk, and Compliance Supplement
11

Table 1
Stakeholder feedback on our reporting approach, 2012
Managers’ Perception Survey Multi-Stakeholder Forum
Aspects of the Report considered most useful/favourable
Performance
reporting
Presentation of performance data for
reference; good coverage of all key
topics and material issues.
Breadth and detail of information provided.
Information on revenue and transparency.
Management
approach
Information on management practices,
policies, and position.
Clarity and detail on approach, frank tone.
Clarity on business case for action on each
issue.
Compliance and
assurance
Adherence to global best practice
standards, and third party assurance.
Independent third-party assurance by SGS.
Design and
layout
A shorter printed Review and
‘Issue Briefs’.
Engaging, easy to read.
Reporting recommendations
Tone Focus on opportunities as well as risks; future
looking – discuss horizon scanning.
Content Refresher information on philanthropic
activities. Tailored content for different
audiences.
Bring out “diamonds for development” story
more strongly. Clarify risk identification
process, and definition of duration of risks.
Provide more context for the data within the
report.
Format and
distribution
Provide short 8/10 page summary
report, outlining key highlights of
each chapter.
Develop online portal further to
provide easy access to specific sets
of information collected by the user.
Employ the advantages of technology to
provide detailed information, and illustrate
visually, the correlation of risks/opportunities.
Performance
reporting
Consider online data management
portal.
Set and communicate performance targets
and Key Performance Indicators.
Management
approach
Provide information on the overall
sustainability strategy and vision. Show
the linkages between management of
sustainability issues (i.e. water as a social
and environmental issue).
Key
MSF: Multi-Stakeholder Forum
MPS: Managers’ Perception Survey
DD: Diamond Dialogue
Table 2
Relevant and material issues identifi ed through formal, Group-level engagement with stakeholders, 2012
MPS DD MSFPage in Report
Economics
The role of De Beers in contributing to social and economic
development, specifically in southern Africa.✓ ✓ 17-23
Natural resources management and national development. ✓ ✓ 20-21
Political lobbying and the use of political leverage for diamond
revenue transparency/EITI support.✓ 21
Ethics
Corruption risk measurement and management. ✓ ✓ 30-31
Human rights management. ✓ 48
Conflict diamonds and the Kimberley Process. ✓ 28-29
Employees
Safety. ✓ 38-39
Engaging with employees. ✓ ✓ 40-41
Communities
Community engagement strategy and performance. ✓ 48-53
Closure planning and management in relation to communities. ✓ 53
Environment
Environmental rehabilitation activities and monitoring of the
environmental impacts of seabed mining.62
Water use and climate change policy. ✓ 60-61
No net loss to biodiversity. 62-63
2012 Assurance, Risk, and Compliance Supplement
12

Internal Audit statement
De Beers Internal Audit (DBIA) is an independent, objective assurance
and consulting activity designed to add value and improve the
operations of the De Beers Group of Companies. DBIA has been
mandated by the Board Audit Committee, a sub-committee of the
Board of De Beers Société Anonyme (DBsa), to ensure that the major
risks facing the Group of Companies are identified and given
appropriate audit focus. Risk management, internal control and
governance processes are systematically reviewed to assist the Group
of Companies accomplish its objectives. DBIA submits an annual report
to the Board Audit Committee on the status of governance, internal
control and the appropriateness of risk management.
All DBIA reviews are performed in accordance with the International
Standards for the Professional Practice of Internal Auditing as prescribed
by the Institute of Internal Auditors (IIA). Our Quality Assurance and
Improvement Programme (introduced in accordance with IIA Standard
1300) found DBIA to be ‘generally compliant’ with the IIA Standards, the
highest rating on the degree of conformity scale.
Risk-based internal auditing
DBIA follows a prescriptive, documented risk-based audit methodology
that culminates in its annual report on risk management, the internal
control environment and governance to the Audit Committee. The
audit plan is derived from the De Beers Enterprise Risk Management
system. The Group Risk Champion consults on and assists with the
facilitating risk management workshops at all levels to ensure a
complete and appropriate risk management system. The risk
management process collates information from value centres and
offices globally to business units and ultimately to enterprise level.
Audit work includes a thorough review of internal systems, procedures
and programmes of work for each business function and area of major
business risk. DBIA also collates reports from managers on the integrity
of internal controls, the safeguarding of assets and risk management, as
well as ethical, social and environmental matters. It also considers
reports produced by external assurance providers.
The DBIA annual report to the DBsa Audit Committee, which was
submitted in February 2013, included the following opinion: “I can
confirm that in my opinion the internal controls are adequate to ensure
that the financial records may be relied on for preparing the reports to
directors and shareholders, and for maintaining accountability for assets
and liabilities. In my opinion, in all material instances, assets are
adequately protected and used as intended with appropriate
authorisation and all significant business risks have been identified and
appropriate mitigating strategies are in place.
No matters have come to my attention during the year ended 31
December 2012 that indicate any breakdown of such magnitude has
occurred in the functioning of these internal controls, procedures and
system of the Group, which in my opinion, would affect the fairness
of presentation of such reporting, and therefore financial decisions
based thereon.”
Kimberley Process Compliance
The Kimberley Process is a joint government, diamond industry and
civil society initiative that requires participants to certify diamond
shipments are conflict free. Compliance with the Kimberley Process is a
legal requirement for participating countries. A review of the
fact-finding reports, issued by independent auditors, confirms that
relevant business units comply with the requirements for De Beers to
have its compliance with the Kimberley Process externally assessed.
These reviews sought to assess De Beers’ compliance with respect to
the Kimberley Process Certification Scheme (KPCS) on the international
trade in rough diamonds, in accordance with European Council
Regulation (EC) No 1574/2005. The assessments related to the period
commencing 1 January 2012 and ending 31 December 2012. The major
Kimberley Process compliance criteria are also reviewed as part of the
third-party verified BPP Assurance Programme. No material breaches or
non-compliance with the Kimberley Process were identified in the 2012
BPP assurance cycle.
Implementation of the Anti-Money Laundering Policy
In 2006, De Beers developed and communicated a policy on
Anti-Money Laundering and Combating the Financing of Terrorism.
The policy reflects the deep-seated commitment of the Group of
Companies to maintaining the continued confidence of its stakeholders
and the integrity of its product. DBIA’s 2012 review of the
implementation and progress of the policy highlighted that all business
units and applicable group functions have implemented the policy.
First-party assurance on internal audit and risk managementStatement from De Beers Internal Audit on selected material issues including internal auditing, the Best Practice Principles,
the Kimberley Process, anti-money laundering and integrated reporting.
2012 Assurance, Risk, and Compliance Supplement
13

Integrated reporting
In November 2010, the DBsa Audit Committee updated its Terms of
Reference to include a role for the Audit Committee in providing
oversight of integrated reporting by DBsa. This was in response to the
King Code of Governance for South Africa, otherwise known as the
King III Report. This reflects a broader drive for the integrated reporting
of financial and non-financial performance, to embed sustainability
considerations into commercial practice, including commissioning
third-party assurance.
Brian Cleak
Group Manager: Internal Audit
De Beers Corporate Headquarters
Johannesburg, South Africa, 22 April 2013
Independent Assurance of the Report to Society 2012
We commissioned SGS United Kingdom Ltd (SGS) to conduct an independent assurance of the 2012 Report to Society. SGS evaluated the
content of the report according to the Global Reporting Initiative principles provided in the GRI G3 (2006) and AA1000AS (2008). The scope
of the assurance, based on the SGS Sustainability Report Assurance methodology, included the text, and 2012 data in accompanying tables,
contained in the Report to Society.
The full assurance statement is provided on p66-67 of the 2012 Report to Society, available for download from www.debeersgroup.com/
sustainability. In their statement, SGS provide the following verification/assurance opinion:
“On the basis of the methodology described and the verification work performed, we are satisfied that the information and data contained within the 2012 Report to Society verified is accurate, reliable and provides a fair and balanced representation of De Beers’ sustainability activities in 2012.
The assurance team is of the opinion that the 2012 Report to Society can be used by the reporting organisation’s stakeholders. We believe that the organisation has chosen an appropriate level of assurance for this stage in their reporting.”
2012 Assurance, Risk, and Compliance Supplement
14

Role of SGS in the BPP Programme
Appointment of SGS
Following a tender process beginning in April 2003, SGS was invited
to present their proposal and following responses to additional
information were advised of their selection as the verification partner
in July 2003.
SGS is the world’s leading independent verification and certification
organisation and has no commercial interests. SGS continues to
maintain a vigilant system to ensure that conflicts of interest do not
arise through the provision of additional services to Sightholders or the
De Beers Family. This has been supplemented by further safeguards
since SGS gained accreditation as a Certification Body for the
Responsible Jewellery Council who also has interests in this regard.
Scope of work and evolution of programme
For the 2012 cycle, the effective dates were moved to 01 April 2012 to
31 March 2013 in order to match the Supplier of Choice cycles. The BPP
programme was fully aligned with the Responsible Jewellery Council
(RJC) Principles and Code of Practice in 2011, maintaining the BPP
requirements where these were already at a higher level and this has
continued to be the baseline for the programme.
This year, De Beers decided to opt in to the Responsible Jewellery
Council Code of Practice. The on-site verification visits were undertaken
at arm’s length by a separate team within SGS in order to meet the no
conflict of interests requirement of the RJC, with the results uploaded
to the SMART system and used in evaluating performance against BPPs.
Sightholders were again given the opportunity of integrating RJC
certification visits into their BPP programme in order to provide an
efficient approach and to leverage the areas of commonality, while
those who were certified in 2011 were able to upload this certification
to the system and respond to a limited number of questions for the
first party assessments, while the third-party verification visits
continued to assess compliance on a broader level.
The scope of work undertaken by SGS as the BPP verifier for the 2012
cycle comprised the following:
• Desktop review of a sample of the workbooks submitted by
Sightholders for their owned operations and contractor (Tier B) sites
and by the De Beers Group of Companies. This process verifies that
all required workbooks have been submitted; that all questions
have been answered; that the responses to the questions support
the compliance status declared in each case and to test the
conclusions by requesting supporting evidence on a random
number of questions.
• Verification visits on up to 10% of the declared facilities to check that
the original first party assessments have been undertaken thoroughly
both by discussing this with the assessor and by seeking first-hand
evidence of compliance with the issues concerned.
• Visit to a non-substantial contractor who qualified by virtue of the
fact that they work for a number of Sightholders.
• Provision of information relating to the compliance status of
Sightholders’ and De Beers’ facilities and details of any significant
issues. This information is provided in accordance with the
confidentiality requirements imposed by the Supplier of Choice
Ombudsman.
• Ongoing support in explaining local legislative requirements and
improving the BPP processes.
Work undertaken on De Beers Group facilities
69 workbooks were submitted across all eligible De Beers facilities
including 7 for contractors.
23 reviews were conducted and completed during the cycle. 6
verification visits were also completed as part of the RJC certification
and the results from these were incorporated into the BPP results on
the SMART system.
The BPP programme
The evaluation points of the Best Practice Principles have been fully
aligned to the RJC Principles and Code while the ratings continue to
take a more flexible approach, taking account of the common practices
and endemic issues in the industry and countries covered. This is
in line with the wider body of programmes covering business
partner evaluation.
For the De Beers Group, the requirement for the submission of
self-evaluations was completed to the agreed deadlines. These have
been rated according to the RJC certification requirements and are
being actively followed up. This has included working with their
contractors to ensure that they also meet the BPP requirements.
Verifi cation methodology
The verification process is undertaken in 3 stages:
• In the country of operation, workbooks are reviewed by a qualified
auditor. For Sightholders this is a Social Auditor, cross-trained in
Environmental Management and briefed on the requirements of the
Best Practice Principles. For De Beers this is an RJC accredited auditor.
• Local reviews are then submitted to a central review point where
these are crosschecked to ensure consistency by country and
key points.
Third-party assurance on the BPP Assurance ProgrammeStatement from SGS on the De Beers Group 2012 cycle of the De Beers Best Practice Principles Assurance Programme (BPPs),
including scope, work undertaken, the BPP programme, verifi cation methodology, key fi ndings and recommendations.
2012 Assurance, Risk, and Compliance Supplement
15

• An average sample of 10% of facilities is selected centrally for onsite
verification to check the effectiveness of the 1st party assessments
and to evaluate at first hand the situation on the ground. For the De
Beers Group these visits were undertaken by RJC accredited auditors
who had not previously been involved in the BPP programme in
order to satisfy the independence requirements set by the RJC.
Key fi ndings
Workbooks were all received within the required timescales and
the reviews were undertaken by the SGS team that looks after the
BPP programme.
The facilities to visit were selected by the team managing the RJC
certification based on a risk assessment approach as required for
that programme and the visits were conducted in accordance with
that programme.
The majority of infringements in the De Beers facilities found in the
course of previous cycles have been rectified with evidence of
implementation verified either on site or through the workbooks.
However, a small number of issues from previous cycles remain open
and discussions are continuing to ensure the evidence is uploaded
as required.
In the 2012 cycle, no Major Infringements were identified which
allowed a 3-year certification recommendation to be made to the RJC.
Some Minor Infringements were noted and corrective actions have
been submitted for these.
Overall summary
Policies and procedures are now generally embedded into normal
operations for De Beers’ facilities and there is a commitment to
continuing to meet and exceed both the BPP and RJC requirements.
No Material Breaches or Major Infringements were identified during first
or third party assessments and the De Beers Group achieved full 3-year
certification to the RJC Code of Practice. The few Minor Infringements
raised are being tackled and communication is ongoing to obtain
evidence of corrective actions.
Recommendations for future development
A general recommendation has been made to improve the level of
detail in the first party assessments and this will be a focus area for 2013.
Sightholders who are certified to the RJC will be able to present this as
part of their evidence of compliance to the BPPs which will reduce the
scope of the first party assessments required. Those who are members
of the Responsible Jewellery Council but have not yet undergone
certification will continue to have the opportunity to undergo a
combined BPP/RJC verification with the possibility of this leading to a
Recommendation for Certification against that programme.
De Beers Group facilities will continue to submit full first party
certifications based on their general risk assessment without taking
account of the RJC certification so as to ensure that the local teams
remain focussed on meeting and exceeding compliance requirements.
Effie Marinos
SGS United Kingdom Ltd
18 April 2013
www.uk.sgs.com
Table 3
SGS review and fi ndings from the 2012 BPP cycle for the De Beers Group of Companies
Workbooks
Business unit Submitted Reviewed Site visits Status
De Beers Canada 8 3 1 Compliant
De Beers
Consolidated Mines
7 2 0 Compliant
De Beers Global Mining 6 2 1 Compliant
De Beers Group Services 4 1 0 Compliant
Forevermark 7 2 0 Compliant
De Beers SA 2 1 0 Compliant
Debswana 4 2 1 Compliant
Diamdel 5 2 1 Compliant
De Beers UK Ltd 6 2 1 Compliant
Exploration 9 3 1 Compliant
Namdeb 11 3 0 Compliant
TOTAL 69 23 6
2012 Assurance, Risk, and Compliance Supplement
16

This table sets out how the Global Reporting Initiative (GRI) Reporting Framework has been applied in our sustainability reporting, and how our reporting links to the UN Global Compact and UN Millennium Development Goals. It primarily covers the De Beers Group
of Companies 2012 Report to Society (RtS) and makes reference to the 2012 Operating and Financial Review (OFR). We have prepared the table in order to help stakeholders
quickly find the information they are seeking.
Application of the GRI Reporting Framework forms a key part of our commitment to continuous improvement and to achieving the highest levels of sustainability performance.
It is our belief, and the independent assessment of SGS, and our assurance provider, that we have applied the GRI Reporting Framework to the highest A+ standard.
GRI Compliance Table
2012 Report to
Society
2012 Operating
and Financial
Review
De Beers Group of Companies 2012 Report to Society
2012 Assurance, Risk, and Compliance Supplement
17

Indicator shading Extent of reporting UN mechanisms
‘core indicators’ Partially reported 1 UN Global Compact Principles
‘additional indicators’ Fully reported 1 UN Millennium Development Goals
Indicator DescriptionPage
reference ExtentUN
mechanisms Notes
Profi le
1. Strategy and Analysis
1.1 Statement from the most senior decision maker of the organisation
about the relevance of sustainability to the organisation and its
strategy.
2-5
1.2Description of key impacts, risks, and opportunities. 10-15, 17, 27, 37,
47, 57
2. Organisational Profi le
2.1 Name of the organisation. Back cover
2.2
Primary brands, products, and/or services. Inside front cover
(IFC), inside back
cover (IBC);
Operating and
Financial Review
(OFR) PDF 2-3
2.3Operational structure of the organisation, including main divisions,
operating companies, subsidiaries, and joint ventures.
IFC; OFR PDF 2-3
2.4 Location of organisation’s headquarters. IBC De Beers Société Anonyme is headquartered in Luxembourg.
2.5
Number of countries where the organisation operates, and names of
countries with either major operations or that are specifically relevant
to the sustainability issues covered in the report.
IFC
2.6 Nature of ownership and legal form. IFC; OFR PDF 2-3
2.7Markets served (including geographic breakdown, sectors served,
and types of customers/beneficiaries).
IFC, 18-21, 22; OFR
PDF 2-3, 6-7, 18-22
2.8 Scale of the reporting organisation, including:
• Number of employees;
• Net sales (for private sector organisations) or net revenues (for
public sector organisations);
• Total capitalisation broken down in terms of debt and equity (for
private sector organisations); and
• Quantity of products or services provided.
IFC, 8-9, 40; OFR
PDF 2-3, 5, 19-20, 23
2012 Assurance, Risk, and Compliance Supplement
18

Indicator DescriptionPage
reference ExtentUN
mechanisms Notes
2.9Significant changes during the reporting period regarding size,
structure, or ownership.
2-5, 11, 20-21, 22, 53,
62; OFR PDF 4, 5
2.10 Awards received in the reporting period. 14;OFR PDF 18, 26
3. Report Parameters
Report profi le
3.1 Reporting period (e.g., fiscal/calendar year) for information provided. Contents page Information provided in the Report to Society 2012, and Operating
and Financial Review 2012, refer to the calendar year (1 January to
31 December 2012).
3.2 Date of most recent previous report (if any). Contents page
3.3 Reporting cycle (annual, biennial, etc). Contents page
3.4 Contact point for questions regarding the report or its contents. Back cover
Report Scope and Boundary
3.5 Process for defi ning report content:
• Determining materiality;
• Prioritising topics within the report; and
• Identifying stakeholders the organisation expects to use
the report.
14-15, 12-13
3.6 Boundary of the report (e.g., countries, divisions, subsidiaries, leased
facilities, joint ventures, suppliers).
Contents page
3.7 State any specific limitations on the scope or boundary of the report. Contents page
3.8 Basis for reporting on joint ventures, subsidiaries, leased facilities,
outsourced operations, and other entities that can significantly affect
comparability from period to period and/or between organisations.
Contents page
3.9 Data measurement techniques and the bases of calculations,
including assumptions and techniques underlying estimations
applied to the compilation of the Indicators and other information in
the report.
11, 40, 51, 58, 61, 63
3.10 Explanation of the effect of any restatements of information provided
in earlier reports, and the reasons for such restatement (e.g., mergers/
acquisitions, change of base years/periods, nature of business,
measurement methods).
– No restatements of information provided in previous reports.
3.11
Significant changes from previous reporting periods in the scope,
boundary, or measurement methods applied in the report.
GRI table No significant changes were made to scope, boundary or
measurement methods other than described elsewhere in the Report
to Society 2012.
2012 Assurance, Risk, and Compliance Supplement
19

Indicator DescriptionPage
reference ExtentUN
mechanisms Notes
GRI Content Index
3.12Table identifying the location of the Standard Disclosures in
the report.
GRI table
Assurance
3.13 Policy and current practice with regard to seeking external assurance
for the report.
10, 14, 28, 32-33, 48,
66-67; Sustainability
Risk and
Compliance
Supplement
This Sustainability Risk and Compliance Supplement supports
the Report to Society 2012 and contains our first party assurance
statement from De Beers Internal Audit; third party assurance
summary of the 2012 Report to Society by SGS; and the third
party assurance statement on the BPP Assurance Programme.
4. Governance, Commitments, and Engagement
Governance
4.1 Governance structure of the organisation, including committees
under the highest governance body responsible for specific tasks,
such as setting strategy or organisational oversight.
10, 12; OFR PDF
24-25; 27-29
10
4.2 Indicate whether the Chair of the highest governance body is also an
executive officer (and, if so, their function within the organisation’s
management and the reasons for this arrangement).
OFR PDF 24-25,
27-29
10
4.3 For organisations that have a unitary board structure, state the
number of members of the highest governance body that are
independent and/or non-executive members.
OFR PDF 24-25,
27-29
10
4.4 Mechanisms for shareholders and employees to provide
recommendations or direction to the highest governance body.
OFR PDF 24-25,
27-29
4.5 Linkage between compensation for members of the highest
governance body, senior managers, and executives (including
departure arrangements), and the organisation’s performance
(including social and environmental performance).
GRI table 10 The Remuneration Committee consists of the non-executive
chairman of De Beers and two others seconded to the committee
from Anglo American, the major shareholder. It approves
remuneration for executive directors on the Board and other senior
managers including those on the Executive Committee. The
Remuneration Committee ensures that rewards are linked to both
group and individual performance and are commensurate with
market rates. Both group and individual performance include
non-financial performance metrics such as social and environmental
criteria, which include adherence to effective risk management and
compliance. The exact remuneration structures of senior managers
and other employees at subsidiaries and investments is informed by
group policy and performance, but determined separately by the
respective boards, committees and finance and human resource
functions of each company.
2012 Assurance, Risk, and Compliance Supplement
20

Indicator DescriptionPage
reference ExtentUN
mechanisms Notes
4.6 Processes in place for the highest governance body to ensure
conflicts of interest are avoided.
GRI table 10 A number of structures exist to ensure conflict of interest is avoided in
line with external best practice standards. These include the Best
Practice Principles Assurance Programme (BPPs) and the Directors
Conflict of Interest Policy. Existing statements in our Code of Conduct
and Business Ethics also require all personnel to act in the best
interests of De Beers and its shareholders. The Code also prohibits
involvement in business interests that conflict with the Principles and
policies of the Group of Companies or that might compromise
independence in decision-making.
4.7 Process for determining the qualifications and expertise of the
members of the highest governance body for guiding the
organisation’s strategy on economic, environmental, and social topics.
GRI table 1-10
1-8
The appointment of independent directors to the Board is based
primarily on the extent to which they represent the interests of the
shareholders and are able to provide strategic guidance on the
direction, values and performance of the Company. This includes with
respect to the Principles, ECOHS policies and related sustainability and
reputational risk management. The term of office for each director is
limited by law and the constitutional documents of the Company to
six years, but directors are eligible for re-election by the shareholders.
The terms of office of those directors appointed by the majority
consent of shareholders has been limited to periods of three years,
with the opportunity for re-election by shareholders. Shareholders
also have the ability to terminate appointments, if necessary, prior to
the completion of the appointed term of office. Board continuity is
fundamental to the sustained success of the De Beers Group.
This requires an ongoing resource and skills identification to be
performed by the Board in consultation with shareholders. Board
members are able to supplement their own expertise on issues
pending decision by obtaining independent professional advice.
The Company Secretary coordinates the provision of professional
advice to ensure that advisors are appropriately briefed, provided
with relevant information and paid on completion of the assignment.
The results of any advisory engagement are also made available to
other members of the Board.
4.8 Internally developed statements of mission or values, codes of
conduct, and principles relevant to economic, environmental, and
social performance and the status of their implementation.
10, 30, 32-33,
58-62, 68
1-10
1-8
4.9 Procedures of the highest governance body for overseeing the
organisation’s identification and management of economic,
environmental, and social performance, including relevant risks and
opportunities, and adherence or compliance with internationally
agreed standards, codes of conduct, and principles.
12-13; OFR PDF
24-25, 26
1-10
1.8
2012 Assurance, Risk, and Compliance Supplement
21

Indicator DescriptionPage
reference ExtentUN
mechanisms Notes
4.10 Processes for evaluating the highest governance body’s own
performance, particularly with respect to economic, environmental,
and social performance.
12-13; OFR PDF
24-25, 26
1-10
1-8
Commitments to External Initiatives
4.11 Explanation of whether and how the precautionary approach or
principle is addressed by the organisation.
10, 12-13, 30, 32-33,
38-39, 42, 47-49, 52,
53, 57-63
7
4.12 Externally developed economic, environmental, and social charters,
principles, or other initiatives to which the organisation subscribes
or endorses.
13, 21, 28, 33, 60 1, 2, 4, 5, 10
1, 4-8
4.13 Memberships in associations (such as industry associations) and/or
national/international advocacy organisations.
13, 21, 33 Membership of the World Economic Forum’s Partnering Against
Corruption Initiative (PACI).
4.14 List of stakeholder groups engaged by the organisation. 12-13; 2012
Sustainability Risk
and Compliance
Supplement 23
4.15 Basis for identification and selection of stakeholders with whom
to engage.
12-13
4.16 Approaches to stakeholder engagement, including frequency of
engagement by type and by stakeholder group.
12-13, 14, 41; 2012
Sustainability Risk
and Compliance
Supplement 23
4.17 Key topics and concerns that have been raised through stakeholder
engagement, and how the organisation has responded to those key
topics and concerns, including through its reporting.
1-10
1-8
5. Management Approach and Performance Indicators
Economic Performance Indicators
Aspect: Economic Performance
DMA Management Approach disclosures. 8-9, 17-23;
OFR PDF 4-7
EC1 Direct economic value generated and distributed, including revenues,
operating costs, employee compensation, donations and other
community investments, retained earnings, and payments to capital
providers and governments.
6-7, 8-9, 18-21, 22, 23;
OFR PDF 5-7, 231-8
EC2 Financial implications and other risks and opportunities for the
organisation’s activities due to climate change.
60-61 8
7
2012 Assurance, Risk, and Compliance Supplement
22
Indicator DescriptionPage
reference ExtentUN
mechanisms Notes
EC3 Coverage of the organisation’s defined benefit plan obligations. GRI table Employee benefits differ between De Beers’ operations but in most
instances some form of retirement benefit is provided as normal
practice. At this time only De Beers UK maintains an accruing Defined
Benefit pension scheme (closed to new entrants). All other locations
provide a Defined Contribution arrangement. In South Africa a legacy
Defined Benefit arrangement is managed by the De Beers Pension
Fund which also provides a Defined Contribution scheme for current
employees. Due to the transient nature of their employment, some
De Beers exploration employees are not provided with a pension.
However, these employees are appropriately compensated in order
to make their own arrangements. Other welfare benefits such as
medical aid, holiday leave, sick leave, maternity/paternity leave, life
insurance and compensation for injuries or disease at work are also
usually provided as part of standard terms and conditions.
EC4 Significant financial assistance received from government. GRI table No significant financial assistance was received from government
in 2012.
Aspect: Market Presence
EC5 Range of ratios of standard entry level wage compared to local
minimum wage at significant locations of operation.
(Additional indicator).
GRI table De Beers pays more than the local minimum wage in all of the
countries in which it operates.
EC6 Policy, practices, and proportion of spending on locally-based
suppliers at significant locations of operation.
6-7, 23; GRI table See Figures 3a and 3b.
EC7 Procedures for local hiring and proportion of senior management
hired from the local community at locations of significant operation.
GRI table At DBCM, a total of 79.5 percent of our permanent workforce is made
up of Historically Disadvantaged South Africans (HDSAs) (excluding
white females). HDSAs also make up 40.2 percent of managers at
DBCM. At Debswana, a total of 96.6 percent of the workforce is made
up of local citizens. Local citizens also make up 87.3 percent of
managers at Debswana. At Namdeb, a total of 88 percent of our
permanent workforce is made up of Historically Disadvantaged
Namibians (HDNs). HDNs also make up 57.8 percent of managers at
Namdeb. (see also figure 9).
Aspect: Indirect Economic Impacts Core
EC8 Development and impact of infrastructure investments and services
provided primarily for public benefit through commercial, in kind, or
pro bono engagement.
20-21, 50-51 1-8
EC9 Understanding and describing significant indirect economic impacts,
including the extent of impacts. (Additional indicator).
17, 18-21, 22, 23, 47,
48-51
2012 Assurance, Risk, and Compliance Supplement
23

Indicator DescriptionPage
reference ExtentUN
mechanisms Notes
Environmental Performance Indicators
DMA Management Approach disclosures. 57, 58, 60-61, 62, 63
Aspect: Materials
EN1 Materials used by weight or volume. GRI table 8
7
The processes used within exploration laboratories and ore treatment
plants do in some cases require hazardous materials. Replacing,
minimising and eliminating the use of these hazardous substances
forms the basis of our hazardous materials and waste strategy.
The actual mining process does not require the use of hazardous
substances. See Figure 4.
EN2 Percentage of materials used that are recycled input materials. GRI table 8
7
Water is a key input into the processing stages of ore for diamond
extraction. We recycle 41 percent of water for our process at our
southern African operations (see EN10).
Aspect: Energy
EN3 Direct energy consumption by primary energy source. 61 8
7
EN4 Indirect energy consumption by primary source. 61 8
7
EN5 Energy saved due to conservation and efficiency improvements.
(Additional indicator).
61 8
7
We are embarking on a programme in line with Anglo American
requirements to evaluate and quantify energy savings and carbon
emission reductions due to reduced energy use.
EN6 Initiatives to provide energy-efficient or renewable energy based
products and services, and reductions in energy requirements as a
result of these initiatives. (Additional indicator).
61 8
7
EN7 Initiatives to reduce indirect energy consumption and reductions
achieved. (Additional indicator).
61 8
7
Aspect: Water
EN8 Total water withdrawal by source. 6-7, 60-61 8
7
Water use – as opposed to withdrawal – (by category of water type
e.g. potable and non-potable water) is reported. For example at
Venetia Mine, water is withdrawn and stored, and the use thereof is
reported. In addition, we track the water withdrawn from the pit at
Victor Mine and not used by the operation (37.5 million m3 in 2011 and
42.5 million m3 in 2012).
EN9 Water sources significantly affected by withdrawal of water.
(Additional indicator).
58, 63 8
7
2012 Assurance, Risk, and Compliance Supplement
24

Indicator DescriptionPage
reference ExtentUN
mechanisms Notes
EN10 Percentage and total volume of water recycled and reused.
(Additional indicator).
6-7, 60 8
7
Aspect: Biodiversity
EN11 Location and size of land owned, leased, managed in, or adjacent
to, protected areas and areas of high biodiversity value outside
protected areas.
62-63, 6-7 8
7
EN12 Description of significant impacts of activities, products, and services
on biodiversity in protected areas and areas of high biodiversity value
outside protected areas.
62-63 8
7
EN13 Habitats protected or restored. (Additional indicator). 62-63 8
7
EN14 Strategies, current actions, and future plans for managing impacts
on biodiversity. (Additional indicator).
62-63 8
7
EN15 Number of IUCN Red List species and national conservation list
species with habitats in areas affected by operations, by level of
extinction risk. (Additional indicator).
GRI table 8
7
These data are collected for Environmental Impact Assessments (EIA)
and associated specialist studies for every operation. Where relevant,
mitigating actions are taken and included in our Environmental
Management Plans (EMP). The numbers of species summarised from
across the Group of Companies are not currently included in this
report, nor the species at local and regional level that have
conservation importance.
Aspect: Emissions, Effl uents, and Waste
EN16 Total direct and indirect greenhouse gas emissions by weight. 6-7, 61 8
7
EN17 Other relevant indirect greenhouse gas emissions by weight. 61 8
7
EN18 Initiatives to reduce greenhouse gas emissions and reductions
achieved. (Additional indicator).
61 8
7
We are embarking on a programme in line with Anglo American plc
group requirements to evaluate and quantify energy savings and
carbon emission reductions due to reduced energy use.
EN19 Emissions of ozone-depleting substances by weight. n/a n/a 8
7
Ozone-depleting substances in any remaining air conditioners,
refrigerators and freezers that use these substances have not been
quantified as this is not considered a material risk. Replacement plans
for phasing out such equipment containing ozone-depleting
substances is in line with Montreal Protocol timelines.
2012 Assurance, Risk, and Compliance Supplement
25

Indicator DescriptionPage
reference ExtentUN
mechanisms Notes
EN20 NOx, SOx, and other significant air emissions by type and weight. GRI table 8
7
Our sulphur emissions relate almost exclusively to energy use and
changes in emission levels are directly linked to our energy
consumption. SO2 (sulphur dioxide) emissions from liquid fuels use
amounted to 696 tonnes in 2012 (2011 618 tonnes). Marine gas oil,
which contains higher concentrations of sulphur than most other
liquid fuels, contributed 75 percent of SO2 emissions in 2012,
(2011: 75 percent).
EN21 Total water discharge by quality and destination. GRI table 8
7
Water discharge data is not currently captured for our southern Africa
operations because water in these countries is typically reused and
recycled. Water discharge from our Canadian operations amounted
to 42.5 million m3 in 2012 (37.5 million m3 in 2011). Discharged water is
the excess water from dewatering that is not used in operational
processes. The environmental impact of these discharges is managed
to strict requirements.
EN22 Total weight of waste by type and disposal method. GRI table 8
7
Waste is separated into categories at source to ensure appropriate
disposal and recycling. Hazardous waste produced during the mining
process is either responsibly stored onsite for future management or
disposed of through certified hazardous waste sites. Waste from our
Botswana and Namibian operations is generally disposed of through
facilities in South Africa. See Figure 5.
EN23 Total number and volume of significant spills. 58 8
7
Volumes of spills has not been included because of the differing type
of spills and their location which has differing impacts e.g. hydraulic
oil spilled into sea versus fine residue spill onto ground. However, the
extent of the volume of the spill in the context of the receiving
environment is taken into account in determining the severity rating
of each incident.
EN24 Weight of transported, imported, exported, or treated waste deemed
hazardous under the terms of the Basel Convention Annex I, II, III, and
VIII, and percentage of transported waste shipped internationally.
(Additional indicator).
GRI table 8
7
Any movement of hazardous waste is conducted in full compliance
with the Basel Convention for controlling trans-boundary movements
of applicable hazardous wastes, e.g. between Botswana and South
Africa because no hazardous waste site exists in Botswana.
EN25 Identity, size, protected status, and biodiversity value of water bodies
and related habitats significantly affected by the reporting
organisation’s discharges of water and runoff. (Additional indicator).
n/a n/a 8
7
Snap Lake, the receiving water body at the Snap Lake Mine, is 200
hectares in area and has a limited absorption capacity because of its
size and low flow rate. The water aspects hence require careful
management.
2012 Assurance, Risk, and Compliance Supplement
26

Indicator DescriptionPage
reference ExtentUN
mechanisms Notes
Aspect: Products and Services
EN26 Initiatives to mitigate environmental impacts of products and services,
and extent of impact mitigation.
n/a n/a 8
7
The latent environmental impacts of diamonds as products are
non-existent.
EN27 Percentage of products sold and their packaging materials that are
reclaimed by category.
n/a n/a 8
7
The nature of diamonds means they are rarely knowingly disposed of.
Packaging is negligible.
Aspect: Compliance
EN28 Monetary value of significant fines and total number of non-
monetary sanctions for non-compliance with environmental laws
and regulations.
GRI table 8
7
The incidents at Snap Lake during 2011/2012 may result in a fine, but it
is expected that the process may take one to two years to finalise,
before it is known whether a fine will be levied.
Aspect: Transport
EN29 Significant environmental impacts of transporting products and other
goods and materials used for the organisation’s operations, and
transporting members of the workforce. (Additional indicator).
n/a n/a 8
7
The environmental impacts of transporting diamonds and other
goods and materials (other than as described elsewhere in the
2012 Report to Society) are negligible.
Aspect: Overall
EN30 Total environmental protection expenditures and investments by
type. (Additional indicator).
GRI table 8
7
Accounting procedures, spending classifications and the structure of
the Group of Companies mean this information is not available.
Labour Practices and Decent Work Performance Indicators
DMA Management Approach disclosures. 37-43
Aspect: Employment
LA1 Total workforce by employment type, employment contract,
and region.
6-7, 40
LA2 Total number and rate of employee turnover by age group, gender,
and region.
40
LA3 Benefits provided to full-time employees that are not provided
to temporary or part-time employees, by major operations.
(Additional indicator).
GRI table 3 Different operations offer various pensions and medical aid benefits
for full-time employees (see EC3). In South Africa, for example, the
company subsidises medical aid benefits to permanent employees
and their families.
Aspect: Labour/Management Relations
LA4 Percentage of employees covered by collective bargaining
agreements.
GRI table 3 Figure 6 shows union representation at our main operations in Africa.
Our operations in Canada are not unionised.
2012 Assurance, Risk, and Compliance Supplement
27

Indicator DescriptionPage
reference ExtentUN
mechanisms Notes
LA5 Minimum notice period(s) regarding operational changes, including
whether it is specified in collective agreements.
GRI table 3 Employees at our Namibian operations are subject to a one month
minimum notice period regarding operational changes. For
employees at DBCM, De Beers Group Services (South Africa) and
De Beers Marine (South Africa), a two month consultation process in
addition to the one month notice period is applied where changes to
our operational requirements are contemplated. At Debswana the
notice period is either three months (for more junior grades) or six
months (for more senior grades).
Aspect: Occupational Health and Safety
LA6 Percentage of total workforce represented in formal joint
management–worker health and safety committees that help
monitor and advise on occupational health and safety programmes.
(Additional indicator).
GRI table 1 Employees and contractors are represented in joint committees and
daily briefings with managers to monitor and advise on health and
safety programmes. In South Africa, for example, the law requires that
joint safety committees have 50 percent employee representation.
At Debswana, a Safety and Health Agreement is in place with relevant
unions covering health and safety committee meetings, as well as the
roles and responsibilities of safety representatives.
LA7 Rates of injury, occupational diseases, lost days, and absenteeism, and
number of work related fatalities by region.
6-7, 38-39, 42 1 Despite notable safety performance improvements across the Group,
we sadly lost three colleagues in loss of life incidents in 2012
(2011:seven). Our overall Lost Time Injury Frequency Rate (LTIFR)
improved in 2012 to 0.13 (2011: 0.15). This is a 46 percent improvement
compared to our LTIFR of 0.24 in 2010.
The Group of Companies has an outcome standard to maintain an
occupational illness frequency rate (OIFR) of less than five cases per
million hours worked. Definitions of occupational diseases and
statutory reporting requirements differ between operating units.
In 2012, across the Group of Companies, 12 cases of occupational
disease were diagnosed and reported in employees; four cases of
noise-induced hearing loss; four cases of occupational malaria; three
cases of carpal tunnel syndrome; and one case of loss of vision
associated with chemical exposure. In 2012, the OIFR for diseases
reported by the Group of Companies was 0.4 cases per million person
hours worked and thus well within the De Beers OIFR standard of <5
cases per million person hours worked.
2012 Assurance, Risk, and Compliance Supplement
28

Indicator DescriptionPage
reference ExtentUN
mechanisms Notes
LA8 Education, training, counselling, prevention, and risk-control
programmes in place to assist workforce members, their families, or
community members regarding serious diseases.
42, 6-7;
2012 Sustainability
Risk and
Compliance
Supplement
1 Sub-Saharan Africa accounts for 69 percent1 of all global HIV infections
and most of our workforce is in the hyper-endemic countries where
exposure to HIV is a real threat to our employees’ health, their families
and the continuity of our business. Our holistic strategy for managing
HIV risk includes prevention, treatment, care and support. We run
awareness-raising sessions and we provide confidential HIV
counselling and testing to all employees, spouses, life partners and
contractors. Anti-Retroviral Treatment (ART) is available free to
HIV-infected employees and their spouses or life partners where it
can be provided in a responsible and sustainable manner. Where it is
not available through public health systems, we continue to provide
lifelong ART upon retirement or retrenchment.
In addition to ART, our Disease Management Programme provides
employees with access to programmes that address physical and
psycho-social wellbeing related to HIV infection and treatment.
Tuberculosis is an important endemic disease and health indicator in
southern African countries that are hyper-endemic for HIV infection.
The estimated national incidence rate of tuberculosis in South Africa is
993 cases per 100,000 population. This compares to an incidence rate
among DBCM permanent employees in 2012 of 50 per 100,000. The
HIV programmes and active workplace screening for tuberculosis
have contributed to lowering the risk for contracting tuberculosis.
Similarly, education, screening and management of non-
communicable diseases reduce the personal health risks of the
workforce.
LA9 Health and safety topics covered in formal agreements with trade
unions. (Additional indicator).
GRI table 1 At Debswana, a Safety and Health Agreement is in place with relevant
unions covering health and safety committee meetings, as well as the
roles and responsibilities of safety representatives.
Aspect: Training and Education
LA10 Average hours of training per year per employee, by employee
category.
GRI table See Figure 7.
LA11 Programmes for skills management and lifelong learning that support
the continued employability of employees and assist them in
managing career endings. (Additional indicator).
40
1 http://www.unaids.org/en/media/unaids/contentassets/documents/epidemiology/2012/gr2012/20121120_UNAIDS_Global_Report_2012_en.pdf
2012 Assurance, Risk, and Compliance Supplement
29

Indicator DescriptionPage
reference ExtentUN
mechanisms Notes
LA12 Percentage of employees receiving regular performance and career
development reviews. (Additional indicator).
GRI table Our Talent Management Policy supports the recruitment,
development, succession and retention of employees across the
Group of Companies. It mandates the appointment of the best
qualified internal or external candidates in line with job requirements
and national legislation relating to employment equity. It also ensures
employee performance is gauged against a defined set of key
performance indicators, through regular dialogue and feedback. See
Figure 8. (Please note that blank entries may indicate either a lack of
employees at a relevant grade, or a lack of performance or career
development review).
Aspect: Diversity and Equal Opportunity
LA13 Composition of governance bodies and breakdown of employees per
category according to gender, age group, minority group
membership, and other indicators of diversity.
OFR PDF 27-29;
GRI table
6
3
The Group of Companies is committed to ensuring its workforce is
reflective of the societies in which we operate and to support
government efforts to offer opportunities to previously
disadvantaged groups. The Group of Companies ensures designated
groups have representation in decision-making positions that
reasonably reflects the demographics of the country’s economically
active population. A number of structures including our Employment
Equity Committee have been established in order to monitor our
performance in this respect. They include management
representatives, union representatives and functional personnel.
The Group of Companies is actively supporting efforts to increase the
proportion of women achieving senior management positions. In
South Africa, this includes our support of the ‘Women in Mining’
programme, which is facilitated by the Department of Minerals and
Energy through the Da Vinci Institute of Technology. We also support
the establishment of mentoring schemes within our operations.
These schemes encourage women in senior positions to share their
experience and to motivate women in more junior positions to
achieve their full professional potential.
See Figures 9 and 10.
LA14 Ratio of basic salary of men to women by employee category. GRI table 6
3
See Figures 11 and 12.
Human Rights Performance Indicators
DMA Management Approach disclosures. 27-33
2012 Assurance, Risk, and Compliance Supplement
30

Indicator DescriptionPage
reference ExtentUN
mechanisms Notes
Aspect: Investment and Procurement Practices
HR1 Percentage and total number of significant investment agreements
that include human rights clauses or that have undergone human
rights screening.
GRI table 1, 2 All investments over US$20 million are considered by the DBsa
Investment Committee. No significant investment agreements with
the potential to directly affect human rights took place in 2012.
HR2 Percentage of significant suppliers and contractors that have
undergone screening on human rights and actions taken.
32-33 1, 2 In the De Beers Group of Companies value-chain, the ethical, social
and environmental practices of our customers present a higher risk
than those of our suppliers. The Best Practice Principles Assurance
Programme includes human rights screening, and applies to
Sightholders, and to Significant Contractors that provide goods or
services to both De Beers and Sightholders.
HR3 Total hours of employee training on policies and procedures
concerning aspects of human rights that are relevant to operations,
including the percentage of employees trained. (Additional indicator).
GRI table 1, 2 According to submitted figures, 72,669 hours were spent on human
rights training. A total of 3,283 employees participated in this process,
representing 23.5 percent of the permanent workforce.
Aspect: Non-discrimination
HR4 Total number of incidents of discrimination and actions taken. GRI table 1, 2, 6 No incidents of alleged discrimination were reported within the
Group of Companies in 2012.
Aspect: Freedom of Association and Collective Bargaining
HR5 Operations identified in which the right to exercise freedom of
association and collective bargaining may be at significant risk, and
actions taken to support these rights.
GRI table 1-3 Trade union and employee associations have a strong presence and
operate freely at all of our mining operations.
Aspect: Child Labour
HR6 Operations identified as having significant risk for incidents of child
labour, and measures taken to contribute to the elimination of child
labour.
GRI table 1, 2, 5 No operations have been identified as presenting a significant risk for
child labour.
Aspect: Forced and Compulsory Labour
HR7 Operations identified as having significant risk for incidents of forced
or compulsory labour, and measures to contribute to the elimination
of forced or compulsory labour.
GRI table 1, 2, 4 No operations have been identified as presenting a significant risk for
forced or compulsory labour.
Aspect: Security Practices
HR8 Percentage of security personnel trained in the organisation’s policies
or procedures concerning aspects of human rights that are relevant
to operations. (Additional indicator).
GRI table 1, 2 De Beers has a group-level Security and Human Rights Policy that is
brought to the attention of security personnel as appropriate.
Aspect: Indigenous Rights
HR9 Total number of incidents of violations involving rights of indigenous
people and actions taken.
GRI table 1, 2 No incidents of violations involving rights of indigenous people were
recorded in 2012.
2012 Assurance, Risk, and Compliance Supplement
31

Indicator DescriptionPage
reference ExtentUN
mechanisms Notes
Society Performance Indicators
DMA Management Approach disclosures. 10, 17-21, 22, 23, 30,
47-50, 52, 53
Aspect: Community
SO1 Nature, scope, and effectiveness of any programmes and practices
that assess and manage the impacts of operations on communities,
including entering, operating, and exiting.
17, 21, 22, 23, 47-50,
53, 62
1, 2
Aspect: Corruption
SO2 Percentage and total number of business units analysed for risks
related to corruption.
30
SO3 Percentage of employees trained in organisation’s anti-corruption
policies and procedures.
GRI table Training is available for employees most at risk of exposure to
corruption. The percentage of employees trained in anti-corruption
policies and procedures was around 1 percent.
SO4 Actions taken in response to incidents of corruption. 30
Aspect: Public Policy
SO5 Public policy positions and participation in public policy
development and lobbying.
GRI table Public policy engagement ranges from direct engagement with
governments on regulation or mining policy, to contributing
knowledge and experience to debates on sustainability issues. We
prioritise public policy engagement on issues that could impact the
diamond industry, and influence economic growth and sustainable
development – particularly in Africa.
We generally restrict our involvement in policy development to
formal participation in relevant forums and organisations, such as the
national Chamber of Mines, or partnership initiatives with NGOs.
SO6 Total value of financial and in-kind contributions to political parties,
politicians, and related institutions by country. (Additional indicator).
21
Aspect: Anti-Competitive Behaviour
SO7 Total number of legal actions for anticompetitive behaviour, anti-trust,
and monopoly practices and their outcomes. (Additional indicator).
GRI table The Group of Companies works hard to ensure continued
compliance with competition and anti-trust laws and regulations in
all jurisdictions in which we operate. Employees are requested to
report any breaches of this policy through our whistleblowing
hotlines. De Beers will not tolerate violations of competition law, or
mistakes resulting from carelessness or inattention to legal
compliance by its employees. In 2012, over 690 individuals were
nominated to take part in online competition compliance training.
The average completion and pass rates across the Group of
Companies were 98 percent and 98 percent respectively.
2012 Assurance, Risk, and Compliance Supplement
32

Indicator DescriptionPage
reference ExtentUN
mechanisms Notes
Aspect: Compliance Core
SO8 Monetary value of significant fines and total number of non-
monetary sanctions for non-compliance with laws and regulations.
GRI table Other than described in the report, the Group of Companies was not
subject to any significant fines or non-monetary sanctions for
non-compliance with laws and regulations in 2012.
Product Responsibility Performance Indicators
DMA Management Approach disclosures. 27-33
Aspect: Customer Health and Safety
PR1 Life cycle stages in which health and safety impacts of products and
services are assessed for improvement, and percentage of significant
products and services categories subject to such procedures.
n/a n/a Diamonds do not present any latent health and safety risks.
PR2 Total number of incidents of non-compliance with regulations and
voluntary codes concerning health and safety impacts of products
and services during their life cycle, by type of outcomes.
(Additional indicator).
n/a n/a Diamonds do not present any latent health and safety risks.
Aspect: Product and Service Labelling
PR3 Type of product and service information required by procedures and
percentage of significant products and services subject to such
information requirements.
28, 32-33
PR4 Total number of incidents of non-compliance with regulations and
voluntary codes concerning product and service information and
labelling, by type of outcomes. (Additional indicator).
6-7, 28, 32-33
PR5 Practices related to customer satisfaction, including results of surveys
measuring customer satisfaction. (Additional indicator).
GRI table The DTC undertakes frequent surveys of Sightholder satisfaction with
the services they provide. Corporate Affairs also undertakes surveys
regarding Sightholder satisfaction with aspects of the Best Practice
Principles Assurance Programme (BPPs). Forevermark undertakes
frequent consumer-focused surveys.
Aspect: Marketing Communications
PR6 Programmes for adherence to laws, standards, and voluntary codes
related to marketing communications, including advertising,
promotion, and sponsorship.
GRI table Corporate Affairs and Forevermark – De Beers’ marketing arm – seeks
to ensure all materials produced on behalf of De Beers are not
misleading and are in compliance with applicable advertising rules
and legislation. They also seek to ensure such materials do not violate
the intellectual property rights of third parties.
PR7 Total number of incidents of non-compliance with regulations and
voluntary codes concerning marketing communications, including
advertising, promotion, and sponsorship by type of outcomes.
GRI table No incidents of non-compliance with regulations and voluntary
codes concerning marketing communications were recorded in 2012.
2012 Assurance, Risk, and Compliance Supplement
33

Indicator DescriptionPage
reference ExtentUN
mechanisms Notes
Aspect: Customer Privacy
PR8 Total number of substantiated complaints regarding breaches of
customer privacy and losses of customer data. (Additional indicator).
GRI table No substantiated complaints regarding breaches of customer privacy
and losses of customer data were recorded in 2012.
Aspect: Compliance
PR9 Monetary value of significant fines for non-compliance with laws
and regulations concerning the provision and use of products
and services.
GRI table No significant fines for non-compliance with laws and regulations
concerning the provision and use of products and services were
recorded in 2012.
Performance indicators – Mining and Metals Sector
Supplement (2012)
MM1 Amount of land (owned or leased, and managed for production
activities or extractive use) disturbed or rehabilitated.
62-63 8
7
MM2 The number and percentage of total sites identified as requiring
biodiversity management plans according to stated criteria, and the
number (percentage) of those sites with plans in place.
62-63 8
7
MM3 Total amounts of overburden, rock, tailings, and sludges and their
associated risks.
63 8
7
MM4 Number of strikes and lock-outs exceeding one week’s duration, by
country.
There were no incidents to report on in 2012.
MM5 Total number of operations taking place in or adjacent to Indigenous
Peoples’ territories, and number and percentage of operations or sites
where there are formal agreements with Indigenous Peoples’
communities.
48-51; 52;
GRI table
The only operations that took place in or adjacent to Indigenous
Peoples’ territories were the Snap Lake and Victor Mines in Canada
territories. In total, seven formal agreements have been entered into
with Indigenous Peoples’ Communities in relation to these
operations.
MM6 Number and description of significant disputes relating to land use,
customary rights of local communities and Indigenous Peoples.
50;
GRI table
Our materiality process (p5) indicates that land claims is a lower-level
risk and is therefore only reported on in brief. The structure and form
of grievance mechanisms vary across the Group of Companies. In
2011 an assessment and benchmarking of existing grievance
mechanisms commenced, to be completed in 2012.
MM7 The extent to which grievance mechanisms were used to resolve
disputes relating to land use, customary rights of local communities
and Indigenous Peoples, and the outcomes.
51-52
MM8 Number (and percentage) of company operating sites where artisanal
and small-scale mining (ASM) takes place on, or adjacent to, the site;
the associated risks and the actions taken to manage and mitigate
these risks.
GRI table The materiality process for our 2010 and 2011 Reports to Society
indicated that artisanal mining was a lower-level risk for the Group of
Companies and it was removed from the materiality matrix. In 2012,
our materiality process (p5) again indicated artisanal mining as a
lower-level risk and this issue is not reported in the 2012 Report to
Society.
2012 Assurance, Risk, and Compliance Supplement
34

Indicator DescriptionPage
reference ExtentUN
mechanisms Notes
MM9 Sites where resettlements took place, the number of households
resettled in each, and how their livelihoods were affected in
the process.
52;
GRI table
During the course of 2011 a small community of 72 persons, in 16
households, was resettled in the Lunda Norte region of Angola, in
order for safe exploratory drilling to occur. The resettlement process
was undertaken in line with the IFC Performance Standards, and
externally assured. In addition to compensation agreed through
extensive consultation with the community, ongoing agricultural
projects supported by De Beers will continue to focus on livelihood
restoration.
MM10 Number and percentage of operations with closure plans. 53, 62 All mining operations have closure plans. These are at varying degrees
of resolution dependent on the remaining life of mine. Exploration
operations have EMP that cover closure of the exploration sites.
MM11 Programmes and progress relating to materials stewardship. 58; GRI table 8
7
See also figures 2 and 3.
Performance indicators – Reporting Guidance on HIV/Aids
Good governance
Indicator 1 Describe the organisation’s HIV/Aids policy. 43 4-6
Indicator 2 Describe the overall strategy for managing the HIV/Aids risk. 42 4-6 Our approach to preventing HIV infection, both within our workforce
and more broadly, is built on awareness-raising, testing and research.
Awareness and training interventions are oriented towards preventing
and managing HIV and Aids, as well as related risks such as
tuberculosis.
Indicator 3 Describe preparedness and contingency planning in anticipation
of expected impacts.
GRI table 4-6 Given that the Group of Companies operates in hyper-endemic
countries such as Botswana, Namibia and South Africa, the impacts of
HIV and Aids are current rather than anticipated. The Group of
Companies has a long standing and comprehensive HIV and Aids
management in place in order to address the impacts of the disease.
Indicator 4 Describe how your organisation monitors its progress and reports
in terms of Indicators.
GRI table 4-6 The Group of Companies conducts operational and ‘in-field’ research
projects to improve the effectiveness of our existing HIV and Aids risk
management.
Indicator 5 Describe how the organisation involves stakeholders in the
formulation of policy, strategy and implementation.
12-13, 42 4-6 Our HIV and Aids principals engage actively with external
organisations at local, regional and international levels. Our
Anti-Retroviral Treatment (ART) programmes in Botswana, Namibia
and South Africa are coordinated externally by Aid for AIDS. We
engage in research partnerships, for example, a longitudinal study
with the Health Economics and HIV/AIDS Research Division (HEARD)
at the University of KwaZulu Natal on the factors that challenge
adherence to HIV treatment services.
2012 Assurance, Risk, and Compliance Supplement
35

Indicator DescriptionPage
reference ExtentUN
mechanisms Notes
Measurement, monitoring and evaluation
Indicator 6 Indicate current and projected future HIV/Aids prevalence and
incidence rates among relevant populations (workforce, service
providers, communities, target consumers, direct suppliers).
GRI table According to UNAIDS, there are 34 million adults and children living
with HIV. Taken from their 2012 report on the global AIDS epidemic,
the 2011 estimated HIV prevalence adults (15-49 years) in our countries
of operation are as follows:
• Angola: 2.1 percent.
• Canada: 0.3 percent.
• China: 0.1 percent.
• Belgium: 0.3 percent.
• Botswana: 23.4 percent.
• DRC: no estimate.
• India: no estimate.
• Israel: 0.2 percent.
• Japan: <0.1 percent.
• Luxembourg: 0.3 percent.
• Namibia: 13.4 percent.
• South Africa: 17.3 percent.
• United Kingdom: 0.3 percent.
• United States of America: 0.6 percent.
www.unaids.org
Indicator 7 Report current HIV/Aids-associated costs and losses to the
organisation.
– X
Indicator 8 Indicate total assumed future HIV/Aids-associated costs/losses. – x
2012 Assurance, Risk, and Compliance Supplement
36

Indicator DescriptionPage
reference ExtentUN
mechanisms Notes
Workplace conditions and HIV/Aids management
Indicator 9 Describe the workplace and workplace-related HIV/Aids programmes
and interventions and the extent to which they maintain a workplace
environment respectful of human and legal rights.
42 4-6 Routine HIV Counselling and Testing (HCT) through Provider Initiated
Counselling and Testing (PICT) facilitates HIV testing of employees
during medical consultations at mine clinics, either during
occupational medical examinations or primary care consultations. HIV
tests are available to all employees, spouses, life partners and
contractors. Private-public partnerships also help to make testing
available in communities near our operations.
Anti-Retroviral Treatment (ART) is available free to HIV-infected
employees and their spouses or life partners where it can be provided
in a responsible and sustainable manner. Our ART programmes in
Botswana, Namibia and South Africa continued to be coordinated
externally by Aid for AIDS as our principal Disease Management
Service Provider. Our goal is to encourage all HIV positive employees
and spouses or life partners to join a disease management
programme as early as possible and to maintain 100 percent
accessibility of treatment in the countries affected by HIV and Aids.
Indicator 10 Indicate total allocated budget dedicated to HIV/Aids programmes
per annum.
GRI table 4-6 Approximately 0.03 percent of total Community Social Investment
spend was allocated to HIV/Aids programmes in 2012. This is in
addition to the employee-focused programmes and spending on
general health care programmes (39.3 percent).
Depth, quality and sustainability of programmes
Indicator 11 Detail the organisation’s Voluntary Counselling and Testing (VCT)
programme.
42,
GRI table
4-6 See Indicator 9.
Indicator 12 Describe other support and counselling programmes and measures. GRI table 4-6 See Indicator 15.
Indicator 13 Describe the organisation’s HIV/Aids education and training
programmes.
42,
GRI table
4-6 See Indicator 9.
Indicator 14 Describe the organisation’s condom and femidom distribution
programme.
GRI table 4-6 Condoms and femidoms are available free of charge to employees
through on-site medical centres, clinics, restrooms and offices.
2012 Assurance, Risk, and Compliance Supplement
37

Indicator DescriptionPage
reference ExtentUN
mechanisms Notes
Indicator 15 Describe the organisation’s general health care and wellness provision
for employees (and/or ex-employees) and their families with specific
mention of STD-treatment for those Aids sick.
42 4-6 In addition to ART, our Disease Management Programme provides
employees with access to programmes that address physical and
psycho-social wellbeing related to HIV infection and treatment.
This includes:
• Post-exposure prophylaxis;
• Medication to prevent opportunistic infections;
• Pathology;
• Counselling and support;
• Wellness advice; and
• Nutritional supplements.
Indicator 16 Describe additional benefits and support for employees sick, dying or
deceased from Aids-related conditions.
– x 4-6
2012 Assurance, Risk, and Compliance Supplement
38

Fig. 3a
EC6 – Preferential procurement spend, 2010–2012 (US$ million)
■ Namibia* (Namibian suppliers) ■ Canada (Aboriginal spend) ■ South Africa (HDSA owned, empowered, influenced)
■ Botswana (citizen spend, local spend)
1200
800
400
201220112010
94.098.8
115.4
271.7
345.8
98.9
336.8
408.4
179.3
111.3
440.3
372.7
Data note: * Preferential procurement spend in Namibia has been restated for 2010 to reflect spending with Namibian suppliers.
Previously, reported spending in Namibia was based on proposed preferential procurement categories due to be passed into Namibian law. This legislation has not been passed and preferential procurement has been restated to reflect local (in-country) spending.
Fig. 3b
Preferential procurement spend as a proportion of total procurement spend, 2012 (US$ million)
Country Total spend (US$ million) Preferential procurement 100%
Botswana 606.2 61.5
South Africa 723.0 60.9
Canada 301.5 36.9
Namibia 307.4 58.3
Fig. 4
EN1 – Materials used by weight or volume
Materials 2010 2011 2012
Ferrosilicon (tonnes) 13,111 11,938 9,192
Oils and hydraulic fluid (litres) 4,438,632 4,066,709 4,711,606
Grease (kilogrammes) 287,964 403,307 181,337
Hydrochloric acid (litres) 197,984 112,959 356,018
Sulphuric acid (litres) 21,705 25,202 388,201
Hydrofluoric acid (litres) 69,931 63,945 82,139
Nitric acid (litres) 35,438 38,321 171,161
Sodium hydroxide (litres) 5,832 9,484 10,616
Calcium carbonate (kilogrammes) 51,300 36,106 39,685
Sodium hydroxide (kilogrammes) 91,540 154,564 89,299
Bromoform (litres)* – – 10
* Bromoform is used by Element Six. Data for Element Six is being reported for the first time in 2012.
2012 Assurance, Risk, and Compliance Supplement
39

Fig. 5
EN22 – Total weight of waste by type and disposal method
Waste type 2010 2011 2012
Non-Hazardous Waste to Landfill (cubic metres) 152,904 59,509 67,818
Solid Hazardous Waste (cubic metres) 2,327 210,868 203,975
Liquid Hazardous Waste (litres) 516,467 376,143 3,071,710*
Waste Incinerated (cubic metres) 47,236 30,244 110,415
Cardboard/Paper Sent for Recycling (tonnes) 8,879 1,602 5,115
Scrap Metal Sent for Recycling (tonnes) 52,155 25,041 14,101
Cans Sent for Recycling (tonnes) 7 19 46
Earthmoving Tyres Sent for Recycling (number) 33 76 69
Light Vehicles Tyres Sent for Recycling (number) 111 686 175
Conveyor Belting Sent for Recycling (tonnes) 215 139 167
Drums Sent for Recycling / Re-use (number) 1,450 2,331 1,635
Lead Acid Batteries Sent for Recycling / Re-use (number) 3,619 1,333 1,450
Plastic Sent for Recycling / Re-use (tonnes) 165 82 2,148
Toner / Ink Cartridges Sent for Recycling / Re-use (number) 1,104 5,599 2,022
Electrical and Electronic Items Sent for Recycling / Re-use
(kilogrammes)
37,104 10,871 16,534
Used Oil / Grease Sent for Recycling / Re-use (litres) 2,244,201 2,709,501 2,932,231
Re-used Oil / Grease (litres) 988,549 568,164 658,155
Contaminated Water (litres) 1,112,670 1,176,389 5,005,122*
Glass Sent for Recycling (tonnes) 15 60 71
* Increase due to reporting Element Six data for the first time in 2012.
Fig. 6
LA4 – Union membership of semi-skilled workers at African operations, 2010–2012 (%)
■ Debswana ■ Namdeb ■ DBCM
201220112010
100
75
50
25
8984
90 89
72
8591
67
94
Data note: Our operations in Canada are not unionised.
Fig. 7
LA10 – Average hours of training by employee category, 2012
75
50
2528.5
20.3
48.8
30.024.7
18.06.0
41.1
31.5
F-Band /Grade 8
EU-Band /Grade 7
EL-Band / Grade 6
DU-Band /Grade 5
DL-Band /Grade 4
CU-Band /Grade 3
CL-Band /Grade 2
B-Band /Grade 1
A-Band
Data note: Our operations in Canada are not unionised.
2012 Assurance, Risk, and Compliance Supplement
40
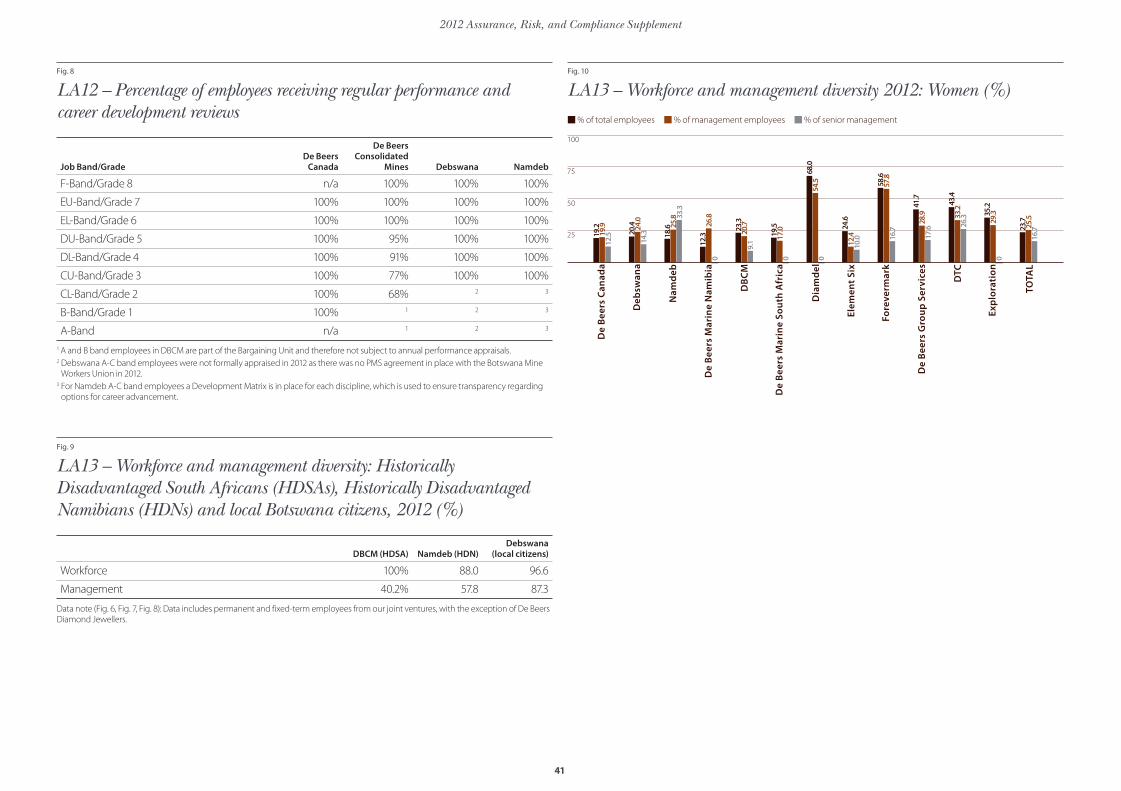
Fig. 8
LA12 – Percentage of employees receiving regular performance and career development reviews
Job Band/GradeDe Beers
Canada
De Beers Consolidated
Mines Debswana Namdeb
F-Band/Grade 8 n/a 100% 100% 100%
EU-Band/Grade 7 100% 100% 100% 100%
EL-Band/Grade 6 100% 100% 100% 100%
DU-Band/Grade 5 100% 95% 100% 100%
DL-Band/Grade 4 100% 91% 100% 100%
CU-Band/Grade 3 100% 77% 100% 100%
CL-Band/Grade 2 100% 68% 2 3
B-Band/Grade 1 100% 1 2 3
A-Band n/a 1 2 3
1 A and B band employees in DBCM are part of the Bargaining Unit and therefore not subject to annual performance appraisals.2 Debswana A-C band employees were not formally appraised in 2012 as there was no PMS agreement in place with the Botswana Mine
Workers Union in 2012. 3 For Namdeb A-C band employees a Development Matrix is in place for each discipline, which is used to ensure transparency regarding
options for career advancement.
Fig. 9
LA13 – Workforce and management diversity: Historically Disadvantaged South Africans (HDSAs), Historically Disadvantaged Namibians (HDNs) and local Botswana citizens, 2012 (%)
DBCM (HDSA) Namdeb (HDN)Debswana
(local citizens)
Workforce 100% 88.0 96.6
Management 40.2% 57.8 87.3
Data note (Fig. 6, Fig. 7, Fig. 8): Data includes permanent and fixed-term employees from our joint ventures, with the exception of De Beers Diamond Jewellers.
Fig. 10
LA13 – Workforce and management diversity 2012: Women (%)
■ % of total employees ■ % of management employees ■ % of senior management
TOTA
L
Explo
ratio
n
DTC
De Bee
rs G
rou
p Ser
vice
s
Fore
verm
ark
Elem
ent Si
x
Dia
mdel
De Bee
rs M
arine So
uth
Afric
a
DB
CM
De Bee
rs M
arine
Nam
ibia
Nam
deb
Deb
swan
a
De Bee
rs C
anad
a
100
75
50
25 19.2
12.519
.9
20.4
14.324.0
18.6
33.3
0
25.8
12.3
26.8
0 0 0
19.5
17.0 24
.612.4
68.0
54.5
23.3
9.1 10.0 17
.620.7
58.6
57.8
41.7
28.9
26.3
43.4
33.2
16.723
.725.5
35.2
29.3
16.7
2012 Assurance, Risk, and Compliance Supplement
41

Fig. 11
LA14 – Male : Female salary ratio, 2012 (by operation)
Gro
up
of
Co
mp
anie
s
Explo
ratio
n
DTC
DB
Gro
up
Ser
vice
s
Fore
verm
ark
Dia
mdel
Fore
verm
ark
DB
Marine
Nam
ibia
DB
Marine So
uth
Afric
a
Nam
deb
Deb
swan
a
DB
CM
De Bee
rs C
anad
a
1.030.95
0.890.97
0.870.91 0.91 0.90
1.010.95 0.991.01
1.2
0.2
0.4
0.6
0.8
1.0
Fig. 12
LA14 – Male : Female salary ratios, 2012 (by grade)
1.20
0.80
0.60
1.00
0.40
0.20
0.970.950.970.95
0.83
1.00 1.000.90
EU-Band /Grade 7
EL-Band / Grade 6
DU-Band /Grade 5
DL-Band /Grade 4
CU-Band /Grade 3
CL-Band /Grade 2
B-Band /Grade 1
A-Band
Data note (Fig. 10, Fig. 11, Fig. 12): Data includes permanent and fi xed-term employees from our joint ventures, with the exception of De Beers Diamond Jewellers.
2012 Assurance, Risk, and Compliance Supplement
42