Embed Size (px)
Citation preview

2012-2014
MONTANA BOARD OF CRIME CONTROL
Title II
3-Year Plan 2013 Update
State of Montana 2013 Title II Formula Grant
Page 1 of 33
Project Abstract
Montana’s governor-appointed Youth Justice Advisory Council (YJC) has determined the following priorities for Title II funding: Native American programs; delinquency prevention; alternatives to detention; disproportionate minority contact; diversion; and juvenile justice system improvement. The purpose of Montana’s Title II Formula Grant program is to provide effective juvenile justice programs and programs that improve Montana’s juvenile justice system. The population to be served includes all Montana youth and their families at risk for coming into contact with the juvenile justice system. Project goals include the support of state and local juvenile justice system improvement efforts; improvement of the juvenile justice system through increased availability and types of prevention and intervention programs; improvement of tribal justice system capacity for delivering and implementing promising and best practices prevention and intervention programs for Native American youth and families; increase availability of community-based juvenile detention alternatives; and monitor and ensure compliance with the DMC core requirement. A Title II RFP will be released; applications will be processed; funding decisions will be made. The Title II subgrantees submit quarterly reports; subgrantees also submit their data in the DCTAT. Subgrantee progress is measured through an evaluation process which includes quarterly reports, desk audits, and site visits.

State of Montana 2013 Title II Formula Grant
Page 2 of 33
Attachment 1: Program Narrative
a. System Description: Structure and Function of the Juvenile Justice System No Change; see Montana’s 2012 application, Attachment 1, pp. 2 – 10. b. Analysis of Juvenile Crime Problems and Juvenile Justice Needs Updated below
(1) Analysis of Juvenile Crime Problems – Updated (See Attachment 6: Juvenile Crime Data for a-e)
(a) Juvenile arrests by offense type, gender, age, and race (b) Number and characteristics (by offense type, gender, race, and age) of juveniles referred to juvenile court, a probation agency, or special intake unit for allegedly committing a delinquent or status offense (c) Number of cases handled informally and formally by gender, race, and type of disposition (d) Number of delinquent and status offenders admitted, by gender and race, to juvenile detention facilities and adult jails and lockups (if applicable) (e) Other social, economic, legal, and organizational conditions considered relevant to delinquency prevention programming.
(2) State Priority Juvenile Justice Needs/Problem Statements - Update
The needs, gaps, and scope of issues identified for the juvenile justice system for the state of Montana can be categorized along the continuum of intervention, prevention, and accountability programs. Data elements considered include the analysis of juvenile crime problems in the state as presented in the above section, a survey conducted with statewide probation officers in November 2005 based upon the survey developed by the National Center for Juvenile Justice (with permission), and the SAG strategic planning sessions provided through technical assistance from the OJJDP and DSG in September 2011. Other data sources include the Annie E. Casey Foundation’s 2011 Kids Count Data Book, the 2010 Prevention Needs Assessment Survey conducted by the State Department of Public Health, Chemical Dependency Bureau, Addictive and Mental Disorders Division (AMDD), and the 2011 Montana Youth Risk Behavior Survey (YRBS) conducted by the Montana Office of Public Instruction (OPI). In addition, a copy of the White Paper created by the Youth Justice Advisory Council (YJC) for the Law and Justice Interim Committee is included as an attachment. This document outlines YJC concerns regarding juvenile justice in Montana for the legislative interim committee members and serves as a resource for the 2011-2014 three-year plan.

State of Montana 2013 Title II Formula Grant
Page 3 of 33
Problem Statement 1: Alternatives to Detention In order to allow for implementation of the Juvenile Detention Alternative Initiative, more alternatives to detention need to be developed in local communities. At the 3-Year Strategic Plan meeting held in September 2011, the SAG identified the following intervention needs:
There is a need to increase and sustain evidence-based, community-based programs available as alternatives to detention that incorporate graduated sanctions and ensure youth and family engagement in appropriate services based upon assessment.
Problem Statement 2: Intervention In order to provide Montana’s youth with effective juvenile justice intervention programs, the Montana juvenile justice system needs to develop a continuum of care that includes mental health treatment and drug and alcohol treatment based on normed, validated, and age and gender appropriate assessments; evidence-based treatment and intermediate sanctions; and needs to provide appropriate training to reflect these elements as well as system accountability to ensure youth are provided and are engaged in treatment. The SAG has identified prevention programming as the second priority for addressing the needs of at-risk youth in the state of Montana. At the September 2011 SAG strategic plan meeting the SAG listed the following priorities:
Training for judges and the juvenile justice system in adolescent brain development, evidence-based approaches, the impact of youth trauma and other areas important to understanding youth (i.e., public defenders, county attorneys, probation officers, law enforcement, mental health professionals, and others in the juvenile justice continuum.
Training for public defenders, county attorneys, and probation officers in representation of youth and the Youth Court Act.
Improved screening and assessments available at the front end and throughout the system and at detention centers that are validated, normed, and age and gender appropriate. This may include regional assessment centers open to all youth regardless of income, gender, age, or other status.
Improved access to evidence-based practices and services, such as skill building education (increased knowledge of the harmful effects of substance abuse will not change adolescent behavior), mental health and/or chemical dependency treatment while on probation and/or in detention.
Problem Statement 3: Prevention In order to reduce the number of youth entering the Montana Juvenile Justice system, and later the Montana Adult Justice System, Montana needs to provide evidence-based prevention and early intervention programs based on normed, validated, and age and gender appropriate screening and assessment (i.e., mental health, substance abuse, education) to Montana youth and families.

State of Montana 2013 Title II Formula Grant
Page 4 of 33
Coordinated planning between agencies that incorporates a child and family-driven, high-
fidelity wraparound approach. Consistent with the child- and family-driven, high-fidelity wraparound approach, there
should be normed, validated, and age and gender appropriate mental health screening and assessments that are accessible to all Montana’s youth and families, and that guide them to services targeted for early identification of at-risk youth and services needed.
There should be normed, validated, and age and gender appropriate mental health screening and assessments of youth strengths and needs in other areas, such as education, to prevent youth from entering the juvenile justice system.
Provide evidence-based prevention and early intervention programs focused on strengthening families in order to prevent and/or delay youth’s entry into the juvenile justice system.
Identify and secure funding streams that promote interagency/program collaboration within communities, counties, and the state.
Collaboration with other agencies in early identification and referral to services of at-risk youth and families through home healthcare visits for at-risk pregnant mothers and others who need assistance.
Collaboration with other agencies in early identification and referral to services for at-risk preschool and elementary school-age youth and their families through normed, validated, and age and gender appropriate screening and assessments.
Collaborate with other agencies to provide evidence-based, co-occurring treatment for youth. In Montana this is in the beginning stages and requires training initially in identification and development of these approaches.
Problem Statement 4: Accountability Successful coordination and implementation of juvenile accountability programs in Montana requires overcoming the barriers of a large, geographically separate state. These geographic challenges extend to technology barriers created by distance and remoteness of sites; limits to resources for safety and services for youth due to limited provision of services and access to security in some areas of the state; as well as vastly different cultures and ability to communicate between areas of the state.
Support for accountability and graduated sanctions, and evaluation training for courts, probation, judges, law enforcement, and the legal community that utilizes new technologies to bridge the large geographic challenges presented by Montana’s geography.
Effective application and equitable availability of evidence-based prevention and intervention programs to avoid escalation within the juvenile system and to prevent a youth from entering the adult system.
Collaborate with Youth Court, the Cost Containment Committee, and other key juvenile justice partners to sustain and maintain effective or evidence-based diversion programming in communities, identifying new approaches with potential effectiveness, and to ensure underserved kids have access to programs.

State of Montana 2013 Title II Formula Grant
Page 5 of 33
Collaborate with other agencies to provide evidence-based, co-occurring treatment for youth. In Montana this is in the beginning stages and requires training initially in identification and development of these approaches.
Judges should be provided more discretion and maximum flexibility to keep youth appropriately out of detention; this may entail legislative or policy changes or increase training opportunities for judges.
Develop better technological tools, including effectively communicating data systems (i.e., between and among lower courts and youth courts to track MIPs) in order to be able to hold youth more accountable more effectively, given Montana’s geography and distance.
Develop tools and facilities for keeping youth in-state who may have issues of violence or may be perceived as a threat without resorting to holding in a detention facility and ensuring that they receive appropriate treatment services. Current law prohibits holding mental health youth in Corrections facilities; this is not seeking to put youth in those facilities, but rather is seeking appropriate and safe strategies or facilities with which to safely treat these youth.
Problem Statement 5: Juvenile Justice Systems Improvement The Montana Board of Crime Control recognizes that the overuse of detention for misdemeanants and probation violators is an ongoing problem and successful evidence-based programming requires effective evaluation. Consequently, the Board proposes to continue supporting the Annie E. Casey Foundation’s Juvenile Detention Alternative Initiative and to provide effective training to grantees for program evaluation and continue to ensure that all RFPs or processes and all grantees include evaluation components in successful applications.
All RFPs include an evaluation component. Provide annual evaluation training to ensure grantees can effectively evaluate the impact
and success of their programs. Improve state level data systems to ensure adequate evaluation and greater information
sharing among agencies. Problem Statement 6: Gender-Specific Programming Recent data in Montana indicates there may be a trend upwards of increased referrals and misdemeanant charges to girls in the juvenile justice system. This trend needs to be explored and the potential impact needs to be assessed. In this way Montana will be prepared if this trend materializes.
Review of data. Learn about evidence-based gender and LGBT programs that reflect populations
represented in the data trends. If necessary, implement effective programs that address these trends.
Problem Statement 7: Substance Abuse Recent data in Montana indicates there may be a trend upwards of increased referrals and charges related to marijuana use and the abuse of prescription medications by juveniles. This

State of Montana 2013 Title II Formula Grant
Page 6 of 33
trend needs to be explored and the potential impact needs to be assessed. In this way Montana will be prepared if the trend materializes.
Review of data. Learn about evidence-based substance abuse programs that address these areas
represented in the data trends. If necessary, implement effective programs that address these trends.
Problem Statement 8: Disproportionate Minority Contact Minority youth are overrepresented in the Montana juvenile justice system. Efforts are underway in the state to address this disparity. Effective and additional measures should continue to be pursued in order to address barriers to resolving Disproportionate Minority Contact within the juvenile justice system.
Identify any barriers to implementing the DMC Reduction Model and recommend a plan to address them if they arise, as they arise.
Use OJJDP’s RRI form to determine whether DMC exists in the juvenile justice system among minority groups that represent at least 1% of Montana’s general youth population between the ages of 10 and 17 statewide and in at least 3 local sites.
Assess the causes of DMC for the identified system contact points and minority groups wherever DMC is identified within the juvenile justice system.
Fund prevention and intervention best or promising practices programming, if available, to address DMC based on assessment findings and recommendations; and advocate for systemic change in the appropriate geographic, demographic, and system decision points.
Require all implemented DMC prevention/intervention programming to report to the Statewide Planning Agency and the federal DCTAT database using the performance measures developed by OJJDP for the DMC purpose area in order to provide for evaluation of the programs.
Accurately collect and report RRI data annually; monitor the RRI trends to determine if the interventions are having the desired long-term impact on DMC.
c. Plan for Compliance with the First Three Core Requirements of the JJDP Act and
the State’s Compliance Monitoring Plan (1) Plan for Deinstitutionalization of Status Offenders (DSO): Trend Analysis
In the past 10 years, Montana has been in full compliance, with no violations in 2002 and 2004 and substantial compliance in all others. The highest rate was 3.19 violations per 100,000 youth in 2009. All violations have been against state statute, isolated and circumstantial in nature and have constituted neither a pattern nor a practice.

State of Montana 2013 Title II Formula Grant
Page 7 of 33
State Statutes Pertaining to DSO: See Attachment 3 for relevant Montana state statutes. Strategy for Maintaining Compliance: Reference the logic model of Montana’s Compliance Plan for maintaining compliance with the core requirements of the JJDP Act (Part d. of this application).
(2) Plan for Separation of Juveniles from Adult Offenders: Trend Analysis Montana has been in full compliance, with no violations of the sight and sound separation requirements of the JJDP Act for 9 of the past 10 years. The only exception was in 2006, when Montana was in substantial compliance, with a rate of 1 violation per 100,000 youth. Violations were isolated, against state statute, and constituted neither a pattern nor a practice.
0
0.5
1
1.5
2
2.5
3
3.5
2002 2003 2004 2005 2006 2007 2008 2009 2010 2011
10 Year Analysis of MT's DSO Violation Rates from OJJDP Compliance Reports
Violation Rate per100,000 youth

State of Montana 2013 Title II Formula Grant
Page 8 of 33
State Statutes Pertaining to Separation of Juveniles from Adult Offenders: See Attachment 3 for relevant Montana state statutes. State Administrative Rules Pertaining to Collocated Facilities: See Attachment 3 for relevant Montana state statutes. Strategy for Maintaining Compliance: Reference the logic model of Montana’s Compliance Plan for maintaining compliance with the core requirements of the JJDP Act (Part d. of this application).
(3) Plan for Removal of Juveniles from Adult Jails and Lockups: Trend Analysis Montana was in full compliance with the rural exception for jail removal with no violations in 2002, 2004, and 2010; Montana was in substantial compliance in the remaining 7 years. The highest rate of violations per 100,000 youth was 3.19 in 2009. Violations are random and situational and do not constitute a pattern or practice of violations. All violations were also violations of state statute. State Statutes Pertaining to Jail Removal and the Rural Exception: See Attachment 3 for relevant Montana state statutes. To meet the requirements of the rural exception, Montana wrote Part 19 of the Youth Court Act that provides for the creation of juvenile detention regions. The legislature currently provides just under $1 million in state general funds to subsidize regional juvenile alternatives to detention and juvenile detention services. Each region has at least one state licensed juvenile or collocated
0
0.2
0.4
0.6
0.8
1
1.2
2002 2003 2004 2005 2006 2007 2008 2009 2010 2011
10 Year Analysis of MT's Sight & Sound Separation Violation Rates from OJJDP
Compliance Reports
Violation Rate per100,000 youth

State of Montana 2013 Title II Formula Grant
Page 9 of 33
detention facility, putting law enforcement in close enough proximity of a juvenile facility that they can be compliant with the older, more restrictive 24-hour criteria of the JJDP Act.
Rural Exception for Jail Removal The State of Montana requests to continue using the Rural Exception to Jail Removal for the reasons of time and distance; weather conditions; and the rural/frontier nature of the majority of Montana. Time and Distance Montana lies in the northwest section of the lower 48 states, bordered on the north by Canada. It is the fourth largest state in the United States, encompassing 145,552 land area square miles and a population of just under 1 million people, for a population density of 6.2 persons per square mile (2010 Census). Montana and Delaware receive the same minimum allocation for monitoring; however, the entire state of Delaware is smaller than the smallest county in Montana! Although Montana does not have as many youth as other states, there are greater distances to travel with less staff to accomplish the on-site monitoring and training. The eastern portion of Montana is the least populated and consists of rolling plains. The western portion of the state is more populous, but very mountainous. In recent years the population and crime problems have boomed with the

State of Montana 2013 Title II Formula Grant
Page 10 of 33
development of the Bakken oil fields at a rate that exceeds the ability of local communities to keep pace. Conditions of weather Montana weather is extreme, to say the least. The coldest temperature recorded in Montana was -70 F at Rogers Pass north of Helena on January 20, 1954; this is also a national record for the lower 48 states. The warmest recorded temperature in Montana was 117 degrees F in Glendive on July 20, 1893. Winter weather can be severe, with blowing snow and sub-zero temperatures. The record for the coldest spot in the lower 48 states is held by Montana at 72 degrees below zero. Extreme weather variations mean extreme driving conditions. When the heavy snows throughout western and central Montana and the high winds of eastern and south central Montana are factored, driving from one community to the next can be an adventure! Metropolitan Statistical Areas (MSAs) With the exception of Missoula, Great Falls, and Billings, the entire state is rural or frontier in nature. Strategy for Maintaining Compliance: Reference the logic model of Montana’s Compliance Plan for maintaining compliance with the core requirements of the JJDP Act (Part d. of this application).
d. Plan for Compliance Monitoring for the First Three Core Requirements of the JJDP Act.
1. Policy and procedures. The Manual for Monitoring Compliance is located online
at http://mbcc.mt.gov/JuvenileJustice/Compliance/2011MonitoringPlan.pdf. 2. Monitoring authority. Beginning on page 7, Section 200 of the Manual sets forth
the statutes, policy, and procedure that ensure MBCC has sufficient legal authority to require onsite inspection of each facility that could hold youth as the result of public authority for the purposes of facility classification; verification of facility records to reported data; review of processes and areas used to process and hold youth in custody pending release to parents/guardian or transfer to another facility; and enforce sanctions when violations are not corrected.
3. Monitoring timeline. The monitoring schedule is provided in Attachment 4. 4. Violation procedures. Beginning on page 30, Section 406 of the Manual sets
forth the procedures to be used when a facility is alleged or found to be in violation of the JJDP or Youth Court Acts.
5. Barriers and strategies. Beginning on page 5, Section 100 of the Manual sets
forth the procedures to ensure that emerging barriers to maintaining compliance

State of Montana 2013 Title II Formula Grant
Page 11 of 33
with the core requirements of the JJDP Act and the Youth Court Act are identified and state and local strategies are developed to overcome them.
6. Definition of terms. Beginning on page 9, Section 400 of the Manual provides
definitions compatible with those found in the JJDP Act and Formula Grant Regulations.
7. Identification of the monitoring universe. Beginning on page 17, Section 401 of
the Manual sets forth the procedures used to identify facilities in which youth may be placed as the result of public authority.
8. Classification of the monitoring universe. Beginning on page 19, Section 402 of
the Manual describes the process used to classify facilities and further identify the Monitoring Universe.
9. Inspection of facilities. Beginning on page 27, Section 405 of the Manual sets
forth the policy and procedure for conducting onsite monitoring of a facility to update classification; inspect physical areas and conduct staff interviews to determine if youth in custody are being handled in compliance with statutory and regulatory requirements; ensure that adequate data and supporting documentation are maintained to determine compliance with the statutory requirements and to verify self-reported data; and conduct investigations of alleged violations.
10. Data collection and verification. Beginning on page 25, Section 404 of the
Manual sets forth policy and procedure for data collection and verification. Montana contracts for onsite inspections and data verification. Following is the contact information for the current onsite monitor contractor:
Thomas Corbett ITH Associates 1109 9th Avenue Helena, MT 59601 406-461-3845 Mr. Corbett was hired on an emergency limited solicitation. Before MBCC can
renew a compliance contract on a regular basis, the state procurement process requires a full solicitation be completed in 2013. MBCC is in the process of soliciting a new contractor for the upcoming state fiscal year (July 1, 2013 through June 30, 2014). MBCC does not know who will have the contract for the upcoming state fiscal year. $25,000 of Title II funds has been budgeted to cover the estimated contract costs. The current contract reimburses a flat rate of $350 per report plus lodging, per diem, and mileage at the current state rate.

State of Montana 2013 Title II Formula Grant
Page 12 of 33
e. Plan for Compliance with the Disproportionate Minority Contact (DMC) Core Requirement
Phase I: Identification (1) Updated DMC Identification Spreadsheets.
The updated Relative Rate Indexes (RRIs) for the State of Montana, Cascade, Hill, Missoula, and Yellowstone Counties for calendar year 2012 are provided in individual attachments identified as Attachment 2 with specific location indicators in the file name.
(2) DMC Data Discussion. 1. Prior to 2005, Montana could only provide best available data for the point
of contact (POC) necessary to complete OJJDP’s RRI. In May 2005 data became available for all points of contact that meet with definitions provided by OJJDP’s Technical Assistance Manual. OJJDP requires duplicated data as a means of monitoring contacts with the system. Montana developed a new data set in the National DMC Website in 2005 to track the data provided primarily by the Juvenile Courts Assessment and Tracking System (JCATS).
2. There has been an overall decline in youth population since 2005. The
overall figure masks a 14 percent increase in Hispanic youth of all races and an 18 percent decrease in Black non-Hispanic (BNH) youth, a 5 percent decrease in American Indian/Alaska Native/non-Hispanic (AI/AN/NH) youth, and a 4 percent decline in both White and Asian NH youth.
3. In 2005 Montana had 3 populations that met the 1 percent rule: Hispanic youth of any race (YOAR); non-Hispanic (NH) AI/AN youth; and Other/Mixed. The federal Office of Management and Budget (OMB) no longer provides population projections for the Other/Mixed population; therefore, Montana is unable to analyze DMC for the Other/Mixed population between census years. In 2011 the BNH population met the 1 percent rule for the first time in Montana.
4. Montana’s population reached one million in 2011; the 2012 population
estimate is 1,005,141, reflecting a 1.6% increase since 2010. While the general population is growing, the youth population ages 10-17 is declining. This population is spread over 147,046 square miles. Youth of color are often not represented in some POC; numbers of cases are so small in some areas that it cannot be said with statistical confidence whether DMC exists. Therefore, Montana only charts the statistically significant RRI trends. Even then, the numbers are so small that minor changes of one or two youth can result in large changes in the relative rate trends.

State of Montana 2013 Title II Formula Grant
Page 13 of 33
5. Charts of statistically significant RRI magnitude trends since 2005 by POC and Race/Ethnicity for Montana and each of the DMC and Juvenile Detention Alternative Initiative (JDAI) pilot sites follow. The 2005 data represent only 8 months of data, so the actual declines in DMC are likely greater than what is reflected in the charted trends.
Statistically significant RRI trend for all minorities at the POC of arrest
County Race/Ethnicity Juvenile System Point of Contact 2005 2006 2007 2008 2009 2010 2011 2012
Cascade All Minorities Arrested 2.85 2.40 2.81 2.62 3.53 2.56 2.67 3.32
Hill All Minorities Arrested 2.92 3.65 4.94 4.13 2.33 2.13 2.00 1.88 Missoula All Minorities Arrested 1.49 1.41 1.39 1.26 Statewide All Minorities Arrested 1.44 1.40 1.52 1.38 1.50 1.19 1.35 1.26
Yellowstone All Minorities Arrested 1.82 1.67 2.04 1.81 2.19 1.83 1.72 1.45 Cascade County shows an increase from 2.85 in 2005 to 3.32 in 2012. Cascade County is a regional service center for three reservations and Malmstrom Air Force Base, all of which bring minority youth to the county who are not counted within the county census. To achieve parity with NH White arrests in 2012, Cascade County would have had to have 213 fewer arrests of NH minority youth. Hill County rose steeply from 2.92 in 2005 to 4.94 in 2007 and then steadily declined to the 1.88 in 2012. To achieve parity with NH White youth arrests, Hill County would have had to have 41 fewer minority youth arrests in 2012. Missoula County is sporadic. There was no statistically significant DMC in 2005, 2006, 2011, and 2012. The highest RRI rate was 1.49 in 2005, and the current rate is 1.26. To achieve parity with NH White youth arrests in 2012, Missoula County would have had to have 23 fewer minority youth arrests. Yellowstone
0.00
1.00
2.00
3.00
4.00
5.00
6.00
2005 2006 2007 2008 2009 2010 2011 2012
RRI V
alue
Statistically Significant RRI Trends at Arrest for All Minority Youth
Cascade All MinoritiesArrested
Hill All MinoritiesArrested
*Hill All MinoritiesArrested
Missoula All MinoritiesArrested
Statewide All MinoritiesArrested
Yellowstone AllMinorities Arrested

State of Montana 2013 Title II Formula Grant
Page 14 of 33
County shows a general downward trend in DMC at the point of arrest. The RRI was 1.82 in 2005 and rose to a high of 2.19 in 2009; since then it has steadily declined and in 2012 was 1.45. To achieve parity with NH White youth arrests, Yellowstone County would have had to have 38 fewer minority youth arrests in 2012. Montana shows a decline from 1.44 in 2005 to 1.26 in 2012. To achieve parity with NH White youth arrests in 2012, Montana would have had to have 231 fewer minority youth arrests.
Statistically significant RRI trend for NH AI/AN youth at arrest
County Race/Ethnicity Juvenile System Point of Contact 2005 2006 2007 2008 2009 2010 2011 2012
Cascade American Indian Arrested 4.94 3.17 3.46 5.66 7.32 5.79 5.17 6.26 Hill American Indian Arrested 2.66 3.85 5.28 4.41 2.39 2.02 2.23 2.09
Missoula American Indian Arrested 2.55 1.82 1.57 1.57 1.88 1.67 2.03 1.75 Statewide American Indian Arrested 1.56 1.62 1.73 1.53 1.66 1.51 1.61 1.51 Yellowstone American Indian Arrested 2.59 3.32 3.25 3.68 3.71 2.54 2.46
Cascade County has been erratic, with a high of 7.32 in 2009 and a low of 3.17 in 2006, jumping back of up 6.26 in 2012. Cascade County is a regional service center for three reservations and Malmstrom Air Force Base, all of which bring minority youth to the county who are not counted within the county census. To achieve parity with NH White arrests in 2012, Cascade County would have had to have 192 fewer arrests of NH AI/AN youth. Hill County increased from 2.66 in 2005 to a peak of 5.28 in 2007 and then dropped to 2.09 in 2012. To achieve parity with NH White arrests in 2012, Hill County would have had to have 23 fewer arrests of NH AI/AN youth. Missoula County has been erratic, with a high of 2.55 in 2005, a low of 1.57 in 2007 and 2008, and 1.75 in 2012. To achieve parity with NH White arrests in 2012, Missoula County would
0.00
1.00
2.00
3.00
4.00
5.00
6.00
7.00
8.00
2005 2006 2007 2008 2009 2010 2011 2012
RRI V
alues
Statistically Significant RRI Trends for American Indian/Alaskan Native Youth at Arrest
Cascade AmericanIndian Arrested
Hill American IndianArrested
Missoula AmericanIndian Arrested
Statewide AmericanIndian Arrested
Yellowstone AmericanIndian Arrested

State of Montana 2013 Title II Formula Grant
Page 15 of 33
have had to have 23 fewer arrests of NH AI/AN youth. Yellowstone County started at 2.59 in 2006 and gradually rose to 3.71 in 2010, declining to 2.46 in 2012. To achieve parity with NH White arrests in 2012, Yellowstone County would have had to have 43 fewer arrests of NH AI/AN youth. Montana’s trend has been relatively flat, with a low of 1.51 in 2010 and 2012 and a high of 1.73 in 2007. To achieve parity with NH White arrests in 2012, Montana would have had to have 258 fewer arrests of NH AI/AN youth.
Statistically significant RRI trend for NH Black youth at arrest
County Race/Ethnicity Juvenile System Point of Contact 2005 2006 2007 2008 2009 2010 2011 2012
Cascade Black Arrested 1.49 1.67 1.55 2.83
Hill Black Arrested
Missoula Black Arrested 2.96 3.10
Statewide Black Arrested 2.10 1.93
Yellowstone Black Arrested 1.93 3.04 1.96 2.15 0.57 2.66 1.65
Cascade County has been too volatile to consider DMC as a trend. Cascade County is a regional service center for 3 reservations and home to Malmstrom Air Force base which bring minority youth to the county who are not counted within the county census population. To achieve parity with NH White youth arrests in 2012, Cascade County would have had to have 27 fewer NH Black youth arrests. In Hill County the NH Black youth population does not meet the 1 percent rule. In 2011 Missoula County started at 2.96 times the arrest rate of NH White youth and increased to 3.1 in 2012. When compared with all reporting counties, Missoula was in the 25th
0
0.5
1
1.5
2
2.5
3
3.5
20052006200720082009201020112012
RRI
Values
Statistically Significant RRI Trendsfor Black Youth at Arrest
Cascade Black Arrested
Hill Black Arrested
Missoula Black Arrested
Statewide BlackArrested
Yellowstone BlackArrested

State of Montana 2013 Title II Formula Grant
Page 16 of 33
percentile for NH Black youth arrests. To achieve parity with NH White youth arrests in 2012, Missoula County would have had to have 20 fewer NH Black youth arrests. Yellowstone County started in 2006 at 1.93 and dropped to 0.57 in 2010, jumping to 2.66 in 2011 and dropping to 1.65 in 2012. Yellowstone County ranked1.1 points below the 25th percentile for NH Black youth arrests when compared to other reporting counties. To achieve parity with NH White youth arrests in 2012, Yellowstone County would have had to have 6 fewer NH Black youth arrests. In 2011 Montana arrested NH Black youth at 2.1 times the rate that NH White youth were arrested; the rate declined to 1.93 in 2012. To achieve parity with NH White youth arrests in 2012, Montana would have had to have 64 fewer NH Black youth arrests.
Statistically significant RRI trend for Hispanic youth of any race at arrest
County Race/Ethnicity Juvenile System Point of Contact 2005 2006 2007 2008 2009 2010 2011 2012
Cascade Hispanic Arrested 0.50 0.52
Hill Hispanic Arrested
Missoula Hispanic Arrested 0.24 0.28
Statewide Hispanic Arrested 0.69 0.54 0.69 0.74 0.84 0.70
Yellowstone Hispanic Arrested 1.37 1.43 `
The statistically significant RRI trends for Hispanic youth of any race (YOAR) at the point of arrest is nonexistent in Cascade County, Hill County, Missoula County, and Yellowstone County. Statewide, Montana has been erratic and shows fewer Hispanic youth arrests than NH White youth arrests. The highest rate was .84 in 2009; the lowest rate was .54 in 2006. The most recent statistically significant rate was .70 in 2010. There was no statistically significant DMC in 2011 and 2012.
0
0.2
0.4
0.6
0.8
1
1.2
1.4
1.6
2005 2006 2007 2008 2009 2010 2011 2012
RRI V
alue
Statistically Significant RRI Trends for Hispanic Youth of Any Race at Arrest
Yellowstone HispanicArrested
Missoula HispanicArrested
Statewide HispanicArrested

State of Montana 2013 Title II Formula Grant
Page 17 of 33
Statistically significant RRI trend for all minority youth of any race at diversion
County Race/Ethnicity Juvenile System Point of Contact 2005 2006 2007 2008 2009 2010 2011 2012
Cascade All Minorities Diverted 0.91 0.86 0.95 0.82 0.86 0.92
Hill All Minorities Diverted 0.84 0.75
Missoula All Minorities Diverted 0.72 0.71 0.79
Statewide All Minorities Diverted 0.95 0.91 0.85 0.84 0.89 0.88 0.93 Yellowstone All Minorities Diverted 0.86 0.81 0.73 0.77 0.81 0.75 0.85
Cascade County increased from a low of .82 in 2008 to no statistically significant DMC in 2012. DMC at the point of diversion in Hill County is virtually nonexistent. To achieve parity with NH White youth diverted in 2012, Hill County would have had to have diverted 7 fewer minority youth cases. DMC at the point of diversion is virtually nonexistent in Missoula County. Yellowstone County has been erratic; between 2006 and 2012 Yellowstone County reduced the rate of diverting all minority youth from .86 to .85. To achieve parity with NH White youth diverted in 2012, Yellowstone County would have had to have diverted 13 more minority youth cases. Like Yellowstone County, Montana has been erratic. Overall, the statistically significant rate of diversion of all minority youth declined from .95 in 2006 to .93 in 2012. To achieve parity with NH White youth diverted in 2012, Montana would have had to have diverted 55 more minority youth cases.
0.00
0.10
0.20
0.30
0.40
0.50
0.60
0.70
0.80
0.90
1.00
2005 2006 2007 2008 2009 2010 2011 2012
RRI V
alues
Statistically Significant RRI Trends for All Minority Youth at Diversion
Cascade All MinoritiesDiverted
Hill All MinoritiesDiverted
Missoula All MinoritiesDiverted
Statewide All MinoritiesDiverted
Yellowstone AllMinorities Diverted

State of Montana 2013 Title II Formula Grant
Page 18 of 33
Statistically significant RRI trend for AI/AN youth at diversion
County Race/Ethnicity Juvenile System
POC 2005 2006 2007 2008 2009 2010 2011 2012
Cascade American Indian Diverted 0.89 0.85 0.91 0.79 0.85
Hill American Indian Diverted 0.83 0.70
Missoula American Indian Diverted 0.82 0.63 0.62 0.80 0.73
Statewide American Indian Diverted 0.95 0.94 0.90 0.87 0.80 0.89 0.88 0.92
Yellowstone American Indian Diverted 0.88 0.78 0.78 0.67 0.78 0.70 0.79
Cascade County generally increased DMC for AI/AN youth at the point of diversion from .89 to no statistically significant DMC from 2010 through 2012. DMC for AI/AN youth at the point of diversion is virtually nonexistent in Hill County. Missoula County increased diversion for NH AI/AN youth from .82 in 2005 to no statistically significant DMC in 2012. Generally speaking, Yellowstone County decreased diversion for NH AI/AN youth cases; DMC was not statistically significant in 2005, and in 2012 DMC at diversion was .79. To achieve parity with NH White youth cases in 2012, Yellowstone County would have had to divert 11 more NH AI/AN youth cases. Montana generally decreased diversion for NH AI/AN youth from .95 to .92 in 2012. To achieve parity with NH White youth cases in 2011, Montana would have had to divert 46 more NH AI/AN youth cases.
0.00
0.10
0.20
0.30
0.40
0.50
0.60
0.70
0.80
0.90
1.00
2005 2006 2007 2008 2009 2010 2011 2012
RRI V
alues
Statistically Significant RRI Trends for American Indian/Alaskan Native Youth at Diversion
Cascade AmericanIndian Diverted
Hill American IndianDiverted
Missoula AmericanIndian Diverted
Statewide AmericanIndian Diverted
Yellowstone AmericanIndian Diverted

State of Montana 2013 Title II Formula Grant
Page 19 of 33
Statistically significant RRI trend for NH Black youth at diversion
County Race/Ethnicity Juvenile System POC 2005 2006 2007 2008 2009 2010 2011 2012 Cascade Black Diverted 0.78 Hill Black Diverted
Missoula Black Diverted Statewide Black Diverted Yellowstone Black Diverted 0.66 0.61 0.76
Statistically significant RRI trends for NH Black youth at diversion does not exist in Cascade County, Hill County, Missoula County, Yellowstone County, or Montana. Hill County met the 1 percent rule for the first time in 2012.
State of Montana 2013 Title II Formula Grant
Page 20 of 33
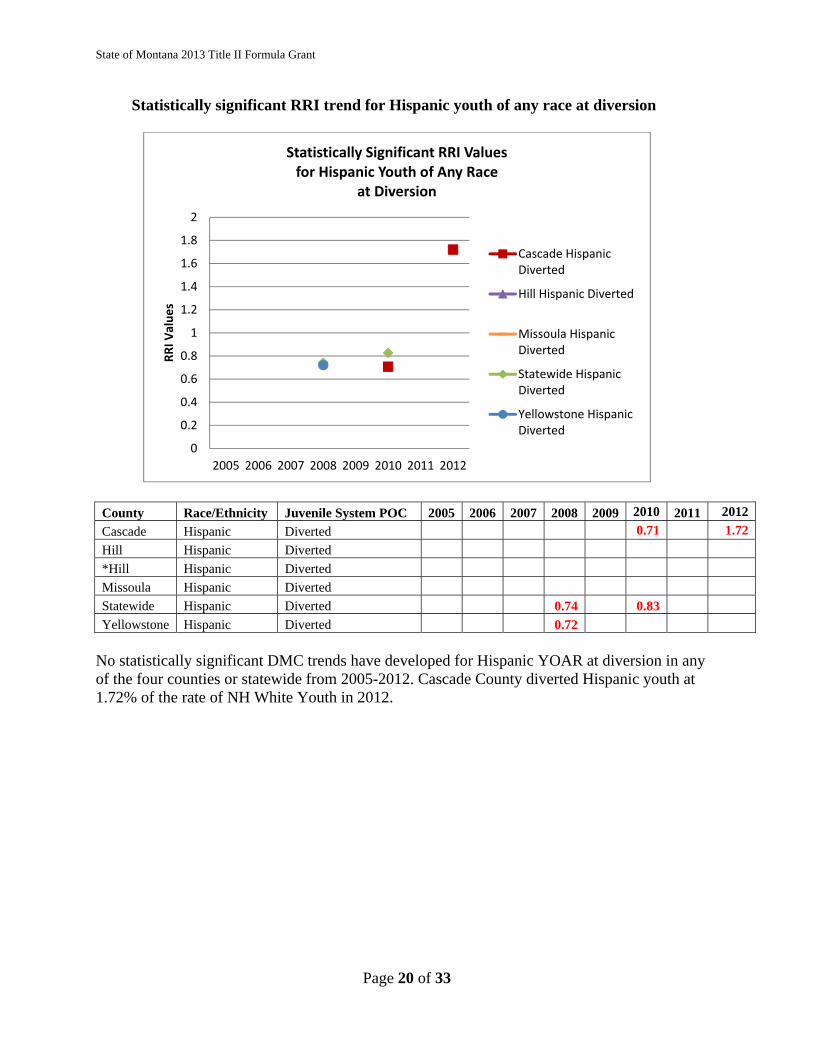
Statistically significant RRI trend for Hispanic youth of any race at diversion
County Race/Ethnicity Juvenile System POC 2005 2006 2007 2008 2009 2010 2011 2012
Cascade Hispanic Diverted 0.71 1.72
Hill Hispanic Diverted
*Hill Hispanic Diverted
Missoula Hispanic Diverted
Statewide Hispanic Diverted 0.74 0.83
Yellowstone Hispanic Diverted 0.72
No statistically significant DMC trends have developed for Hispanic YOAR at diversion in any of the four counties or statewide from 2005-2012. Cascade County diverted Hispanic youth at 1.72% of the rate of NH White Youth in 2012.
0
0.2
0.4
0.6
0.8
1
1.2
1.4
1.6
1.8
2
2005 2006 2007 2008 2009 2010 2011 2012
RRI V
alues
Statistically Significant RRI Values for Hispanic Youth of Any Race
at Diversion
Cascade HispanicDiverted
Hill Hispanic Diverted
Missoula HispanicDiverted
Statewide HispanicDiverted
Yellowstone HispanicDiverted

State of Montana 2013 Title II Formula Grant
Page 21 of 33
Statistically significant RRI trend for all minority youth at secure detention
County Race/Ethnicity Juvenile System POC 2005 2006 2007 2008 2009 2010 2011 2012
Cascade All Minorities Securely Detained 1.64 1.35 2.09 1.40 1.29
Hill All Minorities Securely Detained 3.19 0.58 Missoula All Minorities Securely Detained 1.95 3.09 4.29 4.22 1.33 Statewide All Minorities Securely Detained 1.38 1.89 1.86 1.96 1.73 1.37 1.95 1.73
Yellowstone All Minorities Securely Detained 1.52 2.6 2.11 2.07 1.56 1.66 1.71 1.92 Cascade County’s RRI trend for minority youth at detention has been erratic, fluctuating from 2.09 in 2008 to no statistically significant DMC in 2005, 2009, and 2010. In 2012 all minority youth were being securely detained at a rate of 1.29 of NH White youth. To achieve parity in 2012, Cascade County would have had to detain 27 fewer minority cases. Hill County never established a trend of statistically significant RRIs for all minority youth at detention. Like Cascade County, Missoula County has been erratic. In 2009 minority youth were detained at a rate of 4.29 of NH White youth, and in 2005, 2007, and 2011 there was no statistically significant DMC. To achieve parity with NH White youth in 2012, Missoula County would have had to detain 12 fewer minority youth cases. Yellowstone County had an RRI of 1.52 in 2205; it peaked in 2006 at 2.6 and declined to 1.56 in 2009, rising to 1.92 in 2012. To achieve parity with NH White youth in 2012, Yellowstone County would have had to detain 41 fewer minority youth cases.
0.00
0.50
1.00
1.50
2.00
2.50
3.00
3.50
4.00
4.50
2005 2006 2007 2008 2009 2010 2011 2012
RRI V
alues
Statistically Significant RRI Trends at Secure Detention for All Minority Youth
Cascade All MinoritiesSecurely Detained
Hill All MinoritiesSecurely Detained
Missoula All MinoritiesSecurely Detained
Statewide All MinoritiesSecurely Detained
Yellowstone AllMinorities SecurelyDetained
State of Montana 2013 Title II Formula Grant
Page 22 of 33
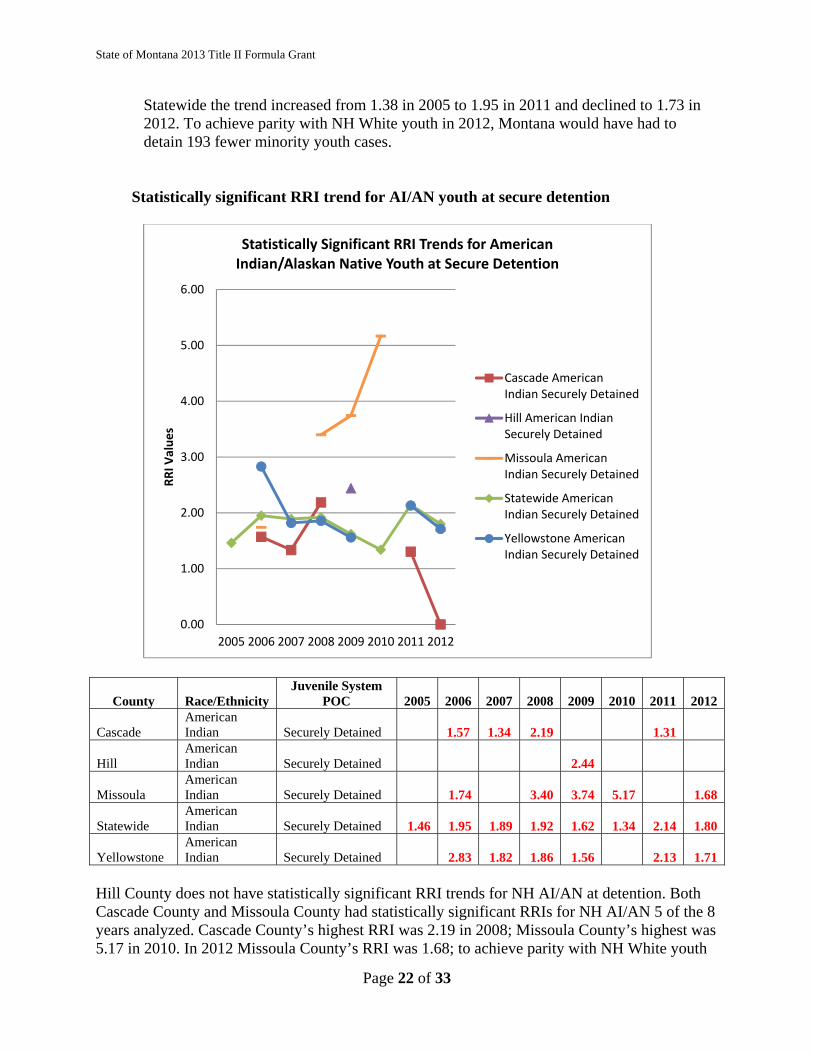
Statewide the trend increased from 1.38 in 2005 to 1.95 in 2011 and declined to 1.73 in 2012. To achieve parity with NH White youth in 2012, Montana would have had to detain 193 fewer minority youth cases.
Statistically significant RRI trend for AI/AN youth at secure detention
County Race/Ethnicity Juvenile System
POC 2005 2006 2007 2008 2009 2010 2011 2012
Cascade American Indian Securely Detained 1.57 1.34 2.19 1.31
Hill American Indian Securely Detained 2.44
Missoula American Indian Securely Detained 1.74 3.40 3.74 5.17 1.68
Statewide American Indian Securely Detained 1.46 1.95 1.89 1.92 1.62 1.34 2.14 1.80
Yellowstone American Indian Securely Detained 2.83 1.82 1.86 1.56 2.13 1.71
Hill County does not have statistically significant RRI trends for NH AI/AN at detention. Both Cascade County and Missoula County had statistically significant RRIs for NH AI/AN 5 of the 8 years analyzed. Cascade County’s highest RRI was 2.19 in 2008; Missoula County’s highest was 5.17 in 2010. In 2012 Missoula County’s RRI was 1.68; to achieve parity with NH White youth
0.00
1.00
2.00
3.00
4.00
5.00
6.00
2005 2006 2007 2008 2009 2010 2011 2012
RRI V
alues
Statistically Significant RRI Trends for American Indian/Alaskan Native Youth at Secure Detention
Cascade AmericanIndian Securely Detained
Hill American IndianSecurely Detained
Missoula AmericanIndian Securely Detained
Statewide AmericanIndian Securely Detained
Yellowstone AmericanIndian Securely Detained

State of Montana 2013 Title II Formula Grant
Page 23 of 33
detentions, Missoula County would have had to detain 13 fewer NH AI/AN youth cases. Yellowstone County had statistically significant RRIs for NH AI/AN 6 of the 8 years analyzed. The highest RRI was 2.83 in 2006. In 2012 Yellowstone County detained NH AI/AN youth at 1.71 times the rate of NH White youth. To achieve parity with NH White youth detentions, Yellowstone County would have had to detain 18 fewer NH AI/AN youth in 2012.
Statistically significant RRI trend for all minority youth at petitions filed
County Race/
Ethnicity Juvenile System
POC 2005 2006 2007 2008 2009 2010 2011 2012
Cascade All Minorities
Petitions (Charges) Filed 1.62 2.18 1.74 1.45
Hill All Minorities
Petitions (Charges) Filed 2.46
Missoula All Minorities
Petitions (Charges) Filed 1.66 1.78 1.68 1.44 1.48
Statewide All Minorities
Petitions (Charges) Filed 1.21 1.31 1.54 1.55 1.33
Yellowstone All Minorities
Petitions (Charges) Filed 1.65 1.8 2.07 1.53 1.32 2.14
The statistically significant RRI trend for all minority youth at petitions filed in Cascade County has been intermittent and erratic, peaking at 2.18 of NH White youth in 2008 and dropping to no statistically significant DMC in 2011 and 2012. DMC is nonexistent in Hill County for all
0.00
0.50
1.00
1.50
2.00
2.50
3.00
2005 2006 2007 2008 2009 2010 2011 2012
RRI V
alues
Statistically Significant RRI Trends for All Minority Youth at Petitions (Charges) Filed
Cascade All MinoritiesPetitions (Charges) Filed
Hill All MinoritiesPetitions (Charges) Filed
Missoula All MinoritiesPetitions (Charges) Filed
Statewide All MinoritiesPetitions (Charges) Filed
Yellowstone AllMinorities Petitions(Charges) Filed
Cascade AmericanIndian Petitions(Charges) Filed

State of Montana 2013 Title II Formula Grant
Page 24 of 33
minority youth at petitions filed. Missoula County has had sporadic statistically significant RRIs for all minority youth at petitions filed. The highest RRI was 1.78 in 2006; no statistically significant DMC was identified in 2008-2010. In 2012 Missoula County filed petitions against minority youth at a rate of 1.48 times the rate of NH White youth. To achieve parity with NH White youth in 2012, Missoula County would have had to file 4 fewer minority youth petitions. Yellowstone County’s RRI for all minority youth at petitions filed steadily increased between 2006 and 2011, peaking at 2.14 in 2011 followed by no statistically significant DMC in 2012. Montana filed petitions against minority youth at 1.21 times the rate of NH White youth beginning in 2006 and peaking in 2009 at 1.55. No statistically significant DMC was identified at petitions filed in 2012.
Statistically significant RRI trend for AI/AN youth at petitions filed
0.00
0.50
1.00
1.50
2.00
2.50
3.00
2005 2006 2007 2008 2009 2010 2011 2012
RRI V
alues
Statistically Significant RRI Trends for American Indian/Alaskan Native Youth at Petitions (Charges) Filed
Cascade AmericanIndian Petitions(Charges) Filed
Hill American IndianPetitions (Charges) Filed
Missoula AmericanIndian Petitions(Charges) Filed
Statewide AmericanIndian Petitions(Charges) Filed
Yellowstone AmericanIndian Petitions(Charges) Filed

State of Montana 2013 Title II Formula Grant
Page 25 of 33
County Race/Ethnicity Juvenile System POC
2005 2006 2007 2008 2009 2010 2011 2012
Cascade American Indian
Petitions (Charges) Filed 1.47 1.78 2.31 1.65
Hill American Indian
Petitions (Charges) Filed 2.69
Missoula American Indian
Petitions (Charges) Filed 1.94 1.84 1.99
Statewide American Indian
Petitions (Charges) Filed 1.22 1.35 1.39 1.69 1.31
Yellowstone American Indian
Petitions (Charges) Filed 1.40 1.87 1.93 1.87 1.42 2.24
Cascade County identified DMC for NH AI/AN youth at petitions filed 4 of the 8 years, peaking in 2008 at 2.31 and dropping to 1.65 in 2009; no statistically significant DMC was identified in 2010 through 2012. DMC for NH AI/AN youth at petitions filed is nonexistent in Hill County. Missoula County had statistically significant RRIs at petitions filed for NH AI/AN youth from 2005 through 2005; the highest RRI was 1.99 in 2007. In 2006 Yellowstone County at an RRI at petitions filed for NH AI/AN youth at 1.4 in 2006; the RRI rose to 2.24 in 2011 and dropped to no statistically significant RRI in 2012. Montana had no statistically significant RRI in 2005; the RRI steadily increased each year to 1.69 in 2009. In 2010 and 2012 Montana once again had no statistically significant RRI. Neither the four counties addressing DMC nor the State of Montana have established statistically significant RRI trends for any point of contact beyond petitions filed. It is likely that the numbers are too small beyond this point in the system to be statistically reliable.
Data discussion using the Relative Rate Index Tracking Sheet in Appendix I to interpret and analyze the values that should drive decision-making for each site 1. The top five instances of DMC at point of contact and minority groups to
address the SMV analysis are the following: a. Cascade County 1. Arrest: NH AI/AN 2. Arrest: NH Black 3. Arrest: All Minorities 4. Secure detention: Hispanic 5. Secure detention: All minorities b. Hill County 1. Arrest: NH AI/AN 2. Arrest: All Minorities c. Missoula County 1. Arrest: NH Black 2. Arrest: NH AI/AN

State of Montana 2013 Title II Formula Grant
Page 26 of 33
3. Arrest: All minorities 4. Secure detention: NH AI/AN d. Yellowstone County 1. Arrest: NH AI/AN 2. Arrest: All minorities 3. Secure detention: NH AI/AN 4. Secure detention: All minorities e. Montana 1. Arrest: NH AI/AN 2. Arrest: All minorities 3. Cases diverted: NH AI/AN 4. Secure detention: NH AI/AN 5. Secure detention: All minorities
Phase II: Assessment/Diagnosis Funding has always been a barrier to assessment for Montana. The Statewide Planning Agency (SPA) overcame that barrier in 2011 by collaborating with the State of Montana Statistical Analysis Unit (SAC) to use a SAC grant to obtain a quantitative and qualitative assessment of DMC in the juvenile justice system. The assessment was initiated in 2011 and completed in 2012. The assessment was presented to the SAG at the September 2012 meeting; next it was presented to juvenile justice professionals at the SPA’s Annual Crime Prevention Conference in October 2012. The assessment was amended in December 2012 to include the results of the survey of non-JDAI sites and then posted to the following website: http://www.mbcc.mt.gov/Data/SAC/RAI/DMCAssessRep.pdf. In December 2012 the assessment was also submitted to the Annie E. Casey Foundation (AECF) for inclusion on their JDAI Help Desk and to OJJDP for inclusion on their DMC Virtual Resource Center. Additionally, the SPA collaborated with the University of Montana to evaluate the detention risk assessment instrument (RAI) implemented by the four JDAI sites in Montana in 2009. This project was funded with Juvenile Accountability Block Grant (JABG) and AECF JDAI funds. This assessment was also presented to the SAG at the September 2012 meeting and to juvenile justice professionals at the Annual Crime Prevention Conference one month later. The RAI Validation and Assessment Study is posted to the State of Montana’s DMC website: http://www.mbcc.mt.gov/Data/SAC/RAI/RAI%20Technical%20Report%20_Final%20Version_.pdf. The RAI Validation and Assessment Study

State of Montana 2013 Title II Formula Grant
Page 27 of 33
was submitted to the AECF for inclusion on their JDAI Help Desk and to OJJDP for inclusion on their DMC Virtual Resource Center. The DMC assessment may be read in its entirety at the above-referenced link. In summary, the study found the following:
There is very little difference between minority and White juveniles in terms of the types of offenses and juvenile justice system responses to them. Differences between minority and White juveniles were more common across the decision points when social factors pertaining to individual and family influences are accounted for. There are a number of often overlapping mechanisms that contribute to DMC, including cultural, social, and economic dimensions; as a result, effective responses and interventions will need to be based on a multidimensional approach that will include cooperation between the juvenile justice system and other social institutions that work with juveniles. Future DMC work in Montana needs to include an investigation of methods that allow more accurate counts of juveniles at the county level.
Phase III: Intervention Attachment 4 includes the DMC logic model and reports Montana’s progress on the 3-Year DMC Intervention Plan in 2012. SPA staff engaged in 5 educational activities to educate potential funding partners to assess and address DMC in Montana. Those activities included developing the Governor’s Report on State/Tribal Activities; co-presenting on DMC and JDAI with AECF at the Statewide Prevention Conference; obtaining a re-score of the Detention Risk Assessment Instrument (DRAI) and developing a curriculum for its use; working with a software company to automate DRAI and detention data; participating in a statewide training of state agencies regarding working with Tribes. The juvenile justice planner continues to collaborate with the Department of Public Health and Human Services (DPHHS), the Office of Court Administration (OCA) and the Department of Corrections (DOC) to plan and educate the legislature on the need for a Systems of Care to provide increased access to mental health and substance abuse resources for juveniles. As a result, Montana has seen the statewide implementation of the Vroon Van Den Berg model of high fidelity wrap around; CANS, a mental health assessment tools was selected; a children’s mental health data system was designed; and four pieces of children’s mental health legislation were introduced. Five alternative sources of existing data/research were identified to assess/monitor the mechanisms contributing to DMC: AECF’s Kids

State of Montana 2013 Title II Formula Grant
Page 28 of 33
Count; Montana’s Prevention Needs Assessment; Montana’s Youth Risk Behavior Survey; Cradle to Prison Pipeline data for Montana; and a draft of the University of Montana’s national Native American Trauma Center’s Adverse Childhood Experiences (ACE) Report. Additionally, the SAG’s annual Report to the Governor provided an update on DMC. The SAG continued to require that all non-tribal programs submit or update an RRI and include a plan to assess mechanisms that contribute to DMC in order to receive Title II funding. The DMC Committee reviewed assessment data to identify intervention priorities and brought them forward to the YJC as seconded motions. The SAG continued to prioritize the funding of at least three sites with identified DMC; two additional sites were supported with a combination of state general fund and AECF funds. SPA staff will work with the University of Montana to identify funding for the development of DMC training curriculums for identified stakeholders and a plan for delivering the curriculum. SPA staff has provided three technical assistance events to tribes and the juvenile justice planner has provided ongoing technical assistance to one tribal JDAI site. The SAG continued to fund tribal promising or best practices prevention and intervention programs in excess of the required Native American pass through allocation. In 2012 the SAG funded two tribal grants totaling $47,720.
Phase IV: Evaluation The SAG required all funded programs report performance measures in OJJDP’s Data Collection and Training and Technical Assistance (DTAT) tool. Two RFPs, the Title II and the JABG, were written and required reporting of performance measures to DCTAT. The SAG required all non-tribal continuation applications to prepare and report on an updated RRI to monitor DMC in their community or county. Fifteen of the nineteen objectives were met or exceeded; three objectives were changed in 2012; one objective was added for 2013 (See Attachment 4).
Performance Measures
The State of Montana will report on the following performance measures for Purpose Area 10; these performance measures will be reported to the SPA by the subgrantees.
Number of program youth served Number and percent of program youth who offend during the
reporting period (short term) Number and percent of program youth who offend during the
reporting period (long term) Number and percent of program youth who re-offend (short term)

State of Montana 2013 Title II Formula Grant
Page 29 of 33
Number and percent of program youth who re-offend (long term) Number of local agencies reporting improved data collection
systems (short term) Number of local agencies reporting improved data collection
systems (long term) Number of contributing factors determined from assessment
studies (short term) Number and percent of recommendations from assessment studies
implemented (long term) Phase V: Monitoring
The DMC committee and the juvenile justice planner met at least four times during 2012 to implement and monitor the DMC plan. The committee will monitor the overall effectiveness of the plan based on the RRI trends. Performance measures of the JDAI sites and other funded programs that address DMC are reported quarterly to the SPA.
DMC Reduction Plan See Attachment 4: DMC Compliance Plan Montana
f. Coordination of Child Abuse and Neglect and Delinquency Programs (1) Reducing Probation Officers’ Caseloads No change; see Montana’s 2012 application, Attachment 1, p. 94. (2) Sharing Public Child Welfare Records with Juvenile Courts
No change; see Montana’s 2012 application, Attachment 1, p. 94.
(3) Establishing Policies and Systems to Incorporate Child Protective Services Records into Juvenile Justice Records
No change; see Montana’s 2012 application, Attachment 1, pp. 94 - 95.
g. Disaster Preparedness Plan No change; see Montana’s 2012 application, Attachment 2012 Title II Montana Disaster Emergency Preparedness Plan.
h. Suicide Prevention The State of Montana ranked number one in the nation for deaths by suicide in 2009 (National Vital Statistics Reports, 2012), with 219 deaths and a rate of 22.5; the national rate the same year was 12.0. Karl Rosston, LCSW, is Montana’s Suicide Prevention Coordinator. His office is located within Montana’s Department of Public Health and Human Services. Montana has created a Strategic Suicide Prevention Plan; the plan may be found at this site: http://prevention.mt.gov/suicideprevention/StateSuicidePlan.pdf. Signs of Suicide kits have been provided to 150 schools around the state. Over 7,000 gunlocks with suicide prevention tags have been distributed to 16 counties and 7 tribal entities. Over 200 crisis team school staff have been trained. All Key Clubs in Montana have been trained to focus on suicide prevention. Over 7000 parent booklets have been

State of Montana 2013 Title II Formula Grant
Page 30 of 33
distributed to schools and to agencies working with families. Suicide prevention training has been provided to detention officers in juvenile and collocated facilities as well as juvenile parole officers. Anti-suicide blankets and clothing have been provided to all county jails and correctional facilities.
i. Collecting and Sharing Juvenile Justice Information No change; see Montana’s 2012 application, Attachment 1, pp. 95 - 96. j. Statement of the Problem/Program Narrative
No change; see Montana’s 2012 application, Attachment 1, pp. 97 - 104.
k. Budget. Purpose Area Fiscal Year Formula Grant
Funds ($) State/Local Funds ($)
Total Funds ($)
*02 2013 2014 2015
50,000 50,000 50,000
0 0 0
50,000 50,000 50,000
*06 2013 2014 2015
25,000 25,000 25,000
0 0 0
25,000 25,000 25,000
*09 2013 2014 2015
115,000 115,000 115,000
0 0 0
115,000 115,000 115,000
*10 2013 2014 2015
50,000 50,000 50,000
0 0 0
50,000 50,000 50,000
*11 2013 2014 2015
50,000 50,000 50,000
0 0 0
50,000 50,000 50,000
*22 2013 2014 2015
50,000 50,000 50,000
0 0 0
50,000 50,000 50,000
23 2013 2014 2015
40,000 40,000 40,000
40,000 40,000 40,000
80,000 80,000 80,000
31 2013 2014 2015
20,000 20,000 20,000
0 0 0
20,000 20,000 20,000
*Budget amounts are estimates; actual amounts will not be determined until funding determinations are made.

State of Montana 2013 Title II Formula Grant
Page 31 of 33
l. SMART MBCC is registered with OJJDP’s Socioeconomic Mapping and Resource Topography (SMART) system. We have queried the SMART system and generated quick reports. However, the SMART system does not provide the most recent data to validate the problem; instead MBCC relies data submitted to the Statistical Analysis Center (SAC) which is housed within our agency. The SAC was formed in 1991; it is the FBI’s point of contact for crime reporting in Montana. Local law enforcement agencies submit data using either summary data (UCR/MUCR) or electronic, incident-based data (NIBRS/MTIBRS). The Montana SAC has been accepting incident-based data since 1999, and in 2005 the SAC became certified to submit incident-based (NIBRS) data to the FBI. The SAC collects other datasets as well, including data from Montana VAWA/VOCA (Violence Against Women Act/Victims of Crime Act) subgrantees, Montana Supreme Court data for juvenile justice issues, and from the local juvenile detention facilities for juvenile detention reform oversight. The SAC also funds research and publications on criminal justice issues that affect the state. The SAC is affiliated with and receives professional support from the Justice Research and Statistics Association (JRSA), a national nonprofit organization that promotes collaboration and exchange of information among state SACs and acts as a liaison between state agencies and the U.S. Department of Justice. Following is a link to the Crime Data sites that MBCC makes available: http://www.mbcc.mt.gov/Data/crimedata/crimedata.asp.
m. SAG Membership - Updated Name Represents Full-Time
Government Youth Member Date of
Appointment Residence
Pam Carbonari, Chair
E March 2012 Kalispell
Tim Brurud C, D March 2012 Havre Erika Lindbloom F X January 2013 Lewistown Katie Champion F X March 2012 Bozeman Larry Dunham A, E March 2012 Condon Leah Heffelfinger
F X March 2012 East Helena
Hon. Pedro Hernandez
B X March 2012 Billings
Nick Korthals B, G, H X March 2012 Townsend Chaz McGurn F X March 2012 Helena Cindy McKenzie B, C X March 2012 Helena Elinor Nault B, C X March 2012 Rocky Boys Randy Shipman G, H March 2012 Dillon Laura Singley B X March 2012 Lewistown Adam Stern A March 2012 Livingston Roy Tanniehill B, G, H X March 2012 Helena

State of Montana 2013 Title II Formula Grant
Page 32 of 33
The SAG serves as the advisory board; the final decisions are the responsibility of the Montana Board of Crime Control. n. Formula Grants Program Staff
MBCC hired a new executive director in January 2012. Since that time the organizational chart has been restructured. The new organizational chart may be found in Attachment 5: MBCC Org Chart. The juvenile justice specialist and the juvenile justice planner are listed as program specialists beneath the Public Safety and Community Justice Bureau Chief. Following is a list of other programs administered through the MBCC:
VOCA VAWA EUDL Misdemeanor Probation – Domestic Violence JABG JAG SASP STOP Juvenile Detention Region General Fund Reimbursement Allocations Resident Substance Abuse Treatment
Staffing and Management Plan for MBCC
Title II Formula Grant: Federal $40,000 State Match $40,000 Provides funding for one 1.0 FTE, one 0.5 FTE, one 0.29 FTE, and the operating costs of the Public Safety and Community Justice Bureau.
State of Montana General Funds: Provides funding for the Juvenile Fiscal Analyst and operating costs for that office.
Juvenile Justice Specialist 1.0 FTE OJJDP Funds Julie Fischer Juvenile Justice Planner 0.5 FTE OJJDP Funds Cil Robinson Administrative Support 0.29 FTE OJJDP Funds Kristel Matchett Juvenile Fiscal Analyst 1.0 FTE State General Funds Stacy Purdom
Position Descriptions
The juvenile justice specialist provides 100% time overseeing JJDP block grants and coordinating the Youth Justice Advisory Council, or SAG. The juvenile justice planner provides 100% time overseeing compliance, DMC coordination, and providing support for subgrantees. Both positions provide technical assistance to local communities and oversight of subgrantees. The juvenile justice specialist serves as a liaison to the Coalition for Juvenile Justice.

State of Montana 2013 Title II Formula Grant
Page 33 of 33
The fiscal analyst is funded through State of Montana general funds. The fiscal analyst provides support services for the accounting services. The analyst also provides on-site fiscal audits. The administrative support staff assists with online applications, quarterly reports, and various administrative duties. The Public Safety and Community Justice Bureau manages Title II Formula Grant, JABG, VOCA, VAWA, SASP, STOP, JAG, RSAT, and Misdemeanor Probation funding streams.
o. Performance Measures Data Submission of performance measures data is not required for this application. MBCC will submit the required data into the DCTAT system for the purpose of generating OJJDP’s required reports in the Grant Management System (GMS). The SAG will award funding to subgrantees who have demonstrated success in carrying out the goals specified in the original subgrant application as outlined in the RFP. Quarterly reports are reviewed by staff; desk audits and site visits are conducted annually to ensure activities are being implemented to SAG and OJJDP standards. Title II RFPs contain a link to the OJJDP Model Programs Guide so that agencies are able to research OJJDP-approved programs. The OJJDP program area, performance measures, and evaluation process of each subgrantee program is required to be clearly outlined within each subgrant application. A link to OJJDP Formula Grant performance measures is also provided in the RFP for this purpose. Subgrantees submit quarterly reports to the MBCC online reporting system; additionally, subgrantees are required to submit DCTAT reports in a timely manner. Once the subgrantees have submitted their data, the juvenile justice specialist verifies the accuracy of the data and finalizes the report. The juvenile justice specialist is responsible for submitting Title II reports in GMS on behalf of the State of Montana.