Embed Size (px)
Citation preview

2012 Mat Su Valley Collision Avoidance Survey

2012 Mat Su Valley Collision Avoidance Survey
1
Table of Contents
Table of Contents 1
INTRODUCTION 2
Measurement Objectives 3
Methodology and Notes 4
Key Findings 5
PILOT LOCATION 6
Activity in the Area 7
Pilot Location 8
Altitudes Flown 9
SAFETY IN THE AREA 10
Frequency of Unsafe Situations 11
Safety Factors 12
High-Traffic Areas 13
Safety from Proximity 15
Collision Avoidance Equipment 16
ATC Usage in VFR 17
VHF Radio Usage 18
GPS Usage 19
USER OPINIONS 20
Verbatim Responses 21
DEMOGRAPHICS 22
Hours Flown 23
Aircraft Type 24
Primary Purpose 25
Certificate Level 26
Age 27
2012 Mat Su Valley Collision Avoidance Survey
2
INTRODUCTION
2012 Mat Su Valley Collision Avoidance Survey
3
Measurement Objectives
• In an effort to inform an Alaska industry/government working group to
reduce aircraft collision risk, an e-mail survey was developed to learn
more about flight operations in the region. The goal of the survey is to
discover the methods currently used by pilots to avoid a mid-air collision,
and to measure the number of times pilots have felt unsafe in the Mat Su
Valley region.

2012 Mat Su Valley Collision Avoidance Survey
4
Methodology and Notes
• An e-mail survey was sent to a sample of 2,942 current AOPA members
residing in Alaska.
• Additionally, an open-access URL was provided to the AOPA Regional
Manager for word-of-mouth promotion within Alaska.
• In total, 619 surveys were started and 519 surveys were completed.
From the email distribution, 230 surveys were completed, resulting in a
7.82% response rate for that broadcast and a margin of error of ±6.37%
at the 95% confidence level.
Mat Su Valley Region:
2012 Mat Su Valley Collision Avoidance Survey
5
Key Findings
• Many pilots in the area have encountered what they interpret as an unsafe situation between (on average) 2-3 times in the past five years.
• Just less than approximately one-half of respondents felt this unsafe situation was due to another aircraft in close proximity.
• The highest rated cause for an unsafe situation was difficulty in communication, or the lack of communication between pilots.
o Confusing CTAF rules, pilots that do not announce position, lack of ATC within the study area all contribute to this feeling.
• Pilots desire more consistency in the usage of aircraft lighting in order to be able to see and avoid, and a simpler was to communicate.
• Generally speaking, survey respondents feel that it’s the fault of the other pilot not adhering to the regulations and customs in the study area that contribute to the problems, but they do acknowledge that the level of traffic and the patterns within the study area make piloting difficult at times.
2012 Mat Su Valley Collision Avoidance Survey
6
PILOT LOCATION

2012 Mat Su Valley Collision Avoidance Survey
7
Activity in the Area The large majority of respondents indicated that they have flown in the defined area within the past five year period.
Figure 1: Activity in the Defined Area
Have you flown within the defined study area in the past five years? Base: N = 502 Scale: Yes (1), No (2)
97% 3%
Yes No
2012 Mat Su Valley Collision Avoidance Survey
8
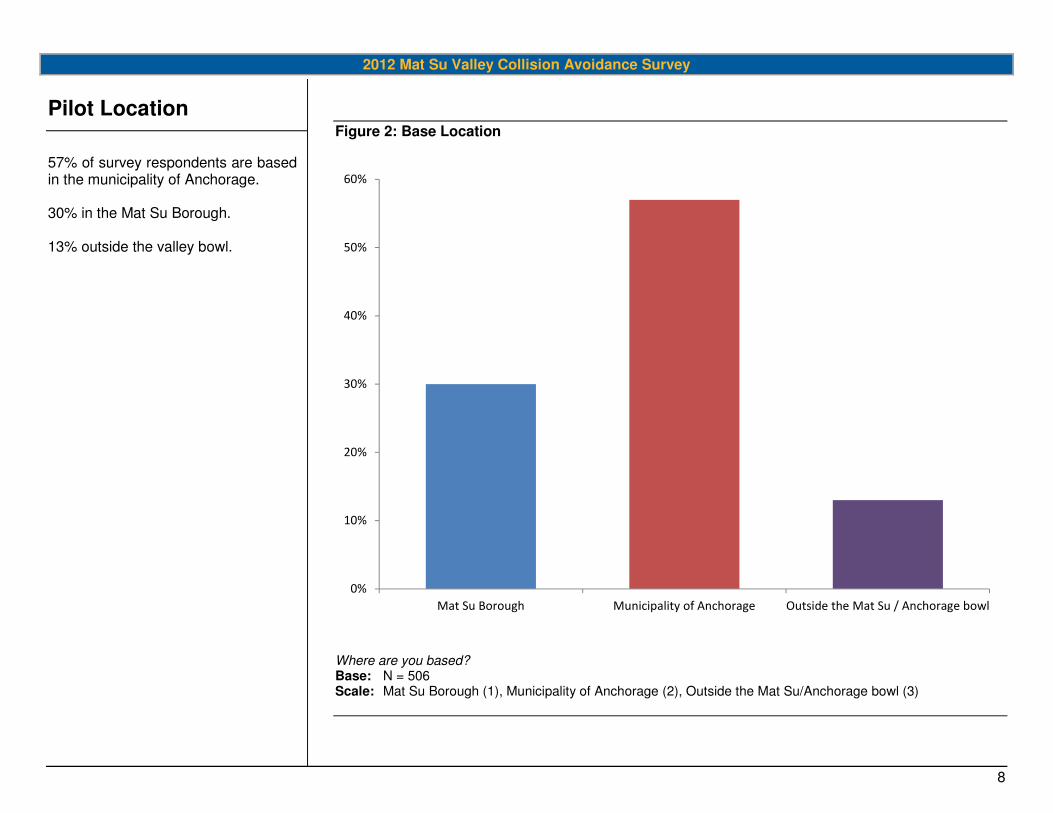
Pilot Location 57% of survey respondents are based in the municipality of Anchorage. 30% in the Mat Su Borough. 13% outside the valley bowl.
Figure 2: Base Location
Where are you based? Base: N = 506 Scale: Mat Su Borough (1), Municipality of Anchorage (2), Outside the Mat Su/Anchorage bowl (3)
0%
10%
20%
30%
40%
50%
60%
Mat Su Borough Municipality of Anchorage Outside the Mat Su / Anchorage bowl

2012 Mat Su Valley Collision Avoidance Survey
9
Altitudes Flown More than half the survey respondents fly within the valley at 1,001 – 2,000 ft. MSL. When flying through or overflying the valley however, the percentage flying at that altitude drops to 36%. Pilots flying through or over the valley tend to fly at higher altitudes, but still only 22% fly at altitudes greater than 3,000 ft. MSL.
Figure 3: Altitudes of Flight within the Valley
When flying within (departure and destination both in the valley) the Mat Su Valley, what altitude (weather permitting) do you typically use? Base: N = 496 Scale: Less than 500 ft. MSL (1), 500 – 1,000 ft. MSL (2), 1,001 – 2,000 ft. MSL (3), 2,001 – 3,000 ft. MSL (4), Greater than 3,000 ft. MSL (5)
Figure 4: Altitudes of Flight through the Valley
When flying through (either leaving the valley, or overflying) the Mat Su Valley, what altitude (weather permitting) do you typically use? Base: N = 492 Scale: Less than 500 ft. MSL (1), 500 – 1,000 ft. MSL (2), 1,001 – 2,000 ft. MSL (3), 2,001 – 3,000 ft. MSL (4), Greater than 3,000 ft. MSL (5)
0%
10%
20%
30%
40%
50%
60%
Less than 500 ft MSL 500 - 1,000 ft MSL 1,001 -2,000 ft MSL 2,001 - 3,000 ft MSL Greater than 3,000 ft
MSL
0%
10%
20%
30%
40%
50%
60%
Less than 500 ft MSL 500 - 1,000 ft MSL 1,001 -2,000 ft MSL 2,001 - 3,000 ft MSL Greater than 3,000 ft
MSL

2012 Mat Su Valley Collision Avoidance Survey
10
SAFETY IN THE AREA

2012 Mat Su Valley Collision Avoidance Survey
11
Frequency of Unsafe Situations Over 50% of respondents indicated that they have been in either one or two unsafe situations in the past five years. The median number of situations indicated is two, while the mean is 3.42.
Figure 5: Number of Unsafe Situations
Approximately how many unsafe situations have you encountered in the past five years? Base: N = 247 Scale: N/A
0
10
20
30
40
50
60
70
80
90
1 3 5 7 9 11 13 15 17 19 21 23 25

2012 Mat Su Valley Collision Avoidance Survey
12
Safety Factors The primary factor indicated by respondents that contributed to an unsafe situation was communication. 82% indicated this as a contributing factor. The second-most indicated factor was other (33%). In the other category, verbatim responses included factors including weather, congestion, lack of pilot focus, or the non-use of aircraft lighting.
Figure 6: Factors Contributing to Unsafe Situations
What factors contributed that that situation(s)? (Check all that apply) Base: N = 256 Scale: Air Traffic Control (1), Communications (including the lack of communication) (2), Deviation of an aircraft (3), Navigation (4), Other (5)
11%
82%
20%
10%
33%
Air Traffic Control Communications
(including the lack of
communication)
Deviation of an
aircraft
Navigation Other
0%
10%
20%
30%
40%
50%
60%
70%
80%
90%

2012 Mat Su Valley Collision Avoidance Survey
13
High-Traffic Areas The table to the right identifies the top five “high traffic areas” as indicated by our survey respondents. Respondents were asked to include any relevant comments on high traffic areas as well. 135 comments were tallied. Many indicated the desire for pilots to utilize aircraft lights and for appropriate radio communication. The desire for a common CTAF frequency was included in multiple comments as well.
Figure 7: Top 5 “High Traffic Areas” in the Mat Su Valley
Please identify the top FIVE “high traffic areas in the Mat Su Valley that in your experience pilots should be aware of (including airports, airstrips, lakes, landing areas). Base: N = 458 Scale: Alexander Lake (1), Beluga Lake (2), Big Lake (3), Big River Lakes (4), Birchwood (5), Confluence of the Yenta and Su (6), Figure Eight Lake (7), Fish Lakes (8), Flat Horn Lake (9), Judd Lake (10), Knik Glacier (11), Kustatan River (12), Meadow Lakes (13), Mouth of Alexander Creek (14), Mouth of Lake Creek (15), Mouth of the Deshka (16), Point MacKenzie (17), Red Shirt Lake (18), Skwentna (19), Talachulitna Mouth (20), Talkeetna (21), Trapper Lake (22), Wasilla (23), Willow (24), Wolf Lake (25), Yentna Station (26), Other (27), Other (28, Other (29). Locations labeled as “A” were added based on user supplied locations labeled as “other”.
2012 Mat Su Valley Collision Avoidance Survey
14
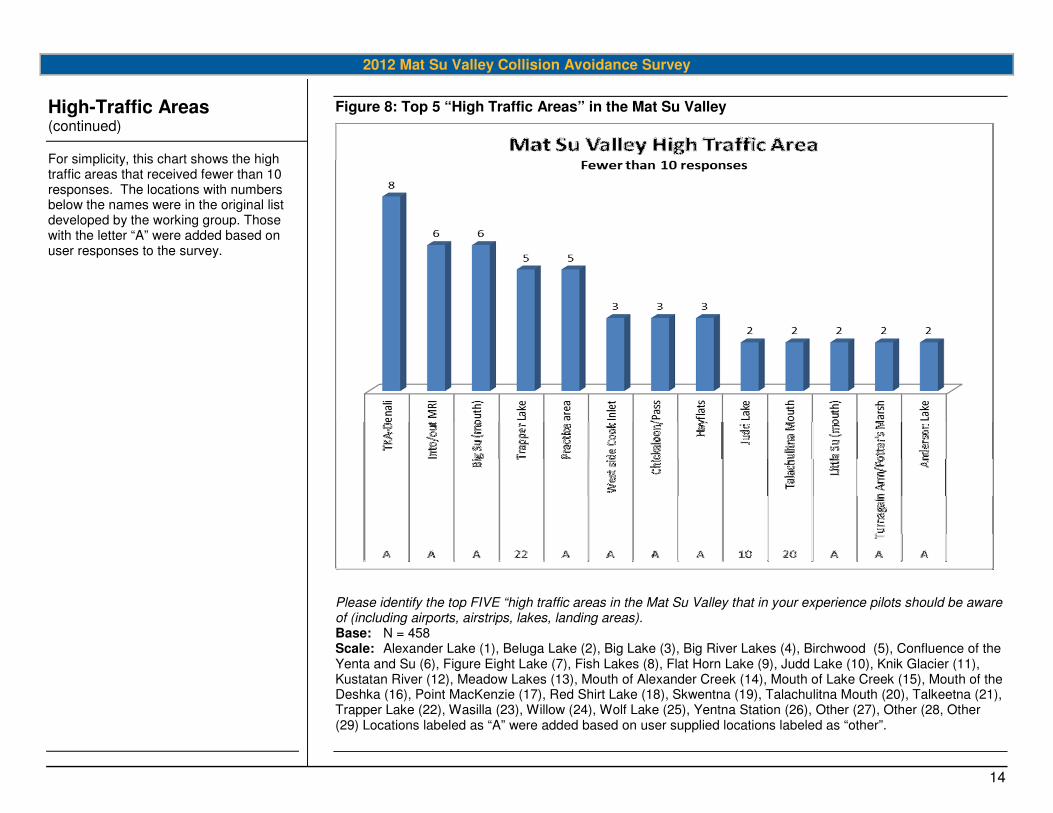
High-Traffic Areas (continued) For simplicity, this chart shows the high traffic areas that received fewer than 10 responses. The locations with numbers below the names were in the original list developed by the working group. Those with the letter “A” were added based on user responses to the survey.
Figure 8: Top 5 “High Traffic Areas” in the Mat Su Valley
Please identify the top FIVE “high traffic areas in the Mat Su Valley that in your experience pilots should be aware of (including airports, airstrips, lakes, landing areas). Base: N = 458 Scale: Alexander Lake (1), Beluga Lake (2), Big Lake (3), Big River Lakes (4), Birchwood (5), Confluence of the Yenta and Su (6), Figure Eight Lake (7), Fish Lakes (8), Flat Horn Lake (9), Judd Lake (10), Knik Glacier (11), Kustatan River (12), Meadow Lakes (13), Mouth of Alexander Creek (14), Mouth of Lake Creek (15), Mouth of the Deshka (16), Point MacKenzie (17), Red Shirt Lake (18), Skwentna (19), Talachulitna Mouth (20), Talkeetna (21), Trapper Lake (22), Wasilla (23), Willow (24), Wolf Lake (25), Yentna Station (26), Other (27), Other (28, Other (29) Locations labeled as “A” were added based on user supplied locations labeled as “other”.

2012 Mat Su Valley Collision Avoidance Survey
15
Safety from Proximity Respondents were split on their feeling of being unsafe due to the proximity of other aircraft. 53% responded that they had felt unsafe because of aircraft proximity, 47% indicated that they had not.
Figure 9: Feeling of Being Unsafe due to Aircraft Proximity
Do you feel you were ever in an unsafe situation due to the proximity of another aircraft in the Mat Su Valley within the last 5 years?? Base: N = 498 Scale: Yes (1), No (2)
53% 47%
Yes No

2012 Mat Su Valley Collision Avoidance Survey
16
Collision Avoidance Equipment In addition to visual scan, the majority of pilots also use the “Aircraft Landing Light” (75%), “Strobes” (81%), “Transponder” (70%), and “VHF Radio” (85%). In the “Other” category, the most common recurring responses included TCAS, PCAS, or Flight Following.
Figure 10: Additional Collision Avoidance Equipment
In addition to good visual scan techniques, what collision avoidance equipment do you use, if any? (Check all that apply) Base: N = 492 Scale: Aircraft landing light (1), Strobes (2), Pulse light (3), Transponder (4), ADS-B (5), VHF Radio (6), Other (7)
75%
81%
33%
70%
2%
85%
8%
0%
10%
20%
30%
40%
50%
60%
70%
80%
90%
Aircraft landing
light
Strobes Pulse light Transponder ADS-B VHF Radio Other

2012 Mat Su Valley Collision Avoidance Survey
17
ATC Usage in VFR Pilots utilizing ATC services under VRF rules are normally distributed between using them “Every flight” (12%), “Most flights” (22%), “Some flights” (28%), “Seldom” (20%), and “Never” (18%)
Figure 11: Use of ATC Services in VFR Conditions
When flying under VFR rules, do you use ATC Services (Traffic Advisories) when flying in the Mat Su Valley? Base: N = 494 Scale: Every flight (1), Most flights (2), Some flights (3), Seldom (4), Never (5)
12%
22%
28%
20%
18%
0%
5%
10%
15%
20%
25%
30%
Every flight Most flights Some flights Seldom Never

2012 Mat Su Valley Collision Avoidance Survey
18
VHF Radio Usage The large majority of respondents (96%) use VHF radio communication as a tool to maintain situational awareness.
Figure 12: VHF Radio Usage in the Mat Su Valley
Do you use a VHF communication radio as a tool to help maintain situational awareness? Base: N = 492 Scale: Yes (1), No (2)
96%4%
Yes No
2012 Mat Su Valley Collision Avoidance Survey
19
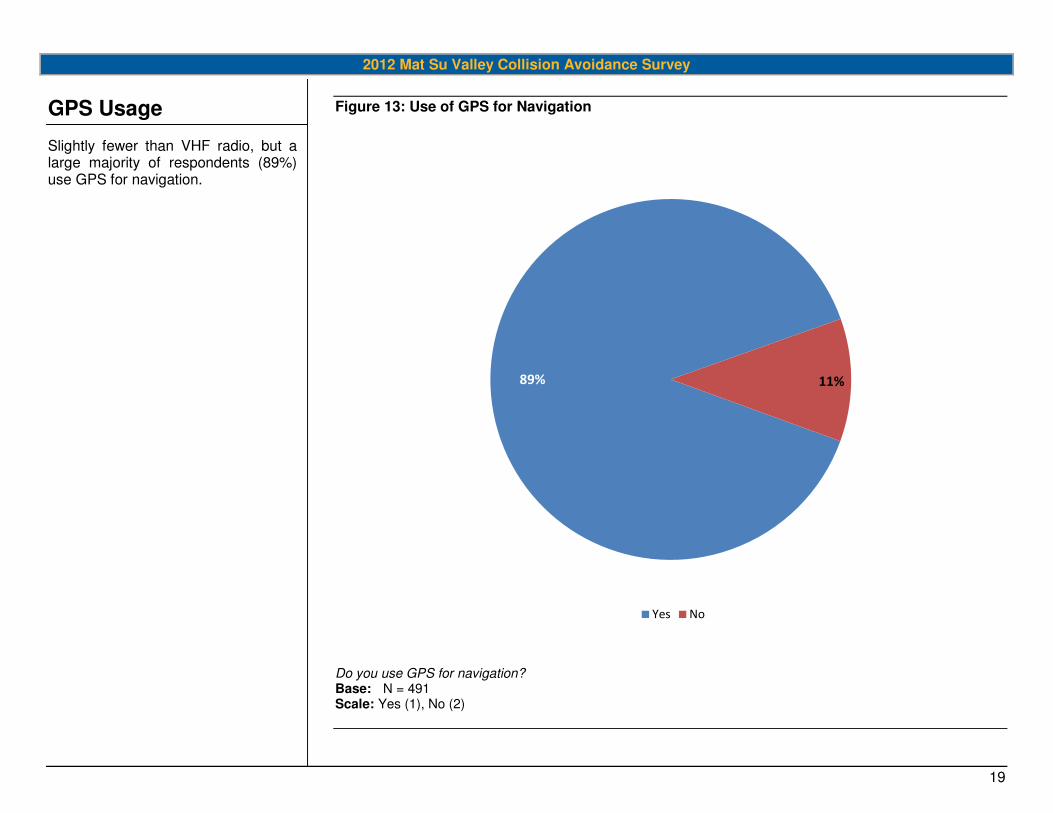
GPS Usage Slightly fewer than VHF radio, but a large majority of respondents (89%) use GPS for navigation.
Figure 13: Use of GPS for Navigation
Do you use GPS for navigation? Base: N = 491 Scale: Yes (1), No (2)
89% 11%
Yes No

2012 Mat Su Valley Collision Avoidance Survey
20
USER OPINIONS

2012 Mat Su Valley Collision Avoidance Survey
21
Verbatim Responses Three questions allowed survey respondents to comment. The responses were evaluated as a group, with the goal of extracting common themes. Nine themes were extracted, based on an initial inspection of the data, and are presented here
There were 256 comments analyzed from “open ended” three questions: Question 4. Any comments on "high traffic areas" you would like to share? Question 10. Any comments on unsafe situations you would like to share?, and Question 16. Any additional comments you would like to share?
All comments were grouped together for analysis. The themes identified initially are: Communications – 58 comments stated issues with radio communications, including a lack of communication.
Concerns regarding frequency were included in the frequency category. This high number of comments corresponds with answers to Question #9 about what factors contributed to an unsafe situation - 82% of responses said communications, including the lack of. “There are a number of pilots that don't like to talk on the radio, even in "High traffic areas." Some effort should be directed at this group.”
Frequency – 42 comments mentioned issues with frequency, such as frequency congestion, confusion over which frequency to use, frequency boundary clarification, and suggestions to change CTAF frequencies. “I use CTAF, but often cross the highway. Creates confusion the way the frequency break is. I think an east west break line would be better.”
Procedures/Pattern – 35 comments reflected use of improper procedures, non-standard patterns, problems with pattern entry, the importance of following rules, flying very low, use of reporting points or position reports, or failure to use established altitudes. “Point Mackenzie is particularly dangerous because pilots frequently fly the procedures published in the AK supplement incorrectly. There should be a focused study on this one particular area.”
Avionics – 30 comments mentioned use of avionics including TCAS, ADS-B, lack of transponders or mode C. “Come up with a way to make ADS-B transceivers affordable for the average pilot.”
ATC/Radar services – 27 comments suggested that ATC, Approach or departure Control be used or monitored in certain segments, there was a lack of radar coverage, ATC failed to point out traffic, or was helpful. “ATC terminates flight following pretty quickly after crossing the Knik Arm into the Mat Su Valley”
Look/See and Avoid – 22 comments reflected the importance of looking for other traffic, stated that other pilots needed to spend more time looking out the window, using passengers to scan for traffic and proper scanning techniques. “All lights on all the time, Brief all passengers to watch for traffic, Use ATC services & CTAF, Pay attention!”
Lights - 18 comments about lights, including more pilots should fly with lights on, pulse lights and LED lights are effective.
“Streamline process for adding LED position/ strobe lights. Much more visible but FAA not supporting field approvals.”
Military – 15 comments regarding military aircraft, particularly with a lack of communications with GA aircraft. “Military Aircraft departing Elmendorf often times fly over at low altitudes causing issues for smaller aircraft. They don't appear to monitor the CTAF for this area.”
Routes – 9 comments pertained to the establishment of routes and VFR corridors. For example, the gorge near Knik Glacier was recommended to have one way traffic.
“The "gorge" @ Knik Glacier should be identified as one way - either up river or down river. There was a near mid-air there 3 days ago.”

2012 Mat Su Valley Collision Avoidance Survey
22
DEMOGRAPHICS
2012 Mat Su Valley Collision Avoidance Survey
23
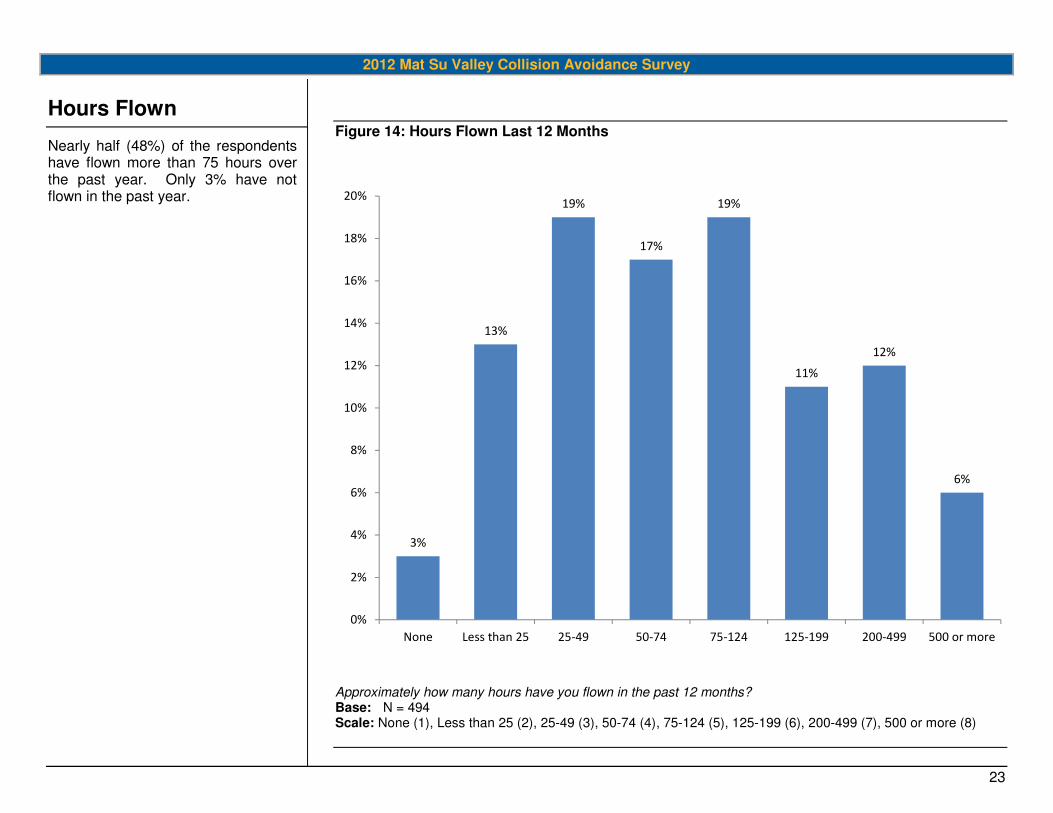
Hours Flown Nearly half (48%) of the respondents have flown more than 75 hours over the past year. Only 3% have not flown in the past year.
Figure 14: Hours Flown Last 12 Months
Approximately how many hours have you flown in the past 12 months? Base: N = 494 Scale: None (1), Less than 25 (2), 25-49 (3), 50-74 (4), 75-124 (5), 125-199 (6), 200-499 (7), 500 or more (8)
3%
13%
19%
17%
19%
11%
12%
6%
0%
2%
4%
6%
8%
10%
12%
14%
16%
18%
20%
None Less than 25 25-49 50-74 75-124 125-199 200-499 500 or more

2012 Mat Su Valley Collision Avoidance Survey
24
Aircraft Type More than two-thirds of respondents are flying Single Engine Land aircraft within or through the Mat Su Valley area. Second to that, 22% are flying Single Engine Sea aircraft. Within the “Other” category, respondents indicated that they split time equally between SEL and SES aircraft.
Figure 15: Aircraft Type Used in Mat Su Region
What type of aircraft do you PRIMARILY operate when flying in or through the Mat Su Valley? Base: N = 494 Scale: Light Sport (1), Single Engine Land (2), Single Engine Sea (3), Multi-engine Land (4), Multi-engine Sea (5), Helicopter (6), Other (7)
1%
69%
22%
3%0%
3% 2%
0%
10%
20%
30%
40%
50%
60%
70%
80%
Light Sport Single Engine
Land
Single Engine
Sea
Multi-engine
Land
Multi-engine
Sea
Helicopter Other
2012 Mat Su Valley Collision Avoidance Survey
25
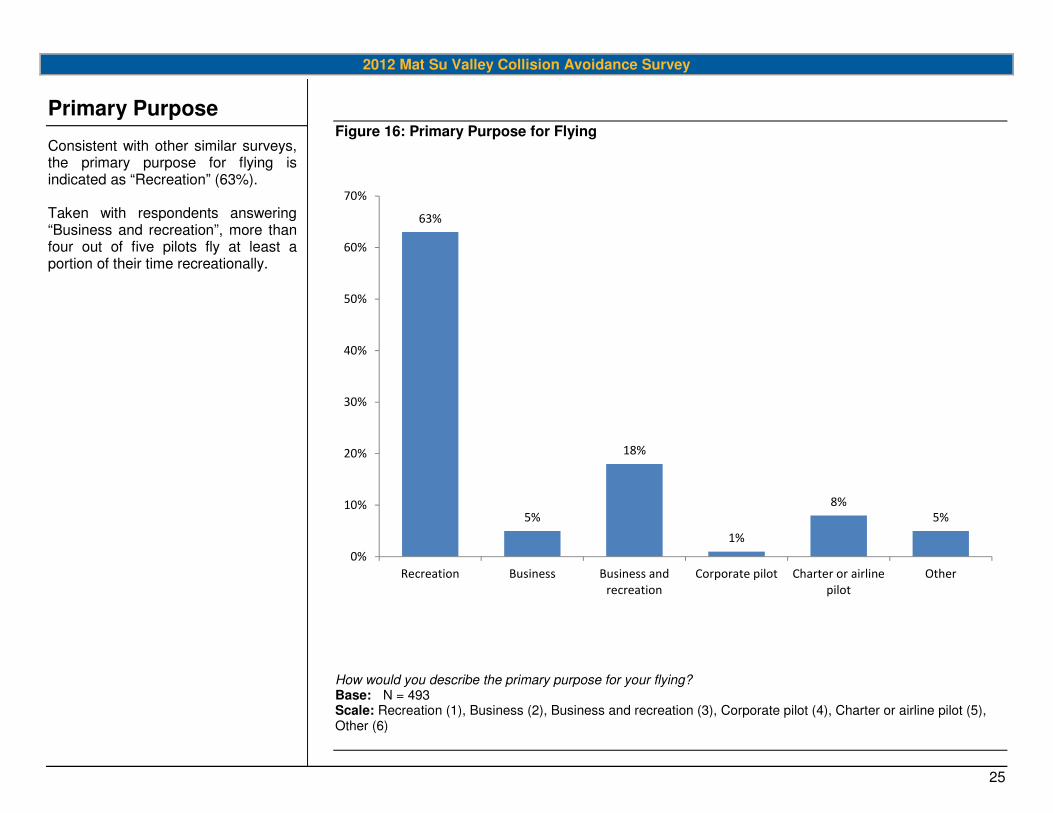
Primary Purpose Consistent with other similar surveys, the primary purpose for flying is indicated as “Recreation” (63%). Taken with respondents answering “Business and recreation”, more than four out of five pilots fly at least a portion of their time recreationally.
Figure 16: Primary Purpose for Flying
How would you describe the primary purpose for your flying? Base: N = 493 Scale: Recreation (1), Business (2), Business and recreation (3), Corporate pilot (4), Charter or airline pilot (5), Other (6)
63%
5%
18%
1%
8%
5%
0%
10%
20%
30%
40%
50%
60%
70%
Recreation Business Business and
recreation
Corporate pilot Charter or airline
pilot
Other

2012 Mat Su Valley Collision Avoidance Survey
26
Certificate Level Compared to the most recent membership survey conducted in April 2011, the responses are significantly different. Student: 2% Mat Su Valley Survey 8% Membership Survey Private: 46% Mat Su Valley Survey 52% Membership Survey Commercial: 28% Mat Su Valley 24% Membership ATP: 24% Mat Su Valley Survey 14% Membership Survey
Figure 17: Certificate Level
What is the highest level of pilot certificate you hold? Base: N = 493 Scale: Student (1), Sport (2), Recreational (3), Private (4), Commercial (5), ATP (6), Do not currently have a pilot certificate (7)
2%
0% 0%
46%
28%
24%
0%0%
5%
10%
15%
20%
25%
30%
35%
40%
45%
50%
Student Sport Recreational Private Commercial ATP Do not
currently have
a pilot
certificate

2012 Mat Su Valley Collision Avoidance Survey
27
Age Opposite of the pilot certificate data, these responses do not show the same variation with the most recent membership survey. The age brackets represented in this survey are similar to the overall membership study.
Figure 18: Age
What is your current age? Base: N = 218 Scale: Less than 16 (1), 16 to 19 (2), 20 to 24 (3), 25 to 34 (4), 35 to 44 (5), 45 to 54 (6), 55 to 64 (7), 65 or over (8)
0% 0%1%
10%
13%
25%
34%
17%
0%
5%
10%
15%
20%
25%
30%
35%
40%
Less than 16 16 to 19 20 to 24 25 to 34 35 to 44 45 to 54 55 to 64 65 or over