Embed Size (px)
Citation preview

Sophisticated Portfolio Management Techniques: supporting the backbone of the industry
Dr. Stefan Busch
VP Strategic Planning and Portfolio-Management
AstraZeneca GmbH - Germany
1455300/11
portfolio management techniques 2
Title of Contents
1. performance of the pharmaceutical industry (PI)
2. new PI and drivers for portfolio-managment focus on core competences
society`s voice into R&D
diversification or ...
...forward integration
new business model
3. marketing company portfolio management basics
identify, prioritize, understand – the marketing company consultation model
interpret and recommend – the eNPV-market access grid
the composite of resource allocation - pipeline projects and marketed products
1455300/11
| Title of presentation | 00 Month Year (Go Header & Footer to edit this text) 3
Performance of the Pharmaceutical Industry (PI)
4
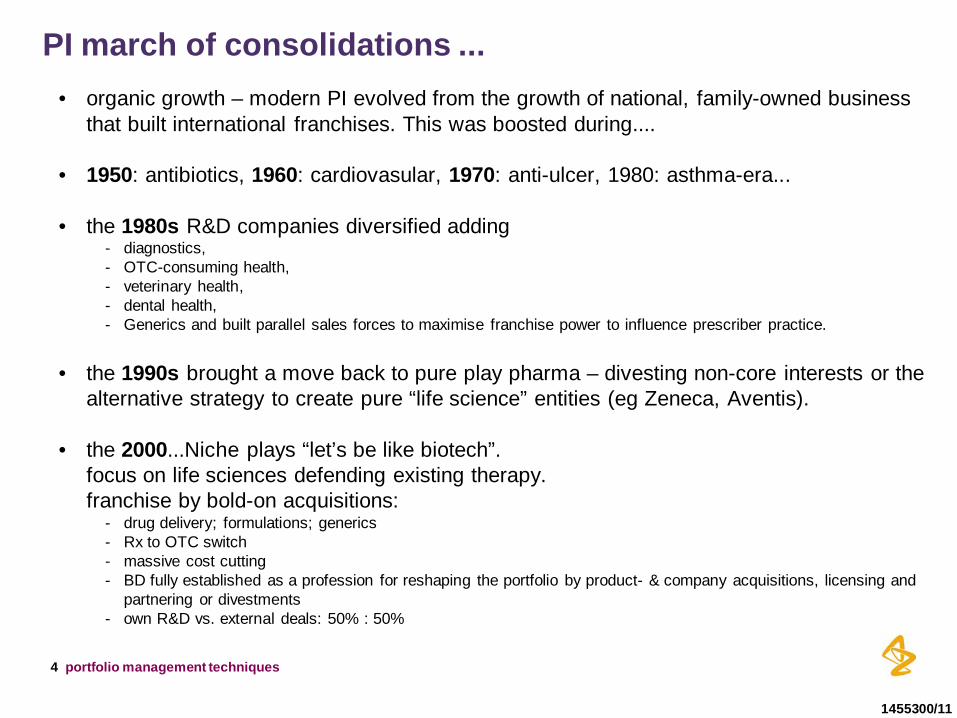
PI march of consolidations ... • organic growth – modern PI evolved from the growth of national, family-owned business
that built international franchises. This was boosted during....
• 1950: antibiotics, 1960: cardiovasular, 1970: anti-ulcer, 1980: asthma-era... • the 1980s R&D companies diversified adding
- diagnostics, - OTC-consuming health, - veterinary health, - dental health, - Generics and built parallel sales forces to maximise franchise power to influence prescriber practice.
• the 1990s brought a move back to pure play pharma – divesting non-core interests or the
alternative strategy to create pure “life science” entities (eg Zeneca, Aventis).
• the 2000...Niche plays “let’s be like biotech”. focus on life sciences defending existing therapy. franchise by bold-on acquisitions:
- drug delivery; formulations; generics - Rx to OTC switch - massive cost cutting - BD fully established as a profession for reshaping the portfolio by product- & company acquisitions, licensing and
partnering or divestments - own R&D vs. external deals: 50% : 50%
portfolio management techniques
1455300/11

5
R&D spending has soared but the number of NMEs & biologics approved is down
Year R&D (bn USD) # on NMEs approved Ratio
1995 1996 1997 1998 1999 2000 2001 2002 2003 2004 2005 2006 2007
15 17 19 20 22 25 28 30 35 38 40 44 46
30 55 40 30 35 30 25 20 25 38 20 22 20
2,0 3,2 2,1 1,5 1,6 1,2 0,9 0,7 0,7 1,0 0,5 0,5 0,4
* FDA/CDER Data
from 2000 to 2009 the PI spent >400bn in R&D but lost 1/3 of ist market capitalization in the same time.
e.g. Seroquel patex costs AstraZeneca 40% of its operating margin e.g. J&J: Pharma = 35% of its sales and 40% of its profit but 65% of its invest into R&D
1455300/11
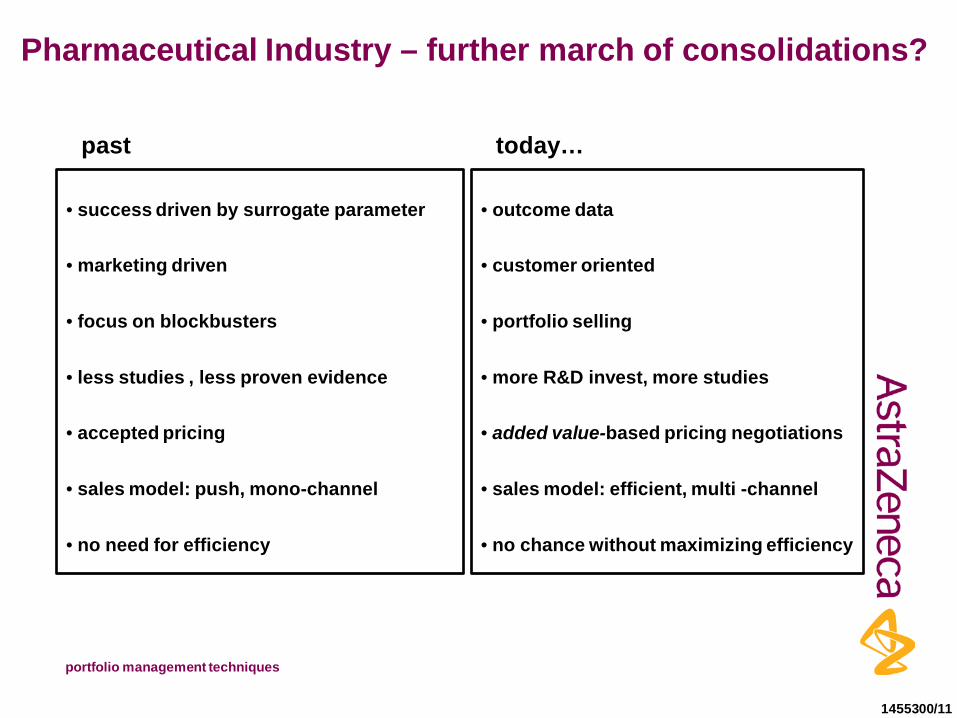
• outcome data
• customer oriented
• portfolio selling
• more R&D invest, more studies
• added value-based pricing negotiations
• sales model: efficient, multi -channel
• no chance without maximizing efficiency
Pharmaceutical Industry – further march of consolidations?
• success driven by surrogate parameter
• marketing driven
• focus on blockbusters
• less studies , less proven evidence
• accepted pricing
• sales model: push, mono-channel
• no need for efficiency
past today…
portfolio management techniques
1455300/11

7
The time of the low hanging fruit is over...
portfolio management techniques
| Title of presentation | 00 Month Year (Go Header & Footer to edit this text) 8
New PI and Drivers for Portfolio-Managment
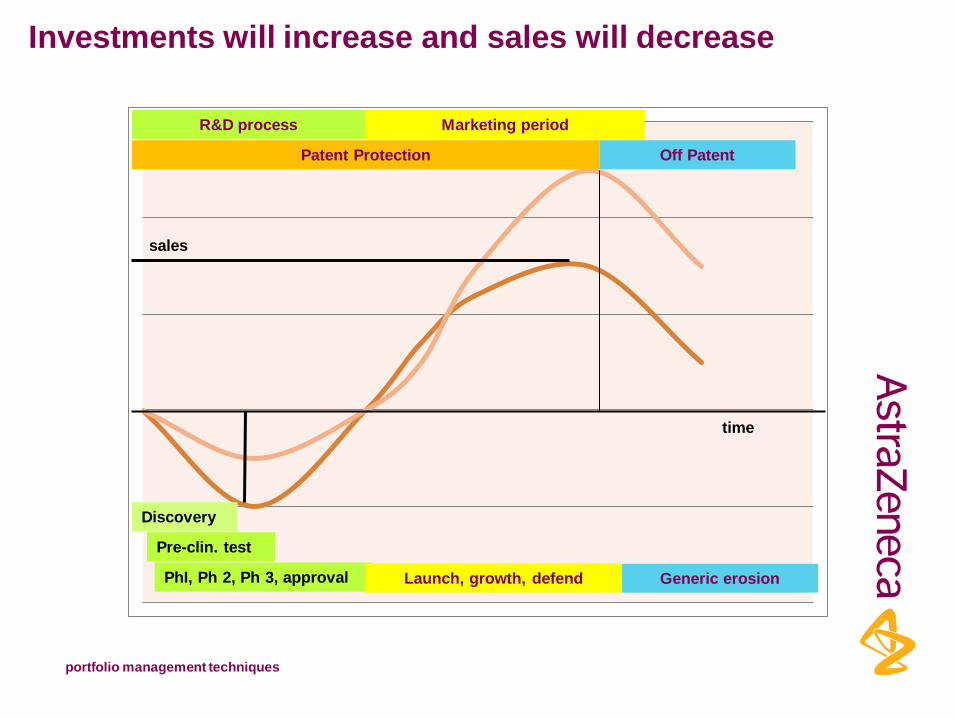
time
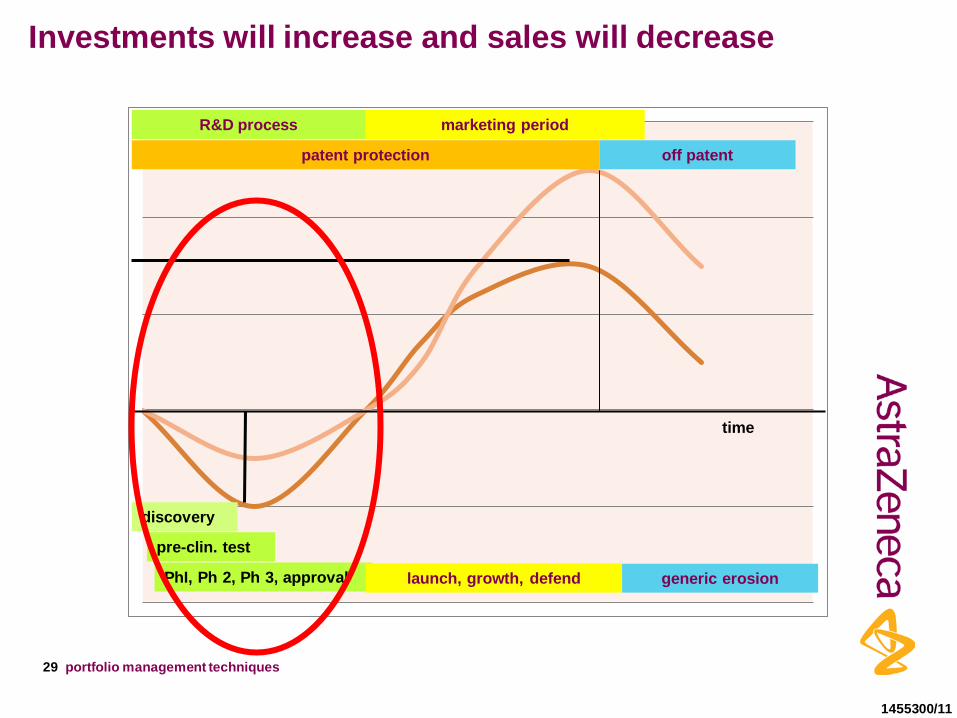
Investments will increase and sales will decrease
R&D process Marketing period
Patent Protection Off Patent
Discovery
Pre-clin. test
PhI, Ph 2, Ph 3, approval Launch, growth, defend Generic erosion
portfolio management techniques
sales
| Title of presentation | 00 Month Year (Go Header & Footer to edit this text) 10
Focus on Core Competences

11
New R&D... develop when confident that mechanism of action works
Discovery & Screening
Leading Development
Preclinical Evaluation Phase I
Phase II CIM / CIS Phase III Submission Phase IIIb/IV
RWE Submission Mol. Development
Early human Studies (POC)
Testable Hypotheses
Contextual Pathophys
Disease Knowledge
Today
Tomorrow
• Biol • Epid • Genomics • …
• International Understanding • Disease subtype • Mechanisms • Targets • Biomarkers • Safety • Incidence • Economics • Different.
• Targets • Mol. Entities • Subpopulations • disease-spec. Biomarkers • Efficiency Biomarkers • Safety Biomarkes
• Pharm. Science • Clinical Biomarkers • Device/Diagnostics • Regulatory Toxic. • Eff. & Safety clin. Trials • Preparation of submission
evidence to make a case
Pathophysiology
CIM CIS
Launch
portfolio management techniques
1455300/11
12
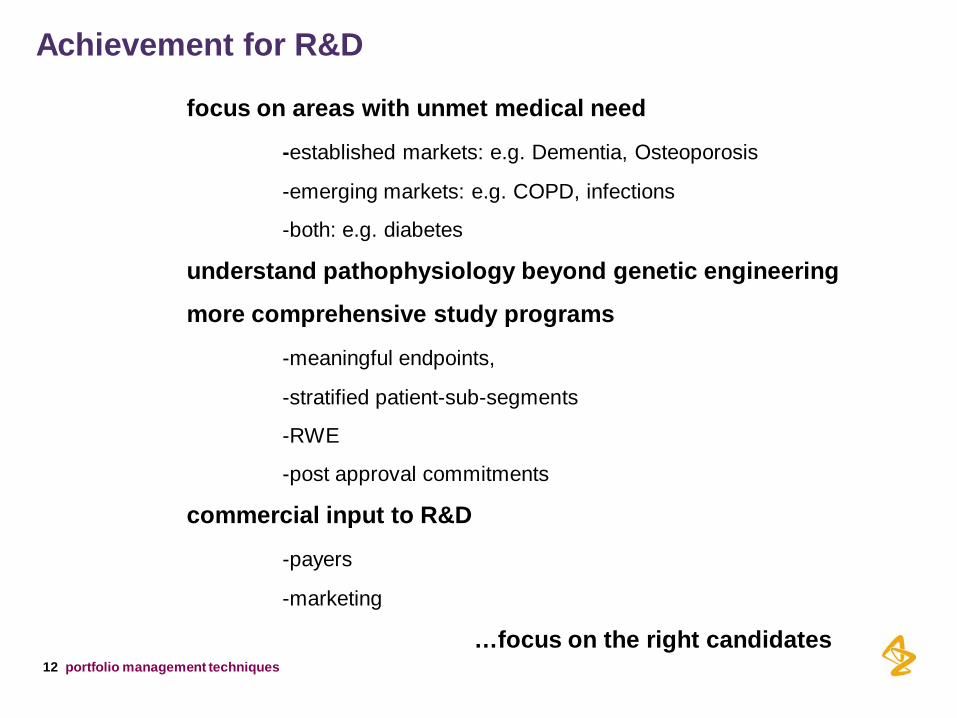
focus on areas with unmet medical need
-established markets: e.g. Dementia, Osteoporosis
-emerging markets: e.g. COPD, infections
-both: e.g. diabetes
understand pathophysiology beyond genetic engineering
more comprehensive study programs
-meaningful endpoints,
-stratified patient-sub-segments
-RWE
-post approval commitments
commercial input to R&D
-payers
-marketing
…focus on the right candidates
Achievement for R&D
portfolio management techniques
| Title of presentation | 00 Month Year (Go Header & Footer to edit this text) 13
Secure Society`s Voice into R&D
14
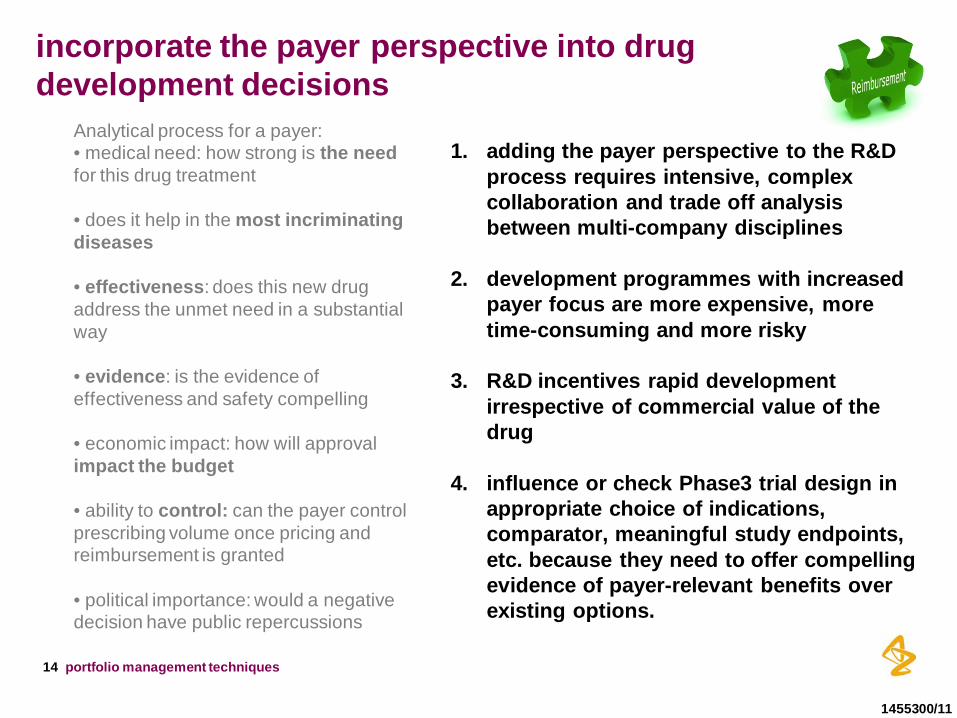
Analytical process for a payer: • medical need: how strong is the need for this drug treatment
• does it help in the most incriminating diseases • effectiveness: does this new drug address the unmet need in a substantial way
• evidence: is the evidence of effectiveness and safety compelling
• economic impact: how will approval impact the budget
• ability to control: can the payer control prescribing volume once pricing and reimbursement is granted
• political importance: would a negative decision have public repercussions
portfolio management techniques
1. adding the payer perspective to the R&D process requires intensive, complex collaboration and trade off analysis between multi-company disciplines
2. development programmes with increased payer focus are more expensive, more time-consuming and more risky
3. R&D incentives rapid development irrespective of commercial value of the drug
4. influence or check Phase3 trial design in appropriate choice of indications, comparator, meaningful study endpoints, etc. because they need to offer compelling evidence of payer-relevant benefits over existing options.
incorporate the payer perspective into drug development decisions
1455300/11
15
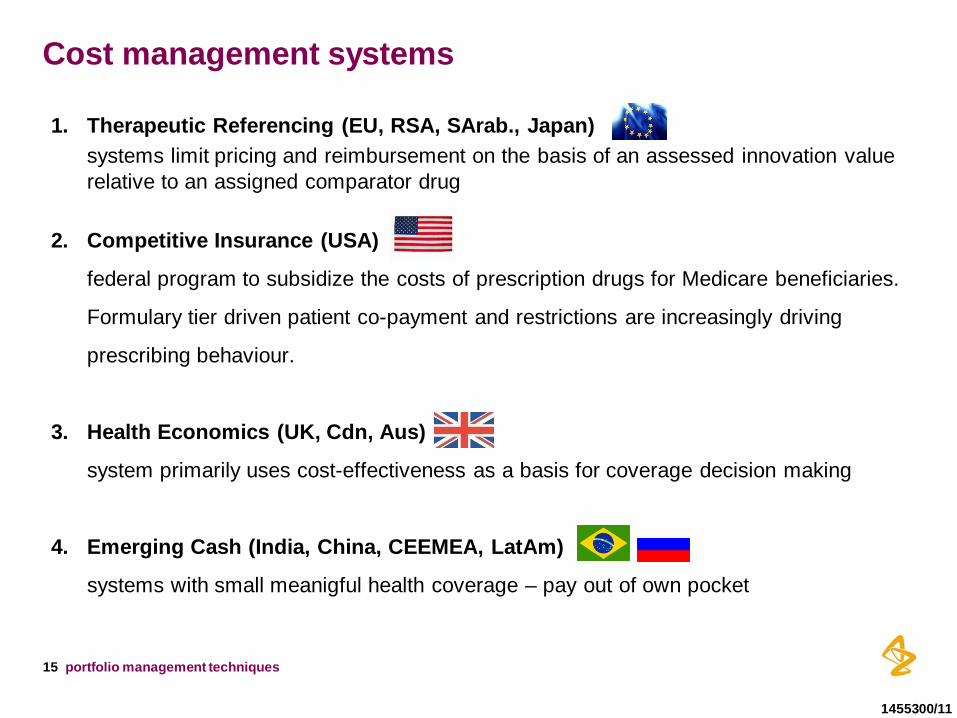
Cost management systems
1. Therapeutic Referencing (EU, RSA, SArab., Japan) systems limit pricing and reimbursement on the basis of an assessed innovation value
relative to an assigned comparator drug 2. Competitive Insurance (USA)
federal program to subsidize the costs of prescription drugs for Medicare beneficiaries.
Formulary tier driven patient co-payment and restrictions are increasingly driving
prescribing behaviour.
3. Health Economics (UK, Cdn, Aus)
system primarily uses cost-effectiveness as a basis for coverage decision making
4. Emerging Cash (India, China, CEEMEA, LatAm)
systems with small meanigful health coverage – pay out of own pocket
portfolio management techniques
1455300/11
| Title of presentation | 00 Month Year (Go Header & Footer to edit this text) 16
Diversification or...
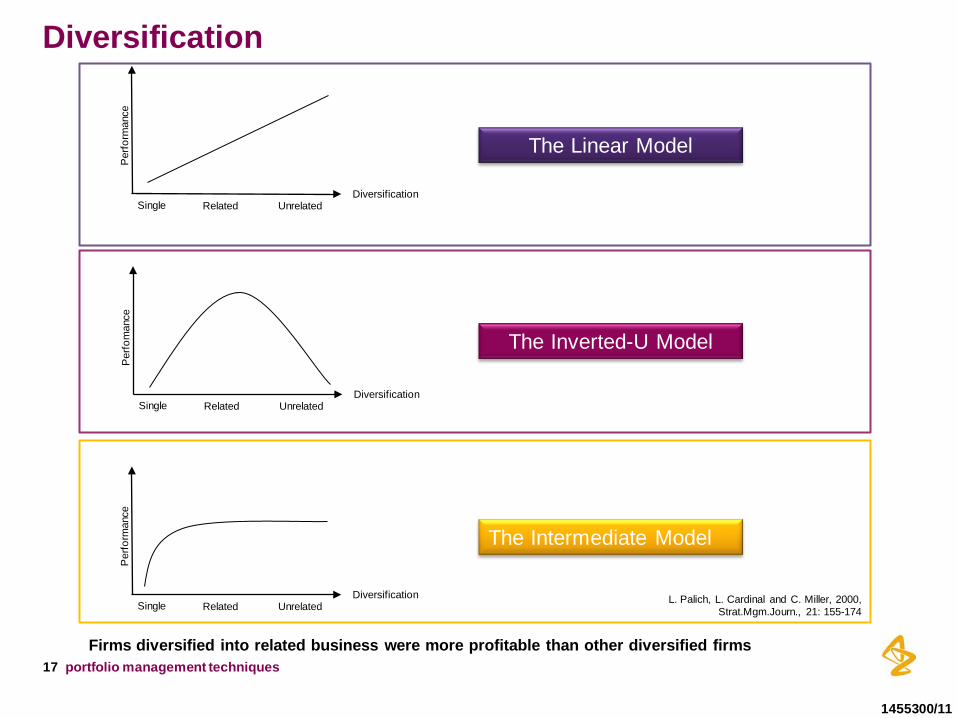
17
L. Palich, L. Cardinal and C. Miller, 2000, Strat.Mgm.Journ., 21: 155-174
The Linear Model
Diversification Single Related Unrelated
Per
form
ance
Diversification Single Related Unrelated
Per
fom
ance
The Inverted-U Model
The Intermediate Model
Diversification Single Related Unrelated
Per
form
ance
Diversification
Firms diversified into related business were more profitable than other diversified firms portfolio management techniques
1455300/11
18
Diversification
• diversification lowers a firm`s business-specific risk (but does not affect its
system-wide risk)
• PI is the paradigma for related diversification so further diversification is not the answer to current challenges:
Nevertheless.... • PI has been busy shedding non-core assets
- Service provider - Integrated care - Disease management programmes
• but ambitious and commitment remain limited due to still higher “pill-margins” • expand the value proposition responsibility by broadening the value chain or
outsourcing to contract service providers (according to the automotive sector: car manufactory is just the assembler with part-manufacturing as well as car sales outsourced).
portfolio management techniques
1455300/11

| Title of presentation | 00 Month Year (Go Header & Footer to edit this text) 19
...Forward Integration
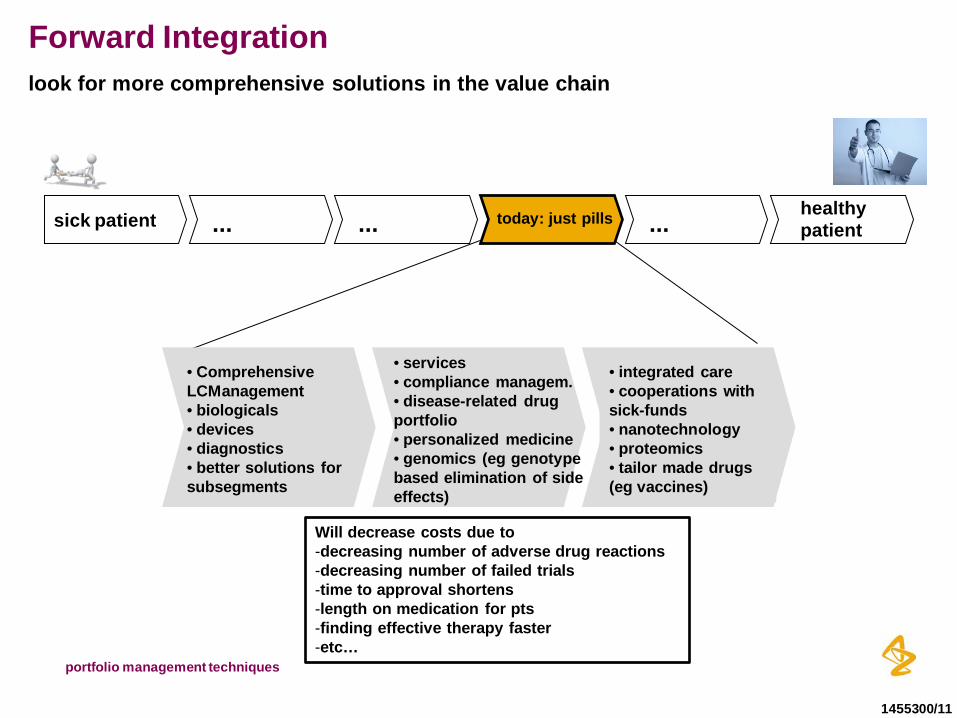
Forward Integration
• Comprehensive LCManagement • biologicals • devices • diagnostics • better solutions for subsegments
• services • compliance managem. • disease-related drug portfolio • personalized medicine • genomics (eg genotype based elimination of side effects)
• integrated care • cooperations with sick-funds • nanotechnology • proteomics • tailor made drugs (eg vaccines)
sick patient ... ... today: just pills ... healthy patient
look for more comprehensive solutions in the value chain
Will decrease costs due to -decreasing number of adverse drug reactions -decreasing number of failed trials -time to approval shortens -length on medication for pts -finding effective therapy faster -etc…
portfolio management techniques
1455300/11

| Title of presentation | 00 Month Year (Go Header & Footer to edit this text) 21
New Business Model

22
Sales Potential
portfolio management techniques
time
sales
•prevelance, •diagnosis rate •number of competitors •price •etc.
LoE
Sophisticated end of life-cycle management
2011 Jan Feb Mar Apr May Jun
Rep visit Patient adherence programme – Canada, Crestor
4
Rep visit Rep visit Birthday email
Doctor Müller, Berlin
Reference Follow-up service
Reacting to HCP comment
Request for support
Product-related question
HCP looks up in internet
Call center information
Service team visit Call center information
Web based detailing
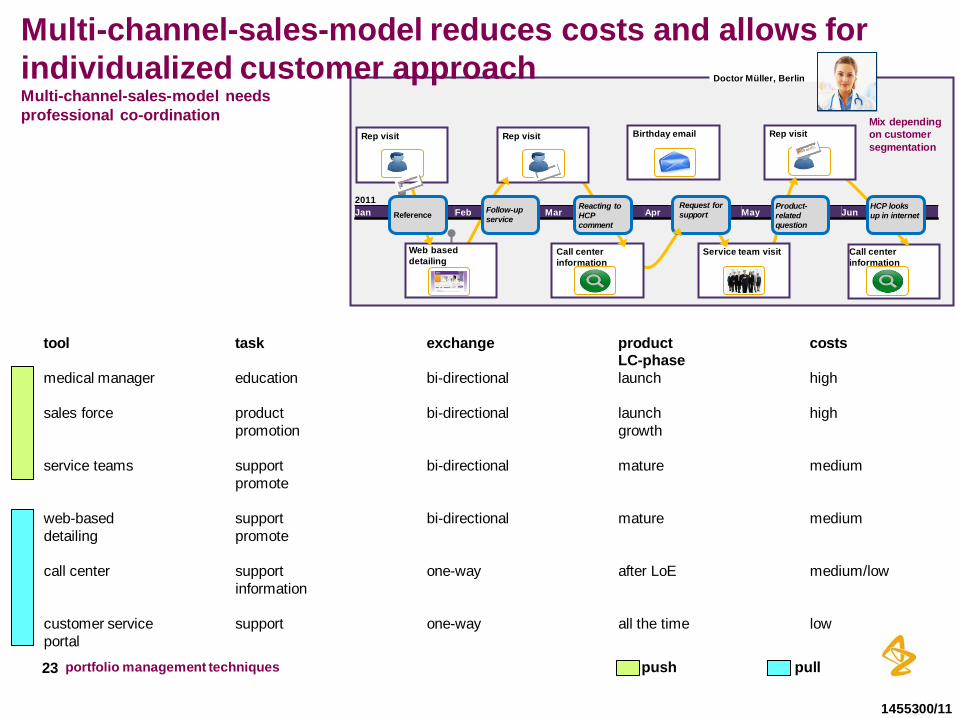
Multi-channel-sales-model reduces costs and allows for individualized customer approach Multi-channel-sales-model needs professional co-ordination
portfolio management techniques 23
tool task exchange product costs LC-phase medical manager education bi-directional launch high sales force product bi-directional launch high promotion growth service teams support bi-directional mature medium promote web-based support bi-directional mature medium detailing promote call center support one-way after LoE medium/low information customer service support one-way all the time low portal
push pull
1455300/11
Mix depending on customer segmentation
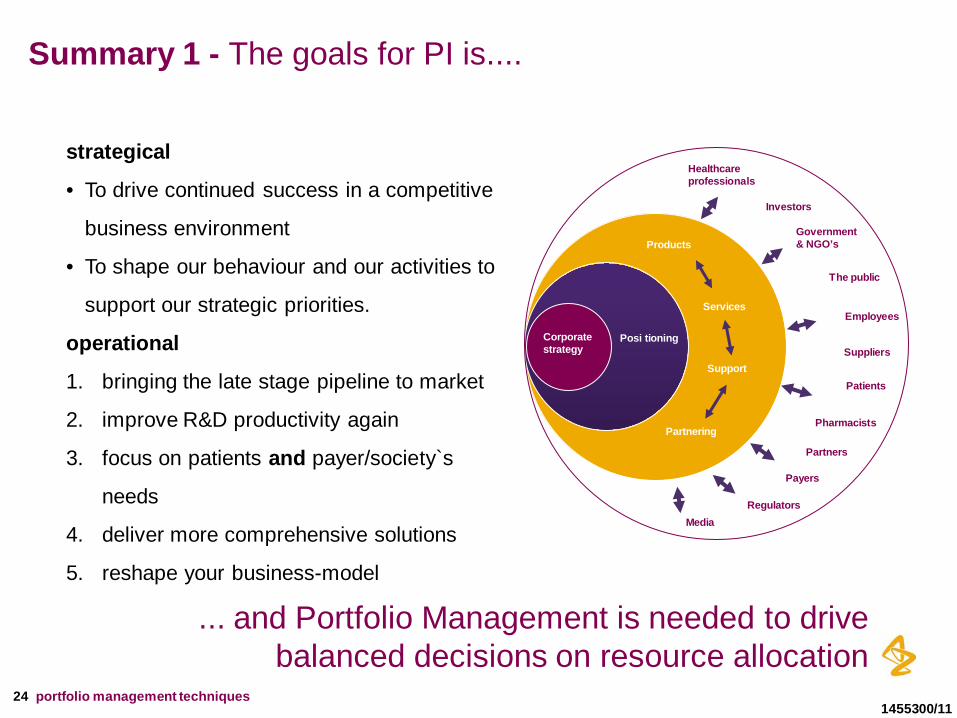
Summary 1 - The goals for PI is....
strategical
• To drive continued success in a competitive
business environment
• To shape our behaviour and our activities to
support our strategic priorities.
operational
1. bringing the late stage pipeline to market
2. improve R&D productivity again
3. focus on patients and payer/society`s
needs
4. deliver more comprehensive solutions
5. reshape your business-model
24
Corporate strategy
Posi tioning
Products
Services
Support
Partnering
Healthcare professionals
Investors
Government & NGO’s
The public
Employees
Suppliers
Patients
Pharmacists
Partners
Payers
Regulators Media
... and Portfolio Management is needed to drive balanced decisions on resource allocation
portfolio management techniques
1455300/11
| Title of presentation | 00 Month Year (Go Header & Footer to edit this text) 25
Portfolio Management
It`s all about TIME, RISK and MONEY

26
27
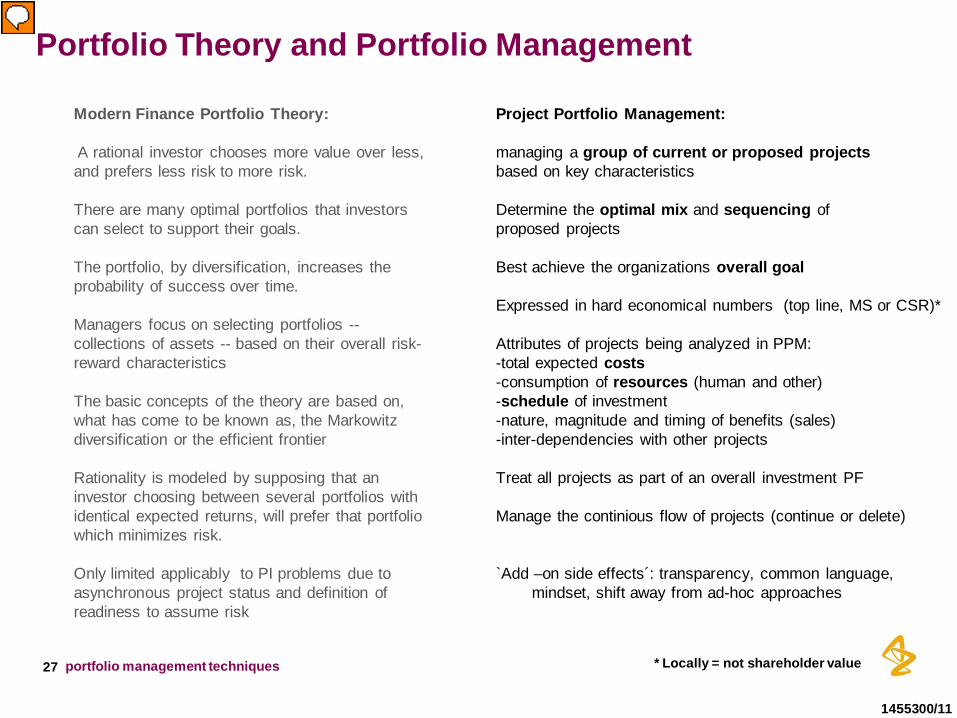
Portfolio Theory and Portfolio Management
Modern Finance Portfolio Theory: A rational investor chooses more value over less, and prefers less risk to more risk. There are many optimal portfolios that investors can select to support their goals. The portfolio, by diversification, increases the probability of success over time. Managers focus on selecting portfolios -- collections of assets -- based on their overall risk-reward characteristics
The basic concepts of the theory are based on, what has come to be known as, the Markowitz diversification or the efficient frontier Rationality is modeled by supposing that an investor choosing between several portfolios with identical expected returns, will prefer that portfolio which minimizes risk. Only limited applicably to PI problems due to asynchronous project status and definition of readiness to assume risk
Project Portfolio Management: managing a group of current or proposed projects based on key characteristics Determine the optimal mix and sequencing of proposed projects Best achieve the organizations overall goal Expressed in hard economical numbers (top line, MS or CSR)* Attributes of projects being analyzed in PPM: -total expected costs -consumption of resources (human and other) -schedule of investment -nature, magnitude and timing of benefits (sales) -inter-dependencies with other projects Treat all projects as part of an overall investment PF Manage the continious flow of projects (continue or delete) `Add –on side effects´: transparency, common language,
mindset, shift away from ad-hoc approaches
* Locally = not shareholder value
1455300/11
portfolio management techniques
• shaping the portfolio-candidates
• prioritize the frontrunners
• interpretation and recommendation
• the composite of resource allocation
Project Portfolio Management done in a `neutral´, un-biased department only focussing on the overall goal of the company
portfolio management techniques 28
time
Investments will increase and sales will decrease
R&D process marketing period
patent protection off patent
discovery
pre-clin. test
PhI, Ph 2, Ph 3, approval launch, growth, defend generic erosion
portfolio management techniques
1455300/11
29
| Title of presentation | 00 Month Year (Go Header & Footer to edit this text) 30
Shaping the Portfolio-Candidates
31
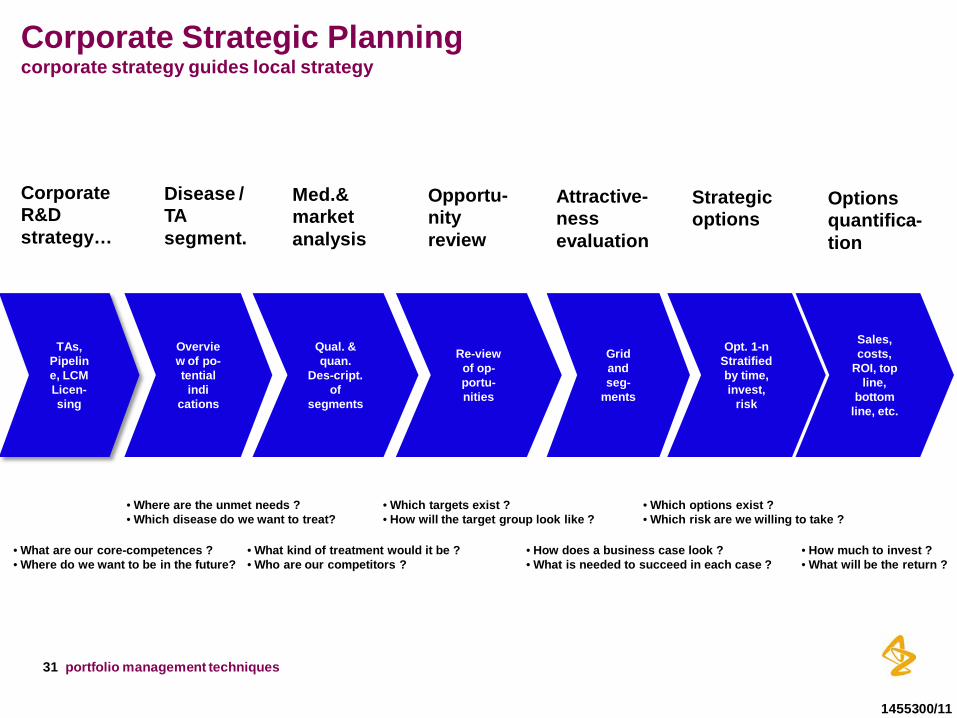
Corporate Strategic Planning corporate strategy guides local strategy
Corporate R&D strategy…
Disease / TA segment.
Med.& market analysis
Opportu- nity review
Attractive-ness evaluation
Strategic options
Options quantifica-tion
TAs, Pipeline, LCM Licen-sing
Overview of po-tential
indi cations
Qual. & quan.
Des-cript. of
segments
Re-view of op-portu- nities
Grid and seg-
ments
Opt. 1-n Stratified by time, invest,
risk
Sales, costs,
ROI, top line,
bottom line, etc.
• Where are the unmet needs ? • Which disease do we want to treat?
• What are our core-competences ? • Where do we want to be in the future?
• What kind of treatment would it be ? • Who are our competitors ?
• Which options exist ? • Which risk are we willing to take ?
• Which targets exist ? • How will the target group look like ?
• How does a business case look ? • What is needed to succeed in each case ?
• How much to invest ? • What will be the return ?
portfolio management techniques
1455300/11
32
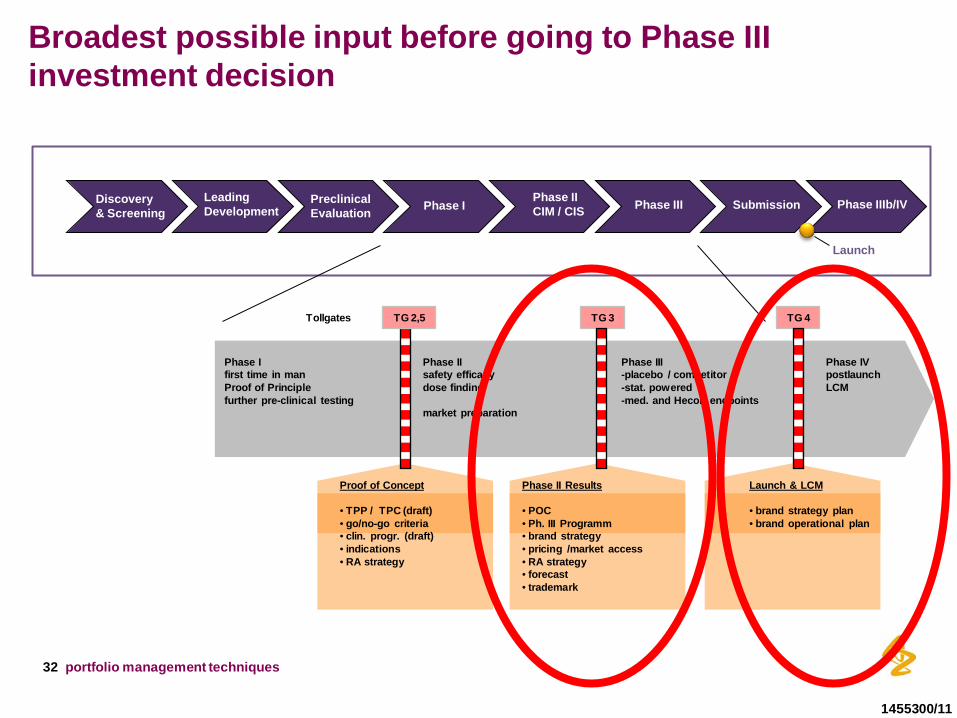
Broadest possible input before going to Phase III investment decision
Discovery & Screening
Leading Development
Preclinical Evaluation Phase I
Phase II CIM / CIS Phase III Submission Phase IIIb/IV
Launch
Launch & LCM • brand strategy plan • brand operational plan
TG 2,5 TG 3 TG 4
Phase I first time in man Proof of Principle further pre-clinical testing
Phase II safety efficacy dose finding market preparation
Phase III -placebo / competitor -stat. powered -med. and Hecon endpoints
Phase IV postlaunch LCM
Proof of Concept • TPP / TPC (draft) • go/no-go criteria • clin. progr. (draft) • indications • RA strategy
Phase II Results • POC • Ph. III Programm • brand strategy • pricing /market access • RA strategy • forecast • trademark
Tollgates
portfolio management techniques
1455300/11
33
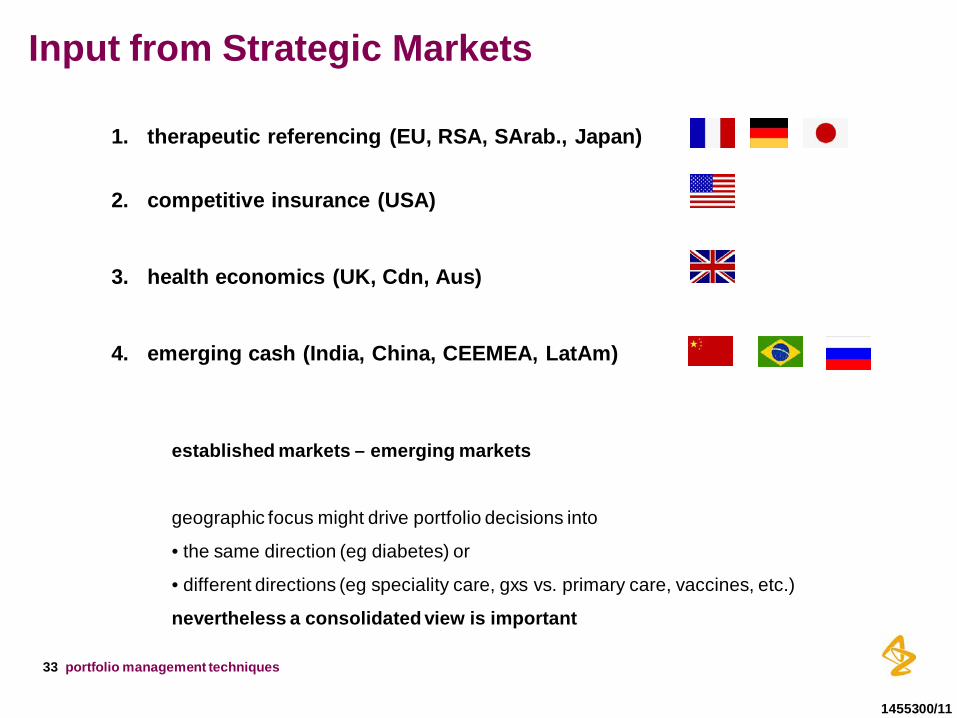
Input from Strategic Markets
1. therapeutic referencing (EU, RSA, SArab., Japan) 2. competitive insurance (USA)
3. health economics (UK, Cdn, Aus)
4. emerging cash (India, China, CEEMEA, LatAm)
established markets – emerging markets
geographic focus might drive portfolio decisions into
• the same direction (eg diabetes) or
• different directions (eg speciality care, gxs vs. primary care, vaccines, etc.)
nevertheless a consolidated view is important
portfolio management techniques
1455300/11
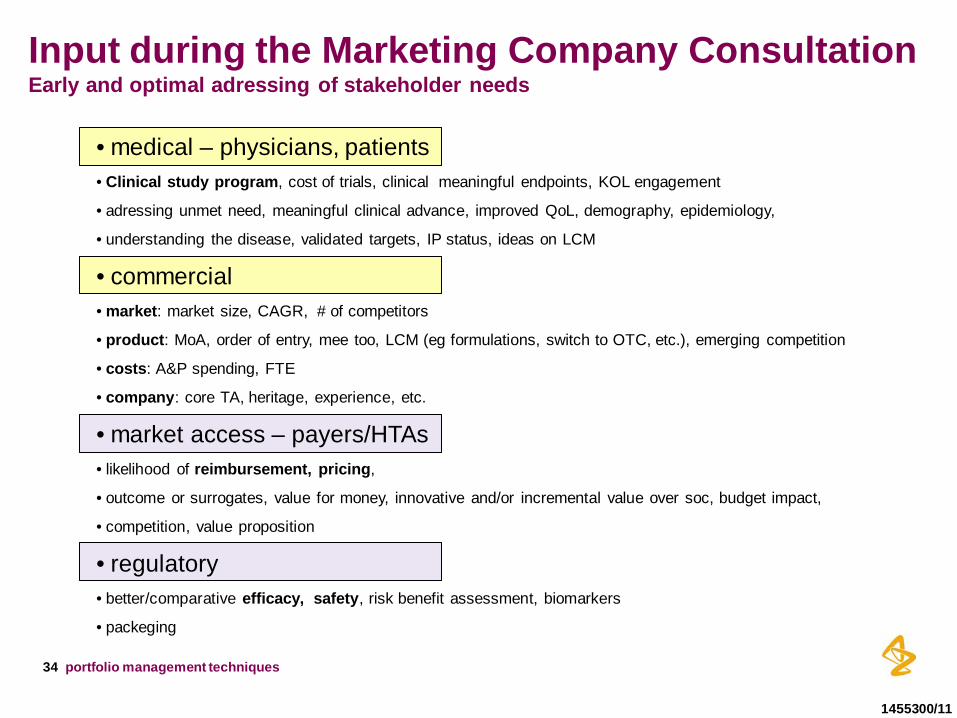
Input during the Marketing Company Consultation Early and optimal adressing of stakeholder needs
• medical – physicians, patients • Clinical study program, cost of trials, clinical meaningful endpoints, KOL engagement
• adressing unmet need, meaningful clinical advance, improved QoL, demography, epidemiology,
• understanding the disease, validated targets, IP status, ideas on LCM
• commercial • market: market size, CAGR, # of competitors
• product: MoA, order of entry, mee too, LCM (eg formulations, switch to OTC, etc.), emerging competition
• costs: A&P spending, FTE
• company: core TA, heritage, experience, etc.
• market access – payers/HTAs • likelihood of reimbursement, pricing,
• outcome or surrogates, value for money, innovative and/or incremental value over soc, budget impact,
• competition, value proposition
• regulatory • better/comparative efficacy, safety, risk benefit assessment, biomarkers
• packeging
portfolio management techniques
1455300/11
34

Corporate Consolidated Cross Market View and its feedback to the local marketing companies
low medium high
low
medium
high
Overall risk
Com
mer
cial
attr
activ
enes
s
16 21%
14 62%
8 41%
5 56%
20 32,5%
8
16%
5 56%
8 41%
portfolio management techniques
1455300/11
overall position of the project in the company`s
project portfolio
35
| Title of presentation | 00 Month Year (Go Header & Footer to edit this text) 36
Identify, Prioritize, Understand
8 41%
-0,2
0
0,2
0,4
0,6
0,8
1
0 20 40 60 80 100 120 140 20 40 60 80 100 0
20
40
60
80
100
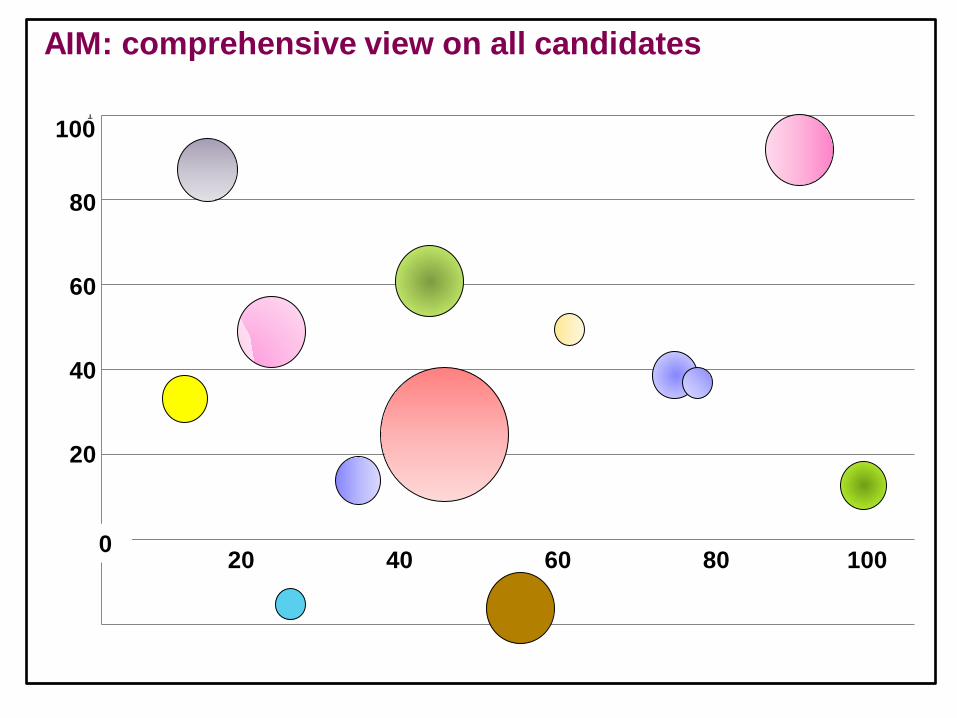
AIM: comprehensive view on all candidates
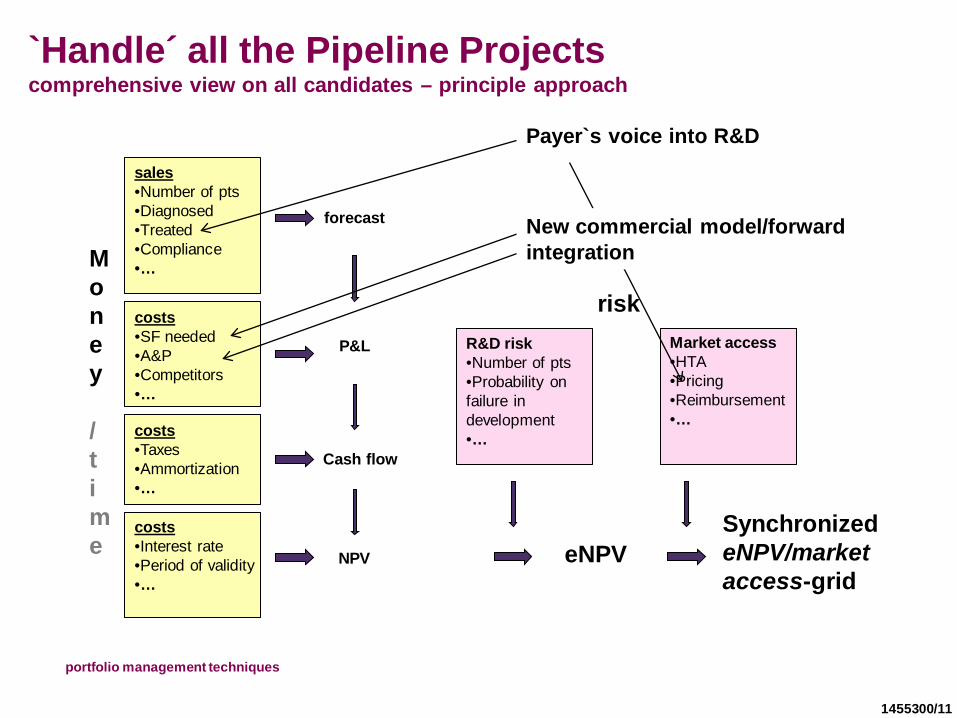
`Handle´ all the Pipeline Projects comprehensive view on all candidates – principle approach
sales •Number of pts •Diagnosed •Treated •Compliance •…
costs •Taxes •Ammortization •…
forecast
P&L
Money / time
Cash flow
costs •SF needed •A&P •Competitors •…
costs •Interest rate •Period of validity •…
NPV
Market access •HTA •Pricing •Reimbursement •…
R&D risk •Number of pts •Probability on failure in development •…
risk
eNPV Synchronized eNPV/market access-grid
portfolio management techniques
Payer`s voice into R&D
New commercial model/forward integration
1455300/11
1455300/11

39
Cash Flow Statement & NPV , base case, m€ Year 1 2 3 4 5 6 7 8 9 10 11 12 13 14 TOTAL SALES (US) - - - - 6 90 210 320 390 440 460 480 490 500 3386 Discount US 12% - - - - (1) (11) (25) (38) (47) (53) (55) (58) (59) (60) (406) SALES (EU) - - - - 1 20 40 70 100 115 120 125 130 135 856 TOTAL NET SALES - - - - 6 99 225 352 443 502 525 547 561 575 3836 -------------------------------------------------------------------------------------------------------------------------------------------------------------------------------------------------------------------------------------------------------------------- COGS 8% - - - - (1) (9) (20) (31) (39) (44) (46) (48) (50) (51) (339) Royalty 15% - - - - (1) (15) (34) (53) (66) (75) (79) (82) (84) (86) (575) -------------------------------------------------------------------------------------------------------------------------------------------------------------------------------------------------------------------------------------------------------------------- CONTRIBUTION 1 - - - - 5 76 171 268 338 382 400 417 427 438 2921 GM - - - - 76% 76% 76% 76% 76% 76% 76% 76% 76% 76% 76% -------------------------------------------------------------------------------------------------------------------------------------------------------------------------------------------------------------------------------------------------------------------- Marketing & Sales - - - (50) (100) (100) (100) (75) (75) (50) (50) (50) (50) (30) (730) R&D (40) (40) (40) (2) (1) - - - - - - - - - (123) Other payments Amortization - - - - (2) (2) (2) (2) (2) (2) (2) (2) (2) (2) (20) Payment not to be capitalized (50) - - - - - - - - - - - - - (50) Pre tax profit (90) (40) (40) (52) (98) (26) 69 191 261 330 348 365 375 406 1998 Taxes 40% 36 16 16 21 39 11 (28) (76) (104) (132) (139) (146) (150) (162) (799) Net profit (54) (24) (24) (31) (59) (16) 41 114 156 198 209 219 225 244 1199 --------------------------------------------------------------------------------------------------------------------------------------------------------------------------------------------------------------------------------------------------------------------- Payment to be capitalized - - - - (20) - - - - - - - - - (20) Net profit (54) (24) (24) (31) (59) (16) 41 114 156 198 209 219 225 244 1199 Change in working capital 11% - - - - (1) (11) (15) (15) (11) (7) (3) (3) (2) (2) Amortization - - - - (2) (2) (2) (2) (2) (2) (2) (2) (2) (2) (20) -------------------------------------------------------------------------------------------------------------------------------------------------------------------------------------------------------------------------------------------------------------------- Annual cash flow (54) (24) (24) (31) (78) (25) 28 101 147 193 208 218 226 244 1129 Cummulative cash flow (54) (78) (102) (133) (211) (236) (208) (107) 40 233 441 659 885 1129 Annual discounted cash flow 10% (49) (20) (18) (21) (48) (14) 14 47 62 74 73 70 65 64 300 Cumulative NPV (49) (69) (87) (108) (157) (171) (156) (109) (47) 28 101 170 235 300
Launch
portfolio management techniques
1455300/11
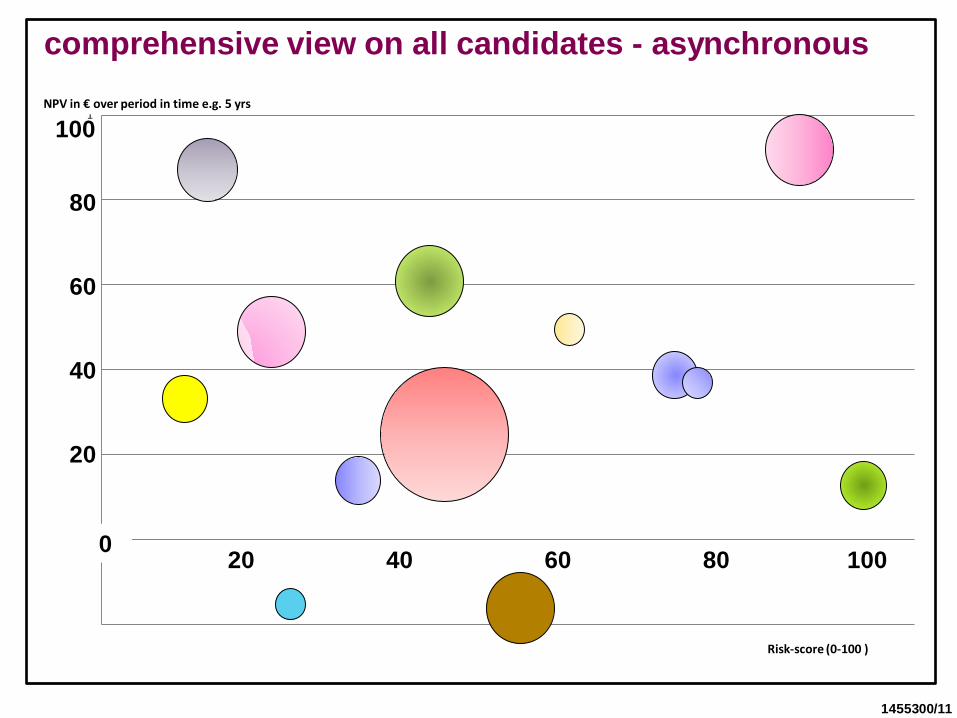
-0,2
0
0,2
0,4
0,6
0,8
1
0 20 40 60 80 100 120 140
Risk-score (0-100 )
NPV in € over period in time e.g. 5 yrs
20 40 60 80 100 0
20
40
60
80
100
comprehensive view on all candidates - asynchronous
1455300/11
41
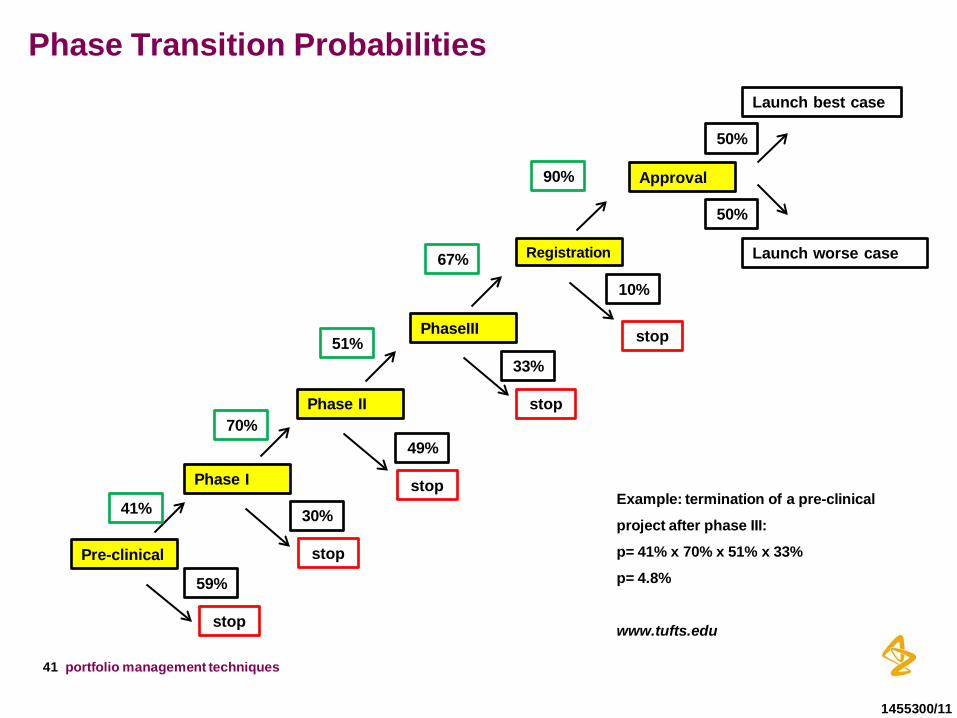
Phase Transition Probabilities
Pre-clinical
Phase I
Phase II
PhaseIII
Registration
Approval
Launch best case
Launch worse case
stop
stop
stop
stop
stop
41%
70%
51%
67%
90%
50%
50%
59%
30%
49%
33%
10%
Example: termination of a pre-clinical
project after phase III:
p= 41% x 70% x 51% x 33%
p= 4.8%
www.tufts.edu
portfolio management techniques
1455300/11
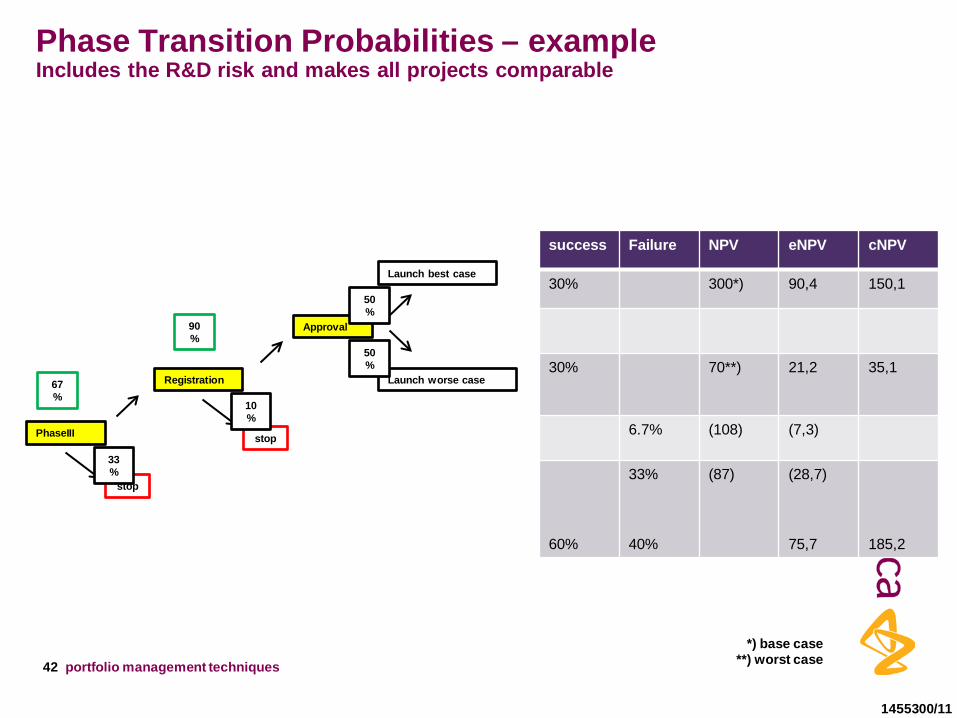
PhaseIII
Registration
Approval
Launch best case
Launch worse case
stop
stop
67%
90%
50%
50%
33%
10%
Phase Transition Probabilities – example Includes the R&D risk and makes all projects comparable
success Failure NPV eNPV cNPV
30% 300*) 90,4 150,1
30% 70**) 21,2 35,1
6.7% (108) (7,3)
60%
33% 40%
(87) (28,7) 75,7
185,2
*) base case **) worst case portfolio management techniques
1455300/11
42

Local Market Access Riskscore has to be taylored along the different cost management systems
Produkt X
weighting yes (5) probable(3) no (0) Risk-scoreunmet medical need 3 0indication with generic competition 1 0reference pricing most probable 2 0achieved daily therapy costs above comparator 2 0reimbursement unsecure 3 0payer market research without further interest 1 0patient benefits evident in clinical studies 4 0fullfilling IQWiG criteria 3 0forecasted PYS spotting the compound in the system 1 0
total risk 0
portfolio management techniques
1455300/11
43
-0,2
0
0,2
0,4
0,6
0,8
1
0 20 40 60 80 100 120 140
Risk-score (0-100 )
eNPV in €
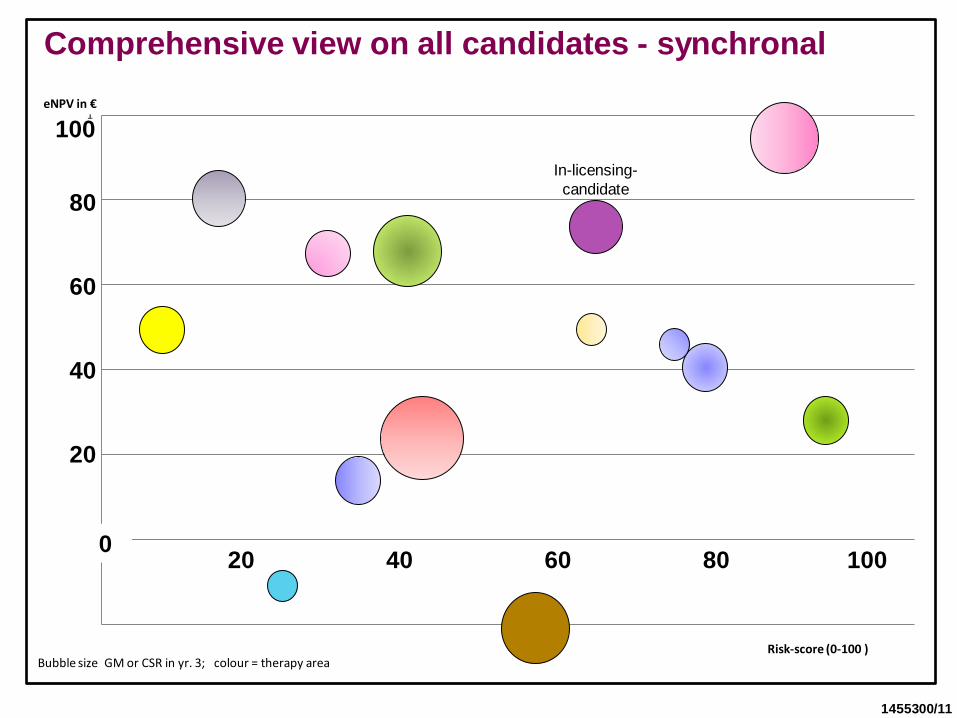
Bubble size GM or CSR in yr. 3; colour = therapy area
20 40 60 80 100 0
20
40
60
80
100
Comprehensive view on all candidates - synchronal
In-licensing-candidate
1455300/11
45
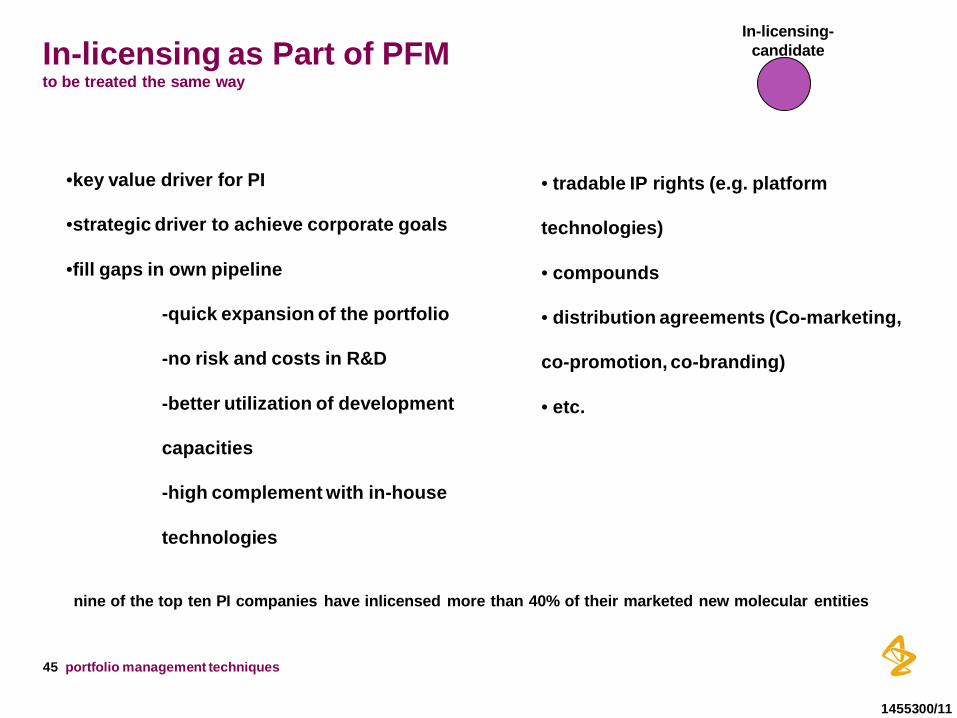
In-licensing as Part of PFM to be treated the same way
•key value driver for PI
•strategic driver to achieve corporate goals
•fill gaps in own pipeline
-quick expansion of the portfolio
-no risk and costs in R&D
-better utilization of development
capacities
-high complement with in-house
technologies
• tradable IP rights (e.g. platform
technologies)
• compounds
• distribution agreements (Co-marketing,
co-promotion, co-branding)
• etc.
nine of the top ten PI companies have inlicensed more than 40% of their marketed new molecular entities
In-licensing-candidate
portfolio management techniques
1455300/11
| Title of presentation | 00 Month Year (Go Header & Footer to edit this text) 46
Interpretation and Recommendation
-0,2
0
0,2
0,4
0,6
0,8
1
0 20 40 60 80 100 120 140
Risk-score (0-100 )
eNPV in €
20 40 60 80 100 0
20
40
60
80
100
in-licensing-candidate
1455300/11
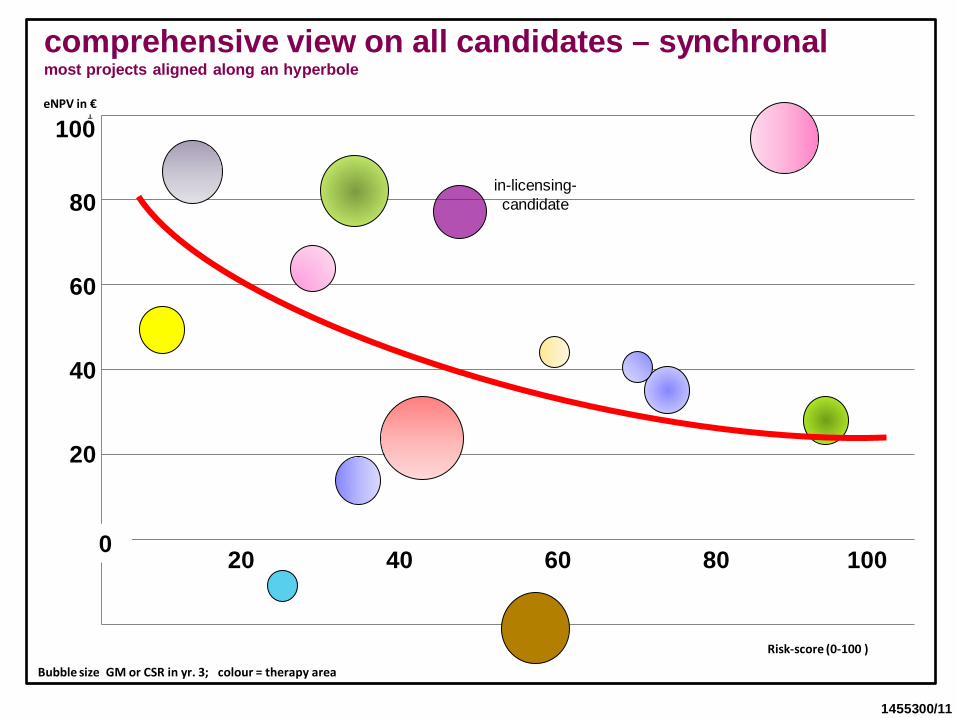
comprehensive view on all candidates – synchronal most projects aligned along an hyperbole
Bubble size GM or CSR in yr. 3; colour = therapy area

48
Portfolio-evaluation helps driving productivity
1. Understand:
1. NPV of entire portfolio
2. NPV of entire portfolio with risk adjustement
3. # of products per development phase
4. Ratio of NCE vs. NBE and vs. LCM opportunities
5. Do we have a healthy balance ?
6. Ratio of high risk vs. low risk projects
7. Expected new launches per year
8. Needed resourcing for
1. further development
2. unlocking the entire potential of the
portfolio
3. efficient commercialization of the portfolio
9. Evaluate licensing opportunities to streamline
your business shape
2. Actions
• kill projects early , if PoC failed
• identify the the right assets
• take only the best projects into late stage clinical
development
• understand their comprehensive potential –
don`t be afraid of niches
• where are the synergies ?
• identify gaps or lags in your distribution and
shape as early as possible
• bring your organization to `think, act and
speak the same language´
• identify needs for broader customer solutions
(diagnostics, personalized medicine, …)
portfolio management techniques
1455300/11
-0,2
0
0,2
0,4
0,6
0,8
1
0 20 40 60 80 100 120 140
Risk-score (0-100 )
eNPV in €
20 40 60 80 100 0
20
40
60
80
100
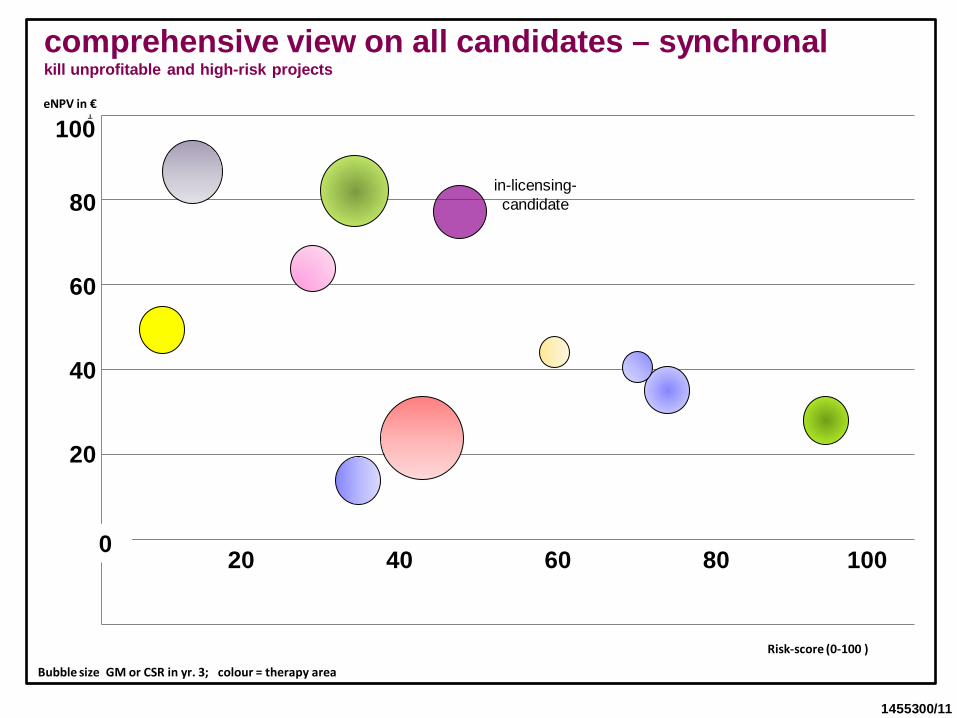
comprehensive view on all candidates – synchronal kill unprofitable and high-risk projects
in-licensing-candidate
1455300/11
Bubble size GM or CSR in yr. 3; colour = therapy area
| Title of presentation | 00 Month Year (Go Header & Footer to edit this text) 50
The Composite of Resource Allocation – 1. Pipeline Projects
-0,2
0
0,2
0,4
0,6
0,8
1
0 20 40 60 80 100 120 140
Risk-score (0-100 )
eNPV in €
Bubble size= ROI/rep; colour = therapy area
20 40 60 80 100 0
20
40
60
80
100
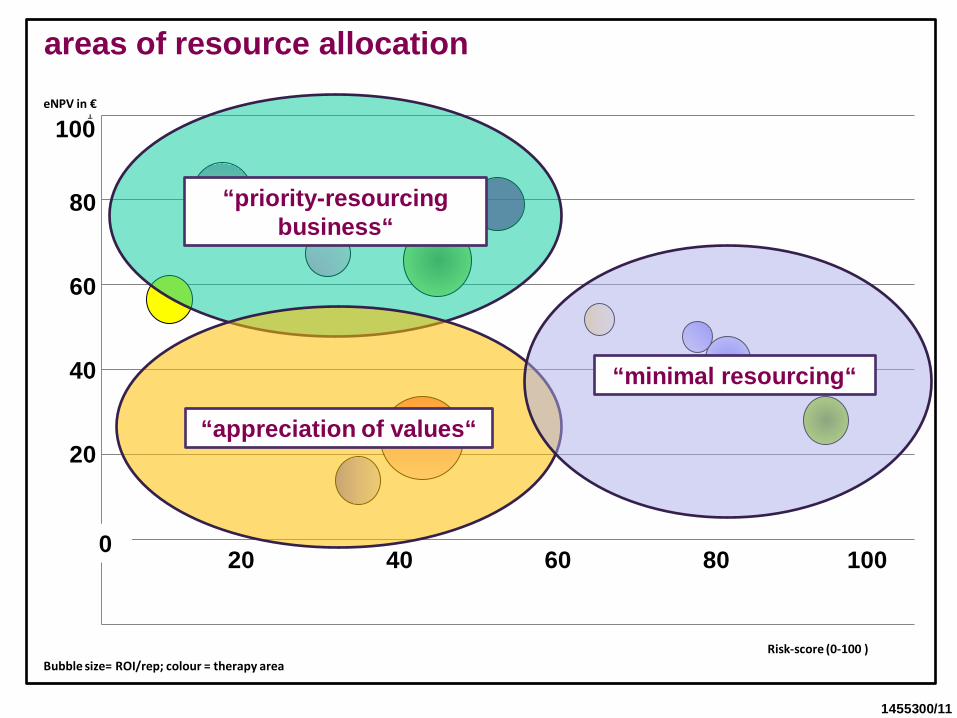
areas of resource allocation
“priority-resourcing business“
“appreciation of values“
“minimal resourcing“
1455300/11
-0,2
0
0,2
0,4
0,6
0,8
1
0 20 40 60 80 100 120 140
Risk-score (0-100 )
eNPV in €
Bubble size= ROI/rep; colour = therapy area
20 40 60 80 100 0
20
40
60
80
100
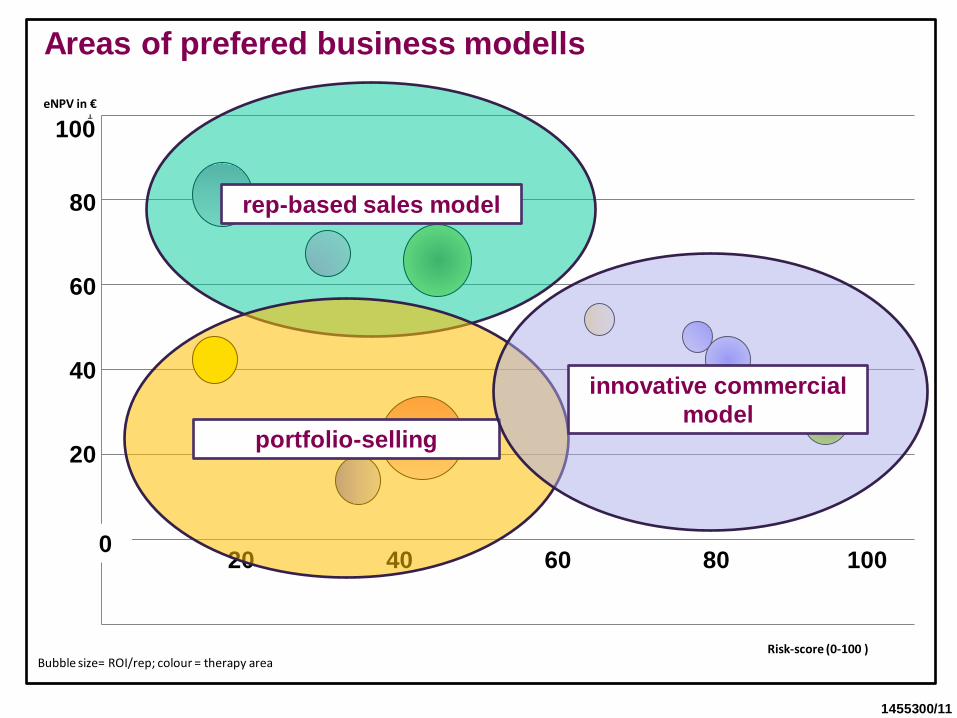
Areas of prefered business modells
rep-based sales model
portfolio-selling
innovative commercial model
1455300/11
53
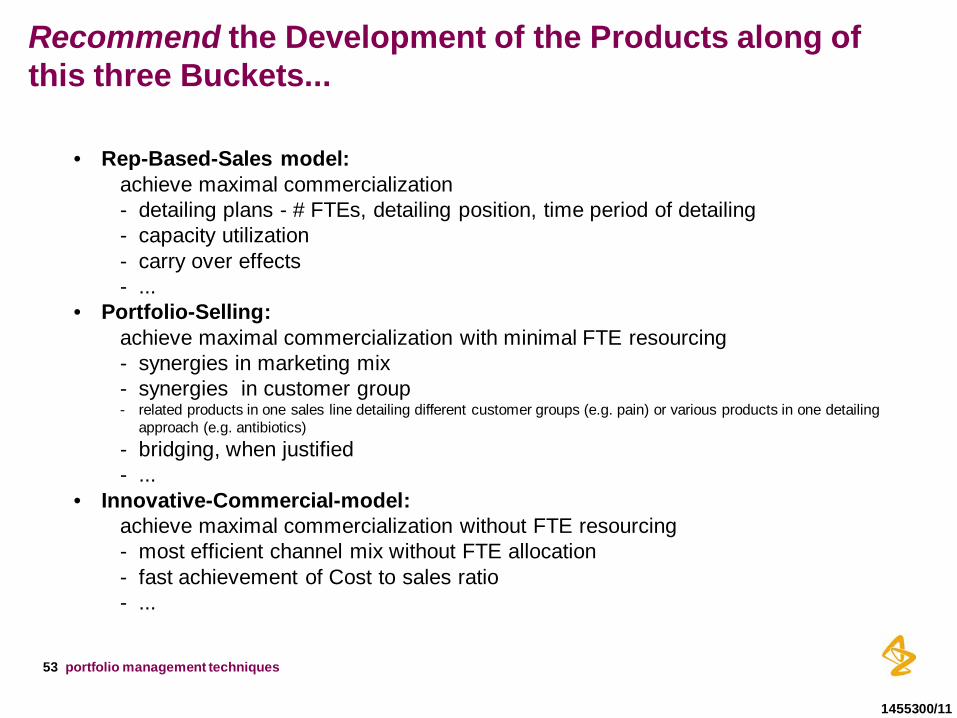
Recommend the Development of the Products along of this three Buckets...
• Rep-Based-Sales model: achieve maximal commercialization - detailing plans - # FTEs, detailing position, time period of detailing - capacity utilization - carry over effects - ...
• Portfolio-Selling: achieve maximal commercialization with minimal FTE resourcing - synergies in marketing mix - synergies in customer group - related products in one sales line detailing different customer groups (e.g. pain) or various products in one detailing
approach (e.g. antibiotics) - bridging, when justified - ...
• Innovative-Commercial-model: achieve maximal commercialization without FTE resourcing - most efficient channel mix without FTE allocation - fast achievement of Cost to sales ratio - ...
portfolio management techniques
1455300/11
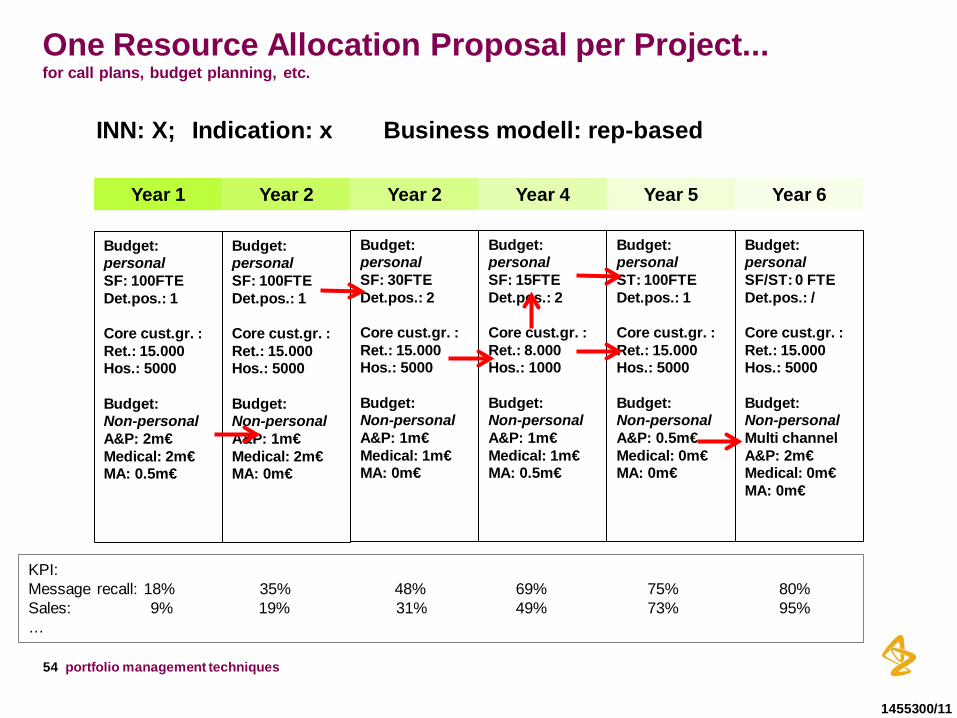
54
One Resource Allocation Proposal per Project... for call plans, budget planning, etc.
Year 1 Year 2 Year 2 Year 4 Year 5 Year 6
Budget: personal SF: 100FTE Det.pos.: 1 Core cust.gr. : Ret.: 15.000 Hos.: 5000 Budget: Non-personal A&P: 2m€ Medical: 2m€ MA: 0.5m€
Budget: personal SF: 100FTE Det.pos.: 1 Core cust.gr. : Ret.: 15.000 Hos.: 5000 Budget: Non-personal A&P: 1m€ Medical: 2m€ MA: 0m€
Budget: personal SF: 30FTE Det.pos.: 2 Core cust.gr. : Ret.: 15.000 Hos.: 5000 Budget: Non-personal A&P: 1m€ Medical: 1m€ MA: 0m€
Budget: personal SF: 15FTE Det.pos.: 2 Core cust.gr. : Ret.: 8.000 Hos.: 1000 Budget: Non-personal A&P: 1m€ Medical: 1m€ MA: 0.5m€
Budget: personal ST: 100FTE Det.pos.: 1 Core cust.gr. : Ret.: 15.000 Hos.: 5000 Budget: Non-personal A&P: 0.5m€ Medical: 0m€ MA: 0m€
Budget: personal SF/ST: 0 FTE Det.pos.: / Core cust.gr. : Ret.: 15.000 Hos.: 5000 Budget: Non-personal Multi channel A&P: 2m€ Medical: 0m€ MA: 0m€
INN: X; Indication: x Business modell: rep-based
KPI: Message recall: 18% 35% 48% 69% 75% 80% Sales: 9% 19% 31% 49% 73% 95% …
portfolio management techniques
1455300/11
| Title of presentation | 00 Month Year (Go Header & Footer to edit this text) 55
The Composite of Resource Allocation – 2. Marketed Products
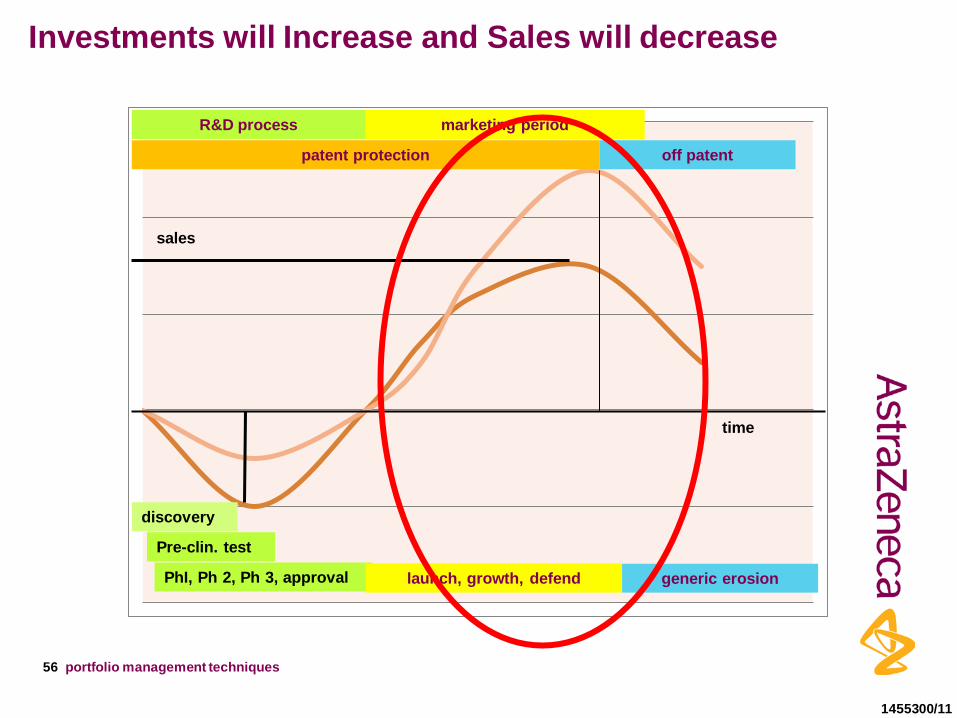
time
Investments will Increase and Sales will decrease
R&D process marketing period
patent protection off patent
discovery
Pre-clin. test
PhI, Ph 2, Ph 3, approval launch, growth, defend generic erosion
portfolio management techniques
1455300/11
56
sales
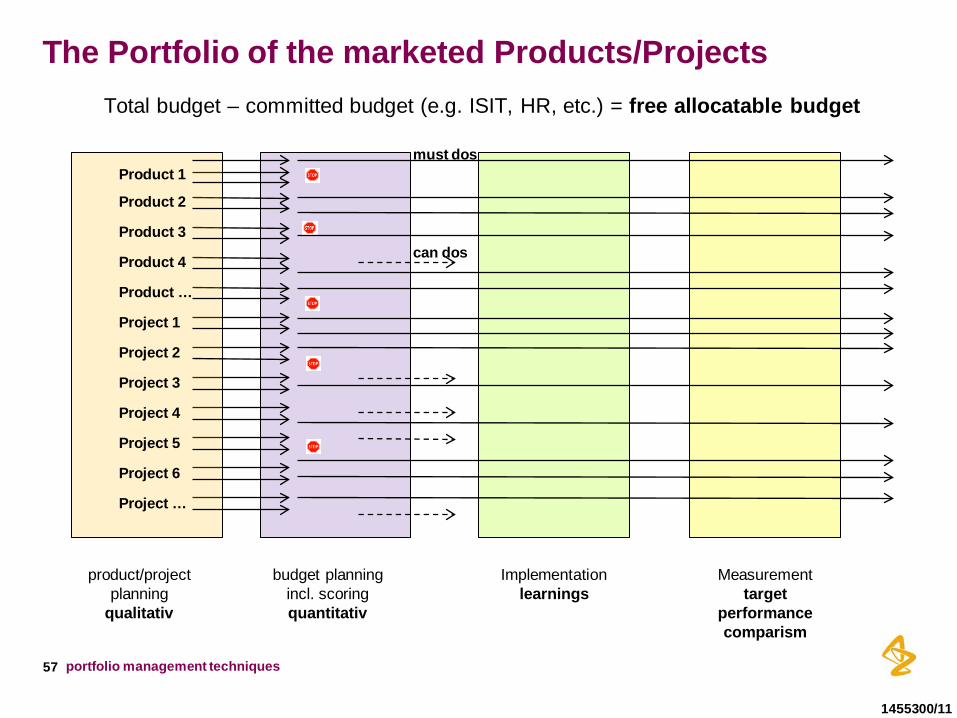
57
The Portfolio of the marketed Products/Projects Total budget – committed budget (e.g. ISIT, HR, etc.) = free allocatable budget
portfolio management techniques
1455300/11
must dos
can dos
Product 1
Product 2
Product 3
Product 4
Product …
Project 1
Project 2
Project 3
Project 4
Project 5
Project 6
Project …
product/project planning
qualitativ
budget planning incl. scoring quantitativ
Implementation learnings
Measurement target
performance comparism
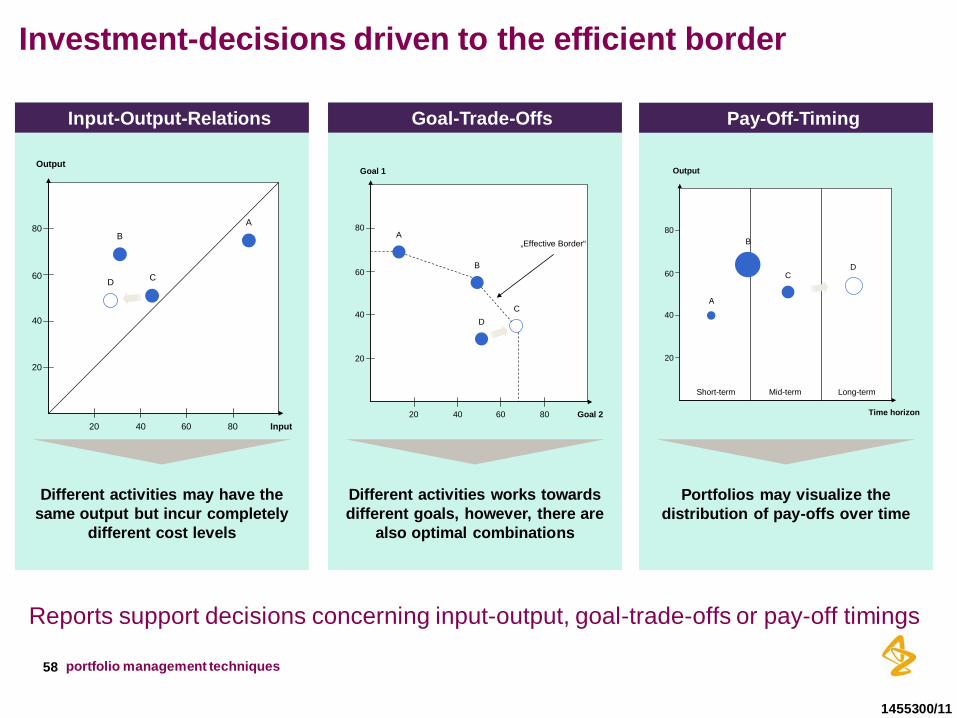
Input-Output-Relations Goal-Trade-Offs Pay-Off-Timing
Different activities may have the same output but incur completely
different cost levels
Different activities works towards different goals, however, there are
also optimal combinations
Portfolios may visualize the distribution of pay-offs over time
20 40 60 80
20
40
60
80
Goal 2
Goal 1
A
B
C
„Effective Border“
D
20 40 60 80
20
40
60
80
Input
Output
CD
BA
20
40
60
80
Time horizon
Output
Short-term Mid-term Long-term
A
B
CD
Reports support decisions concerning input-output, goal-trade-offs or pay-off timings
Investment-decisions driven to the efficient border
1455300/11
58 portfolio management techniques
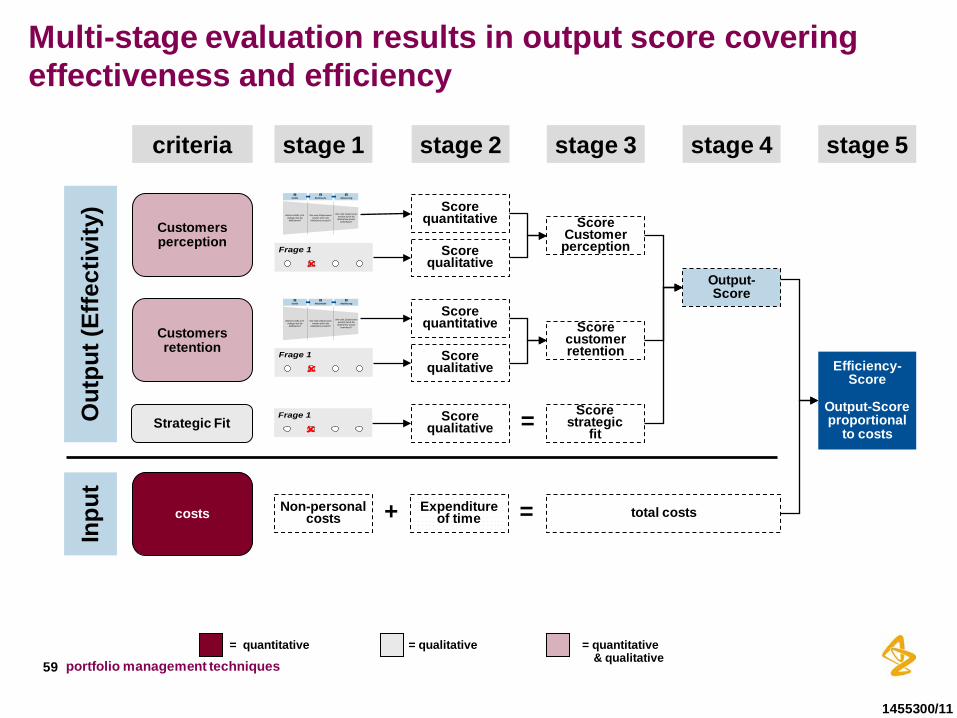
Multi-stage evaluation results in output score covering effectiveness and efficiency
= quantitative = quantitative & qualitative
= qualitative
Score qualitative
Score quantitative
Score qualitative
Score qualitative
Score quantitative
Score strategic
fit
Score customer retention
Score Customer perception
Output- Score
=
stage 5
costs
Inpu
t
Non-personal costs
Expenditure of time + = total costs
Efficiency- Score
Output-Score proportional
to costs
stage 1 stage 2 stage 3 stage 4 criteria
Strategic Fit
Customers retention
Customers perception
Out
put (
Effe
ctiv
ity)
Frage 1
Frage 1
Frage 1
Welche Größe (z.B. Auflage) hat die
Maßnahme?
Wie viele Zielpersonen werden durch die
Maßnahme erreicht?
Wie viele Zielpersonen werden durch die Maßnahme positiv
beeinflusst?
Größe Reichweite Aktivierung1 2 3
Welche Größe (z.B. Auflage) hat die
Maßnahme?
Wie viele Zielpersonen werden durch die
Maßnahme erreicht?
Wie viele Zielpersonen werden durch die Maßnahme positiv
beeinflusst?
Größe Reichweite Aktivierung1 2 3
1455300/11
59 portfolio management techniques
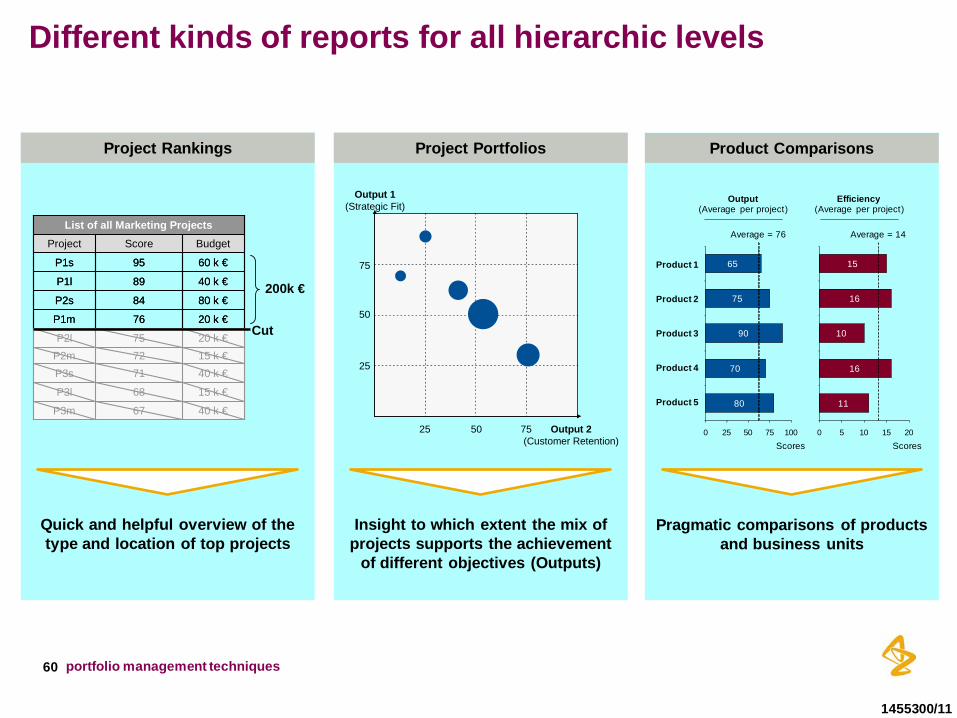
Different kinds of reports for all hierarchic levels
Project Rankings Project Portfolios Product Comparisons
20 k €75P2l
40 k €71P3s15 k €72P2m
80 k €84P2s
40 k €89P1l
60 k €95P1s
40 k €67P3m
15 k €68P3l
20 k €76P1m
BudgetScoreProject
List of all Marketing Projects
20 k €75P2l
40 k €71P3s15 k €72P2m
80 k €84P2s
40 k €89P1l
60 k €95P1s
40 k €67P3m
15 k €68P3l
20 k €76P1m
BudgetScoreProject
List of all Marketing Projects
Cut
200k €
25 50 75
25
50
75
Output 2(Customer Retention)
Output 1(Strategic Fit)
Quick and helpful overview of the type and location of top projects
Insight to which extent the mix of projects supports the achievement
of different objectives (Outputs)
Pragmatic comparisons of products and business units
80
70
90
75
65
0 25 50 75 100
Output ( Average per project )
Efficiency ( Average per project )
Product 1
11
16
10
16
15
0 5 10 15 20 Scores Scores
Average = 76 Average = 14
Product 2
Product 3
Product 4
Product 5
1455300/11
60 portfolio management techniques
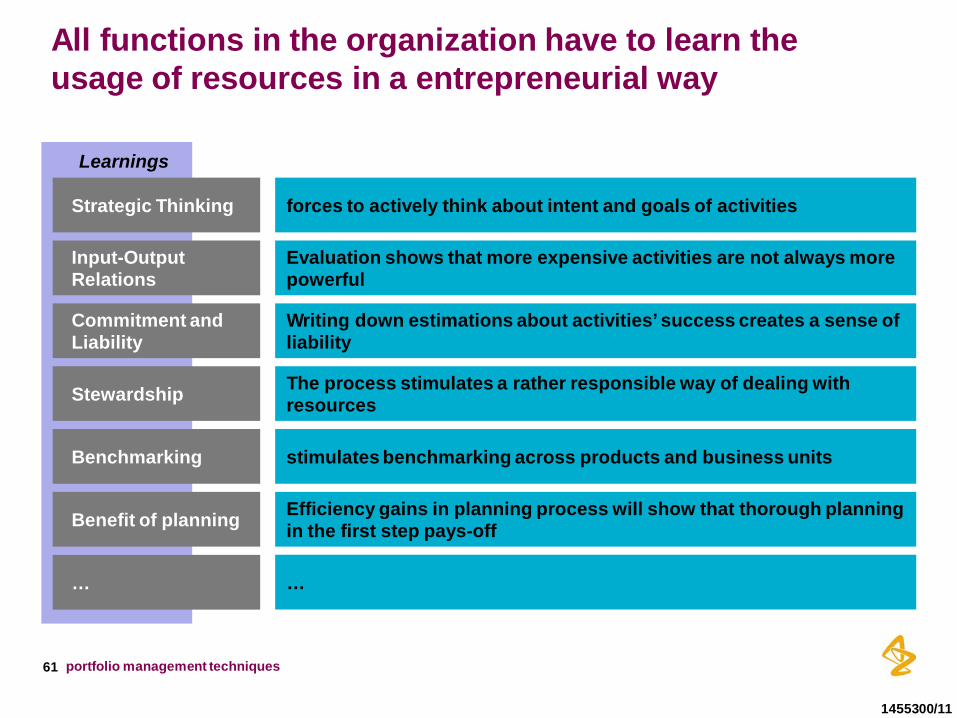
All functions in the organization have to learn the usage of resources in a entrepreneurial way
Learnings
forces to actively think about intent and goals of activities Strategic Thinking
… …
Evaluation shows that more expensive activities are not always more powerful
Input-Output Relations
Writing down estimations about activities’ success creates a sense of liability
Commitment and Liability
The process stimulates a rather responsible way of dealing with resources Stewardship
stimulates benchmarking across products and business units Benchmarking
Efficiency gains in planning process will show that thorough planning in the first step pays-off Benefit of planning
1455300/11
61 portfolio management techniques

| Title of presentation | 00 Month Year (Go Header & Footer to edit this text) 62
Summary
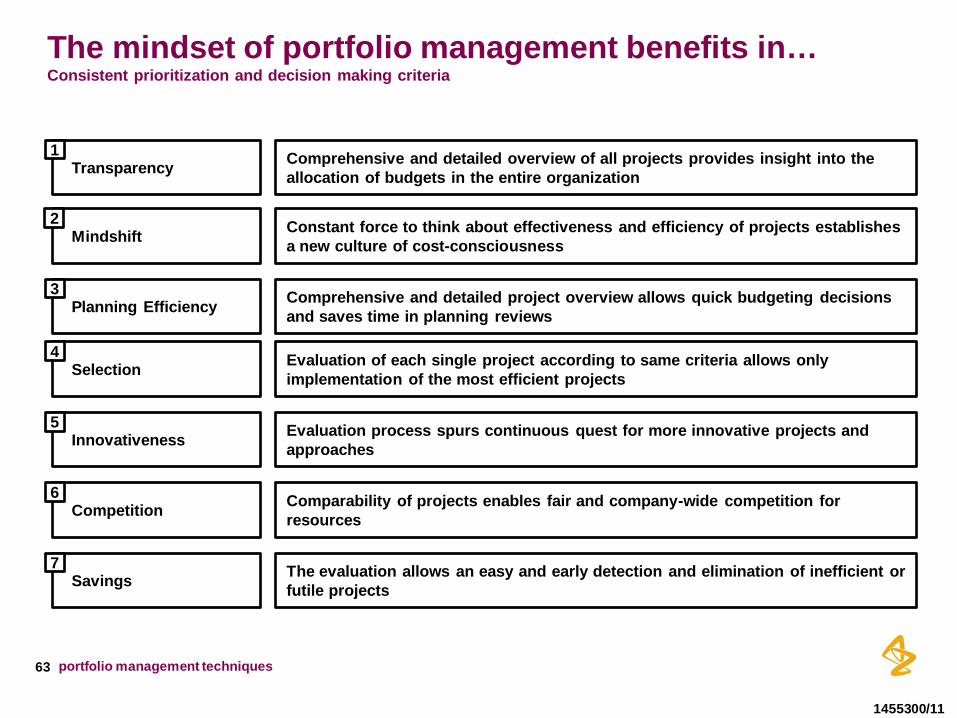
The mindset of portfolio management benefits in… Consistent prioritization and decision making criteria
Comprehensive and detailed overview of all projects provides insight into the allocation of budgets in the entire organization Transparency
1
The evaluation allows an easy and early detection and elimination of inefficient or futile projects Savings
7
Constant force to think about effectiveness and efficiency of projects establishes a new culture of cost-consciousness Mindshift
2
Comprehensive and detailed project overview allows quick budgeting decisions and saves time in planning reviews Planning Efficiency
3
Evaluation of each single project according to same criteria allows only implementation of the most efficient projects Selection
4
Evaluation process spurs continuous quest for more innovative projects and approaches Innovativeness
5
Comparability of projects enables fair and company-wide competition for resources Competition
6
1455300/11
63 portfolio management techniques