Embed Size (px)
Citation preview

2011 National Survey of Syringe Exchange Programs: Summary of Results
Don C. Des Jarlais, Vivian Guardino, Ann Nugent, Kamyar Arasteh,
David PurchaseThis work was funded by amfAR, The Foundation for AIDS Research with support from the Elton John AIDS Foundation (EJAF) and the
Irene Diamond Foundation.

Characteristics of SEPs Participating in BIMC/NASEN SurveysUnited States, 1996-2011
Numbers of 1996 1997 1998 2000 2002 2004 2005 2006 2007 2008 2009 2010 2011
SEPs known to NASEN 101 113 131 154 148 174 166 188 186 184 201 194 197
SEPs Participating in survey (%) 87
(86%)100
(88%)110
(84%)127
(82%)126
(85%)109
(63%)118
(71%)150
(80%)131
(70%)123
(67%)149
(74%)149
(77%)144
(73%)
Cities with SEPs participating 69 78 77 98 97 88 90 113 100 98 115 119 117
States with SEPs participating * 29 33 33 36 32 32 29 32 31 30 33 33 32
Syringes exchanged (millions) 13.9 17.5 19.4 22.6 24.9 24.0 22.5 27.6 29.5 29.1 33.1 35.5 36.9
Total of SEP budgets ($, millions) 7.3 8.4 8.6 12.0 13.0 11.6 14.5 17.4 19.6 21.3 21.6 21.7 19.3
Total of SEP budgets in 2011-adjusted $ (millions) (adjusted using a constant 3% annual inflation rate)
10.6 11.9 12.0 16.0 16.5 14.0 17.1 20.0 22.0 23.2 22.9 22.4 19.3
Public funding as % of total SEP budgets 62% 67% 69% 74% 67% 76% 74% 79% 73% 79% 80% 82% 84%
* This category includes the District of Columbia and/or Puerto Rico.
Number of syringes exchanged and Total SEP budgets 1996-2011
1996 1997 1998 2000 2002 2004 2005 2006 2007 2008 2009 2010 20110
5
10
15
20
25
30
35
40
Syringes exchanged (millions) Total of SEP budgets in 2010-adjusted $ (millions)*
*adjusted using a constant 3% annual inflation rate

1996 1997 1998 2000 2002 2004 2005 2006 2007 2008 2009 2010 20110
50
100
150
200
SEPs known to NASEN and cities with SEPs participat-ing
SEPs Known to NASEN Cities with SEPs participating

National Survey of Syringe Exchange Programs Methodology
2010 Survey• 194 SEPs contacted in first quarter 2010• 149 SEPs (77%) submitted completed
surveys by early summer.2011 Survey
• 197 SEPs contacted in second quarter 2011• 144 SEPs (73%) submitted completed
surveys by late summer.

SEP Budget Dollars2010 2011
Total $$$ $21,674,495 $19,345,206 City Gov $ $6,021,484 $5,157,416
County Gov $ $2,328,563 $1,683,229
State Gov $ $9,336,118 $8,793,482
Federal Gov $ ------------ $637,518
Foundation $ $2,127,053 $2,081,362
Individual Donations $833,686 $584,780
Out-of-pocket $ $29,830 $28,145
NASEN $ $67,116 $36,750
CBO Donation $ $27,410 $53,944
Corporate Donation $ $57,350 $82,464
Other $ $563,906 $202,841

Budget Status 2010 vs. 2011
Increased Budget
Decreased Budget
Same Budget Did Not Answer0
10
20
30
40
50
60
70
40
5447
8
38 37
60
9
2010
2011
Num
ber
of S
EPs

SEPs That Participated in 2010 & 2011 Surveys
Total Budget $$
2010 $17,451,562 (as reported by 110 SEPs)
2011 $17,866,457 (as reported by 110 SEPs)

Steroids
Cocaine mixed w/other drug NOT heroin
Other amphetamine (uppers/Dexedrine)
HIV medications and/or insulin
Other
Heroin mixed w/other drug (not cocaine)
Downers (benzodiazepines, tranquilizers)
Other opiates (OxyContin, Percodan, etc)
Methamphetamine (crystal meth/ice/crank)
Heroin and cocaine
Cocaine by itself
Heroin by itself
0 10 20 30 40 50 60 70 80
1
2
2
2
3
6
7
16
17
18
18
68
Percent of NSEP Participants Injecting the following Drugs in 2011*
Percent of SEP Participants*Weighted by number of syringes distributed

Type of Exchange Conducted by SEPs in 2011Variation No. (%)
Allowed receipt of more syringes than brought in 123 (85%)
Used A Distribution Model 84 (58%)
Used Start-up Packs 81 (56 %)
Used A Minimum 48 (33%)
Had a Limit on Syringes Exchanged 44 (31%)

Number of Syringes Distributed by Syringe Exchange Programs (SEPs), by Program Size:
2010 & 2011SEP Size(Syringes
Distributed)
No. of
SEPs2010
Total syringes exchanged
2010
No. of
SEPs2011
Total syringes exchanged
2011
Small(< 10,000) 22
92,316(0.3%) 19
54,709(0.1%)
Medium(10,000-55,000) 25
714,320(2.0%) 33
965,472(2.6%)
Large(55,001-499,999) 75
12,576,461(35.4%) 72
13,472,727(36.5%)
Very Large(500,000) 18
22,127,202(62.3%) 18
22,383,837(60.7%)
Total 140 35,510,299 142 36,876,745
* In 2010, nine programs responding to the survey did not track the number of syringes exchanged, in 2011 two programs did not indicate the number of syringes they distributed.

Returned/Collected Syringes in 2010 and 2011
2010 2011
29,549,25830,837,933

Syringes Exchanged By Programs ThatParticipated in Both 2010 & 2011 Surveys
2010 (n=110*)• 32,947,282
syringes distributed
• 27,204,851 syringes collected
2011 (n=110*)• 34,447,074
syringes distributed
• 28,983,403 syringes collected
*Only programs which reported the number of syringes distributed in both 2010 and 2011 are included in the calculations above . In 2010, seven programs in this group did not report the number of syringes they collected , the number was eight in 2011.

Secondary Exchange & Methods of Encouragement Used by SEPs in 2011
Secondary Exchange No. (%) SEPs allowing secondary exchange 130 ( 90%) SEPs encouraging secondary exchange 116 (81%)Methods of Encouragement Talked about it 109 (76%) Gave extra supplies 103 (72%) Provided sharps containers 96 (67%) Had no limit on syringes exchanged 83 (58%) Peer education 61 (42%) Enrolled people receiving syringes from secondary exchange
23 (16%)
Gift certificates/Other incentives 14 ( 10%)

SEPs Providing On-Site Medical Services
•2010Number of SEPs=65
•2011Number of SEPs=75

Overdose Rescue & Drug Treatment Medications Provided by SEPs in 2010 & 2011
Buprenorphine
Suboxone
Naloxone
0% 10% 20% 30% 40% 50%
5%
9%
44%
8%
10%
47%
20112010
Percent of SEPs

Additional Program Characteristics in 2010 & 2011
2010 No. (%)
2011 No. (%)
Did not operate for two months or more 6 (4%) 8 (6%)
Any full-time (paid) staff 95 (64%) 83 (58%)
Operated by city, county or state health department
35 (23%) 34 (24%)
501-C3 Status 116 (78%) 100 (69%)

Additional Program Characteristics in 2010 & 2011
2010 No. %)
2011 No. (%)
Operated a Delivery Service 69 (46%) 77 (53%)
Was involved in formal external evaluation
23 (15%) 20 (14%)

Problems SEPs Encountered in 2010 & 2011
Police harassment of staff / program
Other
Any type of problem due to gentrification?
Retaining participants
Operations disrupted by government or law enforcement
Legal status
Police harassment of participants (at/near site)
Lack of community support
Reaching or recruiting participants
Lack of outreach
Staff burnout
Lack of political support
Staff shortage
Lack of resources/Lack of funding
0% 10% 20% 30% 40% 50% 60% 70% 80%
5%
6%
9%
11%
9%
8%
14%
15%
24%
20%
24%
21%
44%
69%
6%
6%
9%
13%
13%
15%
19%
22%
22%
24%
28%
30%
56%
75%
2011 2010
Percentage of SEPs

Quality of Relationship Between SEPs and Police as Reported by SEPs in 2010 & 2011
Quality of Relationship
2010No. (%)
2011No. (%)
Very Good 35 (23%) 29 (20%)Somewhat good 55 (37%) 42 (29%)Neutral 44 (30%) 50 (35%)Somewhat poor 6 (4%) 5 (3%)Very poor 1 (1%) 1 (1%)Non-existent 8 (5%) 17 (12%)

Strategies SEPs Used in 2011 to Gain Law Enforcement Support
Strategy # of SEP’s %
Meetings 69 48%Trainings 38 26%
Officer Liaisons 38 26%Coalition work w/other public health activists 35 24%
None 32 22%Invitation to exchange 26 18%Didn’t have capacity/resources for strategy 20 14%Other 16 11%Street demonstrations 4 3%

Federal Funding in 2010 and 2011SEPs … 2010 2011
Applied for federal funding
20(13%)
19(13%)
Received federal funding20
(13%)14
(10%)

Programs Used Federal Funding in 2010 and 2011 to
2010 2011Maintain Present Services Only 9 (45%) 7 (50%)
Expand Present Services 7 (35%) 1 (7%)Add New Services 2 (10%) 2 (14%)Maintain/Expand Present Services
1 (5%) 2 (14%)
Didn’t Answer 1 (5%) 2 (14%)

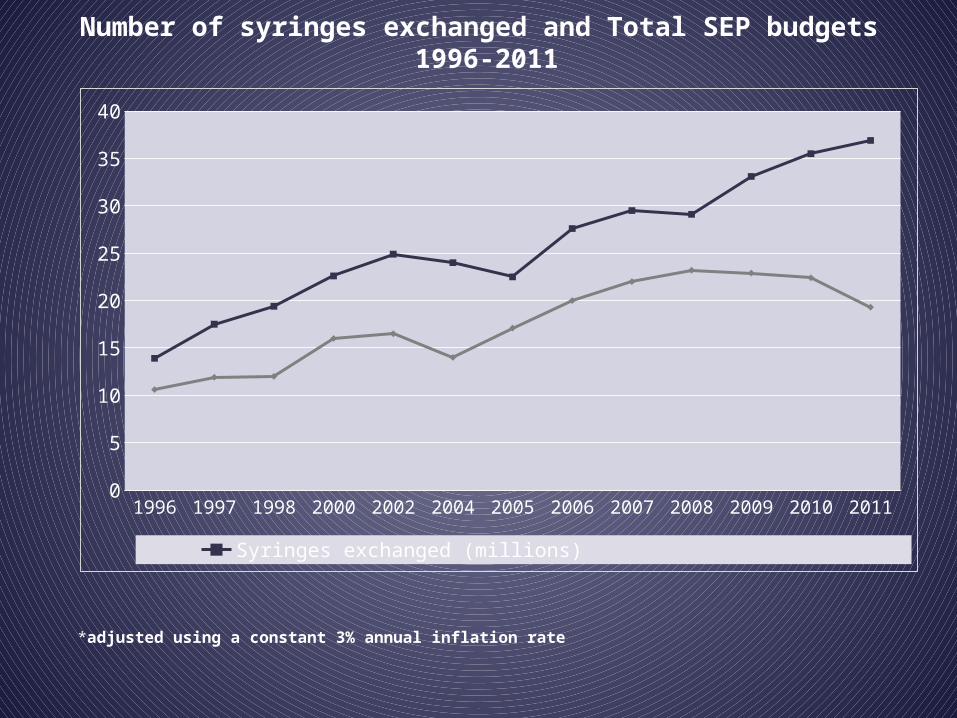
Naloxone Services and Fundingat SEPs in 2011
# of SEP’s
%
Program distributes Naloxone 68 47%Funding source for programs providing Naloxone
Regular budget item 35 51%Special funding 33 49%
Type of Naloxone Provided by SEPs in 2011
11.8%
67.6%
20.6%
Intranasal NaloxoneInjectable NaloxoneBoth

Very Special Thanks to:
• Alisa Solberg
• Jill Westermark
• Kay Borba
for their generous help contacting SEPs and encouraging survey submissions.