Embed Size (px)
Citation preview

The Quadruple Aim: Working Together, Achieving Success
2011 Military Health System Conference
Getting Enrollment Right: Perspectives From MHS Health Care Systems
24 January 2011CAPT Maureen Padden MD MPH FAAFP
2011 Military Health System Conference
The Quadruple Aim: Working Together, Achieving Success
Navy Medicine

Report Documentation Page Form ApprovedOMB No. 0704-0188
Public reporting burden for the collection of information is estimated to average 1 hour per response, including the time for reviewing instructions, searching existing data sources, gathering andmaintaining the data needed, and completing and reviewing the collection of information. Send comments regarding this burden estimate or any other aspect of this collection of information,including suggestions for reducing this burden, to Washington Headquarters Services, Directorate for Information Operations and Reports, 1215 Jefferson Davis Highway, Suite 1204, ArlingtonVA 22202-4302. Respondents should be aware that notwithstanding any other provision of law, no person shall be subject to a penalty for failing to comply with a collection of information if itdoes not display a currently valid OMB control number.
1. REPORT DATE 24 JAN 2011 2. REPORT TYPE
3. DATES COVERED 00-00-2011 to 00-00-2011
4. TITLE AND SUBTITLE Getting Enrollment Right: Perspectives From MHS Health Care Systems
5a. CONTRACT NUMBER
5b. GRANT NUMBER
5c. PROGRAM ELEMENT NUMBER
6. AUTHOR(S) 5d. PROJECT NUMBER
5e. TASK NUMBER
5f. WORK UNIT NUMBER
7. PERFORMING ORGANIZATION NAME(S) AND ADDRESS(ES) Navy Medicine ,Bureau of Medicine & Surgery,2300 E Street NW,Washington,DC,20372-5300
8. PERFORMING ORGANIZATIONREPORT NUMBER
9. SPONSORING/MONITORING AGENCY NAME(S) AND ADDRESS(ES) 10. SPONSOR/MONITOR’S ACRONYM(S)
11. SPONSOR/MONITOR’S REPORT NUMBER(S)
12. DISTRIBUTION/AVAILABILITY STATEMENT Approved for public release; distribution unlimited
13. SUPPLEMENTARY NOTES presented at the 2011 Military Health System Conference, January 24-27, National Harbor, Maryland
14. ABSTRACT
15. SUBJECT TERMS
16. SECURITY CLASSIFICATION OF: 17. LIMITATION OF ABSTRACT Same as
Report (SAR)
18. NUMBEROF PAGES
56
19a. NAME OFRESPONSIBLE PERSON
a. REPORT unclassified
b. ABSTRACT unclassified
c. THIS PAGE unclassified
Standard Form 298 (Rev. 8-98) Prescribed by ANSI Std Z39-18

2011 MHS Conference
Define enrollment and discuss its historical use in primary care
Compare and contrast enrollment in the Patient Centered Medical Home (PCMH)
Explore the impact on quality and cost if we don’t get enrollment “right”
Consider one basic approach to enrollment in search of improving access and performance
2
Getting enrollment right

2011 MHS Conference
Enrollment and primary care
Enrollment versus empanelment HA policy 99-033 (Dec 99) “PCM by name” HA policy 09-015 (Sep 09) “PCMH policy” Why enroll?
– Accountability and tracking– Improve health outcomes through continuity– Improve satisfaction: patients and providers– To achieve access/continuity success—panel
size must match demand against availability3

2011 MHS Conference
Why define a panel?
Patient satisfaction Predicts workload for each provider on team Predicts demand for services (not just visits) Helps in evaluating provider performance
against peers Proper planning should improve continuity—
leading to improved health outcomes
4

2011 MHS Conference
Enrollment in the medical home
PCMH evolves large “clinic” to micro-practices Adjustments for other duties outside face to
face continuity practice Successful planning will have impact on:
– PCMBN continuity– Team continuity– ER utilization and other leaks of primary care– Performance on quality metrics– Patient satisfaction
5

2011 MHS Conference
Enrollment in the medical home
Setting the “number” isn’t the entire solution Establishing accountability and business
rules is equally important– Asynchronous messaging / T-cons– E-visits– Nurse and team based care
Measuring performance and providing feedback to providers is critical
6

2011 MHS Conference
The Quadruple Aim
7
ReadinessEnsuring that the total military
force is medically ready to deploy and that the medical
force is ready to deliver health care anytime, anywhere in support of the full range of
military operations, including humanitarian missions.
Population Health
Reducing the generators of ill health by encouraging healthy behaviors and
decreasing the likelihood of illness through focused
prevention and the development of increased
resilience.
Experience of Care
Providing a care experience that is patient and family
centered, compassionate, convenient, equitable, safe and always of the highest
quality.
Per Capita CostCreating value by focusing
on quality, eliminating waste, and reducing unwarranted variation; considering the
total cost of care over time, not just the cost of an
individual health care activity.
2011 MHS Conference
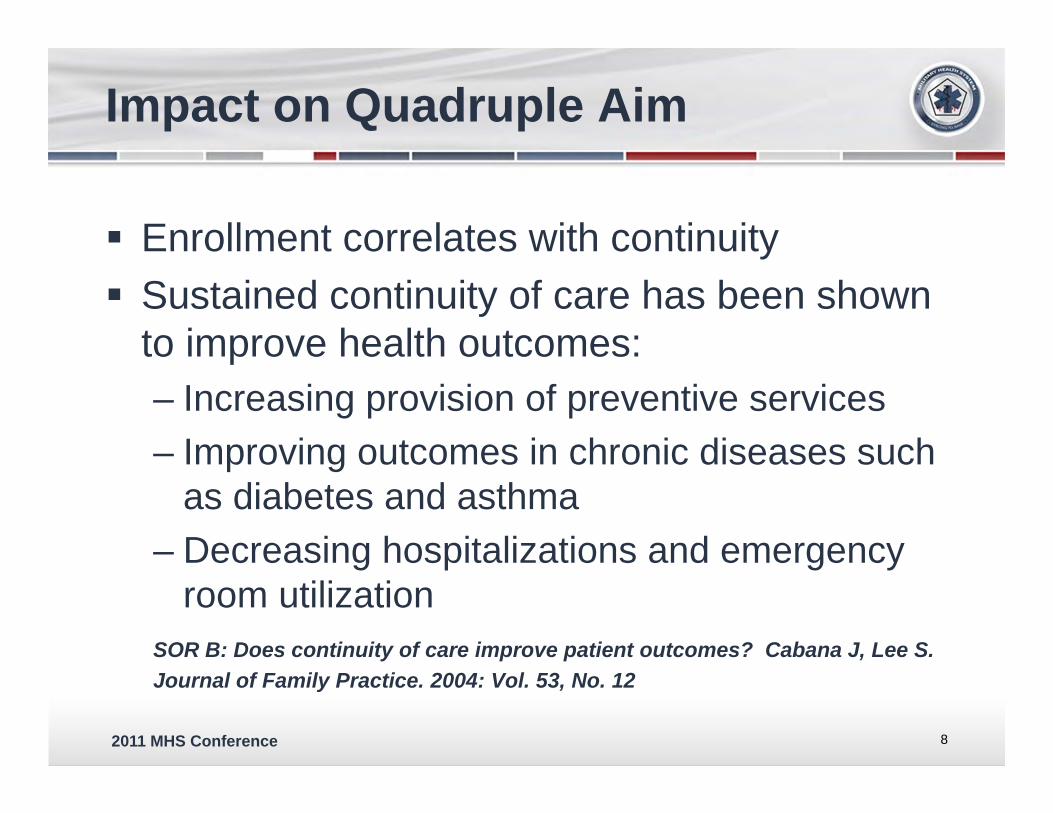
Impact on Quadruple Aim
Enrollment correlates with continuity Sustained continuity of care has been shown
to improve health outcomes:– Increasing provision of preventive services– Improving outcomes in chronic diseases such
as diabetes and asthma – Decreasing hospitalizations and emergency
room utilization SOR B: Does continuity of care improve patient outcomes? Cabana J, Lee S. Journal of Family Practice. 2004: Vol. 53, No. 12
8
2011 MHS Conference
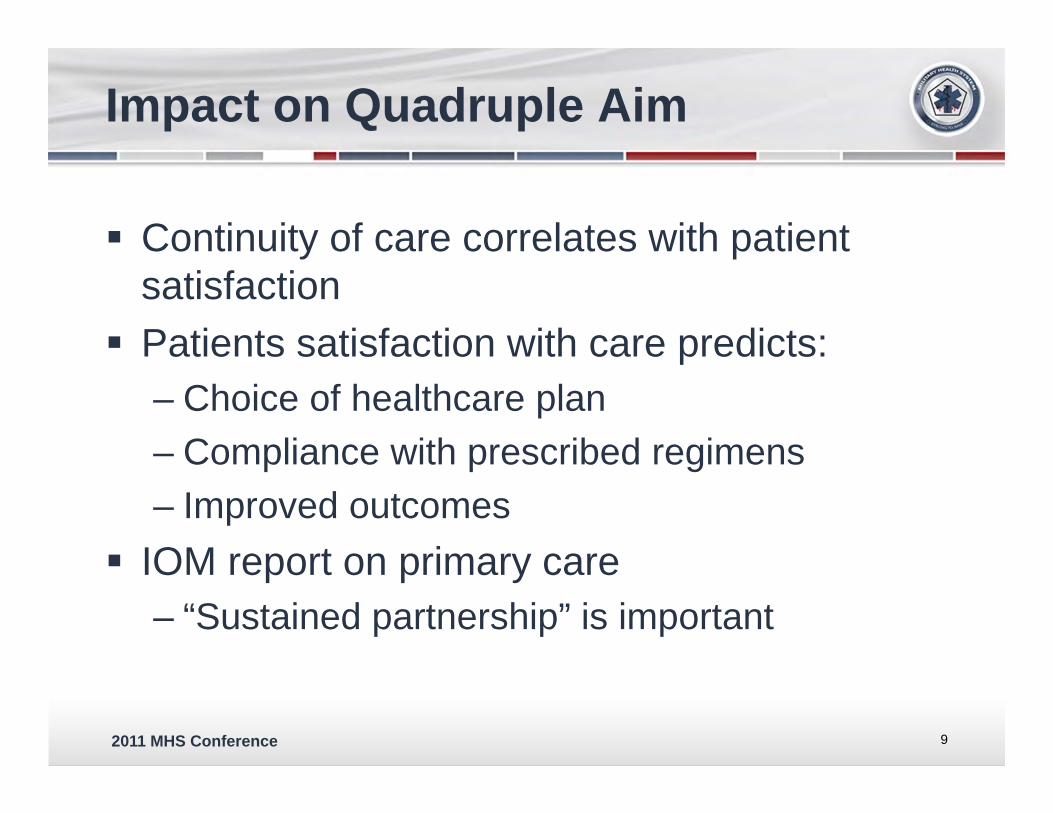
Impact on Quadruple Aim
Continuity of care correlates with patient satisfaction
Patients satisfaction with care predicts:– Choice of healthcare plan– Compliance with prescribed regimens– Improved outcomes
IOM report on primary care – “Sustained partnership” is important
9

2011 MHS Conference 10
Outcomes of Implementing Patient-Centered Medical Home Interventions:
A Review of the Evidence From Prospective Evaluation Studies in the United States
Updated November 16, 2010Kevin Grumbach, MD, Paul Grundy, MD, MPH
2011 MHS Conference
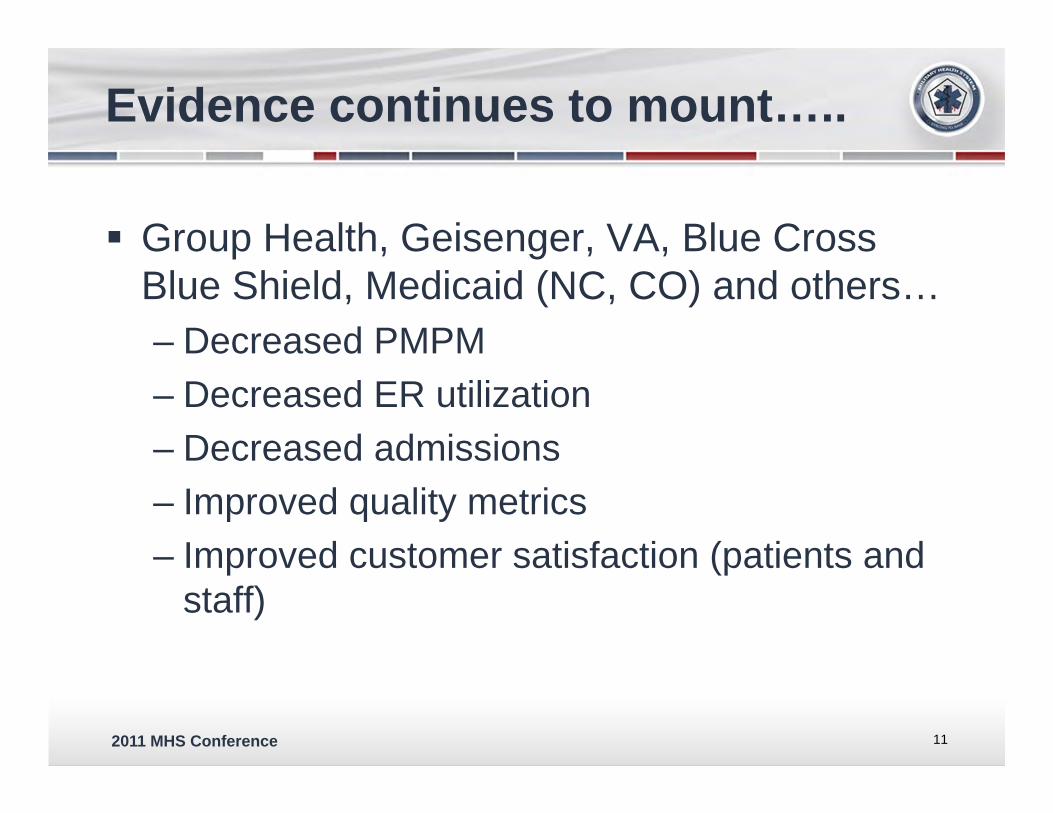
Evidence continues to mount…..
Group Health, Geisenger, VA, Blue Cross Blue Shield, Medicaid (NC, CO) and others… – Decreased PMPM– Decreased ER utilization– Decreased admissions– Improved quality metrics– Improved customer satisfaction (patients and
staff)
11

2011 MHS Conference
Building a Successful Enrollment Capacity Model
12

2011 MHS Conference
Information to gather
What is the current enrollment? Provider staffing and specialty mix? What will micro-practices (teams) look like? What duties interrupt continuity practice? Examine clinic templates; available time Historical demand for care from patients Case mix of patients? Chronic disease burden Special populations (OB, infant, must-sees)
13

2011 MHS Conference
Step 1: Determine the C-FTE
Determine each providers clinical full time equivalent (c-FTE)
Enrollment for 1.0 FTE in Navy = 1100-1300 1.0 FTE is full time provider seeing clinic
each day no other duties Others will need deductions based on time
away from continuity practice Graduate Medical Education enrollment
capacity models include added complexities
14
2011 MHS Conference
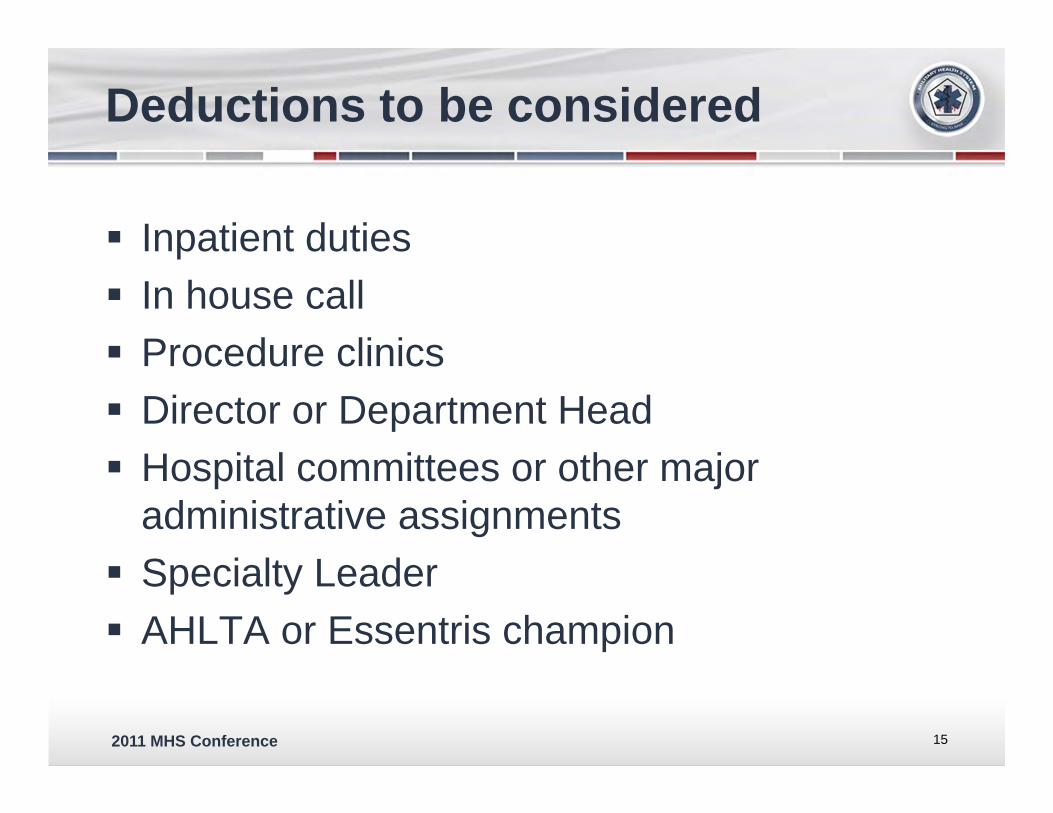
Deductions to be considered
Inpatient duties In house call Procedure clinics Director or Department Head Hospital committees or other major
administrative assignments Specialty Leader AHLTA or Essentris champion
15

2011 MHS Conference
Provider example
Doctor Smith– Family Physician– 1 of 10 providers that
covers inpatient– Call 1:10 nights
(phone)– Procedures one half
day week– Department Head
Deduction 1.0 FTE
Dept Head - 0.3
Inpatient - 0.1
Call - 0.0
Procedures - 0.1
C-FTE= 0.5
16
C-FTE should correlate to enrollment
2011 MHS Conference
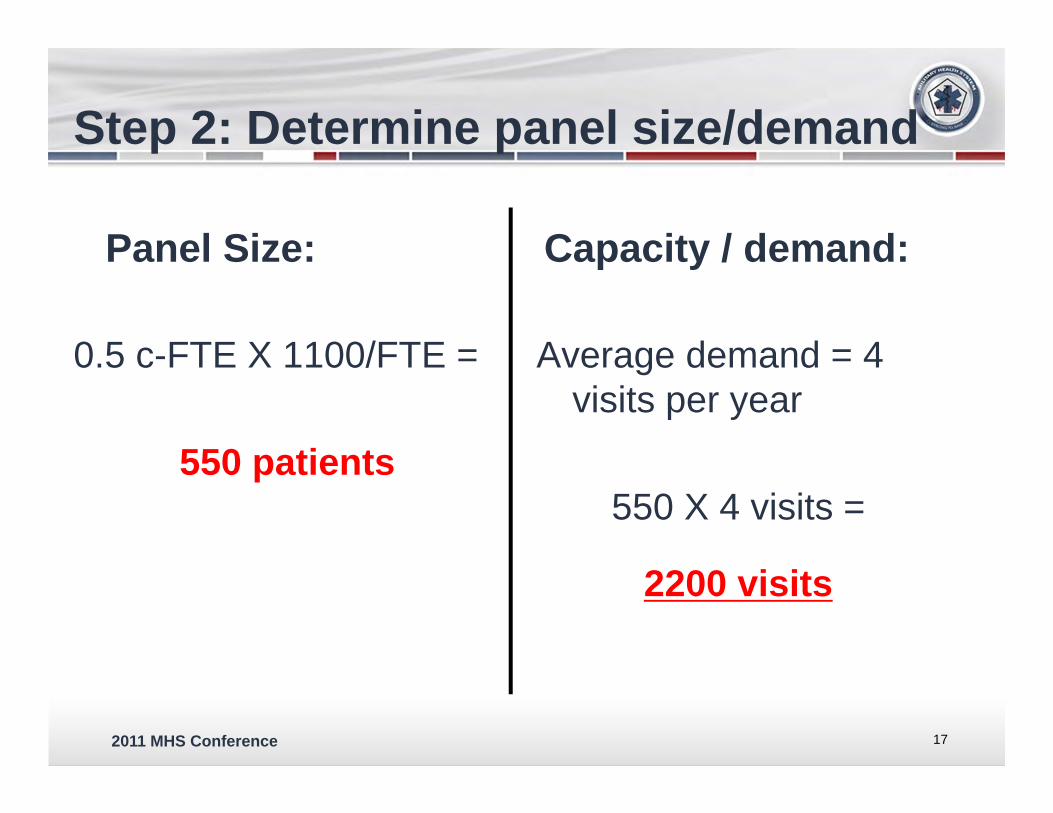
Step 2: Determine panel size/demand
Panel Size:
0.5 c-FTE X 1100/FTE =
550 patients
Capacity / demand:
Average demand = 4 visits per year
550 X 4 visits =
2200 visits
17
2011 MHS Conference
Will Doctor Smith be able to support his patient’s demands?
How can you determine?
18
2011 MHS Conference
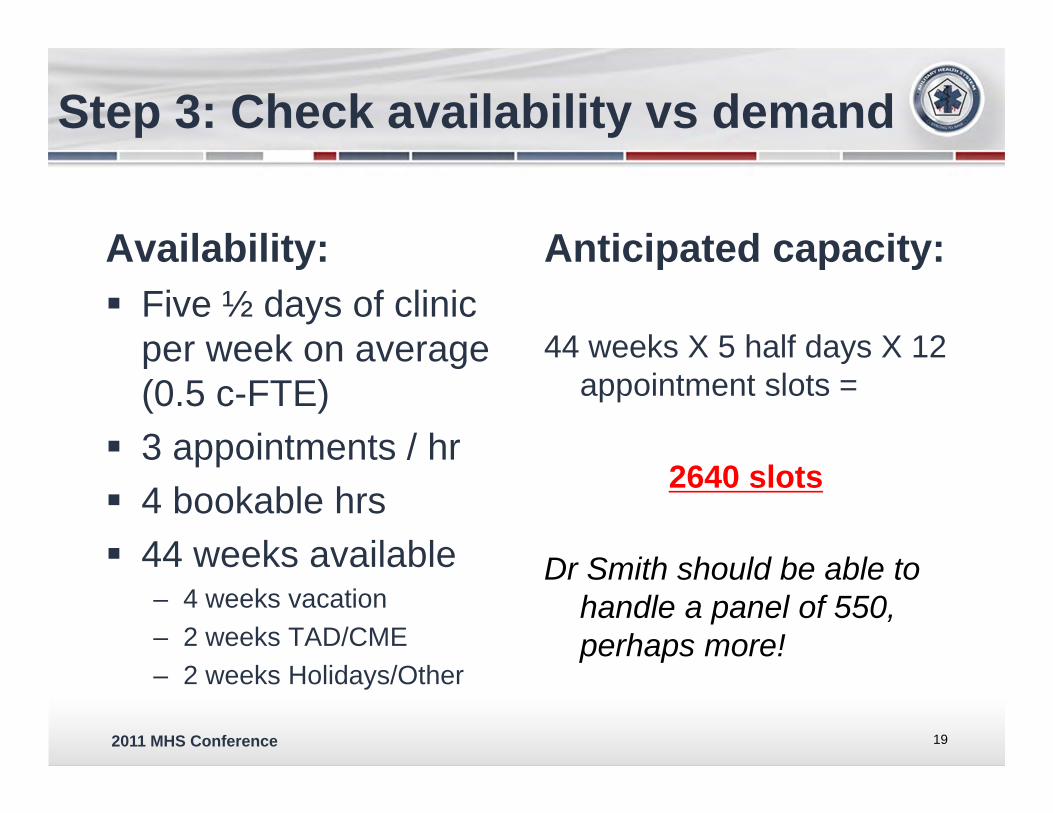
Step 3: Check availability vs demand
Availability: Five ½ days of clinic
per week on average (0.5 c-FTE)
3 appointments / hr 4 bookable hrs 44 weeks available
– 4 weeks vacation– 2 weeks TAD/CME– 2 weeks Holidays/Other
Anticipated capacity:
44 weeks X 5 half days X 12 appointment slots =
2640 slots
Dr Smith should be able to handle a panel of 550, perhaps more!
19
2011 MHS Conference
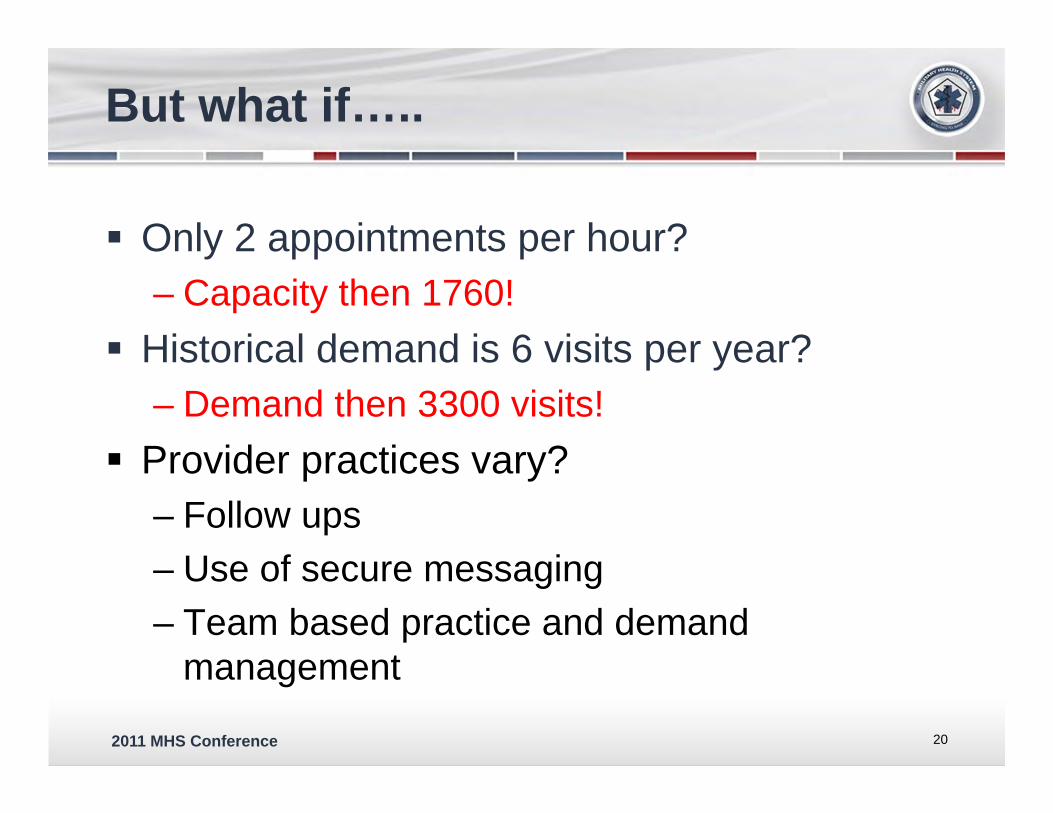
But what if…..
Only 2 appointments per hour? – Capacity then 1760!
Historical demand is 6 visits per year?– Demand then 3300 visits!
Provider practices vary?– Follow ups– Use of secure messaging– Team based practice and demand
management
20

2011 MHS Conference
Building the team…
Provider Deductions C-FTE 1100 / FTE
1200 / FTE
1300 / FTE
Dr Smith 0.3 DH; 0.1 IP; 0.1 PR 0.5 550 600 650
Dr Evans 0.1 IP; 0.1 PR; 0.1 AC; 0.1 TL 0.6 660 720 780
FNP Rogers None 1.0 1100 1200 1300
PA Willow None 1.0 1100 1200 1300
3.1 3410 3720 4030
21
DH=Department Head; IP=Inpatient coverage; PR= procedures; AC=AHLTA champion; TL: Team leader

2011 MHS Conference
Enrollment adjustments
If your current enrollment is:– Higher than enrollment capacity model
• Amortize proportionally across panels• Open up enrollment if backlog cleared
– Lower than enrollment capacity model• Close enrollment• Allow drift down• Consider additional hires if space, staff• Move to another Medical Home or Clinic?
22

2011 MHS Conference
For example
Practice of 10 providers C-FTE = 8.7 after deductions = 9,570
enrollment capacity at 1,100 / FTE level Current enrollment:
– 6,000 Tricare prime enrollees– 4,000 must sees (students)
The practice is currently over enrolled by 430 Close enrollment and hold. Amortize surplus
across all providers based on their c-FTE23

2011 MHS Conference
Same practice….
Recall that the enrollment capacity is 9,570 Change current enrollment to:
– 3,500 Tricare prime– 5,000 must sees (students)
Under enrolled by 1,170 (12%) Fill each panel to roughly 88% of capacity Ensure enrollment is open Consider incremental openings to optimize
enrollment across ALL panels24

2011 MHS Conference
Common Pitfalls Affecting Success
25

2011 MHS Conference
“MUST SEES” INCLUDING STUDENTS, FOREIGN
NATIONALS, ETC MUST BE INCLUDED IN ENROLLMENT
CAPACITY MODELS TO SUCCEED AT ACCESS AND
CONTINUITY!
Pitfall #1
26

2011 MHS Conference
ANALYZE HOW MANY NON ENROLLED PATIENTS YOU
ARE SEEING THAT YOU SHOULD NOT BE (STD,
NETWORK) AND CONSIDER ENROLLING THEM
Pitfall #2
27
2011 MHS Conference
HIRING OCO BACKFILLS TO COVER DEPLOYED
PERSONNEL AND THEN ENROLLING PATIENTS TO THEM…..USE THEM LIKE
LOCUM TENEMS COVERAGE
Pitfall #3
28

2011 MHS Conference
ENROLLING PCM’S AT ONE SITE TO THEIR MAXIMUM
AVAILABILITY THEN USING THEM AT MULTIPLE CLINICS IN LOCAL AREA ALTERING
THEIR AVAILABILITY TO CONTINUITY PRACTICE
Pitfall #4
29

2011 MHS Conference
Final Step: Execute!
Planning versus execution Confounding variables to be addressed:
– Age and gender mix– Chronic Disease burden– Special populations (OB, infants)– Does actual practice = model assumptions?– Business rules– Team based practice?– Provider behaviors?
30

The Quadruple Aim: Working Together, Achieving Success
2011 Military Health System Conference
Getting Enrollment Right
25 January 2011COL (RET.) Ken Canestrini, MSC, USA
2011 Military Health System Conference
The Quadruple Aim: Working Together, Achieving Success
Department of the Army Medical Department
The Quadruple Aim: Working Together, Achieving Success
2011 Military Health System Conference
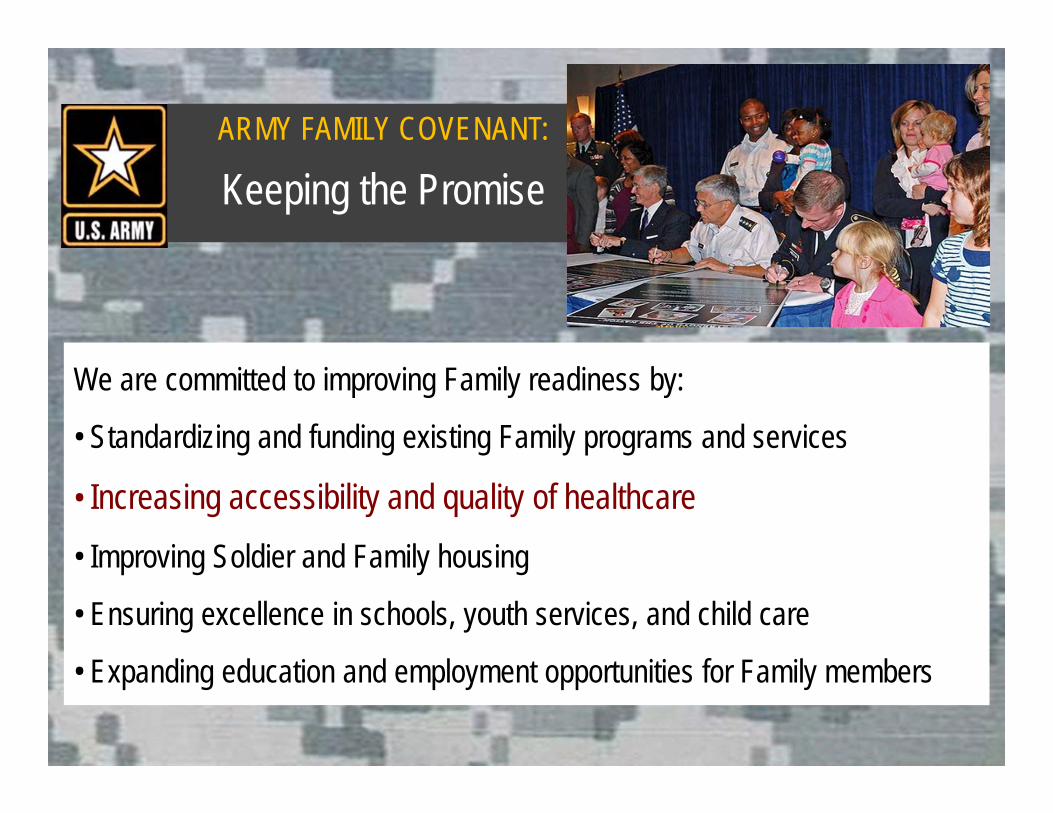
We are committed to improving Family readiness by:
• Standardizing and funding existing Family programs and services
• Increasing accessibility and quality of healthcare • Improving Soldier and Family housing
• Ensuring excellence in schools, youth services, and child care
• Expanding education and employment opportunities for Family members
ARMY FAMILY COVENANT:
Keeping the Promise

2011 MHS Conference
TSG Blog comments:– Access is horrible– Access at MTFs seems to be getting worse– Told that the books are full/closed and she should
just keep calling back
But……
August 2008 Army has 900K additional Enrollment Capacity
Reality is?
Slide 33 of 25
2011 MHS Conference
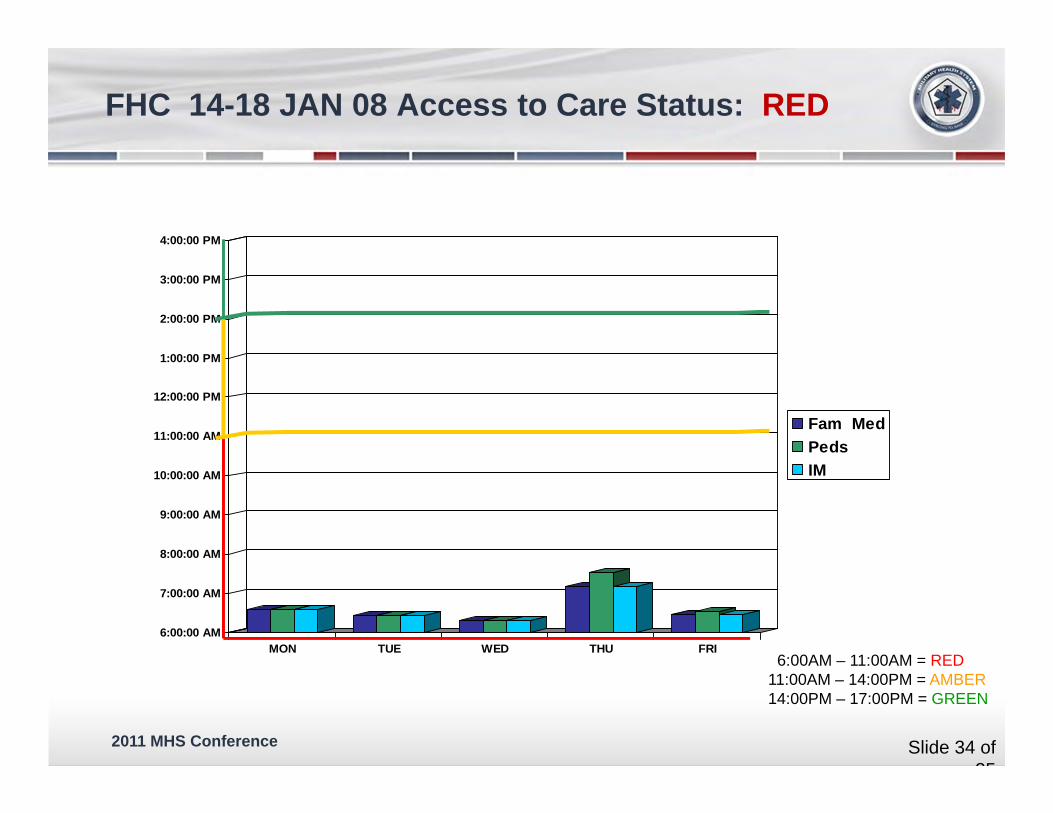
6:00:00 AM
7:00:00 AM
8:00:00 AM
9:00:00 AM
10:00:00 AM
11:00:00 AM
12:00:00 PM
1:00:00 PM
2:00:00 PM
3:00:00 PM
4:00:00 PM
MON TUE WED THU FRI
Fam MedPedsIM
6:00AM – 11:00AM = RED11:00AM – 14:00PM = AMBER14:00PM – 17:00PM = GREEN
FHC 14-18 JAN 08 Access to Care Status: RED
Slide 34 of 25
2011 MHS Conference
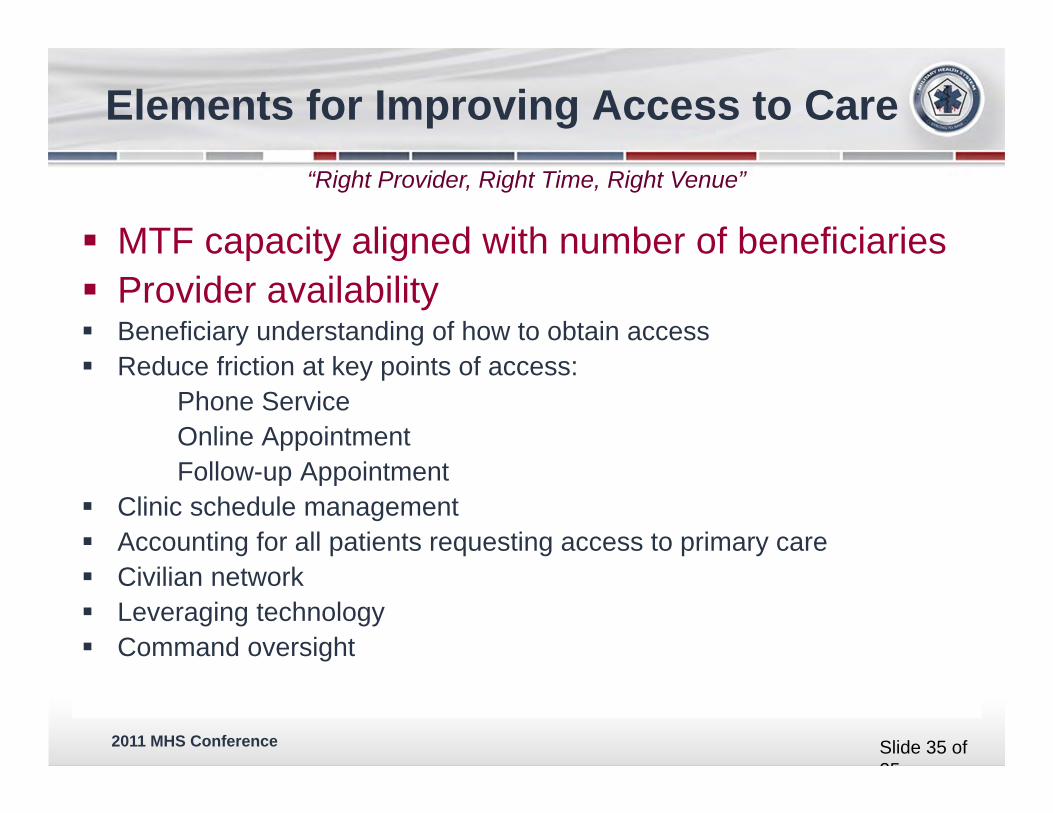
MTF capacity aligned with number of beneficiaries Provider availability Beneficiary understanding of how to obtain access Reduce friction at key points of access:
Phone ServiceOnline AppointmentFollow-up Appointment
Clinic schedule management Accounting for all patients requesting access to primary care Civilian network Leveraging technology Command oversight
“Right Provider, Right Time, Right Venue”
Elements for Improving Access to Care
Slide 35 of 25
2011 MHS Conference
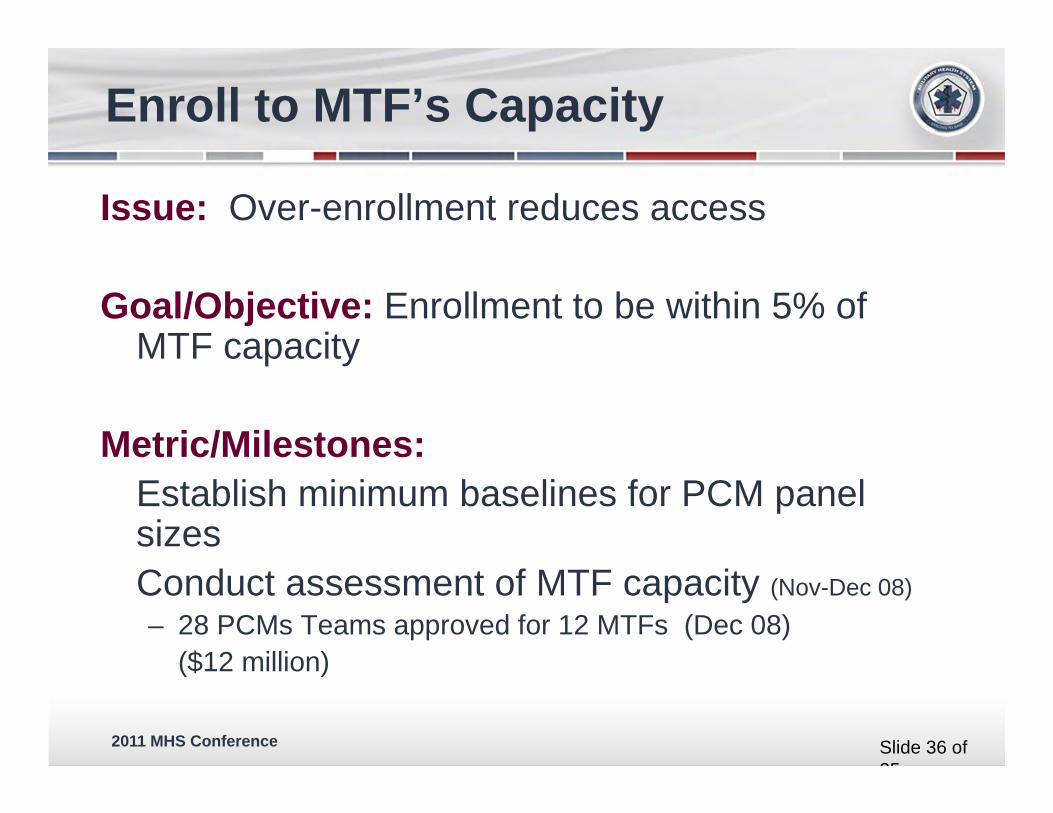
Issue: Over-enrollment reduces access
Goal/Objective: Enrollment to be within 5% of MTF capacity
Metric/Milestones:Establish minimum baselines for PCM panel sizesConduct assessment of MTF capacity (Nov-Dec 08)– 28 PCMs Teams approved for 12 MTFs (Dec 08)
($12 million)
Enroll to MTF’s Capacity
Slide 36 of 25
2011 MHS Conference
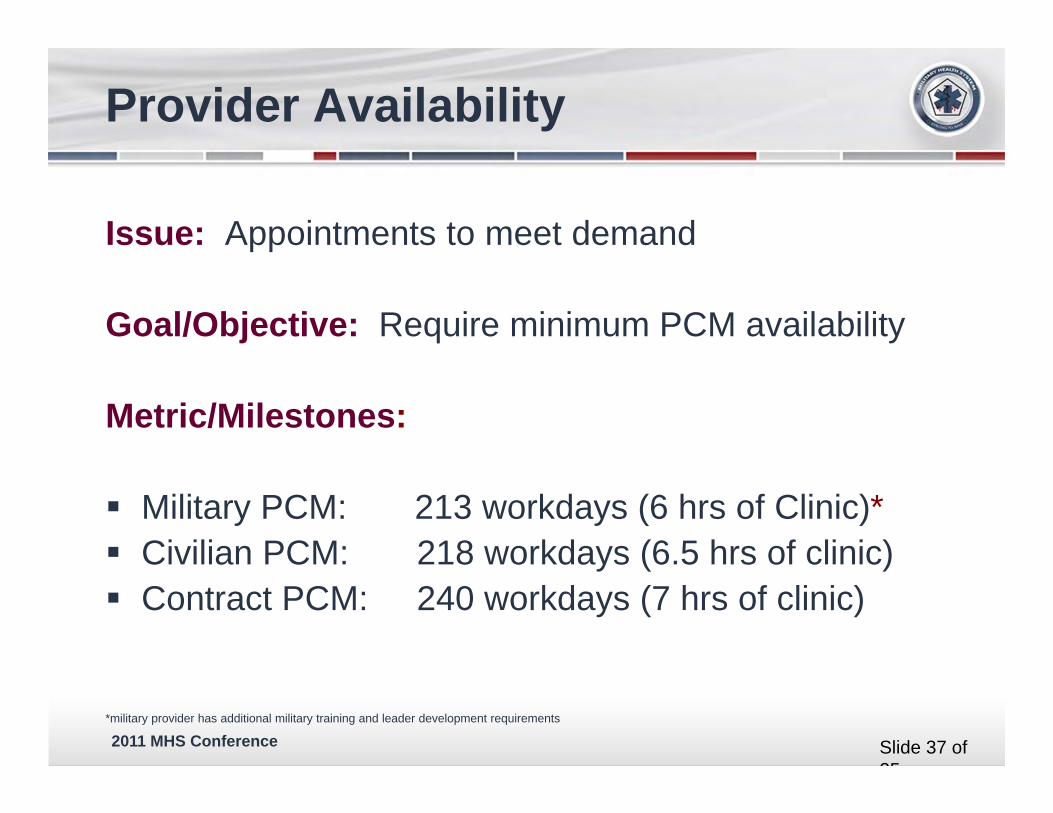
Issue: Appointments to meet demand
Goal/Objective: Require minimum PCM availability
Metric/Milestones:
Military PCM: 213 workdays (6 hrs of Clinic)* Civilian PCM: 218 workdays (6.5 hrs of clinic) Contract PCM: 240 workdays (7 hrs of clinic)
*military provider has additional military training and leader development requirements
Provider Availability
Slide 37 of 25

2011 MHS Conference
PCM’s Available Clinical Time Utilization Rate of Pts (type of patients that make up panel)
Support Staff Clinic Design/Infrastructure
PCM Panels Vary …. That’s OK
CLINIC # ENROLLED # of PCMs PANEL RANGES
QU 17K 15 PCMs (800 – 1,387)
RA 10K 10 PCMs (450 – 1,270)
BB 17K 17 PCMs (551 – 1,380)
ABCD 30K 60 PCMs (62 – 1,114)
Slide 38 of 25

2011 MHS Conference
How do we get to the correct Provider Ratio?
Although 1,178 was the “golden” number – many do not know why 2,080 hours in a work year = 260 work days (no leave or TDY, etc.) Minus 30 (non-weekend) days of leave (six work weeks lost) Minus 5 days CME, 5 days MilTrng, and 5 days of general admin (15 days) 215 work days (military) 7.5 work hours per day in clinic and 0.5 hours in “admin” 20 minute appointments, generates roughly 22.5 visits per day Old standard (not wrong, things are changing) of 4.1 visits annual Utilization
Rate 215 days X 22.5 visits/day = 4,837 visits … Divided by 4.1 UR = 1,179
MEDCOM’S AUTOMATED STAFFING ASSESSMENT MODEL (ASAM)
Slide 39 of 25

2011 MHS Conference
20 Min Appts X 7.5 hrs = 22.5 Appts per Day
22.5 Appts X 215 = 4837.5 Annual
4837.5 ÷ 4.1 = 1178 Enrollment
Work Days
Utilization Rate
ASAM: Family Medicine Military Physician
Slide 40 of 25

2011 MHS Conference
POSSIBLE WORK DAYS EXPECTED HOURS IN CLINIC ANNUAL HOURS PANEL SIZE
MILITARY 6 1,278 935 3,834 VISITS
213 4 852 623 2,556 VISITS
2 426 312 1,278 VISITS
CIVIL SERVICE 7 1,526 1,117 4,580 VISITS
218 6 1,308 957 3,924 VISITS
5 1,090 798 3,292 VISITS
CONTRACTOR
240 7 1,680 1,170 4,800 VISITS
Clinic Time Drives Panel Size
Slide 41 of 25

2011 MHS Conference
Family Practice Clinic10,000 Enrollees
* HA Policy 00-001ratio
ADSM
ADFM
RET
T+40%
40%15%
5%
4 5 6.53Utilization Rates
# Appointments 12,000 16,000 7,500 3,250
# Enrollees 4,000 4,000 1,500 500
Total Appointments p/Yr 38,750
38,750 / 252 wk days = 154 appts per day
PCM Enrollment / Availability
Slide 42 of 25

2011 MHS Conference
Utilization Rates, Provider Type, and RVUs to Determine Panel Sizes
Utilization Rates (Visits/Year)
4.1 3.9 3.7 3.5
Military Provider RVU Encounters/DayClinic
Days/YearAnnual
Encounters
Panel Size
FP and FNP 2.2 18
213
3834 935 983 1036 1095
PA, Flt Med, GMO 2 20 4217 1029 1081 1140 1205
Pediatrics NP 2.66 15 3171 773 813 857 906
Pediatrician 2.5 16 3374 823 865 912 964
Internist 2.3 17 3667 894 940 991 1048
RVU Standard = 39.6 RVU/Day
Slide 43 of 25

2011 MHS Conference
Decreasing Percentage of Time in Clinic requires more Providers to Meet Demand and Access Standards
38,750 / 252 wk days = 154 appts per day
154 / 21 apts = 8 (7.3) PCMs in clinic each day for 7 hrs ($1.6M) 154/ 18 apts = 9 (8.5) PCMs in clinic each day for 6 hrs 154 / 14 apts = 11 (11) PCMs in clinic each day for 5 hrs 154/ 12 apts = 13 (12.8) PCMs in clinic each day for 4.3 hrs ($2.6M)
Family Medicine Clinic Example
Slide 44 of 25

2011 MHS Conference
ACCESS TO CARE – directly correlated with # of providers in clinic per day
0.0
5.0
10.0
15.0
20.0
25.0
30.0
35.0
40.0
0
100
200
300
400
500
600
700
800
1-3 July
7-11 July
14-18 July
21-25 July
28 Jul-1 Aug
4-8 Aug
11-15 Aug
18-22 Aug
25-29 Aug
1-5 Sep
8-12 Sep
15-19 Sep
22-26 Sep
Avg # Total Templated Appts daily
Avg # Providers in Clinic Daily
38 FTEs in Clinic every day will meet total demand
Current on hand - 32 FTEs yields 24-28 Providers in clinic daily and < 600 appointments daily
Goal
Need 750 appointments per day to fully meet acute and wellness needs for this population
Are you checking?
Slide 45 of 25

2011 MHS Conference
Completed Encounters = Competed encounters in Primary Care product line at all DMISes, minus: t-cons, inferred SADRs, BHA1 and BHA2. Data source: M2, pulled 8 Jan 10.Required = ((Prime enrolled population * Prime utilization rate) + (TPlus empanelled population * TPlus utilization rate))+ current volume of Space A encounters-WTU credit. Data source: Enrollment Capacity Models: Mar 09 version(09_03) and Dec 09 version(09_12).
Slide 46 of 25
Tot al PC Encount ers
Tot al Required
Tot al Completed
Shortfall
2500
2000
1500
1000
500
111111111111 I ,t
~~ 0
rf Sun
Oct08-Dec08
88,397
octo9-Deco91
93,110
75,188 97,169
( 210 per day) ( -64 per daY.LJ
I
-ue
FY2009
- Sum of Encounte rs
DARNALL AMC-FT. HOOD
Oct08-DeC08 Oct09-Dec09
Total Enrollees 94,666 98,948
PC Provider FTEs 71.44 83.84
Primary Care Encounters
Oct08-0ec08 & Oct09-0ec09
'- J VV
1403
II llllltlldlllllllllllllll 1
Fri Sun -ue
It
Wed
FY2010
IPC URs
Prime
Oct08-Dec08 Oct09-DeC09
3.5 3.5
Tplus 6.44 6.44
ltl arget primarycare encounters per beneficia ry
1761
1478
II II 111111111
~f - hu Sat
- sum of Daily PC Appts eeded - sum of Daily PC Appts Possible based on FTEs

2011 MHS Conference
Enrollment!
MTFCHCS
CHCSMCP F&T
DEERSPCM Repository
PCMRS
DEERSNational
Enrollment Database
MOUs with MTFs
DEERSPersonnel Systems
RAPIDS
Enrollment Applications
DOES
TOC tool for empanelment check
Slide 47 of 25

2011 MHS Conference
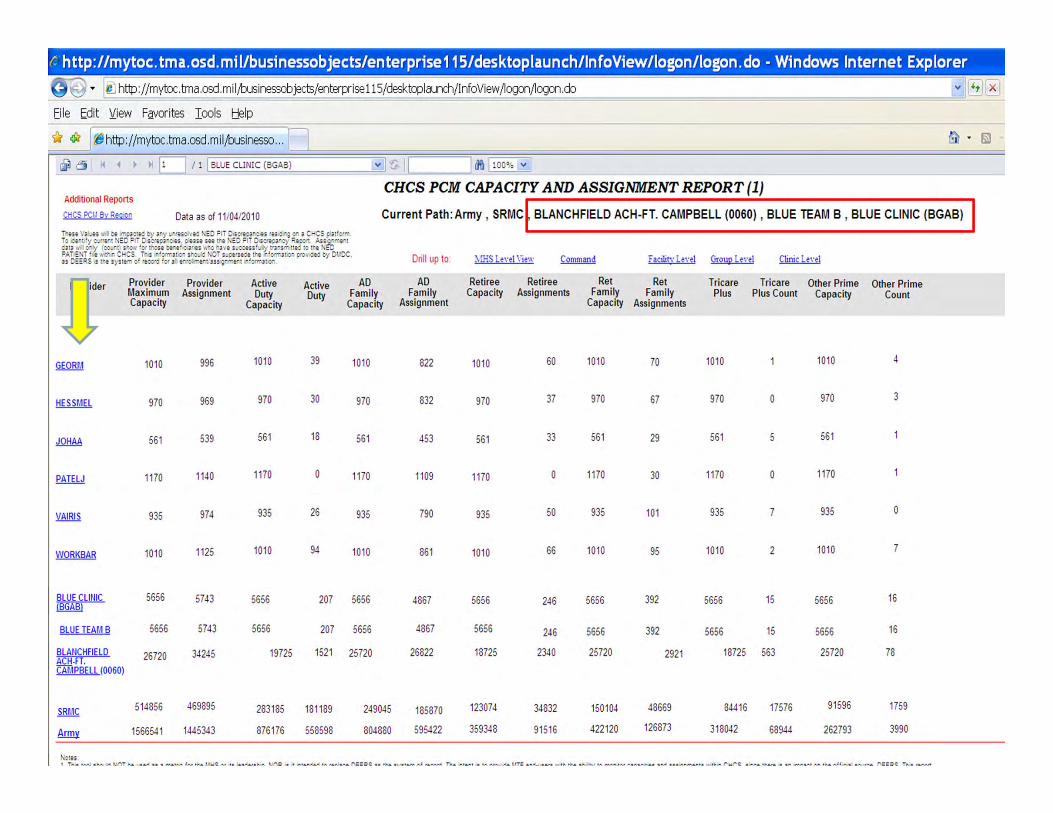
• Provides view of enrollee assignment
• Daily snapshot of data extracted CHCS Host Platform.
• The PCM assignment process affects clinic’s ability to provide continuity of care to their patients.
• The panel assignment size and makeup must be constructed so that PCMs can see their own assigned patients.
• Improper distribution of enrollee assignment could result either in unequal workloads or a breakdown in continuity as patients are referred from the overloaded panel to open appointments with other PCMs.
Primary Care Manager (PCM) Capacity and Assignment Report
Slide 48 of 25

2011 MHS Conference
t:. http://mytoc. tma.osd.mil/businessobjects/enterprise115/desktoplaunch/lnfoView/logon/logon.do -Windows Internet Expl
I~ http: I jmytoc. tma .osd. m i ljbusinessobjectsjenterprise 115/desktoplaunch/InfoView ~ogon~ogon .do
Eile Edit Y:iew Fg,vorites Iools t!elp
_!__lSI ~~ http ://mytoc.tma.osd.mil,lbusinesso .. . Q ____ D._J l I BLANCHFIELD ACH·FT. CAMPBELL (0060) v I J rlfl ~ vJ
Additional Reports
CHCS PCI.I Bv Reo~en
CHCS PCM CAPACITY AND ASSIGNMENT REPORT (1)
Data as of 11/04/2010 Current Path: Army , SRMC ,IBLANCHFIELD ACH-FT. CAMPBELL (0060)
ihse VJ ... ts -. bt IIT_;:<l:t~ ty r y .·rnolvt~ :o =Ji 0-s:.tio.r -:..'fs ru j ·~ o· a c:..cs c n'omTo c.: · t ' y e:..rrt" t t\EO ?IT 0 i~t~r::~s. pun~~ tfe f\EO =IT 0 se•tOJ."~ Rt:oon Ass;,:rrer-t a Jta 'II. o .. Jy (oo ... ""t sloaN 'of &on bt· t' :-..JrJts "" "~ l" J 't e s .. e-:en' .. rty trrsrr ttt~ to tr t f\: u ::>A.TIENT I f .. & .. c r-cs Tr 3 r 'ortrltJG .. sro .. l i\OT J .. otflt! t Vt " 1ottrl l0-" p~ov eM by m/ DC. u o:::RS s tr t syscerr o' re:»~O ' or J e·ro rn "t Jn ; ·JTt rt · ' c.rrrJ t.o"
NED Provider Group
Provider Provider Maximum Assignment Capacity
Active Duty
Capacity
Active Duty
AD Family
Capacity
5479 4985 192 5995
BLUE TEAM 5656 5743 5656 207 5656
BLUE TEAM C 4975 4723 4975 167 4975
BLUE TEAM 0 3109 3941 3109 136 3109
GOLOTEAMA 0 1533 0 11 0
GOLD TEAM B 0 1366 0 13 0
WARRIOR CARE 1000 707 1000 707 0 GROUP
WHITE TEAM A 0 3244 0 88 0
YOUtJG EAGLE 5985 7509 0 0 5985
BLAtlCHFIELO 26720 34245 19725 1521 25720 ACH-FT. CAMPBELL !0060!
SRMC 514856 469895 283185 181189 249045
Army 1566541 1445343 876176 558598 804880
1\otu
Drill up to
AD Family
Assignment
4445
4867
4154
3482
46
19
0
2564
7245
26822
185870
595422
Retiree Capacity
4985
5656
4975
3109
0
0
0
0
0
18725
123074
359348
Retiree Assignments
341
246
147
131
657
578
0
240
0
2340
34832
91516
Facilit\· L~nl Group l ent Clinic l~nl
Ret Ret Family Family
Capacity Assignments
5995 451
5656 392
4975 231
3109 179
0 561
0 515
0 0
0 330
5985 262
25720 2921
150104 48669
422120 126873
Tricare Plus
4985
5656
4975
3109
0
0
0
0
0
18725
84416
318042
Tricare Other Prime Other Prime Plus Count Capacity Count
35 5995 15
15 5656 16
15 4975 9
5 3109 8
248 0 10
231 0 10
0 0 0
14 0 8
0 5985 2
563 25720 78
17576 91596 1759
68944 262793 3990
' Tt s too sto • .a t\OT be .. u d n a trttr c 'or th· L!t-S or t1 n.cfe•sl': p, NOR s t · tt·ze-l to rt o J oe DEERS as th systt m o' r£-tor.l Th · t~·t s to p•ov >et- UTF e-o,.-,~nrs ~ tf! tre .tt ty to n-o· tor CJ,P3C.Lei :r d ass ;·rre· ts Y. tl' "l Cr CS. s '"O£ th•e s ._ .. &rrO-.lCt o· tri' o' f e:;J] ~ .. rc.. OE:RS Tr. s ret>Ott OO"' tl- · s 1 d1.ily s·Jps'"ot o' eJtJ ' ron-: th I\ EO =-rov»!t-r Gro .. p . .r.+ :t rs extrJ. : :e-o {J 'tN rr .. .. tn a. ' ter tT l r ~h ' rorr u :t CI-CS 1-~t =~t'om-
., Tu : _.. .. ,.__..,. ,.., e.an. ....... . ,. ..... '"' ... " ,,. e.an.- c~ .... ,......._.k..o.. ,., , .. -... ........ ,.., ,,._.. ... .... ,.., N Jte tn , . ........ ~__......ta.A , ,_ ........, ...._ ............ ,.,.,.. '"'""" ........... .............. .....,..,_.., ._,..,.,...,"', - •lo.J. ''" ..... ,__.. : . , C.a.n.o.,.. r' ......... T l-..a ~,,_,_ .,,_ ,. _,.,..,....,. " '"-"' A..a..t,., ,..,. ., .. _.. '""" ,._,.., ~ " t&f'aA r\...aat......,a tv ,.,.._,..~,•
2011 MHS Conference
r.. http: //mytoc. tm a. osd. mi 1/busi nessob jects/en terprise 115/ desktop laun ch/ln fo View /logon/logon. do • Win dews Internet Explorer
9 .. 1~ http :f /mytoc. tma .osd. m i l;'ousinessobjects/enterprise 115/desktoplaunch/InfoView fiogonfiogon .do
Eile Edit Y..iew Favorites I ools t:J.elp
!_ 41 [ ~http://mytoc.tma.osd.mil;'ousinesso .. . []_
Addlhonal Reports
CHCS PCI.I Bv Rec10n Data as of 11/04/2010 Current Path: Army , SRMC BLANCHFIELD ACH-FT. CAMPBELL (0060) , BLUE TEAM B , BLUE CLINIC (BGAB) Trtst VJ .. u v. oe rr p.J: It:. ty r y t~ ~ ·r~vt:l f\EO =fT O..i:ttor:..es rn :~ -~ o· J c:..cs F-lt'Ofl'!" To Of "'t ' y e .. rrt· t f\:.0 =JT 0-l C-'t~J-:.U. Q-UU SH trt ~:.0 =IT O's:tt~r:y Rtoon AsS!'!"'f'l" !rt anl v. O"')' co .. " t s._-a,. 'or trcu t-!" ! ' ::.Jru .... ro 1'1\'f s .. :etn' .:ry trJ"S'l" ttt-d to tre f\:i'o =-ATI: NT ' t 'fl t!" r C~CS T~ s · 'orrrJW"• s~-, .. .j f\OT !Jpt:ru:t tl"t · 'o.rn"l~"' o·o'W'•lt-l ty OVDC, n CEERS 5 trf systt rr o' reoo•l 'o• 1 e· •o..n-e·tns~ '"ITt"' t "'Ortrll.IG"
Provider Provider Maximum Assignment Capacity
GEORM 1010 996
HESSMEL 970 969
JOHAA 561 539
PATELJ 1170 11-~0
VAIRIS 935 974
WORKBAR 1010 1125
BLUE CLINIC !BGABl
5656 5743
BLUE TEAM B 5656 5743
BlAtJCHFIELD 26720 34245 ACHH. CAMPBEll (0060)
SRr.IC 514856 469895
Army 1566541 1445343
N~tfS
Active Duty
Capacity
1010
970
561
1170
935
1010
5656
5656
19725
283185
876176
Active Duty
39
30
18
0
26
94
207
207
1521
181189
558598
AD Family
Capacity
1010
970
561
1170
935
1010
5656
5656
25720
249045
804880
Drill up to
AD Family
Assignment
822
832
453
1109
790
861
4867
4867
26822
185870
595422
:-.P.S Lenl \'iew
Retiree Retiree Capacity Assignments
1010 60
970 37
561 33
1170 0
935 50
1010 66
5656 246
5656 246
18725 2340
123074 34832
359348 91516
• TII....C !.-I cM. N/"'T ...._ ca.<f sc s 1¥..AtiV' l tv tka U~C:.,.., t1: ta:a.~cM kt'\;) ol: t tr'r&.~ tl\ , .. ,.._,.,.. f\: :CC::: s c t .. .a &•n:r&M ,., , ......,.,., Tfta .,.~, <& tA NAv - U'T: ~"'-' 1:&1'& -k , .,__. s
Facilit\' Le,·el Group lenl Clinic Le,·el
Ret Ret Family Family
Capacity Assignments
T ricare T ricare Other Prime Other Prime Plus Plus Count Capacity Count
1010 70 1010 1010 4
970 67 970 0 970 3
561 29 561 5 561
1170 30 11 70 0 1170
935 101 935 935 0
1010 95 1010 2 1010 7
5656 392 5656 15 5656 16
5656 392 5656 15 5656 16
25720 2921 18725 563 25720 78
150104 48669 84416 17576 91596 1759
422120 126873 318042 68944 262793 3990
t\t tl\ ~ tiV ... Sfls.Nt.&C S.!'Jf S CCII\.f'I.M&I'U: _ , .. -"' ('~f"C::: 1:-'I.J'\& t l'.at& 01: S '" OM.fiSJ"t IV!.,.,._. Al f""s J &N"'J'>& n..:: CC::: llo I r&N'Vt

2011 MHS Conference
COMMAND CAPACITY ASSIGNED
MHS 15,546,019 3,557,376
ARMY 1,523,404 * 1,440,793
ERMC 122,919 103,604
NRMC 414,036 405,544
PRMC 103,691 89,257
SRMC 506,374 473,658
WRMC 376,384 368,728
DATA SOURCE: TRICARE Operations Center (TOC) / REPORT: Primary Care Manager (PCM) Capacity and Assignment / DATE: As of 01/04/2011
* Total Army Capacity does not include an additional 400 Capacity at No Command included on the TOC Report
PCM Capacity and Assignment Report: JAN 2011
Slide 51 of 25

2011 MHS Conference
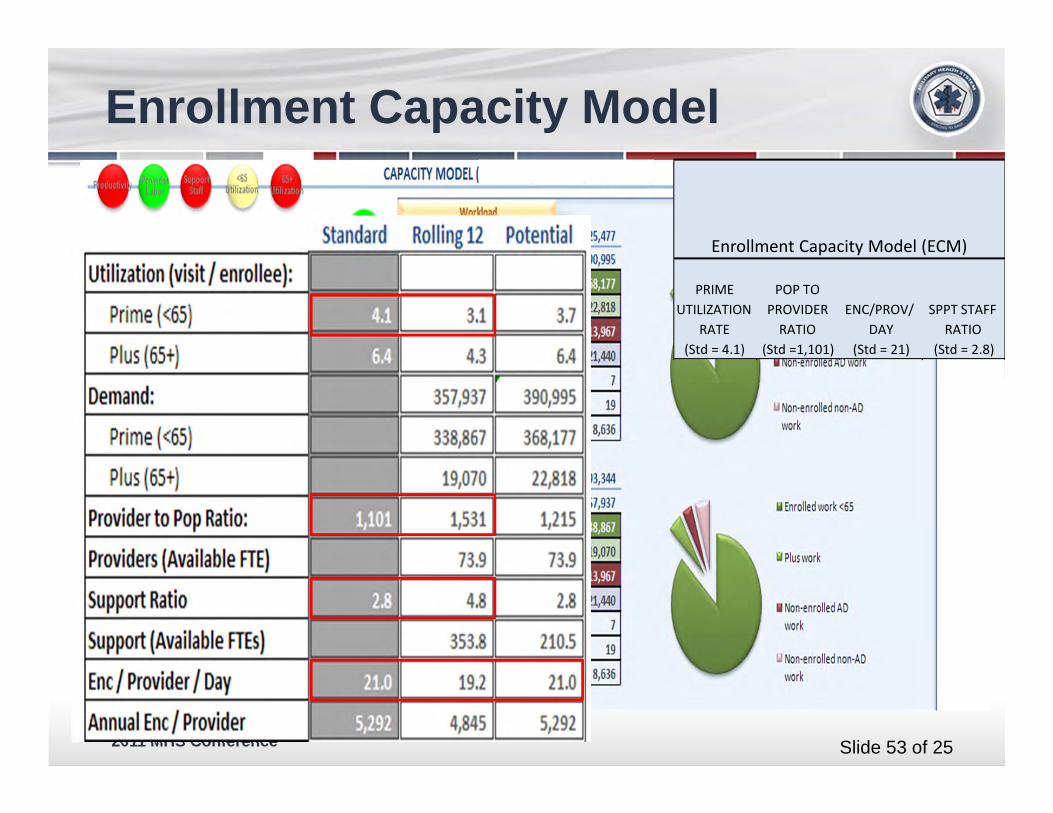
Stoplights are an indicator of efficiency areas for further investigation at MTF.
Workload tables show breakout by type of care.
(TOP) Potential work based on primary care provider available FTEs at 21 encounters per provider per day.
(BOTTOM) Historical work from M2, based on rolling 12 months of records expected to be complete to-date.
Slide 52 of 25
2011 MHS Conference
Enrollment Capacity Model
PRIME UTILIZATION
RATE (Std = 4.1)
POP TO PROVIDER RATIO
(Std =1,101)
ENC/PROV/DAY
(Std = 21)
SPPT STAFF RATIO
(Std = 2.8)
Enrollment Capacity Model (ECM)
Slide 53 of 25

2011 MHS Conference
Foundation for patients to have access and continuity with their PCM is when right provider, at the right time, and in the right place is enrollment process.
Panel Size must be based on PCM’s clinic availability
Less time in clinic decreases continuity of care
PCM Clinic time must match panel size, if less than required result is not enough access to meet demand…..– You are Over-enrolled and cannot meet access standards
Balance requires continuous assessmentSlide 54 of 25
2011 MHS Conference
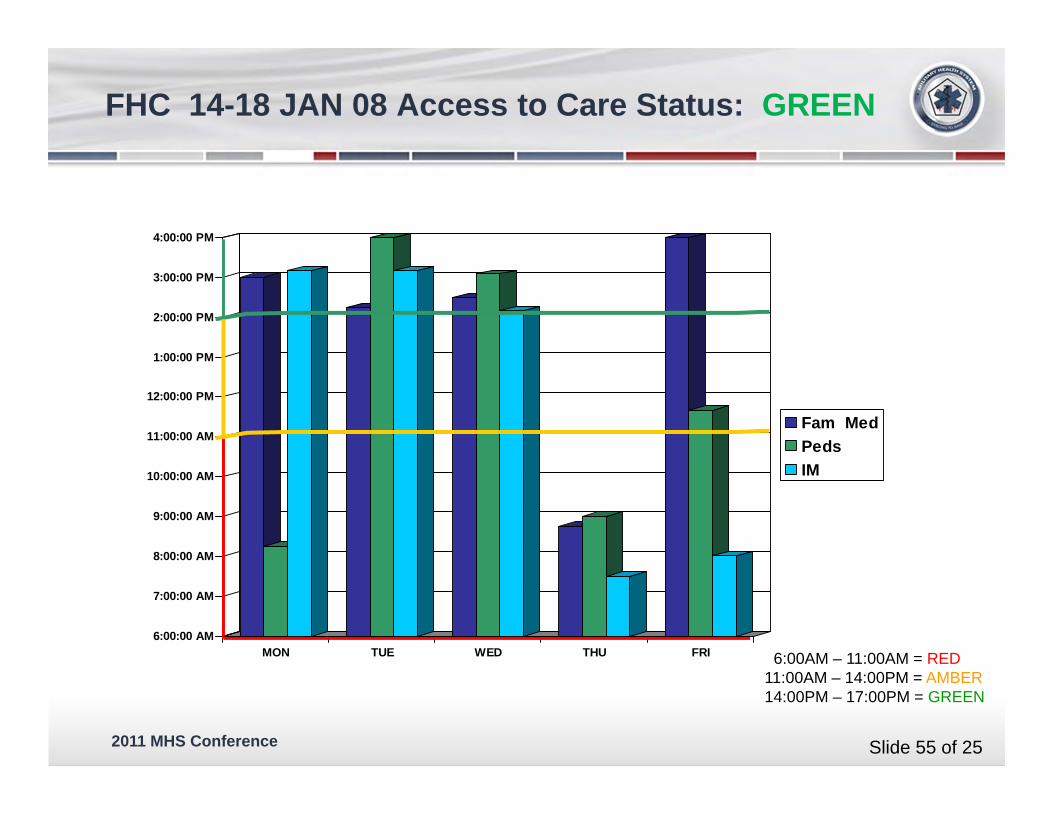
6:00:00 AM
7:00:00 AM
8:00:00 AM
9:00:00 AM
10:00:00 AM
11:00:00 AM
12:00:00 PM
1:00:00 PM
2:00:00 PM
3:00:00 PM
4:00:00 PM
MON TUE WED THU FRI
Fam MedPedsIM
6:00AM – 11:00AM = RED11:00AM – 14:00PM = AMBER14:00PM – 17:00PM = GREEN
FHC 14-18 JAN 08 Access to Care Status: GREEN
Slide 55 of 25
2011 MHS Conference
-