Embed Size (px)
Citation preview
©2011 Lincoln National Corporation201111-2061288
The MOOD of America:Measuring Optimism, Outlook and DirectionPresented by Lincoln Financial Group
201111-2061288
Executive Summary
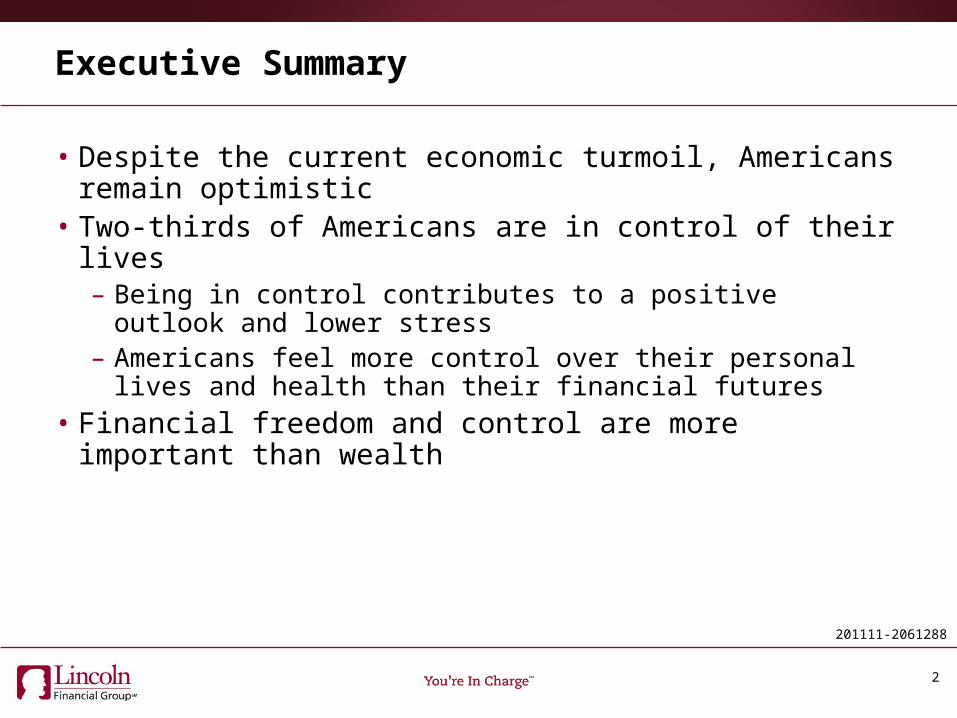
• Despite the current economic turmoil, Americans remain optimistic
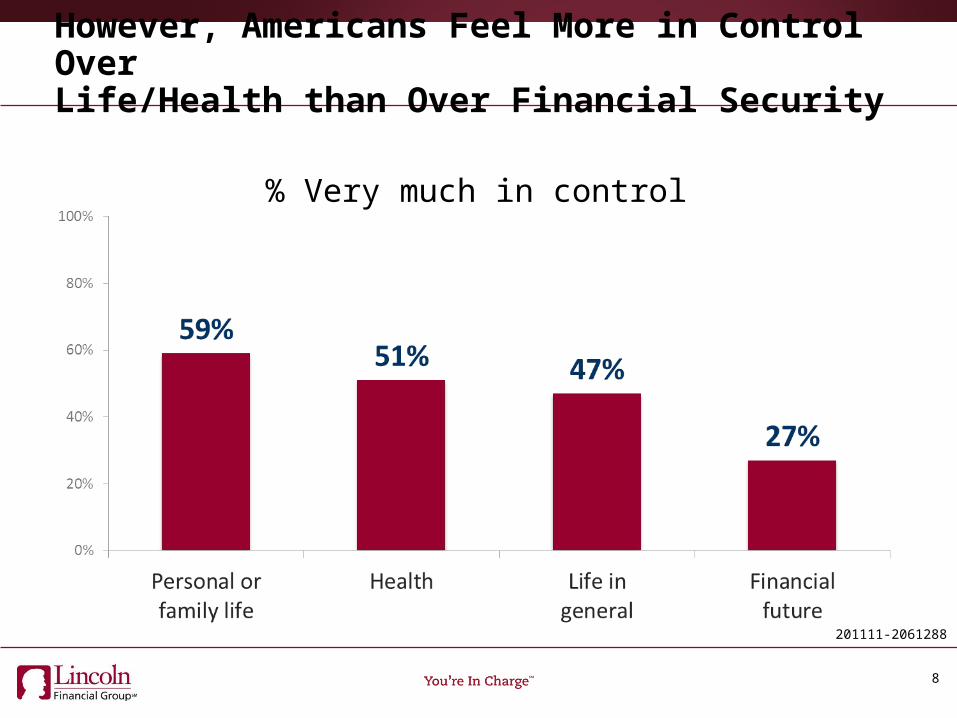
• Two-thirds of Americans are in control of their lives– Being in control contributes to a positive outlook and lower stress– Americans feel more control over their personal lives and health
than their financial futures
• Financial freedom and control are more important than wealth
2
201111-2061288
Executive Summary
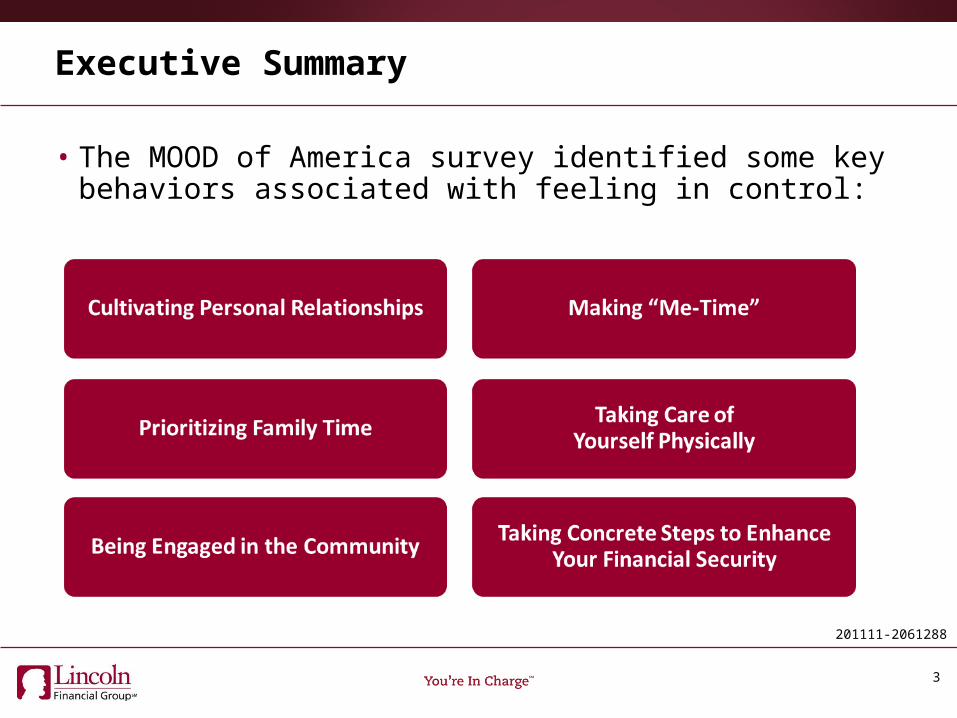
• The MOOD of America survey identified some key behaviors associated with feeling in control:
3
201111-2061288
The MOOD of America survey found that Americans are optimistic,
resilient and in control
201111-2061288
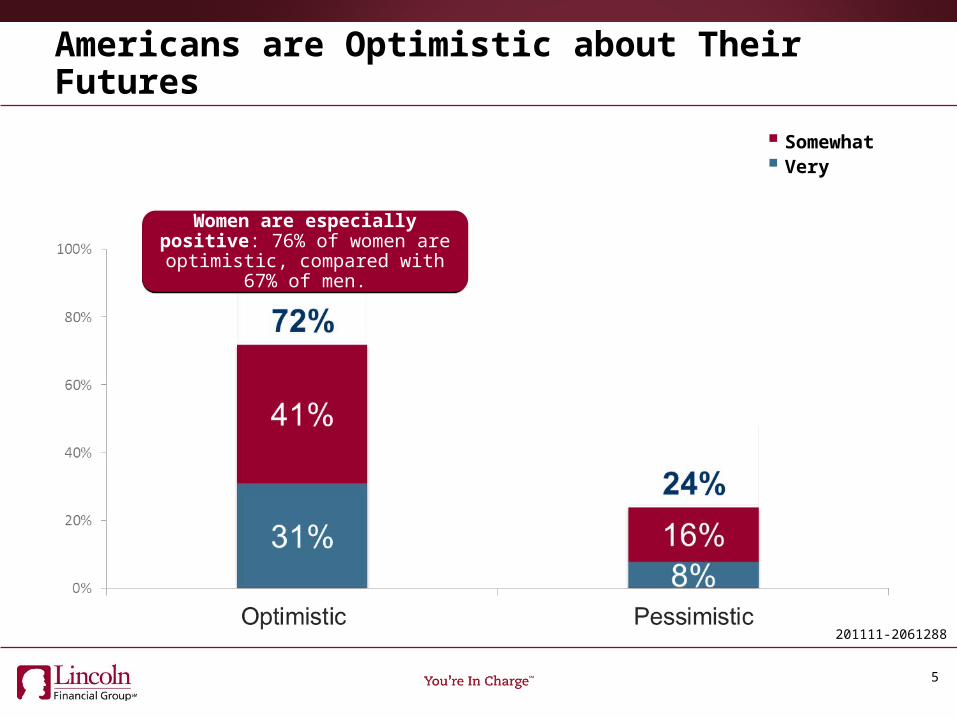
Americans are Optimistic about Their Futures
5
Women are especially positive: 76% of women are optimistic, compared with 67% of men.
Women are especially positive: 76% of women are optimistic, compared with 67% of men.
Somewhat Very
201111-2061288
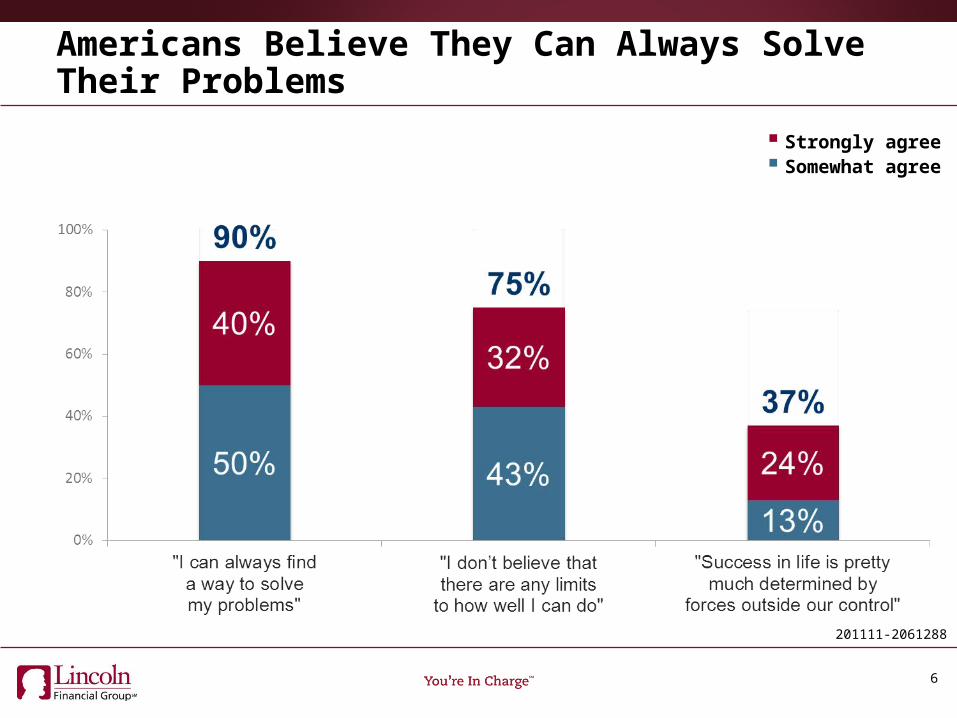
Americans Believe They Can Always Solve Their Problems
6
Strongly agree Somewhat agree
201111-2061288
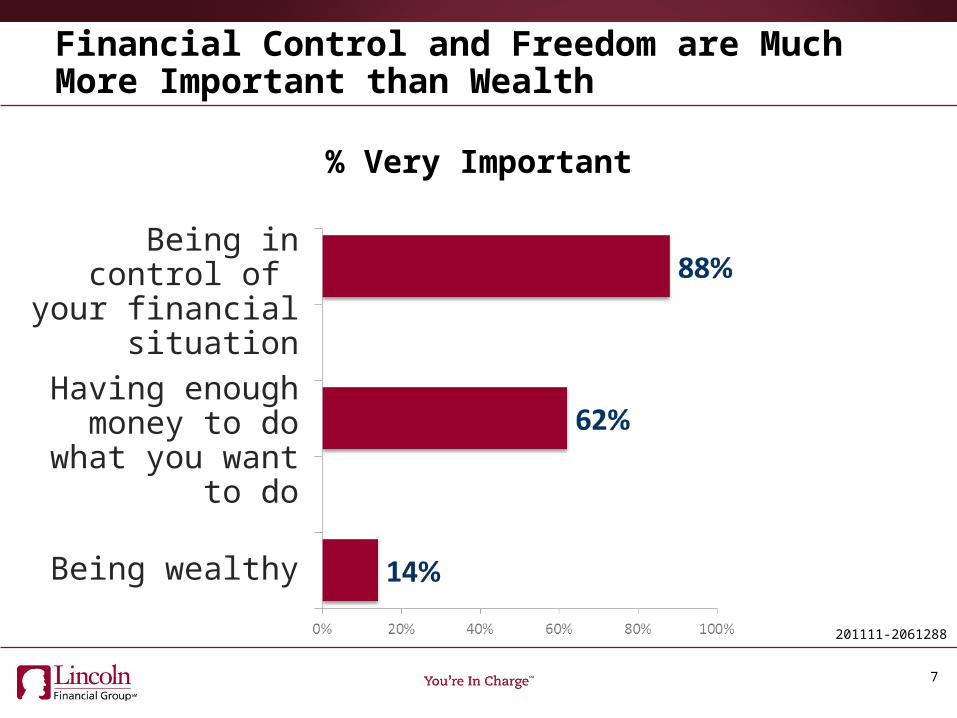
Financial Control and Freedom are Much More Important than Wealth
7
% Very Important
Being in control of your financial
situation
Having enough money to do what
you want to do
Being wealthy
201111-2061288
However, Americans Feel More in Control Over Life/Health than Over Financial Security
8
% Very much in control
201111-2061288
Feeling in control of one’s life has a positive impact on
future outlook and stress levels
201111-2061288
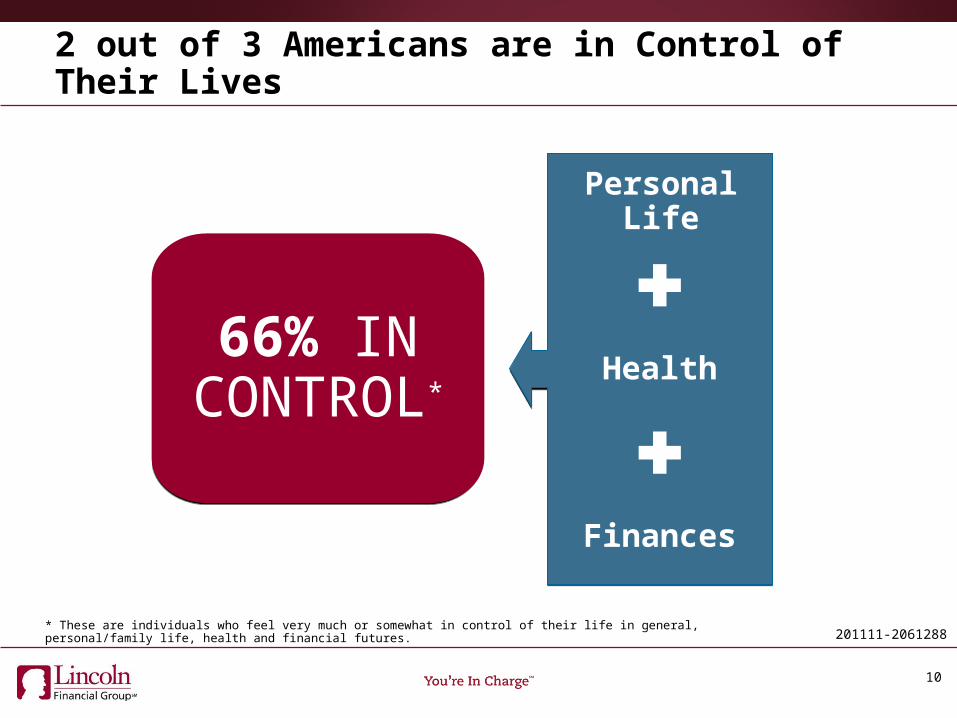
2 out of 3 Americans are in Control of Their Lives
10
Personal Life
Health
Finances
66% IN CONTROL*
66% IN CONTROL*
* These are individuals who feel very much or somewhat in control of their life in general, personal/family life, health and financial futures.
201111-2061288
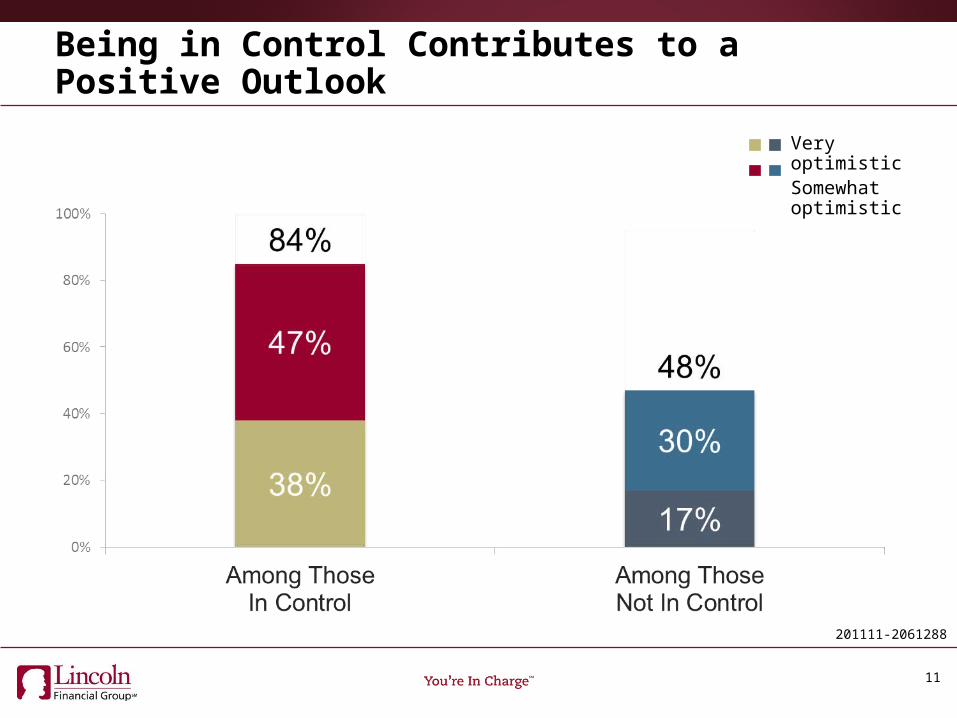
Being in Control Contributes to a Positive Outlook
11
Very optimisticSomewhat optimistic
201111-2061288
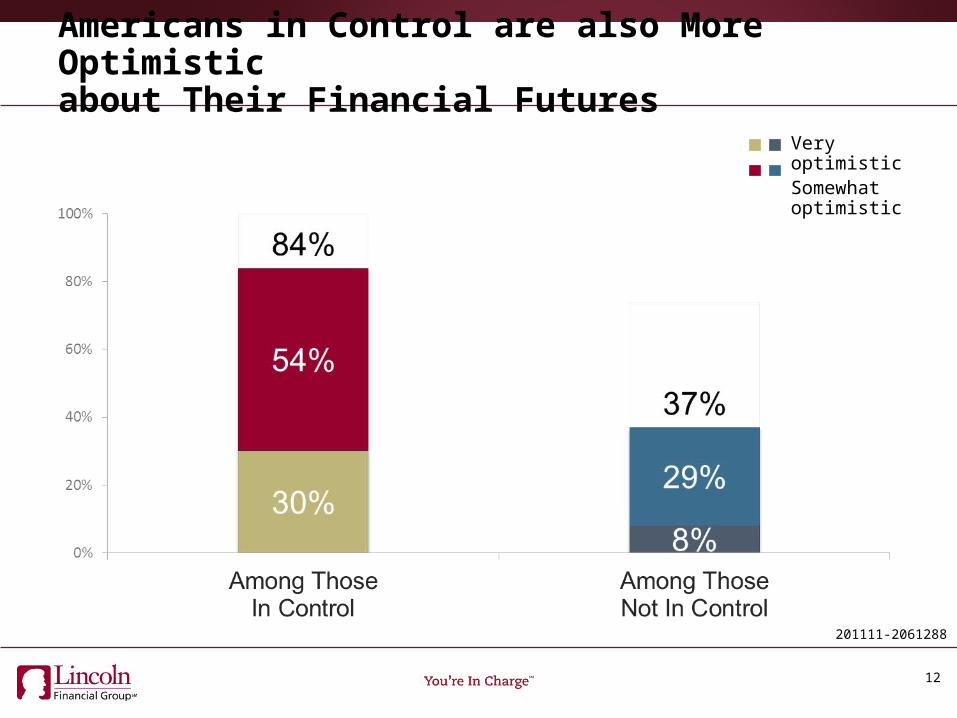
Americans in Control are also More Optimistic about Their Financial Futures
12
Very optimisticSomewhat optimistic
201111-2061288
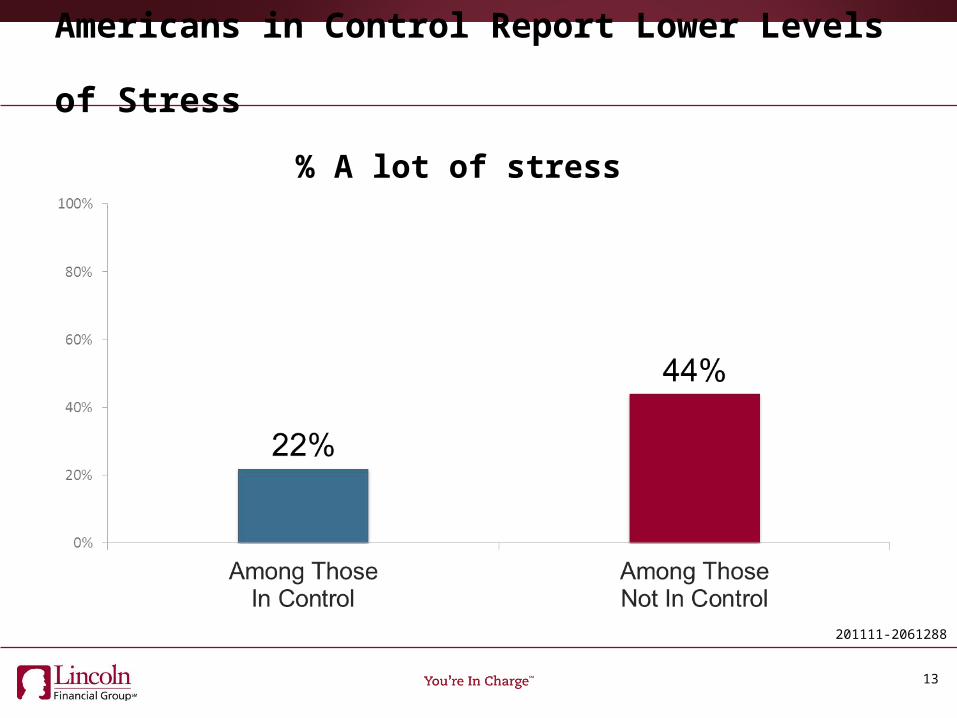
Americans in Control Report Lower Levels of Stress
13
% A lot of stress
201111-2061288
The survey uncovered some key behaviors that are associated with
feeling in control
14
201111-2061288
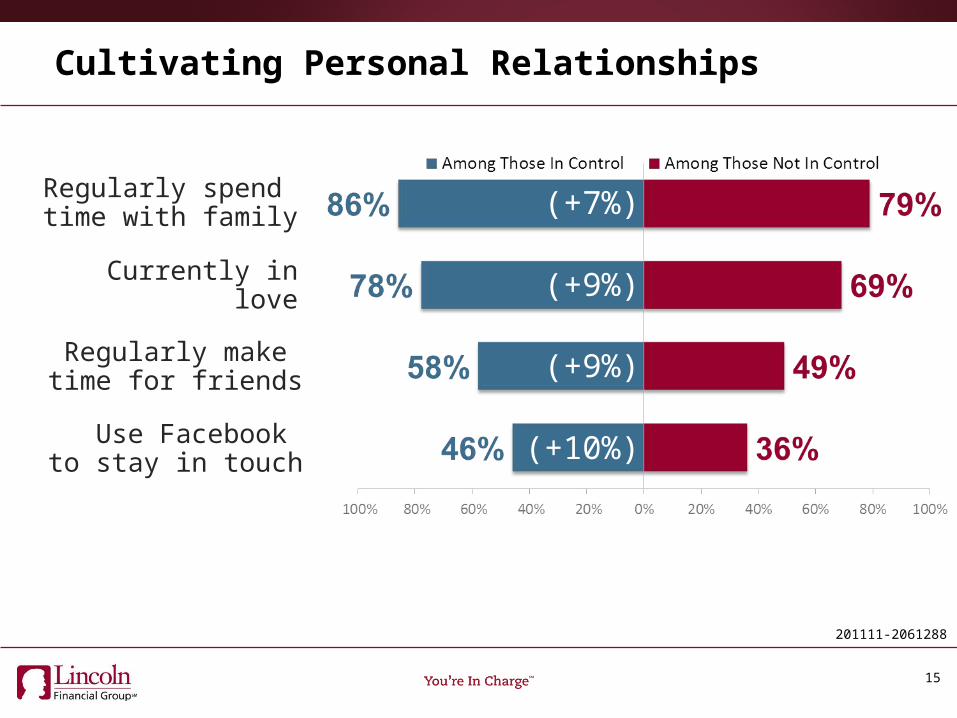
Cultivating Personal Relationships
15
Regularly spend time with family
Currently in love
Regularly make time for friends
(+7%)
(+9%)
(+9%)
Use Facebook to stay in touch (+10%)
201111-2061288
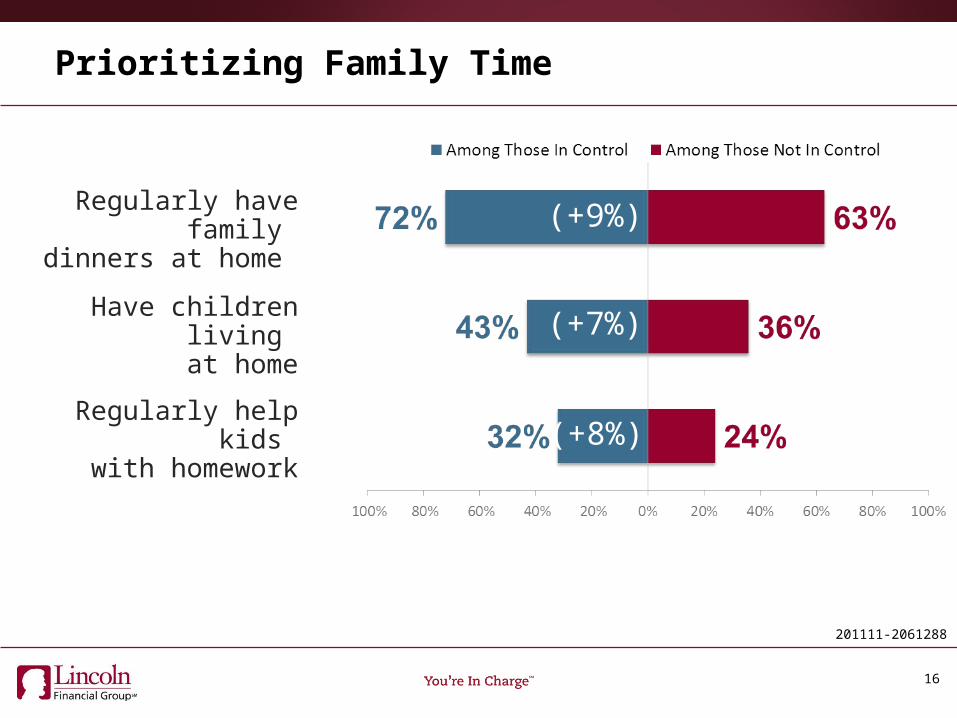
Prioritizing Family Time
16
Regularly have family dinners at home
Have children living at home
Regularly help kids with homework
(+9%)
(+7%)
(+8%)
201111-2061288
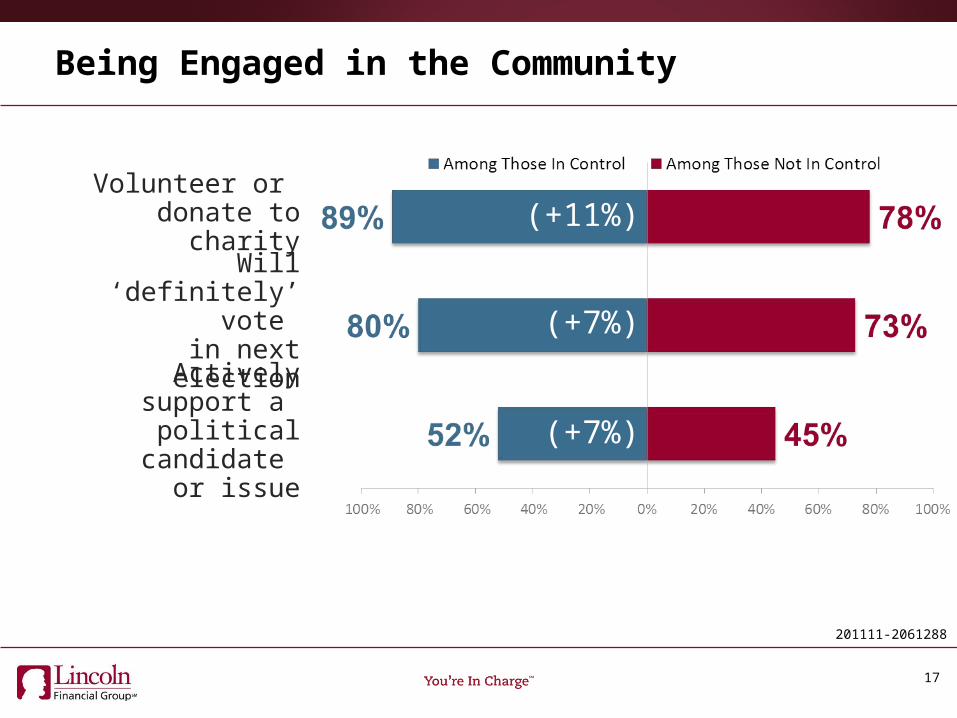
Being Engaged in the Community
17
Volunteer or donate to charity
Will ‘definitely’ vote in next election
Actively support a political candidate
or issue
(+11%)
(+7%)
(+7%)
201111-2061288
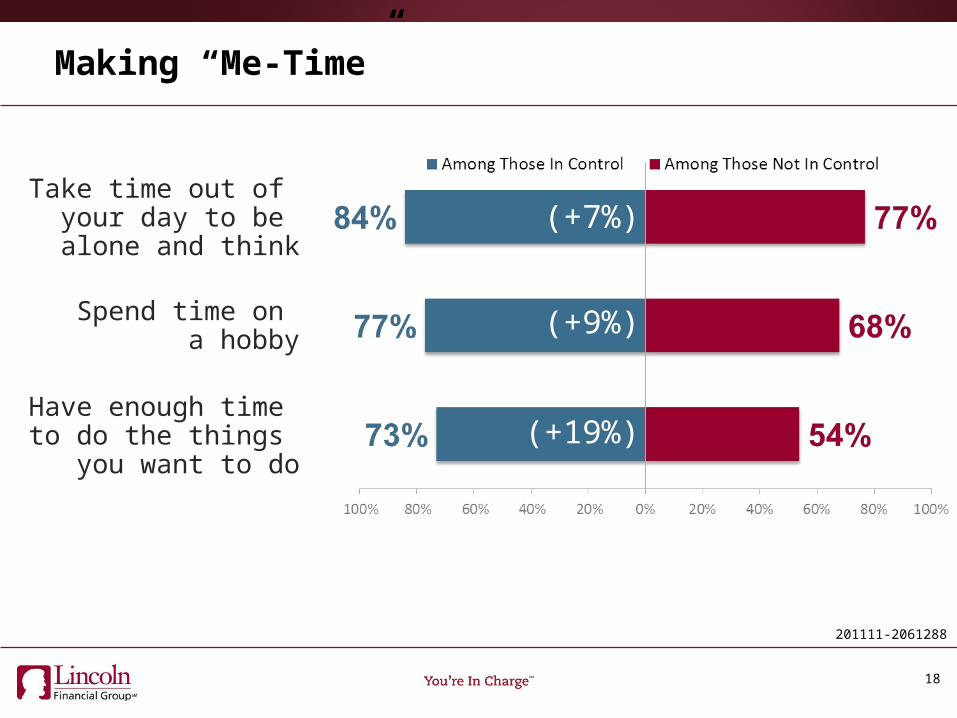
Making “Me-Time”
18
Take time out of your day to be alone and think
Spend time on a hobby
Have enough time to do the things
you want to do
(+7%)
(+9%)
(+19%)
201111-2061288
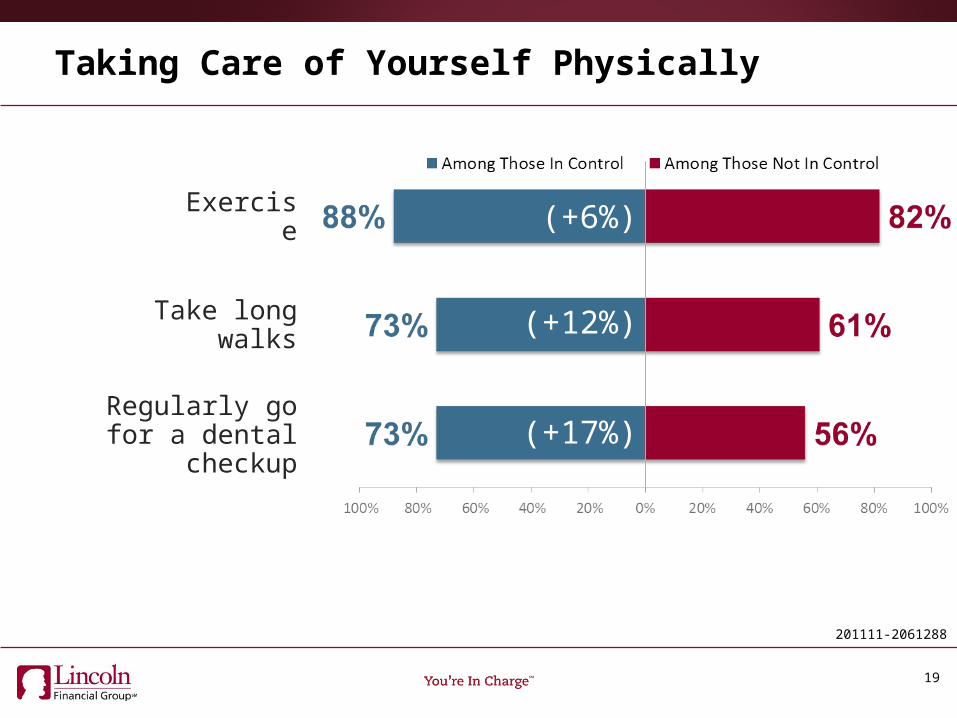
Taking Care of Yourself Physically
19
Exercise
Take long walks
Regularly go for a dental checkup
(+6%)
(+12%)
(+17%)
201111-2061288
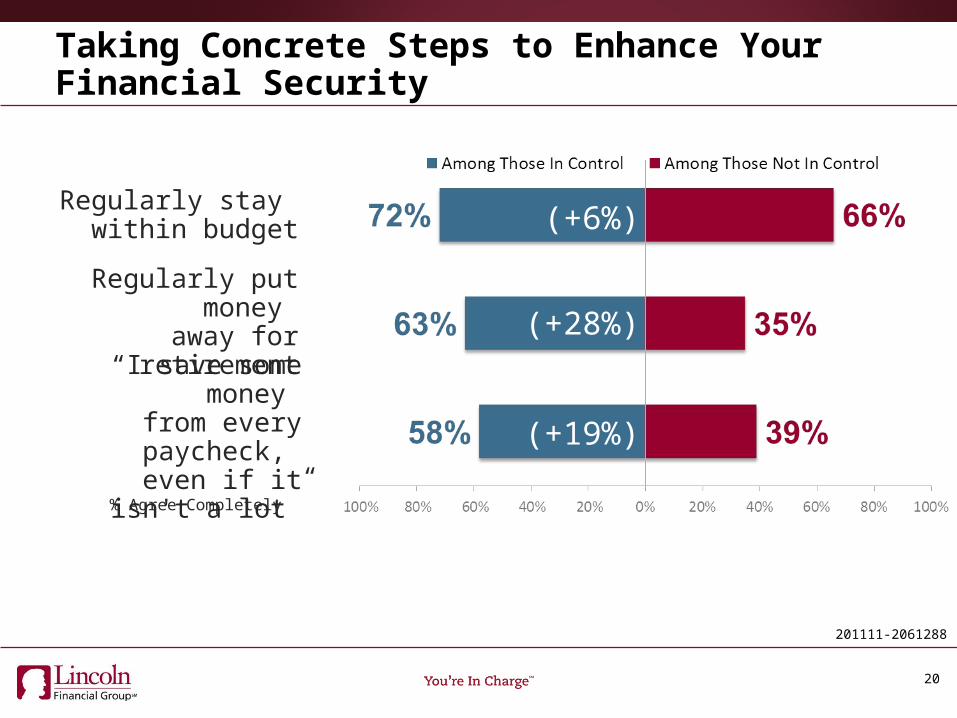
Taking Concrete Steps to Enhance Your Financial Security
20
(+6%)
(+28%)
(+19%)
Regularly stay within budget
Regularly put money away for retirement
“I save some money from every paycheck,
even if it isn't a lot”% Agree Completely
201111-2061288
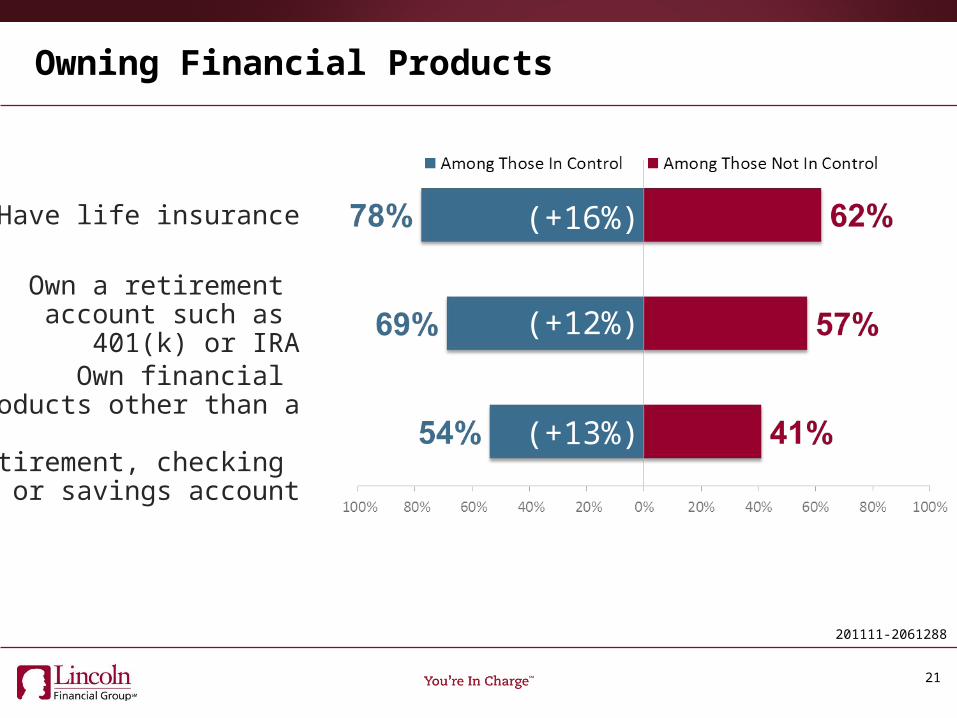
Owning Financial Products
21
Have life insurance
Own a retirement account such as
401(k) or IRA
Own financial products other than a retirement, checking
or savings account
(+16%)
(+12%)
(+13%)
201111-2061288
Demographically, those in control are strikingly similar to those not in control
201111-2061288
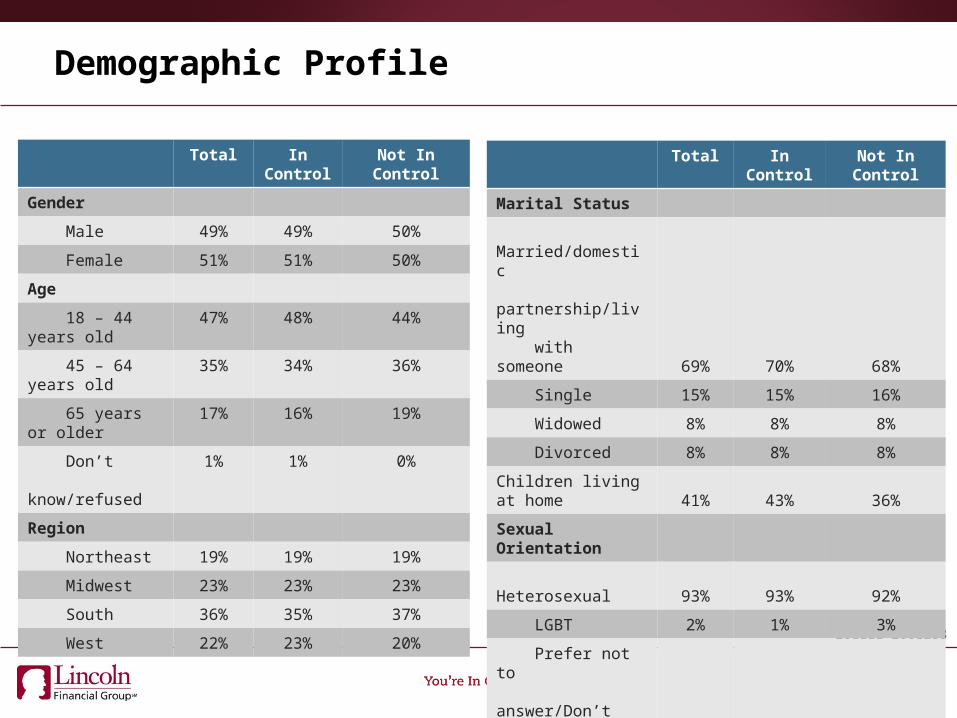
Demographic Profile
23
Total In Control Not In Control
Gender
Male 49% 49% 50%
Female 51% 51% 50%
Age
18 – 44 years old 47% 48% 44%
45 – 64 years old 35% 34% 36%
65 years or older 17% 16% 19%
Don’t know/refused
1% 1% 0%
Region
Northeast 19% 19% 19%
Midwest 23% 23% 23%
South 36% 35% 37%
West 22% 23% 20%
Total In Control Not In Control
Marital Status
Married/domestic partnership/living with someone 69% 70% 68%
Single 15% 15% 16%
Widowed 8% 8% 8%
Divorced 8% 8% 8%
Children living at home 41% 43% 36%
Sexual Orientation
Heterosexual 93% 93% 92%
LGBT 2% 1% 3%
Prefer not to answer/Don’t know 5% 6% 5%
201111-2061288
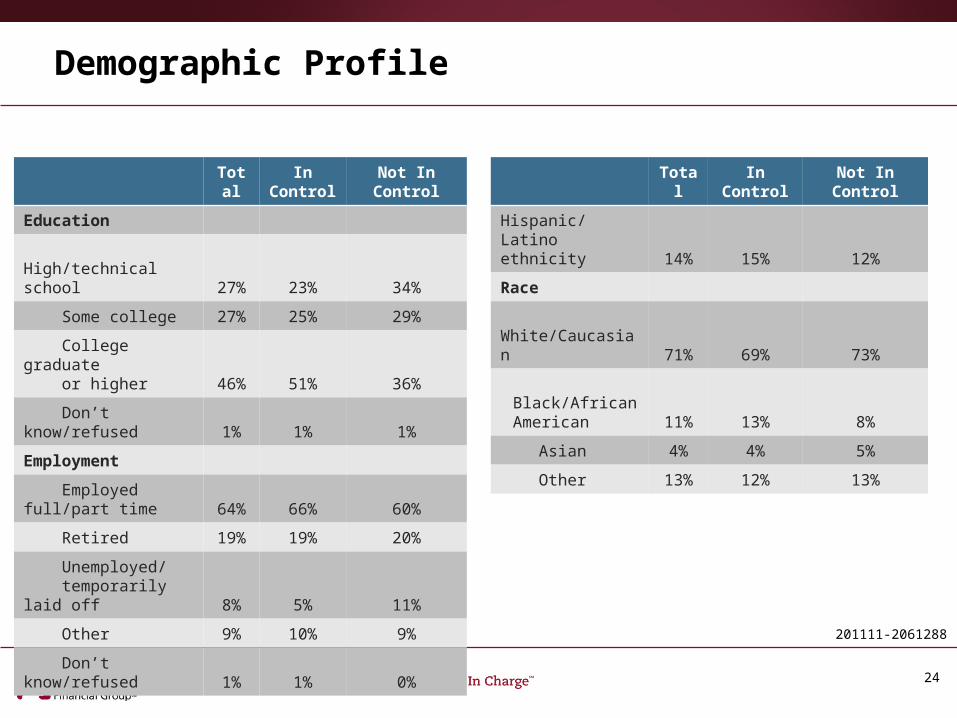
Demographic Profile
24
Total In Control Not In Control
Education
High/technical school 27% 23% 34%
Some college 27% 25% 29%
College graduate or higher 46% 51% 36%
Don’t know/refused 1% 1% 1%
Employment
Employed full/part time 64% 66% 60%
Retired 19% 19% 20%
Unemployed/ temporarily laid off 8% 5% 11%
Other 9% 10% 9%
Don’t know/refused 1% 1% 0%
Total In Control Not In Control
Hispanic/Latino ethnicity 14% 15% 12%
Race
White/Caucasian 71% 69% 73%
Black/AfricanAmerican 11% 13% 8%
Asian 4% 4% 5%
Other 13% 12% 13%
201111-2061288
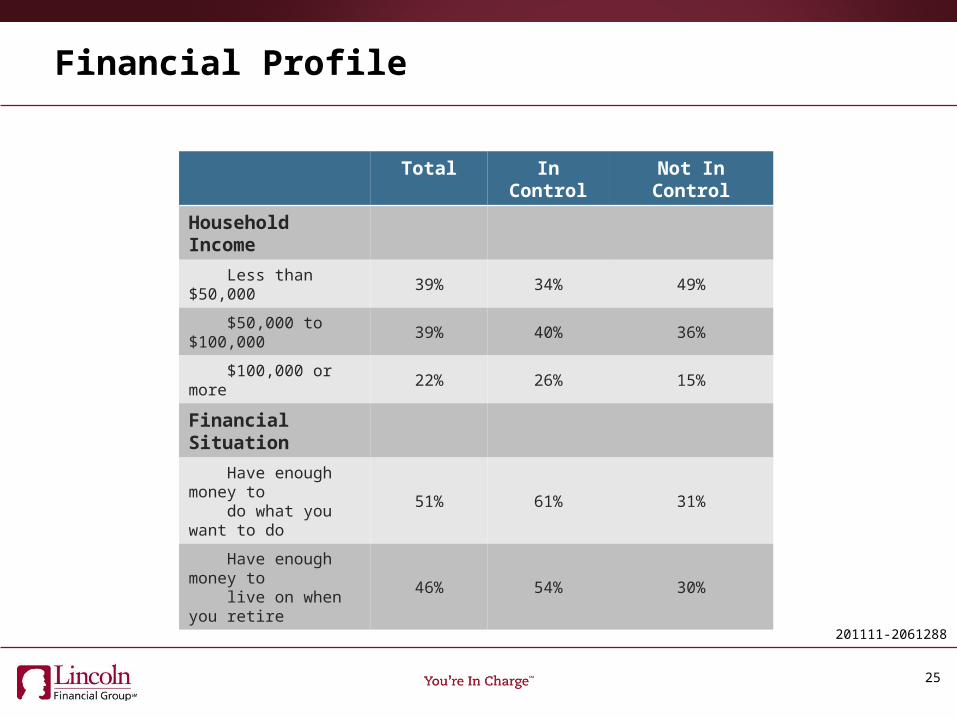
Financial Profile
25
Total In Control Not In Control
Household Income
Less than $50,000 39% 34% 49%
$50,000 to $100,000 39% 40% 36%
$100,000 or more 22% 26% 15%
Financial Situation
Have enough money to do what you want to do 51% 61% 31%
Have enough money to live on when you retire 46% 54% 30%
201111-2061288
Methodology
The MOOD (Measuring Optimism, Outlook and Direction) of America survey results are based on telephone interviews conducted by Whitman Insight Strategies on behalf of Lincoln Financial Group.
Interviews were conducted on November 4-8, 2011, among 803 adults 18 years of age and older across the United States.
The margin of error for total sample is ±3.5% at the 95% confidence interval, and is somewhat higher for subgroups. Respondents were contacted by phone via a live operator; their telephone numbers were selected using random-digit-dial methods. The sample was weighted by age, Hispanic ethnicity, race. Demographic weighting targets are based on the 2010 U.S. Census figures for adults 18 years of age and older.
26