Embed Size (px)
Citation preview

THE URBAN
INSTITUTE
Fundraising Effectiveness Project (FEP)
2011 Fundraising Effectiveness Survey Report Available at www.afpnet.org/FEP
2011 FEP Donor Retention Supplement November 17, 2011
Overall Donor Retention was 41 Percent in 2010 (Median) Repeat donor retention was 70 percent, new donor retention was 27 percent and
database donor retention was 10 percent (average)
FEP
Participating Donor Software Firms
Donor2/Campus Management Corporation* PhilanthrAppeal (FundTrack Software)*
DonorPerfect Fundraising Software* The Raiser’s Edge ® (Blackbaud)*
eTapestry* ROI Solutions
GiftWorks (Mission Research)* Sage Software*
MatchMaker FundRaising Software* Telosa Software (Exceed!)
Metafile*
* Charter member of the AFP Donor Software Workgroup
Project Sponsors
Association of Fundraising Professionals (AFP)* Center on Nonprofits and Philanthropy at the Urban Institute*
Association of Donor Relations Professionals (ADRP) Center on Philanthropy at Indiana University
Council for Advancement and Support of Education (CASE) Council for Resource Development (CRD)
National Committee on Planned Giving (NCPG)
* Founding partners, providing resources for the project.
Gai n
Loss
Net

1
2011 FEP Donor Retention Supplement
Summary of Fundraising Effectiveness Project Donor Retention Findings: These findings are based on data provided by 2,377 participating nonprofits about the 2010 behavior of 1.8 million 2009 donors to their organizations. Donor confidentiality is maintained for all FEP annual surveys. Key donor retention and attrition findings:
Overall* donor retention was 41 percent in 2010 (Median).
That is, only 41 percent of 2009 donors made repeat gifts to participating nonprofits in 2010 (Fig. 1, pg 3).
Overall* donor attrition in 2010 was 59 percent. That is, 59 percent of 2009 donors did not give again to participating nonprofits in 2010. These donors are also known as ―lapsed donors‖ or ―LYBUNTs‖ [Last-Year-BUt-Not-This] (Fig. 1, pg 3).
Repeat* donor retention was 70 percent. New* donor retention was only 27 percent (Fig. 2, pg 4).
Database* donor retention in 2010 was 10 percent. That is, only 10 percent of all prior donors of record in participating nonprofits’ donor databases gave again in 2010. (Fig. 3, pg 5).
Other findings: Overall annual donor retention varied from 50 percent in 2005 to a low of 41 percent in 2009, and overall donor attrition ranged from 50 percent in 2005 to a high of 59 percent in 2009 (Fig. 4, pg 6).
Only 65 of 2,377 respondents had retention rates over 70 percent. Half of the respondents had retention rates under 40 percent (Fig. 5, pg 7).
Several factors are related to the variations in retention rates (Fig. 6, pg 8).
Expanding donor relations programs can significantly increase retention and improve results (Fig. 7, pg 10).
Donor retention is less than the FEP survey median of 41 percent for groups of donors making gifts of under $250 and significantly higher for groups of $250-and-over donors where retention can range up to 70 percent or more (Case study, Fig. 8, pg 12).
Dimensions FEP measures and publishes statistics on gains, losses and net growth for both ―number of donors‖ and ―amount of gifts‖ (dollars). See Figure 8, page 11 for an illustrative FEP growth-in-giving (GiG) report. Definitions for the gain/loss categories are in Appendix A, page 13. FEP retention statistics are referred to in this supplement as ―donor retention‖ and ―gift$ retention.‖ This supplement focuses primarily on donor retention.
Donor retention categories are: New donor retention Repeat donor retention Overall donor retention Database donor retention
* See Appendix A for definitions and formulas for the four categories of donor retention using the FEP database (page 13).

2
About the Fundraising Effectiveness Project
In 2006 the Association of Fundraising Professionals (AFP) and the Center on Nonprofits and Philanthropy at the Urban Institute established the Fundraising Effectiveness Project to conduct research on fundraising effectiveness and help nonprofit organizations increase their fundraising results at a faster pace. Organizations listed on the cover page have joined them as sponsors of the project. The project goal is to help nonprofit organizations measure, compare, and maximize their annual growth in giving. The FEP Fundraising Effectiveness Database housed at the Urban Institute is available free to nonprofit sector researchers on request ([email protected]).
The groundbreaking annual Fundraising Effectiveness Survey, piloted in November 2006, collects fundraising data from nonprofit organizations beginning with data for 2004-2005. The Fundraising Effectiveness Survey enables participating nonprofits to measure and compare their fundraising gain and loss ratios to those of similar organizations. Participants can use this industry data, which AFP offers free, to make better-informed, growth-oriented budget decisions to boost donor revenue.
The 2011 Fundraising Effectiveness Survey Report is based on 2,377 responses for 2009-2010, received as of February, 2011, from nonprofit organizations in the United States. The 2009-2010 responses reflected a total amount raised of $1,645,470,816 for an average of $692,247 in amounts raised by 2,377 participating nonprofits that reported on the 2010 giving behavior of 1.8 million donors who had given to these organizations in 2009.

3
FEP Overall Donor Retention Rate
On average, the 2,377 respondents to the 2009-2010 annual Fundraising Effectiveness Survey reported that only 43 percent of their 2009 donors gave to them again in 2010. The average donor retention rate of 43 percent means that the donor attrition rate was 57 percent where 57 percent of 2009 donors did not renew their gifts to participating nonprofits in 2010.
As shown in Figure 1, only 16 percent gave more. On average, 15 percent of 2009 donors gave less in 2010 than in 2009 and 12 percent gave the same in 2010. With a donor attrition rate of 57 percent, the cumulative bad-to-poor growth-in-giving fundraising performance in 2010 was 84 percent. That is, 84 percent of the 2009 donors gave the same, gave less or stopped giving in 2010 even though annual giving appeals are designed to encourage giving more. Only 16 percent of 2009 donors gave more in 2010 than they did in 2009.
The median overall donor retention rate in 2010 was 41 Percent.
Figure 1 – Overall Donor Attrition and Retention for 2009-2010
Average Overall Donor Attrition and Retention
Donors Donors
As % of As % of
Attrition/Retention 2009 2009 total: 2009 total:
Category Donors Average 2010 Result Median
Attrition (lapsed) 997,523 57% Did not give in 2010 59%
Retention
Downgraded 256,381 15% Gave less in 2010 14%
Same 214,390 12% Gave the same in 2010 10%
Upgraded 284,835 16% Gave more in 2010 13%
Total retention * 755,606 43% Gave in 2010 41%
Total - 2009 donors ** 1,753,129 100% Gave in 2009
* 43% is the average or mean donor retention rate, 41% is the medain
** Total 2009 repeat donors for 2,377 repondents to the FEP 2009-2010 survey.
FEP Donor Attrition/Retention 2009-2010
Attrition (lapsed)
Downgraded
Same
Upgraded

4
While overall donor retention (combined new and repeat donor retention) for 2009-10 was 41 percent, new donor retention was only 27 percent and repeat donor retention was 70 percent. Repeat donor retention was 75 percent if previously lapsed donors that renewed their 2010 gifts are included in the calculation.
Figure 2 - New and Repeat Donor Attrition and Retention (Median) For 2004-05 through 2009-10
Retention: Repeat Donors Versus New Donors for 2005 to 2010 Surveys
Attrition/Retention
Category
Six Year
Average 2004-05 2005-06 2006-07 2007-08 2008-09 2009-10
New donors
Attrition * 76% 77% 77% 76% 75% 74% 73%
Retention 24% 23% 23% 24% 25% 26% 27%
* Some lapsed previous-year new donors may be renewed in future years
Repeat donors
Attrition 33% 34% 33% 33% 32% 31% 30%
Retention ** 67% 66% 67% 67% 68% 69% 70%
Retention - II *** 73% 72% 73% 73% 74% 75% 75%
** Repeat retention rate excludes previously lapsed donors renewed in 2010
*** Repeat retention rate - II includes previously lapsed donors renewed in 2010
45% 50% 46% 47% 45% 41% 43%
Overall (new and repeat combined)
Attrition 57% 54% 54% 55% 58% 59% 59%
Average 55% 50% 54% 53% 55% 59% 57%
Retention 43% 46% 46% 45% 42% 41% 41%Average 45% 50% 46% 47% 45% 41% 43%
0%
10%
20%
30%
40%
50%
60%
70%
80%
2005 2006 2007 2008 2009 2010
Repeat
New donors

5
Database Donor Retention Rate in 2010 was 10 Percent
Sixty two of the 2011 FEP survey respondents included in their data the total number of prior and current donors in their donor databases providing for calculation of the database donor retention and attrition rates.
Most nonprofits solicit all lapsed prior donors in their databases at least once a year. FEP survey data indicates that on average 90 percent of these survey respondents‘ prior donors did not make a gift in response to the annual giving appeals they received. This database donor attrition rate of 90 percent means that the database donor retention rate was 10 percent where only 10 percent of all prior donors that had ever given renewed their gifts to survey respondents in 2010.
Figure 3 – Database Donor Retention and Attrition Rates
Prior and Donors Database Database
Current Donors Solicited but Donor Donor
Donor Renewed Not renewed Retention Attrition
Database* In 2010** In 2010 Rate Rate
(A) (B) (C) (B/A) (B/C)
1,721,534 175,184 1,546,350 10% 90%
Median 18% 82%
* Excludes new donors acquired in 2010
** Includes previously lapsed donors recaptured in 2010 and
all 2009 donors that renewed in 2010.
Database Donor Retention/Attrition
Retention
Attrition
6
The average donor retention rate varied slightly over the six year period from 2005 to 2010, tracking economic conditions during the period -- ranging from 50 percent in 2005 to a low of 41 percent in 2009 and averaging 45 percent. Donor attrition exceeded donor retention all six years.
Figure 4 - Donor Retention and Attrition for 2004-05 through 2009-10
Retention Versus Attrition for 2005 to 2010 FEP Surveys
Attrition/Retention
Category
Six Year
Average 2004-05 2005-06 2006-07 2007-08 2008-09 2009-10
Attrition (lapsed) 55% 50% 54% 53% 55% 59% 57%
Median 57% 54% 54% 55% 58% 59% 59%
Retention
Downgraded 14% 16% 14% 14% 14% 14% 15%
Same 13% 15% 15% 15% 14% 12% 12%
Upgraded 17% 19% 18% 18% 17% 15% 16%
Total retention 45% 50% 46% 47% 45% 41% 43%
Median 43% 46% 46% 45% 42% 41% 41%
Total - 2009 donors 100% 100% 100% 100% 100% 100% 100%
0.0%
10.0%
20.0%
30.0%
40.0%
50.0%
60.0%
70.0%
2005 2006 2007 2008 2009 2010
Retention
Attrition

7
Only 65 of the 2,377 FEP 2009-10 survey respondents (3%) had donor retention rates over 70 percent while two-thirds had retention rates ranging from 50 percent to under 10 percent.
There is enormous room for improvement in donor retention!
Figure 5 - Donor Retention and Attrition by Donor Retention Rate for 2009-10
Donor Retention versus Attrition by Retention Rate for 2009-10
Attrition/Retention Total --------------------------------------------- Donor Retention Rate ---------------------------------------------------
Category 2009-10 100%-70% 70%-60% 60%-50% 50%-40% | 40%-30% 30%-20% 20%-10% 10%-0%
Responses --> 2,377 65 205 403 531 | 502 330 220 121
Percentage --> 100% 3% 9% 17% 22% | 21% 14% 9% 5%
|
Attrition (lapsed) 57% 25% 36% 45% 54% | 65% 75% 84% 94%
Median 59% 26% 35% 45% 54% | 65% 75% 84% 94%
Retention |
Downgraded 15% 21% 21% 18% 16% | 13% 9% 6% 3%
Same 12% 21% 18% 16% 13% | 10% 7% 4% 1%
Upgraded 16% 32% 25% 21% 17% | 13% 9% 6% 2%
Total retention 43% 75% 64% 55% 46% | 35% 25% 16% 6%
Median 41% 74% 65% 55% 46% | 35% 25% 16% 6%
|
Total - 2009 donors 100% 100% 100% 100% 100% | 100% 100% 100% 100%
|
<------ Over 40% retention ------- Median ------ Under 40% retention ----->
0.0%
10.0%
20.0%
30.0%
40.0%
50.0%
60.0%
70.0%
80.0%
90.0%
100.0%
100-70 70-60 60-50 50-40 40-30 30-20 20-10 10-0
Retention
Attrition

8
Several factors are related to the variations in retention rates.
Figure 6 - Factors Related to Retention By Donor Retention Rate for 2009-10
Statistics:
Growth in giving:
There is enormous potential for increased growth with increased donor retention. Overall net growth in donors from 2009 to 2010 ranged from 18 percent down to minus 53 percent, and net growth in gift$ ranged from plus 12 percent down to minus 43 percent.
2010 results by type of donor (new, previously lapsed and renewed 2009 donors):
Respondents with higher donor retention rates relied substantially less on new donor acquisition – almost 1:3.
Total ---------------------------------------------------- Donor Retention Rate ------------------------------------------------------
Factor 2009-10 100%-70% 70%-60% 60%-50% 50%-40% 40%-30% 30%-20% 20%-10% 10%-0%
Donor retention for group 43% 75% 64% 55% 46% 35% 25% 16% 6%
Median 41% 74% 65% 55% 46% 35% 25% 16% 6%
Gift$ retention for group 45% 63% 57% 50% 50% 42% 34% 29% 17%
Median 44% 63% 59% 54% 48% 41% 31% 21% 6%
Responses 2,377 65 205 403 531 502 330 220 121
Number of 2009 donors 1,753,129 24,301 183,685 399,327 481,173 309,469 196,693 119,420 39,061
Donors per respondent 738 374 896 991 906 616 596 543 323
Average gift size 923$ 1,196$ 824$ 781$ 931$ 966$ 1,181$ 1,009$ 871$
Avg respondent size 692,247$ 526,759$ 808,182$ 804,305$ 916,479$ 620,320$ 632,013$ 448,995$ 132,434$
Net growth in donors 2% 18% 10% 4% 9% 4% -10% -18% -53%
Net growth in gift$ -2% 12% 10% 3% 5% -1% -9% -33% -43%
Number of donors as a % of 2010 total:
New in 2010 44% 26% 27% 30% 43% 54% 61% 71% 78%
Previously-lapsed renewed 14% 10% 15% 17% 15% 12% 11% 9% 9%
2009 renewed in 2010 42% 64% 59% 53% 42% 34% 28% 20% 13%
Total 2010 donors 100% 100% 100% 100% 100% 100% 100% 100% 100%
Amount of gift$ as a % of 2010 total:
New in 2010 22% 21% 13% 17% 21% 22% 37% 25% 44%
Previously-lapsed renewed 13% 7% 13% 12% 12% 15% 9% 18% 11%
2009 renewed in 2010 65% 72% 74% 71% 67% 62% 54% 57% 44%
Total 2010 gift$ 100% 100% 100% 100% 100% 100% 100% 100% 100%

9
Investing more in donor relations may be one solution to the poor donor retention problem
The Association of Donor Relations Professionals defines donor relations as follows: ―Donor relations is the comprehensive effort of any nonprofit that seeks philanthropic support to ensure that donors experience high-quality interactions with the organization that foster long-term engagement and investment. This effort is commonly thought to have four elements—gift acceptance and management, acknowledgment, donor recognition, including events, and reporting (*) —that together support the acquisition and retention of donors.‖ http://www.adrp.net/assets/documents/adrpdefinitionsexpanded.pdf
(*) ―The fourth element is reporting to donors on the impact of their gifts on the mission of the organization‖ (from ADRP definition). Communicating with donors about their gifts at work is essential. According to research on donor attrition by Penelope Burk, 46 percent of donors who were asked ―why do you stop giving?‖ responded that they ―would stop giving to a charity they once supported for reasons that are tied to insufficient or poor quality information concerning their gifts at work‖ (page 15, Donor Centered Fundraising, 2003). These same reasons are likely to apply to stagnant and declining giving where repeat donors give the same or downgrade instead of upgrading the size of their gifts.
Donor relations resources
The Association of Donor Relations Professionals http://www.adrp.net/experts-bureau
Strategies for reducing attrition are provided in the following books on donor relations and retention.
Tom Ahem and Simone Joyaux, Keep Your Donors: The Guide to Better Communications and Stronger Relationships, AFP Fund Development Series, John Wiley & Sons, 2008.
Penelope Burk, Donor Centered Fundraising, Burk & Associates, Ltd./Cygnus Applied Research, 2003
Ken Burnett, Relationship Fundraising: A Donor-Based Approach to the Business of Raising Money, 2nd Addition, Jossey-Bass, 2002.
Adrian Sargeant, Elaine Jay, Building Donor Loyalty: The Fundraiser’s Guide to Increasing Lifetime Value, Jossey-Bass, 2004
Quotes from Penelope Burk‘s book found on pages 86-87 of Ken Burnett‘s book Relationship Fundraising:
“It takes more time to keep donors informed of what their money is achieving than it does to ask them for it” – which means devoting over 50 percent of staff time reporting to donors on their gifts at work.
―Sixty-nine percent of individual donors say none of the nonprofits they support call them without asking for another gift.‖
10
―Sixty-one percent of donors say they‘ve received a request for a second gift with their ‗thank you.‘ Eighty-one percent have been offended by this.‖ ―A donors‘ prime needs are to know the gift was received, to know the gift was ‗set to work‘ as intended, and to know the project or program is having the desired effect.‖
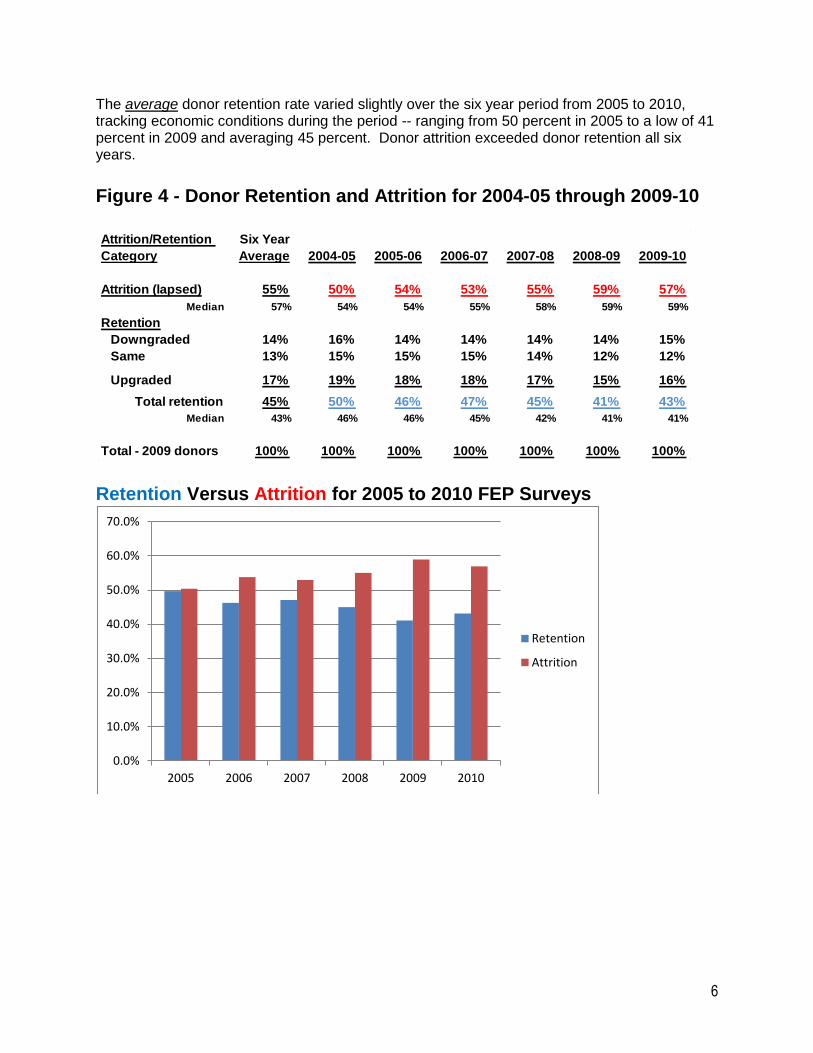
The potential for improved fundraising performance is enormous. Adrian Sargeant and Penelope Burk report in their books that donor retention can be increased by 50 percent -- or more – by investing in communications to donors about their gifts at work and other aspects of donor relations. A 50 percent increase in the FEP survey‘s 45 percent gift$ retention for 2010 would increase gift$ retention to nearly 70 percent (see Figure 7). Such increases in retention rates alone can significantly improve the annual rate of growth in giving in the nonprofit sector as indicated in Figure 7. For the average FEP 2009-10 survey respondent, an increase in gift$ retention from 45 percent to 70 percent would mean an increase in net growth in giving from -2 percent to 23 percent.
Figure 7 – Potential Impact of Increases in Retention Rates On Three 2011 National Growth in Giving Surveys
The differences between growth-in-giving results – FEP minus 2 percent, Chronicle 400 plus 4 percent and Giving USA plus 2 percent are consistent with FEP 2011 survey data, which indicates that growth in giving performance varies significantly according to size (based on total amount raised) with larger organizations performing much better than smaller ones.
FEP FEP ---------------- Growth in Giving ----------------
Donor Gift$ FEP Chronicle Giving
Retention(1) Retention(1) Survey(1) 400(2) USA(3)
Actual
Average 43% 45% -2% 4% 2%
Median 40% 44%
What if What if gift$ --- Growth in giving would have been ---
retention were 50% 3% 9% 7%
increased to: 55% 8% 14% 12%
60% 13% 19% 17%
65% 18% 24% 22%
70% 23% 29% 27%

11
AFPs Growth in Giving GiG Reports www.afpnet.org/FEP The core Growth-in-Giving (GiG) Report provides a concise, yet informative picture of fundraising gains and losses-growth in giving and attrition-in a simple, reader-friendly format that the executive staff and board members can understand. The Excel-based GiG Report template – downloadable from www.afpnet.org/FEP -- has instructions for retrieving gain(loss) data from donor databases and automatically produces the "Core GiG Report" - the centerpiece of the FEP gain(loss) reporting package along with 7 other useful GiG Reports.
Figure 8 – Illustrative FEP Growth-in-Giving (GiG) Report Average Gains & Losses for FEP 2009-10 Survey Respondents
See definitions for the Gain/Loss categories in Appendix A, page 14
Gain(Loss) Category Year 1 Year 2 Gains
For Year 2 Donors 2009 2010 (Losses)
(A$) (B$) (C$=B-A)
Gains Amount of GiftsNew n/a 152,797$ 152,797$
Recaptured n/a 87,809 87,809
Upgraded 122,173$ 259,017 136,844
Subtotal gains 122,173 499,624 377,451
Same 62,505 62,505 -
Losses
Downgraded 273,241 130,118 (143,123)
Lapsed new 99,468 n/a (99,468)
Lapsed repeat 148,337 n/a (148,337)
Subtotal losses 521,046 130,118 (390,928)
Total - gifts 705,724$ 692,247$ (13,477)$
Overall net growth in giving
12
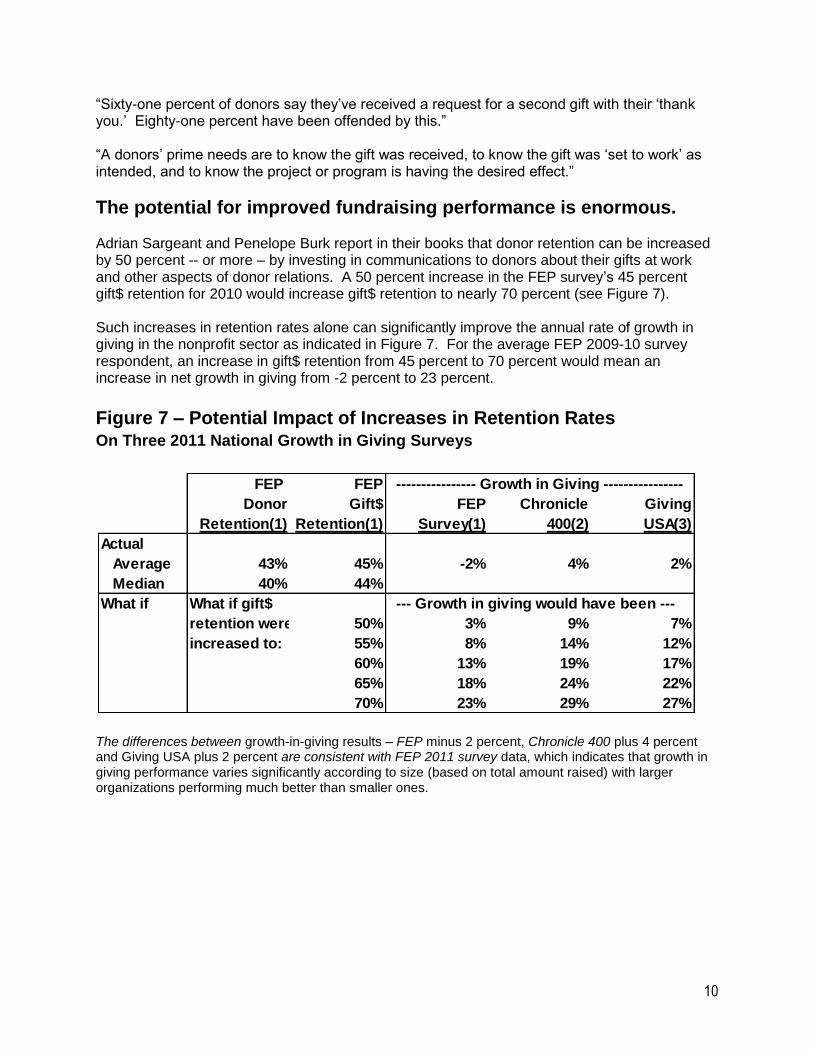
Donor Attrition and Retention Case Study For a Human Service Organization The overall donor retention rate for all donors at 40 percent was consistent with the FEP survey 2009-10 median of 41 percent. However, the retention rate varied from a lower 33 percent of the donors that gave less than $250 to higher retention rates ranging from 71 percent to 83 percent for donors that gave $250 or more. The same differences were observed for new donor retention, repeat donor retention and database donor retention.
Figure 9 - Donor Attrition and Retention Case Study By Range of Gift Size
Overall Donor Retention Versus Attrition for Case Study
----------------------------- Gift Size Range -------------------------
Attrition/Retention
Category All Donors
$250 &
Down
$250 to
$1,000
$1,000 to
$5,000 $5,000 & Up
Overall donor retention 40% 33% 71% 83% 75%
Overall donor attrition 60% 67% 29% 17% 25%
New donor retention 12% 11% 24% 42% 40%
New donor attrition 89% 89% 76% 58% 60%
Repeat donor retention 58% 51% 78% 86% 78%
Repeat donor attrition 42% 50% 23% 14% 22%
Database donor retention 16% 14% 28% 36% 25%
Database donor attrition 84% 86% 72% 64% 75%
Number of donors year 2 3,128 2,618 280 169 61
Percent of donors by range 100% 84% 9% 5% 2%
Amount of gift$ year 2 1,853,000$ 145,000$ 108,000$ 285,000$ 1,315,000$
Percent of gift$ by range 100% 8% 6% 15% 71%
Average gift size year 2 592$ 55$ 386$ 1,686$ 21,557$
0.0%
10.0%
20.0%
30.0%
40.0%
50.0%
60.0%
70.0%
80.0%
90.0%
0-250 250-1,000 1,000-5,000 5,000-up
Retention
Attrition
13
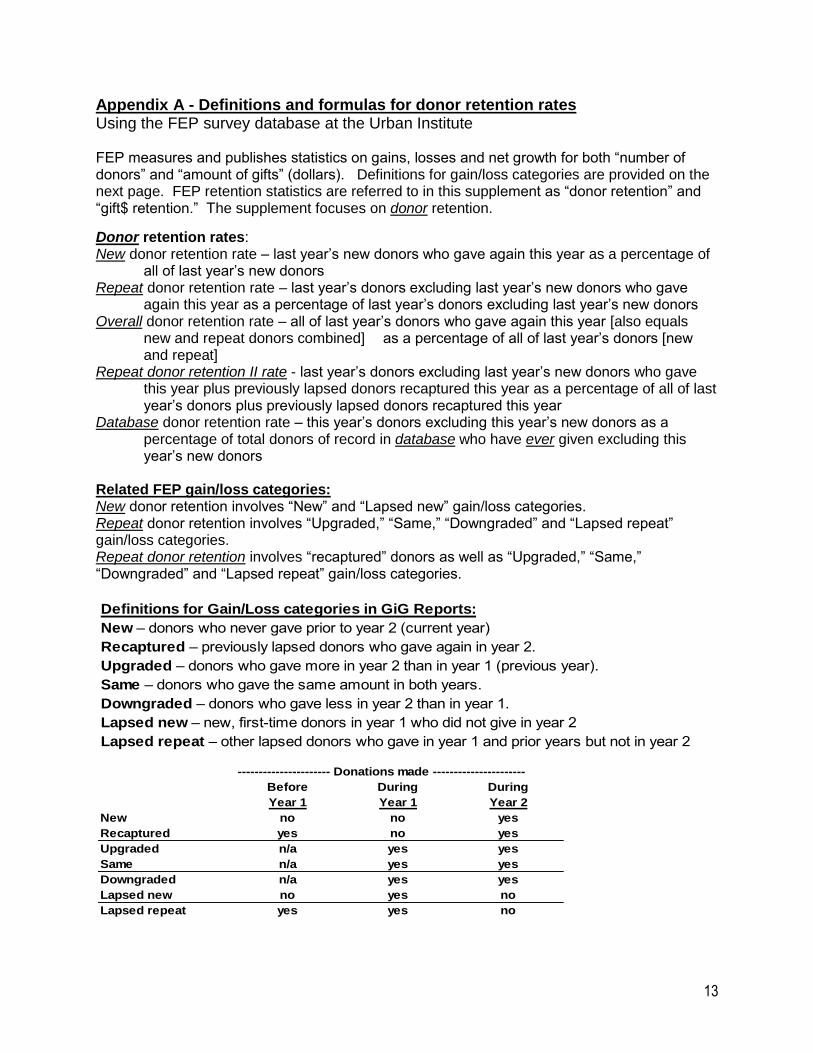
Appendix A - Definitions and formulas for donor retention rates Using the FEP survey database at the Urban Institute FEP measures and publishes statistics on gains, losses and net growth for both ―number of donors‖ and ―amount of gifts‖ (dollars). Definitions for gain/loss categories are provided on the next page. FEP retention statistics are referred to in this supplement as ―donor retention‖ and ―gift$ retention.‖ The supplement focuses on donor retention.
Donor retention rates: New donor retention rate – last year‘s new donors who gave again this year as a percentage of
all of last year‘s new donors Repeat donor retention rate – last year‘s donors excluding last year‘s new donors who gave
again this year as a percentage of last year‘s donors excluding last year‘s new donors Overall donor retention rate – all of last year‘s donors who gave again this year [also equals
new and repeat donors combined] as a percentage of all of last year‘s donors [new and repeat]
Repeat donor retention II rate - last year‘s donors excluding last year‘s new donors who gave this year plus previously lapsed donors recaptured this year as a percentage of all of last year‘s donors plus previously lapsed donors recaptured this year
Database donor retention rate – this year‘s donors excluding this year‘s new donors as a percentage of total donors of record in database who have ever given excluding this year‘s new donors
Related FEP gain/loss categories: New donor retention involves ―New‖ and ―Lapsed new‖ gain/loss categories. Repeat donor retention involves ―Upgraded,‖ ―Same,‖ ―Downgraded‖ and ―Lapsed repeat‖ gain/loss categories. Repeat donor retention involves ―recaptured‖ donors as well as ―Upgraded,‖ ―Same,‖ ―Downgraded‖ and ―Lapsed repeat‖ gain/loss categories.
Definitions for Gain/Loss categories in GiG Reports:
New – donors who never gave prior to year 2 (current year)
Recaptured – previously lapsed donors who gave again in year 2.
Upgraded – donors who gave more in year 2 than in year 1 (previous year).
Same – donors who gave the same amount in both years.
Downgraded – donors who gave less in year 2 than in year 1.
Lapsed new – new, first-time donors in year 1 who did not give in year 2
Lapsed repeat – other lapsed donors who gave in year 1 and prior years but not in year 2
---------------------- Donations made ----------------------
Before During During
Year 1 Year 1 Year 2
New no no yes
Recaptured yes no yes
Upgraded n/a yes yes
Same n/a yes yes
Downgraded n/a yes yes
Lapsed new no yes no
Lapsed repeat yes yes no


![„l rt äDbD dhNq...rWqfv iv sKsj ˆjec …]yc bf rWqf ipG À, (2) nCpG dEj mfKfv …iv zfnfv iv sKsj ˆjec Tst bf pfWqf ipG À ˆhQ (3) nCpG sFfhfv jfYfjfdY rWqf sKsj Fcsh bf pfWqf](https://img.dokumen.tips/doc/110x75/60fc6f296b2a3a3c4841df4e/al-rt-dbd-dhnq-rwqfv-iv-sksj-jec-yc-bf-rwqf-ipg-2-ncpg-dej-mfkfv.jpg)