Embed Size (px)
Citation preview
2011 Foreclosures in Minnesota:
A Report Based on County Sheriff’s Sale Data
revised February 24, 2012
Published by:
Prepared by:
275 Market Street Suite 509 Minneapolis, MN 55405
Telephone: 612-522-2500 Facsinile: 612-521-1577
www.housinglink.org

About the Minnesota Homeownership Center
Recognized nationally as a model of home ownership and foreclosure prevention programming, the Minnesota Homeownership Center convenes a network of 50 community-based nonprofit, government and tribal organizations to deliver homeownership education and foreclosure prevention services to low- and moderate-income households throughout Minnesota. Learn more at www.hocmn.org.
About Greater Minnesota Housing Fund
The Greater Minnesota Housing Fund is a private, nonprofit organization whose mission is to strengthen families and communities in greater Minnesota through the creation and preservation of affordable housing. Learn more at www.gmhf.com.
About Minnesota Housing
Minnesota Housing finances and advances affordable housing opportunities for low- and moderate- income Minnesotans to enhance quality of life and foster strong communities. Learn more at www.mnhousing.gov.
About Family Housing Fund
The Family Housing Fund is a nonprofit organization whose mission is to provide safe, affordable, sustainable homes to families and children in the Twin Cities metropolitan area through ongoing partnerships with the public and private sector. Learn more at www.fhfund.org.
About HousingLink
HousingLink is a primary distributor of affordable housing information to service agencies, housing providers, and policy workers in the Twin Cities metropolitan area and selected regions in Greater Minnesota. Learn more at www.housinglink.org.
All rights reserved. © Copyright 2012.

Table of Contents
Minnesota Foreclosure Figures Figure 1: Seven-Year History of Minnesota Foreclosures……………………………………………... 1 Figure 2: Map of MN Foreclosures by County, 2011………………………………………………. 2 Figure 3: Map of MN Foreclosure Rates by County, 2011…………………………………………... 3 Figure 4: MN County Foreclosure Counts, 2010-2011 (sorted by county)………………………….. 4 Figure 5: MN County Foreclosure Counts, 2010-2011 (sorted by 2011 total)………………………. 6 Figure 6: MN County Foreclosure Rates, 2010-2011 (sorted by county)……………………………. 8 Figure 7: MN County Foreclosure Rates, 2010-2011 (sorted by 2011 rate)…………………………. 10Study Purpose and Objectives……………………………………………………………………... 12Methodology…………………………………………………………………………………………. 12 Overview of the foreclosure process…………………………………………………………………... 12 Sheriff’s Sale Records………………………………………………………………………………… 14 Data Collection……………………………………………………………………………………… 14 Foreclosure Rate Metric……………………………………………………………………………… 14

2011 Foreclosures in Minnesota: A Report Based on County Sheriff’s Sales Data (revised February 24, 2012) Page Minnesota Homeownership Center (651) 659-9336
1
Seven-Year History of Minnesota Foreclosures There were 21,298 foreclosures in Minnesota in 2011, which is down 17% from 2010 and the lowest statewide total in four years. However, the total number of foreclosures stubbornly remains above the 20,000 mark, a figure which is over three times the number of annual foreclosures in 2005, the first year these numbers were compiled. Figure 1
The following pages include additional figures and appendices detailing foreclosures in Minnesota. They include:
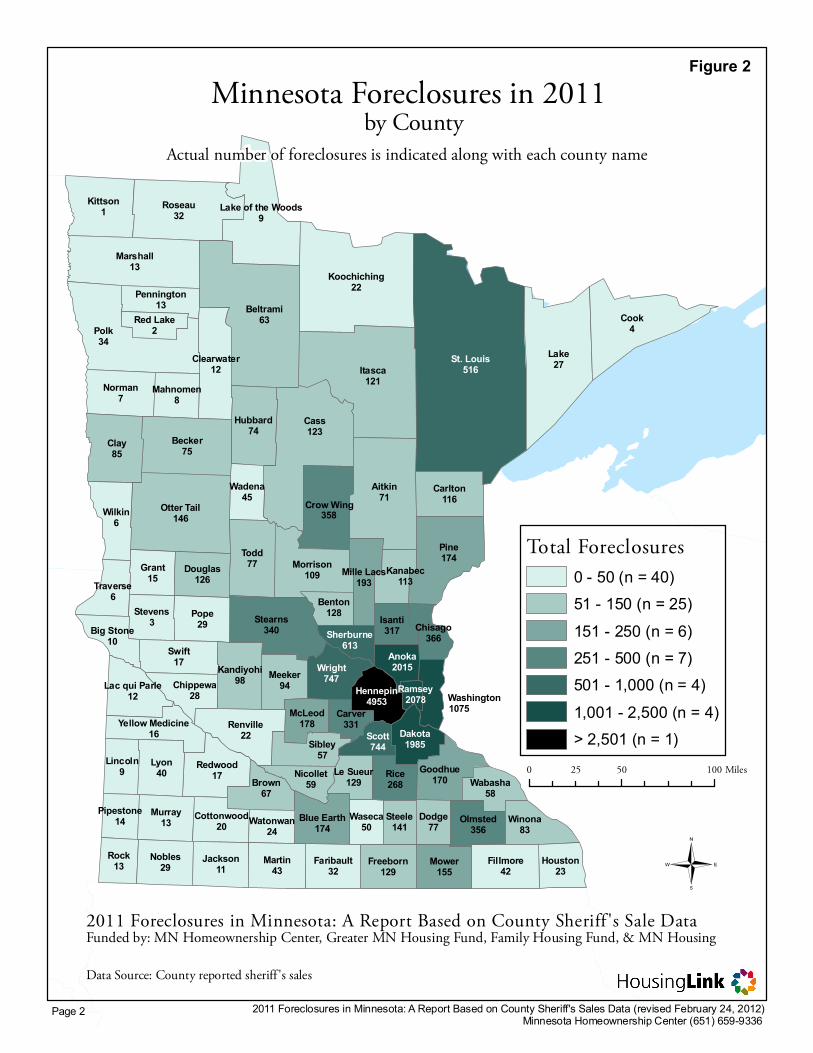
2011 Foreclosure Counts Map
A map of Minnesota representing total foreclosures by county in 2011. p.2
2011 Foreclosure Rates Map
A map of Minnesota representing foreclosure rate (in percent) by county in 2011. p.3
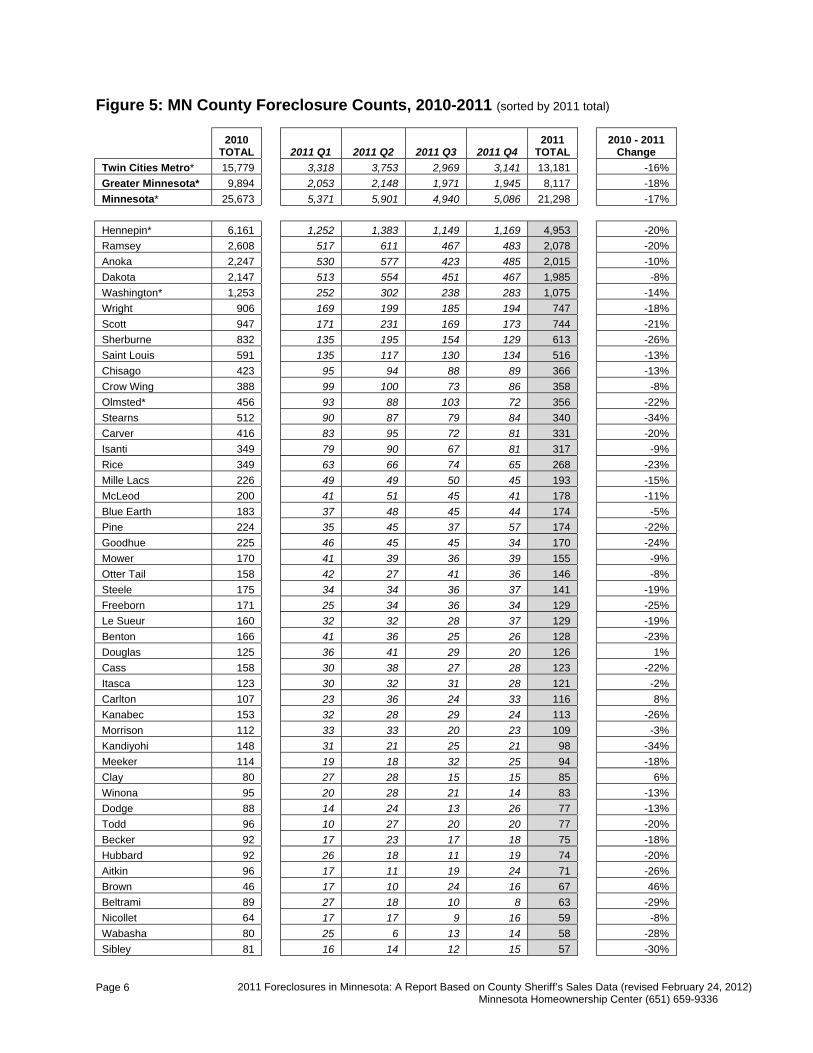
2010 – 2011 Foreclosure Counts Data
Tables detailing foreclosure counts from 2010 and four quarters of 2011, sorted by county and 2011 total. p.4-7
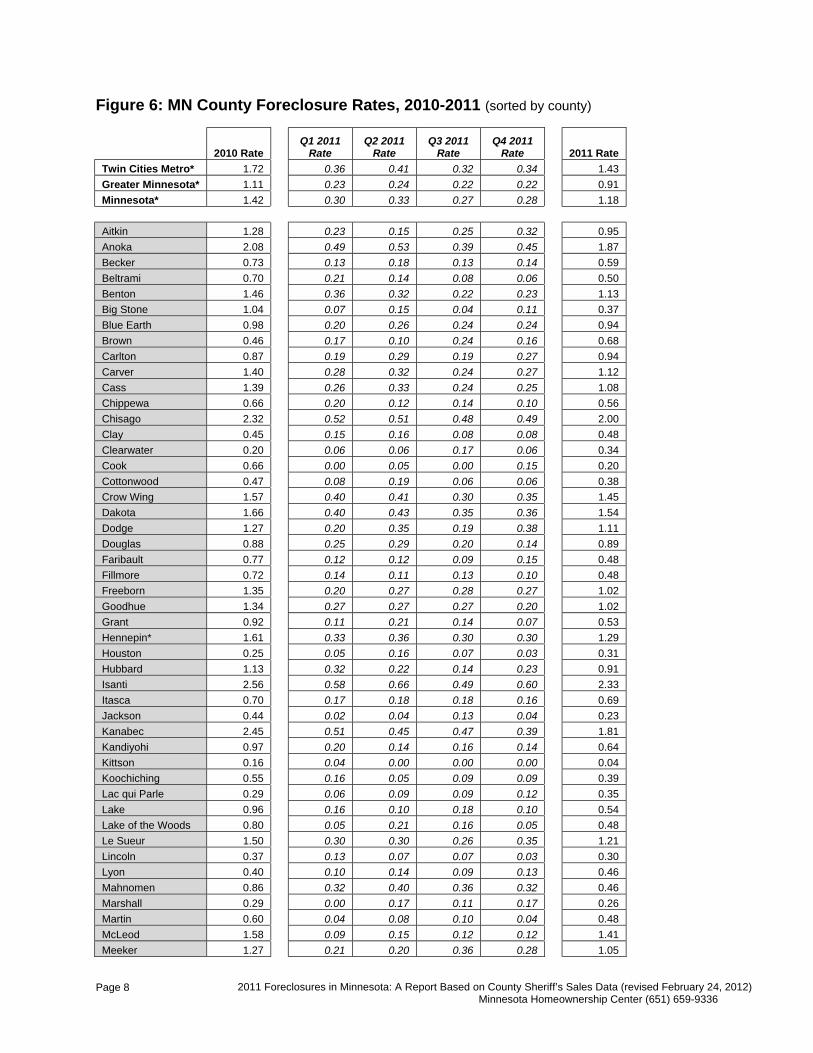
2010 – 2011 Foreclosure Rates Data
Tables detailing foreclosure rates from 2010 and four quarters of 2011, sorted by county and 2011 rate. p.8-11
More Minnesota foreclosure information and historical data can be found online at www.hocmn.org or www.housinglink.org
0
5000
10000
15000
20000
25000
30000
2005 2006 2007 2008 2009 2010 2011
Minnesota
7 County Metro
Greater MN
St. Louis516
Wright747
Dakota1985Scott
744
Anoka2015
Hennepin4953
Sherburne613
Ramsey2078
Itasca121
Lake27
Cass123
Polk34
Beltrami63
Aitkin71
Pine174
Cook4
Koochiching22
Otter Tail146
Clay85
Roseau32
Marshall13
Becker75
Todd77
Stearns340
Kittson1
Swift17
Lyon40
Pope29
Morrison109
Renville22
Wilkin6
Carlton116
Hubbard74
Rice268
Martin43
Norman7
Mower155
Fillmore42
Murray13
Nobles29
Grant15
Sibley57
Brown67
Rock13
Redwood17
Meeker94
Jackson11
Winona83
Douglas126
Goodhue170
Isanti317
Faribault32
Freeborn129
Olmsted356
Lincoln9
Blue Earth174
Stevens3
Steele141
Dodge77
Houston23
McLeod178
Nicollet59 Wabasha
58
Chippewa28
Benton128
Cottonwood20
Pennington13
Red Lake2
Clearwater12
Lake of the Woods9
Kandiyohi98
Wadena45
Traverse6
Mille Lacs193
Kanabec113
Lac qui Parle12
Waseca50
Carver331
Big Stone10
Chisago366
Mahnomen8
Le Sueur129
Yellow Medicine16
Pipestone14 Watonwan
24
0 - 50 (n = 40)51 - 150 (n = 25)151 - 250 (n = 6)251 - 500 (n = 7)501 - 1,000 (n = 4)1,001 - 2,500 (n = 4)> 2,501 (n = 1)
«
Figure 2
Washington1075
Page 2 2011 Foreclosures in Minnesota: A Report Based on County Sheriff's Sales Data (revised February 24, 2012)Minnesota Homeownership Center (651) 659-9336
Crow Wing358

Cass123
Pine174
Rice268
Wright747
Mower155
Meeker94
Goodhue170
Dakota1985
Isanti317
Freeborn129
Scott744
Steele141
Anoka2015
Dodge77
McLeod178
Benton128
Mille Lacs193
Hennepin4953
Kanabec113
Carver331
Chisago366
Le Sueur129
Sherburne613
Ramsey2078
St. Louis516Itasca
121
Lake27
Polk34
Beltrami63
Aitkin71
Cook4
Koochiching22
Otter Tail146
Clay85
Roseau32
Marshall13
Becker75
Todd77
Stearns340
Kittson1
Swift17
Lyon40
Pope29
Morrison109
Renville22
Wilkin6
Carlton116
Hubbard74
Martin43
Norman7
Fillmore42
Murray13
Nobles29
Grant15
Sibley57
Brown67
Rock13
Redwood17
Jackson11
Winona83
Douglas126
Faribault32
Olmsted356
Lincoln9
Blue Earth174
Stevens3
Houston23
Nicollet59 Wabasha
58
Chippewa28
Cottonwood20
Pennington13
Red Lake2
Clearwater12
Lake of the Woods9
Kandiyohi98
Wadena45
Traverse6
Lac qui Parle12
Waseca50
Big Stone10
Mahnomen8
Yellow Medicine16
Pipestone14 Watonwan
24
Foreclosure Rates0% - 0.25% (n=7)0.26% - 0.5% (n=26)0.51 - 0.75% (n=19)0.76% - 1.0% (n=9)1.01% - 1.5% (n=16)1.51% - 2.0% (n=6)>2.0% (n=4)
«
Figure 3
Washington1075
Page 3 2011 Foreclosures in Minnesota: A Report Based on County Sheriff's Sales Data (revised February 24, 2012)Minnesota Homeownership Center (651) 659-9336
Crow Wing358

2011 Foreclosures in Minnesota: A Report Based on County Sheriff’s Sales Data (revised February 24, 2012) Minnesota Homeownership Center (651) 659-9336
Page 4
Figure 4: MN County Foreclosure Counts, 2010-2011 (sorted by county)
2010
TOTAL 2011 Q1 2011 Q2 2011 Q3 2011 Q4 2011
TOTAL 2010 - 2011
Change Twin Cities Metro* 15,779 3,318 3,753 2,969 3,141 13,181 -16% Greater Minnesota* 9,894 2,053 2,148 1,971 1,945 8,117 -18% Minnesota* 25,673 5,371 5,901 4,940 5,086 21,298 -17% Aitkin 96 17 11 19 24 71 -26% Anoka 2,247 530 577 423 485 2,015 -10% Becker 92 17 23 17 18 75 -18% Beltrami 89 27 18 10 8 63 -29% Benton 166 41 36 25 26 128 -23% Big Stone 28 2 4 1 3 10 -64% Blue Earth 183 37 48 45 44 174 -5% Brown 46 17 10 24 16 67 46% Carlton 107 23 36 24 33 116 8% Carver 416 83 95 72 81 331 -20% Cass 158 30 38 27 28 123 -22% Chippewa 33 10 6 7 5 28 -15% Chisago 423 95 94 88 89 366 -13% Clay 80 27 28 15 15 85 6% Clearwater 7 2 2 6 2 12 71% Cook 13 0 1 0 3 4 -69% Cottonwood 25 4 10 3 3 20 -20% Crow Wing 388 99 100 73 86 358 -8% Dakota 2,147 513 554 451 467 1,985 -8% Dodge 88 14 24 13 26 77 -13% Douglas 125 36 41 29 20 126 1% Faribault 51 8 8 6 10 32 -37% Fillmore 63 12 10 11 9 42 -33% Freeborn 171 25 34 36 34 129 -25% Goodhue 225 46 45 45 34 170 -24% Grant 26 3 6 4 2 15 -42% Hennepin* 6,161 1,252 1,383 1,149 1,169 4,953 -20% Houston 19 4 12 5 2 23 21% Hubbard 92 26 18 11 19 74 -20% Isanti 349 79 90 67 81 317 -9% Itasca 123 30 32 31 28 121 -2% Jackson 21 1 2 6 2 11 -48% Kanabec 153 32 28 29 24 113 -26% Kandiyohi 148 31 21 25 21 98 -34% Kittson 4 1 0 0 0 1 -75% Koochiching 31 9 3 5 5 22 -29% Lac qui Parle 10 2 3 3 4 12 20% Lake 48 8 5 9 5 27 -44% Lake of the Woods 15 1 4 3 1 9 -40% Le Sueur 160 32 32 28 37 129 -19% Lincoln 11 4 2 2 1 9 -18% Lyon 35 9 12 8 11 40 14% Mahnomen 15 0 3 2 3 8 -47% Marshall 14 2 4 5 2 13 -7% Martin 53 8 13 11 11 43 -19%

2011 Foreclosures in Minnesota: A Report Based on County Sheriff’s Sales Data (revised February 24, 2012) Page Minnesota Homeownership Center (651) 659-9336
5
2010
TOTAL 2011 Q1 2011 Q2 2011 Q3 2011 Q4 2011
TOTAL 2010 - 2011
Change McLeod 200 41 51 45 41 178 -11% Meeker 114 19 18 32 25 94 -18% Mille Lacs 226 49 49 50 45 193 -15% Morrison 112 33 33 20 23 109 -3% Mower 170 41 39 36 39 155 -9% Murray 10 3 2 3 5 13 30% Nicollet 64 17 17 9 16 59 -8% Nobles 29 6 9 5 9 29 0% Norman 6 2 1 1 3 7 17% Olmsted* 456 93 88 103 72 356 -22% Otter Tail 158 42 27 41 36 146 -8% Pennington 15 3 2 5 3 13 -13% Pine 224 35 45 37 57 174 -22% Pipestone 10 5 2 4 3 14 40% Polk 45 8 9 7 10 34 -24% Pope 25 7 11 9 2 29 16% Ramsey 2,608 517 611 467 483 2,078 -20% Red Lake 6 1 0 0 1 2 -67% Redwood 22 3 6 3 5 17 -23% Renville 26 7 5 7 3 22 -15% Rice 349 63 66 74 65 268 -23% Rock 11 4 3 2 4 13 18% Roseau 39 9 6 10 7 32 -18% Saint Louis 591 135 117 130 134 516 -13% Scott 947 171 231 169 173 744 -21% Sherburne 832 135 195 154 129 613 -26% Sibley 81 16 14 12 15 57 -30% Stearns 512 90 87 79 84 340 -34% Steele 175 34 34 36 37 141 -19% Stevens 6 0 1 1 1 3 -50% Swift 31 6 2 6 3 17 -45% Todd 96 10 27 20 20 77 -20% Traverse 4 3 0 2 1 6 50% Wabasha 80 25 6 13 14 58 -28% Wadena 34 17 12 9 7 45 32% Waseca 81 16 10 10 14 50 -38% Washington* 1,253 252 302 238 283 1,075 -14% Watonwan 42 6 4 6 8 24 -43% Wilkin 12 3 1 1 1 6 -50% Winona 95 20 28 21 14 83 -13% Wright 906 169 199 185 194 747 -18% Yellow Medicine 15 6 5 5 0 16 7%
* Reflects different 2011 Q1 and 2011 Q2 totals from the August 9, 2011 release of “Foreclosures in Minnesota” due to amended reporting from Hennepin, Washington, and Olmsted Counties.
2011 Foreclosures in Minnesota: A Report Based on County Sheriff’s Sales Data (revised February 24, 2012) Minnesota Homeownership Center (651) 659-9336
Page 6
Figure 5: MN County Foreclosure Counts, 2010-2011 (sorted by 2011 total)
2010
TOTAL 2011 Q1 2011 Q2 2011 Q3 2011 Q4 2011
TOTAL 2010 - 2011
Change Twin Cities Metro* 15,779 3,318 3,753 2,969 3,141 13,181 -16% Greater Minnesota* 9,894 2,053 2,148 1,971 1,945 8,117 -18% Minnesota* 25,673 5,371 5,901 4,940 5,086 21,298 -17% Hennepin* 6,161 1,252 1,383 1,149 1,169 4,953 -20% Ramsey 2,608 517 611 467 483 2,078 -20% Anoka 2,247 530 577 423 485 2,015 -10% Dakota 2,147 513 554 451 467 1,985 -8% Washington* 1,253 252 302 238 283 1,075 -14% Wright 906 169 199 185 194 747 -18% Scott 947 171 231 169 173 744 -21% Sherburne 832 135 195 154 129 613 -26% Saint Louis 591 135 117 130 134 516 -13% Chisago 423 95 94 88 89 366 -13% Crow Wing 388 99 100 73 86 358 -8% Olmsted* 456 93 88 103 72 356 -22% Stearns 512 90 87 79 84 340 -34% Carver 416 83 95 72 81 331 -20% Isanti 349 79 90 67 81 317 -9% Rice 349 63 66 74 65 268 -23% Mille Lacs 226 49 49 50 45 193 -15% McLeod 200 41 51 45 41 178 -11% Blue Earth 183 37 48 45 44 174 -5% Pine 224 35 45 37 57 174 -22% Goodhue 225 46 45 45 34 170 -24% Mower 170 41 39 36 39 155 -9% Otter Tail 158 42 27 41 36 146 -8% Steele 175 34 34 36 37 141 -19% Freeborn 171 25 34 36 34 129 -25% Le Sueur 160 32 32 28 37 129 -19% Benton 166 41 36 25 26 128 -23% Douglas 125 36 41 29 20 126 1% Cass 158 30 38 27 28 123 -22% Itasca 123 30 32 31 28 121 -2% Carlton 107 23 36 24 33 116 8% Kanabec 153 32 28 29 24 113 -26% Morrison 112 33 33 20 23 109 -3% Kandiyohi 148 31 21 25 21 98 -34% Meeker 114 19 18 32 25 94 -18% Clay 80 27 28 15 15 85 6% Winona 95 20 28 21 14 83 -13% Dodge 88 14 24 13 26 77 -13% Todd 96 10 27 20 20 77 -20% Becker 92 17 23 17 18 75 -18% Hubbard 92 26 18 11 19 74 -20% Aitkin 96 17 11 19 24 71 -26% Brown 46 17 10 24 16 67 46% Beltrami 89 27 18 10 8 63 -29% Nicollet 64 17 17 9 16 59 -8% Wabasha 80 25 6 13 14 58 -28% Sibley 81 16 14 12 15 57 -30%

2011 Foreclosures in Minnesota: A Report Based on County Sheriff’s Sales Data (revised February 24, 2012) Page Minnesota Homeownership Center (651) 659-9336
7
2010
TOTAL 2011 Q1 2011 Q2 2011 Q3 2011 Q4 2011
TOTAL 2010 - 2011
Change Waseca 81 16 10 10 14 50 -38% Wadena 34 17 12 9 7 45 32% Martin 53 8 13 11 11 43 -19% Fillmore 63 12 10 11 9 42 -33% Lyon 35 9 12 8 11 40 14% Polk 45 8 9 7 10 34 -24% Faribault 51 8 8 6 10 32 -37% Roseau 39 9 6 10 7 32 -18% Nobles 29 6 9 5 9 29 0% Pope 25 7 11 9 2 29 16% Chippewa 33 10 6 7 5 28 -15% Lake 48 8 5 9 5 27 -44% Watonwan 42 6 4 6 8 24 -43% Houston 19 4 12 5 2 23 21% Koochiching 31 9 3 5 5 22 -29% Renville 26 7 5 7 3 22 -15% Cottonwood 25 4 10 3 3 20 -20% Redwood 22 3 6 3 5 17 -23% Swift 31 6 2 6 3 17 -45% Yellow Medicine 15 6 5 5 0 16 7% Grant 26 3 6 4 2 15 -42% Pipestone 10 5 2 4 3 14 40% Marshall 14 2 4 5 2 13 -7% Murray 10 3 2 3 5 13 30% Pennington 15 3 2 5 3 13 -13% Rock 11 4 3 2 4 13 18% Clearwater 7 2 2 6 2 12 71% Lac qui Parle 10 2 3 3 4 12 20% Jackson 21 1 2 6 2 11 -48% Big Stone 28 2 4 1 3 10 -64% Lake of the Woods 15 1 4 3 1 9 -40% Lincoln 11 4 2 2 1 9 -18% Mahnomen 15 0 3 2 3 8 -47% Norman 6 2 1 1 3 7 17% Traverse 4 3 0 2 1 6 50% Wilkin 12 3 1 1 1 6 -50% Cook 13 0 1 0 3 4 -69% Stevens 6 0 1 1 1 3 -50% Red Lake 6 1 0 0 1 2 -67% Kittson 4 1 0 0 0 1 -75%
* Reflects different 2011 Q1 and 2011 Q2 totals from the August 9, 2011 release of “Foreclosures in Minnesota” due to amended reporting from Hennepin, Washington, and Olmsted Counties.
2011 Foreclosures in Minnesota: A Report Based on County Sheriff’s Sales Data (revised February 24, 2012) Minnesota Homeownership Center (651) 659-9336
Page 8
Figure 6: MN County Foreclosure Rates, 2010-2011 (sorted by county)
2010 Rate Q1 2011
Rate Q2 2011
Rate Q3 2011
Rate Q4 2011
Rate 2011 Rate Twin Cities Metro* 1.72 0.36 0.41 0.32 0.34 1.43 Greater Minnesota* 1.11 0.23 0.24 0.22 0.22 0.91 Minnesota* 1.42 0.30 0.33 0.27 0.28 1.18 Aitkin 1.28 0.23 0.15 0.25 0.32 0.95 Anoka 2.08 0.49 0.53 0.39 0.45 1.87 Becker 0.73 0.13 0.18 0.13 0.14 0.59 Beltrami 0.70 0.21 0.14 0.08 0.06 0.50 Benton 1.46 0.36 0.32 0.22 0.23 1.13 Big Stone 1.04 0.07 0.15 0.04 0.11 0.37 Blue Earth 0.98 0.20 0.26 0.24 0.24 0.94 Brown 0.46 0.17 0.10 0.24 0.16 0.68 Carlton 0.87 0.19 0.29 0.19 0.27 0.94 Carver 1.40 0.28 0.32 0.24 0.27 1.12 Cass 1.39 0.26 0.33 0.24 0.25 1.08 Chippewa 0.66 0.20 0.12 0.14 0.10 0.56 Chisago 2.32 0.52 0.51 0.48 0.49 2.00 Clay 0.45 0.15 0.16 0.08 0.08 0.48 Clearwater 0.20 0.06 0.06 0.17 0.06 0.34 Cook 0.66 0.00 0.05 0.00 0.15 0.20 Cottonwood 0.47 0.08 0.19 0.06 0.06 0.38 Crow Wing 1.57 0.40 0.41 0.30 0.35 1.45 Dakota 1.66 0.40 0.43 0.35 0.36 1.54 Dodge 1.27 0.20 0.35 0.19 0.38 1.11 Douglas 0.88 0.25 0.29 0.20 0.14 0.89 Faribault 0.77 0.12 0.12 0.09 0.15 0.48 Fillmore 0.72 0.14 0.11 0.13 0.10 0.48 Freeborn 1.35 0.20 0.27 0.28 0.27 1.02 Goodhue 1.34 0.27 0.27 0.27 0.20 1.02 Grant 0.92 0.11 0.21 0.14 0.07 0.53 Hennepin* 1.61 0.33 0.36 0.30 0.30 1.29 Houston 0.25 0.05 0.16 0.07 0.03 0.31 Hubbard 1.13 0.32 0.22 0.14 0.23 0.91 Isanti 2.56 0.58 0.66 0.49 0.60 2.33 Itasca 0.70 0.17 0.18 0.18 0.16 0.69 Jackson 0.44 0.02 0.04 0.13 0.04 0.23 Kanabec 2.45 0.51 0.45 0.47 0.39 1.81 Kandiyohi 0.97 0.20 0.14 0.16 0.14 0.64 Kittson 0.16 0.04 0.00 0.00 0.00 0.04 Koochiching 0.55 0.16 0.05 0.09 0.09 0.39 Lac qui Parle 0.29 0.06 0.09 0.09 0.12 0.35 Lake 0.96 0.16 0.10 0.18 0.10 0.54 Lake of the Woods 0.80 0.05 0.21 0.16 0.05 0.48 Le Sueur 1.50 0.30 0.30 0.26 0.35 1.21 Lincoln 0.37 0.13 0.07 0.07 0.03 0.30 Lyon 0.40 0.10 0.14 0.09 0.13 0.46 Mahnomen 0.86 0.32 0.40 0.36 0.32 0.46 Marshall 0.29 0.00 0.17 0.11 0.17 0.26 Martin 0.60 0.04 0.08 0.10 0.04 0.48 McLeod 1.58 0.09 0.15 0.12 0.12 1.41 Meeker 1.27 0.21 0.20 0.36 0.28 1.05

2011 Foreclosures in Minnesota: A Report Based on County Sheriff’s Sales Data (revised February 24, 2012) Page Minnesota Homeownership Center (651) 659-9336
9
2010 Rate Q1 2011
Rate Q2 2011
Rate Q3 2011
Rate Q4 2011
Rate 2011 Rate Mille Lacs 2.47 0.54 0.54 0.55 0.49 2.11 Morrison 0.87 0.26 0.26 0.16 0.18 0.85 Mower 1.17 0.28 0.27 0.25 0.27 1.06 Murray 0.24 0.07 0.05 0.07 0.12 0.31 Nicollet 0.64 0.17 0.17 0.09 0.16 0.59 Nobles 0.38 0.08 0.12 0.07 0.12 0.38 Norman 0.17 0.06 0.03 0.03 0.09 0.20 Olmsted* 0.94 0.19 0.18 0.21 0.15 0.73 Otter Tail 0.65 0.17 0.11 0.17 0.15 0.60 Pennington 0.31 0.06 0.04 0.10 0.06 0.27 Pine 2.05 0.32 0.41 0.34 0.52 1.59 Pipestone 0.24 0.12 0.05 0.10 0.07 0.34 Polk 0.37 0.07 0.07 0.06 0.08 0.28 Pope 0.50 0.14 0.22 0.18 0.04 0.58 Ramsey 1.79 0.35 0.42 0.32 0.33 1.42 Red Lake 0.33 0.06 0.00 0.00 0.06 0.11 Redwood 0.33 0.05 0.09 0.05 0.08 0.26 Renville 0.38 0.10 0.07 0.10 0.04 0.32 Rice 1.80 0.32 0.34 0.38 0.33 1.38 Rock 0.27 0.10 0.07 0.05 0.10 0.32 Roseau 0.63 0.15 0.10 0.16 0.11 0.52 Saint Louis 0.79 0.18 0.16 0.17 0.18 0.69 Scott 2.23 0.40 0.54 0.40 0.41 1.75 Sherburne 2.93 0.47 0.69 0.54 0.45 2.16 Sibley 1.36 0.27 0.23 0.20 0.25 0.95 Stearns 1.12 0.20 0.19 0.17 0.18 0.75 Steele 1.40 0.27 0.27 0.29 0.30 1.13 Stevens 0.16 0.00 0.03 0.03 0.03 0.08 Swift 0.68 0.13 0.04 0.13 0.07 0.38 Todd 0.97 0.10 0.27 0.20 0.20 0.78 Traverse 0.21 0.15 0.00 0.10 0.05 0.31 Wabasha 0.94 0.29 0.07 0.15 0.16 0.68 Wadena 0.63 0.31 0.22 0.17 0.13 0.83 Waseca 1.19 0.23 0.15 0.15 0.21 0.73 Washington* 1.55 0.31 0.37 0.30 0.35 1.33 Watonwan 0.95 0.14 0.09 0.14 0.18 0.55 Wilkin 0.41 0.10 0.03 0.03 0.03 0.21 Winona 0.60 0.13 0.18 0.13 0.09 0.52 Wright 2.18 0.41 0.48 0.44 0.47 1.80 Yellow Medicine 0.32 0.13 0.11 0.11 0.00 0.35
* Reflects different 2011 Q1 and 2011 Q2 totals from the August 9, 2011 release of “Foreclosures in Minnesota” due to amended reporting from Hennepin, Washington, and Olmsted Counties.

2011 Foreclosures in Minnesota: A Report Based on County Sheriff’s Sales Data (revised February 24, 2012) Minnesota Homeownership Center (651) 659-9336
Page 10
Figure 7: MN County Foreclosure Rates, 2010-2011 (sorted by 2011 rate)
2010 Rate Q1 2011
Rate Q2 2011
Rate Q3 2011
Rate Q4 2011
Rate 2011 Rate Twin Cities Metro* 1.72 0.36 0.41 0.32 0.34 1.43 Greater Minnesota* 1.11 0.23 0.24 0.22 0.22 0.91 Minnesota* 1.42 0.30 0.33 0.27 0.28 1.18 Isanti 2.56 0.58 0.66 0.49 0.60 2.33 Sherburne 2.93 0.47 0.69 0.54 0.45 2.16 Mille Lacs 2.47 0.54 0.54 0.55 0.49 2.11 Chisago 2.32 0.52 0.51 0.48 0.49 2.00 Anoka 2.08 0.49 0.53 0.39 0.45 1.87 Kanabec 2.45 0.51 0.45 0.47 0.39 1.81 Wright 2.18 0.41 0.48 0.44 0.47 1.80 Scott 2.23 0.40 0.54 0.40 0.41 1.75 Pine 2.05 0.32 0.41 0.34 0.52 1.59 Dakota 1.66 0.40 0.43 0.35 0.36 1.54 Crow Wing 1.57 0.40 0.41 0.30 0.35 1.45 Ramsey 1.79 0.35 0.42 0.32 0.33 1.42 McLeod 1.58 0.09 0.15 0.12 0.12 1.41 Rice 1.80 0.32 0.34 0.38 0.33 1.38 Washington* 1.55 0.31 0.37 0.30 0.35 1.33 Hennepin* 1.61 0.33 0.36 0.30 0.30 1.29 Le Sueur 1.50 0.30 0.30 0.26 0.35 1.21 Steele 1.40 0.27 0.27 0.29 0.30 1.13 Benton 1.46 0.36 0.32 0.22 0.23 1.13 Carver 1.40 0.28 0.32 0.24 0.27 1.12 Dodge 1.27 0.20 0.35 0.19 0.38 1.11 Cass 1.39 0.26 0.33 0.24 0.25 1.08 Mower 1.17 0.28 0.27 0.25 0.27 1.06 Meeker 1.27 0.21 0.20 0.36 0.28 1.05 Freeborn 1.35 0.20 0.27 0.28 0.27 1.02 Goodhue 1.34 0.27 0.27 0.27 0.20 1.02 Sibley 1.36 0.27 0.23 0.20 0.25 0.95 Aitkin 1.28 0.23 0.15 0.25 0.32 0.95 Carlton 0.87 0.19 0.29 0.19 0.27 0.94 Blue Earth 0.98 0.20 0.26 0.24 0.24 0.94 Hubbard 1.13 0.32 0.22 0.14 0.23 0.91 Douglas 0.88 0.25 0.29 0.20 0.14 0.89 Morrison 0.87 0.26 0.26 0.16 0.18 0.85 Wadena 0.63 0.31 0.22 0.17 0.13 0.83 Todd 0.97 0.10 0.27 0.20 0.20 0.78 Stearns 1.12 0.20 0.19 0.17 0.18 0.75 Waseca 1.19 0.23 0.15 0.15 0.21 0.73 Olmsted* 0.94 0.19 0.18 0.21 0.15 0.73 Saint Louis 0.79 0.18 0.16 0.17 0.18 0.69 Itasca 0.70 0.17 0.18 0.18 0.16 0.69 Wabasha 0.94 0.29 0.07 0.15 0.16 0.68 Brown 0.46 0.17 0.10 0.24 0.16 0.68 Kandiyohi 0.97 0.20 0.14 0.16 0.14 0.64 Otter Tail 0.65 0.17 0.11 0.17 0.15 0.60 Becker 0.73 0.13 0.18 0.13 0.14 0.59

2011 Foreclosures in Minnesota: A Report Based on County Sheriff’s Sales Data (revised February 24, 2012) Page Minnesota Homeownership Center (651) 659-9336
11
2010 Rate Q1 2011
Rate Q2 2011
Rate Q3 2011
Rate Q4 2011
Rate 2011 Rate Nicollet 0.64 0.17 0.17 0.09 0.16 0.59 Pope 0.50 0.14 0.22 0.18 0.04 0.58 Chippewa 0.66 0.20 0.12 0.14 0.10 0.56 Watonwan 0.95 0.14 0.09 0.14 0.18 0.55 Lake 0.96 0.16 0.10 0.18 0.10 0.54 Grant 0.92 0.11 0.21 0.14 0.07 0.53 Winona 0.60 0.13 0.18 0.13 0.09 0.52 Roseau 0.63 0.15 0.10 0.16 0.11 0.52 Beltrami 0.70 0.21 0.14 0.08 0.06 0.50 Martin 0.60 0.04 0.08 0.10 0.04 0.48 Faribault 0.77 0.12 0.12 0.09 0.15 0.48 Lake of the Woods 0.80 0.05 0.21 0.16 0.05 0.48 Fillmore 0.72 0.14 0.11 0.13 0.10 0.48 Clay 0.45 0.15 0.16 0.08 0.08 0.48 Lyon 0.40 0.10 0.14 0.09 0.13 0.46 Mahnomen 0.86 0.32 0.40 0.36 0.32 0.46 Koochiching 0.55 0.16 0.05 0.09 0.09 0.39 Nobles 0.38 0.08 0.12 0.07 0.12 0.38 Cottonwood 0.47 0.08 0.19 0.06 0.06 0.38 Swift 0.68 0.13 0.04 0.13 0.07 0.38 Big Stone 1.04 0.07 0.15 0.04 0.11 0.37 Yellow Medicine 0.32 0.13 0.11 0.11 0.00 0.35 Lac qui Parle 0.29 0.06 0.09 0.09 0.12 0.35 Clearwater 0.20 0.06 0.06 0.17 0.06 0.34 Pipestone 0.24 0.12 0.05 0.10 0.07 0.34 Rock 0.27 0.10 0.07 0.05 0.10 0.32 Renville 0.38 0.10 0.07 0.10 0.04 0.32 Traverse 0.21 0.15 0.00 0.10 0.05 0.31 Murray 0.24 0.07 0.05 0.07 0.12 0.31 Houston 0.25 0.05 0.16 0.07 0.03 0.31 Lincoln 0.37 0.13 0.07 0.07 0.03 0.30 Polk 0.37 0.07 0.07 0.06 0.08 0.28 Pennington 0.31 0.06 0.04 0.10 0.06 0.27 Marshall 0.29 0.00 0.17 0.11 0.17 0.26 Redwood 0.33 0.05 0.09 0.05 0.08 0.26 Jackson 0.44 0.02 0.04 0.13 0.04 0.23 Wilkin 0.41 0.10 0.03 0.03 0.03 0.21 Norman 0.17 0.06 0.03 0.03 0.09 0.20 Cook 0.66 0.00 0.05 0.00 0.15 0.20 Red Lake 0.33 0.06 0.00 0.00 0.06 0.11 Stevens 0.16 0.00 0.03 0.03 0.03 0.08 Kittson 0.16 0.04 0.00 0.00 0.00 0.04
* Reflects different 2011 Q1 and 2011 Q2 totals from the August 9, 2011 release of “Foreclosures in Minnesota” due to amended reporting from Hennepin, Washington, and Olmsted Counties.

2011 Foreclosures in Minnesota: A Report Based on County Sheriff’s Sales Data (revised February 24, 2012) Minnesota Homeownership Center (651) 659-9336
Page 12
Study Purpose and Objectives This report was commissioned by the Minnesota Homeownership Center. It provides policymakers and other community leaders with updated Minnesota foreclosure data as they design solutions to address foreclosures and their impact on Minnesota communities. This report is part of the Foreclosures in Minnesota: A Report Based on County Sheriff’s Sale Data series, in which comparable reports have been released annually since 2007 and semi-annually since 2009. HousingLink was contracted to conduct the research and prepare the analysis in all reports. Key updated foreclosure data included in this report are as follows:
• Updated foreclosure counts for all Minnesota counties including the Twin Cites seven-county metro and Greater Minnesota to reflect actual foreclosures through all of 2011.
• Updated foreclosure rates for all Minnesota counties in 2011.1 The calculation of
foreclosure rates makes it possible to compare the relative impact of foreclosure on areas with different population sizes.
• This report does not include a foreclosure projection. Reports issued prior to 2009 included
a foreclosure projection. These projections were based solely on recent foreclosure trends with the assumption that the same patterns would continue into the upcoming year. Due to continuing uncertainty about future economic conditions, this report does not include a projection.
Some factors that may contribute to foreclosures include but are not limited to: unstable economic conditions; unemployment rates; falling housing prices; rising numbers of mortgage delinquencies; and resetting or recasting adjustable rate mortgages. Conversely, more active intervention and loss mitigation activities on the part of counselors and lenders help to reduce the number of foreclosures.
Methodology To help understand the methods used in this report, it is important to outline Minnesota’s foreclosure timeline. Data is collected throughout the process, much of which is useful for analyzing the characteristics of those mortgages and properties that have defaulted.
1 Releases of Foreclosures in Minnesota: A Report Based on County Sheriff’s Sale Data prior to August 2009 release used household estimates to calculate the foreclosure rate. As of the August 2009 report, residential parcels have been used to calculate foreclosure rate. See Foreclosure Rate Metric for more information.

2011 Foreclosures in Minnesota: A Report Based on County Sheriff’s Sales Data (revised February 24, 2012) Page Minnesota Homeownership Center (651) 659-9336
13
Overview of the Foreclosure Process
There are two types of foreclosure processes in Minnesota: 1) Judicial Foreclosure, which is conducted like any other form of civil lawsuit. 2) Foreclosure by Advertisement, which is a type of non-judicial foreclosure.
Since the large majority of Minnesota foreclosures occur by advertisement, that process is described in detail below.
Foreclosure by Advertisement: Foreclosures in Minnesota take place at the county level and are regulated, for the most part, by state legislation. The foreclosure process can start as early as 30 days after a borrower first misses a mortgage payment. Once the mortgage is in delinquency, the lender empowers an attorney who files notice of pendency against the borrower, starting the foreclosure process.
Shortly thereafter, the attorney publishes a foreclosure sale notice in a local newspaper (at least six weeks before the date of the sheriff’s sale) and the county serves the filing to the homeowner. At any point before the sheriff’s sale, the property owner can reinstate the mortgage by paying all dues, fees and expenses.1 1 As of June 15, 2009, MN State Law allows homeowners to delay their foreclosure sale by five months. The homeowner must file for postponement between the first publication of the sheriff’s sale and 15 days prior to the sale. This reduces the redemption period to five weeks.

2011 Foreclosures in Minnesota: A Report Based on County Sheriff’s Sales Data (revised February 24, 2012) Minnesota Homeownership Center (651) 659-9336
Page 14
After the notice has been published and served, the sheriff’s sale occurs and the sheriff auctions the property off to the highest bidder, resulting in foreclosure of the mortgage. Following the sale is a redemption period of up to six months, during which the borrower can redeem the property by paying the amount of sale plus interest, taxes, fees, or liens on the property. Borrowers who do not redeem the property by the expiration of the redemption period lose title and right of occupancy in the property.
Sheriff’s Sale Records
Sheriff’s sale records are the primary data that identify foreclosed properties and are identified as “foreclosures” within this report. However, it is helpful to understand the following: Sheriff’s sale records do not reflect the total number of properties that enter the foreclosure
process. Some portion of properties identified in sheriff’s sale records do not result in actual loss of title
and occupancy for borrowers because they are redeemed within the allowed timeframe. A small percentage of sheriff’s sale records do not relate to residential mortgages.1 According to a
previous study conducted by the Federal Reserve and Macalester College, less than 2 percent of Minneapolis-St. Paul properties sold at sheriff’s sales are commercial. Also, HousingLink estimates approximately 2 percent of properties in its foreclosure database are the result of association liens. Taking into account these two figures, it is estimated that at least 95 percent of the foreclosures in this study represent residential properties.
Data Collection
To obtain the number of sheriff’s sales in each county, HousingLink contacted all Minnesota counties. For the updates in this report, counties were asked to provide HousingLink with the total number of sheriff’s sales that occurred in their jurisdiction through December 2011. Foreclosure Rate Metric
The calculation of a foreclosure rate makes it possible to compare the relative impact of foreclosures on areas with different population sizes. The foreclosure rate used in this report identifies the number of sheriff’s sales as a percent of total residential parcels. foreclosure rate (in percentage) = sheriff’s sales in county / residential parcels in county2
1 Residential mortgages include single-family and multi-family homes. 2 Residential parcel data is typically provided by the MN Department of Revenue on an annual basis. However, 2011 parcel data was not available at the time this report was prepared, and thus 2011 foreclosure rate calculations are based on 2010 parcel data.