Embed Size (px)
Citation preview

2011 Economic ForecastFebruary 8, 2011
University Plaza Hotel Springfield, MissouriDr. David Mitchell, Director
Bureau of Economic Research
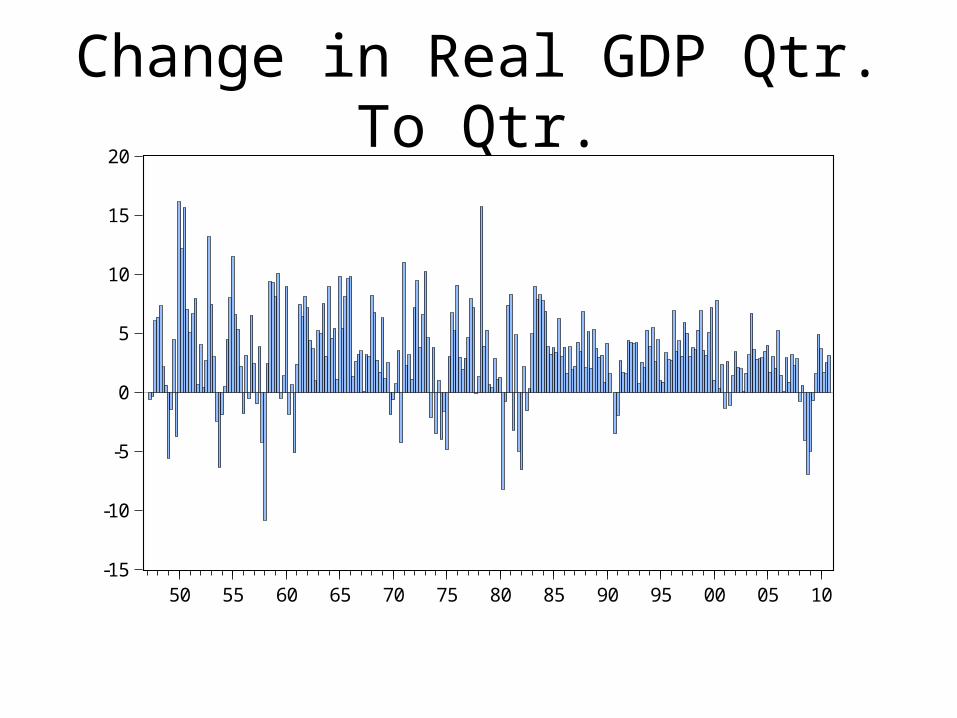
Change in Real GDP Qtr. To Qtr.
-15
-10
-5
0
5
10
15
20
50 55 60 65 70 75 80 85 90 95 00 05 10

GDP Components
GDP Consumption Investment Government Exports Imports
-50
-40
-30
-20
-10
0
10
20
2007:4 - 2009:2 2009:2 - 2010:4

US Employment
116,000
120,000
124,000
128,000
132,000
136,000
140,000
144,000
148,000
90 92 94 96 98 00 02 04 06 08 10
146.5 mil12/07
139.2 mil12/10

US Employment
136,000
138,000
140,000
142,000
144,000
146,000
148,000
2006 2007 2008 2009 2010
From Peak to Trough --Job Losses of 8.62 mil
138.59 mil
146.58 mil
139.2 mil

US Unemployment Rate
3
4
5
6
7
8
9
10
11
90 92 94 96 98 00 02 04 06 08 10
Average 4.5% in 2007
Peak of 10.1%
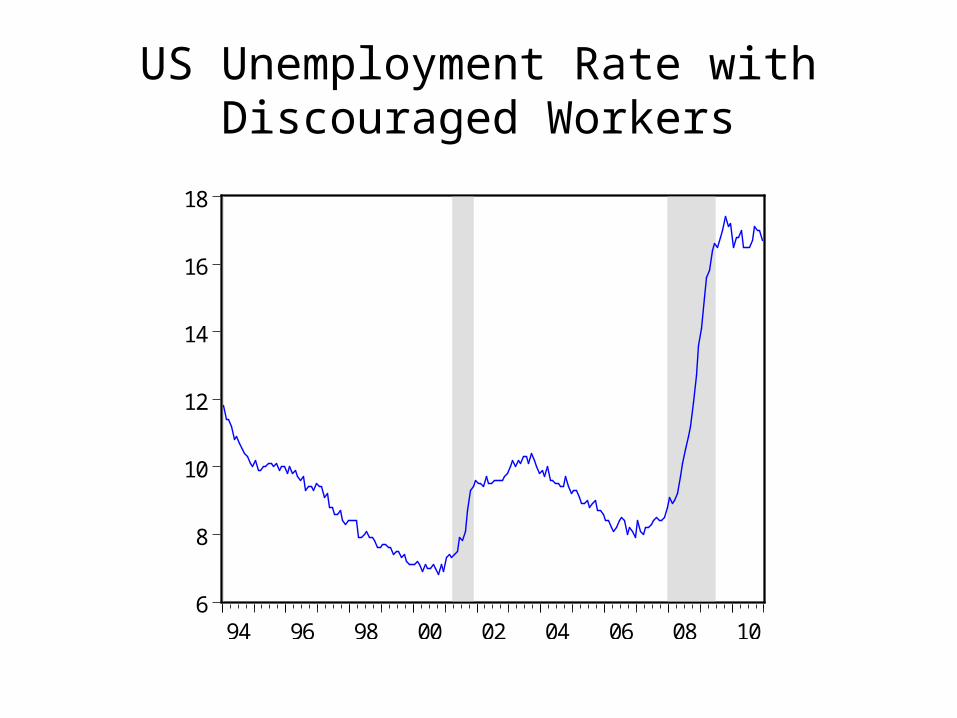
US Unemployment Rate with Discouraged Workers
6
8
10
12
14
16
18
94 96 98 00 02 04 06 08 10
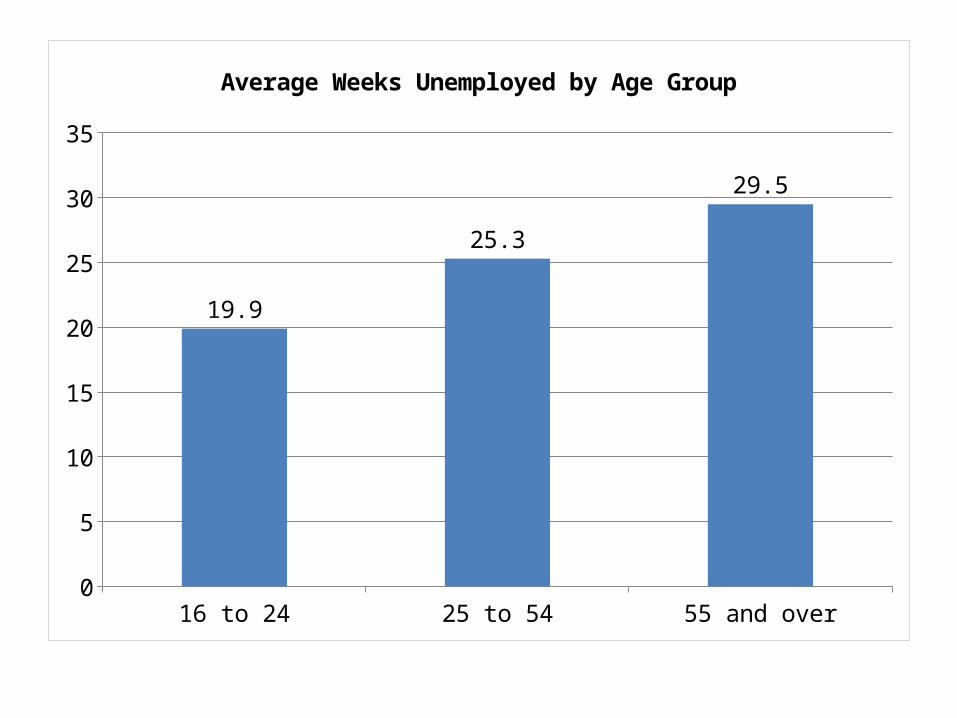
16 to 24 25 to 54 55 and over0
5
10
15
20
25
30
35
19.9
25.3
29.5
Average Weeks Unemployed by Age Group

US Employment(2000s Average Growth Rate in Employment)
1990 1991 1993 1995 1997 1998 2000 2002 2004 2005 2007 2009 2011 2012 2014 2016 2018 2019115,000
125,000
135,000
145,000
155,000
165,000
175,000
Actual No Recession
12.6 Million Jobs

US Employment(1990s Average Growth Rate in Employment)
1990199119931995199619982000200120032005200620082010201120132015201620182020115000
125000
135000
145000
155000
165000
175000
Actual No Recession
7.8 million jobs

US and Missouri Median Home PricesConstant Dollars 2010:Q2
100,000
120,000
140,000
160,000
180,000
200,000
220,000
240,000
260,000
00 01 02 03 04 05 06 07 08 09 10
Missouri United States
$180,1762002:Q1
$123,7542001:Q1
$142,857decline of 13.3%
$240,289decline of 25%
Peak 2006:Q4
Peak 2006:Q4
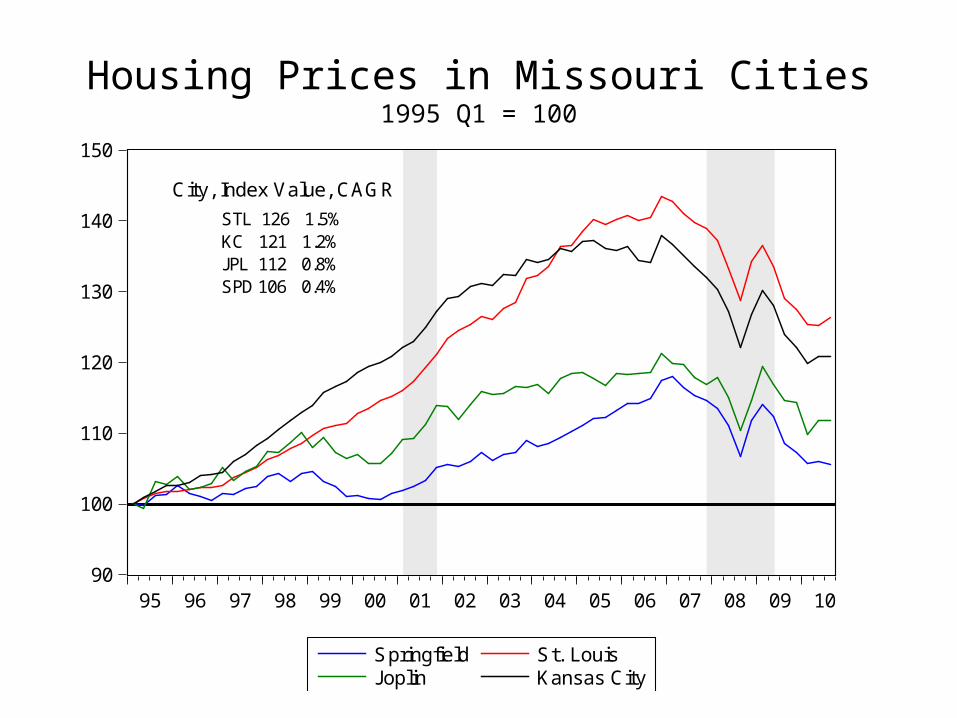
Housing Prices in Missouri Cities1995 Q1 = 100
90
100
110
120
130
140
150
95 96 97 98 99 00 01 02 03 04 05 06 07 08 09 10
Springfield St. LouisJoplin Kansas City
STL 126 1.5%KC 121 1.2%JPL 112 0.8%SPD 106 0.4%
City, Index Value, CAGR

US and Missouri Home Prices(1980:Q1 = 100 ; Constant $1980)
103.3
122.6
80
90
100
110
120
130
140
150
160
80 82 84 86 88 90 92 94 96 98 00 02 04 06 08 10
US Missouri
Area, Index, CAGR
US 131 0.9%MO 110 0.3%

Real Residential Value of Construction (Millions of 2010 $ SAAR)
200,000
300,000
400,000
500,000
600,000
700,000
800,000
94 96 98 00 02 04 06 08 10

New Single Family Home Permitsper 10,000 population
10
20
30
40
50
60
80 82 84 86 88 90 92 94 96 98 00 02 04 06 08 10
US SFH/10,000 Mo SFH/10,000

Missouri SFH Permits/10,000 pop
10
15
20
25
30
35
40
45
50
80 82 84 86 88 90 92 94 96 98 00 02 04 06 08 10
1985-2005 Average

Missouri Personal Income(Constant 2010:Q3 Million $--SAAR)
140,000
150,000
160,000
170,000
180,000
190,000
200,000
210,000
220,000
230,000
90 92 94 96 98 00 02 04 06 08 10

Missouri Personal Income

Growth in Missouri Personal Income(Year over Year)
-6
-4
-2
0
2
4
6
90 92 94 96 98 00 02 04 06 08 10
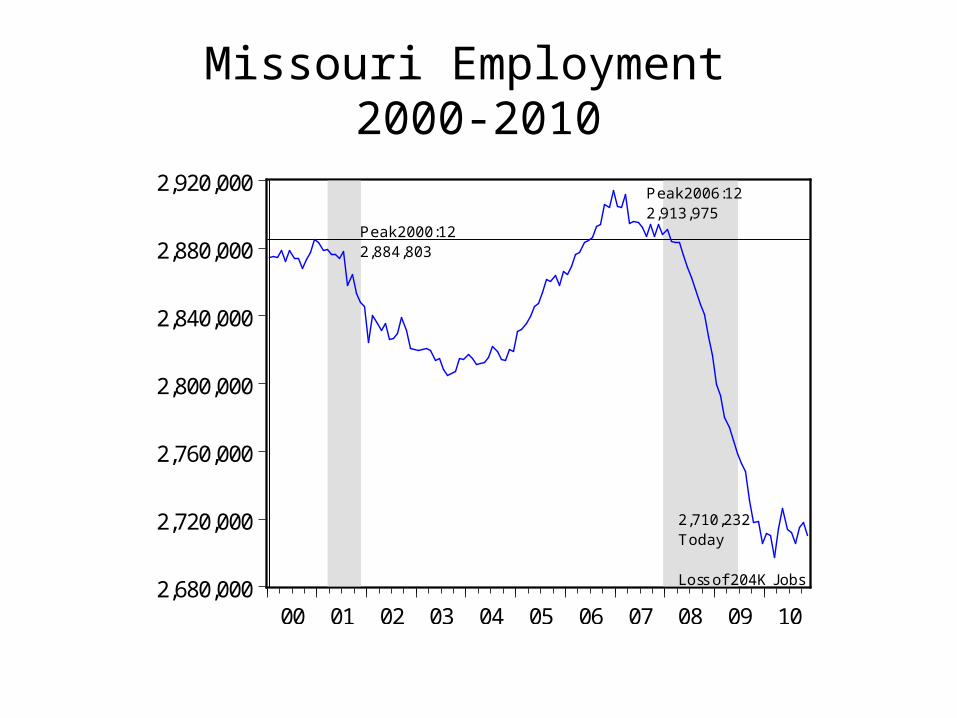
Missouri Employment 2000-2010
2,680,000
2,720,000
2,760,000
2,800,000
2,840,000
2,880,000
2,920,000
00 01 02 03 04 05 06 07 08 09 10
Peak 2000:122,884,803
Peak 2006:122,913,975
2,710,232Today
Loss of 204K Jobs
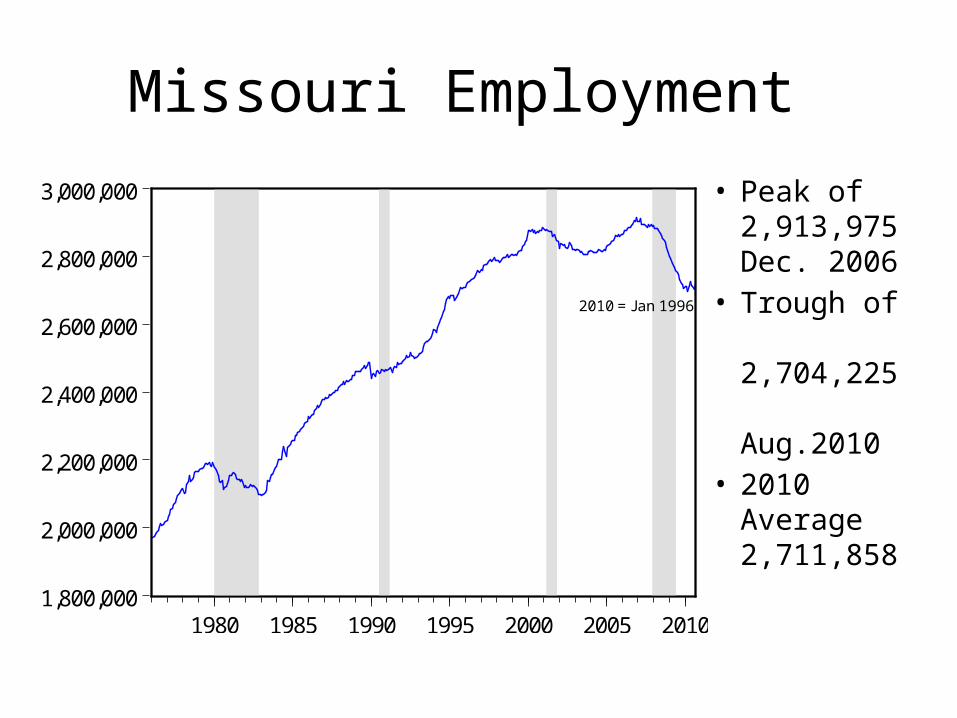
Missouri Employment
• Peak of 2,913,975 Dec. 2006
• Trough of 2,704,225 Aug.2010
• 2010 Average 2,711,858
1,800,000
2,000,000
2,200,000
2,400,000
2,600,000
2,800,000
3,000,000
1980 1985 1990 1995 2000 2005 2010
2010 = Jan 1996

Missouri Employment (Percent Change Year over Year)
-6
-4
-2
0
2
4
6
1980 1985 1990 1995 2000 2005 2010
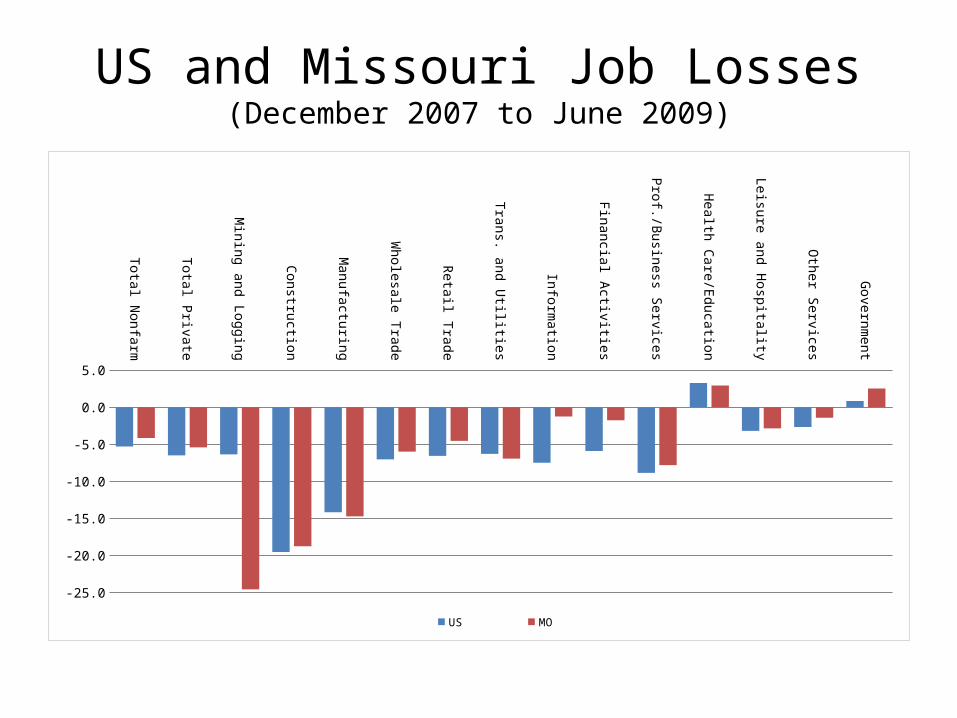
US and Missouri Job Losses(December 2007 to June 2009)
Total Nonfarm
Total Private
Mining and Logging
Construction
Manufacturing
Wholesale Trade
Retail Trade
Trans. and Utilities
Information
Financial Activities
Prof./Business Services
Health Care/Education
Leisure and Hospitality
Other Services
Government
-25.0
-20.0
-15.0
-10.0
-5.0
0.0
5.0
US MO
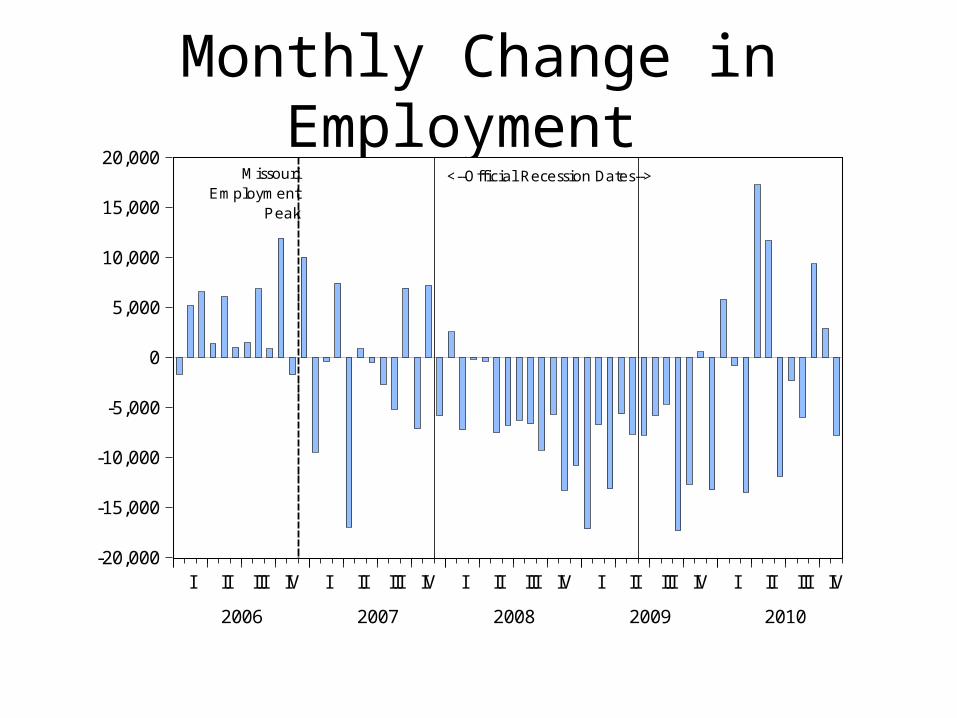
Monthly Change in Employment
-20,000
-15,000
-10,000
-5,000
0
5,000
10,000
15,000
20,000
I II III IV I II III IV I II III IV I II III IV I II III IV
2006 2007 2008 2009 2010
MissouriEmployment
Peak
<--Official Recession Dates-->

Change in US and Missouri Employment(Percent relative to Jan 2006 Employment level)
-.8
-.6
-.4
-.2
.0
.2
.4
.6
.8
I II III IV I II III IV I II III IV I II III
2007 2008 2009 2010
Missouri US
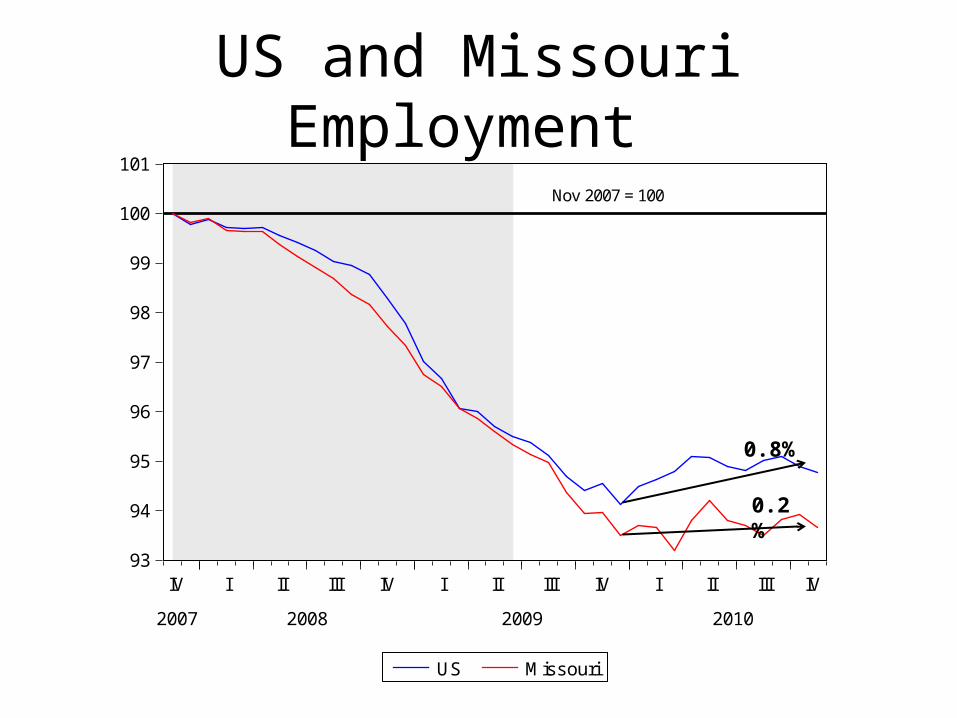
US and Missouri Employment
93
94
95
96
97
98
99
100
101
IV I II III IV I II III IV I II III IV
2007 2008 2009 2010
US Missouri
Nov 2007 = 100
0.8%
0.2%
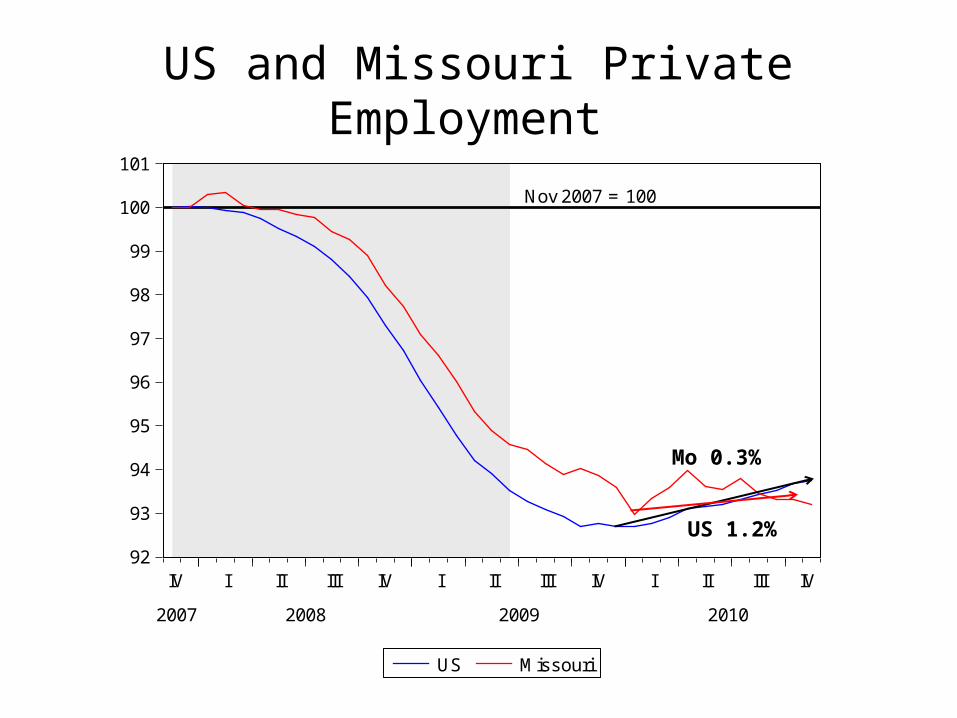
US and Missouri Private Employment
Mo 0.52%
US 1.03%
92
93
94
95
96
97
98
99
100
101
IV I II III IV I II III IV I II III IV
2007 2008 2009 2010
US Missouri
Nov 2007 = 100
US 1.2%
Mo 0.3%
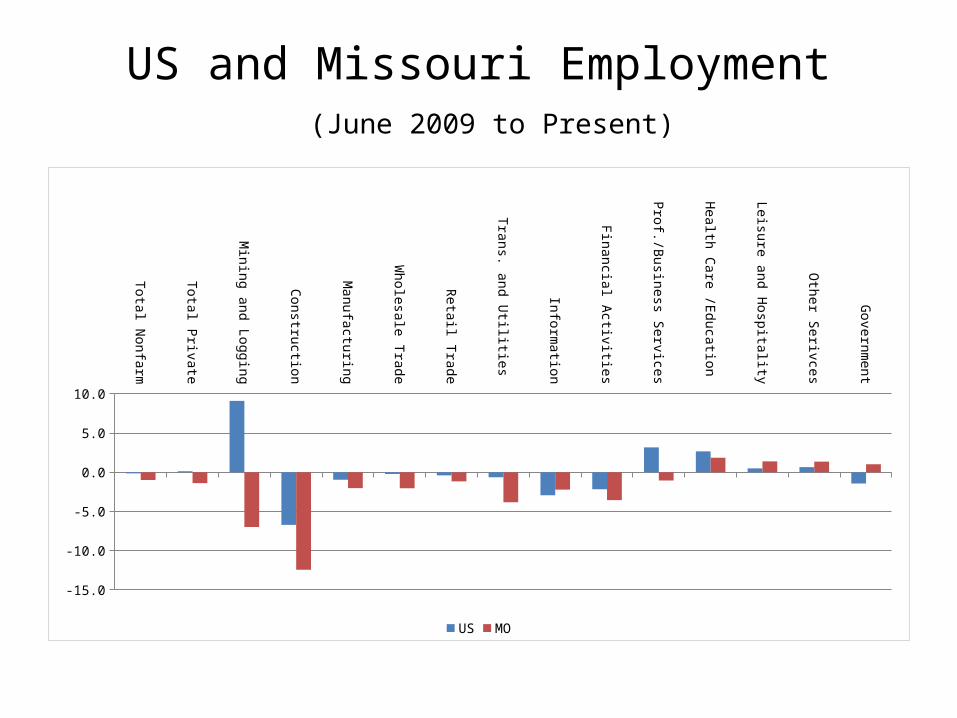
US and Missouri Employment (June 2009 to Present)
Total Nonfarm
Total Private
Mining and Logging
Construction
Manufacturing
Wholesale Trade
Retail Trade
Trans. and Utilities
Information
Financial Activities
Prof./Business Services
Health Care /Education
Leisure and Hospitality
Other Serivces
Government
-15.0
-10.0
-5.0
0.0
5.0
10.0
US MO
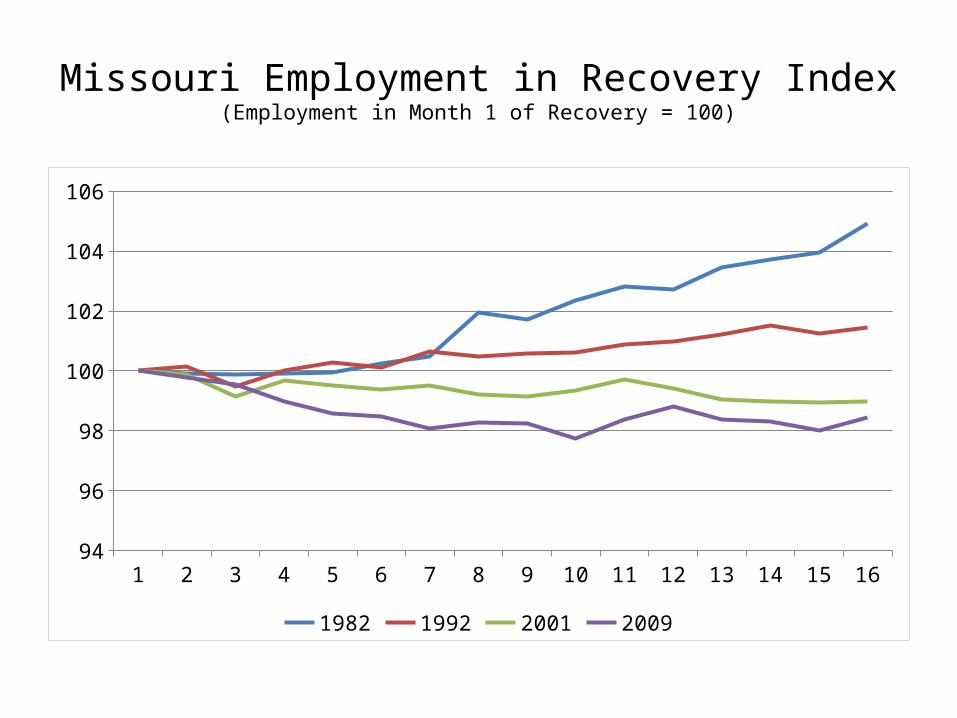
Missouri Employment in Recovery Index(Employment in Month 1 of Recovery = 100)
1 2 3 4 5 6 7 8 9 10 11 12 13 14 15 1694
96
98
100
102
104
106
1982 1992 2001 2009

Missouri Private Employment(thds)
-20
-16
-12
-8
-4
0
4
8
12
16
I II III IV I II III IV I II III IV I II III IV I II III
2006 2007 2008 2009 2010
MissouriEmployment
Peak
<--Official Recession Dates-->

Change in Construction Employment(thds)
-8
-6
-4
-2
0
2
4
6
I II III IV I II III IV I II III IV I II III IV I II III IV
2006 2007 2008 2009 2010
MissouriEmployment
Peak
<----Official Recession------> Dates

Change in Government Employment (thds)
-8
-6
-4
-2
0
2
4
6
8
I II III IV I II III IV I II III IV I II III IV I II III IV
2006 2007 2008 2009 2010
MissouriEmployment
Peak
<----Official Recession------> Dates

Change in Health and Education Employment
(thds)
-4
-3
-2
-1
0
1
2
3
4
5
I II III IV I II III IV I II III IV I II III IV I II III IV
2006 2007 2008 2009 2010
MissouriEmployment
Peak
<----Official Recession------> Dates
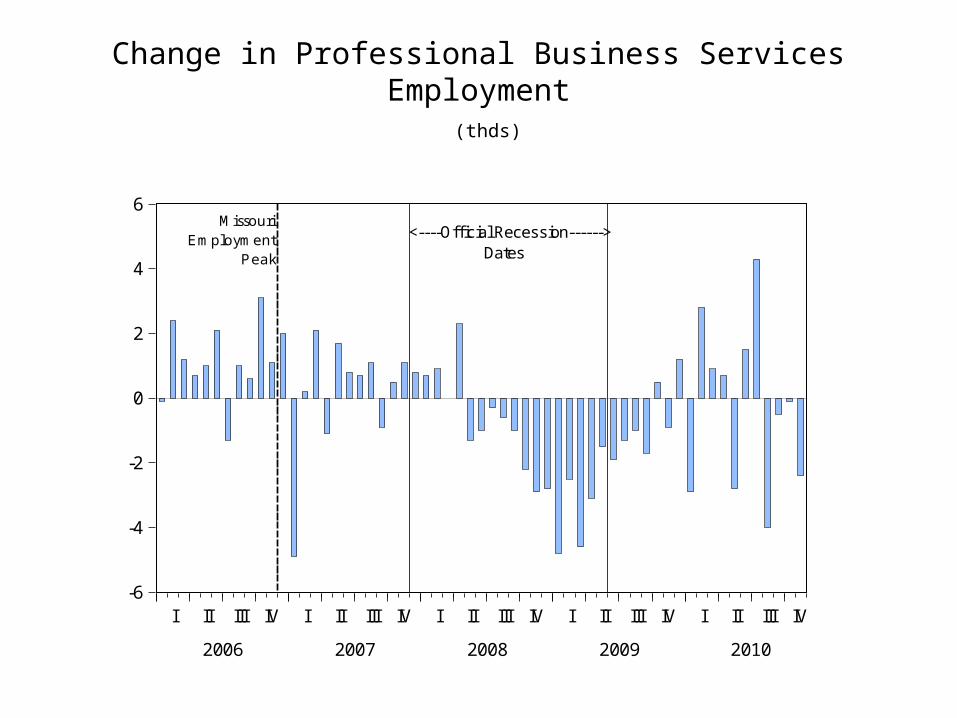
Change in Professional Business Services Employment (thds)
-6
-4
-2
0
2
4
6
I II III IV I II III IV I II III IV I II III IV I II III IV
2006 2007 2008 2009 2010
MissouriEmployment
Peak
<----Official Recession------> Dates

Change in Manufacturing Employment (thds)
-6
-5
-4
-3
-2
-1
0
1
2
3
I II III IV I II III IV I II III IV I II III IV I II III IV
2006 2007 2008 2009 2010
MissouriEmployment
Peak
<--Official Recession Dates-->

Where is Missouri Growing?(December 2009 to today)
• Kansas City (-6,082)
• St. Louis (10,273)
• MSA Minor (8,541)
• Rural (-7,874)
90
92
94
96
98
100
102
IV I II III IV I II III IV I II III IV
2007 2008 2009 2010
Minor MSA Kansas City MSARural Mo St. Louis MSA
Nov 2007 = 100

Springfield MSA Employment
140,000
150,000
160,000
170,000
180,000
190,000
200,000
210,000
220,000
90 92 94 96 98 00 02 04 06 08 10
Peak 213,895 March '07
Trough 196,355 Dec '09
Loss of 17,540 jobs
Current 199,820

Employment Throughout Missouri
Area EmploymentPercent of Missouri
EmploymentSt. Louis 980,405 36.1%
Kansas City 553,824 20.4%Minor MSAs 497,144 18.4%
Rural 677,842 25.1%Total 2,709,215

Missouri Employment Breakdown (thds)
Industry Dec 2006 Nov 2010 Change Relative SizeNonfarm (CES) 2,788.8 2,653.50 -135.3 ---
Private 2,352.7 2,195.00 -157.7 82.7%Construction 147.6 103.6 -44.0 3.9%
Financial 165.6 156.7 -8.9 5.9%Government 436.1 458.8 22.7 17.3%
Health 381.2 408.4 27.2 15.4%Information 63.1 61.8 -1.3 2.3%
Leisure 280.8 277.6 -3.2 10.5%Manufacturing 304.8 246.5 -58.3 9.3%
Mining 5.2 4.1 -1.1 0.2%Prof Biz Services 338.8 308.6 -30.2 11.6%
Retail 316.2 297.8 -18.4 11.2%Trans/Utilities 106.5 94.7 -11.8 3.6%
Wholesale 124.2 115.4 -8.8 4.3%Other Services 120.5 119.5 -1.0 4.5%

Missouri Unemployment Rate
2
3
4
5
6
7
8
9
10
11
1980 1985 1990 1995 2000 2005 2010
Current9.9%

Major City Unemployment Rates
0
2
4
6
8
10
12
90 92 94 96 98 00 02 04 06 08 10
St. LouisSpringfieldKansas City
STL 10%SPD 8.7%KC 11.1%
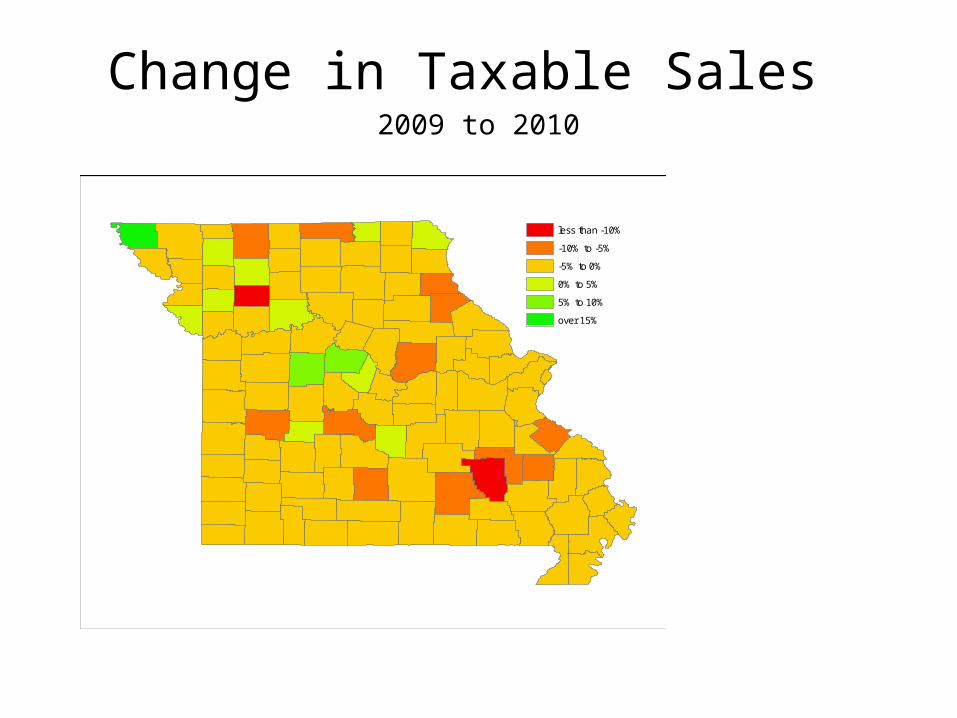
Change in Taxable Sales 2009 to 2010
less than -10%
-10% to -5%
-5% to 0%
0% to 5%
5% to 10%
over 15%
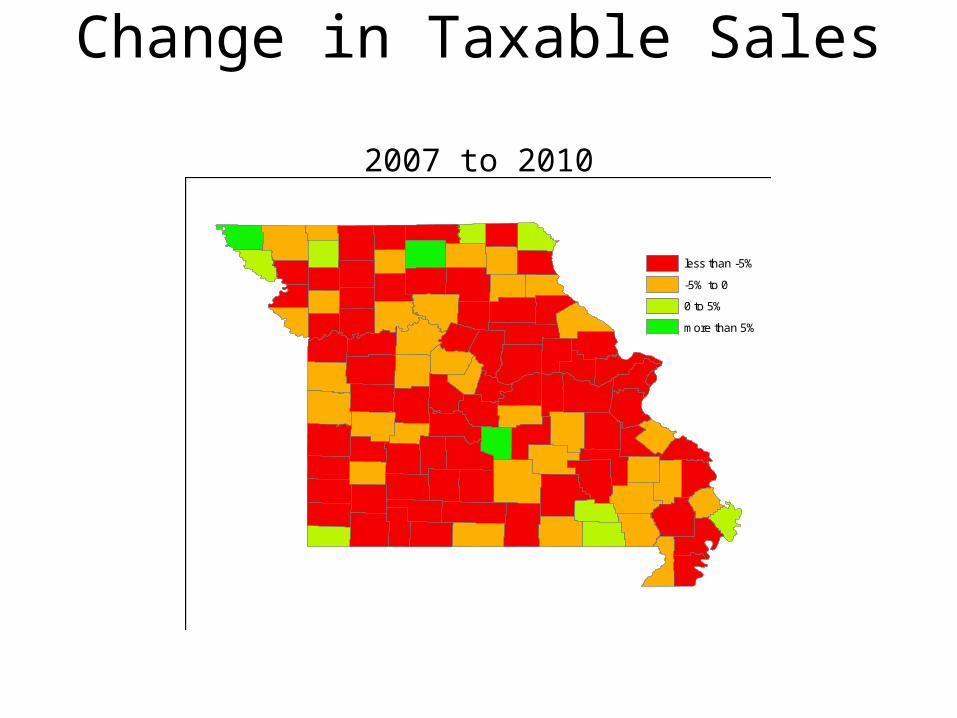
Change in Taxable Sales 2007 to 2010
less than -5%
-5% to 0
0 to 5%
more than 5%

2011 Missouri ForecastIndustry 10-Nov 2011 Change Percent
Nonfarm (CES) 2,653.50 2,668.50 15.0 0.57%Private 2,195.00 2,215.00 20.0 0.91%
Construction 103.6 104 0.4 0.39%Financial 156.7 153.7 -3.0 -1.91%
Government 458.8 453.5 -5.3 -1.16%Health 408.4 412.8 4.4 1.08%
Information 61.8 61 -0.8 -1.29%Leisure 277.6 283.6 6.0 2.16%
Manufacturing 246.5 248.5 2.0 0.81%Mining 4.1 4.6 0.5 12.20%
Prof Biz Services 308.6 314 5.4 1.75%Retail 297.8 301.4 3.6 1.21%
Trans/Utilities 94.7 97.3 2.6 2.75%Wholesale 115.4 116 0.6 0.52%
Other Services 119.5 121 1.5 1.26%Spfd Employment 199.8 202.7 2.9 1.43%
Mo Unemployment Rate (SA) 9.90% 8.50%
Spfd Unemployment Rate (SA) 8.70% 7.90%
Real Personal Income 219,620 222,694 3,074 1.40%