Embed Size (px)
Citation preview

Annual U.S. Geothermal Power Production and Development Report
April 2011

Geothermal Energy Association
GEOTHERMAL ENERGY ASSOCIATION
209 Pennsylvania Avenue SE, Washington, D.C. 20003 U.S.A. Phone: (202) 454-5261 Fax: (202) 454-5265 Web Site: www.geo-energy.org
ANNUAL GEOTHERMAL POWER PRODUCTION AND DEVELOPMENT
REPORT: APRIL 2011 BY DAN JENNEJOHN
Contents
1. Overview of Terms and Methodology ....................................................................................................................... 7
1.1 Geothermal Resource Types and their Definitions .............................................................................................. 7
1.2 Tracking Projects through the Development Timeline ........................................................................................ 8
1.3 Planned Capacity Addition (PCA) and Resource Capacity Estimates ................................................................... 9
2. Industry Overview.................................................................................................................................................... 10
2.1 Installed Capacity Growth .................................................................................................................................. 10
2.2 Geothermal Capacity in Development............................................................................................................... 11
2.3 Federal Incentives and Programs ...................................................................................................................... 18
3. State Tables: Capacity in Development and DOE Funded Projects ......................................................................... 23
3.1 States with Capacity in Development and DOE Funded Projects ...................................................................... 24
3.2 States with Projects Receiving DOE Funding Only ............................................................................................. 46
4. Comparison with Previous Report Data and Trends ................................................................................................ 57
5. References ............................................................................................................................................................... 59
Please Note: GEA is reporting project information that is provided by developers or public sources. We do not independently verify the data provided or warrant its accuracy. Cover Photo Courtesy of ThermaSource, Inc.

Geothermal Energy Association
3
Executive Summary
There are 3,102 MW of geothermal power in production in nine states: Alaska, California, Hawaii, Idaho, Nevada, New Mexico, Oregon, Utah and Wyoming. Geothermal companies continue to explore and develop geothermal resources at a growing number of sites throughout the United States (US). While the economic downturn of 2008 adversely impacted the rate of geothermal resource development, the geothermal industry has maintained steady growth in the US through 2010 and into 2011. The total number of geothermal projects-under-development, as well as geothermal prospects, reported in 2011 increased 12% over 2010. Figure 1: Total Confirmed Projects + 2011 Prospects
Source: GEA
Figure 14 accounts only for those geothermal projects and prospects which have been confirmed by the developer. Unconfirmed projects for which a public record exists but which have not been confirmed to GEA by the developer increase the projects and prospects total to 193. Altogether, these projects are developing approximately 5102 – 5745 MW of geothermal resources. The new projects were identified under development in 15 states: Nevada, California, Utah, Idaho, Oregon, Alaska, Louisiana, Hawaii, New Mexico, Arizona, Colorado, Mississippi, Texas, Washington, and Wyoming.
34
69
83
121
152
170
0
20
40
60
80
100
120
140
160
180
Apr-06 Apr-07 Apr-08 Apr-09 Apr-10 Apr-11
Nu
mb
er
of
Pro
ject
s an
d P
rosp
ect
s
Phase I Phase II Phase III Phase IV Prospect
Geothermal Energy Association
4
Figure 2: Number of Geothermal Projects in Development by State and Phase
Source: GEA
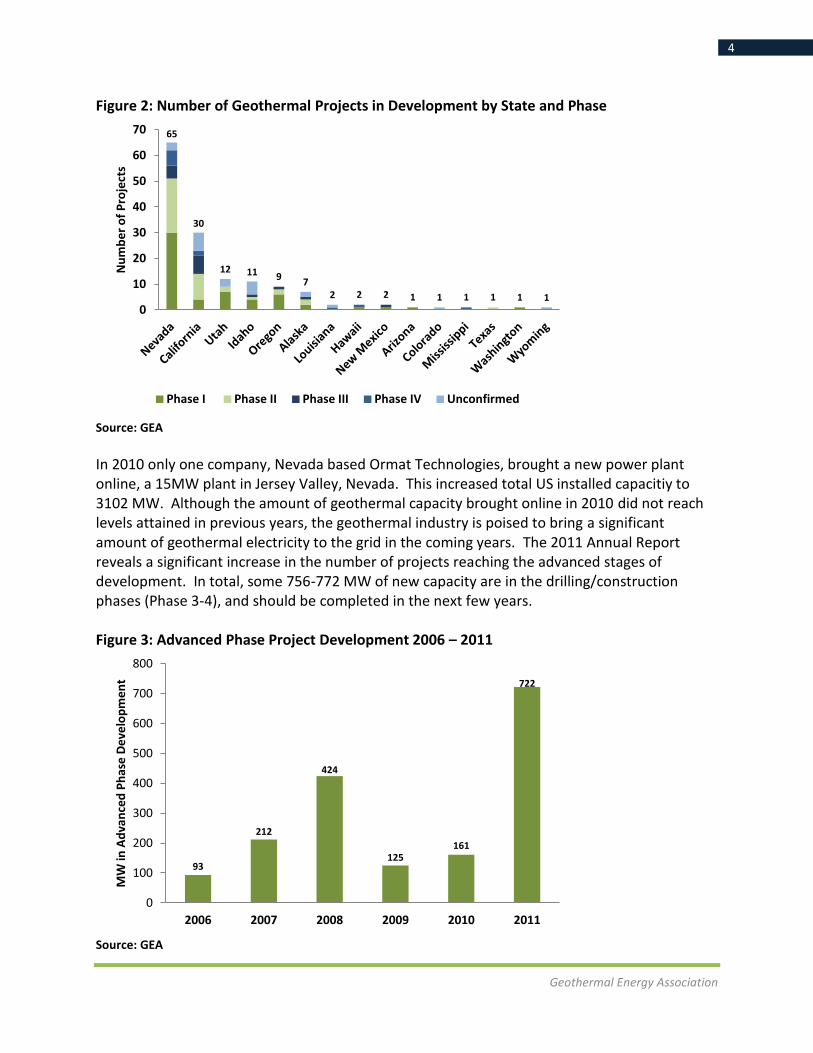
In 2010 only one company, Nevada based Ormat Technologies, brought a new power plant online, a 15MW plant in Jersey Valley, Nevada. This increased total US installed capacitiy to 3102 MW. Although the amount of geothermal capacity brought online in 2010 did not reach levels attained in previous years, the geothermal industry is poised to bring a significant amount of geothermal electricity to the grid in the coming years. The 2011 Annual Report reveals a significant increase in the number of projects reaching the advanced stages of development. In total, some 756-772 MW of new capacity are in the drilling/construction phases (Phase 3-4), and should be completed in the next few years. Figure 3: Advanced Phase Project Development 2006 – 2011
Source: GEA
65
30
12 11 9 7
2 2 2 1 1 1 1 1 1 0
10
20
30
40
50
60
70 N
um
be
r o
f P
roje
cts
Phase I Phase II Phase III Phase IV Unconfirmed
93
212
424
125 161
722
0
100
200
300
400
500
600
700
800
2006 2007 2008 2009 2010 2011
MW
in A
dva
nce
d P
has
e D
eve
lop
me
nt

Geothermal Energy Association
5
While the majority of advanced stage projects are in Nevada and California, projects were also identified in Oregon, New Mexico, Idaho and Hawaii, and smaller capacity (<1 MW) projects were also nearing completion in Alaska, Louisiana and Mississippi. Figure 4: Advanced Stage Planned Capacity Additions (PCA) by State
Source: GEA
The expansion of the geothermal industry is also reflected in the large number of geothermal power projects being developed in new, greenfield sites. Developers are increasingly exploring for and developing areas where little or no previous development has taken place. Of the projects identified in GEA’s 2011 Annual Report, approximately 76% of them are developing conventional hydrothermal geothermal resources in unproduced areas. In addition to the development of conventional geothermal resources, the 2011 Annual Report identifies five geothermal and hydrocarbon coproduction projects, four enhanced geothermal systems projects, and one geopressured resource development project.
357.1 355.8
23 15 13 8 0 0.05 0.03 0
50
100
150
200
250
300
350
400
NV CA OR NM ID HI AK LA MS
Cap
acit
y (M
W)
Phase 3 Phase 4

Geothermal Energy Association
6
Figure 5: Number of Projects by Project Type
Source: GEA The expansion into new geothermal fields and the development and utilization of new geothermal technologies requires the assistance of a large network of supporting industries that reaches beyond the western US. Companies developing geothermal projects in the West require the goods and services of vendors identified in 43 different states to support the development of geothermal resources. Figure 6: Map of US States with Vendors Supporting Geothermal Development
WA
ORID
WY
CO
TX
NMAZ
UTNV
CA
AK
HI
LAMS
MT
NE
KS
OK
MN
IA
MO
WI
IL
MI
IN
KY
TN
AL
FL
GA
SC
NC
VAWV
OH
PN
NY
MD
NH
MA
CT
NJ
WA
Source: GEA
111
15
10
4 1 5
CH Unproduced (Greenfield)
CH Produced
CH Expansion
EGS
Geopressured Systems
Coproduction

Geothermal Energy Association
7
1. Overview of Terms and Methodology To increase the accuracy and value of information presented in its annual US Geothermal Power Production and Development Update, the Geothermal Energy Association (GEA) developed a reporting system known as the Geothermal Reporting Terms and Definitions. The Geothermal Reporting Terms and Definitions act as a guideline to project developers in reporting geothermal project development information to the GEA. A basic understanding of the Geothermal Reporting Terms and Definitions will also aid the reader in fully understanding the information presented in this annual report. The Geothermal Reporting Terms and Definitions serve to increase reporting clarity and accuracy by providing industry and the public with a lexicon of definitions relating to the types of different geothermal projects, and a guideline for determining which phase of development a geothermal resource is in. These two tools help to characterize resource development by type and technology. They also help to determine a geothermal project’s position in the typical project development timeline.
1.1 Geothermal Resource Types and their Definitions
In reporting a project in development to the GEA, the developer of a geothermal resource is asked to indicate which of the following definitions their project falls under:
Conventional Hydrothermal (Un-produced Resource): the development of a
geothermal resource where levels of geothermal reservoir temperature and reservoir flow capacity are naturally sufficient to produce electricity and where development of the geothermal reservoir has not previously occurred to the extent that it supported the operation of geothermal power plant(s).
Conventional Hydrothermal (Produced Resource): the development of a
geothermal resource where levels of geothermal reservoir temperature and reservoir flow capacity are naturally sufficient to produce electricity and where development of the geothermal reservoir has previously occurred to the extent that it currently supports or has supported the operation of geothermal power plant(s).
Conventional Hydrothermal Expansion: the expansion of an existing geothermal
power plant and its associated drilled area so as to increase the level of power that the power plant produces.
Geothermal Energy Association
8
Geothermal Energy and Hydrocarbon Co-production: the utilization of
produced fluids resulting from oil and/or gas-field development for the production of geothermal power.
Geopressured Systems: the utilization of kinetic energy, hydrothermal energy, and
energy produced from the associated gas resulting from geopressured gas development to produce geothermal electricity.
Enhanced Geothermal Systems: the development of a geothermal system where
the natural flow capacity of the system is not sufficient to support adequate power production but where hydraulic fracturing of the system can allow production at a commercial level.
1.2 Tracking Projects through the Development Timeline In addition to defining their project according the above list of definitions, developers also indicate to GEA their projects’ current status in the project development timeline using a four phase system. This systems captures how much, and what type of, work has been performed on that particular geothermal resource up until the present time. These four phases of project development are:
Phase I: Resource Procurement and Identification Phase II: Resource Exploration and Confirmation Phase III: Permitting and Initial Development Phase IV: Resource Production and Power Plant Construction Each of the four phases of project development is comprised of three separate sections, each of which contains phase sub-criteria. The three separate sections of sub criteria are resource development, transmission development, and external to resource development (acquiring access to land, permitting, signing PPA’s and EPC contracts, securing a portion of project financing, etc.). For a project to be considered as being in any particular phase of development a combination of sub-criteria, specific to each individual project phase, must be met.

Geothermal Energy Association
9
1.3 Planned Capacity Addition (PCA) and Resource Capacity Estimates Finally, at each phase of a project’s development a geothermal developer has the opportunity to report two project capacity (MW) estimates: a Resource Capacity estimate and a Planned Capacity Addition (PCA) estimate. At each project phase the geothermal resource capacity estimate may be thought of as the MW value of the total recoverable energy of the subsurface geothermal resource. It should not be confused with the PCA estimate, which is defined as the portion of a geothermal resource that “the developer deems to be viable for the economic production of electricity under existing economic conditions.” In other words, if the developer were to utilize the geothermal resource under its control to produce electricity via a geothermal power plant, the PCA estimate would be the power plant’s estimated installed capacity. In the case of an expansion to a conventional hydrothermal geothermal plant, the PCA estimate would be the estimated capacity to be added to the plant’s current installed capacity. In each phase of development the resource and installed capacity estimates are given different titles that reflect the level of certainty of successful project completion. The different titles as they correspond to the separate phases are as follows: Phase I: “Possible Resource Estimate” and “Possible PCA Estimate” Phase II: “Possible Resource Estimate” and “Possible PCA Estimate”
Phase III: “Delineated Resource Estimate” and “Delineated PCA Estimate” Phase IV: “Confirmed Resource Estimate” and “Confirmed PCA Estimate” This section outlines how the Geothermal Reporting Terms and Definitions influence the reporting and presentation of project in development information in this report. For a detailed explanation of each phase of development and the outline of its sub-criteria please consult GEA’s Geothermal Reporting Terms and Definitions, available at http://geo-energy.org/pdf/NewGeothermalTermsandDefinitions_January2011.pdf.

Geothermal Energy Association
10
2. Industry Overview
2.1 Installed Capacity Growth
The United States currently leads the world’s countries in installed geothermal energy capacity and continues to be one of the principal countries to increase the development of its geothermal resources. In 2007 geothermal energy accounted for 4% of renewable energy-based electricity consumption in the United States.i As of March 2011, geothermal electric power generation is occurring in nine US states: Alaska, California, Hawaii, Idaho, Nevada, New Mexico, Oregon, Utah, and Wyoming. Other states, such as Colorado, Louisiana, Mississippi, and Texas are soon to be added to the list. The United States has a total installed capacity of approximately 3,102 MW. Figure 7: March 2011 US Geothermal Installed Capacity (MW)
Source: GEA
In 2010 one company, Nevada-based Ormat Technologies, brought its 15 MW Jersey Valley power plant online later in the year. The Jersey Valley power plant is located in Pershing County, Nevada and its completion increased installed geothermal capacity in that state to approximately 442 MW.
3101.6
2565.5
441.8
42 35 15.8 0.73 0.28 0.25 0.24 0
500
1000
1500
2000
2500
3000
3500
Total Capacity
CA NV UT HI ID AK OR WY NM
Cap
acit
y (M
W)

Geothermal Energy Association
11
Figure 8: Total Installed Capacity 2005-2010
Source: GEA
2.2 Geothermal Capacity in Development The reduced levels of geothermal capacity coming online in 2010 has been partially attributed to the economic downturn, which made potential investors in geothermal project development and construction more risk-averse. This slowed, somewhat, the pace at which geothermal resources were being developed. However, as the economy recovers and federal and state policies incentivizing investment in geothermal remain in effect, the geothermal industry is expected to see increased geothermal capacity entering advanced stages of development and being brought online in 2011 and the coming years. While advanced geothermal projects enter or near the construction phase of their development, geothermal companies in the US are also acquiring and developing early stage geothermal resources. In 2011 the geothermal industry is developing 123 confirmed geothermal projects. When accounting for projects not confirmed (i.e. “unconfirmed”) by the developing companies this number increases to 146 projects. The geographic spread of confirmed geothermal projects alone is significant, with projects in various phases of project development located in 15 different states.
2737 2771
2850
2911
3087 3102
2500
2600
2700
2800
2900
3000
3100
3200
2005 2006 2007 2008 2009 2010
An
nu
al In
stal
led
Cap
acit
y (M
W)
Total Capacity Annual Capacity Added

Geothermal Energy Association
12
Figure 2: Number of Geothermal Projects in Development by State and Phase
Source: GEA
The number of confirmed geothermal projects recorded in this report account for approximately 3633 - 4050 MW of geothermal resources in development. Accounting for unconfirmed projects increases these levels to 4448 - 5040 MW. The total number of confirmed project megawatts is spread among 15 different states in the western US, with smaller scale pilot projects beginning to be developed in the states around the Gulf of Mexico. Table 1: Total Projects in Development Totals by State
State Phase 1 - 4 Development
Total Projects PCA (MW) Resource (MW) Overall Total (MW)
Alaska 7 50 95 120
Arizona 1 2 0 2
California 30 712-738 1212-1358 1596-1768
Colorado 1 10 0 10
Hawaii 2 8 0 8
Idaho 11 26 589-664 589-664
Louisiana 2 0.05 5 5
Mississippi 1 0.03 0 0.03
Nevada 65 638-648 2132-2408 2250-2536
New Mexico 2 15 0 15
Oregon 9 111 225-250 276-301
Texas 1 1 0 1
Utah 12 40-55 90-160 130-215
Washington 1 0 100 100
Wyoming 1 0.28 0 0.28
Totals: 146 1613-1664 4448-5040 5102-5745*
Source: GEA *PCA and Resource Totals do not add up to Overall Totals because they have been adjusted to avoid double counting. In cases where respondents gave both a PCA value and resource value, it was assumed that the PCA was already included in the stated resource total. In
65
30
12 11 9 7
2 2 2 1 1 1 1 1 1
0
10
20
30
40
50
60
70 N
um
be
r o
f P
roje
cts
Phase I Phase II Phase III Phase IV Unconfirmed

Geothermal Energy Association
13
projects where PCA values but no Resource values were given the PCA value (being the planned capacity of the geothermal power plant) was used as the Resource value and added to the latter to get the Overall Total. As a result, the overall total is less than the sum of PCA and resource values.
Note that while a projects resource capacity value provides an estimate of the amount of recoverable electricity (MW) from an underground reservoir, a projects PCA (Planned Capacity Added) estimate is the portion of that geothermal resource which a developer deems viable for production via a geothermal power plant (see Section 1 explaining the Geothermal Reporting Terms and Definitions used in this report). Currently geothermal industry companies are developing 1377 - 1393 MW of confirmed PCA projects. When accounting for unconfirmed projects the range of PCA in development is 1613 – 1664 MW. Of this, 756 – 772 MW are advanced stage (Phase 3 – 4) geothermal projects expected to be completed in the next three to four years.ii Figure 3: Advanced Phase Project Development 2006 – 2011
Source: GEA
While the majority of advanced stage projects are currently located in Nevada and California, projects are also nearing construction and production in Oregon, New Mexico, Idaho, and Hawaii. Smaller capacity projects (< 1 MW) are also nearing completion in Alaska, Louisiana, and Mississippi.
93
212
424
125 161
722
2006 2007 2008 2009 2010 2011

Geothermal Energy Association
14
Figure 4: Advanced Stage Planned Capacity Additions (PCA) by State
Source: GEA The total amount of PCA and resource capacity (MW) in development in the US in respect to their location and project status (phase) is outlined in Table 2 below. Table 2: Developing Geothermal Capacity (MW) by State and Phase
State Phase 1 Phase 2 Phase 3 Phase 4 Unconfirmed
PCA Resource PCA Resource PCA Resource PCA Resource PCA Resource
Alaska 15 60 10 10 0.4 5 0 0 25 20
Arizona 2 0 0 0 0 0 0 0 0 0
California 100 110-140 102 429-545 297-303 83 53 150 160-180 440
Colorado 0 0 0 0 0 0 0 0 10 0
Hawaii 0 0 0 0 0 0 8 0 0 0
Idaho 13 0 0 150 13 114 0 0 0 325-400
Louisiana 0 0 0 0 0 0 0.05 0 0 5
Mississippi 0 0 0 0 0 0 0.03 0 0 0
Nevada 133 1068-1163 158 645-680 180-190 250-320 167 164-185 0 5-60
New Mexico 0 0 0 0 15 0 0 0 0 0
Oregon 56 145-170 32 80 23 0 0 0 0 0
Texas 0 0 1 0 0 0 0 0 0 0
Utah 0 0 0 70-95 0 0 0 0 40-55 20-65
Washington 0 100 0 0 0 0 0 0 0 0
Wyoming 0 0 0 0 0 0 0 0 0.28 0
Total: 319 1483-1633 303 1384-1560 528-544 452-522 228 314-335 235-270 815-990
Source: GEA
As the geographical reach of the geothermal industry expands, developers are increasingly exploring for and developing conventional hydrothermal geothermal resources in areas where little or no previous development has taken place. Of the 146 projects surveyed, 111 of them are developing conventional hydrothermal resources in “unproduced” areas (CH Unproduced),
357 356
23 15 13 8 0 0.05 0.03 0
50
100
150
200
250
300
350
400
NV CA OR NM ID HI AK LA MS
Cap
acit
y (M
W)
Phase 3 Phase 4

Geothermal Energy Association
15
15 of them are developing conventional hydrothermal resources in “produced” (CH Produced), and 10 are expansions to existing conventional hydrothermal power plants (CH Expansion). The remaining projects are five geothermal and hydrocarbon coproduction (Coproduction), four enhanced geothermal systems (EGS) and, one geopressured system (Geopressured Systems) project(s). Figure 5: Number of Projects by Project Type
Source: GEA
Geothermal installed capacity currently remains concentrated in the western US, but the exploration for and development of new resources, as well as the application of new technologies is expanding the geographic extent of the industry. Projects featuring the development of conventional hydrothermal resources as well as EGS pilot projects are increasing in the western US. At the same time, pilot projects focusing on generating geothermal electricity from low temperature fluids left over as a byproduct from oil and gas production, as well as projects aiming to harness electricity from geothermal fluids under high geological pressure, are emerging in states along the Gulf of Mexico.
111
15
10
4 1 5
CH Unproduced
CH Produced
CH Expansion
EGS
Geopressured Systems
Coproduction

Geothermal Energy Association
16
Figure 7: Maps of US States with Geothermal Capacity Online and Under Development
ORID
WY
NM
UTNV
CA
AK
HI
ORID
WY
CO
TX
NMAZ
UTNV
CA
AK
HI
LAMS
Geothermal Capacity Online Geothermal Capacity in Development
WA
Source: GEA
While the number of states with geothermal installed capacity and projects in development is significant, the reach of the geothermal industry is still more extensive. Companies offering various products, services, and expertise in both the industrial and service sectors are needed to support additional geothermal development. Vendors supporting the development of geothermal resources abound throughout the US as shown in Figure 6.

Geothermal Energy Association
17
Figure 6: Map of US States with Vendors Supporting Geothermal Development
WA
ORID
WY
CO
TX
NMAZ
UTNV
CA
AK
HI
LAMS
MT
NE
KS
OK
MN
IA
MO
WI
IL
MI
IN
KY
TN
AL
FL
GA
SC
NC
VAWV
OH
PN
NY
MD
NH
MA
CT
NJ
WA
Source: GEA
In addition to states with both online and developing geothermal projects, and those with developing projects only, companies whose goods and services support the development of geothermal resources for power generation are found in 28 other states. In total, companies developing geothermal resources have identified vendors needed to support their operations in 43 states.

Geothermal Energy Association
18
2.3 Federal Incentives and Programs
The increased progress in the development of geothermal projects has been fueled by federal incentives and funding which help offset the risk and high capital cost of geothermal development. With certain conditions, geothermal power projects are eligible for the full Production Tax Credit (PTC) if placed in service by December 31, 2013. In addition, the American Recovery and Reinvestment Act of 2009 (ARRA) has made projects eligible for the PTC also eligible for a grant in lieu of the tax credit from the Treasury Department. The grant is equivalent to a 30% tax credit for the eligible portions of their capital investment. Projects which are in construction by the end of calendar year 2011 and are placed in service by the end of calendar year 2013 may receive the cash grant. Geothermal developers have cited the cash grant as a particularly important factor in sustaining development through the economic recession. Since 2009 approximately $262.9M and $4.6M in cash grants have been provided to utility-scale geothermal projects and geothermal heat pump projects respectively. Projects receiving cash grants span 19 different states.iii Figure 9: Cash Grants to the Geothermal Industry by Technology Type
List of “Geothermal Electricity” Department of Treasury Cash Grant Awardees
Awardee/Project Award Date State Amount ($) Enel NA, Salt Wells 9/29/2009 NV 61,520,872
Geysers Power Co./NA 2/26/2010 CA 2,224,148
NGP/ Blue Mountain I 11/9/2009 NV 57,872,513
Ormat/ North Brawley 8/17/2010 CA 108,285,626
Solutions in Human Resources/NA 11/28/2009 PA 5,071
Raser Technologies/ Thermo 1 2/16/2010 UT 32,990,089
Total: 262,898,319
Source: US Department of Treasury, GEA
$262.9M
$4.6M
Geothermal Electricity
Geothermal Heat Pump

Geothermal Energy Association
19
Another incentive driving the increased development of geothermal resources in the US is the Department of Energy (DOE) Loan Guarantee Program. The Energy Policy Act of 2005 (EPAct 2005) authorized loan guarantees through DOE to renewable energy projects that reduce green house gas emissions and employ new or significantly improved technologies. In 2009 ARRA amended the Loan Guarantee Program, adding section 1705 to authorize loan guarantees for renewable energy projects that commence construction no later than September 30, 2011. Since 2009 Nevada Geothermal Power received a $78.8M for its 49.5 MW Blue Mountain “Faulkner 1” power plant, which it brought online in 2009. U.S. Geothermal also received a $96.8M loan guarantee for its Neal Hot Springs project, which is currently under development in Malheur County, Oregon.iv Table 3: DOE Loan Guarantee Section 1705 Geothermal Projects
Project Developer State Jobs Supported
Amount ($) Permanent Construction
Blue Mountain Nevada Geothermal Nevada 14 200 78,800,000
Neal Hot Springs U.S. Geothermal Oregon 12 150 96,800,000
Total: 26 350 175,600,000
Source: US Department of Energy, GEA
DOE federal stimulus legislation funding (ARRA) is also having an important influence on the US geothermal market. In October 2009, the Department of Energy announced the results of its competitive solicitation under ARRA for geothermal technology projects. DOE announced awards that could result in up to $338M in ARRA funding to geothermal research and development, and would require an additional $280M in recipient cost-share. As of March 2011, GTP ARRA awards totaled nearly $363.7M when accounting for ARRA funding to national labs. Total cost share contributes an additional $302.8M, bringing the combined ARRA/cost share geothermal technology investment to more than $666.4M.v Figure 10: Total DOE ARRA/Cost-Share Geothermal Investment
Source: US Department of Energy, GEA
$363.7M
$302.7M
ARRA Award Total
Cost Share Total
Total Investment: $666.4M

Geothermal Energy Association
20
Funding for geothermal technology projects via ARRA is distributed among six categories, including Innovative Exploration and Drilling Projects (IET, up to $97.2M, 24 projects), Coproduced, Geopressured, and Low Temperature Geothermal Demonstration Projects (Geo Demo, up to $18.7M, 10 projects), Enhanced Geothermal System Demonstrations (EGS Demo, up to $44.2M, 3 projects), Enhanced Geothermal Systems Components Research and Development/Analysis (EGS R&D, up to $80.8M, 45 projects), Geothermal Data Development, Collection, and Maintenance (National Geothermal Data System/NGDS, up to $33.7M, 4 projects) and Ground Source Heat Pump Demonstrations (GHP, up to 65.5M, 37 projects). Additionally, ARRA provided $23.7M in funding to national labs throughout the US for research and development in various geothermal technologies. It is planned that 122 projects in 39 states will receive DOE ARRA funding with recipients ranging from private industry, academic institutions and tribal entities to local governments, and DOE National Laboratories. Figure 11: Total DOE ARRA/Cost-Share Geothermal Investment by Technology Focus
Source: US Department of Energy, GEA
A review of ARRA awards administered through the DOE Geothermal Technologies Program (GTP) reveals that the impact of stimulus funding has not yet peaked for geothermal. At the end of 2010, of the 122 projects receiving ARRA funding through the DOE GTP: 1 has been completed, 18 are more than 50% complete, 98 are less than 50% complete, 1 has not been started, and 4 are unaccounted for on Recovery.gov. The vast majority of projects that have yet to be completed indicate that much of this total will be spent in the coming years, boosting job growth within the geothermal sector.vi
195.9
150
117
84.2
61.8
33.7 23.7
0
50
100
150
200
250
IET GHP EGS R&D EGS Demo
Geo Demo
NGDS National Lab
Tota
ls (
$M
)
ARRA Award Total Cost Share Total

Geothermal Energy Association
21
Figure 12: ARRA Funded Geothermal Project Progress
Source: US Department of Energy, GEA
The Department of Energy Geothermal Technologies Program also supports the advancement of geothermal technology through annual appropriations. In 2010 GTP allocated approximately $17.2M of federal funding to seven companies with projects intended to develop and demonstrate new geothermal technologies utilizing low temperature geothermal fluids, geothermal fluids recovered from oil and gas reservoirs, and highly pressurized geothermal fluids. Of the seven companies’ projects, four will advance the technology and implementation of binary systems designed to generate electricity from lower temperature resources. Two projects are designed to generate electricity from geothermal fluids under highly pressured geological conditions. The seventh project will utilize fluids produced as a byproduct of hydrocarbon production from oil and gas wells.vii The aggregate industry cost share for the seven FY 2010 projects is approximately $63.8M.
1
18
98
1 4
Completed
>50% Complete
<50% Complete
Not Started
Not Accounted For

Geothermal Energy Association
22
Figure 13: DOE GTP FY 2010 Allocation and Cost-Share Totals
Source: US Department of Energy, GEA
Federal tax incentives, the Department of Treasury Cash Grant and the DOE Loan Guarantee program combined with strong state renewable portfolio standards are expected to drive growth in the geothermal industry in the near term. Additionally, with the majority of ARRA funding to various projects being less than complete, stimulus funding still stands to be a significant driver of further geothermal development in 2011.
$17.2M
$63.8M
FY 2010 Award Total
Cost Share Total

Geothermal Energy Association
23
3. State Tables: Capacity in Development and DOE Funded Projects
The following results identify 3633 – 4050 MW of confirmed new geothermal power plant capacity under development in the United States. Unconfirmed projects increase the potential capacity to 4448 – 5040 MW. There are 15 states with projects currently under consideration or development: Alaska, Arizona, California, Colorado, Hawaii, Idaho, Louisiana, Mississippi, Nevada, New Mexico, Oregon, Texas, Utah, Washington, and Wyoming. Between confirmed and unconfirmed projects there are a total of 146 geothermal projects in development. Per GEA’s Geothermal Reporting Terms and Definitions (outlined in Section 1 of this report) the projects listed for each state are categorized by the following phases:
Phase I: Resource Procurement and Identification (i.e. identifying resource, secured rights to resource, pre-drilling exploration, internal transmission analysis complete).
Phase II: Resource Exploration and Confirmation (i.e. exploration and/or drilling permits approved, exploration drilling conducted/in progress, transmission feasibility studies underway).
Phase III: Permitting and Initial Development (i.e. securing PPA and final permits, full size wells drilled, financing secured for portion of project construction, interconnection feasibility study complete).
Phase IV: Resource Production and Power Plant Construction (i.e. plant permit approved, facility in construction, production and injection drilling underway, interconnection agreement signed).
Unconfirmed: Project information obtained by GEA from publicly available sources but not verified by the project developer
To properly identify a projects “project type” please refer to the following key:
CH Unproduced: Conventional Hydrothermal (Unproduced) Resource
CH Produced: Conventional Hydrothermal (Produced) Resource
CH Expansion: Conventional Hydrothermal Expansion
Coproduction: Geothermal Energy and Hydrocarbon Coproduction
Geopressured: Geopressured System
EGS: Enhanced Geothermal System This section also lists federal stimulus and FY 2010 supported on a state by state basis. While some of the projects in development received federal funding through ARRA and/or annual appropriations lists of projects in development are kept separate from lists of federally funded projects. This being the case, duplication of some projects in both lists occasionally occurs.

Geothermal Energy Association
24
States with both geothermal power projects in development and federally funded projects are listed first. These are followed by a list of states which have federally funded geothermal research and development and demonstration projects but no geothermal power projects under development within their borders.
3.1 States with Capacity in Development and DOE Funded Projects The following section lists 15 states with geothermal projects in various stages of development as well as projects receiving federal funding from DOE via ARRA and/or FY 2010 appropriations.
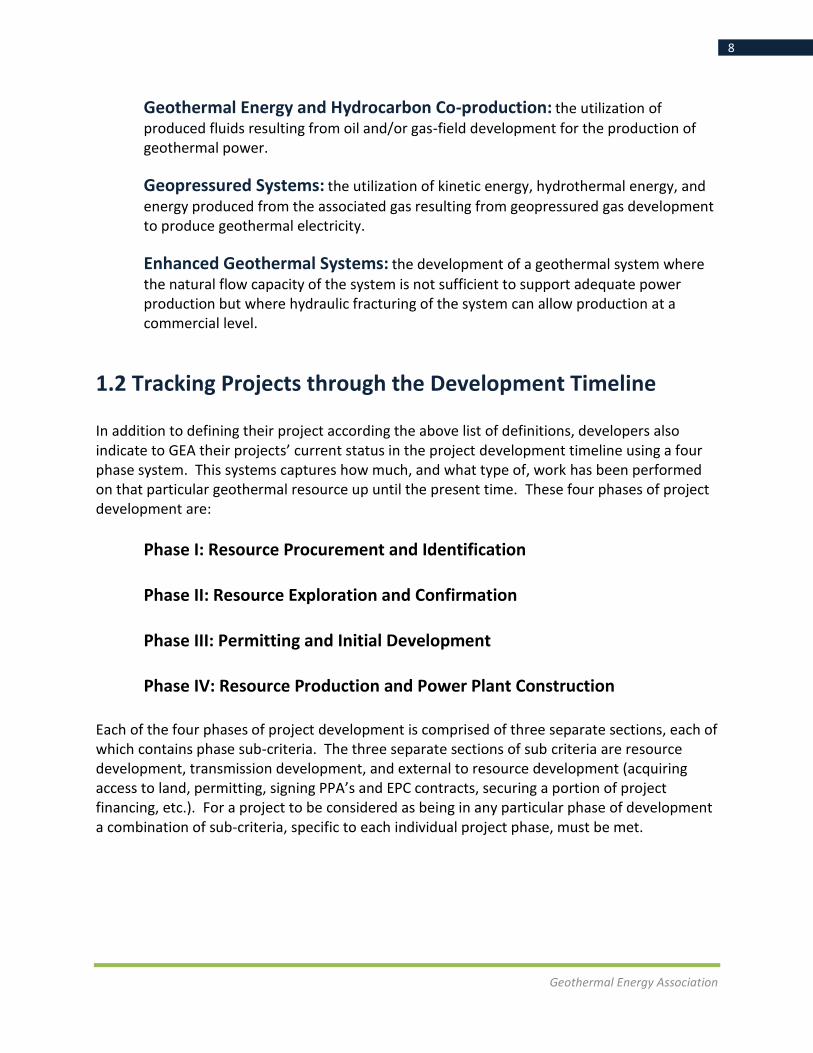
Alaska Installed Capacity: 0.73 MW Estimated Resource Capacity in Development: 95 MW Estimated PCA in Development: 50.4 MW Number of Projects in Development: 7 The first geothermal power plant in Alaska was installed in 2006 at Chena Hot Springs. It is a small-scale unit, using organic rankine cycle (ORC) technology to produce 225 kW from a low-temperature resource (165°F). Subsequent 225 and 280 kW units have been installed, bringing total capacity to 730 kW. In June, 2010 the State of Alaska enacted legislation to promote the development of geothermal energy by significantly reducing royalty payments from geothermal projects on state lands and streamlining geothermal permitting and regulatory processes with state agencies. Seven different geothermal companies, resorts, utilities, and Native American entities are developing up to 95 MW of geothermal resources in Alaska for potential electricity production. Additionally, the SW Alaska Regional Geothermal Energy and Pilgrim Hot Springs projects received funding awards from the Department of Energy via the American Recovery and Reinvestment Act of 2009 (ARRA).
AK Projects in Development
Phase Project Developer Capacity Estimate (MW)
Project Type Resource PCA
Phase 1
Pilgrim Hot Springs Unaatuq 10 5 CH Unproduced
Unalaska City of Unalaska 50 10 CH Unproduced
Phase 2
Akutan City of Akutan 10 10 CH Unproduced
Geothermal Energy Association
25
Phase Project Developer Capacity Estimate (MW)
Project Type Resource PCA
Mount Spurr Ormat N/A N/A CH Unproduced
Phase 3
Chena II Chena Hot Springs 5 0.4 CH Expansion
Unconfirmed
Tongass* Bell Island Hot Springs 20 N/A CH Unproduced
SW AK Geo. Project Naknek Electric Assoc. N/A 25 EGS
*Received GRED III funding for Phase I and II of project Source: GEA
Of the $360.8M of federal funding provided to the geothermal industry via ARRA $18.8M was allocated to three research and development and demonstration projects in Alaska. The table below provides a complete list of these projects and their current status.
AK DOE Funded Projects
Recipient Focus Status Amount Cost Share Expenditure
Naknek Electric Association EGS Demo <50% Complete $12,376,568 $12,400,557 $150,000
Trabits Group EGS R&D <50% Complete $2,154,238 $538,557 $424,120
University of Alaska Fairbanks IET <50% Complete $4,274,792 $1,851,345 $440,184
Total: $18,805,598 $14,790,459 $1,014,304
Source: GEA
Arizona Installed Capacity: 0 MW Estimated Resource Capacity in Development: N/A Estimated PCA in Development: 2 MW Number of Projects in Development: 1 Number of Geothermal Prospects: 1
Arizona has one confirmed project being developed by GreenFire Energy. This project is intended to utilize CO2 as an energy carrier from the subsurface geothermal resource to the power plant, and has received a $2M FY 2010 annual appropriation from DOE.
Geothermal Energy Association
26
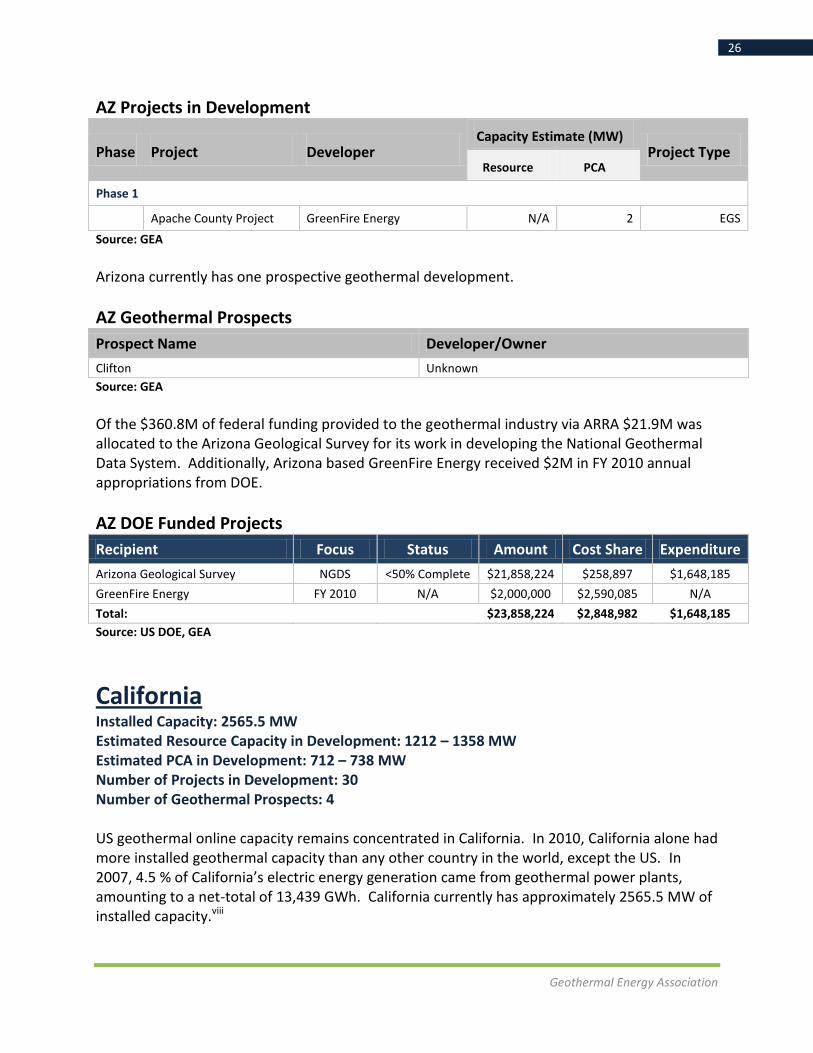
AZ Projects in Development
Phase Project Developer Capacity Estimate (MW)
Project Type Resource PCA
Phase 1
Apache County Project GreenFire Energy N/A 2 EGS
Source: GEA
Arizona currently has one prospective geothermal development.
AZ Geothermal Prospects
Prospect Name Developer/Owner
Clifton Unknown
Source: GEA
Of the $360.8M of federal funding provided to the geothermal industry via ARRA $21.9M was allocated to the Arizona Geological Survey for its work in developing the National Geothermal Data System. Additionally, Arizona based GreenFire Energy received $2M in FY 2010 annual appropriations from DOE.
AZ DOE Funded Projects
Recipient Focus Status Amount Cost Share Expenditure
Arizona Geological Survey NGDS <50% Complete $21,858,224 $258,897 $1,648,185
GreenFire Energy FY 2010 N/A $2,000,000 $2,590,085 N/A
Total: $23,858,224 $2,848,982 $1,648,185
Source: US DOE, GEA
California Installed Capacity: 2565.5 MW Estimated Resource Capacity in Development: 1212 – 1358 MW Estimated PCA in Development: 712 – 738 MW Number of Projects in Development: 30 Number of Geothermal Prospects: 4 US geothermal online capacity remains concentrated in California. In 2010, California alone had more installed geothermal capacity than any other country in the world, except the US. In 2007, 4.5 % of California’s electric energy generation came from geothermal power plants, amounting to a net-total of 13,439 GWh. California currently has approximately 2565.5 MW of installed capacity.viii

Geothermal Energy Association
27
Development of geothermal resources continues to move forward in California. The following table identifies 30 projects being developed by approximately nine different companies. These projects account for approximately 1358 MW of geothermal resource development.
CA Projects in Development
Phase Project Developer Capacity Estimate (MW)
Project Type Resource PCA
Phase 1
El Centro/Superstition Hills Navy Geothermal Program 5-25 TBD CH Unproduced
China Lake South Range Navy Geothermal Program 5-15 TBD CH Unproduced
Orita 2 Ram Power 150 49.9 CH Produced
Orita 3 Ram Power 150 49.9 CH Produced
Phase 2
Canby Cascaded Project Canby Geothermal 5 2 CH Unproduced
El Centro/Superstition Mt. Navy Geothermal Power 12-35 TBD CH Unproduced
Yuma Chocolate Mt. Navy Geothermal Program 12-30 TBD CH Expansion
Bald Mountain Oski Energy 20 TBD CH Unproduced
HV Oski Energy 75-100 TBD CH Unproduced
KN Oski Energy 75-100 TBD CH Unproduced
KS Oski Energy 75-100 TBD CH Unproduced
Wendel Oski Energy 5 TBD CH Expansion
Keystone Ram Power 100 50 CH Unproduced
New River Ram Power 50 50 CH Unproduced
Phase 3
Black Rock I CalEnergy N/A 53 CH Unproduced
Black Rock II CalEnergy N/A 53 CH Unproduced
Black Rock III CalEnergy N/A 53 CH Produced
CD4 Ormat N/A 32-38 CH Unproduced
Wister I Ormat N/A 30 CH Unproduced
Geysers Project Ram Power 33 26 CH Produced
Orita I Ram Power 150 49.9 CH Unproduced
Phase 4
Hudson Ranch I Energy Source 150 49.9 CH Unproduced
Mammoth Repower Ormat N/A 3 CH Expansion

Geothermal Energy Association
28
Phase Project Developer Capacity Estimate (MW)
Project Type Resource PCA
Unconfirmed
Buckeye Calpine N/A 30 CH Produced
Four Mile Hill Calpine 50 N/A CH Unproduced
Telephone Flat Calpine 50 N/A CH Unproduced
Unnamed Glass Mountain Calpine 320 N/A CH Unproduced
Unnamed North Geysers Calpine N/A 100 CH Produced
Wildhorse – North Geysers Calpine N/A 30-50 CH Produced
Suprise Valley Enel 20 N/A CH Unproduced
Source: GEA
In addition to the 30 geothermal projects in development, four geothermal prospects with potential for power production have been identified by developers in the State of California. Geothermal developers may have acquired access to a geothermal resource which has the potential for electricity production, but which has not yet met enough project milestones for the geothermal resource to be considered a Phase I project under the Geothermal Reporting Terms and Definitions (see Section 1). While not currently considered a geothermal “project”, a geothermal prospect has the potential to become so.
CA Geothermal Prospects
Prospect Name Developer/Owner
East and North Brawley Ormat Technologies
Rhyolite Plateau Ormat Technologies
Salton Sea Ram Power
Truckhaven N/A
Source: GEA
Of the $360.8M of federal funding provided to the geothermal industry via ARRA, $32.3M was allocated to 12 research and development and demonstration projects in CA. Additionally, two companies, the Modoc Contracting Company and Oski Energy, received a combined total of $4M in FY 2010 annual appropriations from DOE.
CA DOE Funded Projects
Recipient Focus Status Amount Cost Share Expenditure
Array Information Technology EGS R&D <50% Complete $1,164,142 $290,473 $113,791
CSU, Long Beach Foundation EGS R&D <50% Complete $433,560 $156,420 $76,347
UC Berkeley, Dep. Of Mech. Eng. EGS R&D N/A $1,777,617 $444,405 N/A
Oasys Water Demo <50% Complete $910,997 $1,989,791 $502

Geothermal Energy Association
29
Ormat Technologies IET <50% Complete $4,475,015 $4,050,500 $515,514
Potter Drilling EGS R&D <50% Complete $5,000,000 $2,479,243 $3,929,008
Ram Power IET <50% Complete $5,000,000 $9,328,377 $0
SAIC EGS R&D <50% Complete $1,025,953 $256,489 $336,652
Simbol Mining EGS R&D <50% Complete $3,000,000 $6,633,543 $1,241,263
Symyx Technologies EGS R&D N/A $3,000,000 $1,004,705 N/A
USC EGS R&D <50% Complete $1,483,189 $440,824 $424,697
Geysers Power Company IET <50% Complete $5,000,000 $7,130,648 N/A
Modoc Contracting Company FY 2010 N/A $2,000,000 $3,099,761 N/A
Oski Energy FY 2010 N/A $2,000,000 $15,705,766 N/A
Total: $36,270,473 $53,010,945 $6,637,774
Source: US DOE, GEA
Colorado Installed Capacity: 0 MW Estimated Resource Capacity in Development: N/A Estimated PCA in Development: 10 MW Number of Projects in Development: 1
Colorado currently has one geothermal project in an unconfirmed phase of development.
CO Projects in Development
Phase Project Developer Capacity Estimate (MW)
Project Type Resource PCA
Unconfirmed
Mt. Princeton Mt. Princeton Geothermal N/A 10 CH Unproduced
Source: GEA
Of the $360.8M of federal funding provided to the geothermal industry via ARRA, $18M was allocated to 10 research and development and demonstration projects in CO. The following table provides a complete list of these projects and their current status.
CO DOE Funded Projects
Recipient Focus Status Amount Cost Share Expenditure
Dept. of Personnel and Admin. GHP <50% Complete $4,600,000 $2,065,728 $254,075
CO NW Community College GHP N/A $430,000 $430,000 N/A
Colorado School of Mines EGS R&D <50% Complete $245,797 $91,927 $151,591
Colorado School of Mines EGS R&D <50% Complete $1,191,893 $441,600 $196,028
Colorado School of Mines GHP >50% Complete $860,597 $310,000 $195,650

Geothermal Energy Association
30
Composite Technology Development EGS R&D <50% Complete $503,650 $180,000 $105,000
Composite Technology Development EGS R&D <50% Complete $940,546 $240,000 $410,000
Denver Museum of Science & Nautre GHP <50% Complete $2,611,832 $2,619,485 $133,513
Flint Geothermal IET >50% Complete $4,778,234 $3,007,300 $169,585
Power, Environmental and Energy Research Institute
EGS R&D <50% Complete $1,840,000 $460,000 $395,113
Total: $18,002,549 $9,846,040 $2,010,555
Source: US DOE, GEA
Hawaii Installed Capacity: 35 MW Estimated Resource Capacity in Development: N/A Estimated PCA in Development: 8 MW Number of Projects in Development: 2 Number of Geothermal Prospects: 1
One geothermal power plant operates on the big island of Hawaii. This plant, Puna Geothermal Venture, delivers an average of 25–30 MW of electricity to the grid, supplying approximately 20% of the total electricity needs of the Big Island.ix Two additional projects are currently being developed on the island of Maui and the Big Island by Ormat Technologies.
HI Projects in Development
Phase Project Developer Capacity Estimate (MW)
Project Type Resource PCA
Phase 1
Ulupalakua (Maui) Ormat N/A N/A CH Unproduced
Phase 4
Puna Expansion Ormat N/A 8 CH Expansion
Source: GEA
In addition to the two geothermal projects already under development, Ormat Technologies holds a prospective geothermal project in Hawaii known as Kula. Geothermal developers may have acquired access to a geothermal resource which has the potential for electricity production, but which has not yet met enough project milestones for the geothermal resource to be considered a Phase I project under the Geothermal Reporting Terms and Definitions (see Section 1). While not currently considered a geothermal “project”, a geothermal prospect has the potential to become so.

Geothermal Energy Association
31
HI Geothermal Prospects
Prospect Name Developer/Owner
Kula Ormat Technologies
Source: GEA
Of the $360.8M of federal funding provided to the geothermal industry via ARRA, $4.9M was allocated to Ormat Technologies for a project researching and developing innovative exploration technologies in Hawaii.
HI DOE Funded Projects
Recipient Focus Status Amount Cost Share Expenditure
Ormat Technologies IET <50% Complete $4,911,330 $5,575,229 $3,737,241
Total: $4,911,330 $5,575,229 $3,737,241
Source: US DOE, GEA
Idaho Installed Capacity: 15.8 MW Estimated Resource Capacity in Development: 703 – 778 MW Estimated PCA in Development: 26 MW Number of Projects in Development: 11 Number of Geothermal Prospects: 5 In January 2008 the first geothermal power plant came online in Idaho. Raft River, a binary plant that uses a 300°F resource, and has a nameplate production capacity of 15.8 MW. Currently, net electrical power output is approximately 11.5 MW. An expansion to this plant, and 9 other projects, is under development.x
ID Projects in Development
Phase Project Developer Capacity Estimate (MW)
Project Type Resource PCA
Phase 1
Raft River III U.S. Geothermal 114 13 CH Produced
Newdale Standard Steam Trust N/A N/A CH Unproduced
Snake River Plain Standard Steam Trust N/A N/A CH Unproduced
Weiser Standard Steam Trust N/A N/A CH Unproduced
Phase 2
White Mountain Eureka Green Systems 150 N/A CH Unproduced

Geothermal Energy Association
32
Phase Project Developer Capacity Estimate (MW)
Project Type Resource PCA
Phase 3
Raft River II U.S. Geothermal 114 13 CH Produced
Unconfirmed
China Cap Idatherm 50-100 N/A CH Unproduced
Preston Idatherm 50 N/A CH Unproduced
Renaissance Geothermal Idatherm 100 N/A CH Unproduced
Sulfur Springs Idatherm 25-50 N/A CH Unproduced
Willow Springs Idatherm 100 N/A CH Unproduced
Source: GEA
In addition to the 11 geothermal projects in development, five geothermal prospects with potential for power production have been identified by developers in Idaho. Geothermal developers may have acquired access to a geothermal resource which has the potential for electricity production, but which has not yet met enough project milestones for the geothermal resource to be considered a Phase I project under the Geothermal Reporting Terms and Definitions (see Section 1). While not currently considered a geothermal “project”, a geothermal prospect has the potential to become so.
ID Geothermal Prospects
Prospect Name Developer/Owner
Grays Lake Eureka Green Systems
Oakley Eureka Green Systems
Thatcher Eureka Green Systems
Twin Falls Eureka Green Systems
Magic Reservoir Ormat Technologies
Source: GEA
Of the $360.8M of federal funding provided to the geothermal industry via ARRA, approximately $16M was allocated to four research and development and demonstration projects in ID. The table below provides a complete list of these projects and their current status.
ID DOE Funded Projects
Recipient Focus Status Amount Cost Share Expenditure
Blaine County School District #61 GHP <50% Complete $5,000,000 $11,082,977 $2,400,235
Boise State University NGDS <50% Complete $1,550,000 $0 $256,652
Boise State University NGDS <50% Complete $4,992,089 $0 $1,045,919

Geothermal Energy Association
33
Utah State University IET <50% Complete $4,640,110 $1,804,488 $1,417,876
Total: $16,182,199 $12,887,465 $5,120,682
Source: US DOE, GEA
Louisiana Installed Capacity: 0 MW Estimated Resource Capacity in Development: 5.25 MW Estimated PCA in Development: 0.05 MW Number of Projects in Development: 2
Louisiana currently hosts two known developing geothermal projects. One is a planned geothermal hydrocarbon co-production unit at a producing gas field. Another project, which has been awarded $5M of ARRA funding from the DOE Geothermal Technologies Program, will develop geopressured resources at an oil and gas field.
LA Projects in Development
Phase Project Developer Capacity Estimate (MW)
Project Type Resource PCA
Phase 4
Natural Gas Coproduction Gulf Coast Green Energy N/A 0.05 Coproduction
Unconfirmed
Sweetlake Louisiana Geothermal 5.25 N/A Geopressured
Source: ES DOE, GEA
Of the $360.8M of federal funding provided to the geothermal industry via ARRA $5M was allocated to the Sweetlake Geopressure demonstration project being developed by Louisiana Geothermal there. In addition to ARRA funding, Louisiana Geothermal received $4M in FY 2010 allocations from DOE to conduct an economic feasibility study of geopressured resources.
LA DOE Funded Projects
Recipient Focus Status Amount Cost Share Expenditure
Louisiana Geothermal Geo Demo <50% Complete $5,000,000 $10,330,574 $670,786
Louisiana Geothermal FY 2010 N/A $4,000,000 $20,832,474 N/A
Total: $9,000,000 $31,163,048 $670,786
Source: US DOE, GEA

Geothermal Energy Association
34
Mississippi Installed Capacity: 0 MW Estimated Resource Capacity in Development: N/A Estimated PCA in Development: 0.03 MW Number of Projects in Development: 1 Mississippi’s first developing geothermal project is a planned geothermal hydrocarbon co-production (GHCP) unit at a producing oil field
MS Projects in Development
Phase Project Developer Capacity Estimate (MW)
Project Type Resource PCA
Phase 4
Oil Coproduction Gulf Coast Green Energy N/A 0.03 Coproduction
Source: GEA
The oil coproduction project, being developed by Gulf Coast Green Energy, also received ~$1.6M in ARRA funding in 2009.
MS DOE Funded Projects
Recipient Focus Status Amount Cost Share Expenditure
Forrest County GHP <50% Complete $1,571,027 $1,571,028 $83,408
Total: $1,571,027 $1,571,028 $83,408
Source: US DOE, GEA
Nevada Installed Capacity: 441.8 MW Estimated Resource Capacity in Development: 2132 – 2408 MW Estimated PCA in Development: 638.05 – 648.05 MW Number of Projects in Development: 65 Number of Geothermal Prospects: 26
There are currently 21 operating geothermal power plants in Nevada with a total operating capacity of 441.8 MW. In 2010 Ormat Technologies brought its Jersey Valley power plant online, adding 15 MW to Nevada’s geothermal capacity. With more developing projects than any other state, it is expected that Nevada’s geothermal generating capacity will increase significantly in the future.xi

Geothermal Energy Association
35
NV Projects in Development
Phase Project Developer Capacity Estimate (MW)
Project Type Resource PCA
Phase 1
Lee Hot Springs Earth Power Resources 32 N/A CH Unproduced
Lovelock Earth Power Resources 32 N/A CH Unproduced
Aurora Gradient Resources 190 N/A CH Unproduced
Colado Gradient Resources 350 N/A CH Unproduced
Lee Allen Gradient Resources 145 N/A CH Unproduced
Baltazor Hot Springs Magma Energy N/A N/A CH Unproduced
Soda Lake East Magma Energy N/A N/A CH Unproduced
Sou Hills Montara Energy N/A N/A CH Unproduced
Fallon Test Ranges Navy Geothermal Program 5-15 N/A CH Unproduced
Blue Mountain 2 Nevada Geothermal Power 35 N/A CH Expansion
North Valley Nevada Geothermal Power 120 55 CH Unproduced
Brady EGS Ormat Technologies N/A N/A EGS
Desert Peak Ormat Technologies N/A N/A EGS
Dixie Meadows Ormat Technologies N/A 30 CH Unproduced
Edwards Creek Ormat Technologies N/A N/A CH Unproduced
Leach Hot Springs Ormat Technologies N/A N/A CH Unproduced
Smith Creek Ormat Technologies N/A N/A CH Unproduced
Tungsten Mountain Ormat Technologies N/A N/A CH Unproduced
Alligator Geothermal Oski Energy 20-40 N/A CH Unproduced
Hawthorne Oski Energy 25-50 N/A CH Unproduced
Hot Pot**** Oski Energy 30-50 N/A CH Unproduced
Pilot Peak Oski Energy 20-40 N/A CH Unproduced
Barren Hills Ram Power 32 24 CH Unproduced
Delcer Butte Ram Power 32 24 CH Unproduced
Devils Canyon Raser Technologies N/A N/A CH Unproduced
Trail Canyon Raser Technologies N/A N/A CH Unproduced
Marys River Standard Steam Trust N/A N/A CH Unproduced
Marys River SW Standard Steam Trust N/A N/A CH Unproduced
Gerlach U.S. Geothermal N/A N/A CH Unproduced
Granite Creek U.S. Geothermal N/A N/A CH Unproduced
Geothermal Energy Association
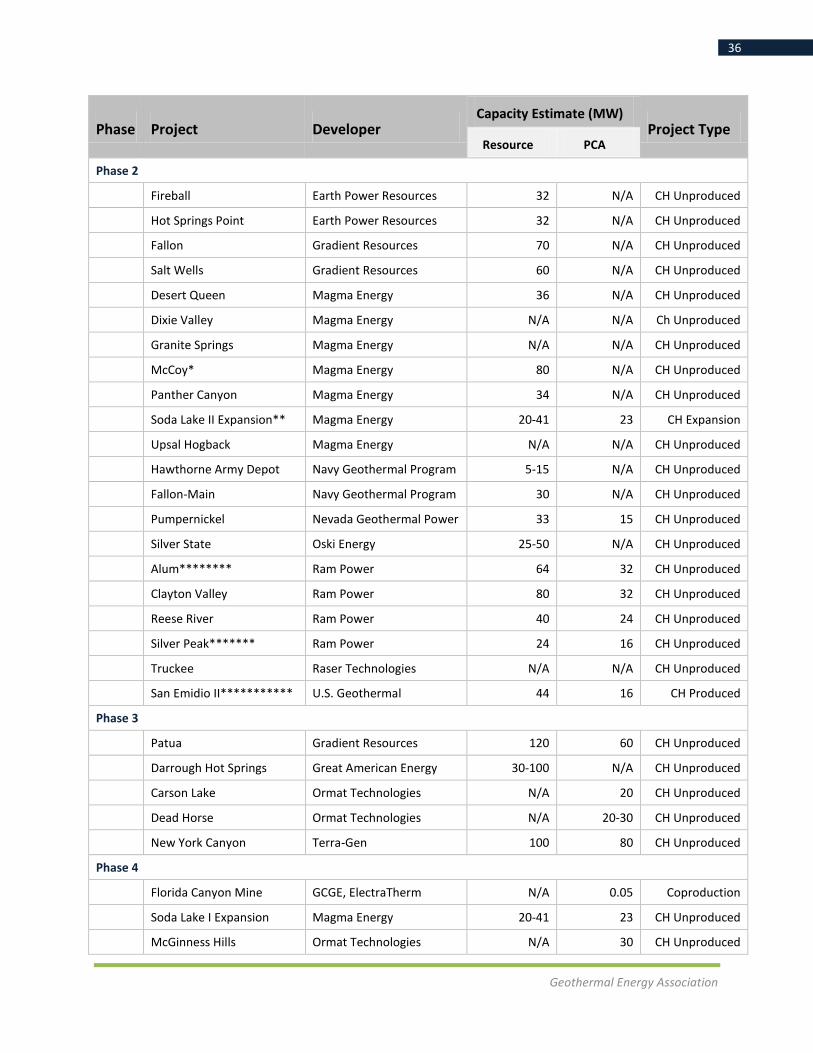
36
Phase Project Developer Capacity Estimate (MW)
Project Type Resource PCA
Phase 2
Fireball Earth Power Resources 32 N/A CH Unproduced
Hot Springs Point Earth Power Resources 32 N/A CH Unproduced
Fallon Gradient Resources 70 N/A CH Unproduced
Salt Wells Gradient Resources 60 N/A CH Unproduced
Desert Queen Magma Energy 36 N/A CH Unproduced
Dixie Valley Magma Energy N/A N/A Ch Unproduced
Granite Springs Magma Energy N/A N/A CH Unproduced
McCoy* Magma Energy 80 N/A CH Unproduced
Panther Canyon Magma Energy 34 N/A CH Unproduced
Soda Lake II Expansion** Magma Energy 20-41 23 CH Expansion
Upsal Hogback Magma Energy N/A N/A CH Unproduced
Hawthorne Army Depot Navy Geothermal Program 5-15 N/A CH Unproduced
Fallon-Main Navy Geothermal Program 30 N/A CH Unproduced
Pumpernickel Nevada Geothermal Power 33 15 CH Unproduced
Silver State Oski Energy 25-50 N/A CH Unproduced
Alum******** Ram Power 64 32 CH Unproduced
Clayton Valley Ram Power 80 32 CH Unproduced
Reese River Ram Power 40 24 CH Unproduced
Silver Peak******* Ram Power 24 16 CH Unproduced
Truckee Raser Technologies N/A N/A CH Unproduced
San Emidio II*********** U.S. Geothermal 44 16 CH Produced
Phase 3
Patua Gradient Resources 120 60 CH Unproduced
Darrough Hot Springs Great American Energy 30-100 N/A CH Unproduced
Carson Lake Ormat Technologies N/A 20 CH Unproduced
Dead Horse Ormat Technologies N/A 20-30 CH Unproduced
New York Canyon Terra-Gen 100 80 CH Unproduced
Phase 4
Florida Canyon Mine GCGE, ElectraTherm N/A 0.05 Coproduction
Soda Lake I Expansion Magma Energy 20-41 23 CH Unproduced
McGinness Hills Ormat Technologies N/A 30 CH Unproduced

Geothermal Energy Association
37
Phase Project Developer Capacity Estimate (MW)
Project Type Resource PCA
Tuscarora I Ormat Technologies N/A 18 CH Unproduced
Coyote Canyon Terra-Gen 100 80 CH Unproduced
San Emidio I (Repower) U.S. Geothermal 44 16 CH Expansion
Unconfirmed
Harmon Lake Enel N/A N/A CH Unproduced
Gabbs Valley GeoGlobal 5-60 N/A CH Unproduced
Pyramid Lake Pyramid Lake Paiute Tribe N/A N/A CH Unproduced
Source: GEA
In addition to the 65 geothermal projects in development, 26 geothermal prospects with potential for power production have been identified by developers in Nevada. Geothermal developers may have acquired access to a geothermal resource which has the potential for electricity production, but which has not yet met enough project milestones for the geothermal resource to be considered a Phase I project under the Geothermal Reporting Terms and Definitions (see Section 1). While not currently considered a geothermal “project”, a geothermal prospect has the potential to become so.
NV Geothermal Prospects
Prospect Name Developer/Owner
Beowawe Magma Energy
Buffalo Valley Magma Energy
Columbus Marsh Magma Energy
Black Rock Desert Mustang Geothermal
Hawthorne Mustang Geothermal
Monteneva Mustang Geothermal
Reese River Mustang Geothermal
Warm Springs Mustang Geothermal
Edna Mountain Nevada Geothermal Power
Beowawe Ormat Technologies
Humboldt House Ormat Technologies
Hyder Hot Springs Ormat Technologies
Seven Devils Ormat Technologies
Tuscarora Expansion Ormat Technologies
Wildhorse Ormat Technologies
Dixie Valley Ram Power
Dixie Valley North Ram Power
Gerlach Ram Power
Hawthorne Ram Power

Geothermal Energy Association
38
Howard Ram Power
North Salt Wells Ram Power
Pearl Hot Springs Ram Power
Salt Wells Ram Power
Spencer Ram Power
Sulphur Ram Power
Wells Ram Power
Source: GEA
Of the $360.8M of federal funding provided to the geothermal industry via ARRA, $61M was allocated to 18 research and development and demonstration projects in NV. In addition to ARRA funding, two companies, ElectraTherm and Energent Corporation, received approximately $1M and $1.2M in FY 2010 appropriations respectively. The table below provides a complete list of these projects and their current status.
NV DOE Funded Projects
Recipient Focus Status Amount Cost Share Expenditure
AltaRock Energy EGS R&D <50% Complete $1,450,120 $525,928 $150,239
Beowawe Power Geo Demo >50% Complete $2,000,000 $2,394,380 $1,796,283
UNR, Board of Regents, NSHE EGS R&D <50% Complete $935,505 $1,000,000 $63,082
UNR, Board of Regents, NSHE EGS R&D <50% Complete $1,278,070 $351,600 $333,178
GeoGlobal Energy IET <50% Complete $2,820,211 $2,876,624 $87,504
Geothermal Technical Partners IET <50% Complete $1,609,275 $1,668,576 $72,903
Magma Energy* IET <50% Complete $5,000,000 $9,336,380 $156,007
Magma Energy** IET <50% Complete $4,511,945 $5,527,985 $1,625,037
Nevada Geothermal Power*** IET <50% Complete $1,597,847 $1,597,847 $30,983
Oski Energy**** IET <50% Complete $4,214,086 $3,985,570 $0
Presco Energy ***** IET <50% Complete $2,277,081 $1,934,149 $430,795
Pyramid Lake Paiute Tribe****** IET <50% Complete $4,845,534 $0 $1,606,782
Sierra Geothermal Power******* IET <50% Complete $5,000,000 $7,356,546 $490,237
Sierra Geothermal Power******** IET <50% Complete $5,000,000 $7,356,546 $2,409,509
Terra-Gen********* Geo Demo <50% Complete $2,000,000 $13,484,628 $1,290,497
TGP Development********** EGS Demo <50% Complete $10,406,082 $5,252,711 $624,169
University of Kansas IET <50% Complete $2,299,237 $1,943,282 $262,525
US Geothermal*********** IET <50% Complete $3,772,560 $3,451,878 $413,462
ElectraTherm************ FY 2010 N/A $981,920 $503,934 N/A
Energent Corporation FY 2010 N/A $1,224,704 $1,180,660 N/A
Total: $63,224,177 $71,729,224 $11,843,192
Source: US DOE, GEA

Geothermal Energy Association
39
New Mexico Installed Capacity: 0.24 MW Estimated Resource Capacity in Development: N/A Estimated PCA in Development: 15 MW Number of Projects in Development: 2
In July 2008, a 0.24 MW pilot installation project went online in New Mexico.xii The full project, Lightning Dock, is being developed by Provo, Utah-based Raser Technologies and is currently expected to produce 15 MW. A second plant is planned for completion at the same site at a later date.
NM Projects in Development
Phase Project Developer Capacity Estimate (MW)
Project Type Resource PCA
Phase 1
Lightning Dock II Raser Technologies N/A N/A CH Produced
Phase 3
Lightning Dock I Raser Technologies N/A 15 CH Unproduced
Source: GEA
Of the $360.8M of federal funding provided to the geothermal industry via ARRA, $5M was allocated one research and development project and one innovative exploration technology project in NM.
NM DOE Funded Projects
Recipient Focus Status Amount Cost Share Expenditure
Arthur Mansure EGS R&D <50% Complete $50,000 $12,500 $26,479
Pueblo of Jemez IET <50% Complete $4,995,844 $100,000 $576,934
Total: $5,045,844 $112,500 $603,413
Source: US DOE, GEA

Geothermal Energy Association
40
Oregon Installed Capacity: 0.28 MW Estimated Resource Capacity in Development: 225 – 250 MW Estimated PCA in Development: 110.5 MW Number of Projects in Development: 9 Number of Geothermal Prospects: 2
In August 2009, a 0.28 MW geothermal unit began producing electricity at the Oregon Institute of Technology’s Klamath Falls campus. Currently, nine known geothermal projects are in development with the potential of providing up to 250 MW to Oregon’s electricity grid.
OR Projects in Development
Phase Project Developer Capacity Estimate (MW)
Project Type Resource PCA
Phase 1
Newberry I Newberry Geothermal 120 30 CH Unproduced
Mahagony Ormat Technologies N/A N/A CH Unproduced
Midnight Point Ormat Technologies N/A N/A CH Unproduced
Newberry Ormat Technologies N/A N/A Not Specified
Olene Gap Oski Energy 25-50 N/A CH Unproduced
Neal Hot Springs II U.S. Geothermal N/A 26 CH Produced
Phase 2
Crump Geyser Nevada Geo. Power/Ormat 80 30 CH Unproduced
GeoHeat Center II OIT N/A 1.5 CH Expansion
Phase 3
Neal Hot Springs U.S. Geothermal N/A 23 CH Unproduced
Source: GEA
In addition to the nine geothermal projects in development, two geothermal prospects with potential for power production have been identified by developers in Oregon. Geothermal developers may have acquired access to a geothermal resource which has the potential for electricity production, but which has not yet met enough project milestones for the geothermal resource to be considered a Phase I project under the Geothermal Reporting Terms and Definitions (see Section 1). While not currently considered a geothermal “project”, a geothermal prospect has the potential to become so.

Geothermal Energy Association
41
OR Geothermal Prospects
Prospect Name Developer/Owner
Alvord Raser Technologies
Klamath Falls Plant Raser Technologies
Source: GEA
Of the $360.8M of federal funding provided to the geothermal industry via ARRA, approximately $36.5M was allocated to seven research and development and demonstration projects in OR.
OR DOE Funded Projects
Recipient Focus Status Amount Cost Share Expenditure
AltaRock Energy EGS Demo <50% Complete $21,448,389 $22,355,008 $572,810
City of Klamath Falls Geo Demo Not Started $816,100 $816,100 $35,119
Johnson Controls Geo Demo <50% Complete $1,047,714 $1,090,271 $27,692
Nevada Geothermal Power* IET <50% Complete $1,764,272 $1,839,271 $350,659
Davenport Power IET <50% Complete $5,000,000 $7,830,425 $506,015
Ormat Technologies** IET <50% Complete $4,377,000 $4,327,260 $473,734
Surprise Valley Electrification Geo Demo <50% Complete $2,000,000 $7,513,522 $27,083
Total: $36,453,475 $45,771,857 $1,993,112
Source: US DOE, GEA
Texas Installed Capacity: 0 MW Estimated Resource Capacity in Development: N/A Estimated PCA in Development: 0.8 MW Number of Projects in Development: 1
Texas’ first developing geothermal project is a planned geothermal hydrocarbon co-production (GHCP) unit in Goliad County.
TX Projects in Development
Phase Project Developer Capacity Estimate (MW)
Project Type Resource PCA
Phase 2
Goliad Co. Coproduction* Universal GeoPower N/A 0.8 Coproduction
Source: GEA

Geothermal Energy Association
42
Of the $360.8M of federal funding provided to the geothermal industry via ARRA, $25.5M was allocated to nine research and development and demonstration projects in TX. The following table provides a complete list of these projects and their current status.
TX DOE Funded Projects
Recipient Focus Status Amount Cost Share Expenditure
ADI Analytics EGS R&D <50% Complete $1,335,727 $336,823 $236,333
Baker Hughes EGS R&D <50% Complete $5,000,000 $1,272,780 $397,000
El Paso County IET <50% Complete $5,000,000 $4,812,500 $461,756
Schlumberger Technology EGS R&D <50% Complete $4,731,449 $1,627,901 $1,674,057
Southern Methodist University NGDS <50% Complete $5,250,000 $0 $320,883
Texas A&M University EGS R&D <50% Complete $1,061,245 $498,440 $119,966
University of Texas at Austin EGS R&D <50% Complete $1,397,170 $349,292 $1,169,987
University of Texas at Austin GHP <50% Complete $250,000 $63,200 $80,058
Universal GeoPower* Geo Demo <50% Complete $1,499,288 $2,050,000 $90,703
Total: $25,524,879 $11,010,936 $4,550,743
Source: US DOE, GEA
Utah Installed Capacity: 42 MW Estimated Resource Capacity in Development: 90 – 160 MW Estimated PCA in Development: 40 – 55 MW Number of Projects in Development: 12 Number of Geothermal Prospects: 8
A number of geothermal power plants operate in Utah. Unit 1 of the Blundell power plant has an installed capacity of 23 MW and Unit 2 has a capacity of 9 MW. In April 2009 the low-temperature 10-MW Hatch Geothermal Power Plant in Beaver County began delivering power to Anaheim California.
UT Projects in Development
Phase Project Developer Capacity Estimate (MW)
Project Type Resource PCA
Phase 1
Hill Air Force Base Navy Geothermal Program N/A N/A CH Unproduced
Drum Mountain Ormat Technologies N/A N/A Unspecified
Whirlwind Valley Ormat Technologies N/A N/A Unspecified
DeArmand Raser Technologies N/A N/A CH Unproduced

Geothermal Energy Association
43
Phase Project Developer Capacity Estimate (MW)
Project Type Resource PCA
Drum Mountain Raser Technologies N/A N/A CH Unproduced
Thermo 2 Raser Technologies N/A N/A CH Produced
Drum Mountain Standard Steam Trust N/A N/A CH Unproduced
Phase 2
Thermo Magma Energy 20 N/A CH Unproduced
Cove Fort Oski Energy 50-75 N/A CH Unproduced
Unconfirmed
Cove Fort Enel NA 20-65 N/A CH Unproduced
Cove Fort 2 Enel NA N/A 20-35 CH Produced
Falstaff Verdi Energy N/A 20 CH Unproduced
Source: GEA
In addition to the 12 geothermal projects in development, eight geothermal prospects with potential for power production have been identified by developers in Utah. Geothermal developers may have acquired access to a geothermal resource which has the potential for electricity production, but which has not yet met enough project milestones for the geothermal resource to be considered a Phase I project under the Geothermal Reporting Terms and Definitions (see Section 1). While not currently considered a geothermal “project”, a geothermal prospect has the potential to become so.
UT Geothermal Prospects
Prospect Name Developer/Owner
Abraham Raser Technologies
Cricket Raser Technologies
Pavant Raser Technologies
Thermo 3 Raser Technologies
Thermo 4 Raser Technologies
Thermo Central Raser Technologies
Thermo Greater Raser Technologies
Wood Ranch Raser Technologies
Source: GEA
Of the $360.8M of federal funding provided to the geothermal industry via ARRA, $3.8M was allocated to five research and development and demonstration projects in UT.

Geothermal Energy Association
44
UT DOE Funded Projects
Recipient Focus Status Amount Cost Share Expenditure
CSI Technologies EGS R&D >50% Complete $766,598 $585,000 $375,667
University of Utah EGS R&D <50% Complete $559,485 $140,378 $244,249
University of Utah EGS R&D <50% Complete $603,230 $150,930 $76,615
University of Utah EGS R&D <50% Complete $944,707 $441,507 $57,488
University of Utah EGS R&D <50% Complete $890,059 $348,440 $187,264
Total: $3,764,079 $1,666,255 $941,283
Source: US DOE, GEA
Washington Installed Capacity: 0 MW Estimated Resource Capacity in Development: 100 MW Estimated PCA in Development: N/A Number of Projects in Development: 1
While the state of Washington currently harbors no geothermal power plants, one company, Gradient Resources, is in the early stages of developing its Mt. Baker project there.
WA Projects in Development
Phase Project Developer Capacity Estimate (MW)
Project Type Resource PCA
Phase 1
Mt. Baker Gradient Resources 100 N/A CH Unproduced
Source: GEA
Of the $360.8M of federal funding provided to the geothermal industry via ARRA, $3.8M was allocated to one research and development and demonstration project in WA. See table below for details.
WA DOE Funded Projects
Recipient Focus Status Amount Cost Share Expenditure
Honeywell International EGS R&D <50% Complete $3,852,101 $963,025 $671,946
Total: $3,852,101 $963,025 $671,946
Source: US DOE, GEA

Geothermal Energy Association
45
Wyoming Installed Capacity: 0.25 MW Estimated Resource Capacity in Development: N/A Estimated PCA in Development: 0.28 MW Number of Projects in Development: 1 In August 2008, a 0.25 MW GHCP unit was installed at the Department of Energy’s Rocky Mountain Oil Test Center (RMOTC) near Casper, Wyoming. The unit, built by Ormat Technologies, Inc., was operated for approximately one year when it was shut down for maintenance. The unit has since resumed operation and RMOTC is developing another site for the installation of a 0.28 MW GHCP unit.
WY Projects in Development
Phase Project Developer Capacity Estimate (MW)
Project Type Resource PCA
Unconfirmed
RMOTC Co-production RMOTC N/A 0.28 Coproduction
Source: GEA
Of the $360.8M of federal funding provided to the geothermal industry via ARRA, $4.5M was allocated to Novatek for an EGS research and development and demonstration project.
WY DOE Funded Projects
Recipient Focus Status Amount Cost Share Expenditure
Novatek EGS R&D <50% Complete $4,500,000 $6,184,678 $2,823,000
Total: $4,500,000 $6,184,678 $2,823,000
Source: US DOE, GEA

Geothermal Energy Association
46
3.2 States with Projects Receiving DOE Funding Only The following list includes states with companies whose projects are receiving ARRA funding and/or FY 2010 appropriations from DOE. These states do not contain any geothermal projects in development which have been identified to GEA.
Arkansas Installed Capacity: 0 MW Estimated Resource Capacity in Development: 0 MW Estimated PCA in Development: 0 MW
Arkansas has no utility-scale or small power geothermal projects in development. However, ARRA awarded approximately $4M to two geothermal heat pump projects in that state.
AR DOE Funded Projects
Recipient Focus Status Amount Cost Share Expenditure
Cedarville School District 44 GHP >50% Complete $2,420,000 $2,420,000 $1,535,594
Newport School District GHP N/A $1,627,796 $1,627,796 N/A
Total: $4,047,796 $4,047,796 $1,535,594
Source: US DOE, GEA
Connecticut Installed Capacity: 0 MW Estimated Resource Capacity in Development: 0 MW Estimated PCA in Development: 0 MW Of the $360.8M of federal funding provided to the geothermal industry via ARRA, approximately $4.4M was allocated to four research and development and demonstration projects in CT. The table below provides a complete list of these projects and their current status.
CT DOE Funded Projects
Recipient Focus Status Amount Cost Share Expenditure
Gas Equipment Engineering Corp. EGS R&D >50% Complete $1,243,624 $416,466 $645,722
United Technologies Research EGS R&D >50% Complete $1,191,218 $297,804 $766,592
United Technologies Research EGS R&D <50% Complete $1,816,306 $454,076 $803,180
University of Hartford GHP >50% Complete $146,973 $36,767 $52,907
Total: $4,398,121 $1,205,113 $2,268,401
Source: US DOE, GEA

Geothermal Energy Association
47
District of Columbia Installed Capacity: 0 MW Estimated Resource Capacity in Development: 0 MW Estimated PCA in Development: 0 MW Of the $360.8M of federal funding provided to the geothermal industry via ARRA, $1.1M was allocated to the Geothermal Heat Pump Consortium.
DC DOE Funded Projects
Recipient Focus Status Amount Cost Share Expenditure
Geo. Heat Pump Consortium GHP <50% Complete $1,077,500 $0 $225,663
Total: $1,077,500 $0 $225,663
Source: US DOE, GEA
Florida Installed Capacity: 0 MW Estimated Resource Capacity in Development: 0 MW Estimated PCA in Development: 0 MW Of the $360.8M of federal funding provided to the geothermal industry via ARRA, $0.25M was allocated to Florida International University for a project involving geothermal heat pump systems. This project is more than 50% complete.
FL DOE Funded Projects
Recipient Focus Status Amount Cost Share Expenditure
Florida International University GHP >50% Complete $250,000 $65,840 $98,074
Total: $250,000 $65,840 $98,074
Source: US DOE, GEA

Geothermal Energy Association
48
Illinois Installed Capacity: 0 MW Estimated Resource Capacity in Development: 0 MW Estimated PCA in Development: 0 MW Of the $360.8M of federal funding provided to the geothermal industry via ARRA, approximately $3.7M was allocated to two geothermal heat pump projects in IL.
IL DOE Funded Projects
Recipient Focus Status Amount Cost Share Expenditure
Dep. Of Military Affairs GHP <50% Complete $1,200,000 $400,000 $73,672
Indie Energy Systems Company GHP >50% Complete $2,459,971 $2,515,250 $2,303,638
Total: $3,659,971 $2,915,250 $2,377,310
Source: US DOE, GEA
Indiana Installed Capacity: 0 MW Estimated Resource Capacity in Development: 0 MW Estimated PCA in Development: 0 MW Of the $360.8M of federal funding provided to the geothermal industry via ARRA, approximately $6.3M was allocated to two geothermal heat pump projects in IN.
IN DOE Funded Projects
Recipient Focus Status Amount Cost Share Expenditure
Ball State University GHP >50% Complete $5,000,000 $5,000,000 $3,565,119
Indiana Institute of Technology GHP >50% Complete $1,339,591 $1,339,591 $1,178,587
Total: $6,339,591 $6,339,591 $4,743,706
Source: US DOE, GEA
Massachusetts Installed Capacity: 0 MW Estimated Resource Capacity in Development: 0 MW Estimated PCA in Development: 0 MW Of the $360.8M of federal funding provided to the geothermal industry via ARRA, $3.8M was allocated to two EGS research and development and demonstration projects in MA.

Geothermal Energy Association
49
MA DOE Funded Projects
Recipient Focus Status Amount Cost Share Expenditure
Draka Cableteq USA EGS R&D <50% Complete $3,222,398 $1,185,792 $1,281,875
MIT EGS R&D <50% Complete $549,148 $157,290 $97,844
Total: $3,771,546 $1,343,082 $1,379,719
Source: US DOE, GEA
Michigan Installed Capacity: 0 MW Estimated Resource Capacity in Development: 0 MW Estimated PCA in Development: 0 MW Of the $360.8M of federal funding provided to the geothermal industry via ARRA, $2.7M was allocated to Oakland University for a project involving geothermal heat pumps.
MI DOE Funded Projects
Recipient Focus Status Amount Cost Share Expenditure
Oakland University GHP <50% Complete $2,738,100 $7,040,830 $624,707
Total: $2,738,100 $7,040,830 $624,707
Source: US DOE, GEA
Minnesota Installed Capacity: 0 MW Estimated Resource Capacity in Development: 0 MW Estimated PCA in Development: 0 MW Of the $360.8M of federal funding provided to the geothermal industry via ARRA, approximately $2.9M was allocated to a EGS research and development as well as a geothermal heat pump project in MN.
MN DOE Funded Projects
Recipient Focus Status Amount Cost Share Expenditure
City of Eagan GHP Completed $1,338,000 $1,430,131 $1,338,000
University of Minnesota EGS R&D <50% Complete $1,550,081 $387,505 $247,143
Total: $2,888,018 $1,817,636 $1,585,143
Source: US DOE, GEA

Geothermal Energy Association
50
Missouri Installed Capacity: 0 MW Estimated Resource Capacity in Development: 0 MW Estimated PCA in Development: 0 MW Of the $360.8M of federal funding provided to the geothermal industry via ARRA $2.5M, was allocated to the University of Missouri for a geothermal heat pump project.
MO DOE Funded Projects
Recipient Focus Status Amount Cost Share Expenditure
University of Missouri GHP <50% Complete $2,476,400 $2,698,500 $61,609
Total: $2,476,400 $2,698,500 $61,609
Source: US DOE, GEA
Montana Installed Capacity: 0 MW Estimated Resource Capacity in Development: 0 MW Estimated PCA Development: 0 MW Of the $360.8M of federal funding provided to the geothermal industry via ARRA, approximately $1.2M was allocated to two geothermal heat pump projects in MT.
MT DOE Funded Projects
Recipient Focus Status Amount Cost Share Expenditure
Flathead Electric Cooperative GHP >50% Complete $155,270 $164,274 $32,271
University of Montana GHP <50% Complete $1,072,744 $1,082,753 $60,696
Total: $1,228,014 $1,247,027 $92,967
Source: US DOE, GEA
North Carolina Installed Capacity: 0 MW Estimated Resource Capacity in Development: 0 MW Estimated PCA in Development: 0 MW Of the $360.8M of federal funding provided to the geothermal industry via ARRA, approximately $1.3M was allocated to the City of Raleigh, NC for a geothermal heat pump project.

Geothermal Energy Association
51
NC DOE Funded Projects
Recipient Focus Status Amount Cost Share Expenditure
City of Raleigh GHP >50% Complete $1,293,625 $1,293,625 $258,741
Total: $1,293,625 $1,293,625 $258,741
Source: US DOE, GEA
North Dakota Installed Capacity: 0 MW Estimated Resource Capacity in Development: 0 MW Estimated PCA in Development: 0 MW Of the $360.8M of federal funding provided to the geothermal industry via ARRA, approximately $3.5M was allocated to two geothermal demonstration projects being carried out by the University of North Dakota.
ND DOE Funded Projects
Recipient Focus Status Amount Cost Share Expenditure
University of North Dakota Geo Demo <50% Complete $1,733,864 $1,734,058 $36,847
University of North Dakota Geo Demo <50% Complete $1,733,864 $1,734,058 $65,217
Total: $3,467,728 $3,468,116 $102,064
Source: US DOE, GEA
Nebraska Installed Capacity: 0 MW Estimated Resource Capacity in Development: 0 MW Estimated PCA in Development: 0 MW Of the $360.8M of federal funding provided to the geothermal industry via ARRA, $5M was allocated to a geothermal heat pump project in NE.
NE DOE Funded Projects
Recipient Focus Status Amount Cost Share Expenditure
District Energy Corporation GHP <50% Complete $5,000,000 $15,132,822 $3,117,213
Total: $5,000,000 $15,132,822 $3,117,213
Source: US DOE, GEA

Geothermal Energy Association
52
New Jersey Installed Capacity: 0 MW Estimated Resource Capacity in Development: 0 MW Estimated PCA in Development: 0 MW Of the $360.8M of federal funding provided to the geothermal industry via ARRA, approximately $0.11M was allocated to Environ International Corporation for a geothermal heat pump project and $5M in FY 2010 annual appropriations went to NRG Energy.
NJ DOE Funded Projects
Recipient Focus Status Amount Cost Share Expenditure
Environ International Corporation GHP >50% Complete $109,999 $28,999 $68,405
NRG Energy FY 2010 N/A $5,000,000 $19,856,817 N/A
Total: $5,109,999 $19,885,816 $68,405
Source: US DOE, GEA
New York Installed Capacity: 0 MW Estimated Resource Capacity in Development: 0 MW Estimated PCA in Development: 0 MW Of the $360.8M of federal funding provided to the geothermal industry via ARRA, approximately $13.7M was allocated to five research and development and geothermal heat pump projects in NY.
NY DOE Funded Projects
Recipient Focus Status Amount Cost Share Expenditure
GE Global Research EGS R&D <50% Complete $3,000,000 $750,000 $882,970
GE Global Research EGS R&D <50% Complete $3,408,485 $852,121 $456,942
GE Global Research EGS R&D <50% Complete $2,390,210 $597,553 $420,154
General Electric EGS R&D <50% Complete $2,085,062 $567,689 $631,504
University at Albany GHP <50% Complete $2,786,250 $2,786,250 $142,840
Total: $13,670,007 $5,553,613 $2,534,410
Source: US DOE, GEA

Geothermal Energy Association
53
Ohio Installed Capacity: 0 MW Estimated Resource Capacity in Development: 0 MW Estimated PCA in Development: 0 MW Of the $360.8M of federal funding provided to the geothermal industry via ARRA, approximately $0.23M was allocated to Ohio’s Wright State University for a geothermal heat pump project.
OH DOE Funded Projects
Recipient Focus Status Amount Cost Share Expenditure
Wright State University GHP >50% Complete $232,596 $58,513 $173,485
Total: $232,596 $58,513 $173,485
Source: US DOE, GEA
Oklahoma Installed Capacity: 0 MW Estimated Resource Capacity in Development: 0 MW Estimated PCA in Development: 0 MW Of the $360.8M of federal funding provided to the geothermal industry via ARRA, approximately $2.9M was allocated to three research and development and geothermal heat pump projects in OK.
OK DOE Funded Projects
Recipient Focus Status Amount Cost Share Expenditure
Climate Master GHP <50% Complete $233,819 $77,056 $76,760
Impact Technologies EGS R&D <50% Complete $2,399,999 $600,000 $677,521
Oklahoma State University GHP <50% Complete $250,000 $62,520 $125,103
Total: $2,883,818 $739,576 $879,384
Source: US DOE, GEA

Geothermal Energy Association
54
Pennsylvania Installed Capacity: 0 MW Estimated Resource Capacity in Development: 0 MW Estimated PCA in Development: 0 MW Of the $360.8M of federal funding provided to the geothermal industry via ARRA, $2.8M was allocated to EGS research and development and a geothermal heat pump project in PN.
PN DOE Funded Projects
Recipient Focus Status Amount Cost Share Expenditure
1001 15th
Street Associates GHP <50% Complete $1,682,920 $1,682,920 $3,403
Pennsylvania State University EGS R&D <50% Complete $1,113,024 $485,990 $89,110
Total: $2,795,944 $2,168,910 $92,513
Source: US DOE, GEA
South Carolina Installed Capacity: 0 MW Estimated Resource Capacity in Development: 0 MW Estimated PCA in Development: 0 MW Of the $360.8M of federal funding provided to the geothermal industry via ARRA, approximately $2.5M was allocated to South Carolina’s Furman University for a geothermal heat pump project which is more than 50% complete.
SC DOE Funded Projects
Recipient Focus Status Amount Cost Share Expenditure
Furman University GHP >50% Complete $2,457,741 $2,457,741 $54,296
Total: $2,457,741 $2,457,741 $54,296
Source: US DOE, GEA
Tennessee Installed Capacity: 0 MW Estimated Resource Capacity in Development: 0 MW Estimated PCA in Development: 0 MW Of the $360.8M of federal funding provided to the geothermal industry via ARRA, approximately $11.1M was allocated to three geothermal heat pump projects in TN.

Geothermal Energy Association
55
TN DOE Funded Projects
Recipient Focus Status Amount Cost Share Expenditure
Development & Housing Agency GHP N/A $1,800,000 $1,800,000 N/A
Oak Ridge City Center GHP <50% Complete $5,000,000 $8,206,633 $3,750
TN Department of Education GHP <50% Complete $4,255,374 $5,123,072 $43,057
Total: $11,055,374 $15,129,705 $46,087
Source: US DOE, GEA
Virginia Installed Capacity: 0 MW Estimated Resource Capacity in Development: 0 MW Estimated PCA in Development: 0 MW Of the $360.8M of federal funding provided to the geothermal industry via ARRA, approximately $2.6M was allocated to two EGS research and development and demonstration projects in VA.
VA DOE Funded Projects
Recipient Focus Status Amount Cost Share Expenditure
Bob Lawrence and Associates EGS R&D <50% Complete $1,499,601 $378,732 $384,516
William Lettis and Associates EGS R&D <50% Complete $1,093,235 $313,510 $109,090
Total: $2,592,836 $692,242 $493,606
Source: US DOE, GEA

Geothermal Energy Association
56
Wisconsin Installed Capacity: 0 MW Estimated Resource Capacity in Development: 0 MW Estimated PCA in Development: 0 MW Of the $360.8M of federal funding provided to the geothermal industry via ARRA, $1.8M was allocated to four geothermal heat pump projects in WI.
WI DOE Funded Projects
Recipient Focus Status Amount Cost Share Expenditure
Energy Center of Wisconsin GHP >50% Complete $190,395 $55,605 $95,560
Johnson Controls GHP <50% Complete $311,324 $311,324 $64,906
RiverHeath GHP <50% Complete $978,168 $978,168 $21,300
Skychaser Energy GHP >50% Complete $325,124 $463,832 $36,026
Total: $1,805,011 $1,808,929 $217,792
Source: US DOE, GEA
West Virginia Installed Capacity: 0 MW Estimated Resource Capacity in Development: 0 MW Estimated PCA in Development: 0 MW Of the $360.8M of federal funding provided to the geothermal industry via ARRA, approximately $1.2M was allocated to West Virginia University for an EGS research and development and demonstration project.
WV DOE Funded Projects
Recipient Focus Status Amount Cost Share Expenditure
West Virginia University EGS GHP <50% Complete $1,206,330 $306,906 $144,012
Total: $1,206,330 $306,906 $144,012
Source: US DOE, GEA

Geothermal Energy Association
57
4. Comparison with Previous Report Data and Trends Due to the new reporting requirements brought about by the implementation of GEA’s Geothermal Reporting Terms and Definitions for 2011, comparison with earlier versions of GEA’s annual reports may be problematic. However, the general trend of projects under development can be estimated by adjusting project totals from the 2010 report for some of the more significant changes made in the 2011 report. In particular, a number of “projects” listed in 2010 are now included as “prospects” in this report. This is due, in part, to the higher standards applied to reporting information on projects in development and in some cases is due to changes in ownership or other company related matters. The consideration of the number of geothermal prospects reported in 2011 along with confirmed projects in development indicates that geothermal developers are actively developing known geothermal resources as well as seeking new prospects for development. The number of projects in development has continued to increase at a steady rate since early 2006. Figure 14: Total Confirmed Projects + 2011 Prospects
Source: GEA
The changes brought about by the higher reporting standards also impacted the total MW capacity in development being reported by developers in 2011. This is partly due to the shift noted above where some sites are now classified as prospects instead of projects in the report, but also because while in the past developers would only report one capacity value for a project to GEA, the Geothermal Reporting Terms and Definitions gave them the opportunity to report both a resource capacity estimate and a PCA estimate. While these estimates are directly related to each other, they provide different points if information (see section 1 on the Geothermal Reporting Terms and Definitions for further explanation). This makes comparing capacity in development information from the 2011 Annual Report to previous years more complex. However, a comparison of the overall resource capacity in the 2011 Annual report
34
69
83
121
152
170
0
20
40
60
80
100
120
140
160
180
Apr-06 Apr-07 Apr-08 Apr-09 Apr-10 Apr-11
Nu
mb
er
of
Pro
ject
s an
d P
rosp
ect
s
Phase I Phase II Phase III Phase IV Prospect

Geothermal Energy Association
58
with the mixed capacity levels from the 2010 report provides insight regarding development trends in the geothermal industry. In 2010 approximately 4407 – 6365 MW of geothermal resources were under development by geothermal companies, while industry reported approximately 5102 – 5745 MW of geothermal development in 2011. The median values for geothermal capacity under development in 2010 and 2011 are 5386 MW and 5423 MW respectively, indicating that the median total geothermal MW under development remains steady. This does not include 18 geothermal prospects whose potential contribution is not estimated. Figure 15: 2010 and 2011 Average Capacity (MW) in Development
Source: GEA
5386 MW 5423 MW
2010 2011

Geothermal Energy Association
59
5. References i U.S. DOE: Geothermal Technologies Program. Geothermal Tomorrow (Sep. 2008). ii The development of stricter project phase criteria, via the Geothermal Reporting Terms and Definitions, has
altered the status of certain projects that were previously considered as being in an advanced stage of development. The adherence to a more thorough set of project phase criteria actually led some projects to effectively be listed in earlier phases of project development. For this reason, a comparison of phase 3 and phase 4 project PCA totals to phase 4 capacity in development totals from previous years is more accurate than comparing to capacity in development totals for phase 3 and 4 for previous years. iii U.S. Department of the Treasury, 1603 Program: http://www.treasury.gov/initiatives/recovery/Pages/1603.aspx
iv U.S. Department of Energy, Loan Programs Office: http://www.lgprogram.energy.gov/
v Communication with U.S. Department of Energy, Geothermal Technologies Program:
http://www.eere.energy.gov/geothermal/index.html vi Recovery.gov: http://www.recovery.gov/About/board/Pages/TheBoard.aspx
vii U.S. Department of Energy, Geothermal Technologies Program:
http://www.eere.energy.gov/geothermal/projects/foa_listing.cfm/FOANumber/DE-FOA-0000318 viii
California Energy Commission: http://www.energy.ca.gov/ ix Hawaii Department of Business, Economic Development and Tourism:
http://hawaii.gov/dbedt/info/energy/renewable/geothermal x Idaho Office of Energy Resources: http://www.energy.idaho.gov/
xi Nevada Commission on Mineral Resources Division of Minerals : http://minerals.state.nv.us/
xii New Mexico Energy, Minerals, and Natural Resources Department:
http://www.emnrd.state.nm.us/main/index.htm
209 Pennsylvania Avenue SE, Washington, DC www.geo-energy.org