Embed Size (px)
Citation preview

2011 ANNUAL REPORT

Data definitions are provided in the Appendices.
Note concerning data accuracy: The Office of the Board of Governors believes that the accuracy of the data it collects and reports is paramount to ensuring accountability in the State University System. Thus, the Board Office allows university resubmissions of some data to correct errors when they are discovered. This policy can lead to changes in historical data.

TABLE OF CONTENTS
Dashboard……………………………………..page 1 Key Achievements……………………………page 5 Narrative Report…...………………………… page 6 Data Tables…………………………………… page 14
Section 1 – Financial Resources [Not every university will have HSC & IFAS tables.] TABLE 1A. University Education and General Revenues
1B. University Education and General Expenditures 1C. State Funding per Full-Time Equivalent (FTE)
Student 1D. University Other Budget Entities 1E. University Total Revenues and Expenditures 1F. Voluntary Support of Higher Education 1G. University Federal Stimulus Dollars (ARRA) 1H. HSC - Education and General Revenues
1I. HSC - Education and General Expenditures 1J. HSC – Faculty Practice Plans
1K. IFAS - Education and General Revenues 1L. IFAS - Education and General Expenditures
Section 2 – Personnel TABLE 2A. Personnel Headcount
Section 3 – Enrollment TABLE 3A. University Full-Time Enrollment (FTE)
3B. Enrollment by Location
Section 4 – Undergraduate Education TABLE 4A. Baccalaureate Degree Program Changes
in AY 2009-2010 4B. First-Year Persistence Rates 4C. Federal Definition - Undergraduate Progression and
Graduation Rates for Full-Time, First-Time-in-College (FTIC) Students
Section 4 – Undergraduate Education (continued) TABLE 4D. SUS Definition - Undergraduate Progression and
Graduation Rates for Full- & Part-Time, First-Time-in-College (FTIC) Students 4E. SUS Definition - Undergraduate Progression and
Graduation Rates for AA Transfer Students 4F. SUS Definition - Undergraduate Progression and
Graduation Rates for Other Transfer Students 4G. Baccalaureate Degrees Awarded 4H. Baccalaureate Degrees Awarded in Areas of
Strategic Emphasis 4I. Baccalaureate Degrees Awarded to
Underrepresented Groups 4J. Baccalaureate Completion
Without Excess Credit Hours 4K. Undergraduate Course Offerings 4L. Faculty Teaching Undergraduates 4M. Undergraduate Instructional Faculty Compensation 4N. Student/Faculty Ratio 4O. Professional Licensure Exams - Undergraduate
Programs 4P. Tuition Differential Fee
Section 5 – Graduate Education TABLE 5A. Graduate Degree Program Changes
in AY 2009-2010 5B. Graduate Degrees Awarded 5C. Graduate Degrees Awarded in Areas of Strategic
Emphasis 5D. Professional Licensure Exams - Graduate Programs
Section 6 – Research and Economic Development TABLE 6A. Research and Development
6B. Centers of Excellence 6C. State University Research Commercialization
Assistance Grants 6D. 21st Century World Class Scholars Program

Enrollments Headcount %TOTAL
(Fall 2010)Black 5,627 13% 65
Hispanic 26,578 60% 79White 6,227 14% 28 Enrollment Profile: High undergraduate
Other 5,578 13% 3 Undergraduate Profile: Medium full-time four-year, selective,higher transfer-in
Full-Time 26,439 60% Size and Setting: Large four-year, primarily nonresidentialPart-Time 17,571 40%
Undergraduate 32,901 75% TOTAL 844 15Graduate 7,897 18% Tenure/T. Track 634 6
Unclassified 3,212 7% Other Faculty/Instr. 210 9Curricular Engagement and Outreach and
Partnerships
Faculty (Fall 2010) Full-Time
Graduate Instructional Program:
Professional Doctorate
Baccalaureate
TOTALProfessions plus arts & sciences,
high graduate coexistenceUndergraduate
Instructional Program:175
Comprehensive doctoral(no medical/veterinary)Master’s & Specialist’s
Florida International University 2011 Dashboard
BOARD OF GOVERNORS – STATE UNIVERSITY SYSTEM 2005-2013 STRATEGIC PLAN GOALSGOAL 1: ACCESS TO AND PRODUCTION OF DEGREES
Part-Time
Basic: Research Universities(high research activity)
CommunityEngagement:
Sites and Campuses Modesto A. Maidique Campus, Biscayne Bay Campus, Pines Center Site
Research Doctorate
Degree Programs Offered (As of Spr. 2011) Carnegie Classification
44,010 100%
6,000
7,000
Baccalaureate DegreesAwarded
6,555* 2,500
3,000
Graduate Degrees Awarded
2,570*
5 000
6,000
Baccalaureate Degrees Awarded by Group
80%
90%
Baccalaureates by Group as Percentage of Total FIU
Baccalaureates
*2012-13 Targets for Degrees Awarded.Note: All targets are based on 2010 University Workplans.
[2012-13 Targets for Baccalaureates By GroupReported in Volume II - Table 4I.].
0
1,000
2,000
3,000
4,000
5,000
,
Bachelor's2006-07 2010-11
,
0
500
1,000
1,500
2,000
2,500
2006-07 2010-11
Master's Doctorates
353*
0
1,000
2,000
3,000
4,000
5,000
2006-07 2010-11 2006-07 2010-11
Black Hispanic Pell
13% 13%
46% 50%
64% 68%
0%
10%
20%
30%
40%
50%
60%
70%
80%
2006-07 2010-11 2006-07 2010-11
Black Hispanic Pell
FLORIDA INTERNATIONAL UNIVERSITY - 2010-11 ANNUAL REPORT 1

Florida International University 2011 DashboardBOARD OF GOVERNORS – STATE UNIVERSITY SYSTEM 2005-2013 STRATEGIC PLAN GOALS
GOAL 2: MEETING STATEWIDE PROFESSIONAL AND WORKFORCE NEEDS
BOARD OF GOVERNORS – STATE UNIVERSITY SYSTEM 2005-2013 STRATEGIC PLAN GOALSGOAL 3: BUILDING WORLD-CLASS ACADEMIC PROGRAMS AND RESEARCH CAPACITY
48208
1,151
0200400600800
1,0001,2001,4001,600
Bachelor's
Baccalaureate Degrees Awarded in Select Areas of Strategic Emphasis, 2010-11
STEMHealth ProfessionsEducation-Critical Shortage Areas
88 4
394
54
401
70
0
500
1,000
Graduate Degrees Awarded in Select Areas of Strategic
Emphasis, 2010-11
Education-Critical Shortage AreasHealth ProfessionsSTEM
Master's Doctorates
2012-13 Target: Increase(2008-09 Baseline: 1,186 Total)
2012-13 Target: Increase(2008-09 Baseline: 985 Total)
65%
75%
89%
90%
82%
87%
82%
89%
0% 20% 40% 60% 80% 100%
OccupationalTherapy*
PhysicalTherapy*
Law
Nursing
2010-11 Certification/Licensure Exams(1st-time) Pass Rates
State/National Benchmark University Pass Rate
Note*: Based on 2008-2010 average due to small number of examinees.
*2011-12 Targets for Research & Development Expenditures. 2011-12 Targets: Licenses - Increase (2008 Baseline = 0)Licensing Revenue - Increase (2008 Baseline = $9,423)
GOAL 3: BUILDING WORLD-CLASS ACADEMIC PROGRAMS AND RESEARCH CAPACITY
$63
$110
$0
$20
$40
$60
$80
$100
$120
$140
Federal Only Total - All Sources
MillionsAcademic Research and Development
Expenditures
2005-06 2009-10
$ 70 M*
$ 121 M*
0
1
2
3
4
5
$0$5
$10$15$20$25$30$35$40$45$50
2005 2006 2007 2008 2009
Lice
nses
& O
ptio
ns E
xecu
ted
Lice
nsin
g In
com
eThousands
University Innovations Generating Revenue Through Technology Transfer:
Licenses and Licensing Revenue
Licensing Income Licenses & Options Executed
FLORIDA INTERNATIONAL UNIVERSITY - 2010-11 ANNUAL REPORT 2

Florida International University 2010-11 Dashboard BOARD OF GOVERNORS – STATE UNIVERSITY SYSTEM OF FLORIDA – 2005-2013 STRATEGIC PLAN
GOAL 4: MEETING COMMUNITY NEEDS AND FULFILLING UNIQUE INSTITUTIONAL RESPONSIBILITIES Florida International University is proud to be the top institution in the nation in awarding bachelor’s and master’s degrees to Hispanics. FIU is also the national leader in awarding STEM bachelor’s degrees to minorities. FIU continues its success in producing an educated workforce to meet the local and state needs and providing students opportunities to gain real-world experience.
Top 5 colleges awarding the most bachelor’s degrees to Hispanics, 2009-101
Rank Institution Name Degrees
1 Florida International University 3,918 2 The University of Texas at El Paso 2,382 3 The University of Texas-Pan American 2,360 4 The University of Texas at San Antonio 1,779 5 California State University-Fullerton 1,680
Top 5 colleges awarding the most STEM bachelor’s degrees to Underrepresented Minorities, 2009-102
Rank Institution Name Degrees 1 Florida International University 588 2 The University of Texas at El Paso 442 3 University of Florida 422 4 The University of Texas at Austin 360 5 The University of Texas-Pan American 350
1 The Hispanic Outlook for Higher Education Magazine 2 IPEDS Completions Survey, STEM categories
2,773
1,246
0
500
1,000
1,500
2,000
2,500
3,000
Bachelor's Graduate
2010-11 Degrees Awarded in All Areas of Strategic Emphasis
771
1,003
0
500
1,000
1,500
2,000
1
2010-11 Number of Students Participating in Internships
Internships through Careers ServicesCo-Op Courses
FLORIDA INTERNATIONAL UNIVERSITY - 2010-11 ANNUAL REPORT 3

Florida International University 2011 DashboardRESOURCES, EFFICIENCIES, AND EFFECTIVENESS
62.5%
56.5%
47.6%
41.0%
AATs -2003-2007
AATs -2007-2011*
FTICs-2001-2007
FTICs -2005-2011*
Undergraduate Retention and Graduation Rates
6-Yr Rates for FTIC Cohorts
n = 4,551
n = 2,681
n = 1,247
n = 1,196
4-Yr Rates for AA Transfer Cohorts
2007-13 Target**: 46.6%
2009-13 Target**: 62.7% 0
5
10
15
20
25
30
35
2006-07 2007-08 2008-09 2009-10 2010-11
Student-to-Faculty Ratio
$14,000
Appropriated Funding Per Actual US FTE
TUITION is the appropriated budget authority, not the amount actually collected. Does not include non-instructional local fees.
STATE includes General Revenues, Lottery and Other Trust funds (ie. Federal Stimulus for 2009-10 and 2010-11 only). **Targets Based on Graduation Rate from SAME Institution.
* The most recent year of data in this graph provides preliminary graduation rate data that may change with the addition of “late degrees”.
53.1%
54.9%
0% 10% 20% 30% 40% 50% 60% 70% 80% 90% 100%
Others -2002-2007
Others -2006-2011*
Graduated from FIU Graduated from Other SUS Institution
Still Enrolled at FIU Still Enrolled in Other SUS Institution
5-Yr Rates for Other Transfer Cohorts
n = 1,490
n = 2,237
2008-13 Target**: More Than 53.5%
$7,122 $6,358 $5,772 $5,566 $4,494
$3,599 $3,885 $4,291 $4,449
$4,832
$0
$2,000
$4,000
$6,000
$8,000
$10,000
$12,000
2007-08 2008-09 2009-10 2010-11 2011-12
STATE TUITION
FLORIDA INTERNATIONAL UNIVERSITY - 2010-11 ANNUAL REPORT 4

Florida International University Key University Achievements in 2010-2011 ► Student awards/achievements
1. FIU team placed first in the energy management category and eleventh out of twenty entries overall in the 2011 Solar Decathlon in Washington, DC.
2. FIU’s Model United Nations team dominated the 2011 National Model UN competition. Competing among 183 delegations from around the world, Team FIU received the Outstanding Delegation award. And for the first time in FIU history, every delegate won an individual award.
3. Computer Science and Honors College senior Jairo Pava received honorable mention honors at the 2011 Computing Research Association (CRA) Outstanding Undergraduate Researcher Award competition for his research on storm-surge simulation systems.
► Faculty awards/achievements 1. President Barack Obama named Mary Jo Trepka,
associate professor at FIU’s Robert Stempel College of Public Health, as one of the recipients of the Presidential Early Career Awards for Scientists and Engineers.
2. Dr. Gustavo Roig, professor at FIU’s Department of Electrical and Computer Engineering, was the recipient of the prestigious Dr. Albert Baez Award for outstanding educator at the 2011 HENAAC (Hispanic Engineer National Achievement Awards Conference)
► Program awards/achievements
1. FIU is proud to be the top institution in the nation in awarding bachelor’s and master’s degrees to Hispanics. FIU is also number one in awarding STEM bachelor’s
degrees to underrepresented minorities. FIU ranks number one in awarding bachelor and masters engineering degrees to Hispanics.
2. National Jurist ranked FIU’s College of Law as #1 for Hispanics and one of six top law schools for diversity.
3. FIU’s Undergraduate International Business program was ranked in the top 20 programs in the nation by U.S. News and World Report for the eighth consecutive year.
► Research awards/achievements
1. Researchers and scholars received $104.56 million in research awards during FY 2010-2011—a 4% increase from last fiscal year.
2. Wind engineers working in the Center of Excellence for Hurricane Damage Mitigation and Product Develop-ment received $972K from the U.S. Department of Energy to conduct research in the development of hurricane ready, energy efficient buildings.
3. The 21st Century World Class Scholars Program recipients in the Herbert Wertheim College of Medicine received $687K funding from the U.S. Department of Defense for development of a new class of biosensors to detect unspecified exposure to environmental chemicals.
► Institutional awards/achievements
1. FIU attained the Community Engagement Classification by the Carnegie Foundation for the Advancement of Teaching.
2. FIU was awarded the “Great College Workplace: Diversity” classification by The Chronicle of Higher Education.
FLORIDA INTERNATIONAL UNIVERSITY - 2010-11 ANNUAL REPORT 5

Florida International University 2010-11 Narrative Report INTRODUCTION On December 9, 2010, FIU’s Board of Trustees approved the 2010-2015 Worlds Ahead Strategic Plan. The Strategic Plan describes specific initiatives we will undertake to fulfill our mission and goals. These initiatives include: (1) improve student learning and achieve academic excellence; (2) enhance the quality, quantity and impact of research and creative initiatives; (3) engage with the community in collaborative problem solving; and (4) revitalize and expand FIU's infrastructure and financial base. As the only public research university in South Florida, FIU is committed to increasing access and degree production in the knowledge economy. Therefore, during the next five years, the University plans to increase enrollment by 2,000 academically qualified students per year. Also, in the next five years, we will continue to graduate more Hispanic students than any other university in the nation. FIU will also continue to be the national leader in awarding STEM bachelor’s degrees to underrepresented minorities. We will build on our faculty’s research and creative energies to form a strong foundation for competitiveness in the twenty-first century knowledge economy, and will engage with local and global communities in collaborative problem solving. A copy of the Strategic Plan can be found at http://stratplan.fiu.edu. Mission Florida International University is an urban, multi-campus, public research university serving its students and the diverse
population of South Florida. We are committed to high-quality teaching, state-of-the-art research and creative activity, and collaborative engagement with our local and global communities. Vision Florida International University will be a leading urban public research university focused on student learning, innovation, and collaboration. BOARD OF GOVERNORS – STATE UNIVERSITY SYSTEM GOAL 1: ACCESS TO AND PRODUCTION OF DEGREES During the academic year 2010-11 FIU enrolled over 44,000 students from 148 countries in 181 degree programs. Seventy-seven percent of our students are minority students. FIU’s most defining feature is our diversity. It is central to the University’s success in producing an educated workforce with leadership capabilities for South Florida, the state, the country and the world. FIU continues to expand its access to Florida residents. In the last five academic years, FIU has increased its degree production by 39%. During the 2010-11 academic year FIU awarded over 10,000 total degrees. Of those, over 7,000 were at the baccalaureate level and 92% of those were granted to residents of the state of Florida. During the 2010-11 year, FIU continued to serve first-generation students with 7,861 of such students receiving financial aid. During the 2010-11 academic year, FIU maintained its commitment to access and diversity by awarding 72% of our
FLORIDA INTERNATIONAL UNIVERSITY - 2010-11 ANNUAL REPORT 6

total degrees to minority students. In May 2011, The Hispanic Outlook in Higher Education ranked FIU first in awarding bachelor’s and master’s degrees to Hispanics. Also, the American Society for Engineering Education (ASEE) ranked FIU’s College of Engineering and Computing (CEC) first in awarding bachelor’s degrees to Hispanics in the Continental US. ASEE also ranked CEC fourteenth in awarding bachelor’s degrees to African American students. CEC also ranked first in the state and eighth nationally for the percentage of PhD degrees awarded to women and first in the state and third nationally in PhD degrees awarded to Hispanics. FIU continues to demonstrate its commitment to access to degrees through its partnership with Miami-Dade County Public Schools (M-DCPS), the fourth largest school system in the nation. The goal of FIU and M-DCPS ACCESS (Achieving Community Collaboration in Education and Student Success) is to promote student’s academic success, increase high school graduation, and improve college transition. From spring 2010 to spring 2011, the dual enrollment program increased from 19 to 23 schools, 44 to 69 courses, and 1,823 to 2,600 students. FIU’s commitment to production of degrees is also demonstrated through its initiatives to increase the retention and graduation rate of First-in-Time-College (FTIC) students. A 2010 internal study confirmed that assisting students to select appropriate majors early in their undergraduate career correlates positively with student success. The data also indicated that it is critical to set a strategy to identify students in an unsuitable major as early as possible and assist them to re-evaluate their choice of major. As a result, FIU has developed a comprehensive academic support system for undergraduate students called the Graduation Success Initiative (GSI) that will be fully launched in fall 2012.
The first phase of GSI was to develop a customized Degree Audit system that provides current and future students an easy way to follow their progress toward degree completion. The Degree Audit was successfully launched in May 2011. BOARD OF GOVERNORS – STATE UNIVERSITY SYSTEM GOAL 2: MEETING STATEWIDE PROFESSIONAL AND WORKFORCE NEEDS FIU continues its efforts to increase production of STEM degrees and to improve recruitment efforts to attract students who are usually underrepresented in these fields. In 2010-11, FIU awarded 1,151 STEM bachelor’s degrees of which 81% of them were awarded to minority students. At the graduate level, 45% of the 471 STEM degrees were awarded to minority students. In 2010-11, 25% of FIU’s undergraduate students and 16% of the graduate students were pursuing a STEM related degree. FIU also participates in national initiatives to increase the number of STEM degrees awarded. FIU joined the Science and Mathematics Teacher Imperative (SMTI) initiative. Under the leadership of the Association of Public and Land-grant Universities (APLU), 125 major research universities have committed to transform middle and high school STEM education by preparing a new generation of world-class science and mathematics teachers. FIU’s President, Mark B. Rosenberg, serves on the APLU SMTI Commission’s Executive Committee. FIU is one of 20 out of the 125 universities that are members of the Leadership Collaborative for this important national initiative. FIU has also developed innovative programs to boost students’ academic experience. Quantifying Biology in the
FLORIDA INTERNATIONAL UNIVERSITY - 2010-11 ANNUAL REPORT 7

Classroom (QBIC) is a program within FIU’s Department of Biological Sciences for students interested in taking a more quantitative approach to their Bachelor of Science in Biological Sciences degree. This four-year program is an intensive, integrative experience in biology aimed at creating a critically-minded, holistic student who can excel in any professional biology or graduate research programs. QBIC courses integrate the biological and physical sciences with statistics, mathematics, English, and other required electives. FIU has enhanced the variety of STEM program offerings. In spring 2011, a new Master of Science in Information Technology, offered through FIU’s College of Engineering and Computing, was implemented. This degree will allow FIU to be on the forefront of the national trend in IT education and provide a well-trained, highly skilled labor force to local and state industries. Degrees in Engineering Management and Construction Management directly address workforce needs. A new Doctor of Philosophy in Biochemistry, approved in January 2011, admitted its first students in fall 2011. This research doctorate is designed to meet the need for advanced research and training capabilities in the expanding fields of biochemistry and molecular biology. In addition, FIU plans to add three new programs to its STEM degree inventory: 1) Ph.D. in Biomedical Sciences (2012), 2) Ph.D. in Environmental Science and Policy (2013), and 3) B.S in Sustainability (2012). FIU continues to graduate healthcare professionals to meet the needs of our region and the state. FIU nursing, physical therapy and other health programs awarded 656 degrees in the 2010-2011 year. The new Healthcare MBA program started with the enrollment of 30 students in fall 2010. In just 18 months, the program has grown to over 110 students, with the first cohort scheduled to graduate in fall 2011. In addition,
a new professional doctorate degree, a Doctor of Nursing Practice (DNP), will be implemented in spring 2012. The DNP program will focus on improving health care through facilitating a culture of patient safety, evidence-based practice, and providing the additional skills necessary to develop advanced practice nursing leaders for the future. FIU has also increased the degree production in other disciplines designated as “critical strategic areas”. In the strategic area of “Security and Emergency Services,” the University awarded 405 degrees in the academic year 2010-11, an increase of 19% from the previous year. An increase of 14% was achieved in the area of “Globalization” wherein FIU awarded 1,196 degrees in 2010-11 compared with 1,048 in 2009-10. In addition, a new Master of Arts in Global Governance was implemented in fall 2011. BOARD OF GOVERNORS – STATE UNIVERSITY SYSTEM GOAL 3: BUILDING WORLD-CLASS ACADEMIC PROGRAMS AND RESEARCH CAPACITY Research Capacity During the 2010-2011 fiscal year, FIU continued its long-term upward trajectory of research growth receiving $104.56 million in research awards—a 4% increase from last fiscal year. Within the context of increasingly competitive research funding and shrinking budgets for state and federal agencies, FY 2010-2011 marks the third consecutive year of increases in research awards obtained by FIU faculty, a growth of 13% in FY 2009-2010, and 22% in FY 2008-2009. Additionally, FIU had five new patents issued this past fiscal year. Our researchers’ inventions range from developing
FLORIDA INTERNATIONAL UNIVERSITY - 2010-11 ANNUAL REPORT 8

methods for identifying humans through characteristic compounds detected in human scent to creating three-dimensional magnetic memory and/or recording devices. FIU's research related accomplishments this past year are all related to our coordinated efforts to build research capacity and produce research that positively impacts the economy and wellbeing of our community and all residents of Florida. Global, National, and State Impact of Research at FIU In May 2011, The Chronicle of Higher Education featured FIU as an example of a university with a research growth strategy that has succeeded where many others have not—“Perhaps less well known is the steady expansion of Florida International's research enterprise.” FIU research covers the breadth of basic science of the environment, training of students in STEM, applied health, and applied transportation. FIU has established a strategic and cluster hiring initiative. This initiative has already paid dividends with the recruitment of a team in Biomedical Engineering that will bring a Center to the College of Engineering and Computing and the Herbert Wertheim College of Medicine (HWCOM), whose research focuses on the development of technologies for better func-tioning of prosthetic devices for patients with neurological disorders. Another team was recruited by the Department of Psychology and Herbert Wertheim College of Medicine, whose research focuses on child mental health, particularly Attention Deficit and Hyperactivity Disorder (ADHD). This year the group received $1.7M in funding from the NIH for studies related to psycho-pharmacological treatment of ADHD. Moreover, this team has provided extensive services to the Miami-Dade
County Public Schools and has brought to Florida a nationally renowned Summer Treatment Program. FIU’s Water for Sustainability Program (GLOWS) is a USAID-funded research program ($70M over five years) on water sustainability in Africa and Eastern Europe. This research focuses on innovation in engineering, health, policy and planning to create sustainable water resources. FIU’s School of Integrated Science and Humanities was awarded a five-year grant ($1.2M) to study the relationship between heavy tobacco use and damage to the immune system. This translational study focuses on identifying patient populations at greater risk for contracting tobacco-related diseases. The team of wind engineers working in the Center of Excellence for Hurricane Damage Mitigation and Product Development received a $972K grant from the U.S. Department of Energy to conduct research in the development of energy efficient buildings that can also be hurricane ready. In the environmental research area, FIU has participated in a State consortium addressing Gulf of Mexico oil spill. In addition to the BP funding through the State consortium, FIU researchers in the School of Environment Arts & Society (SEAS) have received $2.4M to conduct ecotoxicology research in the gulf waters. The Herbert Wertheim College of Medicine funded through the 21st Century World Class Scholars Program has focused on the development of a new class of biosensors to detect unspecified exposure to environmental chemicals. This group
FLORIDA INTERNATIONAL UNIVERSITY - 2010-11 ANNUAL REPORT 9

received $687K funding from the U.S. Department of Defense for this research. Researchers across the university have received funding to enhance STEM education in the public schools as well as in college with an emphasis on research to improve teaching methodologies and workforce development in STEM for students from underrepresented groups. Researchers in the College of Engineering received $1M from the U.S. Department of Education for a program that focuses on high school students, and $445K from the National Science Foundation (NSF) for a collaborative project with FAU that provides internships for undergraduate science and engineering students in laboratories across the world. Researchers in the Department of Physics received funding from the Howard Hughes Medical Institute and NSF for research focusing on new methods of STEM teaching and preparation of STEM teachers for middle and high schools. The Department of Electrical and Computer Engineering has been conducting extensive research on the use of computer applications to assist with neurosurgery, visual impairment, and motor disability. The National Science Foundation (NSF) has featured results of this research, which is being conducted with colleagues at Miami Children’s Hospital (MCH), focusing on neurosurgery for children with epilepsy. The NSF awarded a $3M grant this year for the development of a 5-D brain-processing instrument. BOARD OF GOVERNORS – STATE UNIVERSITY SYSTEM GOAL 4: MEETING COMMUNITY NEEDS AND FULFILLING UNIQUE INSTITUTIONAL RESPONSIBILITIES
Since its establishment in February 2010, the Office of Engagement has provided leadership to expand our community partnerships and align FIU’s instructional and research initiatives with local and global needs and priorities. Community Engagement Classification In January 2011, FIU received the Community Engagement Classification from the Carnegie Foundation for the Advancement of Teaching, joining only 300 universities nationwide that hold this classification. The Carnegie classification is awarded to institutions of higher education that demonstrate collaboration with their larger communities for the mutually beneficial exchange of knowledge and resources in a context of partnership and reciprocity. This designation reflects FIU’s ongoing commitment to engage with the community in collaborative problem solving. Life Tech Florida A collaborative, public-private partnership led by FIU and the Beacon Council (Miami-Dade’s economic development council) was established. The goal of Life Tech Florida is to develop an industry cluster in South Florida focused on life sciences and information technology (IT). Through research, workforce development, and marketing, the initiative aims to grow the life sciences in the South Florida region, with an emphasis on innovation and job creation. The community partners are: 1) five public and private universities (FIU, FAU, FGCU, Nova Southeastern, and UM), 2) four community and state colleges (Broward College, Indian River State College, Miami Dade College and Palm Beach State College), 3) three economic development agencies (Miami-Dade’s Beacon Council, Broward Alliance, and Business Development Board
FLORIDA INTERNATIONAL UNIVERSITY - 2010-11 ANNUAL REPORT 10

of Palm Beach County) , 4) two research parks (FAU and UM), and 5) two research institutes (Max Planck Florida Institute & Scripps Institute Florida). Liberty City Education Effect Project With a $90K planning grant awarded in December 2010 and a $1 million philanthropic grant received in September 2011 from the JPMorgan Chase Foundation, FIU has launched a university-assisted community school initiative in collabor-ation with Miami-Dade County Public Schools (M-DCPS). Centered in Liberty City, an economically disadvantaged and predominantly African American community in Miami, the project’s focus is Miami Northwestern Senior High School and the middle and elementary schools in its feeder pattern, all of which are designated as underperforming by Department of Education criteria. The goal is to achieve long-term educa-tional transformation through the collaborative efforts of FIU, M-DCPS, and Liberty City residents. By creating an environ-ment conducive to student success, the project promotes pathways to post-secondary education. Sweetwater Community Partnership The Honors College initiated City of Sweetwater Partnership continues to flourish. Last year, an FIU-City of Sweetwater Partnership Committee was formed that provides FIU students with an opportunity to engage in a variety of projects to help improve the quality of life for Sweetwater residents. Activities this year included the “Evening for the Arts,” attended by some 500 parents and Sweetwater residents. The event featured the artwork and musical/choral renditions of FIU and Sweetwater Elementary School students. Other activities included academic tutoring by Honors College
students working with children at Sweetwater Elementary School, and FIU students and the City of Sweetwater part-nering to plant trees through an Arbor Day Foundation award. Theatre Productions Theatre students performed Body & Sold at the Kennedy Center on Jan 11, 2011, marking National Human Trafficking Day. The performance was preceded by a symposium hosted by Representative Ileana Ros-Lehtinen. The students part-nered with the UK's Solent University this summer touring the United Kingdom giving performances in many venues, including a performance at the Rose Theatre. Internships During 2010-11, 771 students participated in internships through Career Services, an increase of 7 percent from the previous year. Additionally, students participating in for-credit internships through their academic units increased from 857 to 1,003, an increase of 17 percent. Through internships, students gain real-world experience and a first-hand oppor-tunity to try out their chosen career and build their resume with actual work experience. Internships can provide a bridge to employment. Survey data from the National Association of Colleges and Employers reveals that, on average, nearly 58% of internships turn into full-time positions. The Herbert Wertheim College of Medicine Green Family Foundation NeighborhoodHELPTM Program The NeighborhoodHELPTM program is a community-engaged, inter-professional service-learning program. Since September 2010, more than 270 FIU students from four colleges (Herbert
FLORIDA INTERNATIONAL UNIVERSITY - 2010-11 ANNUAL REPORT 11

Wertheim College of Medicine, Robert Stempel College of Public Health and Social Work, College of Nursing and Health Sciences and the College of Law) and their supervising faculty have made home visits, established a primary care presence in the communities, and have begun a broad variety of commun-ity projects. From September 2010 through September 2011, 85 student teams conducted a total of 343 visits to 132 house-holds, with 305 household members. FIU students assisted household members with health and social issues, such as diabetes, hypertension, breast cancer, dementia, coronary heart disease, low back pain, HIV, obesity, mental illness, low health literacy, child custody issues, finan-cial hardship, lack of health coverage, and inability to access services. Students conducted health assessments, and provid-ed health education, mentoring, nutrition and dietary counsel-ing, environmental assessments, and referrals for primary and specialty care, home health care, and legal services. PROGRESS ON PRIMARY INSTITUTIONAL GOALS AND METRICS AS OUTLINED IN THE UNIVERSITY WORK PLAN The University is making progress on the three goals identified in the work plan. Support strategic priorities in teaching and research The University hired over 71 new faculty for the 2011-2012 year exceeding the goal of 47 faculty. In the 2010-2011 academic year the University exceeded $100 million in external funding and awarded 148 research doctorates and 226 professional doctorates.
Improve Academic Success The University was able to complete two of the three metrics in this goal during the fall 2011 semester by hiring 11 advisors and converting six adjuncts into full-time lecturers. Seventeen classrooms were modernized during the 2010-11 year: 11 at Modesto Maidique Campus and six at Biscayne Bay Campus.
Expand Community Partnerships The University met its goal of increasing internships. In 2010-11, the total number of students participating in internships increased by 12 percent, from 1,579 to 1, 774 students. The University received the Community Engagement Classifi-cation from the Carnegie Foundation. FIU developed a collaborative partnership with Florida Power and Light (FPL). A FPL Customer Care Center was establish-ed in January 2011 with 21 FIU interns. Twelve of the 21 stu-dent interns were hired in June 2011 for permanent positions in FPL. FIU’s Herbert Wertheim College of Medicine is in the process of establishing a residency program at the West Kendall Baptist Hospital (WKBH). ADDITIONAL INFORMATION ON QUALITY, RESOURCES, EFFICIENCIES, AND EFFECTIVENESS Energy Conservation The 2010 State University System Energy Conservation Report, published in December 2010, reported that FIU topped
FLORIDA INTERNATIONAL UNIVERSITY - 2010-11 ANNUAL REPORT 12

all state universities in energy conservation for the three-year fiscal period 2007-2009. Implementing Technology FIU integrated all degree audit functions for students within the University’s enrollment database, Panther Soft, reducing maintenance for interfaces, data validation, data mapping, as well as dependencies on outside systems. The new Degree Audit system also reduces the total man hours for managing exceptions and configurations from a third party system. The Office of Business Services implemented Electronic Fund Payments for vendors. Vendors will now pay the University with an EFT in place of a paper check. This process ensures secure and timely collection of funds. ADDITIONAL RESOURCES 2010-2015 Worlds Ahead Strategic Plan http://stratplan.fiu.edu Work Plan http://opir.fiu.edu/workplan.htm Voluntary System of Accountability College Portrait http://www.collegeportraits.org/FL/FIU
Common Data Set http://opir.fiu.edu/CDS/CDS2010.pdf College Navigator http://nces.ed.gov/collegenavigator/?q=florida+international+un&s=all&id=133951 Institutional Peers Criteria: Public, Part-time greater than 10%, Urban, Carnegie High Research or Very High Research with comparable levels of research expenditures and doctoral degree production George Mason University University of Louisville Georgia State University University of Houston – University Park Aspirational Institutional Peers Criteria: Institutions are urban, public research universities in the Carnegie Very High Research Classification Arizona State University Wayne State University University of Cincinnati University of New Mexico Office of Planning and Institutional Research http://opir.fiu.edu/
FLORIDA INTERNATIONAL UNIVERSITY - 2010-11 ANNUAL REPORT 13

Section 1 – Financial Resources
TABLE 1A. University Education and General Revenues 2007-08
Actual
2008-09 Actual
2009-10 Actual
2010-11 Actual
2011-12
Estimates
Recurring State Funds (GR & Lottery)
$221,172,448 $206,029,070 $180,520,031 $185,414,169 $166,476,221
Non-Recurring State Funds (GR & Lottery)
$12,784,585 $9,587,997 $1,202,411 $3,456,924 $2,242,351
Tuition (Resident & Non-Resident)
$122,206,561 $128,413,296 $128,089,012 $146,292,913 $157,159,209
Tuition Differential Fee $0 $2,566,323 $7,428,377 $15,411,111 $21,981,840 Other Revenues
(Includes Misc. Fees & Fines) $2,478,005 $2,640,819 $2,914,805 $3,456,746 $3,330,663
Federal Stimulus Funds $0 $0 $14,250,535 $13,635,669 $0 TOTAL $358,641,599 $349,237,505 $334,405,171 $367,667,532 $351,190,284
TABLE 1B. University Education and General Expenditures 2007-08
Actual
2008-09 Actual
2009-10 Actual
2010-11 Actual
2011-12
Estimates
Instruction/Research $190,058,978 $192,502,152 $191,817,340 $202,821,253 $232,376,623 Institutes and Research Centers
$2,219,037 $1,190,150 $689,914 $619,771 $708,305
PO&M $34,478,199 $33,195,211 $35,425,984 $42,977,285 $34,246,498 Administration and Support Services
$46,159,437 $41,085,034 $47,261,433 $43,330,392 $34,202,558
Radio/TV $0 $0 $0 $0 $0 Library/Audio Visual $16,579,532 $16,259,156 $15,859,075 $15,807,267 $17,643,429 Museums and Galleries $3,081,449 $3,102,438 $2,997,019 $3,096,999 $3,221,003 Agricultural Extension $0 $0 $0 $0 $0 Student Services $21,999,030 $20,751,117 $21,874,231 $27,054,912 $27,219,498 Intercollegiate Athletics $493,112 $497,435 $496,487 $470,716 $481,205 TOTAL $315,068,774 $308,582,693 $316,421,483 $336,178,595 $350,099,119 The table reports the actual and estimated amount of expenditures from revenues appropriated by the Legislature for each fiscal year. The expenditures are classified by Program Component (i.e., Instruction/Research, PO&M, Administration, etc.) for activities directly related to instruction, research and public service. The table does not include expenditures classified as non-operating expenditures (i.e., to service asset-related debts), and therefore excludes a small portion of the amount appropriated each year by the Legislature. Also, the table does not include expenditures from funds carried forward from previous years.
Section 1 – Financial Resources (continued)
TABLE 1C. State Funding per Full-Time Equivalent (FTE) Student 2007-08
Actual
2008-09 Actual
2009-10 Actual
2010-11 Actual
2011-12
Estimates
Appropriated Funding per FTE General Revenue per FTE $6,539 $5,638 $4,731 $4,526 $3,776 Lottery Funds per FTE $583 $720 $621 $665 $718 Tuition & Fees per FTE $3,599 $3,885 $4,291 $4,449 $4,832 Other Trust Funds per FTE $0 $0 $420 $375 $0 Total per FTE $10,720 $10,243 $10,063 $10,015 $9,326 Actual Funding per FTE Tuition & Fees per FTE $3,796 $4,082 $4,077 $4,539 $4,861 Total per FTE $10,918 $10,439 $9,848 $10,105 $9,355 Notes: (1) FTE is based on actual FTE, not funded FTE; (2) does not include Health-Science Center funds or FTE; (3) FTE for these metrics uses the standard IPEDS definition of FTE, equal to 30 credit hours for undergraduates and 24 for graduates; and (4) actual funding per student is based on actual tuition and E&G fees (does not include local fees) collected.
TABLE 1D. University Other Budget Entities 2007-08
Actual
2008-09 Actual
2009-10 Actual
2010-11 Actual
2011-12
Estimates
Auxiliary Enterprises Revenues $111,658,167 $108,899,206 $148,386,976 $163,393,424 $156,049,628 Expenditures $100,479,217 $103,433,291 $114,372,229 $127,641,069 $140,330,571 Contracts & Grants Revenues $80,720,524 $80,759,342 $88,864,089 $91,229,784 $91,578,394 Expenditures $78,256,135 $82,736,070 $83,468,637 $86,572,638 $89,111,164 Local Funds Revenues $103,545,990 $108,121,083 $135,314,838 $175,793,527 $176,808,816 Expenditures $93,748,434 $105,405,591 $134,813,829 $175,001,783 $179,550,745 Notes: Revenues do not include transfers. Expenditures do not include non-operating expenditures.
TABLE 1E. University Total Revenues and Expenditures 2007-08
Actual
2008-09 Actual
2009-10 Actual
2010-11 Actual
2011-12
Estimates
Total
Revenues $654,566,280 $647,017,136 $706,971,074 $798,084,267 $775,627,122
Total Expenditures
$587,552,560 $600,157,645 $649,076,178 $725,394,085 $759,091,599
FLORIDA INTERNATIONAL UNIVERSITY - 2010-11 ANNUAL REPORT 14

Section 1 – Financial Resources (continued)
TABLE 1F. Voluntary Support of Higher Education 2005-06 2006-07 2007-08 2008-09 2009-10
Endowment Market Value (Thousand $)
80,283 $91,876 $97,064 $82,555 $95,259
Annual Gifts Received ($)
13,891,812 $10,873,175 $18,796,862 $17,741,253 $38,667,187
Percentage of Graduates Who are
Alumni Donors
1.8% 4.4% 4.7% 6.5% 6.7%
TABLE 1G. University Federal Stimulus Dollars (ARRA) 2009-10
Actual
2010-11
Actual
Jobs Saved/Created $11,723,001 $4,870,000 Scholarships $0 $0 Library Resources $0 $0 Building Repairs/Alterations $2,128,202 $5,137,211 Motor Vehicles $0 $0 Printing $0 $0 Furniture & Equipment $0 $0 Information Technology Equipment $333,075 $2,694,611 Financial Aid to Medical Students $0 $0 Other $932,662 $1,793,091 TOTAL $15,116,940 $14,494,913
Section 1 – Financial Resources (continued)
TABLE 1H. Health-Science Center Education and General Revenues 2007-08
Actual
2008-09 Actual
2009-10 Actual
2010-11 Actual
2011-12
Estimates
Recurring State Funds (GR & Lottery)
$5,272,250 $11,465,084 $21,410,785 $24,210,077 $26,293,035
Non-Recurring State Funds (GR & Lottery)
$0 $0 $0 $1,000,000 $0
Tuition (Resident & Non-Resident)
$0 $0 $1,162,500 $2,427,750 $5,317,208
Tuition Differential Fee $0 $0 $0 $0 $0 Other Revenues
(Includes Misc. Fees & Fines) $0 $42,350 $58,424 $62,695 $63,000
Other Operating Trust Funds $0 $0 $0 $0 $0
Federal Stimulus Funds $0 $0 $866,405 $859,244 $0 TOTAL $5,272,250 $11,507,434 $23,498,114 $28,559,766 $31,673,243
TABLE 1I. Health-Science Center Education and General Expenditures 2007-08
Actual
2008-09 Actual
2009-10 Actual
2010-11 Actual
2011-12
Estimates
Instruction/Research $5,031,611 $7,911,020 $15,034,872 $20,073,882 $26,147,437 Institutes and Research Centers
$0 $0 $0 $0 $0
PO&M $4,200 $0 $0 $0 $0 Administration and Support Services
$77,355 $2,161,089 $3,199,046 $4,029,269 $3,693,504
Radio/TV $0 $0 $0 $0 $0 Library/Audio Visual $0 $735,925 $928,007 $1,067,332 $1,163,638 Museums and Galleries $0 $0 $0 $0 $0 Agricultural Extension $0 $0 $0 $0 $0 Teaching Hospital & Allied Clinics
$0 $0 $0 $0 $0
Student Services $0 $0 $0 $0 $0 Intercollegiate Athletics $0 $0 $0 $0 $0 TOTAL $5,113,166 $10,808,034 $19,161,925 $25,170,483 $31,004,579 The table reports the actual and estimated amount of expenditures from revenues appropriated by the Legislature for each fiscal year. The expenditures are classified by Program Component (i.e., Instruction/Research, PO&M, Administration, etc.) for activities directly related to instruction, research and public service. The table does not include expenditures classified as non-operating expenditures (i.e., to service asset-related debts), and therefore excludes a small portion of the amount appropriated each year by the Legislature. Also, the table does not include expenditures from funds carried forward from previous years.
FLORIDA INTERNATIONAL UNIVERSITY - 2010-11 ANNUAL REPORT 15
Section 1 – Financial Resources (continued)
TABLE 1J. Health-Science Center Other Budget Entities 2007-08
Actual
2008-09 Actual
2009-10 Actual
2010-11 Actual
2011-12
Estimates
Faculty Practice Plans Revenues $0 $0 $9,922 $19,789 $1,066,330 Expenditures $0 $0 $39,848 $236,450 $1,246,836 Notes: Faculty Practice Plan revenues/receipts are funds generated from faculty practice plan activities. Faculty Practice Plan expenditures include all expenditures relating to the faculty practice plans, including transfers between other funds and/or entities. This may result in double counting in information presented within the annual report.
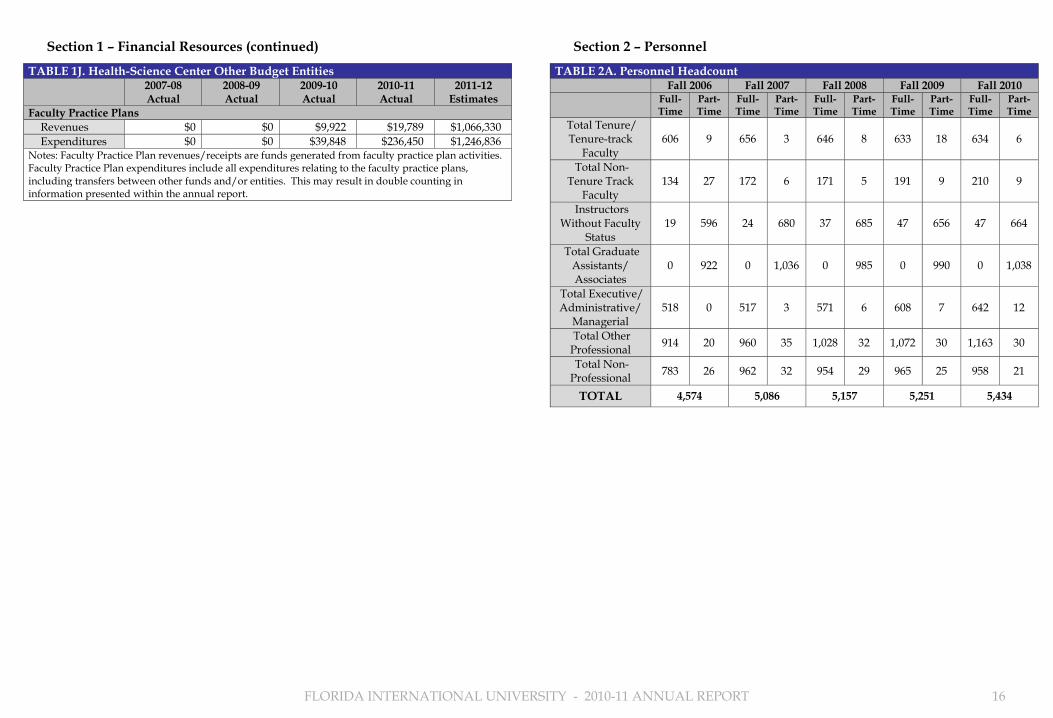
Section 2 – Personnel
TABLE 2A. Personnel Headcount Fall 2006 Fall 2007 Fall 2008 Fall 2009 Fall 2010 Full-
Time Part-Time
Full-Time
Part-Time
Full-Time
Part-Time
Full-Time
Part-Time
Full-Time
Part-Time
Total Tenure/ Tenure-track
Faculty
606 9 656 3 646 8 633 18 634 6
Total Non-Tenure Track
Faculty
134 27 172 6 171 5 191 9 210 9
Instructors Without Faculty
Status
19 596 24 680 37 685 47 656 47 664
Total Graduate Assistants/ Associates
0 922 0 1,036 0 985 0 990 0 1,038
Total Executive/ Administrative/
Managerial
518 0 517 3 571 6 608 7 642 12
Total Other Professional
914 20 960 35 1,028 32 1,072 30 1,163 30
Total Non-Professional
783 26 962 32 954 29 965 25 958 21
TOTAL 4,574 5,086 5,157 5,251 5,434
FLORIDA INTERNATIONAL UNIVERSITY - 2010-11 ANNUAL REPORT 16

Section 3 – Enrollment
TABLE 3A. University Full-Time Enrollment (FTE) 2009-10 2010-11 2011-12
Funded Actual Funded Actual Funded Estimated
FLORIDA RESIDENTS
Lower 7,860 7,602 7,860 8,260 7,860 8,436 Upper 11,682 11,911 11,682 12,937 11,682 13,203 Grad I 2,588 2,964 2,588 2,960 2,588 2,971 Grad II 818 892 818 951 818 1,082 Total 22,948 23,369 22,948 25,108 22,948 25,692
NON-FLORIDA RESIDENTS
Lower 446 491 596 Upper 649 692 858 Grad I 643 597 604 Grad II 306 399 406 Total 2,138 2,044 2,138 2,179 2,138 2,464
TOTAL FTE
Lower 8,048 8,751 9,032 Upper 12,560 13,629 14,061 Grad I 3,607 3,557 3,575 Grad II 1,199 1,350 1,488 Total FTE
(FL Definition) 25,086 25,414 25,086 27,287 25,086 28,156
Total FTE
(US Definition) 33,448 33,885 33,448 36,383 33,448 37,541
Headcount for Medical Doctorates
Florida Residents
40 34 80 71 144 140
Non-Residents 0 9 0 14 16 20 Total 40 43 80 85 160 160
Notes: Florida definitions of FTE (Undergraduate FTE = 40 and Graduate FTE = 32 credit hours per FTE) are used for all items except the row named Total FTE (US Definition), which is based on an Undergraduate FTE = 30 and Graduate FTE = 24 credit hours. Actual Medical headcounts (includes Medicine, Dentistry, and Veterinary programs) are based on Fall enrollment data.
Section 3 – Enrollment (continued)
TABLE 3B. Enrollment by Location 2009-10
Actual
2010-11
Actual
2011-12
Estimated
MODESTO MAIDIQUE CAMPUS
Lower 6,022 6,442 6,530 Upper 8,015 8,530 8,589 Grad I 2,624 2,441 2,396 Grad II 1,161 1,296 1,419 TOTAL 17,822 18,708 18,934
BISCAYNE BAY CAMPUS Lower 802 845 872 Upper 1,760 1,808 1,866 Grad I 251 272 271 Grad II 9 16 19 TOTAL 2,822 2,941 3,028
PINES CENTER SITE Lower 40 34 35 Upper 287 239 246 Grad I 221 233 234 Grad II 18 15 19 TOTAL 566 521 534
REMAINING PHYSICAL LOCATIONS Lower 268 414 455 Upper 90 198 273 Grad I 155 189 212 Grad II 5 16 25 TOTAL 518 817 965
VIRTUAL/DISTANCE LEARNING For the sum of current or planned State-fundable FTE enrollments not served at a physical location.
Lower 916 1,017 1,140 Upper 2,408 2,855 3,087 Grad I 356 423 462 Grad II 6 6 6 TOTAL 3,686 4,301 4,695
FLORIDA INTERNATIONAL UNIVERSITY - 2010-11 ANNUAL REPORT 17

Section 4 – Undergraduate Education
TABLE 4A. Baccalaureate Degree Program Changes in AY 2010-11
Title of Program
Six-digit CIP
Code
Degree Level
Date of UBOT Action
Starting or Ending
Term Comments
New Programs
None Terminated Programs
Environmental Control Technologies/Technicians, Other
15.0599 Bachelor’s Dec. 2010 Spring 2011
Inactive Programs Italian Language and Literature 16.0902 Bachelor’s Dec. 2010 Spring
2011
New Programs Considered By University But Not Approved
None Note: This table does not include new majors or concentrations added under an existing degree program CIP Code. This table reports the program changes between May 5, 2010 and May 4, 2011. New Programs are proposed new degree programs that have been completely through the approval process at the university and, if appropriate, the Board of Governors. Terminated Programs are degree programs for which the entire CIP Code has been terminated and removed from the university’s inventory of degree programs. Inactive Programs are degree programs for which enrollments have been temporarily suspended for the entire CIP Code, but the program CIP Code has not been terminated.
Section 4 – Undergraduate Education (continued)
TABLE 4B. First-Year Persistence Rates
Term of Entry Fall 2005 Fall 2006 Fall 2007 Fall 2008 Fall 2009 Preliminary
Cohort Size
Full-time FTIC 3,970 3,890 3,234 3,106 2,949
From Same University
% Still Enrolled 81.4% 84.0% 82.7% 84.3% 85.2%
TABLE 4C. Federal Definition - Undergraduate Progression and Graduation Rates for Full-Time First-Time-in-College (FTIC) Students
Term of Entry Fall 2001 Fall 2002 Fall 2003 Fall 2004 Fall 2005 Preliminary
Cohort Size
Full-time FTIC 2,462 2,814 3,043 3,372 3,970
6 – Year Rates
From Same University
% Graduated 49.2% 48.8% 46.8% 45.8% 43.3% % Still Enrolled 13.6% 14.4% 14.9% 15.7% 13.5% % Success Rate 62.8% 63.2% 61.7% 61.4% 56.8% Notes: (1) Cohorts are based on undergraduate students who enter the institution in the Fall term (or Summer term and continue into the Fall term); (2) Success Rate measures the percentage of an initial cohort of students who have either graduated or are still enrolled; (3) since degrees can be awarded after the last semester of coursework, the most recent year of data in this table provides preliminary graduation rate data that may change with the addition of “late degrees”. Late degrees reported in conjunction with the IPEDS Graduation Rate Survey due in mid-April will be reflected in the following year.
FLORIDA INTERNATIONAL UNIVERSITY - 2010-11 ANNUAL REPORT 18
Section 4 – Undergraduate Education (continued)
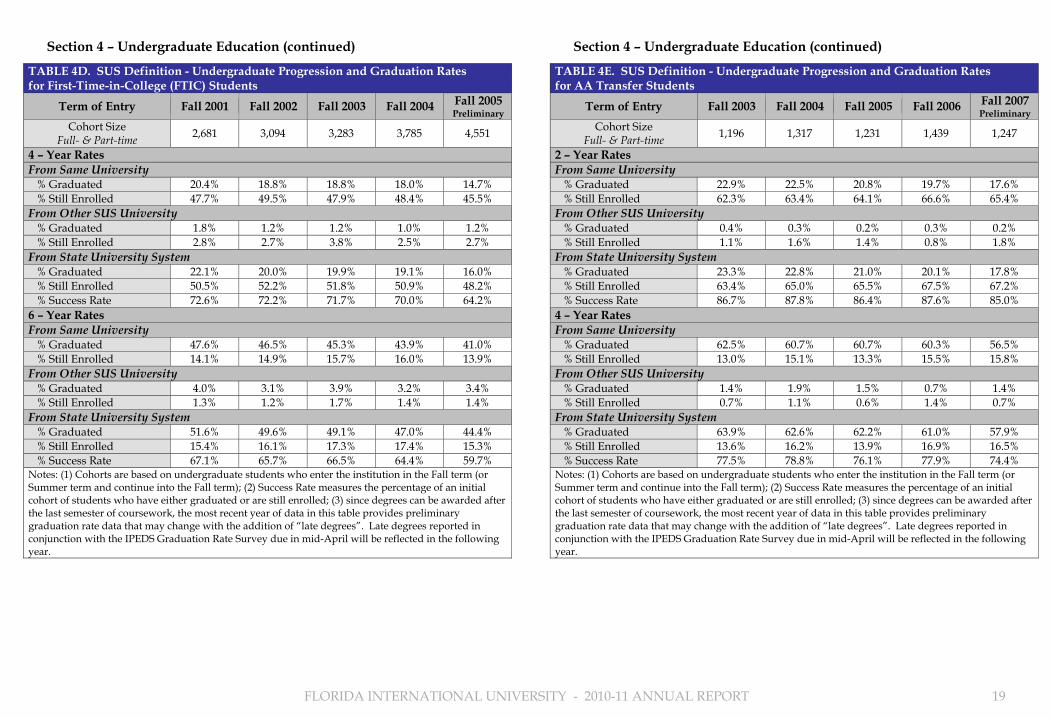
TABLE 4D. SUS Definition - Undergraduate Progression and Graduation Rates
for First-Time-in-College (FTIC) Students
Term of Entry Fall 2001 Fall 2002 Fall 2003 Fall 2004 Fall 2005 Preliminary
Cohort Size
Full- & Part-time 2,681 3,094 3,283 3,785 4,551
4 – Year Rates
From Same University
% Graduated 20.4% 18.8% 18.8% 18.0% 14.7% % Still Enrolled 47.7% 49.5% 47.9% 48.4% 45.5% From Other SUS University
% Graduated 1.8% 1.2% 1.2% 1.0% 1.2% % Still Enrolled 2.8% 2.7% 3.8% 2.5% 2.7% From State University System
% Graduated 22.1% 20.0% 19.9% 19.1% 16.0% % Still Enrolled 50.5% 52.2% 51.8% 50.9% 48.2% % Success Rate 72.6% 72.2% 71.7% 70.0% 64.2% 6 – Year Rates
From Same University
% Graduated 47.6% 46.5% 45.3% 43.9% 41.0% % Still Enrolled 14.1% 14.9% 15.7% 16.0% 13.9% From Other SUS University
% Graduated 4.0% 3.1% 3.9% 3.2% 3.4% % Still Enrolled 1.3% 1.2% 1.7% 1.4% 1.4% From State University System
% Graduated 51.6% 49.6% 49.1% 47.0% 44.4% % Still Enrolled 15.4% 16.1% 17.3% 17.4% 15.3% % Success Rate 67.1% 65.7% 66.5% 64.4% 59.7% Notes: (1) Cohorts are based on undergraduate students who enter the institution in the Fall term (or Summer term and continue into the Fall term); (2) Success Rate measures the percentage of an initial cohort of students who have either graduated or are still enrolled; (3) since degrees can be awarded after the last semester of coursework, the most recent year of data in this table provides preliminary graduation rate data that may change with the addition of “late degrees”. Late degrees reported in conjunction with the IPEDS Graduation Rate Survey due in mid-April will be reflected in the following year.
Section 4 – Undergraduate Education (continued)
TABLE 4E. SUS Definition - Undergraduate Progression and Graduation Rates
for AA Transfer Students
Term of Entry Fall 2003 Fall 2004 Fall 2005 Fall 2006 Fall 2007 Preliminary
Cohort Size
Full- & Part-time 1,196 1,317 1,231 1,439 1,247
2 – Year Rates
From Same University
% Graduated 22.9% 22.5% 20.8% 19.7% 17.6% % Still Enrolled 62.3% 63.4% 64.1% 66.6% 65.4% From Other SUS University
% Graduated 0.4% 0.3% 0.2% 0.3% 0.2% % Still Enrolled 1.1% 1.6% 1.4% 0.8% 1.8% From State University System
% Graduated 23.3% 22.8% 21.0% 20.1% 17.8% % Still Enrolled 63.4% 65.0% 65.5% 67.5% 67.2% % Success Rate 86.7% 87.8% 86.4% 87.6% 85.0% 4 – Year Rates
From Same University
% Graduated 62.5% 60.7% 60.7% 60.3% 56.5% % Still Enrolled 13.0% 15.1% 13.3% 15.5% 15.8% From Other SUS University
% Graduated 1.4% 1.9% 1.5% 0.7% 1.4% % Still Enrolled 0.7% 1.1% 0.6% 1.4% 0.7% From State University System
% Graduated 63.9% 62.6% 62.2% 61.0% 57.9% % Still Enrolled 13.6% 16.2% 13.9% 16.9% 16.5% % Success Rate 77.5% 78.8% 76.1% 77.9% 74.4% Notes: (1) Cohorts are based on undergraduate students who enter the institution in the Fall term (or Summer term and continue into the Fall term); (2) Success Rate measures the percentage of an initial cohort of students who have either graduated or are still enrolled; (3) since degrees can be awarded after the last semester of coursework, the most recent year of data in this table provides preliminary graduation rate data that may change with the addition of “late degrees”. Late degrees reported in conjunction with the IPEDS Graduation Rate Survey due in mid-April will be reflected in the following year.
FLORIDA INTERNATIONAL UNIVERSITY - 2010-11 ANNUAL REPORT 19

Section 4 – Undergraduate Education (continued)
TABLE 4F. SUS Definition - Undergraduate Progression and Graduation Rates
for Other Transfer Students
Term of Entry Fall 2002 Fall 2003 Fall 2004 Fall 2005 Fall 2006 Preliminary
Cohort Size
Full- & Part-time 2,237 2,010 1,621 1,511 1,490
5 – Year Rates
From Same University
% Graduated 53.1% 50.3% 53.5% 50.4% 54.9% % Still Enrolled 9.5% 10.0% 9.1% 8.7% 8.7% From Other SUS University
% Graduated 1.6% 1.6% 1.7% 1.6% 2.1% % Still Enrolled 0.7% 0.9% 0.9% 1.4% 0.7% From State University System
% Graduated 54.7% 51.9% 55.2% 52.0% 57.0% % Still Enrolled 10.2% 10.9% 9.9% 10.1% 9.4% % Success Rate 64.9% 62.8% 65.1% 62.0% 66.4% Notes: (1) Cohorts are based on undergraduate students who enter the institution in the Fall term (or Summer term and continue into the Fall term); (2) Success Rate measures the percentage of an initial cohort of students who have either graduated or are still enrolled; (3) since degrees can be awarded after the last semester of coursework, the most recent year of data in this table provides preliminary graduation rate data that may change with the addition of “late degrees”. Late degrees reported in conjunction with the IPEDS Graduation Rate Survey due in mid-April will be reflected in the following year.
TABLE 4G. Baccalaureate Degrees Awarded 2006-07 2007-08 2008-09 2009-10 2010-11
TOTAL 5,324 5,497 5,663 6,267 6,637
TABLE 4H. Baccalaureate Degrees Awarded in Areas of Strategic Emphasis 2006-07 2007-08 2008-09 2009-10 2010-11
Education 53 56 41 50 48 Health Professions 207 205 211 220 208
Science, Technology, Engineering, and Math
987 987 934 1,026 1,151
Security and Emergency Services
261 261 269 298 344
Globalization 798 755 808 859 1,022 SUBTOTAL 2,306 2,264 2,263 2,453 2,773
Section 4 – Undergraduate Education (continued)
TABLE 4I. Baccalaureate Degrees Awarded to Underrepresented Groups
2006-07 2007-08 2008-09 BASELINE YEAR
2009-10 2010-11
Non-Hispanic Black
Number of Baccalaureate Degrees
650 711 682 Increase*
720 764
Percentage of All Baccalaureate Degrees
13% 14% 13% Maintain* 12% 13%
Hispanic
Number of Baccalaureate Degrees
3,169 3,369 3,555 Increase* 3,919 4,156
Percentage of All Baccalaureate Degrees
64% 65% 67% Increase* 68% 68%
Pell-Grant Recipients
Number of Baccalaureate Degrees
2,276 2,546 2,606 Increase* 3,002 3,284
Percentage of All Baccalaureate Degrees
46% 49% 48% Increase* 52% 50%
Note: Pell-Grant recipients are defined as those students who have received a Pell grant from any SUS Institution within six years of graduation. This does not include degrees awarded to students whose race/ethnicity code is missing (or not reported) or for students who are non-resident aliens. Note*: Directional goals for the 2012-13 year were established in the 2010 University Work Plan.
TABLE 4J. Baccalaureate Completion Without Excess Credit Hours 2006-07 2007-08 2008-09 2009-10 2010-11
% of Total Baccalaureate Degrees Awarded
Within 110% of Hours
Required for Degree
42% 45% 48% 48% 40%
TABLE 4K. Undergraduate Course Offerings Fall 2006 Fall 2007 Fall 2008 Fall 2009 Fall 2010
Number of Course Sections
2,667 2,688 2,518 2,371 2,395
Percentage of Undergraduate Course Sections by Class Size
Fewer than 30 Students 50% 53% 50% 47% 45% 30 to 49 Students 30% 29% 31% 32% 33% 50 to 99 Students 16% 15% 15% 16% 16% 100 or More Students 4% 3% 4% 5% 6%
FLORIDA INTERNATIONAL UNIVERSITY - 2010-11 ANNUAL REPORT 20

Section 4 – Undergraduate Education (continued)
TABLE 4L. Faculty Teaching Undergraduates 2006-07 2007-08 2008-09 2009-10 2010-11
Percentage of Credit Hours Taught by:
Faculty 60% 61% 63% 60% 58% Adjunct Faculty 33% 30% 28% 32% 33% Graduate Students 6% 6% 6% 6% 6% Other Instructors 2% 3% 3% 2% 3% Note: The definition of faculty varies for Tables 4L, 4M and 4N. For Faculty Teaching Undergraduates, the definition of faculty is based on pay plans 01, 02, and 22.
TABLE 4M. Undergraduate Instructional Faculty Compensation 2006-07 2007-08 2008-09 2009-10 2010-11
Average Salary and Benefits for Faculty
Who Teach at Least One
Undergraduate Course
$86,630 $92,391 $84,509 $93,469 $97,048
Note: The definition of faculty varies for Tables 4L, 4M and 4N. For Undergraduate Instructional Faculty Compensation, the definition of faculty is based on pay plan 22.
TABLE 4N. Student/Faculty Ratio Fall 2006 Fall 2007 Fall 2008 Fall 2009 Fall 2010
Student-to-Faculty Ratio 24.0 26.3 26.5 26.6 27.7
Note: The definition of faculty varies for Tables 4L, 4M and 4N. For Student/Faculty Ratio, the definition of faculty is consistent with Common Data Set reporting (which counts full-time equivalent instructional faculty as full-time faculty plus 1/3 part-time faculty).
TABLE 4O. Professional Licensure/Certification Exams for Undergraduate Programs 2006-07 2007-08 2008-09 2009-10 2010-11
Nursing: National Council Licensure Examination for Registered Nurses
Examinees 195 176 181 165 192 Pass Rate 90% 85% 89% 94% 90% National Benchmark 88% 86% 88% 90% 89%
Section 4 – Undergraduate Education (continued)
TABLE 4P. Tuition Differential Fee
2009-10 2010-11 2011-12
Projected
Total Revenues Generated By the Tuition Differential
$7,428,377 $15,411,111 $21,981,840
Unduplicated Count of Students Receiving a Financial Aid Award
Funded by Tuition Differential Revenues
3,844 5,202
Average Amount of Awards Funded by Tuition Differential Revenues
(per student receiving an award)
$545 $639
Number of Students Eligible for a Florida Student Assistance Grant (FSAG)
11,175 12,982
Number of FSAG-Eligible Students Receiving a Waiver
of the Tuition Differential 0 0
Value of Tuition Differential Waivers Provided to FSAG-Eligible Students $0 $0
FLORIDA INTERNATIONAL UNIVERSITY - 2010-11 ANNUAL REPORT 21

Section 5 – Graduate Education
TABLE 5A. Graduate Degree Program Changes in AY 2010-11
Title of Program Six-digit
CIP Code
Degree Level
Date of UBOT Action
Starting or Ending
Term
Date of Board of
Governors Action
Comments
New Programs
Information Technology 11.0103 Masters June 2010 Spring 2011
Biochemistry 26.0202 Research Doctorate Jan 2011 Fall 2011 Jan 2011
International/Global Studies 30.2001 Masters June 2010 Fall 2011
Nursing Practice 51.3818 Professional Doctorate Sep 2010 Fall 2011 Dec. 2010
Information Resources Management 52.1206 Masters Mar 2011 Spring
2012
Terminated Programs Masters None Inactive Programs None New Programs Considered By University But Not Approved
None Note: This table does not include new majors or concentrations added under an existing degree program CIP Code. This table reports the program changes between May 5, 2010 and May 4, 2011. New Programs are proposed new degree programs that have been completely through the approval process at the university and, if appropriate, the Board of Governors. Terminated Programs are degree programs for which the entire CIP Code has been terminated and removed from the university’s inventory of degree programs. Inactive Programs are degree programs for which enrollments have been temporarily suspended for the entire CIP Code, but the program CIP Code has not been terminated.
TABLE 5B. Graduate Degrees Awarded 2006-07 2007-08 2008-09 2009-10 2010-11
TOTAL 2,119 2,384 2,505 2,649 2,971 Masters and Specialist 1,933 2,172 2,255 2,359 2,597 Research Doctoral 100 122 127 114 148 Professional Doctoral 86 90 123 176 226 a) Medicine 0 0 0 0 0 b) Law 86 90 123 144 177 c) Pharmacy 0 0 0 0 0 Note: The total number of Professional Doctoral degrees includes other programs that are not specifically identified in lines a, b, and c.
Section 5 – Graduate Education (continued)
TABLE 5C. Graduate Degrees Awarded in Areas of Strategic Emphasis 2006-07 2007-08 2008-09 2009-10 2010-11
Education 140 76 113 121 92 Health Professions 223 284 285 341 448
Science, Technology, Engineering, and Math
479 498 587 476 471
Security and Emergency Services
18 41 28 42 61
Globalization 112 142 124 189 174 SUBTOTAL 972 1,041 1,137 1,169 1,246
TABLE 5D. Professional Licensure Exams - Graduate Programs
Law: Florida Bar Exam 2007 2008 2009 2010 2011
Examinees 82 83 116 136 168 Pass Rate 88% 88% 81% 81% 89% State Benchmark 81% 84% 79% 79% 82%
Physical Therapy: National Physical Therapy Examinations 2004-06 2005-07 2006-08 2007-09 2008-10
Examinees 124 128 99 89 91 Pass Rate 69% 69% 65% 64% 75% National Benchmark 80% 86% 86% 87% 87%
Occupational Therapy: National Board for Certification in Occupational Therapy Exam 2004-06 2005-07 2006-08 2007-09 2008-10
Examinees 152 120 113 103 142 Pass Rate 73% 77% 82% 74% 65% National Benchmark 85% 87% 86% 83% 82%
Note: We have chosen to compute a three-year average pass rate for first-time examinees on the National Board for Certification in Occupational Therapy (OTR) Examinations and the National Physical Therapy Examinations by exam year, rather than report the annual averages, because of the relatively small cohort sizes compared to other licensed professional programs. The Occupational Therapy exams is a national standardized examination not a licensure examination. Students who wish to practice in Florida must also take a licensure exam.
FLORIDA INTERNATIONAL UNIVERSITY - 2010-11 ANNUAL REPORT 22

Section 6 – Research and Economic Development
TABLE 6A. Research and Development 2005-06 2006-07 2007-08 2008-09 2009-10
R&D Expenditures
Federally Funded Expenditures
(Thousand $)
$58,158 $62,366 $60,045 $57,371 $62,580
Total Expenditures
(Thousand $) $84,697 $108,015 $107,025 $101,322 $110,271
Total R&D Expenditures Per Full-Time, Tenured, Tenure-Earning Faculty Member ($)
$145,864 $178,243 $163,148 $160,066 $174,204
Technology Transfer
Invention Disclosures 20 13 18 16 24 Total U.S. Patents Issued 0 0 0 1 1 Patents Issued Per 1,000 Full-Time, Tenure and Tenure-Earning Faculty
0 0 0 0 0
Total Number of Licenses/ Options Executed
1 0 0 1 1
Total Licensing Income
Received ($) $38,992 $6,166 $9,423 $39,819 $24,942
Total Number of Start-Up Companies
0 0 0 0 0
Note: Awards and Expenditures are based on the National Science Foundation’s annual Survey of R&D Expenditures at Universities and Colleges (data include Science & Engineering and non-Science & Engineering awards). Technology Transfer data are based on the Association of University Technology Managers Annual Licensing Survey.
This page has been left intentionally blank.
FLORIDA INTERNATIONAL UNIVERSITY - 2010-11 ANNUAL REPORT 23

Section 6 – Research and Economic Development (continued)
TABLE 6B. Centers of Excellence
Name of Center:
Center of Excellence for Hurricane Damage Mitigation and Product Development
Cumulative (since inception to June 2011)
Fiscal Year
2010-11
Year Created: 2008 Research Effectiveness
Only includes data for activities directly associated with the Center. Does not include the non-Center activities for faculty who are associated with the Center. Number of Competitive Grants Applied For 32 3 Value of Competitive Grants Applied For ($) $11,787,253 $1,014,779 Number of Competitive Grants Received 26 4 Value of Competitive Grants Received ($) $8,632,243 $2,201,055 Total Research Expenditures ($) $7,567,080 $1,893,979 Number of Publications in Refereed Journals From Center Research
24 19
Number of Invention Disclosures 0 0 Number of Licenses/Options Executed 0 0 Licensing Income Received ($) 0 0 Collaboration Effectiveness
Only reports on relationships that include financial or in-kind support. Collaborations with Other Postsecondary Institutions 6 0 Collaborations with Private Industry 28 0 Collaborations with K-12 Education Systems/Schools 0 0 Undergraduate and Graduate Students Supported with Center Funds
37 16
Economic Development Effectiveness
Number of Start-Up companies with a physical presence, or employees, in Florida
0 0
Jobs Created By Start-Up Companies Associated with the Center
5 0
Specialized Industry Training and Education 0 0 Private-sector Resources Used to Support
the Center's Operations 0 0
Narrative Comments on next page.
Section 6 – Research and Economic Development (continued)
TABLE 6B. Centers of Excellence
Name of Center Center of Excellence for Hurricane Damage Mitigation and Product Development
Narrative Comments [Most Recent Year]: In addition to regular activities such as publishing papers, attending professional conferences, training undergraduate and graduate students, IHRC faculty and staff members are also involved in the following research and service activities: 1. Working with the Florida Division of Emergency Management, IHRC has completed 5 projects including (a) the Building Envelope Performance under Hurricane Conditions and Mitigation Methods to Promote Sustainability, (b) Wind Pressure Coefficient Evaluation for Overhanging Roof Edges, (c) Promoting Hurricane Risk Mitigation Behavior: A Policy Experiment, (d) An Archive and Internet Distribution System for Airborne LiDAR Data, and (e) Education and Outreach Programs to Convey the Benefits of Various Hurricane Loss Mitigation Devices and Techniques. 2. IHRC has updated the Public Hurricane Loss model for the Florida State and successfully passed the rigorous review of the state committee. 3. IHRC has worked with the National Hurricane Center and the National Ocean Service of NOAA to convert the Coastal and Estuarine Storm Tide model for operational real-time forecast of storm surges. 4. IHRC has developed a Storm Surge Simulator to display surge inundation maps based on home addresses for the Miami-Dade County through collaboration with the County's Department of Emergency Management and FIU School of Computing and Information Sciences. This application was widely reported by both local TV stations and newspapers. 5. With the support from the FIU Division of Research and College of Engineering and Computing, IHRC continues to build the Wall of Wind facility. The Facility is expected to be fully operational in Winter 2011.
FLORIDA INTERNATIONAL UNIVERSITY - 2010-11 ANNUAL REPORT 24

Section 6 – Research and Economic Development (continued)
TABLE 6C. State University Research Commercialization Assistance Grants
Project Name by Type of Grant
Year Grant
Awarded
Cumulative
Awards Expenditures
Phase I Grants
None Phase II Grants
1. Bio Innovations 2010 $30,000 $0 2. Forensic Technologies 2010 $30,000 $10,338
Phase III Grants
None
Total for all SURCAG Grants $0 $0
Narrative Comments: For each project, provide a brief update on (1) the project’s progress towards completing its key milestones/deliverables; and (2) the project’s return on investment for the university and state. Phase II Grants 1. Bio Innovations Progress towards completing its key milestones/deliverables. The following tasks were accomplished prior to the June 30th reporting deadline but the expenses were not posted to the University accounting system until July and August: All consultancy, relevant staffing and advisory organized and/or contracted. Business plan strategy narrowed down for both sets of technologies--a determination was made regarding the specific types of markets to target. Marketing materials were developed to assist with presentations and meetings at the 2011 Bio International Convention. AccuDx (our industry partner on the grant) has garnered significant market research. Return on investment for the Florida International University and the State of Florida Significant accomplishments: We were able to market and promote technology developed in the State of Florida at the 2011 Bio International Convention in Washington, DC. PI met with potential interested parties at the 2011 Bio International Convention. 2. Forensic Technologies Progress towards completing its key milestones/deliverables Very detailed market research completed. Business plan information collected, including regulatory information and information on models for similar types of university spin-outs. Return on investment for the Florida International University and the State of Florida Significant accomplishments: Forensic market consultant prepared and presented a very comprehensive market analysis. The proposed spin-out (International Forensic Services) presented at a Florida angel investor event. Business plan writing and development has started.
Section 6 – Research and Economic Development (continued)
TABLE 6D. 21st Century World Class Scholars Program
World Class Scholar(s)
Scholar’s Field
Grant Dollars Report the cumulative activity
since each scholar's award.
Amount Awarded
(Thousand $)
Cumulative Amount
Expended (Thousand $)
External Research Awards
(Thousand $)
Patents Filed / Issued
Licensing Revenues Generated
($)
Joe Leigh Simpson, M.D. Medical Genetics $1,000 $609 $1,636
TOTAL $1,000 $ 609 $1,636 0 $ 0
Narrative Comments
External Research Awards: 1. The Department of Defense - "Mass Scale Biosensor Threat Diagnostic for In-Theater Defense Utilization" - $1.4M 2. Health Resources and Services Administration (HRSA) - "Health Care and Other Facilities" - $235,620
FLORIDA INTERNATIONAL UNIVERSITY - 2010-11 ANNUAL REPORT 25