Embed Size (px)
Citation preview

Cal i fornia Energy Commission
COMMITTEE DRAFT REPORT
2011‐2012 INVESTMENT PLAN FOR THE ALTERNATIVE AND RENEWABLE FUEL AND VEHICLE TECHNOLOGY PROGRAM
MAY 2011
CEC ‐600 ‐2011 ‐006 ‐CTD

CALIFORNIA ENERGY COMMISSION TRANSPORTATION COMMITTEE James D. Boyd Vice-Chair Presiding Member Carla Peterman Commissioner Associate Member Charles Smith Miles Roberts Primary Authors Charles Smith Miles Roberts Project Managers Peter Ward Program Manager Jim McKinney Office Manager Emerging Fuels and Technologies Office Pat Perez Deputy Director Fuels and Transportation Division Melissa Jones Executive Director
DISCLAIMER This report was prepared by the California Energy Commission Transportation Committee as part of 2011-2012 Investment Plan for the Alternative and Renewable Fuel and Vehicle Technology Program – Docket # 2010-ALT-1. The report will be considered for adoption by the full Energy Commission at a future business meeting. The views and recommendations contained in this document are not official policy of the Energy Commission until the report is adopted.

ACKNOWLEDGEMENTS The following Energy Commission staff were key contributors to this report:
Jennifer Allen Leslie Baroody Darcie Chapman Donald Coe Rhetta deMesa Bill Kinney Aleecia Macias Pilar Magaña Jonah Margolis Jim McKinney Tobias Muench Larry Rillera Gordon Schremp Linda Schrupp Michael Trujillo Ysbrand van der Werf Joanne Vinton Peter Ward Gary Yowell
i

ADVISORY COMMITTEE MEMBERS The California Energy Commission thanks the Advisory Committee members for their guidance in helping identify opportunities and priorities for consideration in the Investment Plan:
Shannon Baker‐Branstetter – Consumers Union
Drew Bohan – California Natural Resources Agency
Tom Cackette – California Air Resources Board
Tim Carmichael – California Natural Gas Vehicle Coalition
Brooke Coleman – New Fuels Alliance
Will Coleman – Mohr Davidow Ventures
Peter Cooper – California Labor Federation
Daniel Emmett – Energy Independence Now
Lesley Garland – Western Propane Gas Association
Bonnie Holmes‐Gen – American Lung Association
Roland Hwang – Natural Resources Defense Council
Steve Kaffka – California Biomass Collaborative (courtesy of University of California, Davis)
Howard Levenson – California Department of Resources Recycling and Recovery
Brian McMahon – California Employment Training Panel
Jack Michael – Recreational Boaters of California
Joe Norbeck – University of California, Riverside
John Shears – Center for Energy Efficiency and Renewable Technologies
Jananne Sharpless – Member at Large
Eileen Tutt – California Electric Transportation Coalition
Justin Ward – California Fuel Cell Partnership (courtesy of Toyota Motor Corporation)
ii

PREFACE The increased use of alternative and renewable fuels supports California’s commitment to curb greenhouse gas emissions, reduce petroleum use, improve air quality, and stimulate the sustainable production and use of biofuels within California. Alternative and renewable transportation fuels include electricity, natural gas, biomethane, propane, hydrogen, gasoline substitute fuels, and diesel substitute fuels. State investment is needed to fill the gap and fund the differential cost of these emerging fuels and vehicle technologies.
Assembly Bill 118 (Núñez, Chapter 750, Statutes of 2007) created the Alternative and Renewable Fuel and Vehicle Technology Program. This statute, amended by Assembly Bill 109 (Núñez, Chapter 313, Statutes of 2008), authorizes the California Energy Commission to “develop and deploy innovative technologies that transform California’s fuel and vehicle types to help attain the state’s climate change policies.” The Energy Commission must accomplish this, in part, by funding projects that provide for “a measurable transition from the nearly exclusive use of petroleum fuels to a diverse portfolio of alternative fuels that meet petroleum reduction goals and alternative fuel use goals.” The Energy Commission has an annual program budget of approximately $100 million.
The statute also directs the Energy Commission to adopt an investment plan that describes how funding will complement existing public and private investments, including existing state and federal programs. The Energy Commission must establish and consult with an advisory committee during the development of the investment plan. . The Energy Commission will use the investment plan as a guide for awarding funds. The statute calls for the investment plan to be updated annually.
iii

iv

ABSTRACT The investment plan for the Alternative and Renewable Fuel and Vehicle Technology Program serves as the guidance document for the allocation of program funding and is prepared annually based on input and advice of the Assembly Bill 118 Advisory Committee. This third investment plan, the 2011‐2012 Investment Plan for the Alternative and Renewable Fuel and Vehicle Technology Program, covers the third year of the program and reflects laws, executive orders, and policies to reduce petroleum use, greenhouse gas emissions, and criteria emissions; increase alternative fuel use; and spur the development of bioenergy sources in California. It details how the California Energy Commission, with input from stakeholders and the Advisory Committee, determined the program’s goal‐driven priorities coupled with project opportunities for funding. These priorities are consistent with the program’s goal “to develop and deploy innovative technologies that transform California’s fuel and vehicle types to help attain the state’s climate change policies.”
The 2011‐2012 Investment Plan provides proposed funding recommendations based on alternative and renewable fuel and vehicle technology analyses and identified opportunities. The appendices provide supporting analyses and important references for the development of this plan to help transform California’s transportation sector to a low‐carbon, cleaner, non‐petroleum, and more efficient energy future.
Keywords: California Energy Commission, Alternative and Renewable Fuel and Vehicle Technology Program, alternative transportation fuels, investment plan, electric drive, hydrogen, biodiesel, renewable diesel, diesel substitutes, renewable gasoline substitutes, ethanol, natural gas, propane, innovative technologies, advanced fuels, workforce training, vehicle efficiency, sustainability, fueling stations, fuel production, fuel storage and blending, biofuels, biomethane
Please use the following citation for this report:
Smith, Charles, Miles Roberts, Jim McKinney. 2011. 2011‐2012 Investment Plan for the Alternative and Renewable Fuel and Vehicle Technology Program Committee Draft Report. California Energy Commission, Fuels and Transportation Division. Publication Number: CEC‐600‐2011‐006‐CTD
v

TABLE OF CONTENTS EXECUTIVE SUMMARY ...................................................................................................................... 1
2011‐2012 Investment Plan Funding Priorities .............................................................................. 2
Program Status ................................................................................................................................... 3
2011‐2012 Investment Plan Allocations .......................................................................................... 5
CHAPTER 1: Introduction ..................................................................................................................... 11
CHAPTER 2: Determining Priorities and Opportunities ................................................................ 15
Summary of Program Activities ........................................................................................................ 15
American Recovery and Reinvestment Act of 2009 ........................................................................ 18
Air Quality Improvement Program ................................................................................................... 19
Low Carbon Fuel Standard ................................................................................................................. 21
Zero Emission Vehicle Regulation ..................................................................................................... 21
Zero Emission Bus Regulation ........................................................................................................... 21
Bioenergy Action Plan ......................................................................................................................... 22
Renewable Fuel Standard ................................................................................................................... 22
National Greenhouse Gas and Corporate Average Fuel Economy Standards ........................... 22
Renewables Portfolio Standard .......................................................................................................... 23
Clean Air Action Plan .......................................................................................................................... 23
Chapter 3: Alternative Fuels and Vehicle Technologies ................................................................. 25
Plug‐In Electric Vehicles ..................................................................................................................... 25
Electricity Generation ...................................................................................................................... 26
Electricity Distribution .................................................................................................................... 27
Electric Drive Charging Infrastructure ......................................................................................... 28
Light‐Duty PEVs .............................................................................................................................. 44
Batteries ............................................................................................................................................. 48
Hydrogen .............................................................................................................................................. 51
Fuel Conversion and Production ................................................................................................... 51
Upstream Fuel Infrastructure ......................................................................................................... 53
vi

Localized Fuel Retail Infrastructure .............................................................................................. 54
Light‐Duty Fuel Cell Vehicles ........................................................................................................ 58
Stationary Applications ................................................................................................................... 59
Bridging Technologies ..................................................................................................................... 60
Natural Gas ........................................................................................................................................... 61
Natural Gas Supply ......................................................................................................................... 62
Natural Gas Processing ................................................................................................................... 63
Upstream Fuel Infrastructure ......................................................................................................... 64
Retail and Fleet Fueling Infrastructure ......................................................................................... 65
Light‐Duty Vehicles ......................................................................................................................... 68
Propane .................................................................................................................................................. 70
Upstream Fuel Infrastructure ......................................................................................................... 70
Local Fuel Infrastructure ................................................................................................................. 71
Light‐Duty Vehicles ......................................................................................................................... 72
Biofuels .................................................................................................................................................. 74
Feedstocks ......................................................................................................................................... 74
Waste‐Based Feedstocks ................................................................................................................. 74
Purpose‐Grown Feedstocks ............................................................................................................ 84
Fuel Conversion Processes .............................................................................................................. 97
Gasoline Substitutes ......................................................................................................................... 98
Source: California Energy Commission ...................................................................................... 106
Diesel Substitutes ........................................................................................................................... 106
Biomethane ..................................................................................................................................... 114
Medium‐ and Heavy‐Duty Vehicles ............................................................................................... 117
Natural Gas and Propane Vehicles .............................................................................................. 118
Advanced Vehicle Technologies .................................................................................................. 121
Innovative Technologies, Advanced Fuels, and Federal Cost‐Sharing ...................................... 125
Chapter 4: Manufacturing ................................................................................................................... 127
vii

Chapter 5: Workforce Training and Development ......................................................................... 130
Workforce Development and Training Implementation .............................................................. 130
Workforce Training Activities ...................................................................................................... 131
Workforce Demand ........................................................................................................................... 135
Clean Transportation Workforce Research .................................................................................... 137
Alternative Fuels and Alternative Fuel Vehicles Training Needs Assessment ..................... 137
Green Transportation Jobs Report ............................................................................................... 139
Next 10 Many Shades of Green Report ....................................................................................... 140
2011‐2012 Workforce Training and Development Plan ................................................................ 142
California Community College Office of the Chancellor ......................................................... 142
Employment Training Panel......................................................................................................... 142
Employment Development Department .................................................................................... 143
California Workforce Investment Board ..................................................................................... 143
New Entrant Career Path Development Future Planning ....................................................... 144
Workforce Development and Training Outreach ......................................................................... 144
Agency Partners ............................................................................................................................. 144
Industry Partners ........................................................................................................................... 145
Workforce Development and Training Demand Research .......................................................... 145
Chapter 6: Market and Program Development ............................................................................... 147
Outreach and Marketing ................................................................................................................... 147
Standards and Certification .............................................................................................................. 148
Sustainability Studies ........................................................................................................................ 148
Technical Assistance and Analysis .................................................................................................. 151
Chapter 7: Funding Allocations .......................................................................................................... 153
APPENDIX A: Carbon Intensities for Fuel Pathways .................................................................... 154
APPENDIX B: Hydrogen Fuel Demand and Supply ..................................................................... 156
APPENDIX C: Fuel Conversion Processes ....................................................................................... 159
GLOSSARY ......................................................................................................................................... 166
viii

LIST OF TABLES Page
Table ES‐1: Solicitations and Awards ...................................................................................................... 4
Table ES‐2: Funding Allocation Summary for FY 2011‐2012 ............................................................... 6
Table 1: Summary of Key Policies ......................................................................................................... 13
Table 2: Solicitations and Awards ......................................................................................................... 16
Table 3: ARRA Awards With Program Match Funding in California (In Millions) ....................... 19
Table 4: PEV Public Charging Infrastructure Deployment by California Region .......................... 28
Table 5: Charging Level Definitions ...................................................................................................... 33
Table 6: Estimated Costs for Charging Stations ................................................................................... 33
Table 7: BEV Deployments by Year and Region .................................................................................. 41
Table 8: PHEV Deployments by Year and Region .............................................................................. 41
Table 9: Planned Deployment of Fast Chargers in California ........................................................... 42
Table 10: PEV Infrastructure Funding Summary for FY 2011‐2012 .................................................. 44
Table 11: PEV Versus Conventional Vehicle Fuel Cost Savings Projections ................................... 47
Table 12: Plug‐In Electric Vehicle Funding Allocation ....................................................................... 50
Table 13: 2009 and 2010 Fuel Cell Vehicle Survey ............................................................................... 56
Table 14: Hydrogen Funding Allocation .............................................................................................. 60
Table 15: Natural Gas Fueling Stations ................................................................................................. 66
Table 16: Natural Gas Infrastructure Costs .......................................................................................... 66
Table 17: Natural Gas Funding Allocation ........................................................................................... 69
Table 18: Propane Infrastructure Summary ......................................................................................... 72
Table 19: Propane Funding Allocation .................................................................................................. 73
Table 20: Waste‐Based Feedstock Volumes and Fuel Potential ......................................................... 75
Table 21: Ethanol Funding Allocation ................................................................................................. 106
Table 22: Estimated Emission Reductions From 6.9 Million Gallons of Biodiesel in 2009 .......... 108
Table 23: FY 2008‐2010 Funded Diesel Substitute Infrastructure Projects ..................................... 113
Table 24: Diesel Substitutes Funding Allocation ............................................................................... 113
ix

x
Table 25: Biomethane Funding Allocation ......................................................................................... 116
Table 26: Medium‐ and Heavy‐Duty Vehicles and Petroleum Use ................................................ 117
Table 27: Petroleum and GHG Reductions ........................................................................................ 118
Table 28: Propane and NGVs and Petroleum Displacement ........................................................... 119
Table 29: Medium‐ and Heavy‐Duty Vehicles Funding Allocation ............................................... 124
Table 30: Innovative Fuels, Advanced Fuels, and Federal Cost‐Sharing ....................................... 126
Table 31: Manufacturing Funding Allocation .................................................................................... 129
Table 32: ETP‐Funded Training Contracts ......................................................................................... 132
Table 33: EDD 2009 Local Workforce Subgrants ............................................................................... 133
Table 34: CWIB Clean Transportation Regional Industry Cluster Opportunity Subgrants ........ 134
Table 35: Funding for Workforce Development and Training Delivery ........................................ 144
Table 36: Workforce Development and Training Funding Allocation ........................................... 146
Table 37: Technical Assistance and Analysis Funding Allocation .................................................. 152
Table 38: Funding Allocation Summary for FY 2011‐2012 ............................................................... 153
Table B‐1: Hydrogen Fuel Demand and Supply Gaps Through 2014 ............................................ 156
Table B‐2: FCVs by Air Basin in 2015‐2017 ......................................................................................... 158
Table C‐1: Fuel Conversion Processes for Non‐Cellulosic Feedstocks ........................................... 159
Table C‐2: Fuel Conversion Processes for Cellulosic Feedstocks .................................................... 163
LIST OF FIGURES
Page
Figure 1: GHG Emission Reductions of Electric Vehicles by Electricity Source ............................. 27
Figure 2: Gasoline and CNG Prices by Gasoline Gallon Equivalent ................................................ 61
Figure 3: Diesel and CNG Prices by Diesel Gallon Equivalent ......................................................... 62
Figure 4: California Ethanol Consumption, 1981‐2010 ....................................................................... 98
Figure 5: Historical E85 Stations and E85 Sales Volume .................................................................. 102
Figure A‐1: Carbon Intensity for Gasoline and Substitutes ............................................................. 154
Figure A‐2: Carbon Intensity for Diesel and Substitutes .................................................................. 155

EXECUTIVE SUMMARY Transportation fuel is one of the top three energy use sectors in the United States, accounting for two‐thirds of the 20 million barrels of crude oil consumed daily. Of that, the United States imports about half from foreign sources. In California, the transportation sector represents roughly half of all energy consumed and is more than 90 percent dependent on petroleum. Despite the current economic turmoil, Californians still consume more than 50 million combined gallons of gasoline and diesel each day.
This dependence on petroleum‐derived fuels poses a number of significant challenges for California. Due to this dependence, California’s transportation sector contributes about 40 percent of the state’s greenhouse gas emissions, the largest amount from any single sector. Forecasts of an increase in fuel prices from 35 to 50 percent by 2015 suggest a considerable drag on California’s economic recovery. Finally, given this nation’s dependence on foreign sources of crude oil, petroleum dependence entails national security risks as well.
California has and will continue to affect dramatically the direction of the nation’s transportation sector as it leads with landmark state regulations and incentives to decrease petroleum use and greenhouse gas emissions. The State Alternative Fuels Plan of 2007 (Assembly Bill 1007, Pavley, Chapter 371, Statutes of 2005), jointly developed and adopted by the California Energy Commission and the California Air Resources Board, presented strategies to increase of alternative and non‐petroleum fuel use for transportation. The State Alternative Fuels Plan set goals to reduce petroleum dependence by 15 percent by 2020 and increase alternative fuels use to 26 percent of all fuel consumption by 2022. The alternative fuels proposed in the plan could achieve these goals and reduce greenhouse gases by 15 percent to 20 percent in the coming years. Other important California regulations include the Global Warming Solutions Act of 2006 (Assembly Bill 32, Núñez, Chapter 488, Statutes of 2006), the Low Carbon Fuel Standard, the Zero Emission Vehicle regulations, the Bioenergy Action Plan, the Renewables Portfolio Standard and the San Pedro Bay Ports Clean Air Action Plan.
The Alternative and Renewable Fuel and Vehicle Technology Program, created by Assembly Bill 118 (Núñez, Chapter 750, Statutes of 2007), has a crucial role in attaining the state’s climate change and energy policies. Through 2014, the Energy Commission will provide incentives up to $100 million annually through the program to leverage public and private investment to develop and deploy clean, efficient, and low‐carbon alternative fuels and technologies. The program also provides a foundation for the sustainable development and use of transportation energy and an economic stimulus to create California jobs and businesses by encouraging the invention and production of the technologies and services necessary for the future transportation system. Assembly Bill 118 also provides up to $50 million per year for the Air Quality Improvement Program, administered by the Air Resources Board, which complements the Energy Commission’s program in providing alternative fuel vehicle incentives.
The Energy Commission is required to prepare an annual investment plan determining the program funding priorities and opportunities, and describing how program funding will be used to support other public and private investments. The Energy Commission adopted the first investment plan combining funds from fiscal years 2008‐2009 and 2009‐2010 at the April 22, 2009, Business Meeting. The second investment plan, for fiscal year 2010‐2011, was adopted at
1

the August 11, 2010, Business Meeting. This staff draft 2011‐2012 Investment Plan for the Alternative and Renewable Fuel and Vehicle Technology Program is the proposed funding guide for fiscal year 2011‐2012.
To ensure a more comprehensive approach to the investment plan, the Energy Commission has restructured the analysis and reorganized the contents of the plan. More emphasis is given to the upstream fuel issues, such as feedstocks and fuel conversion processes. This is especially reflected in the biofuels section, which includes a detailed analysis of some of the more developed and promising feedstocks. The Energy Commission is also developing a similarly detailed analysis of biofuel conversion processes. This approach allows the Energy Commission to encourage advanced pathways for biofuels (and other fuel types) that rely on lower carbon feedstocks and more efficient conversion processes.
The Energy Commission has also reshaped the investment plan’s approach to medium‐ and heavy‐duty vehicles. Previously, these vehicles were discussed in each fuel section. For this year’s investment plan, the Energy Commission developed a separate medium‐ and heavy‐duty section, which allows for a more detailed analysis of the opportunities and barriers for incorporating alternative fuels and advanced technologies into medium‐ and heavy‐duty vehicles.
2011-2012 Investment Plan Funding Priorities The Energy Commission will continue to provide funding to accelerate developing and introducing clean, efficient low‐carbon technologies that will reduce greenhouse gas emissions and petroleum dependence, and increase alternative and renewable fuel use and in‐state biofuels production. Achieving these policy objectives requires a portfolio of fuels and vehicle technologies including electric drive and fuel cell vehicles, low‐carbon biofuels, natural gas and propane vehicles, and improved vehicle efficiency.
The Energy Commission evaluated funding priorities based on an identified portfolio of fuels and technologies, and these priorities reflect a broad set of short‐, medium‐ and long‐term opportunities. To ensure the maximum value for the state’s funding, the plan evaluates existing public and private funding that is already developing and deploying alternative fuels and vehicle technologies, and assesses where gaps exist and funding is required. Funding required for workforce training, sustainability studies, standards and certification, public education and outreach, and analytical support is also considered.
This investment plan recognizes the necessity to leverage existing federal, state, and local funding as well as stakeholder investments. Auto manufacturers, utilities, other stakeholders, and federal and local governments are investing in alternative fuel and advanced vehicle technologies. The Energy Commission intends to leverage these investments to accelerate the introduction and use of these fuels and technologies.
To help develop the 2011‐2012 Investment Plan, the Energy Commission has relied on an array of stakeholder input, contracted research, and other agreements. The 2010‐2012 Investment Plan also considers:
• Program funds that have been awarded to date.
2

• American Recovery and Reinvestment Act of 2009 funds awarded to successful California project applicants.
• The effects of existing and anticipated regulations, including the Low‐Carbon Fuel Standard, the Bioenergy Action Plan, the Zero Emission Vehicle regulation modifications, the Clean Fuels Outlets regulations, the Renewable Fuel Standard, the National Greenhouse Gas and Corporate Average Fuel Economy Standards for Vehicles, the Renewables Portfolio Standard, and the Clean Air Action Plan.
Program Status The third investment plan has benefited from the Energy Commission’s recent experience in reviewing and funding projects. This process has provided useful technical and market information that affects the investment plan as well as guidance for future solicitations and agreements. The program is heavily oversubscribed, receiving more than 300 project proposals totaling nearly $1.2 billion in requested funding based on the first investment plan alone. Greenhouse gas and petroleum use reductions are substantial, and the leveraged amount of public, stakeholder, and venture capital is unprecedented.
Under the first investment plan, the Energy Commission sought to help California entities successfully compete for funding under the federal American Recovery and Reinvestment Act. As a result, the Energy Commission has committed $36.5 million to California projects that have been awarded approximately $105.3 million in additional American Recovery and Reinvestment Act funds and also include $113.3 million in private funds. These funds will be used to:
• Install 2,860 new electric vehicle charging sites.
• Demonstrate and deploy more than 700 medium‐ and heavy‐duty natural gas and hybrid‐electric trucks.
• Develop high‐energy‐density lithium‐ion batteries.
• Provide public outreach to promote the deployment of heavy‐duty natural gas vehicles.
• Establish 75 new E85 fueling stations.
The Energy Commission also issued a number of agreements (totaling $20.6 million) for:
• Certifying hydrogen dispensing equipment for retail hydrogen fueling stations and establishment of specifications for hydrogen and biodiesel fuels: $4 million.
• Establishing statewide workforce training and development programs: $15 million.
• Convert state‐owned hybrid vehicles to plug‐in hybrid vehicles: $600,000.
• Technical assistance in administering the Alternative and Renewable Fuel and Vehicle Technology Program: $1 million.
With a significant amount of funding from fiscal years 2008‐2009 and 2009‐2010 remaining, the Energy Commission issued a series of additional solicitations. The Energy Commission evaluated, scored, and provided an initial proposed award for each of these solicitations (Table ES‐1). Several solicitations allowed the Energy Commission the ability to increase the amount of funding available to a specified maximum level, referred to as “headroom.” Due to the large
3

number of competitive proposals with passing scores, the Energy Commission provided headroom funding from the same categories identified in the 2010‐11 investment plan.
Table ES-1: Solicitations and Awards
Fuel Category Funded Activity
Initial Awards (FY 08-09,
09-10) ($ Millions)
Headroom Awards
(FY 10-11) ($ Millions)
Total Award
($ Millions)
Total Number of Projects
American Recovery and Reinvestment
Act
Cost-Sharing for Federal Projects $36.5 - $36.5 9
Electric Drive
Charging Infrastructure $3.2 $2.4 $5.6 7 Medium- and Heavy-Duty Advance Vehicle Demonstrations
$10.0 $2.0 $12.0 8
Manufacturing Facilities and Equipment $19.0 $5.9 $24.9 11
Natural Gas Fueling Infrastructure $5.7 - $5.7 10
Biofuels
Biomethane Production $35.1 $0.2 $35.3 10 Diesel Substitutes Production $2.8 $1.5 $4.3 6
Advanced Ethanol and Gasoline Substitutes Production
$3.5 - $3.5 2
California Ethanol Producers Incentive Program
$6.0 - $6.0 TBD
E-85 Fueling Stations $1.0 - $1.0 1
Upstream Biodiesel Infrastructure $3.9 - $3.9 3
Hydrogen Fueling Stations $15.7 - $15.7 3
Total $142.4 $12.0 $154.4 61 Source: California Energy Commission
In April 2011, the Energy Commission issued a $14.5 million incentive program for natural gas and propane vehicles, using funds from both the first investment plan and the second. Additionally, the Energy Commission is preparing future agreements (totaling $10.45 million) using remaining fiscal years 2008‐2009 and 2009‐2010 funds for:
• Supporting the Clean Vehicle Rebate Program administered by the Air Resources Board: $2 million.
• Expanding funding for zero emission vehicles under the Air Resources Board’s Hybrid Voucher Incentive Program: $2 million.
• Woody biomass sustainability research with the U.S. Forest Service: $1.5 million. • Use and expansion of the University of California at Irvine’s Spatially & Temporally
Resolved Energy & Environment model: $.75 million. • Technical assistance from the National Renewable Energy Laboratory: $1.2 million.
4

• Hydrogen transit project: $3 million.
The second investment plan had $108 million for project and activity funding, based on estimated vehicle registrations, vessel registrations, identification plates, and smog abatement fees. However, Californians registered fewer vehicles in 2009 than was originally estimated; as a result, only $86.4 million was available for fiscal year 2010‐11. An additional $1.73 million was allocated for project monitoring, verification, and evaluation, leaving $84.67 million for projects. Of this amount, $12 million has been dedicated for headroom awards. Using the remaining funding (and a portion of the remaining funding from the first investment plan), four new solicitations will be issued by July 2011. These solicitations include:
• Regional readiness planning for plug‐in electric vehicles: $1 million.
• Medium‐ and heavy‐duty vehicle demonstration of near‐commercial advanced and alternative fuel technologies: $15 million.
• Propane and natural gas vehicles (as mentioned): $14.5 million.
• Outreach and marketing: $1.5 million.
Additional solicitations and agreements for fiscal year 2010‐11 funding will include:
• Gasoline substitutes infrastructure and fuel production: $9.6 million.
• Diesel substitutes bulk terminal storage/blending and fuel production: $7.1 million.
• Biomethane production and quality testing, and natural gas infrastructure: $6.9 million.
• Hydrogen infrastructure: up to $10.2 million.
• Other solicitations and agreements, as outlined in the second investment plan.
2011-2012 Investment Plan Allocations The allocations in the investment plan are based on possible alternative and renewable fuel increases and advanced vehicle technology deployment, petroleum displacement, potential greenhouse gas reductions, the level of current public and private funding, and input from stakeholders. These allocations provide funding for demonstration and deployment opportunities in the short, mid‐ and long term to meet program goals (Table ES‐2). For example, funding is being provided immediately to establish electric drive infrastructure for electric vehicles being deployed in 2011 to 2013—the near term. Funding for improved biofuel production methods will provide alternative vehicle fuels in subsequent years, and funding for hydrogen infrastructure will help to meet petroleum and greenhouse gas reduction goals as commercial fuel cell vehicles are introduced beginning in 2015. To further support commercializing alternative fuels and vehicle technologies, the investment plan also funds market and program development activities.
5

Table ES-2: Funding Allocation Summary for FY 2011-2012
Project/Activity Funding Allocation for FY (2011-2012)
Plug-In Electric Vehicles
Charging Infrastructure $8 Million Subtotal $8 Million
Hydrogen Fueling Infrastructure $8 Million
Subtotal $8 Million
Natural Gas Fueling Infrastructure $8 Million
Subtotal $8 Million
Propane Light-Duty Vehicle Incentives $1 Million Fueling Infrastructure $.5 Million
Subtotal $1.5 Million
Gasoline Substitutes
Advanced Cellulosic Ethanol and Gasoline Substitute Production Plants $7.5 Million
E85 Retail $4 Million Subtotal $11.5 Million
Diesel Substitutes Advanced Diesel Substitute Production Plants $7.5 Million
Subtotal $7.5 Million
Biomethane Pre-Landfill Biomethane Production $8 Million
Subtotal $8 Million
Medium- and Heavy-Duty
Vehicles
Deployment Incentives for Natural Gas Vehicles $11.5 Million Deployment Incentives for Propane Vehicles $3 Million Develop and Demonstrate Advanced Technology Medium- and Heavy-Duty Vehicles $7 Million
Subtotal $21.5 Million Innovative
Technologies, Advanced Fuels, and Federal Cost-
Sharing
Innovative Technologies, Advanced Fuels, and Federal Cost-Sharing $3 Million
Subtotal $3 Million
Manufacturing Manufacturing Facilities and Equipment $8 Million
Subtotal $8 Million
Workforce and Training
Workforce Development and Training Agreements $6.5 Million
Subtotal $6.5 Million
Market and Program
Development
Sustainability Studies $1.5 Million Technical Assistance and Analysis $4 Million Measurement, Verification and Evaluation $3 Million
Subtotal $8.5 Million Grand Total $100 Million
Source: California Energy Commission
Plug-In Electric Vehicles ($8 Million) Sales of in‐state plug‐in electric vehicles are expected to increase rapidly over the next 2‐3 years, as major automakers begin offering fully electric and plug‐in hybrid electric vehicles. Based on
6

automaker survey data, the combined number of these vehicles is expected to surpass 20,000 by 2012. To ensure the continued deployment of these vehicles, the Energy Commission is providing $8 million to support charging infrastructure. This funding will potentially support a broad variety of charging installations and related activities, including regional readiness planning, residential chargers, workplace commercial and public chargers, and fast chargers that can fully charge a vehicle in minutes (rather than hours). These activities will be coordinated with the Air Resources Board, the California Public Utilities Commission, and the recently established California Plug‐In Electric Vehicle Collaborative Council.
Hydrogen ($8 Million) Hydrogen vehicles, predominantly fuel cell vehicles, are expected to rapidly expand within the state over the next decade. As in previous investment plans, the Energy Commission seeks to ensure sufficient fueling infrastructure to support the deployment of these vehicles. An updated survey of major automakers suggests that, despite a drop in anticipated vehicles before 2015, the number of vehicles expected after 2015 will be in the tens of thousands. Before 2015, anticipated hydrogen fueling stations should be able to provide significant coverage for the expected number of vehicles. This coverage will be further expanded as the Energy Commission develops a funding strategy for its fiscal year 2010‐2011 allocation of $10.2 million for hydrogen fueling infrastructure. For fiscal year 2011‐2012, the Energy Commission will provide $8 million to address high‐priority gaps in fueling infrastructure, as well as funding for transit demonstration opportunities that use fuel cell vehicle technology. This funding may be combined with the funds from fiscal year 2010‐2011 into a single solicitation.
Natural Gas ($8 Million) Natural gas is expected to play a growing role in the state’s transportation sector, in response to greenhouse gas emission reduction targets, volatile oil prices, and air quality standards. Significant opportunities remain for expanding the use of medium‐ and heavy‐duty natural gas vehicles in a variety of applications. These opportunities are discussed in greater detail in the Medium‐ and Heavy‐Duty Vehicles section of the investment plan.
A modest network of fueling infrastructure already exists for natural gas vehicles. However, many of these stations require upgrades, and increases in natural gas vehicles will occur only when range anxiety and fleet fueling operations are addressed. The Energy Commission is allocating $8 million to support the installation of new natural gas fueling infrastructure and upgrades to existing infrastructure. An expanded natural gas fueling infrastructure also creates additional opportunities to incorporate biomethane from anaerobically digested waste‐based biomass feedstocks into California’s transportation fueling infrastructure
Propane ($1.5 Million) Propane, like natural gas, offers the potential for immediately reducing greenhouse gas emissions, petroleum dependence, and fuel costs for light‐ and medium‐duty vehicles. Propane produced by renewable methods will further reduce greenhouse gas emissions from propane‐fueled vehicles. Propane has been the preferred alternative fuel for rural communities and school districts that do not have access to an alternative fuel, since propane fueling infrastructure is readily available and affordable. The Energy Commission is allocating $1 million specifically for light‐duty propane vehicle deployment and $500,000 to expand propane
7

infrastructure in Northern California. Further allocations for medium‐ and heavy‐duty propane vehicles are discussed in the Medium‐ and Heavy‐Duty Vehicles section of the investment plan.
Biofuels There is a broad variety of feedstocks available for renewable biofuels. California possesses a significant volume of waste‐based feedstocks, which offer a particularly excellent opportunity for expanding the production of low‐carbon fuels. The Energy Commission is interested in expanding the use of low‐carbon, sustainable feedstocks. Similarly, a variety of fuel conversion processes exists, and the Energy Commission expects to maximize the processes that use abundant, waste‐based feedstocks. Within biofuels, the investment plan focuses on three fuel end uses: advanced ethanol, diesel substitutes, and biomethane.
Gasoline Substitutes ($11.5 Million)
Ethanol and other gasoline substitutes offer a significant opportunity for reducing both greenhouse gas emissions and petroleum use. The state’s Low Carbon Fuel Standard and Bioenergy Action Plan and the federal Renewable Fuel Standard rely heavily on biofuels (including ethanol) to meet their targets. The Energy Commission is providing $7.5 million to expand in‐state production of ethanol and other gasoline substitutes. This funding is intended for the development of new facilities that can use waste‐based cellulosic feedstocks to produce a low‐carbon fuel.
An additional $4 million will be provided to expand E85 (85 percent ethanol and 15 percent gasoline) dispensers and retail outlets. Given the relatively modest marginal cost for the purchase of flex‐fuel vehicles, the Energy Commission is not proposing vehicle funding for this fuel category.
Diesel Substitutes ($7.5 Million)
Diesel substitutes, such as biodiesel and renewable diesel, similarly offer an immediate opportunity to significantly reduce California’s greenhouse gas emissions and petroleum dependence. The same policy drivers that will accelerate ethanol and gasoline substitutes will also accelerate diesel substitutes. To accelerate the in‐state production of diesel substitutes, the Energy Commission will provide $7.5 million to expand and support California’s diesel substitute production plants.
Biomethane ($8 Million)
The production and use of in‐state biomethane will further advance state policy in the transportation sector. Biomethane, when produced from waste‐based resources or byproducts, possesses one of the lowest carbon intensities of any existing fuel. Additionally, biomethane can reduce lifecycle greenhouse gas emissions in a broad variety of fuel pathways, from natural gas to hydrogen to ethanol. Anaerobic digestion of waste‐based feedstocks is proving to be a robust and cost‐effective technology for creating very‐low‐carbon transportation fuels that can be readily incorporated into natural gas vehicles and fueling systems. The annual fuel potential from California’s waste‐based feedstocks is estimated to be more than 1,750 million diesel gallon‐equivalents. For these reasons, the Energy Commission is allocating $8 million to develop in‐state biomethane production for the transportation sector.
8
Medium- and Heavy-Duty Vehicles ($21.5 Million) Medium‐ and heavy‐duty vehicles are a significant component of California’s transportation sector, accounting for a combined 16 percent of the state’s petroleum consumption and greenhouse gas emissions within the transportation sector. Yet, these vehicles represent fewer than 4 percent of the in‐state vehicle population. Given the high amount of petroleum use per vehicle (compared to passenger vehicles), these vehicles offer an excellent opportunity to expand alternative fuel use, reduce petroleum dependence, and reduce greenhouse gas emissions. The Energy Commission is allocating $11.5 million in deployment incentives for on‐road and off‐road medium‐ and heavy‐duty natural gas vehicles, and $3 million for propane vehicles.
Advanced technologies, such as battery electric applications, hybrid hydraulics, and fuel cell technology, can also be incorporated into medium‐ and heavy‐duty vehicles. However, compared to passenger vehicles, medium‐ and heavy‐duty vehicles serve a broader variety of purposes. The early use of advanced technologies may be limited to certain niche applications. Some vehicle suppliers have already begun incorporating a variety of advanced vehicle technologies. To expand the use of these technologies, the Energy Commission will provide $7 million to demonstrate advanced technologies in the medium‐ and heavy‐duty sector.
Innovative Technologies and Advanced Fuels ($3 Million) In addition to the previous fuel and technology categories, the Energy Commission is interested in providing funding for other types of projects that can help the state meet its greenhouse gas emission reduction and alternative fuel use goals. This could include, among other things, projects to improve engine efficiencies, develop high‐productivity biomass feedstocks (such as algae), and create lightweight vehicle materials for multiple vehicle platforms. To ensure adequate funding for these opportunities, the Energy Commission is reserving $3 million for innovative technologies and advanced fuels. This funding will also be reserved for cost‐sharing opportunities from highly leveraged federal solicitations.
Manufacturing ($8 Million) Given the amount of venture capital invested in California’s clean transportation sector, the state has the potential to develop and attract new opportunities for manufacturing alternative fuel vehicles and components. The Energy Commission has already made substantial investments in manufacturing. These successful projects will attract customers and production orders and will soon require greater manufacturing capacity. State support can help ensure that these commercial‐scale manufacturing plants are located in California, benefitting California with jobs, environmental benefits, and tax revenue. For fiscal year 2011‐2012, the Energy Commission will allocate $8 million to fund projects that establish commercial‐scale clean transportation manufacturing facilities in California.
Workforce Development and Training ($6.5 Million) Workforce development and training is critical in California’s efforts to develop a clean transportation energy market. Skilled workers are needed to manufacture low‐emissions vehicles and components, produce alternative fuels, build fueling infrastructure, service and maintain fleets and equipment, and inform ongoing innovation and refinement to increase market acceptance. Training is required to respond to new technology, improve efficiencies,
9

minimize wastage, and reduce the cost of production. As the Energy Commission funds alternative fuel and low‐emission vehicle projects, it is critical that funds are allocated to help develop a skilled workforce to implement and sustain those projects. The Energy Commission allocates $6.5 million for this purpose.
Market and Program Development ($8.5 Million) The Energy Commission is also allocating funding for non‐fuel categories to ensure the success of this program. The Energy Commission is providing $1.5 million for sustainability studies to support commercializing renewable fuels and minimizing negative environmental impacts. Existing efforts in marketing and program outreach will continue using previous years’ funds and do not require additional funding at this time. The Energy Commission will provide $4 million for technical assistance and environmental, market, and technology analysis. This work will assist the program to focus on funding priorities and identifying preferred opportunities for future funding. This category may also provide funding for full fuel cycle analysis to help small companies develop and demonstrate the carbon intensity of their alternative and renewable fuels and technologies. Finally, the Energy Commission will reserve $3 million for program support for the measurement, verification, and evaluation of the program’s activities.
10

CHAPTER 1: Introduction The transportation sector of California represents a critical element of the state’s economy and society, with more than 26 million registered vehicles. This sector accounts for nearly half of all energy consumed within the state and produces approximately 40 percent of the state’s greenhouse gas (GHG) emissions.1 Petroleum‐derived fuels account for 91 percent of all energy consumed within the transportation sector, and importation of foreign‐sourced petroleum is expected to increase, even under a “low‐import” case.2 Despite the climate and economic risks associated with petroleum dependence, California and the United States have yet to take full advantage of alternative and renewable fuels and advanced vehicle technologies.
Over the past five years, however, California has begun aggressive measures to reduce GHG emissions across all sectors. In 2006, Assembly Bill 32 (AB 32) (Núñez, Chapter 488, Statutes of 2006), the Global Warming Solutions Act of 2006 was signed into law. AB 32 established a goal of reducing 2020 GHG emission reductions to 1990 levels. This followed the issuance of Executive Order S‐3‐05 in 2005, which set a target of reducing GHG emissions 80 percent further by 2050. Governor Jerry Brown has actively supported AB 32, as well as policies to specifically reduce GHG emissions in the transportation sector.3 In November 2010, California voters vetoed Proposition 23, which would have repealed AB 32, further demonstrating the state’s commitment to reducing GHG emissions.
California recognizes the economic consequences of an overdependence on petroleum fuels. While the current recession has resulted in a modest decrease in gasoline and diesel consumption, Californians still consume about 50 million combined gallons of gasoline and diesel each day. As the worldwide economy recovers, and the demand for petroleum‐derived fuels increases, the market price of crude oil is subject to instability. California petroleum fuel price forecasts suggest that the price of gasoline may increase from 35 percent to 50 percent (adjusted for inflation) by 2015, with similar possible increases for diesel.4 Some sectors of the economy are likely to respond to such price increases by reducing their transportation fuel demand; in other sectors, price increases will be met with greater commitments toward alternative fuel and advanced vehicle technologies.
Petroleum dependence also entails an energy security risk. In 2008, foreign supplies of crude oil provided nearly half of the supply for California’s oil refineries.5 The United States was similarly dependent on foreign imports for about half of its petroleum demand, while accounting for approximately 22 percent of worldwide petroleum consumption. At a forum on naval energy, Secretary of the Navy Ray Mabus summarized these concerns, stating, “We have
1 California Energy Commission, 2007 Integrated Energy Policy Report, CEC‐100‐2007‐008‐CMF. 2 California Energy Commission, 2009 Integrated Energy Policy Report, CEC‐100‐2009‐003‐CMF. 3 Jerry Brown 2010, “Environment,” http://www.jerrybrown.org/environment, January 6, 2010. 4 Gordon Schremp, Aniss Bahreinian, and Malachi Weng‐Gutierrez, 2010 Transportation Energy Forecasts and Analyses for the 2009 Integrated Energy Policy Report, California Energy Commission. CEC‐600‐2010‐002‐SF. 5 Ibid.
11

ceded [a strategic resource] to other nations who are allowed to exert disproportionate influence as a result. This creates an obvious vulnerability to our energy security, and to our national security, and to our future on this planet.” Taking these concerns seriously, the U.S. Navy plans to reduce its petroleum use by 50 percent in its commercial fleet by 2015, and to use alternative fuels for half of its total energy consumption for ships, aircrafts, tanks, vehicles, and shore installations by 2020.6
The growth of new fuels and technologies also poses a significant opportunity for economic development in California. While total state employment has grown by 18 percent since 1995, growth in the green jobs sector grew by 56 percent. Employment in clean transportation increased 6 percent from January 2008 to January 2009.7 The potential for growth in these sectors is also visible in the venture capital market. From 2006 to 2009, California attracted more than $6.6 billion in clean technology funding, more than half of national funding.8 In 2009, almost $400 million of venture capital was invested specifically within clean transportation. In the first half of 2010, California attracted 40 percent of the global venture capital in the clean technology sector. As a result of these investments, California has developed a competitive edge in intellectual property in green technology, with nearly 50 percent more green technology patents than the next state.9
Since 2003, California has implemented a number of key policies to reduce GHG emissions, reduce the state’s dependence on petroleum, increase the development and use of alternative and renewable fuels and vehicles, and stimulate in‐state sustainable biofuel production and use (Table 1). Transforming California’s transportation sector to achieve these objectives will require the well‐planned use of state and federal funds to encourage private investment in alternative and renewable fuels and technologies.
.pdf6 Honorable Ray Mabus, Secretary of the Navy, Remarks at the Naval Energy Forum on October 14, 2009, http://www.navy.mil/navydata/people/secnav/Mabus/Speech/Energy_Forum_14Oct09 .
.pdf7 Next 10, Many Shades of Green, http://www.next10.org/next10/publications/pdf/2011_Many_Shades_of_Green_FINAL . 8 Pew Charitable Trusts, The Clean Energy Economy: Repowering Jobs, Businesses and Investments Across America, http://www.pewcenteronthestates.org/uploadedfiles/clean_economy_report_web.pdf. 9 Next 10, 2010 California Green Innovation Index, http://www.next10.org/pdf/GII/Next10_GII_2010.pdf.
12

Table 1: Summary of Key Policies
Objectives Goals and Milestones
Petroleum Reduction10 Reduce petroleum fuel use to 15 percent below 2003 levels by 2020
GHG Reduction11,12 Reduce GHG emissions to 1990 levels by 2020 and 80 percent below 1990 levels by 2050
Alternative and Renewable Fuel Use13 Increase alternative and renewable fuel use to 9 percent of on-road and off-road fuel demand by 2012, 11 percent by 2017, and 26 percent by 2022
In-State Biofuels Production14 Produce in California 20 percent of biofuels used in state by 2010, 40 percent by 2020, and 75 percent by 2050
Source: California Energy Commission
To help achieve these policies, Assembly Bill 118, (Núñez, Chapter 750, Statutes of 2007) created the Alternative and Renewable Fuel and Vehicle Technology Program. The statute, amended by Assembly Bill 109 (Núñez, Chapter 313, Statutes of 2008), authorizes the Energy Commission to develop and deploy alternative and renewable fuels and advanced transportation technologies to help attain the state’s climate change and energy security policies. The Energy Commission is providing incentives to accelerate the development and deployment of clean, efficient, low‐carbon alternative fuels and technologies. The program has an annual program budget of about $100 million for projects that:
• Develop and improve alternative and renewable low‐carbon fuels.
• Reduce California’s use and dependency on petroleum transportation fuels and increase the use of alternative and renewable fuels and advanced vehicle technologies.
• Improve alternative and renewable fuels for existing and developing engine technologies.
• Produce alternative and renewable low‐carbon fuels in California.
• Decrease, on a full‐fuel‐cycle basis, the overall impact and carbon footprint of alternative and renewable fuels and increase sustainability.
• Expand fuel infrastructure, fueling stations, and equipment.
• Improve light‐, medium‐, and heavy‐duty vehicle technologies.
• Retrofit medium‐ and heavy‐duty on‐road and non‐road vehicle fleets.
10 Reducing California’s Petroleum Dependence, California Energy Commission and California Air Resources Board joint agency report, August 2003, publication #P600‐03‐005. 11 Assembly Bill 32 (Núñez, Chapter 488, Statutes of 2006). 12 Executive Order S‐3‐05. 13 State Alternative Fuels Plan, Final Adopted Report, CEC‐600‐2007‐011‐CMF, December 2007. 14 Executive Order S‐6‐06.
13

• Expand infrastructure connected with existing fleets, public transit, and transportation corridors.
• Establish workforce training programs, conduct public education and promotion, and create alternative and renewable fuel and vehicle technology centers.
Statute directs the Energy Commission to prepare an investment plan to determine funding priorities and opportunities and describe how program funding will complement other public and private investments. The Energy Commission adopted its first investment plan combining funds from fiscal year (FY) 2008‐2009 and FY 2009‐2010 at the April 22, 2009, Business Meeting. The statute also requires the Energy Commission to adopt a new investment plan each year. The second investment plan, governing FY 2010‐2011, was adopted at the August 11, 2010, Business Meeting. This Committee Draft 2011‐2012 Investment Plan for the Alternative and Renewable Fuel and Vehicle Technology Program (2011‐2012 Investment Plan) guides funding for FY 2011‐2012.
14

CHAPTER 2: Determining Priorities and Opportunities The Energy Commission’s third investment plan continues to accelerate the development and deployment of clean, efficient low‐carbon technologies that will achieve several key policy objectives: reducing GHG emissions and petroleum dependence, and increasing alternative and renewable fuel use and in‐state biofuels production. Achieving these objectives requires a portfolio of fuels and vehicle technologies including developing electric drive and fuel cell vehicles, producing low‐carbon biofuels, increasing vehicle efficiency, and continuing deployment of natural gas and propane vehicles.
Funding opportunities were evaluated based on the identified needs of a portfolio of fuels and technologies, and reflects a broad set of short‐, medium‐ and long‐term opportunities. To ensure the maximum value for the state’s funding, the plan evaluates existing public and private funding that is already developing and deploying alternative and renewable fuel and vehicle technology and assesses where gaps exist and funding is required. Funding required for workforce training, sustainability studies, standards and certification, public education and outreach, and analytical support was also considered.
This investment plan recognizes the necessity to leverage existing federal, state, and local funding as well as stakeholder investments. Auto manufacturers, utilities, other stakeholders, and federal and local governments are investing in alternative fuel and advanced vehicle technologies. The Energy Commission intends to leverage these investments to accelerate the introduction and use of these fuels and technologies.
Summary of Program Activities The Energy Commission has already begun administering the funding activities called for in the first two investment plans. The program funding is heavily oversubscribed, receiving more than 300 project proposals totaling more than $1.2 billion based on the first investment plan alone. Reductions in both GHG emissions and petroleum use are substantial, and the leveraged amount of public, stakeholder, and venture capital is unprecedented.
Under the first investment plan, the Energy Commission sought to help California entities successfully compete for funding under the federal American Recovery and Reinvestment Act. As a result, the Energy Commission has committed $36.5 million to California projects that were awarded approximately $105.3 million in additional American Recovery and Reinvestment Act funds and include $113.3 million in private funds. These funds are used to:
• Install 2,860 new electric vehicle charging sites.
• Demonstrate and deploy more than 700 medium‐ and heavy‐duty natural gas and hybrid‐electric trucks.
• Develop high‐energy‐density lithium‐ion batteries.
• Provide public outreach to promote the deployment of heavy‐duty natural gas vehicles.
• Establish 75 new E85 fueling stations.
15

The Energy Commission also issued a number of agreements (totaling $20.6 million) for:
• Certifying hydrogen dispensing equipment for retail hydrogen fueling stations and establishment of specifications for hydrogen and biodiesel fuels: $4 million.
• Establishing statewide workforce training and development programs: $15 million.
• Convert state‐owned hybrid vehicles to plug‐in hybrid vehicles: $600,000.
• Technical assistance in administering the Alternative and Renewable Fuel and Vehicle Technology Program: $1 million.
With a significant amount of funding from FY 2008‐2009 and 2009‐2010 remaining, the Energy Commission issued a series of additional solicitations. The Energy Commission evaluated, scored and provided an initial proposed award for each of these solicitations (Table 2). Several solicitations allowed the Energy Commission to increase the amount available to a new specified maximum funding level, referred to as “headroom.” Due to the large number of competitive proposals with passing scores, the Energy Commission provided headroom funding from the same categories identified in the 2010‐11 investment plan.
Table 2: Solicitations and Awards
Fuel Category Funded Activity
Initial Awards (FY 08-09,
09-10) ($ Millions)
Headroom Awards
(FY 10-11) ($ Millions)
Total Award
($ Millions)
Total Number of Projects
American Recovery and Reinvestment
Act
Cost-Sharing for Federal Projects $36.5 - $36.5 9
Electric Drive
Charging Infrastructure $3.2 $2.4 $5.6 7 Medium- and Heavy-Duty Advance Vehicle Demonstrations
$10.0 $2.0 $12.0 8
Manufacturing Facilities and Equipment $19.0 $5.9 $24.9 11
Natural Gas Fueling Infrastructure $5.7 - $5.7 10
Biofuels
Biomethane Production $35.1 $0.2 $35.3 10 Diesel Substitutes Production $2.8 $1.5 $4.3 6
Advanced Ethanol and Gasoline Substitutes Production
$3.5 - $3.5 2
California Ethanol Producers Incentive Program
$6.0 - $6.0 TBD
E-85 Fueling Stations $1.0 - $1.0 1
Upstream Biodiesel Infrastructure $3.9 - $3.9 3
Hydrogen Fueling Stations $15.7 - $15.7 3
Total $105.9 $12.0 $154.4 61 Source: California Energy Commission
16

In April 2011, the Energy Commission issued a $14.5 million incentive program for natural gas and propane vehicles, using funds from both the first investment plan and the second. Additionally, before July 2011, the Energy Commission is preparing future agreements (totaling $10.45 million) using remaining FY 2008‐2009 and 2009‐2010 funds.
• Supporting the Clean Vehicle Rebate Program administered by the Air Resources Board: $2 million
• Expanding funding for zero emission vehicles under the Air Resources Board’s Hybrid Voucher Incentive Program: $2 million
• Woody biomass sustainability research with the U.S. Forest Service: $1.5 million • Use and expansion of the University of California at Irvine’s Spatially & Temporally
Resolved Energy & Environment model: $.75 million • Technical assistance from the National Renewable Energy Laboratory: $1.2 million • Hydrogen transit project: $3 million
The second investment plan had $108 million for project and activity funding, based on estimated vehicle registrations, vessel registrations, identification plates, and smog abatement fees. However, Californians registered fewer vehicles in 2009 than was originally estimated; as a result, only $86.4 million was available for FY 2010‐11. An additional $1.73 million was allocated for project monitoring, verification, and evaluation, leaving $84.67 million for projects. Of this amount, $12 million has been dedicated for headroom awards. Using the remaining funding (and a portion of the remaining funding from the first investment plan), four new solicitations will be issued by July 2011. These solicitations include:
• Regional readiness planning for plug‐in electric vehicles: $1 million.
• Medium‐ and heavy‐duty vehicle demonstration of near‐commercial advanced and alternative fuel technologies: $15 million.
• Propane and natural gas vehicles (as mentioned): $14.5 million.
• Outreach and marketing: $1.5 million.
Additional solicitations and agreements for FY 2010‐11 funding will include:
• Gasoline substitutes infrastructure and fuel production: $9.6 million.
• Diesel substitutes bulk terminal storage/blending and fuel production: $7.1 million.
• Biomethane production and quality testing, and natural gas infrastructure: $6.9 million.
• Hydrogen infrastructure: $10.2 million.
• Other solicitations and agreements, as outlined in the second investment plan.
Some of these funds may be combined with FY 2011‐2012 funding in upcoming solicitations.
17

American Recovery and Reinvestment Act of 2009 President Obama signed the American Recovery and Reinvestment Act (ARRA) into law February 17, 2009, to stimulate the economy, create jobs, and address a variety of critical areas of national concern.15 One of the areas targeted for the economic stimulus was energy.
The initial announcement of federal funding opportunities in March 2009 for alternative and renewable fuels and advanced vehicles immediately preceded the adoption of the Energy Commission’s first investment plan. To help California entities successfully compete for available federal funds, the Energy Commission issued a solicitation (PON‐08‐010) in April 2009 offering $175 million16 of program funds from the first investment plan as a cost share to those who were submitting proposals to the federal government in response to a transportation‐related ARRA funding opportunity announcement.
The Energy Commission reviewed 108 proposals requesting more than $624 million of program funds and $1.815 billion of ARRA funds. Of the 108 applications, 38 percent were applying to the federal Clean Cities solicitation, 35 percent were for transportation electrification, 12 percent for biorefineries, and 10 percent for battery and component manufacturing. The remaining applications were for Transit Investments for Greenhouse Gas and Energy Reduction (TIGGER) and Advanced Research Projects Agency‐Energy (ARPA‐E).
Table 3 shows ARRA funds awarded to date for California alternative and renewable transportation projects with and without program match funds.
15 U.S. Department of Energy. “Recovery and Reinvestment,” http://www.energy.gov/recovery. 16 This amount was later reduced to $156 million. Four million dollars for standards and certification and $15 million for workforce training and development had already been committed for specified entities in the 2008‐2009 Alternative Fuels Investment Plan.
18

Table 3: ARRA Awards With Program Match Funding in California (In Millions)
Program Federal Funds
Available ARRA Awards With Program Match
ARRA Awards w/o Program Match
ARRA Awards
Program Match Funds
Private/ Other Match
ARRA Awards
Transportation Electrification $400 $75.025 $17.070 $53.182 $317
Clean Cities $300 $26.276 $18.450 $59.770 $6
ARPA-E $400 $4.000 $1.000 $0.329 $12
Adv Battery Manufacturing $2,000 $0 $0 $0 $0
Diesel Emission Reduction $300 $0 $0 $0 $27
Applied RDD&D $2,500 $0 $0 $0 $14
TIGGER $100 $0 $0 $0 $18
Integrated Biorefinery $483 $0 $0 $0 $45
Efficient Class 8 Trucks and Adv Tech for LD Vehicles
$115-$240 $0 $0 $0 *18
Algal/Adv Biofuels Consortia $85 *19 $0 *20 $.4
Totals $6,683-6,808 $105.301 $36.52 $113.281 $125.4
Source: California Energy Commission
Air Quality Improvement Program The California Air Resources Board (ARB) is responsible for administering the AB 118 Air Quality Improvement Program (AQIP), which provides up to $50 million per year for grants to fund clean vehicles and equipment, air quality research, and workforce training.21
Both the AQIP and the Energy Commission’s program were established by the same legislation and provide opportunities for complementary funding strategies. For example, unlike the Energy Commission, ARB cannot fund infrastructure for alternative and renewable fuels. The Energy Commission, therefore, is making significant investments in fueling and electric
17 Funding is an estimate of California’s share of multistate projects. 18 A total of $187 million was awarded to major heavy‐duty truck and passenger vehicles companies, and at this time it is unknown how many of the vehicles will come to California. 19 Total award of $44 million nationwide but California portion is not yet available. 20 California portion not yet available. 21 ARB, “AB 118 Air Quality Improvement Program,” http://www.arb.ca.gov/msprog/aqip/aqip.htm and http://www.arb.ca.gov/msprog/aqip/meetings/aqip_workshop_presentation_120809.pdf.
19

charging stations and fuel storage facilities.22 Both agencies can fund vehicle technology development and commercial deployment. The Energy Commission, however, is largely funding the former while ARB is providing incentives for the latter with a focus on electric drive and zero‐emission vehicles. The Energy Commission also provides vehicle deployment incentives but primarily for natural gas and propane vehicles.
As part of the FY 2008‐2009 state budget, the Legislature directed FY 2008‐2009 AQIP funds be used for a new ARB Truck Loan Program to assist truckers affected by the ARB regulations adopted in December 2008: the Statewide In‐Use Truck and Bus Regulation and the Heavy‐Duty Vehicle GHG Emission Reduction Measure. About $35 million is available for this program, which supplements ARBʹs existing grant incentive programs. Loans will be available for the purchase of new or used trucks, diesel emission control devices, and the United States Environmental Protection Agency (U.S. EPA) SmartWay technologies.23 ARBʹs Truck Loan Program is designed to leverage state dollars to maximize funding opportunities and to provide credit access to truckers, so they can take early action in upgrading their fleets. The program was rolled out in the spring of 2010 with loan opportunities for truckers available in the following months.
For FY 2009‐2010 total AQIP funds of about $30 million24 are allocated to hybrid truck and bus vouchers ($20.4 million), zero‐emission and plug‐in hybrid light‐duty vehicle rebates ($4.1 million), lawn and garden equipment replacement ($1.6 million), zero‐emission agricultural utility terrain vehicle rebates ($1.1 million), and advanced technology demonstrations (about $2 million). These amounts were supplemented in the 2010‐2011 funding plan, which was adopted in June 2010. The AQIP 2010‐2011 plan allocates up to a total of $40 million to: hybrid truck and bus vouchers ($25 million); clean vehicle rebate project ($5 million); lawn and garden equipment replacement ($1 million); zero‐emission agricultural utility terrain vehicle rebate project ($0.5 million); off‐road hybrid technology pilot ($3 million for this new project); and advanced demonstration projects ($5.5 million).25
f
22 In compliance with governing statutes and regulations adopted by the ARB, projects funded by the ARB or Energy Commission must complement, and not interfere with, efforts to achieve and maintain air quality standards. Additionally, in compliance with regulations adopted by the ARB, the Energy Commission must provide supplemental evaluations of localized health impacts for any projects requiring permits. These evaluations are to ensure that projects funded by the Energy Commission do not result in disproportionate health impacts to communities with low incomes or minority populations. This information will be posted and available for public review at least 30 calendar days before being presented in a publicly noticed meeting. Health and Safety Code, Chapter 8.9, Section 44271(b), and California Code of Regulations, Chapter 8.1, Sections 2343 (b)(2) and (c)(c)(a). 23 The 2009‐2010 AQIP Funding Plan page 6 explains how FY 2008‐09 funds were directed to the truck loan program. ARB did not develop a funding plan for FY 2008‐09 due to time constraints. The Legislature codified financial assistance for truck loans in HSC Section 44274.7. The original funding amount was $42 M, but based on revenues generated during that fiscal year, only $35 M was available. 24 The ARB approved a funding plan for $42.3 million in April 2009 based on funds appropriated in the FY 2009‐2010 state budget; however ARB expects about $30 million will be available for AQIP projects based on revised revenue projections. 25 ARB, Proposed AB 118 Air Quality Improvement Program Funding Plan for Fiscal Year 2010‐11, http://arb.ca.gov/msprog/aqip/fundplan/AQIP_FP_JUNE%202010‐FINAL.pd
20

The ARB’s funding plan for FY 2011‐2012 is still under development. Assuming a $40 million funding level, the ARB has allocated $15 million to $20 million for its hybrid truck and bus vouchers, $17 million to $25 million for zero‐emission and plug‐in hybrid light‐duty vehicle rebates, and $.5 million to $4 million for advanced technology demonstration and testing. If revenues limit the funding to $28 million, these allocations will range around $10 million to $15 million, $12 million to $17 million, and $.5 million to $2 million, respectively.
Low Carbon Fuel Standard The Low Carbon Fuel Standard (LCFS) was established by Executive Order S‐01‐07 in January 2007, and the ARB adopted standards and protocols on April 23, 2009 . The LCFS establishes carbon intensity standards (in grams of carbon dioxide per megajoule) that fuel producers and importers must meet each year beginning in 2011. The 10‐year LCFS schedule requires a gradual reduction in average carbon intensity for the first several years, beginning January 1, 2011, then steeper reductions, year‐to‐year over the remaining years, concluding with a 10 percent carbon intensity reduction by 2020. The ARB will review the LCFS periodically to update advances in low‐carbon fuels, production technologies, and full fuel cycle assessments.
Zero Emission Vehicle Regulation The Zero Emission Vehicle (ZEV) regulation was adopted in 1990 as part of the ARB’s Low Emission Vehicle Program and has been modified several times since then. It requires large automakers to produce certain percentages of “pure zero” emission and “near‐zero” emission vehicles for sale in California. The goal of the ZEV regulation is to meet California’s air quality goals and has resulted in the introduction of new vehicle technologies in California. As a result of the ZEV regulation, more than 1 million Californians are driving partial zero and advanced technology partial zero‐emission vehicles (PZEV and ATPZEV).
Automakers may comply using a variety of different types of ZEVs. While required to produce a minimum number of pure ZEVs, manufacturers can meet their remaining obligation with a variety of vehicle technology options including PZEVs, ATPZEVs, and Enhanced ATPZEV. ARB is preparing regulatory changes that move the PZEV and ATPZEV categories from the ZEV program to the Low Emission Vehicle and Pavley programs by 2020.26
Zero Emission Bus Regulation The ARB’s Zero Emission Bus (ZEB) regulation was adopted in 2000 as part of the Transit Fleet Rule. It affects only large transit agencies with more than 200 buses and includes a 15 percent fleet ZEB purchase requirement. Ten agencies are affected, with six in Northern California and four in Southern California. Two compliance paths are offered: the diesel path (2011‐2026 time frame for purchase requirement) and the alternative fuel path (2012‐2026 time frame for purchase requirement), which includes fuel cell buses and battery‐operated buses.
20 Assembly Bill 1493 (Pavley, Chapter 200, Statutes of 2002), known as the Pavley Bill, requires ARB to adopt regulations for the reduction of GHG emissions from motor vehicles. More information is available on the ARB’s website: http://www.arb.ca.gov/cc/ccms/ccms.htm.
21

Bioenergy Action Plan In 2006, Executive Order S‐06‐06 established targets for the use and production of biofuels and biopower, and directed state agencies to work together to advance biomass programs in California. The Bioenergy Interagency Working Group is working to meet the goals of the Bioenergy Action Plan27 which include maximizing the contribution of bioenergy toward achieving the state’s petroleum reduction, climate change, renewable energy and environmental goals. The Executive Order established targets to increase the production and use of bioenergy, including ethanol and biodiesel fuels from renewable resources. For biofuels, the state’s goal is to produce a minimum of 20 percent of its biofuels within California by 2010, 40 percent by 2020, and 75 percent by 2050. Regarding the use of biomass for electricity, the goal is for 20 percent of the state’s Renewables Portfolio Standard targets for renewable generation for 2010 and 2020 to be met with biomass resources.28
Renewable Fuel Standard The Energy Policy Act of 2005 established the federal Renewable Fuel Standard (RFS) Program. The United States Congress gave the U.S. EPA the responsibility to coordinate with the United States Department of Energy (U.S. DOE), the United States Department of Agriculture (USDA), and stakeholders to design and implement the RFS program. With passage of the Energy Independence and Security Act (EISA) of 2007, Congress made several important revisions to the RFS.
As of January 1, 2010, the new RFS‐2 increased the total renewable fuel required to be used as transportation fuel from 9 billion gallons in 2008 to 36 billion gallons by 2022. Of the four standards, the cellulosic biofuel requirement grows most significantly at 100 million gallons in 2010 to 16 billion gallons in 2022, 1 billion gallons more than corn‐based ethanol (15 billion gallons that year).29
Certain parties (such as refiners, importers, and blenders) have minimum yearly calculated volumetric blending obligations that gradually rise between 2009 and 2022. Not surprisingly, the RFS‐2 will increase demand for ethanol and biodiesel. Companies can generate Renewable Identification Number (RIN) credits for excess renewable fuel use, which may be purchased or sold for compliance purposes.
National Greenhouse Gas and Corporate Average Fuel Economy Standards On September 15, 2009, the U.S. EPA and the United States Department of Transportation’s (U.S. DOT) National Highway Traffic Safety Administration (NHTSA) proposed a historic
27 O’Neill, Garry, John Nuffer. 2011. 2011 Bioenergy Action Plan. California Energy Commission, Efficiency and Renewables Division. Publication Number: CEC‐300‐2011‐001‐CTF. 28 Staff workshops on the 2011 Bioenergy Action Plan were held in June and December. The 2011 Bioenergy Action Plan was adopted at an Energy Commission Business Meeting on March 23, 2011. 29 The RFS includes four categories including Biomass‐Based Diesel, Cellulosic Biofuel, Total Advanced Biofuel and Total Renewable Fuel. RFS‐eligible corn‐based ethanol is the difference between Total Renewable Fuel and the sum of the other three categories. Source: EPA Table “RFS2: 4 Separate STDS.”
22

national program that would dramatically reduce GHG emissions and improve fuel economy for passenger cars, light‐duty trucks, and medium‐duty passenger vehicles for model years 2012 through 2016.
The combined U.S. EPA and NHTSA standards require these vehicles to meet an estimated combined average emissions level of 250 grams of carbon dioxide (CO2) per mile, equivalent to 35.5 miles per gallon (MPG) if the automobile industry were to meet this CO2 level solely through fuel economy improvements.30 Together, these proposed standards would reduce CO2 emissions by an estimated 950 million metric tons and 1.8 billion barrels of oil over the lifetime of the vehicles sold under the national program (model years 2012‐2016).
Under this proposed national program, automakers will be able to build a single light‐duty national fleet that satisfies all requirements under both the national program and the standards of California and other states, while ensuring that consumers still have a full range of vehicle choices.31 Automakers will also be able to earn, trade, and bank credits if their fleet average is better than the standard for that year. Certain vehicle types, including battery electric vehicles, plug‐in hybrid electric vehicles, fuel cell vehicles, and (for a limited number of model years) flex‐fuel vehicles, will earn additional credits compared to conventional vehicles.
Renewables Portfolio Standard California’s Renewables Portfolio Standard (RPS) was established by Senate Bill 1078 (Sher, Chapter 516, Statutes of 2002), and amended by Senate Bill 107 (Simitian and Perata, Chapter 464, Statutes of 2006) and Senate Bill 1036 (Perata, Chapter 685, Statutes of 2007). It requires electric corporations to increase procurement from eligible renewable energy resources by at least 1 percent of their retail sales annually, until they reach 20 percent by 2010.
On April 12, 2011, Governor Brown signed Senate Bill 1X 2 (Simitian, Chapter 1, Statutes of 2011‐2012 First Extraordinary Session), which established requirements for utilities to meet goals of 25 percent renewable energy by 2016 and 33 percent by 2020.
Clean Air Action Plan On November 20, 2006, the Port of Los Angeles and Port of Long Beach adopted the San Pedro Bay Ports Clean Air Action Plan (CAAP).32 The goal of the CAAP is to reduce port‐related air pollution, including particulate matter, nitrogen oxide, and sulfur oxide, by at least 45 percent by 2012. As part of the CAAP, the ports are implementing a Clean Trucks Program33 (CTP), which aims to reduce heavy‐duty drayage truck‐related air pollution by 80 percent by 2012. Part of the CTP requires the scheduled phase‐out of trucks that do not meet the 2007 federal emission standards. Beginning January 1, 2010, pre‐1994 diesel trucks and certain non‐
ations.htm
30 Air conditioning and tailpipe emissions represent an additional potential CO2 savings of 13.5 percent of fuel economy standards. 31 United States Environmental Protection Agency, “Regulations and Standards,” http://www.epa.gov/oms/climate/regul .
.asp32 Port of Los Angeles, “San Pedro Bay Ports Clean Air Action Plan,” http://www.portoflosangeles.org/environment/caap . 33 Port of Los Angeles, “Clean Truck Program,” http://www.portoflosangeles.org/ctp/idx_ctp.asp.
23

retrofitted 1994‐2003 trucks were banned from use in the ports. About 7,000 drayage trucks in the ports already meet federal emission standards, 1,500 trucks that have received funding were delivered in April 2010, and an additional 500‐600 of the 2004‐2006 trucks will require replacement by 2012.34
Both ports also offer incentives for fleet owners to replace older trucks with newer, cleaner trucks. In particular, the Alternative Fuel Vehicle Funding Program, funded by the ports, the South Coast Air Quality Management District (SCAQMD), and ARB (with Proposition 1B funds), offers $50 million in incentives for the purchase of natural gas trucks for use within either of the ports.
34 Energy Commission staff conversation with Thomas Jelenic, March 24, 2010.
24

Chapter 3: Alternative Fuels and Vehicle Technologies Plug-In Electric Vehicles The initial wave of new generation plug‐in electric vehicles (PEVs) is entering the transportation sector of California, the nation, and the world. Automakers announce their plans almost daily for new electric vehicle models. President Obama recently unveiled new initiatives to make the United States the world’s leader in manufacturing and deploying advanced technology vehicles with specific plans to support PEVs. California regions such as the Bay Area and Southern California have made giant strides in PEV readiness, with grass roots efforts to prepare the way for this new means of transportation. The California PEV Collaborative has organized a broad array of stakeholders to leverage existing efforts and help California lead in the global transition to PEVs.35 The Energy Commission has made more than $18 million in awards to upgrade existing sites and install new charging infrastructure in California over the next two years. The Air Resources Board is funding the Clean Vehicle Rebate Program to provide incentives for consumers as they purchase qualified electric vehicles. The federal tax credit has significantly reduced the upfront cost of electric vehicles. Utilities are designing rates to encourage consumers to charge off‐peak and are working with automakers and infrastructure providers to safeguard the grid. The California Public Utilities Commission (CPUC) has been conducting a rulemaking to consider alternative‐fueled vehicle tariffs, infrastructure, and policies to support GHG reduction goals. Much is being done to address barriers to commercialization, but much more is needed.
The Energy Commission is proposing investments in PEV charging infrastructure to help achieve its goal of petroleum and GHG reduction. Battery electric vehicles (BEVs) are 65 percent to 70 percent lower in full fuel‐cycle emissions than that of conventional vehicles based on California’s present electricity grid.36 As California shifts to an increasingly renewable electricity generation system, PEVs will account for fewer GHG emissions. Full fuel cycle emissions of plug‐in hybrid electric vehicles (PHEVs) and extended range electric vehicles (EREVs) are estimated to be 50 percent lower than conventional gasoline vehicles. This depon the proportion of miles driven in electric mode, which is a function of battery capacity and driver beha
ends
vior.
As the Energy Commission considers the best use of funds to support commercialization of PEVs it must evaluate short‐term, mid‐term, and long‐term PEV deployment in California. The Energy Commission’s policy objectives regarding PEV deployment are to encourage off‐peak charging, reduce on‐peak charging and increase the renewable supply of electricity in California. In the short term (2011 through 2013) , early PEV adopters will continue purchasing Nissan Leafs and Chevrolet Volts as well as newer models to be released in this time frame. Existing tax credits and state incentives available for PEVs and electric vehicle supply
g/members35 California Plug‐in Electric Vehicle Collaborative, “Members,” http://www.evcollaborative.or 36 ARB, “Low Carbon Fuel Standard Program,“ http://www.arb.ca.gov/fuels/lcfs/lcfs.htm
25

equipment (EVSE) purchase or lease present an attractive option to early adopters. These PEV pioneers are willing to purchase a PEV with the understanding that most of their charging will be done at home, with some availability of public or workplace charging. The short‐term rollout of about 4,500 PEV chargers throughout the State and the upgrade of existing chargers provides some “range security” for this nascent PEV market.
In the mid‐term, 2013‐2015, the many unknowns make investment decisions more difficult. How many additional PEV early adopters are willing to pay a premium for new technology? Will PEV prices decline? Will gasoline prices continue upward? Will federal tax incentives continue to be available? Will sufficient funds be available for the ARB’s Clean Vehicle Rebate Program? What will be the charging behavior of new PEV drivers? Will home and workplace charging satisfy the charging requirements of most drivers, or will additional public EVSE be needed? All these uncertainties increase the complexity of making investment decisions to support PEV commercialization. The scale of PEV deployment will soon outstrip government’s ability to provide vehicle buydown incentives. As automakers scale up PEV production, strategies for this mid‐term gap period will be addressed by the Statewide PEV Collaborative and a consortium of state agencies, academic institutions, and local and regional stakeholders.
The long term after 2015 is even less certain. By this time, PEV commercialization will likely have gained momentum, the price of PEVs will likely decline, EVSE availability will satisfy market demand, and government support may taper off. The investments proposed in this investment plan will remove some of the key barriers to successful PEV commercialization. A priority is charging infrastructure for homes, including multifamily dwellings, as well as workplace and fleet charging. Regional PEV readiness will smooth the way for local infrastructure plans and the streamlining of EVSE permitting and inspection processes. Consumers may desire the availability of additional public EVSE to supplement home and workplace EVSE. These investments should encourage off‐peak charging or redyction of on‐peak charging via renewables such as photovoltaic charging. The Energy Commission will continue to support the rollout of PEVs by investing in the strategic deployment of EVSE and related activities, especially during this initial phase.
Electricity Generation Although PEV charging will increase statewide demand for electricity, it is unlikely to require new power plant or transmission line capacity. By 2020, PEVs are expected to increase annual electricity demand on a statewide basis by roughly 4,400 gigawatt‐hours (about 1.4 percent) and peak demand by roughly 190 megawatts (about 0.3 percent). The electricity demand forecast accounts for these minor increases.37 Overall, the introduction of PEVs will not seriously affect statewide electricity generation or transmission.
California’s generation mix in 2020 is expected to have 40 percent lower carbon emissions than in 2008. California’s 2008 electricity grid already has 35 percent lower carbon emissions than the national grid. The RPS requires retail sellers to increase renewable energy as a percentage of their retail sales by 20 percent by 2010 and 33 percent by 2020. The reductions in GHG
37 Kavalec, Chris and Tom Gorin, 2009 California Energy Demand 2010‐2020, Adopted Forecast, California Energy Commission. CEC‐200‐2009‐012‐CMF
26

emissions over time resulting from electricity generation will directly benefit the carbon emission reduction calculations of PEVs, as shown in Figure 1.
Figure 1: GHG Emission Reductions of Electric Vehicles by Electricity Source
Source: ARB, California Energy Commission
Electricity Distribution As more PEVs enter the market, grid impacts may become more apparent at the local distribution level. The “cul‐de‐sac” effect of additional electricity load added to neighborhood distribution lines due to the purchase of PEVs could cause reliability problems and could shorten equipment life. One or two PEVs could be the energy equivalent of adding an additional home to the neighborhood. Utilities can plan for and prepare local distribution infrastructure for PEVs if notified soon enough. Therefore, utilities are working closely with automakers and other stakeholders to ensure timely notification of utilities regarding additions to load due to PEV deployment.
The development of the smart grid will promote high numbers of PEVs and allow them to operate effectively without causing major disruptions on the utility grid.38 Communication between chargers, vehicles, and the utilities will allow customers to take advantage of lower off‐peak charging rates. PEVs could also be used as grid assets and provide ancillary services for
38 The term “smart grid” refers to an electricity transmission and distribution system that is integrated with modern telecommunications.
27

grid operators when parked in facilities where commercial energy service providers can aggregate their loads into a single energy response system.39 The smart grid can also make PEV electricity use billing, wireless monitoring, and data gathering easier. Electric Drive Charging Infrastructure As automakers roll out PEVs over the next year, the widespread availability of charging infrastructure will reduce barriers to commercialization success. Residential chargers for single‐family and multifamily dwellings will be the primary method of charging for most consumers, but workplace, commercial, and public charging will also address the needs of consumers as they adjust to this new technology. Charging sites will also be installed for fleet vehicles and medium‐duty and heavy‐duty electric trucks and transit buses. To promote the deployment of these chargers, California’s regions will need to develop strategic charging infrastructure deployment plans and streamline the EVSE permitting and installation process. In the past several months, progress has been made toward addressing these challenges.
Over the 2011‐2012 period there will be significant investment in California’s charging infrastructure. The federal government’s ARRA funds matched with Energy Commission program funds and other private and public funds are providing PEV charging infrastructure to support the deployment of PEVs in California. Table 4 below summarizes the planned deployment of PEV charging infrastructure in four strategic PEV regions: the nine‐county Bay Area, the San Diego and Los Angeles Regions, and the Sacramento Region.
Table 4: PEV Public Charging Infrastructure Deployment by California Region40
Region Existing Planned
Public/Commercial Stations
Public/Commercial Points41
DC Fast Charge Stations
Battery Switch
S.F. Bay Area 96 916 55 5 Los Angeles 237 972 San Diego 16 1,452 60
Sacramento 56 494 Other 28 3 2 Total 433 3,837 117 5
Source: California Energy Commission and Nissan
In the San Diego and Los Angeles regions, program funds of $8 million and ARRA cost‐share funds of $39.35 million will be used to deploy 2,452 Level 2 chargers and 60 fast‐charging stations in residential and commercial sites. This deployment will support the introduction of 1,000 Nissan Leafs in the near term, and eventually up to 5,000 Leafs. The Energy Commission also recently awarded funds to the SoCal Collaborative for $840,750 to upgrade and install at least 315 upgrades and new EVSE for fleets and public locations throughout the Los Angeles Metropolitan Region.
39 California Energy Commission, 2009 Integrated Energy Report, Final Commission Report, December 2009, CEC‐100‐003‐CMF 40 Based on estimates of known deployments planned through 2013. This may not include all planned chargers. 41 Some of these may be charging stations that have more than one charge point.
28

The program will also fund $3.4 million for Coulomb Technologies with $3.8 million in federal ARRA match share to install and upgrade up to 1,290 Level 2 public chargers in the Bay Area, Sacramento, and the Los Angeles areas. The Association of Bay Area Governments is awarded about $1.5 million with additional local match share to install about 423 charge points, of which 176 are Level 1, 228 are Level 2 chargers and 19 are fast chargers. This award will supplement the Bay Area Air Quality Management District (BAAQMD) two‐phased infrastructure deployment. The first phase is for $1.3 million for 402 EVSE’s, 6 fast chargers and a battery switch station to be installed by the end of 2011. The second phase is a $3.9 million award for 2,750 Level 2 residential chargers (with a $700 incentive per charger) provided by Coulomb (500), Aerovironment (500), Clipper Creek (250) and Ecotality (1,500 as part of the “EV Project”). Also included are 30 corridor fast chargers by mid‐2012. 42 Remaining funds will be used for additional residential or commercial chargers, based on the results of a regional analysis of PEV infrastructure.
The Bay Area’s Metropolitan Transportation Commission will provide additional PEV support with four battery switch stations for taxi cabs, $2.8 million for 90 PEVs and 90 charging stations and $1.7 million to “City Car Share” for the purchase of 29 PEVs, including 12 Nissan Leafs.
In the Sacramento region, 206 chargers will be funded by ARRA funds, Sacramento Municipal Utility District (SMUD) and the EV Sacramento Coalition to demonstrate 34 Volts. Program funds of $.553 million will be used for data collection and analysis. A similar SMUD project will deploy 35 chargers to support the deployment of nine Chrysler PHEV vans and 11 Dodge PHEV pickups.
The Energy Commission is also updating 500 chargers to the Society of Automotive Engineers (SAE) J1772 standard in California with an award of $2.3 million to Clipper Creek, including funds to update the chargers with new utility communication protocols.
In July 2010, the California Plug‐In Vehicle Collaborative, an ad hoc group of high‐level stakeholders, convened to work on a roadmap for the commercialization of PEVs in California. In December 2010, the collaborative, with the UC Davis Institute of Transportation Studies PHEV and BEV Research Center, produced a plan, “Taking Charge—Establishing California Leadership in the Plug‐In Electric Vehicle Marketplace.”43 The plan sets goals, recommendations, and suggested actions to guide the market launch, growth, and takeoff phases of PEV market development. Some of these suggested actions will be addressed in this section. In 2011‐2012, the PEV Collaborative is implementing the recommendations and convening multistakeholder workgroups and meetings.
To support the optimal deployment of PEV recharging infrastructure, the Energy Commission’s (Public Interest Energy Research) PIER Program is funding the development of an online Recharging Network Planning Toolbox. This toolbox will help regional and local planning agencies improve the placement of public, workplace, and direct current (DC) fast chargers
42 Karen Schkolnick, Bay Area Air Quality Management District, February 2, 2011. 43 California Plug‐in Electric Vehicle Collaborative, Taking Charge: Establishing California Leadership in the Plug‐in Electric Vehicle Marketplace, http://www.evcollaborative.org/evcpev123/wp‐content/uploads/2010/07/Taking_Charge_final2.pdf.
29

relative to PEV market demand. In addition, this toolbox will also help assess the effect of future public and DC fast chargers on encouraging PEV sales and use.
In October 2010, the Energy Commission, along with the collaborative, held a joint PEV Charging Infrastructure Workshop.44 The public workshop provided a forum to discuss key PEV infrastructure issues important to the rollout of PEVs in California, including input to the collaborative’s plan and the development of the Energy Commission’s infrastructure guidance document. The key findings from this workshop will be included in the next sections on PEV charging.
Regional PEV Readiness Significant regional planning efforts for PEV infrastructure continue to develop in the key PEV rollout areas such as San Diego, Los Angeles, the San Francisco, Bay Area and the Sacramento region. The Energy Commission is encouraging regional coordination and planning with the release of a $1 million noncompetitive solicitation available to all California regions. This solicitation will allow regional government entities such as metropolitan planning organizations or councils of government to apply for funds to develop regional PEV strategic plans and best practices and guidelines for EVSE deployment, including PEV‐friendly building and public works guidelines, PEV charger installation and permitting processes, consumer awareness programs, and locations for the number and type of EVSE to be deployed. Some regions may lead the way by sharing their guidelines and best practices with other regions that are just beginning to establish PEV strategic plans. Currently, a group called “Ready, Set, Charge California” is drafting Guidelines for Developing an EV Ready Community. 45 This document will be have two versions: one for policy makers and local government, and another suited for a technical audience including engineers, architects, and electricians. These guidelines could be adopted for statewide use and then revised by each California region to meet local needs. As another example, for the EV Project, Ecotality has developed a “Deployment Guidelines” document for EVSE in the San Diego region, and has completed near‐term and long‐term plans to help that region identify optimal locations for future PEV infrastructure deployment.
President Obama recently announced plans to reward communities that invest in PEV infrastructure through competitive grants. This new initiative would provide grants to up to 30 communities that are prioritizing advanced technology vehicle deployment. Statewide regional efforts toward getting communities ready for PEVs will potentially leverage up to $10 million in additional federal funds for each region on the “basis of their ability to demonstrate concrete reforms and use the funds to help catalyze electric vehicle deployment.”46
The permitting, installation, and inspection of residential charging infrastructure need to be seamless. The process will vary for each community and for each installation, but on the whole,
44 Meeting transcript and presentations are available at: http://www.energy.ca.gov/2010‐ALT‐1/documents/index.html. 45 Ready, Set, Charge California!, “Guidelines for Developing an EV Ready Community,” January 26, 2011. 46 White House, “Our Plan to Put One Million Advanced Technology Vehicles on America’s Roads,” http://www.whitehouse.gov/blog/2011/01/26/our‐plan‐put‐one‐million‐advanced‐technology‐vehicles‐america‐s‐roads.
30

it is complex, costly, and protracted. The average residential installation time between ordering and installing charging equipment can be more than four weeks. Although the actual charging panels may take only a few hours to install, the entire process depends on a series of site visits including the utility company, licensed electrician, city permitting office, and city building inspector. Regions are brainstorming to find ways to streamline the process and reduce installation time. It is also important to educate local government jurisdictions that often lack knowledge about the permitting process for PEV charging infrastructure and assist permit and inspection offices facing workforce reductions. The California PEV Collaborative has identified the following actions that can help to streamline the process: 47
• Coordinate among auto dealers, electrical contractors, utilities, and local authorities to minimize red tape.
• Designate local contacts to respond to consumer questions about PEV charging.
• Develop automated inspection reporting executed at the time of inspection.
• Develop clear installation procedures and disseminate widely using the clearinghouse and other mechanisms.
• Develop online applications for local inspections and permitting.
• Establish 24‐hour phone or Internet‐based scheduling for inspections.
• Establish set fees and consolidate inspections.
• Prioritize applications for residential charging equipment in the permit review process.
• Provide customers information about installation incentives, costs, options, and trade‐offs through an information clearinghouse or other mechanisms, such as PEV consultations.
• Seek compliance from nationally recognized testing laboratories (such as Underwriters Laboratory, Inc.) for dual‐meter adapters.
For FY 2011‐2012, the Energy Commission will provide $1 million for projects that will support streamlining of permitting, installation, and inspection of residential charging infrastructure and preparation of infrastructure deployment plans.
Electrical Vehicles Supply Equipment To recharge a PEV, EVSE is needed to safely deliver energy from the electric circuit to the vehicle. A charger converts electricity from alternating current (AC) from the electricity source to DC required for the battery. It also converts the incoming 120 or 240 volt current to 300 or higher volts. PEVs carry an on‐board charger capable of accepting AC current from a Level 1 or 2 charging station. The SAE J1772 connection standard allows for delivery of up to roughly 19 kilowatts (kW) to an on‐board vehicle charger. All known PEV on‐board chargers are expected 47 California Plug‐in Electric Vehicle Collaborative, “Taking Charge: Establishing California Leadership in the Plug‐in Electric Vehicle Marketplace,” http://www.evcollaborative.org/evcpev123/wp‐content/uploads/2010/07/Taking_Charge_final2.pdf
31

to provide at least 3.3 kW charging when connected to a Level 2 charging station. For higher capacity charging, a charging station that delivers DC to the vehicle is incorporated off‐board in the wall or mounted pedestal.48
There are four options that provide various levels of service for recharging a PEV as shown in Table 5.49 Level 1 is provided by a typical household outlet and is best for PEVs with relatively small battery packs, low daily mileage, or limited access to Level 2 charging. Level 1 charging allows PHEVs and small BEVs to charge fully overnight.
Level 2 can reduce the time it takes to recharge a PEV in half but may require the homeowner to upgrade his or her electrical panel to provide a dedicated circuit for PEV charging. A clothes dryer outlet is not recommended for recharging a PEV as it does not have sufficient amperage. The connectors for Level 1 and 2 charging are the same and most PEVs are compatible with both voltage levels.
DC charging (also commonly referred to as “fast charging”) requires a permanent installed charging station that converts three‐phase AC electricity to DC. The North American standard for uniform DC charging is being developed. Some demonstration programs and production PEVs incorporate fast charging at a rate sufficient to charge a 24 kilowatt‐hour (kWh) battery to about 80 percent capacity in about 30 minutes.
Battery switch stations would accommodate the replacement of a discharged battery pack with a fully charged battery pack in within several minutes. Battery switch station deployment would enable third‐party ownership, ease of battery replacement for servicing and use in secondary applications. These stations are being demonstrated by Better Place in various locations around the world, including a taxi cab demonstration project in the Bay Area.
Wireless charging, which enables PEVs to be charged seamlessly without operator interaction, is on the horizon. A SAE taskforce launched in October 2010 hopes to deliver the first J2954 SAE guideline by the end of 2011, to be published in 2012. 50 Charging locations under consideration include residential, on‐road (static and dynamic), with Level 1, 2, and 3 capability—the latter for buses.51 These are described in Table 5.
Most chargers will come with smart components to coordinate the vehicle’s charging and user preferences with the needs of the power grid. Smart chargers will ensure utilities can measure and control charging and improve electricity transmission and distribution.
48 U.S. Environmental Protection Agency National Highway Traffic Safety Administration, and California Air Resources Board, Interim Joint Technical Assessment Report: Light‐Duty Vehicle Greenhouse Gas Emission Standards and Corporate Average Fuel Economy Standards for Model Years 2017‐2025, September 2010. 49 Ibid. 50 Green Car Congress, “SAE taskforce developing standards for wireless charging for plug‐in vehicles; targeting first guideline by end of 2011,” http://www.greencarcongress.com/2011/01/j2954‐20110107.html. 51 Ibid.
32

Table 5: Charging Level Definitions
Level 1 120 volt AC, single phase, 12-16 amps continuous.
Level 2 240 volt AC, single phase, up to 80 amps continuous, typically 12-32 amps.
DC Charging Converts three-phase AC electricity to DC off-board the PEV, delivering up to 250 kW directly to the PEV battery.
Battery Switching An automated process exchanges a depleted battery with a fully charged battery in less time than it takes to refuel at a gas station.
Source: California Energy Commission
EVSE Costs Significant potential exists for EVSE costs to decline over the next several years as competition among EVSE companies increase and as economies of scale result from increased EVSE production. Within the past year, there have been significant cost reductions for home charging stations by some providers, and the downward trend is likely to continue. Recently, for example, Ford announced a partnership with Best Buy to offer a Level 2 charging station for owners of the new Ford Focus BEV for roughly $1,500 for a standard installation—about one third less than competitor’s systems.52
Charging station costs vary depending on the level of service, location, type of station and installation requirements, including electrical upgrading requirements. Estimated costs of charging stations are shown in Table 6.
Table 6: Estimated Costs for Charging Stations
Level Location Equipment Installation
1 Single Residence
$30- $200 (charge cord only, included at no cost to consumer with BEV/PHEV) when an accessible household plug (e.g., in a garage or adjacent to a driveway) with a ground fault interrupter is already available
$400-$1000+ may be necessary depending on difficulty of installing a new circuit at the desired location, but in most cases, owners with sufficient panel capacity would opt for a more capable 220 V AC Level 2 installation instead of a Level 1 dedicated circuit because the additional installation cost is only marginally higher.
2 Residential, Apartment Complex, or Fleet Depot
3.3 kW EVSE (each): $300- $4,000 6.6 kW EVSE (each): $400- $4,000
3.3- 6.6 kW installation cost: $400-$2,300 without wiring/service panel upgrade, or $2,000-$5,000 with panel upgrade.
2 Public $400-$3,800+ for each EVSE $3,000- $7,000+ installation cost, varying significantly with distances from service entrance and number of EVSEs installed.
3 Public $8,000-$50,000 for fast chargers Source: U.S. Environmental Protection Agency National Highway Traffic Safety Administration, and California Air Resources Board, September 2010
52 PR Newswire, “Ford Working With Best Buy to Offer Focus Electric Charging Station Sales, Installation and Support,” 1/10/11.
33

Residential Charging One of the attractions of PEVs compared to internal combustion engine vehicles is the convenience of home charging instead of fueling at a gas station. In the early market, roughly 95 percent of charging will either be at home or at fleet facilities.53 Forty percent of homes are likely to rely on Level 1 charging and 60 percent will likely opt for Level 2 charging.54 Surveys show that consumers strongly prefer home charging and rarely use public chargers.55,56 Most PHEVs can charge from a typical 120 V household outlet (Level 1); however Level 1 charging for a typical BEV, such as a Nissan Leaf for example, would provide only 4 to 5 miles of range per hour of charging. Most consumers would prefer Level 2 charging, which would provide 12 to 15 miles per hour of charging. 57 Charging at Level 2 will require an electrical panel upgrade, adequate wiring to the charging location, EVSE equipment, and city and county permits for any electrical or land use changes. A large percentage of homes will require the installation of a 220/240 V plug in their garages or parking shelters. This installation is an additional cost that will extend the payback period for PEVs.
Several automakers are teaming up with charging infrastructure companies as their PEVs roll‐out. General Motors (GM) is partnering with SBX to provide Volt customers with Level 2 chargers and one‐stop shopping, setting up permits, providing rebates, and sending out the electrical contractor. The charger cost is $490 (with installation costs about $1,500) and takes four to six hours to install. Nissan is partnering with ECOtality in the San Diego and Los Angeles regions to provide home installation of Level 2 chargers as part of its initial rollout. Mitsubishi will partner with Eaton and Best Buy to sell and install Level 2 home charging stations. The Best Buy “Geek Squad” will handle the consultation and installation for the charging units, including coordination with third‐party licenses electrical contractors, if needed.
The broad consensus is that residential charging is the highest priority for deployment because consumers like the convenience and it encourages charging during periods of off‐peak electrical demand.58 The Energy Commission will consider providing PEV consumers with incentives to help defray the cost of home EVSE.
Many utilities are developing time‐of‐use rates for PEV consumers to encourage off‐peak electricity usage. San Diego Gas & Electric (SDG&E) is conducting a time‐of‐use rate demonstration project for the Volt in coordination with the Nissan‐ECOtality project that will
53 ICF International Draft Report, “Technical Analysis for Alternative and Renewable Fuel and Vehicle Technology Program,” September 2010. 54 Summary of Southern California Edison Comments on the CPUC Order Instituting Rulemaking to Consider Alternative‐Fueled Vehicle Tariffs, Infrastructure and Policies to Support California’s Greenhouse Gas Emissions Reduction Goals, Morton Blatt, December 2009 55 Characterizing Consumers’ Interest in and Infrastructure Expectations for Electric Vehicles: Research Design and Survey Results. EPRI, Palo Alto, CA, and Southern California Edison, Rosemead, CA: 2010. 56 BMW, Presentation by Andreas Klugescheid given at the October 19, 2010, Joint Energy Commission and PEV Collaborative PEV Infrastructure Workshop. 57 Electrification Roadmap, Revolutionizing Transportation and Achieving Energy Security, Electrification Coalition, November 2009. 58 October 19, 2010, Joint Energy Commission Staff and Statewide PEV Collaborative PEV Infrastructure Joint Workshop, Residential Panel discussion.
34

analyze the electricity price elasticity of demand for PEV charging. The three time‐of‐use rates offered will have a ratio of on‐peak to off‐peak rates of two, four, and six‐to‐one compared to the current two‐to‐one ratio.59
Electricity rates can encourage vehicle owners to charge their vehicles at times that best protect grid safety, reliability, and efficiency. Most California utilities already have some rate structures in place that encourage off‐peak charging. The CPUC Alternative‐Fueled Vehicle Rulemaking proposed decision of March 15, 2011, has addressed many of the rate and tariff policies to encourage further off‐peak charging and to manage the transmission and distribution impacts of PEV loads. Utilities, regulators, local governments, and consumer representatives are collaborating to develop and demonstrate pricing options, including time‐of‐use rate structures that convey the supply and demand balance of electricity. Sharing and clearly communicating pricing information with consumers can reward them with low‐cost electricity for off‐peak charging.60 Many California utilities already have rate structures in place that are intended to encourage off‐peak charging. These may be modified as data is collected and based on the CPUC rulemaking. They will vary depending on utility‐specific factors including rate structure, type of charging in a service territory, measurement options, and consumer acceptance. Presently, many California utility customers have the option of selecting a “whole‐house” time‐of‐use rate that bundles the vehicle charging with the home and offers a very low super off‐peak rate (balanced by higher on‐peak rates). Another common rate available to PEV customers measures vehicle usage separately from the home and, similarly, provides a favorable off‐peak rate. Some specific examples for utilities include:
• Los Angeles Department of Water and Power has two options for PEV owners. The first would require a separate meter for the PEV and the customer receives a discount on off‐peak electricity of $0.025/kWh. The second allows the customer to sign up for a time‐of‐use rate for the entire home, and that home would receive a discount on off‐peak electricity of $0.025. In both cases the discount saves PEV customers about 10 percent if they charge their PEV off‐peak.
• Within Pacific Gas and Electric (PG&E), PEV owners can sign up for time‐of‐use rates that discount off‐peak electricity $0.035‐$0.05/kWh relative to partial peak and as much as $0.23/kWh relative to on‐peak. This rate structure saves PEV customers from 35 percent to as much as 80 percent if they charge their PEV off‐peak.
Work still needs to be done to determine how rates influence customer behavior and should be structured; different rate strategies may be preferred depending upon type of charging and location, the technologies available for measurement and load control, and consumer acceptance. Overall, the utilities’ objective is that rates encourage customers to charge their vehicles during off‐peak hours of the day. 61 The recent CPUC proposed rulemaking concluded that the existing PEV residential rate schedules are sufficient for the early PEV market, until about 2013. To encourage off‐peak charging, however, the CPUC finds that PEV residential
59 Joel Pointon, Presentation at the U.C. Davis Institute for Transportation Studies STEPS Conference, January 19, 2011. 60 Eileen Tutt, California Electric Transportation Coalition, response to staff inquiry 1/17/11. 61 Ibid.
35

rates should be opt‐in, non‐tiered, and time‐of‐use for separately metered PEV customers.62 The PIER Program has tasked the Plug‐in Hybrid and Electric Vehicle (PH&EV) Research Center to study the effectiveness of a variety of special time‐of‐use rates, smart meters, vehicle interfaces and other devices designed to encourage charging at off‐peak hours.
Smart charging, which facilitates the timing of the vehicle’s charging, is a critical component of home charging since it could actually occur on‐peak during the early evening hours. A smart charger would ensure that charging occurs during the later off‐peak hours.63 The type of metering required for various functionalities including smart charging will be decided in the second phase of the CPUC’s Alternative Fuel Rulemaking. A recent decision stated that customer choice should be promoted with regard to meter policy. The CPUC Staff paper regarding the utility role in PEV charging recommends that, in the next 12‐36 month period, utilities should encourage single‐family residential customers to use a single meter arrangement for PEVs to avoid the possible stranded costs of a separate meter. This will more easily promote the early adoption of PEVs in the market. Secondly, utilities should enact a protocol to establish a system that informs the utility of when a customer purchases a PEV without violating personal privacy issues. In the longer term, utilities should propose tariffs that support single, sub‐, and separate metering options with minimum metering requirements.64
In dense urban areas and population centers, not every household will have access to a dedicated parking space. This is particularly challenging in California because consumers in areas such as San Francisco and Los Angeles are likely to adopt PEVs faster than consumers in other areas. While in California up to half of residents do not own a home, in the San Francisco area, about 80 percent of the population does not have access to a garage.65 About half of new car buyers have a place to charge overnight within 25 feet of an outlet. In situations where dedicated parking is not available, consumers need a way to charge. The multidwelling unit (MDU) situation is complex, and therefore solutions must be diverse.
One consideration with MDUs is that the apartment or condominium owner must be involved in any siting decisions. While the PEV consumer will prefer a charging site close to the consumer’s home, the MDU owner may have other things to consider such as lighting and vandalism concerns, flooding or drainage conditions, and payment methods.66 Homeowner associations must be consulted in some cases as well. SDG&E and SMUD have developed a general process for addressing the MDU charging situation that involves coordination with landowners, MDU owners, homeowners’ associations, and the consumers. The city of San Francisco is identifying MDUs and evaluating ways to provide EVSE, including possible nearby
62 California Public Utilities Commission, Proposed Decision of Commissioner Peevey, Rulemaking 09‐08‐009 Phase 2, March 15, 2011. 63 Ibid. 64 CPUC, “The Utility Role in Supporting Plug‐In Electric Vehicle Charging” Staff Issues Paper, August 30, 2010. 65 October 19, 2010, Joint Energy Commission Staff and Statewide PEV Collaborative PEV Infrastructure Joint Workshop, Residential Panel discussion. 66 Electric Transportation Engineering Corporation, Electric Vehicle Charging Infrastructure Deployment Guidelines for Greater San Diego Area, May 2010.
36

parking sites or car share companies.67 Fast chargers are also being located at commercial sites in San Francisco and can be used by nearby MDU tenants. Since all MDUs have 120 volt service, there is no need for separate service drops to the PEV charging station for this application, but new lines, conduit, and plugs will connect to the station from circuit breaker(s).68
To support MDU charging, the Energy Commission will consider grants to provide MDU charging infrastructure and demonstration projects to help solve this complex issue.
Workplace and Fleet Charging After home charging, workplace and fleet charging are the second highest funding priority for PEV infrastructure deployment. Consumers are likely to take advantage of the convenience of workplace charging, especially if they do not have access to home charging. Workplace charging can also offer off‐peak and “shoulder” (between on‐and off‐peak) charging during the morning hours, thereby avoiding on‐peak charging.69 Employers will likely require some level of charging fee, since the Internal Revenue Service is likely to tax free charging as an employee benefit. Employers gain from having PEV charging available because it can contribute to their Leadership in Energy and Environmental Design certification, satisfy employee demand for “green” transportation options, and enhance the company’s environmentally conscious (green) image.70 Most companies view charging as a “facilities” decision and are willing to invest in them as employee parking lots are developed rather than retrofit at a higher cost later on. One example of workplace charging is at SAP’s Palo Alto campus where the software company is installing 16 charging stations in its parking lot and purchasing 25 PEVs, of which 20 will be leased to employees.71 Other companies such as Google and Dell offer charging for PEVs powered by solar arrays, an even more attractive zero‐emissions option for employees. Workplace charging can be encouraged by education and outreach to companies and made easier by employee surveys on transportation needs and preferences. In the Bay Area, for example, the Business Council on Climate Change published Electrify Your Business, a Bay Area Business Guide to help Bay Area businesses create their own PEV programs.72 Fleets are an excellent fit for the purchase of PEVs, and many companies with fleets are investing in PEVs and providing charging infrastructure. Fleet vehicles typically charge in the off‐peak hours and travel a regular route. Fleet managers also make purchasing decisions by evaluating total vehicle lifetime costs including maintenance, which is exceptionally low for
1
67 Conversation with Bob Hayden, Department of the Environment, San Francisco, January 7, 2011. 68 Plug‐In Electric Vehicle Infrastructure Installation Guidelines Volume 1: Multi‐Family Dwellings, S Chhaya, S., and M Alexander, EPRI 1017682, September 2009. 69 October 19, 2010 Joint Energy Commission Staff and Statewide PEV Collaborative PEV Infrastructure Joint Workshop, Workplace and Fleets Panel discussion. San Diego Gas & Electric Company has an off‐peak electric vehicle time‐of‐use rate from 5:00 a.m. to noon. 70 LEED certification for commercial building owners provides a competitive edge, mitigates risk and attracts tenants. Additional information is available at: http://www.usgbc.org/DisplayPage.aspx?CMSPageID=233 . 71 San Jose Mercury News, “Workplace Charging Stations for Electric Vehicles are the Latest Silicon Valley Perk”, December 9, 2010, http://www.mercurynews.com/business/ci_16809939?nclick_check=1. 72 Business Council on Climate Change and the Bay Area Council, Michael Calise, April 6, 2011. http://www.bc3sfbay.org/uploads/5/3/3/9/5339154/electrify_your_business.pdf.
37

PEVs. A recent study shows that light‐duty PEVs, Class 2‐3 trucks in particular such as parcel delivery vans and shuttle buses, will offer the best opportunity for near‐term growth in the United States commercial fleet sector.73 General Electric recently committed to purchasing 25, 000 PEVs through 2015 for its Capital Fleet Services global sales force. It also has an agreement with Nissan and Better Place to develop smart grid electricity infrastructure for PEV charging and will deploy its Level 2 GE WattStation for commercial and home use.74 Some car rental companies are actively pursuing the installation of charging infrastructure in locations such as airports for a portion of their fleets in California.
To encourage workplace and fleet charging, the Energy Commission will consider grants to support charging infrastructure (with emphasis on battery storage and renewable charging) and outreach to business and fleet owners.
Commercial, Public, and Fast Charging The deployment of commercial and public charging stations over the next several years will provide a level of range assurance to new PEV drivers and could reduce barriers to PEV adoption. Public charging is more important for BEVs as opposed to PHEVs or EREVs such as the Volt. Although most customers will charge at home, they must be assured of readily available chargers within their driving radius and near destinations that extend beyond their vehicle’s driving range. As data on public charging infrastructure is collected over the next few years, consumers’ behavior and charging requirements will become much better understood. The development of public charging stations should proceed under the guidance of a regional plan with regional partners developing network plans that are data driven.75
The ratio of chargers per PEV (for home and public) needed varies from 0.6 to 3.5.76 The CPUC estimates that one home charging and 0.2 public charging capacity is needed for each vehicle. Nissan, Ford, GM, and Chrysler similarly estimate that there is need for one home charger and 0.3 public chargers per vehicle. These ratios are highly speculative, and more analysis is needed to understand consumer behavior and charging patterns.
Government support of the initial rollout of PEV public charging infrastructure is necessary to support PEV commercialization until there are sufficient volumes of PEVs to provide a business case for infrastructure providers. Some studies, such as the Tokyo Electric Power Company study in Japan showed that public or workplace opportunistic charging provided consumers with capacity (or the ability to charge) rather than actual electricity fuel usage. Consumers,
73 Frost & Sullivan, Strategic Analysis of the North American and European Electric Truck, Van and Bus Markets, May 24, 2010. As reported in Fleet Owner, “Study Forecasts Electric Truck Growth by Weight Classes,” January 4, 2011. 74 Fleets & Fuels, December 20, 2010. 75 Staff conversation with Tom Turrentine, U.C. Davis PHEV/BEV Research Center, April 2011. 76 Based on input at the Joint Energy Commission Staff and Statewide PEV Collaborative PEV Infrastructure Joint Workshop, October 19, 2010. Estimates of this ratio included the following: Electrification Coalition indicates 1.5‐3.5 per vehicles through 2015, and .5‐1.5 after 2030; RMI indicates 0.6 per vehicle; Bay Area Corridor indicates 0.1‐0.2 per vehicle; CPUC indicates 0.2 per vehicle.
38

therefore, used a greater portion of their battery storage capacity knowing that chargers were available if needed.77
It is generally agreed that charging levels should be matched to the purpose of the consumer’s destination.78 For example, airport parking garages may do well with Level 1 charging given the longer periods of parking at airports. Level 2 chargers are appropriate for destinations suchas theaters, stores, and coffee shops where vehicles may park for several hours. It is important to maximize the public benefit by leveraging the location of chargers and considering the breadth of benefit.
ing.80
ion
79 In Sonoma County, charging sites are often multiuse with overlap betweenhome, workplace, and fleet charg
Public charging will, however, increase the demand for “on‐peak” electricity in most cases. Smart charging will help coordinate the vehicle’s charging and user preferences with the needs of the power grid. Users may receive a lower rate for charging if the utility is allowed to control the timing of the charging to maximize grid benefits.81 Grid impacts can also be reduced by offsetting the increased demand for electricity by improving local efficiency and/or installing photovoltaic systems. The University California at San Diego’s Zero Emission Vehicle Project, with $2.5 million from the Energy Commission and additional U.S. DOE funds, is diverting a portion of its solar and biogas resources to charge a fleet of about 50 new PEVs.82 This study will establish the technical feasibility of using renewable energy to electrify the transportatsector. The Electric Power Research Institute (EPRI), Tennessee Valley Authority and Oak Ridge National Laboratory are testing a solar assisted PEV charging station that uses a battery storage system to assess the effect on reliability, analyze EVSE, and test advance metering infrastructure. Envision Solar International, Inc. is installing PEV charging‐enabled solar tracking trees at Axion Power International in Pennsylvania.83 Envision will provide a solar array that incorporates solar tracking into the canopy structure of its parking array. Colocation of battery storage with public and workplace EVSE is also an effective way to reduce on‐peak charging. All these developments can help solve the problem of “on‐peak” PEV charging. The Energy Commission will consider how to encourage further development of renewable PEV charging infrastructure.
77 Tokyo Electric Power Company, “Desirable characteristics of public quick charger,” http://www.emc‐mec.ca/phev/Presentations_en/S12/PHEV09‐S12‐3_TakafumiAnegawa.pdf. 78 Joint Energy Commission Staff and Statewide PEV Collaborative PEV Infrastructure Joint Workshop, Public Charging Panel, October 19, 2010. 79 Ibid. 80 Joint Energy Commission Staff and Statewide PEV Collaborative PEV Infrastructure Joint Workshop, Workplace Charging Panel, October 19, 2010. 81 For more information on metering issues, see the CPUC’s Alternative Fuel Vehicle Proceeding (R.09‐08‐009) at: http://www.cpuc.ca.gov/PUC/hottopics/1Energy/090814_ev.htm. 82 UC San Diego, The Endgame: Charging of Electric Vehicles with Secure, Domestic, Renewable Energy Resources. 83 Envision Solar, “Envision Solar Commences EnvisionTrak™ and CleanCharge™ Solar Tree® Installations for Axiom Power International,” September 30, 2010, http://www.marketwire.com/press‐release/Envision‐Solar‐Commences‐EnvisionTrak‐CleanCharge‐Solar‐Tree‐Installations‐Axion‐Power‐1327606.htm
39

Business models for commercial charging have been evolving as PEVs roll out and the need for charging infrastructure develops. There are some concerns regarding to the long‐term economic viability of public charging including the inclusion of maintenance and electricity costs. Various business models are emerging that could support future development of PEV infrastructure without government support. One company, NRG Energy Inc., will be creating a network of public charging stations in Houston, Texas. The company hopes to expand in the other 13 states that have deregulated electricity markets and will likely use a subscription model to cover the fixed costs of the network.84 Another company, CCGI, plans to bill customers 50 cents per kWh for public charging, about four times what consumers pay at home for electricity.85 Ecotality plans to generate revenue from hardware and equipment sales, monthly subscription fees from consumers and fleet owners, advertising at the charging stations, and grid services to utilities.86 Subscription fees will likely be in the range of $5 to $10 per month and will ensure a revenue stream for infrastructure providers and charging availability “insurance” for consumers. Some retailers will offer free charging to draw consumers to their stores. Larger companies are entering the market, including General Electric, Schneider Electric, and Siemens, all of which have significant economies of scale regarding equipment sales.
In the absence of a business model, it is likely that public charging infrastructure will require substantial government investment. As viable business models emerge, the need for government support will diminish, and the expansion of the PEV charging network will be market driven.
In January 2011, the Energy Commission with the California Air Resources Board conducted an alternative fuels automaker survey. The survey was sent to 26 automakers, 20 of whom responded. Since the individual results are confidential, the data was aggregated for each year. Tables 7 and 8 provide the survey results for BEV and PHEV rollouts through 2015 in specified regions of California. The data provided is not sufficient for detecting trends, since automaker response rates were inconsistent for each year. For example, some provided data for only two years, and only one provided data for all five years. Only nine automakers provided vehicle production plans for BEVs and six for PHEVs, so the yearly results are underestimates. No single automaker showed a decline in production from one year to the next, despite the appearance of the data. These production numbers represent a minimum rollout.
free/
84 The Wall Street Journal, “Houston to Get Charging Stations”, November 19, 2010. 85 BNET, “Public EV Charging: Expect to Pay $3.50 an Hour for the Convenience”, Jim Motavalli, December 8, 2010 86 Greentech Media, “Will EV Charging Stations be Free?” December 14, 2010, http://www.greentechmedia.com/articles/read/will‐ev‐charging‐stations‐be‐
40

Table 7: BEV Deployments by Year and Region
2011 2012 2013 2014 2015 Survey Responses 5 6 7 6 4
Bay Area 1,738 3,796 2,263 1,580 2,607 Northern Calif. 207 585 540 546 1,266 Central Valley 66 370 491 497 527 Central Coast 99 311 215 215 451 Los Angeles 1,575 3,702 3,288 2,555 2,882 San Diego 2,421 1,449 778 384 1,039 Not specified 3,000 3,450 3,600 3,000 Total 6,106 13,213 11,025 9,377 11,772
Source: ARB, California Energy Commission.
Table 8: PHEV Deployments by Year and Region
2011 2012 2013 2014 2015 Survey Responses 2 2 2 3 4
Bay Area 60 Northern Calif. 9 Central Valley 6 Central Coast 8 Los Angeles 5 198 San Diego 15 Not specified 1,200 9,583 12,013 6,241 6,879 Total 1,205 9,583 12,013 6,241 7,175
Source: ARB, California Energy Commission
As Tables 7 and 8 indicate, PEVs will continue to populate the San Francisco Bay Area, Los Angeles and San Diego areas as expected, with some PEVs in new areas such as the Central Valley and Central Coast regions. The latter regions areas have fewer EVSE units available than the higher density areas such as San Diego, Los Angeles, and the San Francisco Bay Area, but will still require adequate charging infrastructure.
To accommodate likely PEV sales in the Central Valley, Central Coast, and Northern California regions, the Energy Commission will consider funding a minimum level of public, workplace, and fleet EVSE in strategic locations to support the PEV rollout. The Energy Commission is evaluating DC fast charging deployment in cities, metropolitan regions and highway corridors. It is examining the potential to develop PEV public charging corridors on Interstate 5 and other California highways to expand the driving range of BEVs. PHEV and EREV drivers may also choose to maximize their electricity use on longer trips. The effectiveness of DC fast charging will be studied as data from planned DC fast chargers becomes available.
The availability of fast chargers will increase consumer convenience by reducing the recharge time. Fast chargers have an additional benefit in that widespread deployment would allow automakers the ability to design PEVs that have a lighter, lower cost battery pack designed for
41

daily commute.87 The ECOtality Blink 480 volt PEV charger is capable of fully recharging a BEV, such as the Nissan Leaf, in 15 to 28 minutes. ECOtality is partnering with Best Buy to install 12 Blink chargers in its parking lots, and with BP and Arco to install fast chargers at 45 gas stations.88 ECOtality will install 60 fast chargers in the San Diego and Los Angeles regions with a grant from the U.S. DOE and the California Energy Commission.
In the Bay Area, the Association of Bay Area Governments is partnering with 350Green (through its Energy Commission award) to install up to 19 fast chargers. They are using an Epyon fast charger Level 2 system that allows expansion for up to four charger bollards per one base power unit. Each bollard can accommodate twin fast‐charge connectors or a dual Level 2 fast charge configuration89. The system can also allocate reduced voltage to vehicles and improve power flow, depending on the number of vehicles requiring recharging. 350Green is also partnering with the BAAQMD to install six fast chargers at Safeway shopping centers. BAAQMD is also deploying 30 fast chargers in the Bay Area corridor for extended range by local PEV drivers and destination charging for visitors or those passing through. Table 9 summarizes the known planned deployment of 115 fast chargers in California through 2012.
Table 9: Planned Deployment of Fast Chargers in California
Area Installer Partner Number
San Diego and Los Angeles ECOtality-Blink DOE/Energy Commission 60
Bay Area 350Green-Epyon ABAG 19
Bay Area 350Green BAAQMD 6
Bay Area ECOtality/Aerovironment BAAQMD 30
Total 115 Source: California Energy Commission
Fast chargers are being deployed in California in the major PEV regions—in cities and near urban area connectors, as well as a few on highway corridors in Southern California and the San Francisco Bay Area. The first priority for fast charger location is at the city level, which can support consumers in MDUs. 90From there, the priority extends to connecting urban corridors 100 miles apart or less.91 The “West Coast Green Highway” is a three‐state initiative involving Washington, Oregon and California that could eventually result in a seamless recharging network along the 1,350 miles of Interstate 5 (I‐5).92 The majority of ECOtality’s fast chargers in the EV Project will be installed along Interstate 5 connecting Vancouver, Canada, to the Mexican
87 Presentation by David Patterson, Mistubishi Motors, at California Environmental Dialogue Meeting, November, 30, 2010. 88 Los Angeles Times, “BP, Arco, Best Buy to install fast chargers for electric cars”, October 13, 2010. 89 Richard Schorske, January 20, 2011. 90 October 19, 2010, Joint Energy Commission Staff and Statewide PEV Collaborative PEV Infrastructure Joint Workshop, Corridor Charging Panel discussion. 91 Ibid. 92 Automotive News, “Range Anxiety? Not on this Highway”, December 6, 2010.
42

border. The states of Washington and Oregon are planning to install fast chargers between major regional centers and recreational destinations partly funded by the EV Project.
A recent study by the PH&EV Research Center briefly examined establishing a string of Level 2 and DC fast chargers along two corridors: Interstate 5 (I‐5) and California Highway 99 (SR‐99) between Sacramento and Bakersfield. Based on the performance of the Nissan Leaf, the findings showed that it takes about 6.5 hours for the BEV and 4 hours for the internal combustion engine driver to travel from Bakersfield to Sacramento at 70 miles per hour (mph). Charging time adds about 2.5 to 3 hours more for the BEV driver than the ICE driver at all speeds with between 4 to 8 stops depending on speed.93 The study concludes that BEV drivers will not choose to drive this distance in a single day due to the number of stops required. Also Nissan does not recommend DC fast charging more than once per day due to wear and tear on the battery. Therefore, the use of such a corridor is not likely until BEVs have a much greater range. The study also concluded that SR‐99 would have more local travel demand than I‐5 based on travel distances and population and would be a more practical location for fast chargers than I‐5. The routes from Sacramento to Stockton and Fresno to Bakersfield on those sections of SR‐99 could be candidates for fast chargers. Further analysis and planning regarding fast charging on these corridors are needed to take into consideration the numbers of vehicles and corridor use under various market growth scenarios.
The Energy Commission will consider funding a corridor planning initiative to provide an optimal framework to guide DC fast charge deployment and future investment for these corridors. The Energy Commission may also fund fast chargers in strategic locations based on research and data gathered over the next several months.
Signs are important for alerting PEV drivers to recharge sites. Standards and best practices for signage need to be funded and developed for effective deployment of charging infrastructure. The Bay Area Ready, Set, Charge California! group is incorporating this into its local government PEV readiness plan. The Energy Commission proposes supporting signage along within regions and along highway corridors, possibly through an interagency agreement with the California Department of Transportation (Caltrans).
Americans with Disabilities Act (ADA) compliance for PEV charging is an issue that needs further clarification. The State of California’s Division of the State Architect has issued “Interim Disabled Access Guidelines for Electric Vehicle Charging Stations” (Policy #97‐03). PEV charging stations are required to be accessible because they offer a service to the public. When PEV charging is coupled with regular parking, the PEV charging is considered the primary service. If there are up to 25 chargers at a site, then one accessible charger space is required. Accessible charging spaces are not reserved exclusively for people with disabilities. If there are only three parking spots, one of them must be ADA‐compliant, although in San Francisco, for example, chargers are allowed to adjoin an ADA‐compliant parking site. Many communities are attempting to clarify the requirements for ADA‐compliant PEV parking, and in many cases the
93 “A Brief Analysis of Potential EV Corridors for the Energy Commission”, Tom Turrentine, Gil Tal and Mike Nicholas, April 2011. Assumptions: 1. A full charge of the Leaf offers 73 miles of range, 2.A DC fast charge of the Leaf offers 80% of 73 miles in 25 minutes, and 3. Energy consumption per mile is 240W/h at 55 mph and up to 430 W/h at 80 mph.
43

requirements are unclear. To avoid litigation, communities are using more resources to ensure the highest possible standards. The Energy Commission supports further clarification of these ADA standards in the State Building Code Sections of Chapter 11 B and 11 C.
Table 10: PEV Infrastructure Funding Summary for FY 2011-2012
PEV Regional Readiness $1 million
Charging Infrastructure and Related Activities $7 million
Total $ 8 million
Source: California Energy Commission
Light-Duty PEVs In the past several months, a new generation of PEVs has entered the California light‐duty vehicle market. The Nissan Leaf, a BEV with a 100 mile94 range and a 24 kWh battery, is expected to be purchased by several thousand Californians over the next year or two. The GM Chevy Volt, an extended‐range plug‐in electric vehicle, with a 40 mile all‐electric range and on‐board gasoline generator, is starting to rollout in California. The Tesla Roadster, a BEV with a 245 mile range and 53 kWh battery, has sales of more than 1,500 worldwide, and over 160 in California.95 In 2011, planned BEVs include the BMW ActiveE, Ford Focus, Mistubishi “I”, BYD e6, and Coda Sedan. PHEVs planned for 2011 include the Toyota Prius Plug‐in Hybrid, Fisker Karma, and BYD F3DM. Virtually all manufacturers are planning for greater electrification of their fleet.
There are many forecasts of PEV market penetration in California through 2020 ranging from less than 3 percent of sales to nearly 14 percent of California vehicle sales.96 The California PEV Collaborative, in one scenario, estimates annual sales of 250,000 PEVs (representing 14.7 percent of projected total annual light‐duty vehicle sales) during the “market launch” phase in 2020.97 The collaborative also estimates a range of 2 percent to 4 percent PEV market share out of a total California light‐duty vehicle market of 25 million vehicles. New PEV sales will depend on many variables including the success of the initial PEV rollout, future gasoline prices, reduction in battery cost and infrastructure availability. Replacing the existing vehicle fleet takes several decades. For example, conventional hybrid vehicles took 10 years to reach 5.9 percent of new vehicle sales and has reached 1.4 percent penetration into California’s fleet.98 99
Automakers will continue to pursue the development of PEV technology due to adopted federal Corporate Average Fuel Economy (CAFE) standards and California Pavley‐GHG regulations, securing the benefits of high efficiency, reduced GHG and other criteria emissions, attractive vehicle attributes, and fuel diversity. In addition, the ZEV mandate requires large automakers to produce certain percentages of “pure zero” emission and “near‐zero” emission
94 US EPA LA4 city cycle conducted in laboratory tests. 95 California Energy Commission, DMV Analysis of 2009 File Pass. 96 “Taking Charge: Establishing California Leadership in the Plug‐in Electric Vehicle Marketplace”, California PEV Collaborative, page 12. 97 Ibid, page 29. 98 Ibid. 99 California Energy Commission, DMV Analysis of 2009 File Pass, with the Total Fuel Use Analysis.
44

vehicles for sales in California to meet California’s air quality goals. ARB staff is working on regulatory adjustments to focus on PHEVs and pure BEVs in order to incubate these technologies for large‐scale market penetration. Traditionally, the ZEV regulation has been based on reducing criteria pollutant emissions. Based on a December 2009 hearing the ARB staff has begun regulatory development and will release proposed modifications to the ZEV regulation in fall 2011.100
These modifications may include the following:
• Closer alignment of the ZEV regulation requirements with the state’s long term air quality and GHG emission reduction goals, specifically for model years 2018 and beyond.
• A renewed and simplified focus on precommercial development vehicle technologies (ZEVs and Enhanced AT PZEVs), rather than technologies that already have demonstrated their market potential (PZEV and AT PZEV).
• For model years 2018 and beyond, moving PZEV and AT PZEV vehicle technologies out of the ZEV program and into the Low Emission Vehicle program for criteria pollutant and GHG reductions.
• Maintaining only elements of the ZEV regulation that promote the commercialization of ZEV and ZEV‐enabling technologies.101
The main barrier to the penetration of light‐duty PEVs is the high initial vehicle purchase price. Battery costs continue to be the most significant portion of PEV higher costs and are projected to decline with high‐volume production and manufacturing efficiencies gained over time. Many forecasts report that the cost of a PEV battery pack will be reduced in half over the next 5 or 10 years.102 To spur sales of PEVs, incentives may be required to offset the price differential between PEVs and gasoline‐fueled vehicles.
Incentives The AQIP provides up to $50 million per year for program grants to fund clean vehicles and equipment, air quality research, and workforce training. The Clean Vehicle Rebate Project (CVRP) is funded by the AQIP and administered statewide by the California Center for Sustainable Energy (CCSE).103 The ARB allocated up to $5 million from AQIP in the 2010‐2011 funding plan to promote the production and use of zero‐emission vehicles, including BEVs, PHEVs, and fuel cell vehicles. Rebates up to $5,000 per light‐duty vehicle are available for individuals and business owners on a “first come, first serve” basis who purchase or lease new eligible zero‐emission vehicles or PHEVs. Certain zero‐emission commercial vehicles are
‐project.
100 Air Resources Board staff, February 1, 2011. 101 Ibid. 102 California PEV Collaborative, Taking Charge: Establishing California Leadership in the Plug‐in Electric Vehicle Marketplace, page 39. 103 California Center for Sustainable Energy, “Clean Vehicle Rebate Project,” https://energycenter.org/index.php/incentive‐programs/clean‐vehicle‐rebate
45

eligible for rebates up to $20,000. The rebate program is expected to be oversubscribed, so the Energy Commission has supplemented the CVRP with $2 million for 2011.
Federal tax incentives ranging from $2,500 to $7,500 are available as tax credits for full‐function electric‐drive vehicles.104 To qualify for a federal tax credit, an electric‐drive vehicle must have a battery with a capacity of at least 4 kWh, making the vehicle eligible for the minimum $2,500 credit. Vehicles with a battery capacity of 5 kWh or greater are eligible for an additional $417 of credit for every kWh excess of 4 kWh. Vehicles such as the Nissan Leaf (24 kWh battery capacity) and the Chevrolet Volt (16 kWh battery capacity) will thus be eligible for the maximum $7,500 credit. President Obama recently announced a proposal to convert this tax credit to a rebate program.105 Also available, although reduced from 2010, is a federal tax credit for 30 percent of the cost of home (up to $1,000) and commercial (up to $30,000) electric vehicle charging equipment and installations.
Additional PEV incentives include high occupancy vehicle lane access through 2015, free parking in many cities, reduced insurance rates by many providers, reserved parking spots with chargers, and the availability of reduced electricity rates. For example, San Francisco Bay Area residents may obtain a $700 charger rebate; San Joaquin Valley residents have a $3,000 PEV incentive; and Riverside residents have access to a $2,000 PEV rebate.106
If consumers considered the vehicle lifetime fuel savings rather than the upfront capital costs of the PEV, they would observe additional cost advantages compared to a conventional vehicle today. Table 11 compares the lifetime fuel cost savings of a typical BEV such as the Nissan Leaf with the PHEV Toyota Prius and the counterpart conventional vehicle given varying gasoline and electricity costs. Table 11 shows the fuel savings potential for a 5‐ or 10‐ year consumer vehicle ownership. Savings are quite sensitive to the price of gasoline with savings for BEVs almost doubling between $3 per gallon and $5 per gallon levels.
104 Ibid. 105 Department of Energy, “Vice President Biden Announces Plan to Put One Million Advanced Technology Vehicles on the Road by 2015 ,” http://www.energy.gov/news/10034.htm. 106 California Center for Sustainable Energy, “Plug‐in Electric Vehicles,” https://energycenter.org/index.php/technical‐assistance/transportation/electric‐vehicles.
46

Table 11: PEV Versus Conventional Vehicle Fuel Cost Savings Projections107
$2 / gallon gasoline, 10¢/ kWh electricity
$3 / gallon gasoline, 10¢/ kWh electricity
$4 / gallon gasoline, 10¢/ kWh electricity
$5 / gallon gasoline, 15¢/ kWh electricity
$6 / gallon gasoline, 15¢/ kWh electricity
PHEV vs Conventional Savings at 5 years $1,475 $2,212 $2,949 $3,686 $4,424
BEV vs Conventional Savings at 5 years $1,497 $2,997 $4,497 $5,246 $6,746
PHEV vs Conventional Savings at 10 years $2,949 $4,424 $5,898 $7,373 $8,847
BEV vs Conventional Savings at 10 years $2,994 $5,994 $8,994 $10,491 $13,491
Source: California Energy Commission
A Nissan Leaf’s manufacturer’s suggested retail price is $32,780 (or $35,337 including sales tax). After deducting federal tax incentives and the state clean vehicle rebate, the final cost to the consumer is $22,837. This cost compares favorably to a similar conventional vehicle valued at $25,020. In some communities additional incentives will apply. Charging infrastructure is not included in this analysis. A consumer would save $8,994 in fuel savings over 10 years of ownership (at $4 per gallon), resulting in a total cost of $13,753—almost half the price of the comparable conventional vehicle cost of $25,020.108 Over five years of ownership a consumer would save $3,084 (at $4 per gallon) resulting in a total cost of $19,753, which is still less than the conventional vehicle. An important consideration in setting the appropriate level of incentives is understanding the consumer’s approach to vehicle purchasing decisions. The UC Davis PH&EV Research Center indicates that consumers do not typically perform such an in‐depth life‐cycle cost analysis of vehicle costs; rather, they consider the upfront cost of the vehicle.109 Consumer education regarding the life‐cycle cost analysis will be essential to convey the true benefits and costs of PEV ownership.
Vehicle prices will decline as battery costs are reduced and PEV production volumes increase. Over time there will be less need for government subsidies. It is likely that, in the near term, incentives will still be needed to overcome barriers to the relatively high price of PEVs and PEV charging infrastructure. Creative financing strategies and vehicle leasing are other options for reducing the upfront cost of PEVs. As the price of gasoline rises and the costs of batteries continue to decline, PEVs will become increasingly attractive.
In 2010‐2011, the Energy Commission provided $2 million in program funds to the ARB’s CVRP for light‐duty vehicles. The Energy Commission will consider providing funds once again for the rebate program if needed to continue support of the successful rollout of PEVs in California.
107 Staff assumes 9,000 annual miles traveled, BEV at 33.4 kWh/100 miles combined fuel efficiency, PHEV at 59 combined mpg (a 20 percent increase to conventional hybrid) and the base conventional vehicle at 30 mpg. 108 The Nissan Leaf cost is $35,337, including sales tax. The conventional vehicle is the Nissan Altima, costing $25,020 including sales tax. PEV drivers typically drive less than the average driver, at 9,000 miles annually. 109 Tom Turrentine, staff meeting, November 2010.
47

Batteries Battery Technology The key issue in PEV design is the selection of the battery. The cost of lithium batteries remains high ($500 ‐ $1,000 per kWh) when purchased in relatively small quantities. For the 16 kWh battery pack in the Chevy Volt, this equates to around $8,000 ‐ $16,000. Detailed cost modeling done at Argonne National Laboratory shows that – in high production volume (greater than 100,000 packs per year) – original equipment manufacturers should be able to produce batteries in the range of $250 ‐ $400 per kWh for all chemistries.
One key to improving the performance and reducing the costs of PEVs is increasing the amount of energy that can be stored in a battery given its size (energy density); and increasing the amount of power the battery can deliver (power density). A recent Energy Commission report presented test data on the performance of various battery chemistries for use in PHEVs. The data shows that for all lithium‐ion chemistries tested, power density can be increased but not without sacrificing the battery’s energy density and cycle life, and vice versa. As a result, battery pack sizes must either be increased or use more expensive materials to meet both the power and energy storage requirements of the vehicle.
Researches recognize that combining batteries and ultracapacitors (capacitors with significant power densities) can offer advantages in hybrid electric vehicles. Ultracapacitors can deliver very high power and respond in fractions of a second but have limited storage capacity. Batteries have lower power capability, but with high energy density can store relatively large amounts of energy. The combination of batteries and ultracapacitors can deliver high power and high energy and is ideal for PEVs in terms of extending the battery life and downsizing the battery pack. The PH&EV Research Center modeled various combinations of advanced lithium batteries and ultracapacitors in PHEVs and compared their performance with batteries alone. In all respects, vehicle performance was improved using ultracapacitors for all the batteries studied, including fuel economy improvements of 50‐100 percent and 15‐40 percent for charge depletion and charge sustaining modes. The simulation results also indicate that by using ultracapacitors, batteries with a wide range of power characteristics can be used in PEVs without sacrificing vehicle performance and subjecting the batteries to high stress that may shorten their life.
As research and development continues to increase the energy density of lithium batteries, ultracapacitors will likely be needed to meet the power demands of PEVs. Currently the cost of ultracapacitors remains high, due mostly to high material and high manufacturing cost.
Battery Reuse There is considerable interest and potential for the reuse of vehicle batteries for applications after they are no longer suitable for vehicle use. Vehicle batteries must provide a minimum level of power to the vehicle’s electric motors. Although the batteries are no longer usable in the vehicle (“spent”) when they drop to 70‐80 percent of their power capabilities, such batteries could have significant life in other applications that have less demanding energy and power requirements. Repurposing vehicle batteries in second‐use applications would increase their salvage value and extend their useful life. In particular, the utilities may find value for repurposed vehicle batteries as storage devices for intermittent renewables, particularly
48

nighttime wind power, and delivery devices for peak needs, especially if such devices help to avoid building new power plants. Such devices could be distributed in household garages and basements or aggregated into power centers and be used to provide various services to the grid, the utility, and the electricity customers.
A recent Energy Commission report estimates that a repurposed 6 kWh battery pack, enough capacity to provide a PHEV with approximately 15 miles of all‐electric range, could generate net revenue streams of more than $1,000 per year for grid ancillary services. These revenue streams could significantly decrease the monthly lease payment for the vehicle battery pack. As vehicle battery production ramps up and battery costs drop, revenues generated from second‐use applications could fully cover and potentially exceed the monthly lease payments.
There are several ways in which the reuse of batteries could be used to reduce the cost of PEVs either initially or over time as the vehicle is used. In any case, the purchasers of PEVs would have to benefit from the value of second‐use of batteries. This could be done by subtracting some fraction of the sale price of the reused batteries from the initial cost of the new plug‐in vehicle batteries. This could be done easily if the same company owned the batteries over their complete life, including second use. Another approach is for the PEV owner to lease the batteries or pay for the batteries as they use electricity stored in the batteries. In either case, the cost of the batteries would be paid over their lifetime, significantly reducing the initial cost of the PEV.
To promote the development of the second‐use vehicle battery market, the Energy Commission’s PIER Program is identifying and evaluating potential reuse strategies. In 2010, the Energy Commission, in coordination with the PH&EV Research Center, awarded funding to the CCSE to begin developing the home energy storage appliance (HESA). This device will use spent vehicle batteries, be suitable for placement in garages, and provide ancillary services to the electricity grid. CCSE is working with SDG&E to evaluate the effectiveness of the HESA as a peak shaving application in homes and businesses. In addition, CCSE is working with Aerovironment to develop a protocol to determine if spent lithium‐ion vehicle batteries are acceptable for second‐use applications. Since the Energy Commission’s initial award, the U.S. DOE has awarded an additional $700,000 in funding over a longer period to CCSE and the PH&EV Research Center to conduct additional work on second use applications for lithium‐ion vehicle batteries.
The Energy Commission’s PIER Program has tasked the PH&EV Research Center to develop the HESA further and evaluate new ways to use spent vehicle batteries in grid storage applications. This will include developing and testing energy storage devices, like the HESA, in other smart‐grid applications including industrial sites, shopping malls, large buildings, and public charging stations. In particular, the PH&EV Research Center will evaluate methods to integrate these storage devices in applications that have distributed generation resources such as solar photovoltaic systems.
Battery Recycling The question of recycling the battery is something that must be addressed before significant quantities of vehicle batteries are produced. Large‐scale recycling has the potential to not only reduce the environmental footprint of lithium vehicle batteries, but also reduce their high costs
49

if battery materials are able to be reused. Currently, there is not yet the capacity (or the need) for recycling large lithium vehicle batteries. A recent Frost and Sullivan report estimates that the PEV lithium‐ion battery recycling market will be worth more than $2 billion by 2022. In 2009, the U.S. Department of Energy awarded $9.5 million to a California company to build the nation’s first lithium vehicle battery recycling facility in Ohio. As the PEV market grows, additional battery recycling centers will need to be built. In addition, some system of requiring that the batteries be recycled will need to be established. The Energy Commission’s PIER Program has tasked the PH&EV Research Center to discover the full cost of disposal, identify potential ways to reuse battery materials, and assess the potential for large scale recycling of lithium vehicle batteries.
Table 12: Plug-In Electric Vehicle Funding Allocation
PEV Readiness $1 Million
Charging Infrastructure and Related Activities $7 Million
Medium- and Heavy-Duty Advanced Vehicle Technology Demonstration
See Medium- and Heavy-Duty Vehicles Section
Total $8 million
Source: California Energy Commission
50

Hydrogen Hydrogen can be derived from a number of sources, including natural gas, biomethane, electricity from fossil fuels, and electricity from renewable resources. Hydrogen produced through steam methane reformation (SMR) and used in a fuel cell vehicle (FCV) can reduce GHG emissions by 56 percent110 and petroleum consumption by 99.7 percent when compared to California’s reformed gasoline used in a conventional vehicle. Like BEVs, FCVs produce no tailpipe emissions; however, unlike with BEVs, there are no energy storage issues with FCVs. They store the hydrogen fuel in on‐board pressure tanks. Today’s FCVs hold enough hydrogen in on‐board tanks that driving ranges of 250 miles or more are possible in everyday use. Refueling is relatively quick with about 3‐5 minutes per fill (for 700 bar stations and newer vehicles that can be fueled at the higher pressure).
However, a major barrier for this fuel and the vehicle technologies using hydrogen remains the economy and high cost at numerous levels. Vehicle production and fueling infrastructure are still at a pre‐commercial stage, where industry cannot take advantage of economies of scale benefits that come with commercial production volumes. However, there are indicators that cost is decreasing on both the vehicle and fuel infrastructure side. One original equipment manufacturer (OEM) has mentioned that FCVs are now headed below the $100,000 mark, and several OEMs plan to lease vehicles to the public at somewhat affordable lease rates. The Energy Commission has also seen the cost per fueling station decrease, from a range of $3 million to $6 million to a range of $1 million to $2.5 million, over only a few years. 111 This was made possible due to modular designs and strategically designed fuel production and distribution models.
As interest and opportunities for hydrogen and FCVs have risen in California, there has been a continued reduction in financial support from the federal government. For FY 2012, U.S. DOE has proposed reducing funding for hydrogen and fuel cell technologies by nearly 41 percent below the previous year’s level, on the basis that the technologies will not be ready for mass markets until years from now.
Fuel Conversion and Production Steam Methane Reformation The most common method for producing hydrogen is through large‐scale steam methane reforming (SMR) facilities, where methane from natural gas (or biomethane) is broken down in a reaction with high‐temperature steam. The resulting products are hydrogen and CO2, which is released into the atmosphere. The hydrogen is purified and compressed for storage and transport. Large‐scale SMR units are relatively energy‐intensive installations that allow for a comparably low‐cost production per kilogram (kg) of hydrogen. The process energy is generated by the combustion of the same natural gas that serves as the feedstock and some electric power. The vast majority of hydrogen today is produced for various non‐transportation purposes, such as in oil refineries, the chemical industry (methanol, ammonia, hydrochloric
110 Based on LCFS data, using a pathway of hydrogen produced 100 percent from natural gas steam methane reformation, used in a FCV. 111 Based on information from proposals received by the Energy Commission under PON‐09‐608.
51

acid), in the food industry (oil/fat hydrogenation), or as a shielding gas for welding. Less than 1 percent of hydrogen produced today is used as a transportation fuel.
One major in‐state provider, Air Products, produces its hydrogen in a large‐scale industrial installation in Southern California, using natural gas derived from the pipeline. Although hydrogen is produced and traded in large quantities as an everyday industrial gas and can be produced at moderate cost today (at approximately $5‐10 per kg), it has not yet reached cost‐competitiveness with petroleum fuels on an energy‐equivalent basis. 112
Hydrogen as a transportation fuel furthermore requires higher purity levels than hydrogen for industrial uses because fuel cells stack membranes are sensitive to impurities. Purification, mostly from by‐product gases, is typically performed by pressure swing adsorption, an effective but costly technology that adds to the capital and operation/maintenance cost for SMR facilities.
Early hydrogen fueling station sites were equipped with on‐site hydrogen production units, many using SMR technology, others using electrolysis. Energy Commission observations suggest that on‐site production often comes with relatively high maintenance and capital cost, and can produce only small amounts of hydrogen fuel. However, it can present significant potential for renewable hydrogen production if paired with a local source of biomethane or renewable power for example from photovoltaic systems.
Senate Bill 1505 (Lowenthal, Chapter 877, Statutes of 2006) requires that all hydrogen used for transportation fuel in the state must be at least 33.3 percent from renewable sources. The ARB, which administers this mandate, has not yet fully established the requirement and is working on establishing regulations to clarify details of the mandate. For example, the ARB is considering a temporary reduction of the 33.3 percent requirement to 20 percent to account for the lack of availability of renewable hydrogen or the feedstocks necessary for its renewable production during the early years of its implementation. In the case of steam methane reformation, these renewable resources are likely to depend significantly on the use of biomethane. Natural gas used in the SMR process can easily be substituted for biomethane to reach a renewable hydrogen product. Another aspect that ARB is investigating for the regulations is how credits for renewable power and renewable biomethane will be applicable to the mandate and what kind of tracking mechanisms can be used for these two compliance pathways. A July board meeting has been tentatively scheduled for the approval of the rulemaking.
Electrolysis Electrolysis consists of water molecules being cracked with electric power into oxygen and hydrogen. The oxygen is released into the atmosphere and the hydrogen captured and compressed for storage. From 2002 to 2007, a few experimental and demonstration electrolysis fueling stations were built in California, funded by consortia of industry, federal government, state government, and local agencies. Some of these stations used electrolysis to produce hydrogen on‐site. However, Energy Commission observations suggest that on‐site electrolysis comes with relatively high maintenance and capital costs and can produce relatively small
112 One kg of hydrogen contains roughly the energy equivalent to one gallon of gasoline.
52

amounts of hydrogen fuel over time. This suggests that on‐site may not be the most cost‐effective option today. Electrolysis possesses significant potential for renewable hydrogen production, particularly when the electricity comes from renewable sources such as photovoltaic arrays. In recent years, California has seen a decline of on‐site production fueling stations in favor distributed models with central production. SMR is dominating centralized hydrogen production due to the high cost that large‐scale central electrolyzers would entail while producing only moderate amounts of hydrogen. Today, central SMR seems to be favored over on‐site production. The general trend moving away from electrolyzers can also be observed in the recent competitive solicitation issued by the Energy Commission in fall 2010, in which no on‐site electrolyzers were proposed.
The same SB 1505 requirements for renewable hydrogen that were discussed under “Steam Methane Reformation” apply equally to electrolysis. Given that electrolysis does not use methane, renewable natural gas is unlikely to play a significant role in ensuring renewable hydrogen from electrolysis. Pairing electrolysis facilities with distributed renewable electricity generation is a more likely avenue for compliance. Among the items the ARB is investigating before establishing its requirements is whether and how renewable electricity will be applied to this mandate as a feedstock.
Upstream Fuel Infrastructure Today, centralized hydrogen production with truck‐based delivery to the fueling stations is more cost‐competitive than on‐site production, particularly on a cost‐per‐kg basis. This approach allows large amounts of fuel to be produced at relatively low cost and allows for significantly reducing the cost for each fueling station because much equipment is only at a single central filling station, and not at each fueling station. On‐site production has proven to be a relatively high‐cost option, in part because of the high maintenance that on‐site SMR units require and also given the relatively small amounts of fuel they produce.
There are multiple pathways for connecting centralized hydrogen production with fuel dispensing stations. Air Products, an in‐state hydrogen provider, developed the first of these pathways. The hydrogen is produced in a centralized facility, purified by pressure swing adsorption, and then compressed and filled into tube trailers at a central filling terminal located at that same facility. The tube trailers serve as means of transportation and on‐site storage at each fueling station. The trailer is connected to the on‐site equipment, including compressors (for increasing the fuel transport pressure to the dispensing pressure) and the dispenser to allow fueling of FCVs. Once depleted of hydrogen, a trailer is replaced with a newly filled trailer.
Another in‐state provider of hydrogen, Linde, has developed a different delivery system for its hydrogen. Its process produces liquefied hydrogen, which is filled into tanker trucks. These trucks deliver the hydrogen to fueling stations where the liquid hydrogen is pumped into a large on‐site tank. Liquid hydrogen is super‐cooled, and therefore, these tanks are built with thick, double‐steel walls. The equipment at the fueling station includes vaporizers, which turn the liquid hydrogen fuel into its gaseous state on demand. Intermittent storage in tube stacks assures an immediately available supply of fuel at the necessary pressure. Compressors regulate the availability and correct pressures of fuel for dispensing.
53

Fueling stations with hydrogen production and fueling configurations located on‐site have been demonstrated over the past decade. These stations required no upstream infrastructure, as the production of hydrogen is colocated with fuel dispensing. However, both electrolyzer and SMR on‐site systems have significant downsides. They produce only small quantities of hydrogen and they are very cost‐intensive and known to be relatively high‐maintenance technologies. Given today’s modern requirements for capacity and peak fueling, an on‐site SMR unit would need to be very large, which may not necessarily be feasible at existing gasoline stations due to lack of space. 113 In recent years, California has seen a decline of on‐site production fueling stations in favor distributed models with central production. This can also be seen in the recent competitive solicitation issued by the Energy Commission in fall 2010, in which no proposals with on‐site production were submitted.
Localized Fuel Retail Infrastructure Private Fleet Fueling Infrastructure Several OEMs in California maintain and operate private hydrogen fueling stations to supply their own demonstration fleets of FCVs. These dispensing installations possess small capacities and are often located on the premises of OEM testing and development facilities; as such, they are typically inaccessible by FCVs from other OEMs. Transit authorities’ hydrogen stations are inaccessible in the same way; however, the first one that will be different is AC Transit’s Emeryville station that will allow public access “outside the fence” to fuel FCVs in addition to fuel cell buses “inside the fence.”
The Energy Commission has emphasized that these exclusionary, private stations do not contribute to the cooperation necessary to build a viable hydrogen station network that will address near‐term consumer demand. Furthermore, the vehicle owners will soon be individual consumers, so fleet/private fueling generates a big fuel demand gap. Therefore, the Energy Commission, in its 2010 hydrogen infrastructure solicitation (PON‐09‐608), required that proposed stations be publicly accessible without prohibitive user agreements.
Some projects in the past and present use mobile fueling vehicles to supply location‐independent demonstrations and fleets. This will likely continue to be an option, to bridge temporary gaps in fuel supply that may arise from lack of fueling stations in some areas of the state. However, as automakers begin deploying FCVs in the hundreds and thousands, they are not likely to be a significant part of hydrogen refueling strategy.
Public Hydrogen Fueling Infrastructure As part of implementing the program, the California Energy Commission is funding projects that support hydrogen fueling infrastructure driven by the fuel demand of pre‐commercial FCVs deployed by automakers in California. Subsequent to the 2008‐2010 Investment Plan, the Energy Commission provided $22 million to establish hydrogen infrastructure based on information available from public agencies, public and private organizations, and other stakeholders.
Based on this information, the Energy Commission released a competitive solicitation in June 2010. Out of the proposals for 16 stations received, 11 stations (totaling $15.6 million in Energy
113 Peak fueling is defined by SAE as three consecutive FCV fills totaling 20 kg within one hour.
54

Commission funding) were proposed for award. Eight of the stations represent new installations, and three are upgrades. Once awards are finalized and grant agreements are developed, construction of the stations will begin. The stations are strategically located in areas where automakers have committed to significant numbers of fuel cell vehicle deployments over the next three years, with nine of the stations located in the greater Los Angeles area, one near San Francisco International Airport, and one in the Sacramento area.
One key requirement was that the proposed stations had to be backed with location‐specific automaker endorsements for vehicle deployments, which allowed the Energy Commission to match supply to demand. All of the funded stations have a minimum of 100 kg/day capacity to ensure ample fuel supply for California’s hydrogen FCV drivers.
To establish a baseline of existing publicly accessible hydrogen fueling stations in California, an agreement was successfully executed with the Energy Commission’s technical support contractor to perform a comprehensive assessment of all publicly accessible stations in California. In 2010, the report found that of 12 publicly accessible fueling stations in California, 8 stations are operating (2 are transit stations), and the other 4 offer limited operation and public accessibility.
It is anticipated that five hydrogen fueling stations will be completed and come on‐line in 2011. These stations, cofunded by the ARB during its 2008‐2009 solicitations, are all located in Southern California. Another eleven stations are expected to be completed under Energy Commission funding by late 2012. The 2010‐11 Investment Plan included up to $13 million allocation for hydrogen fueling stations, which has been reduced to $10.2 million due to revenue shortfalls. Based on the 2010 solicitation, the Energy Commission anticipates that this amount should be able to fund five to seven additional stations.
There are two transit hubs in California that own and operate hydrogen‐operated buses. SunLine in Thousand Palms and AC Transit in Oakland (together with a consortium of five transit agencies around the Bay Area) both also operate hydrogen fueling stations. SunLine has one bus fueling stations, and AC Transit’s old station in Oakland is closed and will be replaced by a new station in the same location (cofunded by local, state, and federal sources). An additional station is being built by AC Transit in Emeryville.
Medium‐ and heavy‐duty applications and other projects use mobile fueling vehicles to supply location‐independent demonstrations and fleets. This will likely continue to be an option, also to bridge temporary gaps in fuel supply for such projects that may arise from lack of fueling stations in some areas of the state. Mobile fuelers are skid‐mounted with a tube trailer. These can be easily moved for a greater level of flexibility of location.
Needs Analysis The Energy Commission is committed to funding projects that support the fueling need for developing hydrogen fueling infrastructure driven by the fueling demand for precommercial FCVs deployed by automakers in California. In June 2010, the Energy Commission released a solicitation for hydrogen fueling stations, resulting in $15.7 million in proposed funding awards for a total of eleven station:; eight new and three upgrades to existing facilities. The stations are strategically located in areas where automakers have committed to significant numbers of fuel
55

cell vehicle deployments over the next three years, with nine of the stations in Southern California and two in Northern California.
This solicitation incorporated automotive and hydrogen producer industry input in its design to achieve the highest cost‐efficiency. A key requirement was that the proposed stations had to be backed with location‐specific automaker endorsements for vehicle deployments, which allowed the Energy Commission to match demand with supply.
The December 2010 OEM survey for FCV commitment numbers resulted in responses from seven OEMs. Table 13 compares these numbers to the 2009 survey results. Although the new numbers are between 23 percent and 44 percent lower than the previous year’s (and 11 percent higher for the long‐term range 2015‐17), the 2012 values are within range of the commitments presented by automakers in letters of commitment in proposals for the 2010 hydrogen fueling station solicitation.
Table 13: 2009 and 2010 Fuel Cell Vehicle Survey
2011 2012 2013 2014 2015-17 2009 Survey 330 495 769 1839 47,800 2010 Survey 253 312 430 1389 53,000 Percent Change -23 -37 -44 -24 11
Source: California Energy Commission
The geographical distribution of OEM vehicle commitment numbers shows that OEMs are concentrating on more on the clusters where the Energy Commission is proposing awards for fueling stations (for example, Orange County, Torrance). Other locations identified in the survey, such as Burbank, are not currently considered key locations by OEMs for their FCV deployments.
A thorough analysis and comparison with the 2009‐10 gap analysis shows that the 11 stations most recently proposed for funding by the Energy Commission will cover a significant amount of fueling demand through 2014. In combination with the five to seven stations that might be funded by the previous investment plan’s $10.2 million allocation, this should provide adequate fueling supply to all of the most significant regions identified in the OEM survey.
However, providing adequate fueling supply to the most significant regions will not, on its own, ensure the successful commercialization of FCVs in the 2015‐2017 time frame. Additional state support is needed to build regional fueling networks, ensure a reliable supply of fuel, and establish fueling stations in regions with more modest FCV commitments through 2014.
For FY 2011‐2012, the Energy Commission will allocate $8 million for hydrogen fueling infrastructure for light‐duty vehicles and support of transit projects. Stations funded by this allocation should be on‐line by 2014 to help establish a network of fueling stations before commercialization. In addition to the allocations provided through the Energy Commission’s program, the state may need to consider broader incentives or regulations to encourage hydrogen fueling station deployment.
CALSTART, in December 2010, was awarded $10 million from the Federal Transit Administration for two projects that will lead to the development of lower cost and more
56

durable zero‐emission fuel cell buses. Fuel cell buses improve urban air quality because they produce zero tailpipe emissions while also producing far fewer GHG pollutants. The funding will be used primarily to help leading fuel cell manufacturers improve the performance and lower the costs of their bus technology. The Energy Commission may support this program to help develop Southern California transit hydrogen fueling infrastructure to supply these buses with hydrogen transportation fuel. If so, this funding will come from the $8 million in funding for hydrogen fueling infrastructure for FY 2011‐2012.
Studies to Support Strategic Infrastructure Planning The Energy Commission is entering into an interagency agreement with the University of California that will enhance the Spatially and Temporally Resolved Energy and Environmental Tool (STREET). This multi‐year project will expand an existing model to all of California (previously only the South Coast Air Basin) and to all alternative fuels. It represents UC Irvine’s modeling approach for identifying, analyzing, and understanding the interplay among GHG emissions, criteria pollutant emissions, water usage, and other effects resulting from displacing existing transportation fuels and technologies. The work is used to predict environmental and resource usage impacts of current and proposed transportation infrastructure scenarios. Current and past funding sources include U.S. DOE, Toyota, Air Products, Honda, Nissan, ARB, and the Energy Commission. The Energy Commission is also pursuing an agreement with the National Renewable Energy Laboratory’s (NREL) Center for Transportation Technologies Systems to provide technical support services for the program, in particular, market assessments of advanced vehicle fuels and technologies, fuels research, criteria, and GHG emissions characterization and improvement, biofuels production and use, hydrogen vehicle technology evaluation, and infrastructure needs, and the ongoing work the laboratory is engaged in regarding scenario planning to achieve climate change, petroleum reduction, and state air quality goals.
Recent Improvements to Fueling Infrastructure Earlier hydrogen fueling stations were built at a costs ranging from $3 million to $6 million per station. This relatively high capital cost has been identified as a major hurdle in establishing a viable hydrogen fueling network in California. To address this and encourage equipment providers and project proposers to take steps in lowering the cost, the 2010 solicitation used a “sliding scale” performance incentive mechanism. This tool rewarded projects with a higher share of match funding the lower the overall price tag for each single fueling station was. The successful outcome of the incentive lowered the price range for the proposed stations to about $2 million to $3 million for each station. In general, there are signs of decreasing cost for stations as the industry develops innovative production, distribution, and retail supply strategies that are more cost efficient. For instance, more modular, “all‐in one‐container” designs as well as shifting some equipment to a central production/filling location instead of at each site can contribute to these decreases.
A similar performance incentive was included in that same solicitation that rewarded project proposals if their station could be built and brought on‐line in 18 months or less. This time frame is considerably less than what has been observed in the past to build such stations. Shorter construction times reduce costs and allow the station to reach utility sooner. It also allows for better infrastructure planning in the long run. Much experience has been gained
57

during recent years regarding the permitting processes for hydrogen fueling stations. Local government permitting agencies and fire officials in cities of prospective sites are slowly getting to know the technology better, and their understanding and familiarity have greatly helped accelerate and make these permitting processes easier. Automakers and station builders have done their share in working with local representatives to improve this. Permitting times as short as four to eight months have been reported in some cases.
The solicitation also included a set of minimum requirements. The Energy Commission included a requirement that called for projects to be public access and present a retail‐like experience. This was done to improve the experimental character of many current stations to a more precommercial scenario where users had unrestricted drive‐up access (including the absence of gates, fences, guards, key codes or the like) to the fueling dispenser(s). In addition, the station design was supposed to offer most attributes that a typical conventional fueling station offers (such as good lighting, signs, and simple user interface).
Fuel Quality Standards Through a contract with California Department of Food and Agriculture’s (CDFA) Division of Measurement Standards (DMS), the Energy Commission is funding activities to develop and establish retail fuel quality standards for hydrogen. For hydrogen, a sound infrastructure is one of the biggest challenges before mass usage of hydrogen vehicles can take place. Offering high quality fuel will be a key component in the successful deployment of commercial grade hydrogen fuel. Hydrogen fuel must be of the highest quality to provide the best possible vehicle performance, not damage fuel cells, and reward car manufacturers for their investment into new technology. Establishing testing procedures and quality standards for commercially available gaseous hydrogen as a transportation fuel is a critical first step in developing a fair and competitive marketplace in the California hydrogen infrastructure. This will enhance consumer protection, foster fair competition, and promote economic growth and trade. CDFA/DMS will adopt regulations as necessary to incorporate any changes to its hydrogen standards or to clarify existing statute or code.
To further support hydrogen infrastructure development, the Energy Commission funded the CDFA/DMS to develop retail fuel quality standards for hydrogen and a type approval for measuring and dispensing hydrogen for sale in California. 114 The same contract will allow CDFA/DMS to prepare the groundwork to establish a standard for the commercial measurement of gaseous hydrogen for vehicles and other refueling applications. This type approval is strongly needed, as there is no regulatory standard established in California for equipment to measure hydrogen transportation fuel for sale on a per‐kg basis. These efforts will help remove major obstacles to commercialization of hydrogen as a transportation fuel and help develop the fueling infrastructure.
Light-Duty Fuel Cell Vehicles The benefits of high efficiency, reduced GHG and other criteria emissions, fuel source diversity, and attractive vehicle attributes are the primary motivations for OEMs pursuing fuel cell and other electric drive vehicle technologies. In addition, state policy including the ZEV mandate is 114 A “type approval” is granted to a product that meets a minimum set of regulatory, technical and safety requirements. Generally, type approval is required before a product is allowed to be sold.
58
driving the timing of industry investments. While the current volumes are low, FCVs are expected to move from the current demonstration stage to early commercial volumes within the decade. The Energy Commission and the ARB conducted a survey of eight OEMs in 2009. The survey was conducted again in 2010, and the aggregated results can be seen in Appendix B.
Fuel cell vehicles are the most prevalent vehicle technology that uses hydrogen as a transportation fuel. FCVs produce electricity on board by forcing the hydrogen through a stack of membranes, where it reacts with the oxygen from the air and produces electric power. The vehicle is then powered by electric propulsion using this power. Temporary buffer storage of the electric power aids in increasing efficiency and drivability, thus some FCV are battery‐assisted or a type of hybrid. Hydrogen is stored in on‐board, pressurized tanks.
Several OEM have FCVs readily available and are planning to build these for lease to selected customers. Toyota announced on January 13, 2011, that it is on schedule to sell hydrogen cars by 2015 or sooner in California, Japan, and Germany. It also announced that it has cut the cost to make hydrogen vehicles to less than $100,000 and aims to cut that cost in half (to $50,000) by the time sales begin. 115
The ZEV mandate is significantly driving the timing of industry investments. While the volumes are currently low, FCVs are expected to move from the current demonstration stage to early commercial volumes within the next decade. ARB expects a number of vehicles could be rolled out under ZEV compliance path options and under the LCFS base case scenario. The ARB is evaluating a number of approaches to provide policy incentives to energy companies that invest in ultra‐low‐carbon fuels including hydrogen. This includes, for example, the use of credit multipliers under the LCFS or the Clean Fuels Outlet as part of the ZEV program.
Hydrogen internal combustion engine vehicles (HICEV) are vehicles that combust hydrogen as a gaseous fuel in an internal combustion reciprocating engine similar to a gasoline or natural gas‐propelled vehicle. Unlike the FCV, this technology does not use electric power, but it does include on‐board pressurized fuel storage of hydrogen. HICEVs have been tested in California for years, mostly in the five cities project in Southern California where originally 25 Toyota Priuses were converted to HICEV. While some of these cars are still used today and other OEMs have experimented with HICEV as well, the technology has been observed as relatively high maintenance and low‐range. Accordingly, it does not seem likely that HICEV will become the prevalent hydrogen propulsion technology in the near future.
Stationary Applications A recent report for the US DOE identified at least two near‐term markets for non‐road use of hydrogen fuel cells: forklifts in warehousing and distribution centers and airport ground support equipment (which includes certain classes of forklifts). Fuel cell forklifts are considered to have near‐term market potential because they provide zero‐emission operation, eliminate the need for battery storage space, allow rapid refueling, and do not lose power during operation. The ability to rapidly refuel is especially attractive for multishift applications. Indoor and
115 Bloomberg, “Toyota Advances Hydrogen Fuel Cell Plans Amid Industryʹs Battery‐Car Push,” http://www.bloomberg.com/news/2011‐01‐13/toyota‐advances‐hydrogen‐plans‐amid‐industry‐s‐battery‐car‐push.html.
59

outdoor air quality concerns are another important reason for preferring fuel cell forklifts over combustion engine forklifts in the workplace. A number of material handling site owners have already indicated a willingness to support such applications. The U.S. Department of Defense, through the Defense Logistics Agency, has a large fuel cell forklift demonstration program underway at distribution depots throughout the country.
Argonne National Laboratory has estimated that about 50,000 battery electric forklifts have been sold each year from 2005 to 2007, representing a large market potential for this emerging technology. In some cases, infrastructure to serve non‐road applications could also adequately serve light‐duty vehicle applications. Finding such locations may be a challenge but would offer opportunities to leverage funding and increase capacity for multiple‐use stations.
The Energy Commission acknowledges the importance of non‐road applications and their potential to further fuel cell technology. In its recent solicitation for hydrogen fueling infrastructure, the Energy Commission did not exclude non‐road fueling stations. Such stations were eligible as long as a proposer could present a project that combined non‐road fueling with FCV fueling dispenser installations in a multi‐use project (and adhere to all other minimum requirements of the solicitation). No such project proposals were received.
Bridging Technologies Related “bridging” technologies are being developed for hydrogen. For example, blending up to 30 percent hydrogen with natural gas and hydrogen‐compressed natural gas fuels reduces emission and improves operational results in trucks, buses, and vans. HICEVs offer another bridging technology with the potential to reduce GHG and criteria emissions although the lower efficiency of combustion engines relative to fuel cells reduces their benefits. Depending on commercialized FCV costs, HICEVs may be a viable transition option from existing conventional vehicle technology.
Table 14: Hydrogen Funding Allocation
Hydrogen Fueling Infrastructure $8 million
Medium- and Heavy-Duty Advanced Vehicle Technology Demonstration See Medium- and Heavy-Duty Vehicles Section
Total $8 Million
Source: California Energy Commission
60

Natural Gas Given its abundant existing supply and distribution infrastructure, natural gas represents a strong opportunity to reduce petroleum dependence and GHG emissions within California. Vehicles operating on compressed natural gas (CNG) reduce petroleum fuel use by 99 percent and reduce GHG emissions by 29 percent relative to gasoline and by 21 percent relative to diesel on a full‐fuel‐cycle basis (although some criteria pollutants can be higher than for new diesel vehicle counterparts).116 Due to the clean‐burning properties of natural gas, natural gas vehicles (NGVs) have also been historically favored as a means of reducing criteria air pollutants. Furthermore, because the high‐pressure fuel system is sealed, there are little or no evaporative emissions during fueling and use (although there can be some gas release during refueling).
CNG is competitively priced with gasoline and has developed a significantly lower cost than gasoline since early in the previous decade, as shown in Figure 2. The energy efficiency of gasoline vehicles and NGVs result in comparable mileage per gasoline gallon equivalent (GGE).
Figure 2: Gasoline and CNG Prices by Gasoline Gallon Equivalent
Source: Energy Information Administration, California Energy Commission
Figure 3 similarly shows the cost differential between CNG and diesel, on a diesel‐gallon‐equivalent basis. As shown, the price of a diesel equivalent gallon of CNG has become
116 Staff Comparison of 2007 and 2009 model year heavy‐duty engine ARB Executive Orders.
61
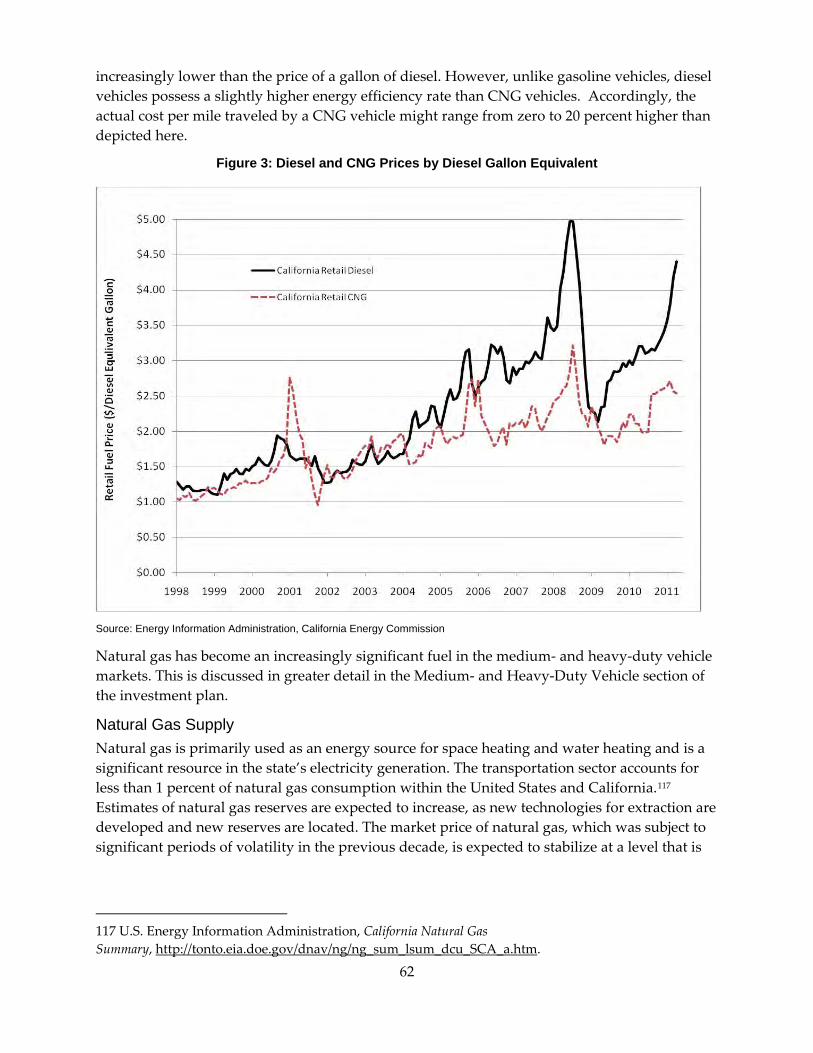
increasingly lower than the price of a gallon of diesel. However, unlike gasoline vehicles, diesel vehicles possess a slightly higher energy efficiency rate than CNG vehicles. Accordingly, the actual cost per mile traveled by a CNG vehicle might range from zero to 20 percent higher than depicted here.
Figure 3: Diesel and CNG Prices by Diesel Gallon Equivalent
Source: Energy Information Administration, California Energy Commission
Natural gas has become an increasingly significant fuel in the medium‐ and heavy‐duty vehicle markets. This is discussed in greater detail in the Medium‐ and Heavy‐Duty Vehicle section of the investment plan.
Natural Gas Supply Natural gas is primarily used as an energy source for space heating and water heating and is a significant resource in the state’s electricity generation. The transportation sector accounts for less than 1 percent of natural gas consumption within the United States and California.117 Estimates of natural gas reserves are expected to increase, as new technologies for extraction are developed and new reserves are located. The market price of natural gas, which was subject to significant periods of volatility in the previous decade, is expected to stabilize at a level that is
A_a.htm117 U.S. Energy Information Administration, California Natural Gas Summary, http://tonto.eia.doe.gov/dnav/ng/ng_sum_lsum_dcu_SC .
62

significantly competitive with petroleum‐derived fuels.118 Historically, natural gas prices have been pegged to petroleum; this is increasingly no longer the case.
Roughly 87 percent of California’s natural gas supply is delivered from outside the state, via five interstate gas pipelines.119 Additionally, the liquefied natural gas (LNG) facility in Costa Azul, Mexico, is capable of processing up to 1 billion cubic feet per day and could provide additional supply to the California natural gas market. The source of this LNG is likely to be foreign, generally located in Southeast Asia, and transported via tanker ship. However, at the present time none of the LNG imported into the United States is allotted for transportation fuel due to costs.120
The expansion of natural gas supply to include shale sources has the opportunity to provide an abundance of natural gas, keeping prices moderate. Estimates of shale gas reserves range from 842 trillion cubic feet to 2,240 trillion cubic feet121,122. The lower estimate gives a 37 year supply at the present consumption rates. By mid‐2008, shale production represented almost 10 percent of production from the lower 48 states, and the Natural Gas Supply Association believes that production from the shales “…could double in the next 10 years and provide one‐quarter of the nation’s natural gas supply.”123
A process known as hydraulic fracturing, used by gas producers, accesses natural gas from sources such as coalbeds and shale gas formations. This process involves creating fractures in underground formations to allow natural gas to flow. Water and sand are pumped in to the rock formations under high pressure to create fractures. These newly created fractures are then “propped” open by the sand, which allows the natural gas to flow into the wellbore and be collected at the surface.124 However, there are environmental risks associated with the use of hydraulic fracturing process in the recovery of shale gas. Hydraulic fracturing uses hundreds of thousands of gallons of water treated with chemicals. The volume of chemicals in this water is a source of concern and debate.125
Natural Gas Processing To be transported via pipeline, all natural gas must conform to pipeline standards and be treated to remove solids, free liquids, and reduce water vapor content to acceptable levels. The treatment process also separates the heavier hydrocarbon components (ethane, propane, and butanes) that can derive higher economic value in the petrochemical feedstock market. Once the
tml118 U.S. Energy Information Administration, Forecasts and Analysis of Energy Data, http://www.eia.gov/oiaf/forecasting.h . 119 California Energy Commission, 2009 Integrated Energy Policy Report, CEC–100–2009–003‐CMF. 120 Phone conservation with Michael L. Eaves, Clean Energy on January 6, 2011. 121 January 9, 2009 PowerPoint presentation by Mitchell Pratt, Clean Energy. 122 California Energy Commission, 2009 Integrated Energy Policy Report, CEC–100–2009–003‐CMF. 123 Natural Gas Supply Association, News Release, October 8, 2008, “Natural Gas from Shale Could Double in Next Ten Years.” 124 Chesapeake Energy, Hydraulic Fracturing Fact Sheet, July 2010. 125 As an example, see guidelines developed by New York for the use and disposal of water, the protection of groundwater, and the use of chemicals. Department of Environmental Conservation, New York State, Final Scope for Draft Supplemental Generic Environmental Impact Statement on the Oil, Gas and Solution Mining Regulatory Program, February 2009.
63

natural gas has been sufficiently purified, it enters interstate and intrastate commerce and becomes a fungible commodity.
In addition to its use in NGVs, natural gas can also be used as an input fuel for the production of other alternative fuels. In particular, natural gas can be converted directly into hydrogen via steam methane reforming. (For more details on this process, see the “Steam Methane Reforming” discussion.) Moreover, methane (whether natural gas or biomethane) can be blended with hydrogen. The advantages of combining natural gas and hydrogen include improved combustion efficiency and significantly smaller energy requirements for ignition.
Upstream Fuel Infrastructure The most significant aspect in upstream infrastructure for natural gas is the network of interstate and intrastate pipelines. As mentioned, more than 87 percent of California’s natural gas supply arrives from a combination of five interstate pipelines, with the remainder delivered strictly within the intrastate pipelines. Given the miniscule amount of natural gas used in California for transportation, increasing the amount of natural gas required within California for transportation is unlikely to have a significant effect on this network.126 However, the Energy Commission will continue coordinate with other western state agencies on developing a natural gas transmission and storage system that can overcome any periodic disruptions in supply and reliability.127
Aside from supply and reliability issues, there are issues of natural gas purity standards that may affect natural gas for transportation. This has been a particularly sensitive issue for natural gas produced in California’s coastal regions and the lower San Joaquin Valley. The ARB is responsible for adopting quality standards for natural gas used in vehicle engines, while the CPUC is responsible for quality standards in the natural gas pipeline. North American pipeline gas generally meets ARB specifications, but roughly 8 percent of in‐state pipeline gas does not. To address these discrepancies, the ARB is evaluating potential changes to its CNG specifications, including the use of new performance indicators, such as a methane number or Wobbe Index.128
Natural gas, when used for transportation purposes, may also require extra treating to remove solids and free liquids and reduce water vapor content to acceptable levels. Once sufficiently treated, the natural gas is can be compressed into CNG, which compresses pipeline natural gas to less than 1 percent of its standard volume. CNG is then used either by vehicles on‐site, or distributed to local fleet and retail fueling stations via delivery trucks. Alternatively, natural gas can be liquefied into LNG, which reduces the volume (but not the energy content) of CNG by half. This makes LNG more efficient to distribute over long distances to where pipelines may not exist (often by ship, rail, or truck). However, this liquefying process consumes additional energy, which results in higher well‐to‐wheel GHG emissions from LNG (83.1 grams of CO2‐
CA_a.htm126 Department of Energy, “California Natural Gas Summary,” http://www.eia.doe.gov/dnav/ng/ng_sum_lsum_dcu_S . 127 California Energy Commission, 2009 Integrated Energy Policy Report, CEC–100–2009–003‐CMF. 128 California Air Resources Board, Compressed Natural Gas (CNG) Motor Vehicle Fuel Specifications, May 19, 2010.
64

equivalent per megajoule) when compared to CNG (68.0 grams of CO2‐equivalent per megajoule).
Biomethane Methane derived from renewable resources, also known as biomethane, can be integrated into the upstream natural gas fuel infrastructure supply chain. The most direct application is to inject biomethane directly into the natural gas pipeline. However, there are a number of barriers to this approach. Expensive gas quality testing and interconnection fees, as well as different gas quality requirements between utilities, represent the first significant obstacle. Additionally, existing law effectively restricts biomethane derived from landfill gases to be injected into the natural gas pipeline.129 Finally, a biomethane producer must be located close to the natural gas pipeline.
Alternatively, biomethane can be combined with gas from the pipeline for direct conversion into CNG or LNG. Biomethane can also be kept separate from natural gas and be compressed or liquefied for use as pure, low‐carbon fuel. This is particularly applicable in situations where the supply of biomethane is colocated with the demand for natural gas as a transportation fuel, such as dairy farm vehicles or waste management fleets. For example, the Energy Commission is funding a grant for Northstate Rendering to produce biomethane from rendering waste, which will be compressed and supplied to an on‐location fueling station, which serves a fleet of local trucks.
The use of biomethane as a low‐carbon substitute for transportation natural gas is only one possible use for biomethane. Other opportunities include the use of biomethane for the production of renewable hydrogen, for reducing the lifecycle carbon intensity of other biofuels, or for use in generating renewable electricity (whether for use in the transportation sector or other sectors). All of these applications help reduce GHG emissions and fossil fuel dependence and would help the state meet a number of its climate and energy policies. Biomethane production is discussed in greater detail in the “Biofuels” section of the investment plan.
Retail and Fleet Fueling Infrastructure One of the primary barriers to the penetration of NGVs is the lack of available fueling infrastructure. Until this problem is addressed, the use of NGVs will likely be confined to medium‐ and heavy‐duty vehicles, which can use CNG/LNG stations on a regular route.
Fueling infrastructure for NGVs in California includes a combination of public and/or private access, CNG and/or LNG dispensing, and fast fill or time fill for CNG dispensing.130 The number of stations is presented in Table 15.
129 Assembly Bill 4037 (Hayden Chapter 932, Statutes of 1988). 130 Fast fill and time fill refers to the speed at which a natural gas vehicle is refueled. Fast fill dispensers can perform a complete fill within several minutes. Time fill dispensers require several hours, often overnight. However, fast fill dispensers require more expensive equipment and maintenance. Fast fill dispensers are the only practical type of dispensers for public retail fueling stations, which necessarily serve multiple vehicles each day. However, time fill stations are expected to be more economical for dedicated fleet users.
65

Table 15: Natural Gas Fueling Stations
Publicly Accessible Stations Private Access Stations CNG 140 424 LNG 13 19
Source: California Natural Gas Vehicle Coalition, U.S. DOE Alternative Fuels and Advanced Vehicles Data Center
Home refueling options for natural gas also exist, primarily for the light‐duty vehicle market. These home refueling stations typically have a long refill time (up to 10 hours). An example of this technology used in the United States is the “PHILL” Fuelmaker, which compresses natural gas from a standard utility gas line for use in a CNG vehicle. The new PHILL unit is expected be ready for production and sale in North America within the next several months131, making home refueling more accessible for NGV owners.
Table 16 presents Energy Commission estimates of current natural gas infrastructure costs, based on the station’s size (measured in standard cubic feet per minute [scfm] for CNG and gallon capacity for LNG). All of the prices for CNG stations are presumed to include fast fill dispensers, which may not be necessary for certain applications (such as those that return to a designated station overnight). To reduce these estimated station costs, the federal government offers a tax credit for up to 30 percent of the cost, not to exceed $30,000, if the station is installed in 2011.
Table 16: Natural Gas Infrastructure Costs
Infrastructure Type Estimated Cost Range132
Small CNG Station (< 500 scfm) $600,000 - $1,500,000
Medium CNG Station (500-2,000 scfm) $1,200,000 - $3,500,000
Large CNG Station (> 2,000 scfm) $3,000,000 - $5,000,000
Large LNG Station (> 15,000 gallons storage capacity) with Combined CNG dispensing $1,000,000 - $2,200,000
Home Fueling $3,600133 Source: Gladstein, Neandross & Associates, California Energy Commission
Self‐contained dispensing systems, such as the Galileo Nanobox, also offer the option to provide small fuel dispensers at existing fuel stations. This significantly reduces the cost of new natural gas fueling infrastructure by using existing land, concrete infrastructure, and canopies.
The Energy Commission has invested $5,741,388 for the installation of 20 new stations or upgrades to existing stations across the state; 16 CNG stations, 3 LNG stations, and 1 combination station. Some of these stations include multiple dispensers at the same site. Each of
131 Phone conservation with Michael Eaves, Clean Energy on January 6, 2011. 132 Estimates based on submitted proposals as well as discussions with industry representatives. 133 Consumers Reports, March 2008, “Review of the 2008 Honda GX.”
66

these installations was targeted to match the fueling needs of particular fleets and natural gas customers.
Discussions with vehicle manufacturers, fuel providers, local air districts, and other program stakeholders revealed that additional investment in natural gas infrastructure is critical to the adoption of NGVs and market transformation for this alternative fuel.134 Fuel accessibility is one of the key considerations for fleet managers for the purchase of NGVs. Increased demand for clean fuel alternatives to gasoline and diesel along with regulatory requirements, such as the SCAQMD Fleet Rule, has driven an increase in natural gas infrastructure by private investors.
The combination of CNG and LNG dispensing at a single station is particularly attractive because LNG can be vaporized and pressurized into CNG with conventional pumps using less energy than it takes to compress pipeline gas into CNG. These stations also allow the station owner to serve different markets using much of the same support equipment, such as canopy and pavement, without a significant difference in the cost of the station. These combination stations also support the corridor approach to refueling, making CNG and LNG available along major goods movement corridors to support regional and interstate trucking operations. These corridors typically run through areas with the worst air pollution, making a stronger case for fueling infrastructure to support cleaner vehicle technologies.
Industry and government strongly support the corridor refueling concept. The Interstate Clean Transportation Corridor (ICTC) project, supported by the U.S. DOE, employs public and private partnerships to expand alternative fuel vehicle use and refueling station access throughout the Western United States.135 The ICTC has successfully developed 23 natural gas refueling stations in California and Nevada. The ICTC continues to work to build a sustainable corridor of LNG refueling stations along the I‐15, I‐80, and I‐5 corridors connecting Southern California, Salt Lake City, and Northern California to support the movement of goods by alternative fuel heavy‐duty trucks throughout the Western United States. Several of the stations proposed for funding by the Energy Commission will directly support corridor refueling along I‐10, I‐5, SR‐99, and other in‐state goods movement corridors.
Recent federal funding further demonstrates government and industry support to expand refueling infrastructure along goods movement corridors. One example of many is the U.S. DOE’s award of nearly $5.6 million for a LNG station in Las Vegas, Nevada, that will provide a 700‐mile LNG fueling corridor along one of the nationʹs most heavily traveled truck routes for the movement of various goods.136
The aging stations and equipment in California do not meet today’s fleet refueling needs. Many fleets involved in goods movement are concerned with the bottom line, which, in part, depends on the reliability of fueling equipment and time it takes to refuel their fleets. In the 2010‐11 Investment Plan, the Energy Commission dedicated $2 million to natural gas station upgrades
tictc.html
134 Industry meetings with Freightliner, Kenworth, Navistar, Westport, December 2010 – January 2011. 135 Interstate Clean Transportation Corridor, “About the Interstate Clean Transportation Corridor,” http://ictc.gladstein.org/abou . 136 Department of Energy, “Secretary Chu Announces Nearly $300 Million in Clean Cities Grants to Support Clean Fuels, Vehicles, and Infrastructure Development,“ http://www.energy.gov/7843.htm.
67

for public fleets, particularly school districts and local governments. While the Energy Commission has not yet issued a solicitation for this allocation, this funding will likely be substantially oversubscribed based on conversations with managers of existing stations, especially those serving school district bus fleets and growing transit fleets.
Recognizing that market transformation for natural gas will occur only when range anxiety and fleet fueling operations are addressed, the Energy Commission proposes an allocation of $8 million to support the installation of new natural gas fueling infrastructure and upgrades to existing infrastructure. This funding will be closely tied toward identifiable needs in LNG and CNG fueling infrastructure, focusing primarily on long‐haul LNG goods movement corridors and pairing new CNG stations with high‐volume fleets that make a concerted effort to convert from diesel to CNG. Based the Energy Commission’s cost share for the 20 natural gas station projects funded from the infrastructure solicitation, this funding will support roughly 30 new stations and/or existing station upgrades.
Light-Duty Vehicles In 2009, there were 36,100 NGVs of all sizes registered in California. Of these, light‐duty vehicles represent 69 percent of the total NGV population but consume only 12 percent of the natural gas fuel used as vehicle fuel. At present, Honda is the only original equipment manufacturer (OEM) that offers a light‐duty passenger natural gas sedan. The Honda Civic GX is comparable to the conventionally fueled Honda Civic DX, but possesses a maximum vehicle range of 225‐250 miles on a full tank, with a fuel tank capacity of about eight GGEs. In 2010, GM announced that it would begin offering natural gas versions of cargo and shuttle van models (Chevrolet Express and GM Savanna), intended for commercial fleets. Worldwide, however, the market for NGVs is much wider; GM alone, mainly through its Opel subsidiary, offers 18 NGV models for the world market.137
In addition to OEM models, some companies offer conversions to natural gas. California regulations prohibit the after‐market conversion of emission‐controlled vehicles with retrofit systems to operate on an alternative fuel, such as natural gas, unless the converted vehicles and engines have been evaluated and certified by the ARB. Two firms (Baytech and BAF) have ARB certification to convert light‐duty conventional vehicles to light‐duty dedicated NGVs. Baytech offers various GM light‐ and medium‐duty vehicles on an aftermarket basis (including pickups, vans, and cutaways). BAF offers natural gas Ford Crown Victoria (used for taxis), as well as E‐series passenger cargo vans and F‐series pickup trucks.138 Additional firms, such as Natural Drive and Altech‐Eco, have obtained emissions certification from the U.S. Environmental Protection Agency for certain dedicated and bi‐fuel vehicle conversions, but have not obtained full certification from the ARB.139 In 2007, California‐based IMPCO sold about 13,000 natural
s‐a.pdf
137 Comments submitted by the California Natural Gas Vehicle Coaltion, Energy Commission Docket Number 08‐ALT‐1, January 23, 2009. 138 NGV America, Guide to Available Natural Gas Vehicles and Engines, http://www.ngvamerica.org/pdfs/marketplace/MP.Analyses.NGV 139 NGV Global News, January 29, 2010. Confirmed by Seong Kim of ARB
68
gas and propane conversion kits per month to the world market, but none in California, primarily because of the expense required to comply with current ARB certification.140
Initial vehicle costs remain a significant issue for the light‐duty NGV market. The incremental cost for OEMs’ NGV offerings ranges from roughly $9,600 for the Civic GX to $15,910 for the Chevrolet Express and GMC Savana. These incremental costs are roughly inline with the cost of converting a conventional pick‐up truck to natural gas, approximately $15,500.141 A federal tax credit for the purchase of light‐duty OEM NGVs and for the conversion of light‐duty vehicles to natural gas expired at the end of 2010, leaving customers with a high initial vehicle cost. As natural gas prices are lower than gasoline, owners of these vehicles can expect to recoup some of this initial cost difference. The federal fuel excise tax credit, currently extended through 2011, offers consumers an additional $.50 per GGE.142 Additionally, most NGVs are permitted single‐occupant access into California’s high occupancy vehicle lanes, which makes them a more attractive proposition.
Given anticipated changes to the ARB’s Low Emission Vehicle regulations, the regulatory environment for CNG vehicles in California is favorable. The ARB proposes to revise current LEV regulations to achieve Super Ultra Low Emission Vehicle exhaust emissions fleet average by 2022 (LEV III). More important for NGVs, the ARB proposes to lower current evaporative emissions standards and effectively require that larger proportions of California vehicles must be certified for zero evaporative emissions. CNG vehicles will be relatively easy to certify to exhaust emissions below Super Ultra Low Emission Vehicle standards and the zero evaporative standards.
Table 17: Natural Gas Funding Allocation
Natural Gas Fueling Infrastructure $8 Million
Medium- and Heavy-Duty Vehicles Deployment Incentives See Medium- and Heavy-Duty Vehicles section
Total $8 Million
Source: California Energy Commission
3253
140 Presentation by Tim Standke, IMPCO, on September 18, 2009. 141 E‐mail from Matt Weiss, NGV America, dated December 14, 2010. E‐mail from Tom Sheehan, NGV America, dated December 14, 2010. 142 U.S. Department of Energy, “Federal Incentives and Laws for Natural Gas,” http://www.afdc.energy.gov/afdc/laws/laws/US/tech/ .
69

Propane Propane can offer significant and immediate petroleum use reductions and moderate GHG emission reductions. Currently, propane can be produced as a by‐product of either natural gas processing or petroleum refining; however, current research is showing promise in the production of propane from renewable resources. According to the Western Propane Gas Association, California consumed about 620 million gallons of odorized propane in 2008, and 70‐80 million gallons of this consumption was used specifically for on‐ and off‐road vehicles.
Propane is very attractive in terms of pricing compared to both diesel and petroleum, and if federal excise tax credits for propane use continue to be made available in the future, propane will be a viable option for fleets. According to the U.S. DOE, the average cost for propane is $2.69 per gallon.143 The federal government also offers a fuel use tax credit of $0.50 per gallon‐gallon equivalent, which acts as an incentive to propane users to offset the energy loss with the use of propane in vehicles. Propane’s energy content is approximately 25 percent less than gasoline. Even with the energy loss, propane’s price remains attractive to fleets as an alternative fuel option.
Upstream Fuel Infrastructure About 570 million gallons of propane are produced annually in California. Of this, about 430 million gallons of this propane come from refinery production, and the remainder comes from natural gas plant production. The refinery propane production numbers have varied slightly in recent years, but not significantly. This is a result of the refinery runs of crude oil. Propane sourced from natural gas plants continues a modest decline, although new natural gas fields in the San Joaquin Valley have yet to come into production. The supply source is typically a function of price, rail car transportation costs, rail car availability, and contract provisions. Gradual demand increases in the propane autogas market can be easily accommodated by increased imports or shifting indigenous supply from declining markets to growing ones.144
From the refinery or processing plant, propane is shipped in two stages—first, to an intermediate terminal and from there to the local propane supplier for delivery to the end user. All propane is transported under pressure in its more compact liquid form. Propane is mainly transported via a pipeline and truck combination but can also be transported via rail in steel cylinders. Because there are no pipelines into or out of California that carry propane as a finished product, the area relies on imports mostly by rail car.
Two types of trucks are used for propane transportation: a highway transport (which typically carries 7,000 to 12,000 gallons) and a smaller bulk delivery truck, called a ʺbobtailʺ (which carries 1,000 to 5,000+ gallons). Both types of trucks are constructed of high‐strength steel.145
About 60 percent of propane used in California is produced in California refineries, while the rest of the propane imported typically comes from Texas, the Midwest, Utah, Washington, and Canada. While a majority of the propane used in California is domestically produced, this
pane.pdf
143 As of July 2009, according to U.S. DOE ERRE Price report. Does not include excise tax credit. 144 E‐mail from Lesley Garland, Western Propane Gas Association, April 25, 2011. 145 National Propane Gas Association Propane, “Facts About Propane,” http://www.npga.org/files/public/Facts_About_Pro .
70

number can vary depending on seasons. California tends to be a net exporter in the summer, while the amount of propane it imports in the winter can increase significantly if California has an especially cold winter.
The Energy Commission is also following the development of biopropane for vehicles. Renewable propane can be derived from feedstocks such as sugarcane and corn. The derivation of renewable propane requires little additional energy use and results in a product that contains the same energy content as propane derived from petroleum. As indicated in a report by the Gas Technology Institute’s report, prepared for the Propane Education and Research Council, significant quantities of bio‐LPG could be ready for use in the next 5 to 10 years.146 Additionally, bio‐DME is being used as a blendstock for propane and is being tested in various demonstration projects in California, including the Port of Long Beach. This could provide a further emission reduction benefit while effectively using the existing propane supply.
Local Fuel Infrastructure Propane retail infrastructure is already widely available and can easily be expanded as demand for propane as a transportation fuel increases. There are about 228 propane fueling stations already in place for vehicles in California, according to the U.S. DOE’s Alternative Fuel and Advanced Vehicle Data Center. California has the second largest number of accessible propane fueling stations for vehicles in the nation, which can already support an expanded vehicle market with funding for light‐ and medium‐duty vehicles.147 Infrastructure for propane vehicle fueling could expand quickly, as existing propane dispensing stations can be used for vehicle fueling through the addition of fuel capacity, a tank pump, and metering equipment. With the addition of this equipment, virtually any propane tank/ station in California can be retrofitted to meet a propane vehicle’s needs. Additionally, many fuel suppliers have indicated that they are willing to enter into a contract to install fueling equipment and stations for propane fleets at no charge, given the fleet has a minimum monthly throughput. This will promote the increasing demand for propane as a transportation fuel in the years ahead.
Due to its low cost and ease of installation, a minimal amount of funding is needed to support propane infrastructure. Based on information contained in applications for the DOE’s Clean Cities program, coupled with propane working group information, the Energy Commission estimates that the cost of a fueling station is $35,000 to $50,000 for a 2,000 gallon storage tank, and $75,000 to $150,000 for a 30,000 gallon tank, including four dispensers. Additionally, federal incentives already offer a sufficient support for propane infrastructure, as indicated in Table 18.
3955146 Gas Technology Institute, Expert Analysis of the Concept of Synthetic and/or Bio‐LPG, February 19, 2010, http://staging.propanecouncil.org/WorkArea/DownloadAsset.aspx?id=
s.html147 Department of Energy, “Alternative Fueling Station Total Counts by State and Fuel Type,” http://www.afdc.energy.gov/afdc/fuels/stations_count
71

Table 18: Propane Infrastructure Summary
Current Stations in California 228
Station Costs 2,000 gallon storage tank: $35,000-$50,000 30,000 gallon storage tank: $75,000-$150,000 Station equipment upgrades: $2,000
Federal Incentives Up to 30 percent or $30,000 of infrastructure installation costs for stations installed after January 1, 2011
Source: California Energy Commission
The Energy Commission intends to support the Northern California sector pilot project for regional use of propane autogas. This funding would cover the cost of about 10 stations along the I‐5 corridor in Northern California. This funding supports a larger effort to launch a pilot project in Northern California that integrates vehicle deployment, infrastructure development, and workforce development for the alternative fuel industry. Propane is considered the most viable option for alternative fuel market development in Northern California, where propane is easily accessible. This pilot project will also serve as a model for the benefits propane as autogas can have in rural communities with limited access to other alternative fuels. For this purpose, the Energy Commission allocates $500,000 for propane fueling infrastructure.
Light-Duty Vehicles Currently, there are four light‐duty vehicles certified by the U.S. EPA and ARB. Roush has certification for the propane F‐150 and F‐250 trucks, as well as the E‐150, and 250 cutaway vans, which have been attracting interest from several fleet owners including Time Warner, PrimeTime, ThyssenKrupp, and Direct TV.148
The incremental cost for purchasing a light‐duty propane vehicle ranges from $7,500 to $10,400. Roush anticipates that a $3,500 per vehicle incentive is needed to generate sales and stimulate the growth of the light‐duty propane market.149 Nonetheless, fleet owners have expressed interest in using propane as an alternative to gasoline due to its cost and availability.
With the emergence of new propane vehicles in 2010 and 2011, there is an increased interest in using light‐duty vehicles as part of delivery, airport, and utility fleets. Given the new models, current propane fuel pricing, and reasonable buydown costs for these vehicles, funding availability for these vehicles will help ensure the purchase of an alternative fueled vehicle over a gasoline or diesel vehicle.
Other states across the nation already widely use propane in their public fleets. Recently Texas was awarded $25.5 million for propane vehicle and infrastructure development. Of the 882 vehicles being deployed, 645 of these vehicles will be light‐duty vehicles for use by public school and business fleets. Market readiness for these vehicles will allow them to serve as an early action in reducing GHG emissions in the transportation sector.
Manufacturers indicate that funding in the form of vehicle incentives in the first few years is critical to the growth of the propane vehicle market in California. Propane can play an
148 Meeting with Todd Mouw, Roush, January 5, 2011. 149 E‐mail from Todd Mouw, Roush, September 8, 2009.
72

especially significant role in rural communities, which may not have the option of using other alternative fuel vehicles due to the lack of infrastructure. Propane is readily available in most rural communities in California already, and the cost of installing either an entire station or the appropriate fueling equipment for autogas use is very affordable. As the market grows in California, manufacturers anticipate that the need for funding support will decrease by about 20 percent each year.
Roush estimates that covering about 30‐35 percent of the incremental vehicles cost is sufficient to stimulate propane vehicle sales. Considering the funding available for propane vehicles through the Energy Commission’s anticipated gaseous fuel incentive program for $3 million in 2011, along with incentives for vehicles being offered through the Western Propane Gas Association through August 2011, it is anticipated that these funds will be sufficient to cover expected vehicles through 2011. For expected vehicles sales through June 2012, the Energy Commission intends to allocate $1 million to support the growth of the light‐duty propane vehicle market in California.
Table 19: Propane Funding Allocation
Fueling Infrastructure $500,000
Light‐Duty Vehicle Incentives $1,000,00
Medium‐ and Heavy‐Duty Vehicle Incentives See the Medium‐ and Heavy‐Duty Vehicle Section
Total $1,500,00
Source: California Energy Commission
73

Biofuels Feedstocks There is a broad variety in the feedstocks available for alternative and renewable fuels. For this investment plan, these feedstocks are divided into two categories: waste‐based and purpose‐grown. For each feedstock, common characteristics are addressed, such as volume, sustainability, carbon intensity, market potential, and likely fuel pathway. By identifying and contrasting these characteristics, the Energy Commission can weigh the relative advantages and disadvantages of each feedstock.
Most biofuels used in California continue to be derived from purpose‐grown feedstocks such as corn and soy. Internationally, oil palm and sugar cane predominate as biofuel feedstocks. All four of these major feedstocks can be grown economically at industrial scales, yet all create serious sustainability concerns. The Energy Commission seeks to identify and promote alternative biomass‐based feedstocks that can serve as the basis for liquid and gaseous fuels for California’s transportation sector. Most waste‐based and alternative feedstocks face substantial challenges and barriers to market entry; high costs, uncertain supplies, and not yet commercially viable process technologies prevent waste‐based feedstocks and alternative feedstocks from forming a larger basis in California’s alternative fuels markets. This year’s investment plan investigates waste‐based and alternative feedstocks in more detail than in previous years to understand their potential and market barriers and identify specific opportunities to advance their development through program funding. This enhanced investigation also complements Energy Commission work to review and update the Bioenergy Action Plan.
Waste-Based Feedstocks This category includes feedstocks that can be used as a source of transportation fuel but would otherwise need to be landfilled or disposed of in some other way. California’s robust agricultural and food processing sectors generate large volumes of biomass‐based waste material that is potentially suitable for low carbon alternative fuel production. Landfills, urban transfer stations, and wastewater treatment plants also generate high volumes of waste materials with similar potential. These waste‐based feedstocks avoid difficult issues, such as the use of high productivity arable lands for fuel production, sustainability, or indirect land use effects. These feedstocks also foster some of the highest GHG emission reductions. For these reasons, the Energy Commission is particularly interested in expanding the use of waste‐based feedstocks, such as those identified below, in the creation of alternative and renewable transportation fuel. The volumes in millions of bone dry tons (BDT) and fuel potential for these feedstocks are summarized in Table 20.
74

Table 20: Waste-Based Feedstock Volumes and Fuel Potential
Feedstock Volume Technically Available150
Biomethane Potential (billion cubic feet)
Biofuel Potential151 (million gge)
Diesel Gallon Equivalent Potential (million)
Agricultural Residue 4.3 M BDT 9.3152 302 261 Animal Manure 3.8 M BDT 14.6 127 110153 Fats, Oils and Greases 14.4 M lbs Unknown 63.6 55 Food Wastes 0.8 M BDT 1.9154 56 48 Forest Biomass Waste (via cellulosic ethanol) 14.2 M BDT N/A 784155 678
Forest Biomass Waste (via gasification) 14.2 M BDT 30.7156 1000 864
Landfill Gas 79 BCF 39.5157 368 318 Municipal Solid Waste 10 M BDT 25.9158 704 608 Waste Water Treatment Plants 9.6 BCF 4.8155 45 39 Total 126 2,566159 1,755158
Source: Multiple sources, see footnotes
Agricultural Residue A large source of available biomass in California will come from agricultural residues. Agricultural residues can be processed using a variety of technologies, producing process heat, electricity, and/or transportation fuel as an end product. When looking at the transportation sector, agricultural residues are often processed using technologies including, but not limited to, gasification, anaerobic digestion, fermentation and hydrolysis to produce either liquid or gaseous transportation fuels such as hydrogen, biogas, and cellulosic ethanol.
Primarily composed of orchard and vine, field and seed, and vegetable residues, agricultural residues will most likely be sourced from the Central Valley as well as the coastal and southern
150 Technical potential accounts for residues needed to maintain soil fertility and tilth or for erosion control purposes. There are a number of technical and social constraints that can limit the amount of biomass that can be sustainably collected. 151 California Biomass Collaborative, California Biomass and Biofuels Production Potential, December 2007. Assumes thermochemical process of gasification followed by Fischer‐Tropsch synthesis. Does not assume any constraint for moisture content. Unless otherwise noted, 27 million BDT yields 1.9 billion gge. 152 Ken Krich, Biomethane from Dairy Waste: A Sourcebook for the Production and Use of Renewable Natural Gas in California, July 2005. Assumes 2.4 million BDT of agricultural residues yields 5.2 billion cubic feet of methane. 153 California Biomass Collaborative, 2008. 154 Ken Krich, July 2005. Includes meat processing waste, cheese whey, and food processing waste. 155 Brian Hunt, “Woodwaste to Ethanol: A Second‐Generation of Ethanol Process.” Presented at Ethanol Policy Forum, October 24, 2008. Current technology has proven 1 BDT of wood waste to yield 45 gallons of ethanol, but a yield of 80 gallons of ethanol may be possible. 156 Assumes same conversion ratio used for agricultural residues. 157 Assumes 50 percent methane content. 158 Ken Krich, July 2005. Includes landfilled manure, landfilled composite organic waste, landfilled food waste, landfilled green waste. 159 Assumes forest biomass converted using gasification process.
75

valleys.160 With California having 9.15 million acres of crops planted in 2007, there is a gross potential of 8.7 million BDT per year and a technical potential of 4.3 million BDT per year of agricultural residues available for conversion to energy.161 Based on the technical potential, this is enough to produce 220 million GGEs annually through 2020.162The GHG reduction when using agricultural wastes as a feedstock can vary significantly depending on the feedstock characteristics, conversion technology, and fuel produced; however, reductions can potentially be significant – around 80 percent for cellulosic technologies and in the mid 80s for some anaerobic digestion processes.163 Also, because agricultural residues are classified as a waste stream, they could be considered highly sustainable when collected and processed in a sustainable manner.
The Energy Commission proposed nearly $1.5 million in funding for the Advanced Bioenergy Center Mendota. This project integrates four technologies in one facility to produce advanced ethanol, renewable biomethane, compost and fertilizer, and green e‐electricity, using sugar beets and almond prunings as feedstocks. Once this project is complete, it will convert an estimated 80,000 tons of almond prunings to produce 6.3 megawatts of renewable electricity.
Some of the most difficult components to navigate when considering using agricultural residues as a feedstock are collection, transport, and storage. Collecting and transporting waste residues can be costly and could potentially jeopardize the economic feasibility of a project. A key to reducing transport costs is to locate production facilities as close to feedstock sources as possible, preferably within 50 to 100 miles.164 Although transporting feedstock using rail or barge are options, often these residues are transported by truck as it allows for the greatest amount of flexibility. The cost of transporting via truck can range from $0.12 to $0.23 per ton‐mile and depends heavily on the price of diesel.165 Another factor to consider is the seasonality of agricultural production. Crops are seasonal, and production facilities will have to adjust to feedstock supplies through either a variety of crop residues or expanded storage capabilities.166
Animal Manure Animal manure is an optimal feedstock for producing energy or biofuels because it is a waste stream available in California. California’s agricultural animal population is close to 70 million, the majority being poultry and cattle.167 The manure these animals generate has a gross potential of more than 11 million BDT per year and a technical potential of 3.8 million BDT per year.168 Anaerobic digestion of animal manure creates biogas, which has a potential of 14.6
160 California Biomass Collaborative, Biomass Resource Assessment for California, 2007. 161 Ibid. Technical potential accounts for residues needed to maintain soil fertility and tilth or for erosion control purposes. There are a number of technical and social constraints that can limit the amount of biomass that can be sustainably used. 162 Draft Bioenergy Action Plan, 2010. Number found in Bioenergy Action Plan reduced to exclude animal manure and food processing. 163 GHG Reductions based on staff estimates. 164 Draft Bioenergy Action Plan, 2010. 165 Ibid. 166 California Biomass Collaborative, Biomass Resource Assessment for California, 2007. 167 California Biomass Collaborative, An Assessment of Biomass Resources in California, December 2006. 168 Ibid.
76

billion cubic feet BCF or 110 million DGE.169 The biogas can be cleaned and used as biomethane, or burned to generate heat or electricity.
If the manure is kept on the farm, it can be collected by flushing the barn with water or by scraping. Once collected, the feedstock is anaerobically digested onsite, or special transport companies collect the manure and take it to centralized anaerobic digesters. The quantity of biogas produced depends on how the manure is collected and stored. Generally, the fresher the manure, the greater the biogas generation potential.170 Manure has an estimated 80 percent to 85 percent GHG emission reduction from the diesel baseline.
A number of dairies in California use manure as a feedstock for producing energy; however, most of those facilities are producing electricity. Only the Hilarides Dairy in Lindsay, California, is producing a transportation fuel. The Hilarides Dairy originally collected biogas for electricity generation but has since expanded to producing biomethane that is used onsite in milk trucks. This is a small‐scale demonstration project; currently, no commercial projects are using animal manure to produce transportation fuel in California.
One of the greatest challenges of using manure as a feedstock is the limited number of large dairies and farms. Scale of production is an important factor in determining economic feasibility. An alternative to large dairies or farms are clusters of smaller ones that could transport their feedstock to a central anaerobic digestion site. Another challenge is access to an end use market. Once biomethane is produced, it needs to be distributed to the transportation market or used onsite in agricultural vehicles such as tractors, combines, threshers, pickup trucks, and milk trucks. If the volume produced exceeded what could be used onsite, the excess would have to be either trucked or piped to a location where it could be sold into the market.
Fats, Oils, and Greases When waste fat, oil, and grease (FOG) from restaurants is dumped down drains, it solidifies and clogs sewers. To prevent clogs, some wastewater service areas require restaurants to collect FOG in grease traps. The FOG can then be picked up, delivered to a wastewater treatment facility, and converted to biodiesel or added to anaerobic digesters to produce gas for electricity.
Before conversion to biodiesel, brown grease needs to be separated from FOG by screening, settling, heating, and filtering. Wastewater high in organics is left over; water is recovered from it, and the remaining material can be added to an anaerobic digester. The brown grease is then converted to biodiesel. Because it is high in free fatty acids, it requires an acid‐catalyzed process before transesterification—the traditional process used to produce biodiesel. 171 Glycerin, methanol, and water are the remaining co‐products.172
169 California Biomass Collaborative, 2008.
esterification is a chemical process in which the ester groups of a FOG material are exchanged
dy in San ntation_15APR
170 Ibid. 171 Transwith alcohol groups, to produce a mix of glycerin and biodiesel. 172 URS Corporation, “FOG Control & Beneficial Reuse: A Case StuFrancisco,” http://www.pprc.org/BrownGreaseSymposium/docs/Presentations/URS_Prese09.pdf.
77

Research studies suggest that the best use of FOG is conversion to biodiesel. In one study, the net energy comparison showed 1,120 kilojoules per liter‐FOG for biodiesel and 1,010 for anaerobic digestion; the GHG comparison showed a reduction of 0.48 kg CO2 per liter‐FOG biodiesel and 0.23 for anaerobic digestion.
for
cent free fatty acids, contamination with food and
s of
ND Corporation, fuels derived from al
r
ntial to
using the Energy Commission’s C is
173 Challenges to using FOG for biodiesel productioninclude foul odor, content of up to 98 pertrash, need to remove sulfur, heavy emulsification, cold flow (FOG is solid at room temperature), and water contamination.
The gross amount of available FOG was calculated for the United States by Wiltsee.174 Using Wiltsee’s results for Sacramento, about 414 million pounds of FOG are available per year inCalifornia (11.2 pounds per person * 36,961,664 people175). Because it takes about 7.5 poundFOG to make one gallon of biodiesel, potential production of biodiesel is about 55 million gallons per year. According to a 2011 report from RAanimal fats and waste oils will never have a significant role in the larger domestic commercimarketplace due to limited production potential.176
Despite an upward cap on market growth, producing fuel from FOG in wastewater service areas with a large quantity of readily available feedstock will stop 75 percent of sanitary seweoverflows, keep FOG out of landfills, help meet California’s Bioenergy Action Plan goals, reducereliance on fossil fuels, and reduce GHG emissions.177 FOG‐based biofuel has the potemake a modest contribution to meeting California’s goals for low‐carbon biofuel use. Currentfuel production demonstrations and conversion technology research efforts include:
• East Bay Municipal Utility District (EBMUD) is using program funds to build a FOG receiving station and small‐scale biodiesel production facility.
• San Francisco Public Utility Commission (SFPUC) is PIER funds to test removal of brown grease from FOG and produce biodiesel. SFPUusing licensed technology from BlackGold Biofuels.
• BlackGold Biofuels, a Pennsylvania‐based company, has developed technology to produce high‐quality biodiesel from FOG.
173 Chakrabarti, Alicia R., John M. Hake, Idit Zarchi, Donald M.D. Gray. 2008. Waste Grease Biodiesel Production at a Wastewater Treatment Plant. Water Environment Federation. 174 Wiltsee, G., Appel Consultants, Inc., Urban Waste Grease Resource Assessment, November 1998, NREL/SR‐570‐26141. 175 U.S. Census Bureau, “California QuickFacts,” http://quickfacts.census.gov/qfd/states/06000.html. 176 Bartis, James T. and Lawrence Van Bibber, RAND Corporation, 2011, Alternative Applications,
Fuels for Military s/MG969.html.http://www.rand.org/pubs/monograph
I: FOG‐to‐177 San Francisco Public Utilities Commission, “San Francisco’s Future Bioenergy Park PhaseBiodiesel,” http://www.energy.ca.gov/proceedings/2008‐ALT‐1/documents/2009‐02‐11_workshop/presentations/Lewis_Harrison.PDF.
78

• BioFuelBox mini‐refinery, a San Jose‐based company, developed a process to separate wastewater into proteins and carbohydrates for anaerobic digestion, and lipids for
n, rete
the FOG, screens to remove large solids, grinders, pumps, blend tanks, and an t system. EBMUD’s FOG receiving station is expected to cost $1.5 million. The
s,
are processed every year in California.180 The gross
ggest
o
waste to produce ethanol at its Ontario,
a ry hierarchy that recommends food waste be reduced first, then used to feed
biodiesel.178
• Piedmont Biofuels, a North Carolina‐based company, opened a plant in 2010 to producebiodiesel from waste grease.179
Restaurants pay third‐party companies to clean out grease traps and dispose of FOG. For wastewater treatment districts such as EBMUD and SFPUC, the third‐party companies deliver FOG to the district’s receiving station, where they pay a tipping fee. EBMUD’s receiving statiowhich will be built with Program funds, will have truck unloading bays, below‐grade conctanks to receiveodor treatmensmall‐scale equipment used to separate brown grease from FOG is expected to cost about $350,000.
Food Waste Food waste includes waste products from fruits and vegetables processed by canners, freezerdryers, and dehydrators, as well as nut shells, fruit pits, rice hulls, cotton gin trash, and whey resulting from producing cheese. The League of California Food Processors estimates that 14 tons to 16 tons of fruits and vegetablesfood waste potential is 1 million BDT per year, and the technical food waste potential is 0.8 million BDT per year.181 However, when using food waste as a feedstock, one of the bichallenges is seasonal availability.
Food waste would most likely be anaerobically digested to produce biomethane, but it can alsbe fermented to produce a gasoline alternative. Parallel Products, a company that runs a number of recycling facilities nationwide, uses beverageCalifornia, facility. Through the fermentation of sugar laden liquids and the distillation of alcohol from beverage and industrial waste streams, Parallel Products produces more than 5 million gallons of waste‐derived ethanol annually.182
The best “use” of food waste is to reduce the amount of waste. The U.S. EPA has developedfood waste recove
178 Treatment Plant Operator, “Mini‐Refinery Converts Fats, Oils and Grease into
nverts‐Fats‐Oils‐and‐Grease‐Biodiesel,” http://www.tpomag.com/editorial/view/2161/Mini‐Refinery‐Cointo‐Biodiesel. 179 Herald Sun, “Biofuel plant to turn waste grease into top‐quality
o‐fuel,” http://www.heraldsun.com/view/full_story/8794804/article‐Biofuel‐plant‐to‐turn‐waste‐grease‐inttop‐quality‐fuel 180 Ken Krich, Biomethane from Dairy Waste: A Sourcebook for the Production and Use of Renewable Natural Gas in California, July 2005
sessment for California, Draft Report” April
181 California Biomass Collaborative, “Biomass Resource As2005 182 Parallel Products, “Ethanol Recovery andProduction,” http://www.parallelproducts.com/ethanol.html
79

hungry people, feed animals, or processed for fuel.183 Assuming that U.S. EPA’s campaign is successful, the market potential for fuel made from food waste will be decreasing.
Forest Residue California’s 40 million acres of forestlands face increasing risks from severe wildland fires, dueto unhealthy accumulation of forest growth from historic fire suppression policies and climatechange. State and Federal forest age
ncies recommend active thinning to reduce the risk of high
m
nt r
per year of gasoline. A new cold pyrolosis conversion
‐
from conifer waste streams is not yet commercially viable due to er
e lifornia has 26 active power plants that consume about 3.2
million
Numerand useduringlangua
,
severity fires, potentially creating large volumes of woody biomass waste materials. This situation presents an opportunity to reduce these unstable fuels by using woody biomass froforest restoration as carbon‐neutral feedstocks for biofuels. Preliminary estimates indicate that about 40 percent of California’s total biomass resources are contained within the 40 million acres of forestlands in California.
Estimates of potential forest biomass waste streams available for energy production depend on assumptions and method. A recent study by the California Department of Forestry and Fire Protection, funded by the Energy Commission, estimated that gross non‐merchantable standingforest and shrub biomass is 1.32 billion BDT. The proportion of this total that is technically available (not limited by legal or engineering constraints) is 699 million BDT. This study also estimated that potential annual biomass that is technically available from forest managemeactivities would total 14.2 million BDT per year. Assuming a conversion factor of 80 gallons peBDT, this annual volume equates to almost 1 billion gallons per year of ethanol, which would offset about 660 million gallonstechnology being evaluated by the G4 company through a $1.2 million program grant in Placer County may produce higher yields of more than 100 GGEs per BDT and produce a transportation grade biogas. More investment is needed to continue the development and evaluation of technologies with the potential to convert woody biomass waste streams to lowcarbon transportation fuels.
Cellulosic ethanol productionthe technical challenges associated with breaking down the lignens and tannins found in conifsoftwoods. Transport costs can also be prohibitively high when material must be trucked from remote forest locations to potential processing sites. To date, woody biomass feedstocks arused to generate electricity. Ca
BDT annually.
ous environmental organizations have raised concerns about sustainability in harvest of forest biomass as an energy source. The Energy Commission addressed these issues the 2008 AB 118 Rulemaking proceeding and adopted the following sustainability ge into its regulations:
Section 3101.5(b)(2)(F) Projects that use forest biomass resources as part of their feedstock, and that demonstrate the advancement of natural resource protection goalsare those that use forest biomass collection or harvesting practices that do not diminish
183 U.S. EPA, “Generators of Food Waste,” http://www.epa.gov/wastes/conserve/materials/organics/food/fd‐gener.htm
80

the ecological values of forest stands, and that are consistent with forest restoration, firrisk
e management and ecosystem management goals.
ommission has worked actively with the California Department of Forestry and
search forest management, thinning,
e
G
to build LFG‐to‐energy tion fuel or
producing biomethane for use in the ger
trucks. The second project, located at the Frank R. Bowerman landfill in Orange County, has a production capacity of 4,000 gallons of LNG per day and also uses the biomethane produced to
The Energy CFire Protection, the U.S. Forest Service and ARB through the Interagency Working Group to further define and establish sustainability standards for forest management and thinning. The Energy Commission is using sustainability funding to enter into a $1.5 million research agreement with the US Forest Service and UC Davis to refire risk reduction and other issues associated with forest management and sustainable energy production. The Air Resources Board’s LCFS program is also investigating appropriate sustainability standards for woody biomass‐based fuels seeking eligibility in the LCFS credit program.
Landfill Gas Landfill gas (LFG) is methane‐rich biogas naturally created as microbes chemically break downthe waste in landfills through a complex series of reactions. Landfill gas is generally composedof 40 percent to 60 percent methane, CO2, and small amounts of other chemicals, such as volatilorganic compounds and sulfur‐containing compounds.
Due to stringent air quality regulations, LFG may not be released into the atmosphere. The LFmust be captured, and—due to difficulties obtaining air permits in some California air districts—combusted on site or flared. An alternative to flaring LFG is projects. Once captured, LFG can be cleaned and used as biomethane for transportaused to generate electricity.
LFG has a gross potential of 118 BCF per year and a technical potential of 79 BCF per year or about 600 million DGE.184 For every 1 million tons of municipal solid waste landfilled, 432,000 cubic feet per day of LFG is created.185 The U.S. EPA has identified 37 candidate landfills in California that could accommodate LFG‐to‐energy projects.186
LFG is a sustainable feedstock because it is derived from waste. On a well‐to‐wheels basis, it reduces GHGs by 82 percent to 87 percent from the diesel baseline.187
Two LFG‐to‐energy projects in California aretransportation sector. The Altamont Pass Landfill, located in Livermore, California, is the larof the two, with a capacity to produce 13,000 gallons of LNG per day, fueling 300 local refuse
184 Waste Management, “Opportunities for Landfill Gas to Energy and Fuel in California,”
te.phttp://www.biomethanesummit.com/pdfs/presentations/105_SOLID_WASTE_LANDFILL/ChuckWhidf. 185 Ted Barnes, CPR Meeting – Task 2.0 Altamont Landfill Gas Purification, Testing and MoniAgreement #500‐09‐004 Presentatio
toring n, August 31, 2010.
cts‐186 U.S. EPA, “Energy Projects and Candidate Landfills,” http://www.epa.gov/lmop/projecandidates/index.html#map‐area. 187 California Air Resources Board Low Carbon Fuel Standard fuel pathway documents.
81

fuel refuse trucks.188 Waste Management Inc. is developing a third landfill gas to energy prousing $11 million in AB 118 program funds at the Simi Valley landfill in Ventura County. Thishigh‐volume project will produce 750 million cubic feet of biomethane annually, equivalent to 6 million gallons of LNG, or 3.4 million dge. Waste Management will use the LNG biogas topower 500 heavy‐duty refuse hauling trucks.
ject
from landfills is prohibited even if the gas
and safety standards.190 Without access to the natural gas pipeline, e
aste
ed th the remainder being plastics, textiles, and non‐organics.192 Once
GE.194
189
One of the greatest challenges faced by LFG‐to‐energy projects is lack of accessibility to thenatural gas pipeline. Pipeline injection of biomethane is treated to meet healthLFG‐to‐energy producers need to find alternative methods for moving their product into thmarket. Some landfills are using the LFG for onsite electricity generation, and others such as theAltamont and Bowerman Landfills are fueling local refuse trucks, but large quantities of biomethane—estimated as high as 50 percent of the total methane captured at California landfills—continue to be flared.191 Creating uniform gas quality standards among utilities would help bring LFG‐to‐energy projects to fruition.
Municipal Solid WMunicipal solid waste (MSW) is the waste collected, both urban and commercial, before it enters a landfill. The waste stream is composed of 57 percent biomass, which can be separatusing various methods, wiseparated, recycling and composting employ most of the resource, but a substantial fraction remains that could be used for energy conversion.193 The primary use of post‐recycled MSW isfeedstock for biogas, but it has also been considered as a feedstock for producing ethanol and synthetic diesel.
MSW could be a significant source of feedstock—it has a gross potential of 38 million BDT per year and a technical potential of 10 million BDT per year. The biogas potential is 79 BCF or about 600 million D
Using MSW as a feedstock for producing energy can significantly reduce the waste stream in California’s landfills, thus extending the life of landfills. Currently, no Low Carbon Fuel Standard pathway exists for the conversion of MSW to biomethane, but a GHG reduction of upto 75 percent from the diesel baseline is possible, depending on the energy consumption of any necessary pretreatment processes.195 California projects should be encouraged to use MSW as afeedstock because it has 10 times greater energy production potential on a per‐ton basis than landfilled waste.196
188 Private Communication with Jesus Perez of Orange County Waste & Recycling, December 9, 2010. 189 High Mountain Fuels received funding under PON‐09‐003. 190 Chuck White, Waste Management. June 3 Stakeholder Workshop transcript. 191 Ibid. 192 Rob Williams, “Biofuels from Municipal Wastes Background Discussion Paper” March 28, 2007. 193 Ibid. 194 California Biomass Collaborative. 195 Energy Commission staff. 196 1 ton of organic waste landfilled has a 65kW potential while 1 ton of MSW has a 550 kW potential. Energy Commission staff meeting with CalRecycle, October 28, 2010.
82

Currently, East Bay Municipal Utility District is the only facility anaerobically digesting MSW. CalRecycle staff strongly supports the use of MSW as a transportation fuel or energy source. However, a number of project developers are proposing facilities that will use post‐recycled MSW as a feedstock. The Energy Commission will provide $4.5 million in program funding toCR&R, which operates the Perris Transfer Station in Riverside County. CR&R will cons50,000 ton facility that will separate MSW from Los Angeles County. The CR&R project withe MSW, anaerobically digest the organic material to produce biomethane, clean it to pipelinestandards, and produce a transportation grade RNG that will be used to fuel 60
truct a
ll sort
to 80 vehicles in . Total output will be equal to 865,000 dge.
s. One of the biggest
r treatment plants generally includes municipal wastewater, sewage, and and
oducing energy can significantly reduce the waste stream in fills, thus extending the life of landfills. California has more than 240
to discharge. A number of sing the biogas produced to
s
The Energy Commission is further investigating this feedstock.
CR&R’s heavy‐duty truck fleet
As a feedstock, the cost of obtaining MSW would be low or negative because it would otherwise be land filled. It would be easily accessible because it is already collected. Unlike large landfill projects, MSW projects should be smaller and decentralized to reduce the need to transport feedstock over large distances. 197 MSW projects could also be colocated with existing facilities such as recycling centers to minimize storage and transport issuechallenges to using MSW for producing biofuel is the perception that these processes will infringe on recycling and composting efforts. In fact, biofuels projects funded through the AB 118 program, such as CR&R, will use only post‐recycled MSW as a feedstock.
Wastewater Treatment Plants Waste from wastewatebiosolids. These facilities often deploy anaerobic digesters to stabilize a portion of the wasteto produce biogas.198 The biogas can be used to generate electricity or produce biomethane. Waste from treatment plants has a gross potential of 16 BCF per year and a technical potential of 9.6 BCF per year.199 Biogas potential is about 40 million DGE.
Using waste as a feedstock for prCalifornia’s landwastewater treatment plants that treat sewage and other waste priorthem already have anaerobic digesters installed onsite and are ugenerate electricity.200
In November, 2009, the Energy Commission awarded a $1 million grant to UC Riverside’sCollege of Engineering‐Center for Environmental Research and Technology to build a procesdemonstration unit to convert biosolids to clean synthetic diesel fuel. The unit uses a steam hydrogasification process to convert biosolids from Riverside’s wastewater treatment facility comingled with green waste.201
Yellow Grease
html
197 CalRecycle, verbal communication, October 28, 2010. 198 Rob Williams, “Biofuels from Municipal Wastes Background Discussion Paper” March 28, 2007. 199 California Biomass Collaborative, Biomass Resource Assessment for California, Draft Report, April 2005. 200 Ibid. 201 U.C. Riverside, “Converting Biosolids into Clean Synthetic Diesel Fuel,” http://www.waterandwastewater.com/www_services/news_center/publish/article_001916.s .
83

Purpose-Grown Feedstocks This section reviews a series of purpose‐grown feedstocks used for ethanol and biodiesel
tion. Some, like algae and switchgrass, have high volumetric potential for renewable n,
light and fed a carbon source, such as sugars, to generate new
be at least 55°F, and the number of annual average
500
producdiesel or cellulosic ethanol but face ongoing cost and technology challenges. Others, like corsoy, oil palm, and sugar cane, can be grown efficiently at industrial scales but engender strongsustainability concerns. For example, recent work by Holly Gibbs of Stanford University indicates that global agricultural land acreage increased by 629 million hectares between 1980 and 2000; 100 million hectares of this new agricultural land was created in tropical zones, and 55 percent of the tropical zone agricultural land came from newly cleared tropical forests. Palm oil, soy oil, and sugarcane account for much of this new agricultural production.202
Algae Algae are organisms that grow in water. They include microalgae and cyanobacteria (both microscopic), and macroalgae (seaweed). They can be grown and processed to produce biodiesel, renewable diesel, biomethane, ethanol, and other fuels. Different types of algae are grown depending on the type of fuel to be produced. Algae can be grown with light in open mixed or unmixed ponds or in enclosed plastic bags or tubes (known as photobioreactors). Theycan also be grown withoutbiomass (heterotrophic cultivation). 203
The best locations for growing algae are in the Southwest and Florida, near fossil fuel plants with waste CO2. The number of annual average cumulative sun hours should be at least 2800,the annual average daily temperature shouldfreeze‐free days should be at least 200.204 Algae can grow in water of all types, including wastewater and saline groundwater. When grown to produce oil, the yield is from 1000 to 6gallons per acre per year.
Compared to other purpose‐grown fuels, algae possess the potential to produce a significant amount of fuel from a relatively small area. Yusuf Chisti estimates that growing algae on 1 percent to 3 percent of the total United States cropping area would be enough to produce 50 percent of transportation fuel needs.205
The carbon intensity of algae‐based fuels depends on the type of fuel produced. In September 2010, the National Academy of Sciences began a study of sustainable development of algal biofuels. The resulting report will include information about centralized and distributed production, land use, water use, nutrients, human health and safety, and potential toxicity. It will also recommend indicators and metrics to help assess sustainability. The report will not
2010. National Algal Biofuels Technology Roadmap. U.S. Department of Energy, Office of Renewable Energy, Biomass Program. Visit http://biomass.energy.gov
202 Gibbs, Holly, Proceedings of the National Academy of Sciences, Vol. 107 no. 37 August 31, 2010. 203 U.S. DOEEnergy Efficiency and for more
vances, volume 25, page 296.
information. 204 Ibid, pages 76‐81. 205 Chisti, Yusuf. 2007. “Biodiesel from microalgae,” Biotechnology Ad
84

include an economic analysis because production has not yet reached commercial scale. The report is expected to be issued in early 2012.206
In 2010, the U.S. DOE Office of Biomass Program published a National Algal Biofuels Technology Roadmap, which summarizes the state of technology for algae‐based fuels and the research and development needed to produce them at a commercial scale. The Office of Biomass Program also released an Algae Biomass Supply Request for Information (DE–FOA–0000466) to gather
t,
than 40 open ponds at its test
y
contributed almost $1.5 million to
Roadmap describes a literature review of production costs, ed
els can be competitive
information about supply systems and services for the production, handling, storage, transporand delivery of algae biomass.
DOE contributed about $20 million for research and demonstration projects to develop algaefeedstock, demonstrate technology to capture CO2 for growing algae, and open a fully integrated algal biorefinery. In California, the San Diego Center for Algae Biotechnology, led by the University of California at San Diego, was one of the recipients ($9 million). The center’s research into biofuel development includes growing algae in morefacility in the Imperial Valley.
ARRA contributed more than $150 million for projects that experiment with growing algae in open ponds, develop an algae harvesting system, develop metabolic engineering and synthetic biology approaches to increase lipid production, produce a diesel substitute, and develop a systems approach for sustainable commercialization of algal biofuel. California companies receiving funding from ARRA are Sapphire Energy, based in San Diego ($50 million), and Solazyme Inc., based in South San Francisco ($22 million). USDA contributed a $54 million loanguarantee to construct a pilot algal biorefinery in New Mexico.
Venture capital and private equity firms contributed the most funding (more than $1 billion), mostly for projects that will experiment with commercial‐scale production. California companies receiving funding from venture capital and private equity firms are Sapphire Energ($100 million), Solazyme Inc. ($57 million), Aurora Biofuels, based in Alameda ($35 million), ExxonMobil and Synthetic Genomics, Inc., based in La Jolla ($600 million), and Green Pacific Biologicals, based in San Francisco ($225,000). The programdesign and configure a pilot‐scale production plant that uses algae to produce oils in standardfermentation tanks, and $250,000 for a project that will experiment with growing algae at a wastewater treatment plant.
The National Algal Biofuels Technologywhich reveals that many estimates are dated and use widely different basic assumptions. Itnotes, however, that “a combination of improved biological productivity and fully integratproduction systems can bring the cost down to a point where algal biofuwith petroleum at approximately $100 per barrel.” 207
206 National Academies, “Project: Sustainable Development of Algal Biofuels,” http://www8.nationalacademies.org/cp/projectview.aspx?key=49316 207 U.S. DOE 2010. National Algal Biofuels Technology Roadmap. U.S. Department of Energy, Office ofEnergy Efficiency an
d Renewable Energy, Biomass Program, page 104.
85

T. J. Lundquist et al. estimated costs for five production scenarios. 208 Depending on type and size of the plant, capital costs range from about $21 million to more than $100 million. Landpond construction are the most expensive capital costs, and staffing and maintenance are the most expensive operating costs.
Before converting algae to biofuel, the algae must be harvested, dewatered, and the oilcarbohydrates
and
or extracted. These processes are energy‐intensive and expensive. Research is
at
ined with
tion of algae‐based biofuels will require another 10 to 15 years of
algae as a ch
olecule alternative fuels (fuels that mimic gasoline, jet fuel, and diesel),
d
ely bid projects that address one or more of the research gaps. of
needed to develop cost‐effective ways to prepare algae for conversion.
Phillip Pienkos lists 28 hurdles to algae cultivation, oil recovery, and biofuel production thinclude temperature control, CO2 availability and transport, resistance to invasion in open ponds, and dewatering methods. 209 Additionally, Rene Wijffels and Maria Barbosa write that research is needed in biology, algae strain development, scale‐up, biorefineries, and whole system design. They believe that production will be economically feasible only if combproduction of bulk chemicals, food, and feed ingredients. They estimate that sustainable, commercial producdevelopment.210
The Energy Commission’s PIER Program is also supporting research into renewabledrop‐in transportation fuel, requiring no additional processing. The identified researsolutions will develop alternative fuels designed for compatibility. In this respect PIER is investigating large msuch as algae‐derived fuels, but also including others derived from single‐cell organisms such as bacteria. Four research gaps affecting algae‐derived fuels have been identified:
• Strain selection, including finding, breeding, or genetically engineering the best oil producers.
• Growth media and containment, such as ponds and bioreactors.
• Oil separation technologies to separate algal lipids from water and biomass.
• Improved life cycle analysis tools and method to better assess carbon emissions and lanuse impacts.
PIER has funded two competitivThe first project is a $794,000 contract with NASA Ames to research, develop and demonstratethe Offshore Membrane Enclosures for Growing Algae system, primarily to address the issuegrowth media and containment. This system consists of lightweight, flexible, closed photo‐bioreactors constructed of inexpensive plastic, with small sections of semipermeable
208 Lundquist, T.J., I.C. Woertz, N.W.T. Quinn, and J.R. Benemann, 2010. A Realistic Technology and Engineering Assessment of Algae Biofuel Production, page vii. http://works.bepress.com/tlundqui/5/. Accessed 11/9/2010. 209 Pienkos, Philip T, National Renewable Energy Lab, 2007. “The Potential of Biofuels From Algae.” Presentation given at the Algae Biomass Summit. www.nrel.gov/docs/fy08osti/42414.pdf, slide 16. Accessed 10/20/2010. 210 Wijffels, Rene H. and Maria J. Barbosa. 2010. “An Outlook on Microalgal Biofuels,” Science, August 13 2010, vol. 329, pages 796‐799.
86
membranes for gas exchange and dewatering. They will be filled with nutrient‐rich primary or secondary treated wastewater from municipal sewage treatment facilities and the sealed
ject, the Energy Commission awarded $790,000 to Solazyme, y out the research to enable development of a commercial lipid biomanufacturing
re
Camelina
crops. e
t
when rotated
of
na has the potential for use as cattle feed supplement, feedstock for biofuel and bio‐lubricant, and soil nutrient enhancer. Primary energy market potential exists as a feedstock for aviation biofuel as it can reduce emissions nearly 85 percent over conventional fuel.
enclosures will be inoculated with lipid‐producing freshwater algae (mono‐cultures or communities). Strains of algae will be cultivated that are able to thrive under local conditionsand outcompete weed species in the wastewater. This project is addressing the growth mediaand containment research gap.
The second project is for the production of Soladiesel RD, a renewable diesel, from cellulosic feedstocks. As a part of this proInc., to carrprocess using cellulosic feedstocks and heterotrophic algal fermentation. While Soladiesel RD could ultimately leverage existing industrial bioproduction facilities and commercial oil refineries to quickly prove commercial viability, this project’s aim is to research and develop the use of cellulosic biomass in Solazyme’s algal biofuel technology. This project also addresses the strain selection and growth media and containment research gaps.
Future large molecule research will continue to develop the economic and environmental potential of algae‐derived fuels. PIER will work with UC Merced to improve LCA tools and methods for algae‐derived fuels. PIER will also establish a California Initiative for Large Molecule Sustainable Fuels to perform research essential to developing the next generations oflarge molecule biofuel technologies and related materials. Research results should inform futuinvestment recommendations.
Camelina, also known as false flax or gold‐of‐pleasure, is a member of the mustard family and adistant relative to canola. It grows as an annual from one to three feet tall producing seed pods containing many small seeds (400,000 seeds per pound) with high oil content (35‐38 percent andhigh in omega‐3‐ fatty acid). As a comparison, the oil content of soybeans is 20 percent.
Camelina is a short‐seasoned, fast‐growing crop planted in March and harvested in late Julymost years, even in northern climates. It should be noted that camelina can grow in crop rotation with wheat. The plant can grow on marginal conditions with low inputs surviving on low moisture (10‐17 inches of rainfall annually) with fewer nutrients than many otherHowever, the plant still requires management including herbicide application to help ensursuccessful establishment. Field trials in Oregon, Montana, and Idaho bear out the fact thacamelina seed oil production is more cold‐resistant that average biodiesel feedstock.
Camelina yields are roughly double that of soy and provide more than 100 gallons of oil per acre. Early trial results have shown an increase in 15 percent production to wheat with camelina. According to Washington State University, Camelina provides 1,400 pounds of seed per acre at 16 cents per pound or provides up to $224 per acre (compared to 28 bushels wheat at $8.23 per bushel, which produces $230 per acre).
Cameli
87

Great Plains and Sustainable Oils have been identified as early commercial ventures in the
million tons per year camelina meal for animal feed.
k,
from 12.8 percent of total supply in 2005 to nearly 36 percent today.211 Over
intensity value. Corn stover (consisting of the stalks, leaves,
r fuel and
production is estimated at 12.4 billion bushels in 2010, down from the record 158.2
1980s
development of camelina as an aviation biofuel. AltAir has a contract with 14 airlines to produce 100 million gallons per year (MGY) of diesel and renewable jet fuel at Tesoro facility inWashington. Sustainable Oils has a partnership with BioJet to produce up to 200 MGY plus 65 MGY of coproducts, and 2.3
There are key issues to address in expanding the commercialization of camelina as a feedstocincluding educating growers to new commodity markets, providing incentives for aviation alternative fuels in California, and focusing camelina development in cooler climates of the state.
Corn The most rapidly increasing use of corn in the United States has been as a feedstock to produce fuel ethanol, risingthe same period, corn for animal feed and residual use has declined from 57.6 percent during 2005 to 39.3 percent today.
Corn kernels are used in biorefinery fermentation facilities to produce conventional ethanol from the starches in the kernel. Oil from the kernel can now be removed and used as a biodieselfeedstock with a very low carbonhusks, and cobs remaining after harvesting) can be used in a cellulosic conversion process to produce ethanol with lower lifecycle carbon emissions. The United States corn ethanol industryis becoming increasingly sophisticated in its ability to use all parts of the corn plant fofeed production.
After starches are removed during ethanol fermentation, high protein distillers grains in wet or dry form are separated and sold as animal feed. Roughly one‐third of every bushel of grain processed into ethanol is returned to the animal feed market in more concentrated forms asdistillers grains, corn gluten feed, or corn gluten meal. Corn by‐products are also used for fertilizer and soil amendment.
U.S. corn grain13.1 billion bushels for 2009, while it was 13.0 billion bushels in 2007. U.S. corn yield was bushels per acre in 2010, down from a record 164.7 bushels per acre in 2009. Per acre productivity for corn production has increased from about 90 bushels per acre in the earlyto 158 bushel per acre in 2010. Total U.S. acreage to corn was about 88 million acres in 2010, with most production occurring in Midwest states. California has about 625,000 acres allocated to corn, which serves the sweet corn market and local silage demand. Nationally, per acre productivity is projected to increase steadily at a rate of two bushels per acre per year. Productivity gains are a result of continuing improvements in plant genetics, machinery, and
211 USDA Economic Research Service statistics. Total supply includes production, imports, and changof inventory levels.
es
88

tillage practices.212 The consumption of corn for U.S. ethanol production was 41.6 percent during 2010.213
The carbon intensity for Midwest biorefineries using conventional ethanol processing of Midwest corn is 98 g CO2e/MJ, with 30 g CO2e/MJ attributed to indirect land use change (ILUC). California‐produced corn ethanol using Midwest corn feedstocks has a CI of 81 g CO2e/MJ with 30 g CO2e/MJ attributed to ILUC. This 18 percent lower carbon intensity value forCalifornia‐produced ethanol using Midwest corn feedstocks is a result of modern biorefineries using state‐of‐the‐art process efficiencies and the use of natural gas and California’s relatively green electricity mix as process energy sources. Midwest biorefineries rely on coal for process energy.
Sustainability concerns for first generation corn ethanol tend to be expressed in termsland use change,
of indirect corn ethanol on global corn commodity prices, and
d by
Some stakeholders have voiced concern regarding increased water use and higher fertilizer application rates associated with corn. Based on the most recent agriculture census by theUSDA (in 2007), the majority of corn is grown without the use of any irrigated water, solely dependent on rainfall during the growing season. In 2007, only 15.3 percent of corn acres were irrigated,
214 effects of demand forwater use for corn cultivation and ethanol refining. The Energy Commission actively investigates sustainability issues associated with alternative fuel production. Professor Wally Tyner of Purdue University is an original author of the Global Trade Analysis Project (GTAP) model used by the Air Resources Board to estimate indirect land use change numbers for the LCFS. His 2010 revision to the model produced a range of results one third to one half lower than the current figure of 30 g CO2e/MJ. The Indirect Land Use Expert Workgroup convenethe Air Resources Board during 2010 reviewed Professor Tyner’s revisions and recommended that ARB staff consider some of the model’s updates in revising the GTAP model. Portions of the model’s updates may result in reduced indirect land use change numbers, while other aspects may further increase or decrease these numbers.215 Energy Commission staff participated in this Expert Workgroup.
212 USDA Economic Research Service, “Corn Market Outlook,” http://www.ers.usda.gov/Briefing/Corn/2010baseline.htm. 213 During 2010, 4.724 million bushels of corn were converted to fuel ethanol out of a total of 11.346 million bushels of total use. Energy Commission analysis of U.S. Department of Agriculture statistics.214 The concept of ILUC is that for each acre of food or forage replaced by a bioenergy crop, somewhere in the world, a landowner will indirectly make an economic decision to clear virgin land to producefood and release additional carbon from the surface vegetation and soil. Some portion of this carbon should then be attributed to biofuels production in a carbon accounting system. This phenomenon is sometimes called “market mediated effects.” ARB added ILUC carbon int
more
ensity estimates to direct
2008, which found that corn ethanol had nearly twice the carbon intensity of emissions fuel pathways for purposes of the LCFS regulation to conform with results of the Searchingerpaper in Science frompetroleum when ILUC was factored in (~200g CO2e/MJ total carbon). Current ILUC estimates for corn ethanol production are much lower. A copy of the Serchinger paper may be viewed at the following link: http://www.princeton.edu/~tsearchi/writings/SupportingMaterials.pdf 215 ARB Staff, Cover Report on the Results of the Indirect Land Use Expert WorkgrouBoard, January 2011.
p to the Air Resources
89

with the balance (84.7 percent) receiving no irrigated water.216 It is not known if expandedproduction of corn will occur as a result of an even higher ratio of irrigated acres over
the
of
acity
ket
y 2011, the Energy Commission allocated $6 million from the California ethanol
al
ol use in California such that gasoline demand will be
forecast period. Assuming the ratio remains fairly constant, increasing corn production due to higher mandated ethanol demand should primarily occur through expansion of dry cropping, rather than through increased irrigation. Regarding fertilizer use, Energy Commission staff examined USDA statistics and noted that the application rate per acre of corn for nitrogen has increased 6.2 percent between 1980 and 2005, while the average corn yield has increased 62.5 percent over the same period.217 The continued improvement of corn yields is primarily aconsequence of other improvements unrelated to increased use of nitrogen per acre.
Corn ethanol is imported from major ethanol production facilities in the Midwest via rail cars tomajor California ethanol distribution terminals in Carson and Albany. This ethanol is used as anoxygenate for California reformulated gasoline and is blended at the E10 (10 percent ethanol) level. During 2009, 95 percent of California’s 962 million gallons of ethanol use was imported from outside the state via rail cars, 4 percent produced from California facilities and the remaining 1 percent imported from foreign sources via marine vessel. During 2009, the emerging E85 retail fueling market in California dispensed about 1,173,025 gallons.
There are five corn‐based ethanol plants in California, with a combined production capacity250 million gallons per year. Estimated capital cost to construct these plants is about $500 million in private capital. Direct employment when the five plants are operating at full capis estimated to be 175. Most of these plants have been idled since January 2009 due to poor operating economics and high debt loads. Until the LCFS begins in earnest, there is no marmechanism to value and remunerate California producers for their lower carbon ethanol products. In earlEthanol Producer Incentive Program (CEPIP) to provide operators of existing corn production plants in California with temporary financial assistance, as funding is available, during periods of difficult economic operating conditions that would be repayable under specifically identified favorable market conditions. This program also will stimulate operationimprovements at existing ethanol facilities and the use of advanced process technology to convert cellulose and other low‐carbon feedstocks. Two of these facilities are operating using Midwest corn.
The federal RFS2 and California’s LCFS will affect the demand of and distribution infrastructure facilities for ethanol. The federal program of mandated renewable fuel use is expected to significantly increase ethandecreased to a greater extent than demand reductions forecast as a result of higher CAFE
216 Corn using irrigated water totaled 13.16 million acres in 2007, while non‐irrigated corn amounted to 73.09 million acres. Since irrigated corn has a higher yield, the percentage of corn produced from irrigated acres is slightly higher, approximately 16.9 percent for the same year. 2007 Census of Agriculture, United
fStates Department of Agriculture, Table 32, page 26, updated September 2009. http://www.agcensus.usda.gov/Publications/2007/Full_Report/Volume_1,_Chapter_1_US/usv1.pd .
re in 2005. U.S. Fertilizer Use and 217 Most recent complete year of fertilizer data for U.S. corn acres is 2005. Nitrogen application for fertilized corn was 130 pounds per acre in 1980 and 138 pounds per acPrice, USDA Economic Research Service, Table 10, updated November 20, 2008. The data is available at: http://www.ers.usda.gov/Data/FertilizerUse/Tables/FertilizerUse.xls.
90

standards. In addition, due to the current state ethanol blending limit of 10 volume percent in gasoline, the RFS2 will likely result in significantly greater use of E85 so that obligated partieachieve their
s “fair share” compliance levels. The 2009 transportation fuels forecast by the
ission estimated that E85 demand levels would increase from 1.1 million gallons by 2030 under
macronutrient levels), harvesting (single or multiple), and yield (length of
fer
of
for turf purposes as genetically modified strains typically
nditions in areas like the western San Joaquin Valley and feedstock resource for cellulosic ethanol. 219
California Energy Commmillion gallons in 2010 to 1,725 million gallons in 2020 and 2,262the Low Demand Case for gasoline.218
The state LCFS may not appreciably alter the demand forecast for ethanol; rather, it will necessitate the use of specific types of ethanol with lower carbon intensity relative to Midwest corn‐based ethanol supplies. Although commercial production levels of cellulosic ethanol have yet to be achieved by the market, low‐carbon intensity ethanol of this kind will eventually be needed to help refiners and marketers to achieve LCFS compliance in the latter years of the regulation.
Farmed Tree Products The Energy Commission is further investigating this feedstock.
Grasses Grasses have been grown in the United States for various purposes including turf, cattle feed, and in co‐firing power plants. Predominant grasses for energy, in particular as a biofuel, includeswitchgrass, miscanthus, and bermudagrass. All three of these grasses are perennials that have different characteristics related to planting practice (seed, stolons, rhizomes), nutrient requirement (varying growing season, water availability).
Most of the grasses are native to Texas, require several years to reach maximum maturity, andhave an optimum daytime temperature requirement above 75 degrees. Grasses can also suffrom insect damage if proper management practices are not implemented.
Early switchgrass field trials suggests a technical yield of 20 tons per acre and an actual yield10‐12 dry tons per acre in the Imperial Valley of California. Bermudagrass production in California is largely harvested as sodproduce sterile seed.
The California Biomass Collaborative has identified Bermuda and other grasses as strong candidates for cultivation in fallowed agricultural lands that are no longer arable due to selenium and boron concentrations, or due to reductions in available irrigation water. The grasses could remediate soil coprovide a
The costs of switchgrass production approach $225 per acre in total costs. Grass is baled at a cost of $30 per ton or $300 per acre.
2‐SF, May 2010, page 72. ergy
Proceedings for Sustainability, 2009.
218 Transportation Energy Forecasts and Analyses for the 2009 Integrated Energy Policy Report, Final Staff Report, California Energy Commission, Publication Number CEC‐600‐2010‐00219 Professor Steven Kaffka, UC Davis and California Biomass Collaborative, Presentation to EnCommission during AB 118 Regulatory
91

According to a USDA report, grasses have been identified as a carbon‐neutral plant. As a biofuel, grasses can be source for ethanol production via cellulosic conversion technology.
Issues identified with grasses as a feedstock include the need to establish itself effectively as a bioenergy crop, high biochemical conversion costs, and thermochemical conversion technologyrequiring more development.
lobal
the late two more decades
and
in
Palm Oil Palm oil, one of the world’s largest agricultural commodities, is widely used for a number of food and cosmetic purposes, including as a renewable diesel substitute. Palm oil is projected tomake up 34‐46 percent vegetable supply in 2010 to 2020.220 A palm plantation typically produces 435 ‐630 gallons of oil per acre, compared to soybean oil’s 74 gallons/acre.221 Palm oilyields are the second most productive fuel volume crop. (Sugarcane produces roughly 800 gallons/acre.222) In 2009 more than 50.5 million metric tons of palm oil were produced; 20 percent of this volume was estimated to be used in nonfood purposes (such as renewable fuel).223 This potential renewable fuel volume represents 2.9 billion gallons. For comparison, California uses 3 billion gallons of diesel fuel per year.
Malaysia and Indonesia account for 83 percent of palm oil production and 89 percent of gexports. In 2009, Indonesia became the largest producer of palm oil, producing more than 20.9 million metric tonnes,224 while Malaysia produced 19.8 million metric tonnes.225 (One ton is approximately equivalent to 5.6 billion gallons.) Extremely high palm oil production growth rates have been sustained over the past 10 years in Malaysia and Indonesia. These historic growth rates are a result of strong global vegetable oil demand and significant political and economic reforms established by the government following the Asian Financial Crisis in1990s. Continued palm oil production growth rates are expected for at leastdue to improved crop yields from existing fields, new maturing plants starting production,new crop plantations being built.
Palm oil costs vary over time and can be affected by commodity prices for other bio‐oils, international tariffs, and international events (including natural disasters). A refiner’s interest palm oil is also directly related to the price of petroleum crude oil and is affected by the costs and savings associated with any GHG regulations. From 2008 to 2010, palm crude oil commodity prices raised from $438‐$1,200 per metric tonne.226 These palm prices represent
220 Sime Darby Plantation, “Palm Oil Industry in Malaysia,” Skills & Knowledge for Sustained
on, Dato’ Dr. Mohd. Basri Wahid,
ysis of published production yields.
e to Grow,” palmoil/
Development in Africa, June 24, 2009. 221 Biofuels: Production, Use and Its Implications on GHG emissiMalaysian Palm Oil Board. Cites 3.8 tonnes per hectare per year. 222 Energy Commission staff anal223 Sime Darby Plantation, 2009. 224 USDA Foreign Agricultural Service, “Indonesia: Palm Oil Production Prospects ContinuDecember 31, 2007, http://www.pecad.fas.usda.gov/highlights/2007/12/Indonesia_
s, & Oil World Annual (2000‐2009). 225 Economics and Industry Division Statistic226 Index Mundi, “Palm Oil Monthly Price,” http://www.indexmundi.com/commodities/?commodity=palm‐oil&months=60.
92

$1.50 to $4.25 per gallon of feedstock to a potential fuel producer. Additional costs to receivtransport, and process the feedstock would raise the cost 30‐45 percent.
Worldwide, an increasing number of refineries are demonstrating interest in palm oil as a feedstock. In the summer of 2010, Bloomberg reported Europe’s first new palm oil plant in Liverpool. This palm oil refinery supplies 40 million tons of palm oil per year, or theoretically 11.3 billion biofuel gallons.
e,
ns th
s of
lm oil 8. For
plantations increased from 11 million hectares to 17.4 million e 0
ied by the RSPO’s Certificate of Conformance. By the end of 2010, there were 22
in establishing a systematic approach to environmental management. This recognition will foster
227 Additionally, two new renewable diesel plants using Neste oils’ biomass‐to‐liquid process are coming on‐line in 2011, one in Rotterdam and Singapore. Each will consume 800,000 metric tons of palm oil and produce 226 million renewable diesel galloper plant. These two plants combined demand represent one year’s production capacity growfrom Indonesia.
Oil palm cultivation and processing, like other agricultural and industrial activities, raiseenvironmental issues and sustainability concerns. Forest clearing, land degradation and lossfertility caused by soil erosion are a major problem in many parts of the world, and are especially rampant in the tropics. A recent paper by Stanford researcher Holly Gibbs documents forest clearing and land conversions in Asian and Southeast Asian countries where oil palm plantations expanded rapidly to meet growing global demand for palm oil. Indonesian paplantations expanded from 2 million hectares to 5 million hectares between 2000 and 200Southeast Asia as a whole,hectares between 1980 and 2000, with oil palm plantations accounting for 80 percent of thincrease.228 Koh and Wilcove found that half of the land cleared for plantations between 199and 2005 in this region came from tropical forests. 229
In response to the urgent and pressing global call for sustainably produced palm oil, the Roundtable on Sustainable Palm Oil (RSPO) was formed in 2004 with the objective of developing and implementing global standards for sustainable palm oil through credible global standards and engagement with stakeholders.230 In 2008 the first Malaysian palm oil plantation was certifgrowers, 81 palm mills RSPO‐certified, representing 3.5 metric tons, or 17 percent of the Malaysian palm crude oil.231
Additionally, New Britain Palm Oil Limited (NBPOL) has developed an Environmental Management System to help the company to minimize its effects on the environment. The company is using the international standard for environmental management, known as ISO 14001 (1996), as the vehicle to deliver this system, and in May 2004 NBPOL achieved accreditation. This standard is universally employed and recognized as a measure of quality
227 New Britain Palm Oil Limited, “Latest News,” http://www.nbpol.com.pg/n_latest_news.php. 228 Gibbs, 2010. 229 Koh and Wilcove, Conservation Letters, 2008. 230 RSPO stakeholders include oil palm producers, palm oil processors or traders, consumer goods manufacturers, retailers, banks and investors, environmental or nature conservation organizations, and
ge/508social or developmental organizations. 231 RSPO Certified, “Growers Certification,” http://www.rspo.org/?q=pa .
93

environmental confidence and demonstrate environmental responsibility to the people who buypalm oil.
An initial estimate for the carbon intensity of palm oil used for biodiesel or renewable diesel determined an 88 percent GHG reduction, but this did not account for indirect land use emissions estimates.232 The Air Resources Board has not yet ado
pted a Life Cycle Analysis value
ar. examples include natural forest, oil palm (food), and tropical fallow sources, at 2, 6,
lly in ction of palm oil. This biomass could theoretically be converted via second‐generation
le in practice and share some market price
el is
e meal and protein. The by‐product of soybeans is used to make for
for palm oil for the LCFS. Current ILUC estimates for soy (62 gCO2e/MJ) and Brazilian sugarcane (46 gCO2e/MJ)233 indicate that the ILUC value for Southeast Asian oil palm may be comparably high. Worst case examples include peat forest land use at 45 tonnes CO2e per hectare year and rubber plantation‐based palm oil plants at 7 tonnes CO2e per hectare yeBetter caseand 8 tonnes CO2e per hectare year, respectively.234 These figures indicate that multiple fuel pathway estimates may be warranted for Southeast Asian oil palm to create positive market incentives for oil palm from older, converted cacao plantation, and negative incentives for palmoil from new plantations from recently cleared tropical forests.
In addition to palm oil, about 60 million metric tons of palm plant waste is created annuathe produbiofuel processes to yield 1.0 billion biofuel gallons.235 The additional biofuel or bioenergy would be counted in future life cycle analyses to yield greater GHG benefits over time.
Soybean For 20 years soybean oil has been the feedstock of choice to produce biodiesel in the United States. In the past, soybean oil has been used for 30‐60 percent of California’s biodiesel supply. Soybeans are the predominant row crop grown in the United States for biodiesel fuel production; canola, palm, and rapeseed are similar alternatives grown worldwide for the biodiesel fuel. All are generally interchangeablinkages.
California does not grow soybeans, and for the last three years no soybean acres are evident by the Agriculture Statics Board January 2010 report.236 Soybean oil used in California for biofubrought in by trains at a cost of 15‐45 cents per gallon, or is trucked in. Soybeans are predominantly grown for thbiodiesel. Most (85 percent) of the soybean is used as meal, and the other 15 percent is usedink, plastics, and fuel. Historically, soybeans were grown and genetically engineered to
232 Energy Commission, Consultant Report, Full Fuel Cycle Assessment: Wells‐To‐Wheel Energy Inputs,
v/fuels/lcfs/010611lcfs_lutables.pdf
Emissions, and Water Impacts, August 1, 2007. 233 ARB, “Proposed LCFS Look Up Tables for the February 24, 2011, Board Hearing,” http://www.arb.ca.go .
Kuala Lumpur,
rs, Forum 2010, Plenary 6: Creating a Sustainable Energy Mix, M.R. Chandran
riculture, National Agriculture Statistics Service, “Crop Production 2009
234 Reinhardt, Guido, “LCA of Biofuel Oil Crops: State of the Art Balancing Scientific Accuracy With the Demands of Policy Makers,” International Palm Oil Life Cycle Assessment ConferenceMalaysia, October 19‐20, 2009. 235 Global Business LeadeAdvisor to EB, RSPO, KL Convention Centre, Kuala Lumpur, November 22‐23, 2010. 236 U.S. Department of AgSummary,” January 2010.
94

maximize meal, not plant oil. Now, genetic research is seeking to maximize the oil productionaspects to expand thi
s crop for fuel markets.
r acre
rce
ume of soybean oil has been steadily growing and accelerating since a
lities
as they at more total
rted
57 percent for soybean oil converted
e flects large‐
8. 241 More critically, California lacks ing facilities, and the crushing process uses hexane, a volatile petrochemical with
t
Of all the food crops considered for biofuels, soybeans have the lowest fuel yield per acre. Soybeans yield approximately 75 biodiesel gallons per acre, as compared to 450 gallons pefor corn‐to‐ethanol or 635 gallons per acre from palm oil.237 As a consequence of the low oil yield per acre, soybean oil is not envisioned to be a major domestic transportation fuel soubeyond a 5 percent level.238
The production volfederal $1.00 per gallon subsidy was enacted in 2004. Soybean oils provide a steady oil quality, desired by biodiesel producers, major oil companies, and marketers for its consistent quaand good cold weather flow properties. Soybean oils produce a better cold weather fuel than palm oil feedstocks.
America is a significant world soybean producer. Sustainability practices are considered apply to grown crops in the United States. There is no historical evidence thagriculture acreage has been required to increase existing soybean oil production, which stain 1990 at zero gallons and grew to nearly 700 million gallons by 2008. However, there is evidence that planted acres for soybean increased from 24,440,000 acres in 1960 to 77,451,000 acres in 2009.239
In 2010, the U.S. EPA adopted a GHG emission reductionto biodiesel or renewable diesel, including indirect land use effects. For California, ARB adopted a 12 percent GHG benefit; direct carbon emissions from soy are 21 g CO2e/MJ, whilthe indirect land use emissions estimate is 62 g CO2e/MJ. This high ILUC estimate rescale forest clearing in countries like Brazil for new soy plantations, where soy plantings increased from 13 million hectares to 21 million hectares in just 10 years.240
There are no known projects in California pursuing soybean or canola farming. The closest plant that is grown in California that produces an oil is sunflower, of which 34,000 acres were planted in 2009, and none were reported in 2007 and 200soybean crushwhich California air quality districts have raised issues.
International commodity prices for soybean oils, canola, rapeseed, and palm oils are somewhalinked in the market. During 1996‐2006, soybean prices ranged from $50 to $110 per barrel, during the same time crude oil was $20‐$40 per barrel lower. Absent governmental intervention, soybean oil does not compete well with petroleum prices. Historically, soybean market prices are more volatile and higher than crude oil prices. The federal $1.00 per gallon
237 Staff assumes soybean values of 51 bushels per acre, 11.28 pounds of soybean oil per bushel, and 7.8
oil per gallon. iesel Board has a 5 percent biodiesel displacement goal by 2015.
pounds of238 National Biod239 Ibid. 240 Gibbs, 2010. 241 U.S. Department of Agriculture, National Agriculture Statistics Service, “Crop Production 2009 Summary,” January 2010.
95

incentive is powerful but not as powerful as the food markets’ strength. Worldwide interest anpolicies pursuing renewable and GHG reduction have spurred the supply an
d d the cost to secure
n
s.
25
lifornia. Several large and modern ethanol totaling roughly 90 MGPY have recently been built in Germany using sugar beets
f
n
w
y
known as energy cane may
wn
ductivity is evident, energy cane requires high volumes of irrigation water of about 8 to 9 acre‐feet per year. This is comparable to current Imperial Valley alfalfa cultivation but higher than the 2 acre‐feet per year required for sweet sorghum cultivation. A
most all plant oils and are likely to continue this trend.
Sugar Beets Sugar beets have been grown in California from the 1950s to present times, primarily in the SaJoaquin and Imperial Valleys, as a feedstock for sugar mills and as a supplemental cattle feed.242 California‐grown sugar beets have very high per acre yields and sugar content and is highly regarded as a potential ethanol feedstock. Sugar beet production in California peaked in 1964 and 1971 with about 350,000 acres of production, but current production is about 40,000 acreAverage yields can be as high as 35 tons per acre (California corn yields are 4.8 tons per acre), with an ethanol conversion factor of about 25 gallons per ton. Production on 200,000 acres couldyield about 170 million gallons per year of ethanol. As a coproduct, sugar beets yield 18 to tons of beet pulp per acre, which can be used as an animal feed supplement.
No sugar beets are in use as a biofuels feedstock in Cabiorefineriesas the feedstock. In California, UC Davis has evaluated their potential as a feedstock and has conducted crop trials. Professor Steven Kaffka of the Department of Agronomy has led much othis research. 243 The California Department of Food and Agricultural is further evaluating sugar beet potential through a $1 million research agreement for energy crop assessment with PIER.
The Energy Commission is funding the Mendota Beet Cooperative’s feasibility study of aintegrated biorefinery through a $1.5 million program grant. The Mendota project would use 840,000 tons of sugar beets per year to produce about 33.5 million gallons per year of locarbon ethanol (45 percent below the petroleum baseline). The Mendota Beet Cooperative estimates cultivation on 11,000 to 22,000 acres of farmland that has either been used historicallfor sugar beet production or that is currently fallow.
Sugarcane While primarily considered a tropical crop, a variety of sugarcanebe well suited for cultivation in the Imperial Valley. Initial field trials through UC Davis indicate extremely high yield potential of 1,200 to 1,400 gallons per acre (as compared to 870 gallons per acre for sugar beets or 459 gallons per acre for corn). 244 Energy cane could be groon nonprime agricultural soils in the Imperial Valley that are currently fallow or that are used for forage grasses such as Bermuda grass, which is used for dairy production. While the potential for high pro
242 Robert Williams and the California Biomass Collaborative, “California Biofuels Potential,” Draft
Kaffka, Presentation at the Energy Commission’s Staff Workshop for the 2010‐2011 Investment Consultant’s Report, unpublished, 2007. 243 StevenPlan (Biofuels Waste‐Stream, Purpose Grown, and Bioengineered Feedstocks, and Production Technology and Economics), September 14‐15, 2009. 244 California Biofuels Potential, Draft Consultant’s Report.
96

UC Davis Biomass Collaborative draft report estimates potential ethanol production of up to 200 MGPY if energy cane were produced on 100,000 acres – 20 percent of the irrigated 500,0acres of farmland – currently in production in the Imperial Valley.245 Such production would not affect primary fo
00
od crop production on prime soils.
nol production from energy cane in California are modeled after state of the
r tensity
licitation, released in April 2010. This
its stalk. It although numerous field trials have been
od
d to extract the sugar juice, which is then fermented to form re 70 gallons per acre to as high as several hundred gallons per
as a
ding materials.
ity
t eloped in Australia to break down sugarcane
stalks into beneficial coproducts.
Proposals for ethaart practices developed for Brazilian production. All parts of the plant would be used; juice for primary fermentation, with the plant remainder (bagasse) being used for process energy focombined heat and power, green energy production, or building products. The carbon invalue for ethanol from energy cane could be as low as 4 gCO2e/MJ, or 95 percent below the gasoline baseline.246
The Energy Commission received several proposals for energy cane to ethanol production in response to the Energy Commission’s PON‐09‐604 sosolicitation was extremely competitive, and the Commission was able to fund only 12 of the 44 proposals received.
Sweet Sorghum Sweet sorghum is a variety of grain sorghum with very high sugar concentrations inhas not been grown commercially in California,conducted in Colusa and San Joaquin Counties.247 It has lower water requirements than California‐grown corn (2 acre feet per year as opposed to 3 acre feet per year for corn). Sweet sorghum will grow on soils with salinity and boron contamination that are unsuitable for focrops, which makes it promising for cultivation in the San Joaquin Valley, which suffers from selenium contamination from long‐term irrigation.
Sweet sorghum plants can be presseethanol. Initial yield estimates aacre. As with sugarcane, the plant remainder can be used as an energy resource (bagasse), cellulosic fuel feedstock, or further broken down to form a variety of feed materials,pharmaceuticals, or buil
The Energy Commission is funding the Great Valley Energy Center sweet sorghum feasibilproject through a $1.9 million program grant. This project will assess multiple sweet sorghum varieties through field trials in Kern County. Great Valley’s approach is to produce ethanol from the sorghum juice and assess the feasibility of producing building products from the planremainder using the Tilby Press, which was dev
Fuel Conversion Processes The Energy Commission is developing detailed assessments for major biofuel conversion processes. These assessments will expand upon the tables in Appendix C. 245 Ibid. 246 California Ethanol and Power, “California‐Produced Sugarcane Ethanol to Be Responsible for Less Greenhouse Gas Emissions Than Gasoline and Brazilian Ethanol,” http://www.californiaethanolpower.com/pdfs/CEP‐Press‐Release‐Feb20‐2009_Final.pdf. 247 Phillip Trainer, Presentation at Energy Commission Biofuels Workshop, September 14‐15, 2009.
97

Gasoline Substitutes Gasoline substitutes, including ethanol, represent a significant opportunity to use existing technologies to expand low‐carbon alternative fuel use. Gasoline substitutes refer to any liquid
t
ade. Between 2004 and 2008, California ethanol rate of more than 55 percent to its curren this capacity has been significantly underused in recent years, with just 21 million GGE produced in 2009.248
Despite its relatively small production of ethanol, California consumes a significant amount of the fuel each year. In 2003, California ethanol consumption jumped from a little more than 100 million gallons to a little less than 600 million gallons, due to its replacement of methyl tertiary butyl ether as a prominent gasoline additive. Consumption jumped another 44 percent in 2004 and almost 10 percent in 2005, and remained fairly steady until 2010, when the ethanol blend in California reformulated gasoline increased to 10 percent, and total ethanol use grew to nearly 1.5 billion gallons. However, California ethanol facilities contributed less than 4 percent of the state’s needs during 2010. Figure 4 shows California ethanol consumption.
Figure 4: California Ethanol Consumption, 1981-2010
fuel that can significantly displace gasoline in internal combustion engines. This section also refers to renewable drop‐in gasoline substitutes, which are physically identical to gasoline but are produced through alternative technologies.
Ethanol is the most prominent alternative fuel produced and consumed in the United States and California. Between 1997 and 2010, nationwide production has increased more than 19.5 percenper year, with about 13.1 billion gallons of ethanol produced in 2010. Similar increases in ethanol production were seen within California throughout the previous dec
production capacity grew at an average annualt capacity of 240 million gallons per year. However,
0
1,000ons
200
400
600
800
Millions of G
a
1,200
1,400
1,600
ll
198
198
198
198
198
199
199
199
199
199
200
200
200
20
1 3 5 7 9 1 3 5 7 9 1 3 5 07
2009
Source: California Energy Commission and Energy Information Administration
248 O’Neill, Garry, John Nuffer. 2011. 2011 Bioenergy Action Plan. California Energy Commission, Efficiency and Renewables Division. Publication Number: CEC‐300‐2011‐001‐CTF.
98

A variety of federal and state policy mandates will necessitate an increase in the consumption renewable fuels through this decade. Given that California is about 11.5 percent of the U.S. population, California’s “fair share” consumption of biofuels under the federal RFS2 is expto be roughly 3 billion gallons.
of
ected
s ethanol is a mixture of ethanol produced in‐state, in the Midwest, and
ble
production
vert ng will also be
fuels used for process energy
249 At the state level, the ARB’s LCFS outlines four scenarios forachieving GHG emission reductions from gasoline, each of which prominently includes contributions from ethanol. These scenarios include a broad range, from 2.2 billion gallons to 3.1billion gallons per year by 2020.250 The state’s Bioenergy Action Plan establishes a 2 billion GGE target for biofuel consumption by 2020, in which ethanol is likely to feature prominently. The Bioenergy Action Plan also calls for 20 percent of the state’s biofuel consumption to be met by in‐state resources. For ethanol, this will entail approximately 500 million gallons per year in additional production (in addition to the full resumption of production at existing plants).251
Currently, California’from foreign sources. California is uniquely positioned, however, to use vast low‐carbon feedstocks and to produce ethanol from feedstocks other than corn. For example, California hassignificant waste streams from the agricultural, municipal, and forest sectors that are availafor use as feedstocks for advanced biofuels with low‐carbon content.252 Specialty bioenergy crops such as cane, sweet sorghum, and perennial grasses can also be grown on marginal soilsto produce very low‐carbon biofuels (with 75 percent and higher GHG reductions from the petroleum baseline).
However, at this time, these types of renewable fuel technologies have not been demonstrated to be commercially successful. The U.S. EPA issues renewable volume obligations each December to provide guidance on the mandated minimum volumes of renewable fuels by various categories for the upcoming calendar year. Over the last two years, the EPA has significantly reduced the cellulosic renewable fuel requirement due to the lack ofcapacity in the United States, most recently reducing the RFS cellulosic requirement for 2011 down from 250 million gallons to 6 million gallons.
To encourage further development of low‐carbon liquid fuel options, the Energy Commission intends to allocate $7.5 million for the development of new production facilities that can consustainably derived cellulosic feedstocks into a low‐carbon ethanol. This fundiopen to projects that produce drop‐in gasoline substitutes, rather than ethanol.
Additionally, process energy efficiency measures and alternative can further reduce the GHG emissions from California ethanol. At the Energy Commission’s 249 Orta, Jason, Zhiqin Zhang, and et. al. 2010. 2009 Progress to Plan – Bioenergy Action Plan for California. California Energy Commission. CEC‐500‐2010‐007. 250 Air Resources Board, Proposed Regulation to Implement the Low Carbon Fuel Standard: Volume II, Appendices, March 5, 2009, http://www.arb.ca.gov/fuels/lcfs/030409lcfs_isor_vol2.pdf.
‐007.PDF251 California Energy Commission, 2009 Progress to Plan – Bioenergy Action Plan for California, http://www.energy.ca.gov/2010publications/CEC‐500‐2010‐007/CEC‐500‐2010 252 An Assessment of Biomass Resources in California, 2007 Draft Report, PIER Collaborative Report, March 2008. Using a California Biomass Collaborative average value of 82 gals of ethanol derivable from each BDT of a mix of biomass wastes and residues yields a technical potential in 2010 of 2.9 billion gallons of ethanol.
99

2010‐2011 Investment Plan Biofuels Workshop, several project developers described strategies to produce very low‐carbon intensity biofuels (with more than 80 percent reductions from the
d new demands, similar to the production strategy used by petroleum refiners.253
ics
forthcoming.
well very narrow margins, as
upward has occurred
Credit: a $0.45 per gallon excise tax credit for
to ic production. It is set to expire in 2011.
a $0.10 per gallon tax credit for ethanol
CaRFG baseline) at competitive prices in California. These strategies include:
• Separation of feedstocks into multiple value‐added products including ethanol, renewable diesel, green electricity, and other coproducts.
• Development of specialty bioenergy feedstocks such as energy cane, sweet sorghum, and perennial grasses that can be grown on marginal, non‐food crop soils.
• Capital investments to increase biorefinery production outputs to meet shifting anmarket
However, a lack of capital and debt financing is impeding biofuel plant development and upgrades at existing plants. If capital and debt financing were readily available, California’s existing and planned plants could initiate use of California’s biomass wastes and other alternative low‐carbon feedstocks. Many in‐state developers of advanced biofuels projects are positioned to provide technology specifically designed to convert agricultural, forest, and municipal waste streams to transportation fuel. However, the present poor operating economassociated with these potential projects is the primary reason that financing has not been
The profitability of the U.S. ethanol industry has fluctuated with gasoline price and demand as as corn prices. Consequently, in recent years the industry has had
the impact of the global economic slowdown and decline in oil demand and prices, as well as pressure on corn price, have made survival more difficult. This poor performance despite a number of policy actions that support the ethanol industry, including:
• The Volumetric Ethanol Excise Taxrefiners and blenders. It is set to expire in 2011.
• The Secondary Tariff on Ethanol: a $0.54 per gallon ethanol import tariff intendedsupport domest
• The Small Ethanol Producer Tax Credit:production up to 15 million gallons. The credit is available only to small scale ethanol producers with an annual production capacity of no more than 60 million gallons. It is set to expire in 2011.
• The Cellulosic Biofuel Producer Tax Credit: a $1.01 per gallon tax credit for producers of cellulosic biofuel, intended to spur cellulosic production. It is set to expire in 2012.
California Ethanol Producer Incentive Program
253 Testimonies of David Rubenstein of California Ethanol and Power, Brian Pellens of Great Valley Energy, and Bob Walker of Swan Biomass, AB 118 2010‐2011 Investment Plan Workshop, September 14‐15, 2009, California Energy Commission, Sacramento, California.
100

The Energy Commission developed the CEPIP to provide operators of existing corn ethanolproductio
n plants (minimum 10 million gallons per year) in California with temporary financial
d
rbon eir produced fuel by at least 10 percent, relative to the default value
ly used to meet n
ticipants their facilities.
‐
of lt, the Energy Commission will
PIP and study the benefits from its proposed $6 million
assistance during periods of difficult economic operating conditions. Currently, five plants areeligible for this assistance. This funding would be repayable under specifically identified favorable market conditions. The CEPIP is designed to stimulate operational improvements atexisting ethanol facilities and the use of advanced process technology to convert cellulose another low carbon feedstocks. The objectives of the CEPIP are to increase statewide biofuel production, retain and create California jobs, and reduce GHG emissions. CEPIP was provided$6 million in initial funding, with the understanding that funding could be increased by $9million.
The CEPIP requires participants to comply with biorefinery operational enhancement goals (BOEG) in one of two ways. The first BOEG is based on the participants’ reducing the caintensity value of thadopted under the LCFS for their particular process application and type of feedstock. The second BOEG requires the biorefiner to displace at least 20 percent of their existing feedstock with waste‐based feedstocks. Participants in the CEPIP must achieve either of these goals according to a set timeline of milestones. The first milestone, not yet reached by any of the participants, requires the biorefiner to submit a draft plant for compliance with either of the BOEGs within six months of participation. In the first quarter of 2011, two of the five eligible CEPIP facilities are producing ethanol. It is expected that two more facilities could start operations in 2011.
The objectives of the CEPIP reflect the Energy Commission’s broader objectives for alternative fuels. These include the production of an in‐state alternative fuel that is widestate gasoline oxygenate content requirements. California consumed more than 1.4 billiogallons of ethanol in 2010. However, before CEPIP, more than 95 percent of this volume was imported from outside the state. The reopening of in‐state biorefiners also has important job benefits, as each facility has been able to rehire dozens of workers who had been laid‐off. In‐state biorefiners also ensures a technology and facility base for California to expand into next‐generation biofuels. Finally, the continued operation of these plants protects millions of dollars in existing private investment into California alternative fuels production and gives paran opportunity to leverage additional private investment in
During the administration of the CEPIP, market conditions have becoming increasingly unfavorable for ethanol production, particularly within California. This is due in part to nearrecord commodity costs for corn. Given uncertain market conditions and future price projections, it is unclear whether a modest state price support program can offset the effectsthis unprecedented change in the ethanol fuel market. As a resureevaluate the future of the CEinvestments before making a recommendation on funding.
As part of this reevaluation, the Energy Commission is planning a forum for summer 2011 that will investigate the connections among alternative fuels, agriculture markets, and food commodities. This forum will incorporate input from ethanol producers, federal and state agriculture agencies, and livestock and poultry farmers, and will provide information for a long‐term strategy for supporting in‐state biofuel production.
101

Upstream Fuel Infrastructure
More than 80 percent of the nation’s ethanol production is in six Midwestern states and must beshipped to distribution terminals in other regions via truck, barge, or rail, transport modes thatare more expensive than pipelines. California produces less than 5 percent of the ethanol it consumes and will continue to rely heavily on imports even if this percentage increases. Ethanois imported into California by unit train volumes moving from the Midwest to terminals in Southern and Northern California before being redistributed by truck.
In the near term, most of the projected increase in shipments of ethanol to terminals will be handled by tanker truck and rail tank car as opposed to pipelines. Except for a few proprietary pipelines, the common carriers
l
generally do not ship ethanol in their systems. The increased for water contamination associated with ethanol are key factors Investment funding for distribution improvements is small.
ll
California sales of E8 ssing 3 million gallons in 2010. However, the Energy Commission expects that the retail presence and sales of E85 will need to expand if the state is to meet its fair share of RFS2 compliance. 254 Depending on the average quantity of fuel sold by a typical E85 dispenser, California could require between 4,400 and 30,900 E85 dispensers by 2022. To put that estimated number of new dispensers into perspective, there were about 42,050 retail dispensers in California during summer of 2008 for all fuel types.255 Figure 5 shows the recent trends of E85 stations and E85 sales volume.
Figure 5: Historical E85 Stations and E85 Sales Volume
risk of corrosion and potentiallimiting its transport via pipeline.An existing infrastructure moves ethanol from production sites to service stations, and that process is not expected to change materially over the next 10‐20 years. However, as ethanol demand grows due to RFS2 and LCFS requirements, the scope of the distribution system will need to expand. For the United States overall, new sources of ethanol from cellulosic plants wibe producing ethanol from sites outside the traditional Midwest, requiring more truck, rail, andbarge movements to markets.
Local Fuel Infrastructure
5 have risen significantly over the past five years, surpa
254 Transportation Energy Forecasts and Analyses for the 2009 Integrated Energy Policy Report, California Energy Commission, Final Staff Report, Publication Number CEC‐600‐2010‐002‐SF, May 2010. 255 Gordon Schremp and Nicholas Janusch, 2009. Fuel Delivery Temperature Study, California Energy Commission. CEC‐600‐2009‐002‐CMF.
102
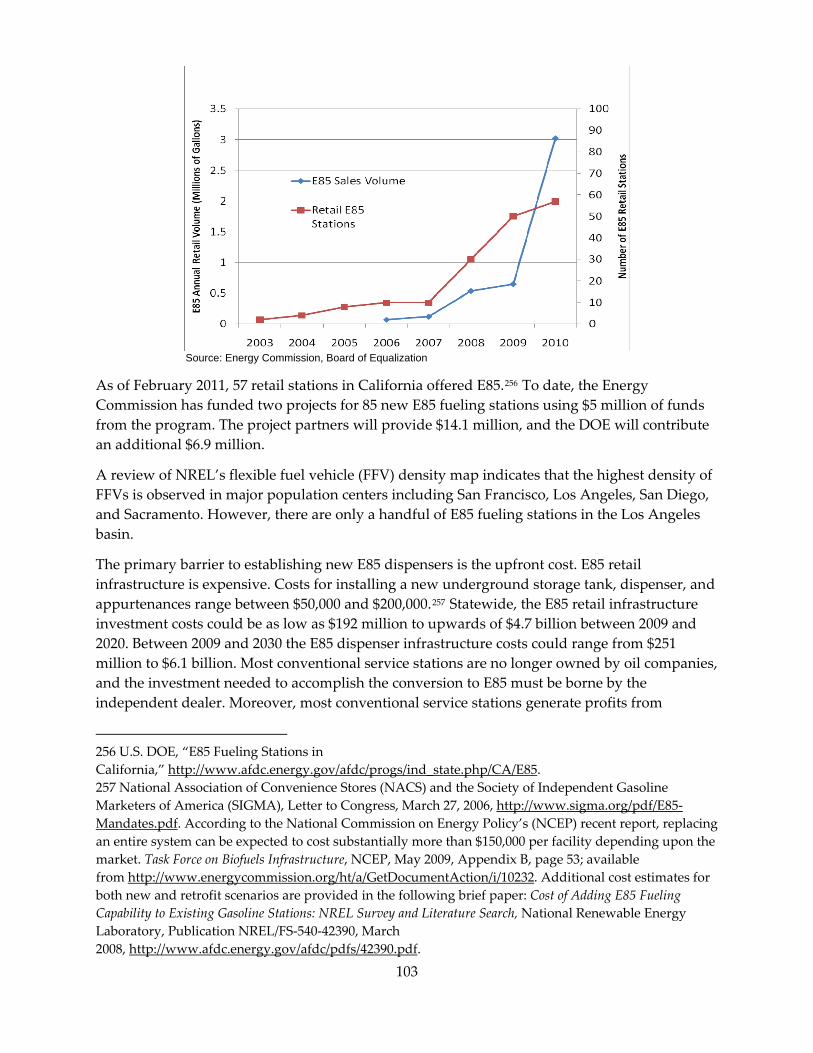
Source: Energy Commission, Board of Equalization
As of February 2011, 57 retail stations in California offered E85.256 To date, the Energy Commission has funded two projects for 85 new E85 fueling stations using $5 million of funfrom the program. The project partners will provide $14.1 million, and the DOE will contribute an additional $6.9 million.
ds
d ucture
,
generate
A review of NREL’s flexible fuel vehicle (FFV) density map indicates that the highest density ofFFVs is observed in major population centers including San Francisco, Los Angeles, San Diego, and Sacramento. However, there are only a handful of E85 fueling stations in the Los Angeles basin.
The primary barrier to establishing new E85 dispensers is the upfront cost. E85 retail infrastructure is expensive. Costs for installing a new underground storage tank, dispenser, anappurtenances range between $50,000 and $200,000.257 Statewide, the E85 retail infrastrinvestment costs could be as low as $192 million to upwards of $4.7 billion between 2009 and 2020. Between 2009 and 2030 the E85 dispenser infrastructure costs could range from $251 million to $6.1 billion. Most conventional service stations are no longer owned by oil companiesand the investment needed to accomplish the conversion to E85 must be borne by the independent dealer. Moreover, most conventional service stations profits from
256 U.S. DOE, “E85 Fueling Stations in California,” http://www.afdc.energy.gov/afdc/progs/ind_state.php/CA/E85. 257 National Association of Convenience Stores (NACS) and the Society of Independent Gasoline Marketers of America (SIGMA), Letter to Congress, March 27, 2006, http://www.sigma.org/pdf/E85‐Mandates.pdf. According to the National Commission on Energy Policy’s (NCEP) recent report, replacing an entire system can be expected to cost substantially more than $150,000 per facility depending upmarket. Task Force on Biofuels Infrastructure, NCEP, May 2009, Appendix B, page 53; available from
on the
http://www.energycommission.org/ht/a/GetDocumentAction/i/10232. Additional cost estimates for both new and retrofit scenarios are provided in the following brief paper: Cost of Adding E85 Fueling Capability to Existing Gasoline Stations: NREL Survey and Literature Search, National Renewable Energy Laboratory, Publication NREL/FS‐540‐42390, March 2008, http://www.afdc.energy.gov/afdc/pdfs/42390.pdf.
103

convenience store sales and service or repair business, while usually breaking even on fuel sales. Investors have the challenge of recovering significant investment cost while marketing an
h
hich
tial low penetration and
ting of the on of E85 distribution stations within their jurisdiction.258 Other Authorities Having n consider E85 as a fuel equivalent to gasoline and are determining E85 distribution
icy the date
ed toward meeting CAFE standards, as provided by the
E85 and fuel.
initially lower volume product.
The most significant factors in fuels sales are location and price. Locating E85 stations at higvolume stations on busy commuter routes will be an important factor in achieving the required volumes. Another factor in siting E85 stations is the size of many existing service stations, woccupy small parcels that cannot readily accommodate an additional tank. The service station owner may be reluctant to dedicate an existing tank to E85 due to inivolume sales of E85. Without external funding sources, retail availability of E85 would solelyrely on retail site owners voluntarily choosing to invest in E85 dispensing equipment.
Permitting for the development of stations must be done through the local Authority Having Jurisdiction – usually the local fire marshal. According to the State of California Supervising Deputy State Fire Marshal, there are local fire marshals who do not allow the permitconstructiJursidctioequipment as having natural equivalency.
In June 2010, Underwriters Laboratory UL certified two fuel dispensing systems for E85, including dispenser, hose, nozzle, swivel, breakaway, and shear valves. Because UL polstipulates its listings apply only to those particular units that were manufactured after of certification, current retailers who sell E85 may need to purchase all new equipment. In addition, those retailers may need to ensure that their underground equipment is also listed ascompatible or replace the entire system, an expensive undertaking.
Given the anticipated demand growth for E85 and the associated retail station infrastructure needs discussed above, the Energy Commission intends to allocate $4 million for the further expansion of E85 fueling infrastructure. This amount of funding could provide 40‐60 stations,depending on capital cost. This funding will be guided by results of a survey of automakers, which will provide information on the numbers and locations of FFV deployments.
Vehicles
Engine modifications are needed to accommodate E85, while retaining capability to operate on gasoline or any blend containing up to 85 percent ethanol. Modification costs, however, are sufficiently low that U.S. automakers have produced FFVs since 1993, primarily to take advantage of the credit allowAlternative Motor Fuels Act of 1988. According to the Office of Energy Efficiency and Renewable Energy, there were about 8.4 million E85 FFVs on the road in the United States in 2009, with more than 400,000 of these in California. Due to the limited availability of the cost relative to gasoline, most FFVs never use this
258 ICF interviewed the State of California Supervising Deputy State Fire Marshal to developunderstanding of the safety and permitting issues associated with E85
a clearer stations.
104

All gasoline vehicles can now use E10 blends safely, and EPA has determined that newer (post‐2000) vehicles can use E15 safely.259 As older vehicles are retired, most of the fleet will be E15capable by 2015. However, several barriers would need to be overcome if E15 use werbecome a reality
‐e to
in California. California has its own reformulated gasoline regulations that are f to
vehicles
s l
cturers for producing FFV models by 2020.260
ine vehicle ethanol‐capable, manufacturers install a computerized optical
85
s for FFVs. This
ord has also
ore
based on vehicle testing of gasoline with ethanol no greater than 10 percent. New testing ovehicles, assuming no deleterious emission impacts, would take time – at least three years complete. In addition, no vehicle manufacturer allows ethanol concentrations in excess of 10 percent to be used without violating the vehicle warranty. Finally, service station owners have no liability protections against misfueling damage claims for people that use E15 in older than model year 2001.
In contrast, E85 can be used only in vehicles designated as an FFV. Future emission standardfor California will make certification of FFV models more difficult in California. At the Federalevel, new fuel economy regulations phase out the fuel economy credits available to manufa
FFVs account for 1.5 percent of California light duty vehicles, or more than 400,000 vehicles.261 All E85 use is in the light duty vehicle category. By 2020, projections based on DMV vehicle registration data indicate upwards of 800,000 FFVs for both light‐ and medium‐ duty applications.262
To make a gasolsensor or other technology that detects how much ethanol is in the fuel mixture. Because ethanol is more corrosive than gasoline and has less energy content, manufacturers need to usemodified materials and larger sizes for the gas line, gas tank, pumps, and injectors.
E85 has about 30 percent less energy per gallon so the fuel efficiency of a FFV running on Ewill be about 30 percent lower on a volumetric basis. As a result the vehicle range will be proportionally reduced since OEMs do not typically specify larger fuel tankmeans that E85 prices should be reduced a comparable percentage to be fairly priced at GGE prices.
In 2006, Ford, DaimlerChrysler, and GM indicated they would produce 2 million FFVs by 2010.In May 2010, Ford announced it would fulfill its projection by the end of the year. Fannounced that FFV certified engines would be available on 50 percent of nameplates by modelyear 2013, including new small engines such as in the Focus. GM made a commitment that m
259 U.S. EPA, “EPA Announces E15 Partial Waiver Decision,” http://www.epa.gov/otaq/regs/fuels/additive/e15/420f11003.pdf. 260 ICF International, “Technical Analysis for the Alternative & Renewable Fuel & Vehicle Technology
ed report, November 22, 2010.
V data.
Program ‐ Task 2 –Evaluate Alternative and Renewable Fuel Infrastructure and Distribution Development for E85,” draft unpublish261 DMV data. 262 Energy Commission staff estimate, based on DM
105

than 50 percent of its product made this same pledge.263
T g of E85 is a significant driver for research int that improve ogies that capitalize on this physical Most researchers focus on increased compression ratio engines or more
n. For example, Ricardo Motors has demonstrated an ethanol‐n engine with extreme downsizing and estimated that a fuel economy
g
ine knock is most likely to occur. Their research determined that a small, turbocharged, high‐compression‐ratio spark ignition engine can provide the same peak power
ion by model year 2013 will be FFVs. DaimlerChrysler
he high octane ratin engine technol
o vehicle technologies property
operating of the fuel.
with natural,frequently, boosted aboosted direct injectio
spiratio
improvement of up to 30 percent is possible on equal performance basis.264
Ford is supporting the development of a similar technological approach using ethanol boostinsystems.265 The proposed technology uses conventional gasoline fuel in higher compression ratio engines as long as a small quantity of E85 is available on board for high load conditions when eng
as a naturally aspirated gasoline spark ignition engine but will be 20 to 30 percent more fuel‐efficient. As a reference, that level of fuel economy increase is provided by some of today’s hybrid vehicles but at a substantial cost disadvantage.
Table 21: Ethanol Funding Allocation
Advanced Cellulosic Ethanol Production Plants $7.5 Million
E85 Fueling Stations $4 Million Total $11.5 Million
Source: California Energy Commission
Diesel Substitutes Diesel substitutes are defined as biomass‐based diesel fuels including biodiesel and renewdiesel, as well as specific feedstock‐ and process‐based diesels such as algae‐based diesel, biomass‐Fischer‐Tropsch diesel, and diesel from thermal depolymerization of industrial and food processing
able
waste.266 Of these fuels, only biodiesel is commercially available in California
process that blends bio‐oils and a catalyst to
and renewable diesel is now produced in Louisiana and abroad in Rotterdam, Singapore, and Finland.
Biodiesel refers to a non‐petroleum‐based diesel made from vegetable oils or animal fats using aprocess called transesterification. This is a simple make a biodiesel fuel, which is often blended with conventional petroleum‐based diesel. In
263 ICF International, “Technical Analysis for the Alternative & Renewable Fuel & Vehicle Technology Program ‐ Task 2 –Evaluate Alternative and Renewable Fuel Infrastructure and Distribution
265 Ethanol Boosting Systems, LLC, “Ethanol Turbo Boost for Gasoline
Development for E85,” draft unpublished report, November 22, 2010. 264 Ricardo Motors, “The Impact of Federal Requirements on Future Vehicle Technologies”, Presentationat AVT Conference, October 30, 2009.
Engines,” http://www.ethanolboost.com/EBS_Overview.pdf. 266 Thermal depolymerization is a process in which pressure and heat reduce complex organic materials into short‐chain hydrocarbons (such as light crude oil).
106

2009, California used 6.9 million gallons of biodiesel.267 Today, California has the potentexpand its biodiesel use to 200 million gallons within the industry‐accepted blend of 5 percent biodiesel and 95 percent conventional diesel (also known as B5) without requiring modifications to vehicles and retail infrastructure. Wholesale modifications, however, arenecessary to store and blend segregated biodiesel into diesel fuel.
Renewable diesel can be made from a variety of feedstocks
ial to
and is typically processed in a g
ewable
Biom e, o forest residue. Through a gasification process, the biomass is converted into diesel and naphtha. The final diesel product or blen l with conventional diesel fuel and infrastructure.
B fuel prod are bein rched l companies (sehong Chemical Co., Ltd.). Biochemical processes vary
iesel process. Algae is an especially
s
duce GHG 270
refining facility where the feedstocks are transformed into a diesel fuel through hydrocrackinand hydrogenation. The refinery‐based process produces a renewable diesel fuel that is chemically identical to diesel fuel, requiring no modifications for infrastructure or diesel engines. Segregated wholesale rack infrastructure modifications may be needed for rendiesel as well.
ass Fischer‐Tropsch diesel can be made from agriculture waste, green waste, food wastr
has superi fuel qualities and can be used in any d leve
iochemical processes for uction g resea by severa uch as Amrys, Solazyme, Jiangsu Yuconsiderably, and the final fuel product specifications are as varied as the processes and are inthe beginning stages of development. Energy Commission staff will continue to monitor these promising technologies.
Algae‐derived diesel is a research‐phase effort that involves growing algae in ponds or in containers that either reacts with sunlight and CO2 or is fed sugar to reproduce and create oils for later separation and use in any biomass‐based dattractive fuel source for diesel, gasoline, and aviation fuel, since the process does not require arable land and results in a fuel with up to an estimated 80 percent reduction in GHG emissioncompared to petroleum‐based diesel.268 Additionally, algae‐derived diesel may have a significant potential to replace conventional fuels due to its ability to produce up to 30 times more oil per unit of growth area than land plants.269
Diesel substitutes could be significant contributors to reduce GHG emissions in California’s transportation sector. Depending on the feedstock, biomass‐based diesel fuels reemissions 12 percent to 93.8 percent compared to conventional diesel fuel. Additionally, the6.9 million gallons of biodiesel used in California in 2009 had the estimated emissions reductions (with the exception of nitrogen oxide [NOx], which increases) shown in Table 22.271
267 Energy Commission staff, based on data from the California Board of Equalization.
esel to GHGenius, September 30, 2009.
utables.pdf
268 (S&T)2 Consultants, Inc., The Addition of Algae and Jatropha Biodi269 NREL, Aquatic Species Project Report FY 1989‐90. January 1992. 270 California Air Resources Board, Low Carbon Fuel Standard Table 6 Carbon Intensity Lookup Table for Diesel and Fuels that Substitute for Diesel, at http://www.arb.ca.gov/fuels/lcfs/121409lcfs_l . 271 Original data derived from the National Biodiesel Board’s on‐line calculator, available at http://www.biodiesel.org/tools/calculator/default.aspx?AspxAutoDetectCookieSupport=1. NOx
107

Table 22: Estimated Emission Reductions From 6.9 Million Gallons of Biodiesel in 2009
Particulate Matter Hydrocarbons Carbon
Monoxide NOx1 SO2
Percentage Reductions 47 67 48 -15 100
Emission Reductions (lbs) 34,775 38,880 383,685 -160425 30,430 Source: National Biodiesel Board, ARB
The ARB’s Research Division is investigating biodiesel NOx impacts, and its staff released a draft biodiesel NOx mitigation plan. Preliminary research findings suggest that NOx emissionincrease 10‐35 percent depending on engine, feedstock, and test cycle. The staff draft biodNOx mitigation plan relies on blending renewable diesel or a common cetane improve
s iesel
r to tion. An ARB hearing and
ge
Valley or in more remote locations, and areas not served by the
ll to increase the availability of
acceptance of higher biodiesel blend concentrations for use in all diesel vehicles. California has several compelling reasons to increase in‐state production and use of biomass‐based diesels:
• Significant emission reductions from lower carbon intensity.
t petroleum
render biodiesel’s NOx emissions neutral, requiring no further mitigaregulation on this are anticipated in October 2011.
Biodiesel is today’s option, but it requires bulk storage and rack modifications to significantly expand beyond its current volume. Ultimately, biodiesel is expected to supply less than 10 percent of California’s diesel demand due to domestic feedstock supply limitations. In the near‐term, renewable diesel is envisioned to become a commercial product, will be comingled withpetroleum diesel, flow through the existing pipelines, and be dispensed from petroleum storaand rack terminals. Renewable diesel is also envisioned to use separate and dedicated storage and blending facilities similar to today’s regular and premium grade gasoline.
Most renewable diesel is likely to be produced at refineries on California’s coast, and the fuel transported via pipeline throughout the state. Concurrently, most biodiesel is envisioned to be produced in the Central pipelines connected to major refineries.
The key obstacles for diesel substitutes are economic viability due to high feedstock costs and the lack of California bulk infrastructure. To become a more viable fuel option, California wineed strategic deployment of blending and storage terminals diesel substitutes to customers. Additional progress will be needed to produce fuels from renewable feedstocks (including algae and the organic fraction of municipal waste sources) andpurpose‐grown crops, as well as to demonstrate the market viability of these sources. The federal subsidy of $1 per gallon will spur diesel substitutes economic viability in the short term,and the federal RFS and the California LCFS will spur economic viability in the long term. In addition, automakers and engine manufacturers will need to show widespread
• Along with biomethane, biomass‐based diesel represents one of the most effective alternative fuels for reducing GHG emissions. It also provides a significandiesel gallon displacement, thereby diminishing California’s dependence on petroleum.
staff to reflect ARB’s research on California‐specific emission data weighted by Energy Commission
diesel.
108

• In‐state biodiesel production plants are needed to ensure California’s “fair share”
on
nt
urability, fuel plugging, variable fuel quality, and cold weather properties.
STM D975 r these
ated
biofuel use of 60 million gallons per year by 2022 as specified in the RFS of the EISA.
• The LCFS identifies a major role for biofuels, such as biomass‐based diesel, in achieving the 10 percent carbon intensity reduction target. Biofuels are projected to contribute 60 percent to 89 percent of the carbon intensity reductions.272 Up to 30 new biorefineries could be needed in California to meet the LCFS carbon intensity reduction requirements for diesel fuel.273
• California has biomass waste streams from agricultural, municipal, and forest sectors available for the production of biofuels with low carbon intensity. Bioenergy specialty crops such as algae, jatropha, and canola can be grown on marginal land to produce biofuels using conventional conversion technologies.
• To meet the 2010 in‐state production goal in California’s BAP, the state needs to restartits largely idle in‐state production capacity of 68 MGY. In‐state production increases California jobs and economic benefits and reduces GHG emissions by minimizing imported fuel transport costs and impacts. California needs to add 4‐8 new facilities for a total of 115 million gallons of new capacity to meet the 2020 BAP goal.274
Biodiesel/Renewable Diesel Fuel Use and Vehicles In 2010, 1.0 million on‐road diesel vehicles were registered in California, consuming 2.6 billigallons of diesel. Off‐road diesel demand adds an additional 1 billion gallons. Heavy‐duty and off‐road vehicle applications use more than 92 percent of all diesel fuels and therefore represethe key market for biomass‐based diesel fuels.275 Biodiesel has unique fuel properties that require a unique American Society for Testing and Materials (ASTM) D‐6751 fuel specification. It also has special handling, storage, and use requirements. This fuel poses challenges with vehicles and engine d
Renewable diesel has less variable fuel properties than biodiesel and complies with A(petroleum diesel fuel) or ASTM D396 (home heating oil).276 Engine manufacturers favocharacteristics. Based on current ASTM specifications, renewable diesel fuels are not anticipto require any vehicle modifications or preventative maintenance.
Today, the main barrier to expanded B20 or renewable diesel R20 use is the 20 cent to 40 cent per gallon higher price for blend than standard diesel. Future renewable diesel fuels are expected to encounter the same higher price challenge as biodiesel because both use the same
272 California Air Resources Board, Proposed Regulation to Implement the Low Carbon Fuel Standard: Initial
://www.arb.ca.gov/regact/2009/lcfs09/lcfs09.htmStatement of Reasons, March 5, 2009, http . 020. Assuming 50 million
be needed;
273 About 1.4 billion gallons of soybean biofuel is needed at 68 g GHG/MJ by 2gallons per plant, 28 plants would be needed. Conversely, 8 yellow grease plants would however, there is not enough yellow grease in California to fuel 8 plants. Based on Energy Commissionstaff analysis done in support of the 2009 IEPR. 274 This assumes 15‐30 million gallons per year plant size. 275 Energy Commission staff analysis. 276 National Biodiesel Board. Biodiesel, Renewable Diesel & Co‐Processed Diesel. http://www.biodiesel.org/pdf_files/fuelfactsheets/Co‐Processing%20One%20Pager.pdf.
109

expensive feedstocks. Since 1992, most diesel fleets obligated to meet federal alternative fuel userequirements use B20 as the lowest‐cost compliance option.
d icles,
les provided sufficient market opportunity for some manufacturers to
y diesel cars and pickup trucks can use B5 or R5 blends without voiding
le
l.279
.280
se were
ied on
277 Most major medium‐ anheavy‐duty diesel engine vehicle manufacturers accept blends of up to B20 in their vehwhich are also accepted as an alternative compliance option for the federal alternative fuel vehicle purchase requirements.278 Federal fleets required to use an alternative fuel in medium‐ and heavy‐duty vehicbuild B20 compatible vehicles in limited models. These medium‐ and heavy‐duty engines were not subject to the aggressive emission reductions required of light‐duty vehicles since the 2004 model year, but the 2010 heavy‐duty diesel engine standards will be as stringent as the 2004 light‐duty standard.
All light‐dutmanufacturers’ warranties. However, new light‐duty diesel vehicles are susceptible to biodiesel’s engine‐oil‐dilution and have critical emission control needs. As a result, vehicle manufacturers are currently not recommending higher blends for use in new light‐duty vehiclesalthough some are conducting research that may enable future B20 acceptance. Since renewabdiesel blends of up to 90 percent meet conventional diesel standards, light‐duty diesel vehicle manufacturers are not likely to be as concerned with higher blends of renewable diesel as they are with higher blends of biodiese
In November 2008, ASTM International adopted new biodiesel standards for B5, B20, and B100blends to address the fuel quality problems identified in the last decade. The Energy Commission is funding additional work to develop and perform test methods for the development of national standards for biodiesel blends greater than 20 percent by volume Compliance with the recently established ASTM B5 standard would provide the opportunity to triple biodiesel use.
In 2008, 1.6 million gallons of biodiesel were sold at 39 retail stations within California. Of the1.6 million gallons, 1 million gallons were sold as part of B20 blends, and 250,000 gallonssold as B99 blends. 281 The majority of fuel was used by non‐retail facilities such as commercial fleets, governmental entities, private card locks, and rental companies, most of which relB20 blends.
Funding for vehicle demonstrations is not recommended for biodiesel vehicles. The producersof some new diesel substitute fuels are requesting vehicle demonstration funds. These demonstrations will allow for precommercial identification and correction of any deleterious engine effects that might otherwise dissuade light‐duty vehicle manufacturers. While the
277 The Energy Policy Act of 1992 regulations require that federal, state, and alternative fuel provider fleets build an inventory of alternative fuel vehicles. 278 National Biodiesel Board, “OEM Information / Standards and Warranties,” http://www.biodiesel.org/resources/oems/default.shtm. 279 Renewable diesel engine testing finds that blends up to nearly 90 percent have the ability to meet ASTM 975 Standards, Preliminary Results from Neste and Conoco Phillips Testing, 2003‐2007.
troleum Industry Information Reporting Act data. 280 This task part of a $4 million agreement with Department of Food and Agriculture. 281 Energy Commission, Pe
110

Energy Commission will continue to monitor this opportunity, it is not currently allocatiprogram funds for this purpose.
Fuel Production California has 12 biodiesel plants with a combined annual production capacity of 76 million gallons. Due to the industry’s inability to compete with petroleum‐based diesel prices, these plants likely produced fewer than 5.5 million gallons in 2010282. Six plants, representing one‐third of the state’s biodiesel production capacity, are idle due to their price disparity.283 TheBAP requires a minimum of 20 percent of biofuels to be produced within
ng any
California by 2010 and
in‐
and lowest GHG
d
move into pilot and precommercial‐scale d second generation biofuel plants is needed to reach the
de and in California. The ARB’s LCFS
t
s
rastructure, and California’s regional
ission is allocating $7.5 million, including possible loans ia
40 percent by 2020. With an estimated diesel demand of 5.25 billion gallons by 2020, a minimumof 200 million gallons of biomass‐based diesel and other biofuels are needed, requiring anstate plant expansion of up to 115 million gallon. The ARB LCFS program’s 2020 goal is projected to require 0.7 billion‐1.0 billion gallons of diesel substitutes assuming 50‐75 percent carbon reduction respectively – assuming 5.25 billion gallons of diesel demand in 2020.
Biodiesel plants use recycled cooking oil (yellow grease) as their lowest‐costfeedstock as well as more expensive (and typically higher GHG) feedstocks such as soybean, palm, and a variety of plant and animal oils. To reach higher diesel substitute volumes, secongeneration feed sources and plants are necessary like biomass‐based cellulose, waste, and algae. Second generation plants will need assistance as theyplant sizes. Expansion of both first an2020 goals. Building biofuel plants is one of the most effective and fastest ways to reach the goals of the Biioenergy Action Plan and directly supports California’s jobs and economy.
A federal $1 per gallon incentive for biodiesel production began in 2002 and expired onDecember 31, 2009, but was resumed in December 2010. The federal subsidy expiration significantly reduced biodiesel production nationwiprogram has a gradual phase‐in, and will not significantly impact the market demand for biodiesel for another year. Accordingly, fuel producers will have little motivation to invest in ensuring these plants’ continued operation in the short‐term. The LCFS should provide a 10‐cent to 75‐cent per gallon market price premium for biofuels providing 40 percent to 90 percenGHG reduction in a $20‐$60/metric ton GHG market, respectively.
On November 12, 2009, U.S. DOE and the USDA announced $24 million in funding in BiomasResearch and Development grants to produce biofuels. Of these funds, $1.6 million was awarded to a California firm. The ARB does not fund infair quality management districts have not awarded funds in this area. The Energy Commissionawarded $2,845,744 for five diesel substitute projects using funds from the first investment plan. An additional $3.9 million solicitation is planned for FY 2010‐2011 funds.
For FY 2011‐2012 the Energy Command loan guarantees, to support new diesel substitute plants or plant expansions. Californ
282 Based on Board of Equalization data up to September 2010, staff assumed three months of 500,000
‐9.
gallons per month in subsequent months for a total of 5.398 million biodiesel gallons. 283 Comments submitted by the California Biodiesel Alliance, Energy Commission Docket Number 09ALT‐1, February 16, 200
111

needs to expand current production to at least 700 million gallons to reach 2020 Bioenergy ActionPlan goals and to support ARB LCFS objectives.
Fuel Terminal Storage and Blending For California to reach the 2050 GHG emission reduction goals and other near‐term goals, adiesel substitutes sources must have access to California’s market. Diesel substitutes use must,at a minimum, expand to half a billion gallons by 2015 and one billion gallons by
ll
2030.
percent of its transportation fuels from domestic
modifying existing bulk terminals to accept biofuels are critical to diesel
racks
typically experience
h the
(referred to as drop‐in fuels) are hampered by a lack of wholesale als
loaded for
uestionable for e facility operator. In addition, the independent jobbers who want to sell B5 of R5‐R20 to retail ormally do not own and operate distribution terminals, which means they have little control or
Maximizing in‐state and domestic supplies is the first priority but may not be sufficient to reachthe goals if unfavorable market conditions persist.
Consequently, the continued growth of diesel substitutes produced and used in California depends on establishing bulk storage and terminal blending facilities for distributing biofuels and feedstocks. California imports about 62and foreign sources, and this amount continues to grow for petroleum and biofuels alike. 284Biodiesel and renewable diesel will require bulk terminals to receive and store the large volumes of bio‐oils required to competitively produce diesel substitutes. ARB’s LCFS carbon intensity and sustainability requirements will ensure that future imported renewable fuels are sustainably grown and provide lower carbon intensity.
Nearly all bulk receiving terminals are located with access to marine ports, railroads, and pipelines sufficient to move the fuel volumes into the mainstream diesel market. Adding biofuelcapacity andsubstitute’s expanded future use.
Terminal blending racks are used to store bulk volumes of unblended fuels and dispense blended fuels for trucks to deliver to retail, fleets, and farm customers. California terminal are not modified to accept diesel substitute fuels. Diesel substitute terminal rack modifications can lead to a significant expansion of biofuel volumes due to the ease, lower‐cost and time to load the fuels compared to today’s method. In California, biodiesel fuels after‐plant transport costs of 15 cents to 50 cents per gallon, compared to 9 to 12 cents for gasoline and diesel fuel.285 These higher transportation costs should be eliminated witestablishment of appropriate rack terminal modifications to accept the biofuel.
Retail sales of low‐level B5 and R5–R20 diesel substitute blends through existing retail facilities that require no modificationsstorage and distribution diesel substitute facilities. Regionally located distribution terminwith diesel substitute storage tanks are needed so that B5 and R5‐R20 blends can be distribution to local retail diesel stations.
The relatively poor or marginal blending economics for diesel substitutes means that the payback for the investment in a storage tank at a distribution terminal can be qthn
84 Schremp, Gordon, Aniss Bahreinian, Malachi Weng‐Gutierrez. Transportation Energy Forecasts and Analyses for the 2009 Integrated Energy Policy Report, Draft Staff Report. California Energy Commission CEC‐600‐2009‐012‐SD.
2
285 Tellurium’s comments made at the Energy Commission workshop November 2009.
112

say on wheth ated funding from the Energy Commission an opportunity substantially the distribution and end use of low level blends in retail that are price sensitive.
Currently, financial in tu ture projects. Funds from sources such as t air q tricts have not been made available for diesel substitute infrastructure investments. Commission’s program funds alone rogram funds used as a grant or loan
sk
equire modifications to dispens ed projects, infrastructure modification costs are estimated to be $500,000 to $3.0 million per site. Making t retail prices of diesel su d increase diesel substitutes’ sales volumes.
Commission allocated $4 million for blending and storage ts as part of a broader solicitation for alternative and renewable fuel
sel Substitute Infrastructure Projects
Project Description Award
er or where a B99 or R100 storage tank is constructed. Strategically alloc can provide diesel substitute
to increase markets
stitutions are not funding diesel substihe federal government, ARB, or local
te infrastrucuality dis The Energy
are not sufficient. However, pguarantee may be able to leverage funds from other financial institutions to minimize the rifor companies to make improvements in advance of economic necessity.
California has more than 100 rack‐terminals and several plants, some of which may re diesel substitutes. Based on FY 2008‐2010 fund
hese modifications would reduce costs and bstitutes an
For FY 2008‐2010, the Energyterminal projecinfrastructure in November 2009. From this solicitation, about $3.86 million has been awarded as identified in Table 23. Additional funds from FY 2010‐2011 of roughly $3.1 million will also be available for blending and storage terminal projects in a future solicitation.
Table 23: FY 2008-2010 Funded Die
Port of Stockton biodiesel fuel terminal $1,999,379 Two biodiesel blending facilities $1,790,000 Bulk biomass dispenser adjacent to San Jose pipeline terminal $69,223
Total $3,858,602 Source: California Energy Commission
The Energy Commission is awaiting the results of the previous fiscal years’ projects before allocating additional funds to diesel substitutes infrastructure. The Energy Commission will also assess the relative need of renewable diesel for upstream fueling infrastructure.
Table 24: Diesel Substitutes Funding Allocation
Advanced Diesel Substitute Production Plants $7.5 Million
Total $7.5 Million
Source: California Energy Commission
113

Biomethane Biomethane, or renewable natural gas, is most commonly sourced from the anaerobic digestion
• Blended or enhanced with hydrogen, further extending its GHG benefits.
l
erated from a variety of biomass sources. However, the Energy the
astewater treatment waste.
MSW one of the largest waste streams available in California and is a prime feedstock for
or gasification of organic matter. These processes result in a biogas, which can then be cleanedup to biomethane with the removal of impurities such as CO2, hydrogen, sulfide, and water. Biomethane can be used as an energy source for a variety of purposes, including:
• Direct use as a fuel and heat source for boilers or industrial heat.
• Injection into utility‐operated natural gas pipeline systems for use by residential, commercial, and industrial customers.
• Powering natural gas electricity generating stations.
• Feedstock in hydrogen production.
• Refined into gasoline and diesel via gas‐to‐liquid technologies.
• Compressed into CNG or liquefied into LNG for use in transportation applications.
In the transportation sector, biomethane is a highly desirable alternative to fossil fuels as it has low carbon intensity values as determined by ARB on a well‐to‐wheels basis. Compared to traditional fuels such as gasoline, diesel, and fossil‐based natural gas, biomethane can reduce emissions by up to as much as 87 percent.286 These reductions can be even higher if additionatechnologies, such as a carbon sequestration process, are used. As determined by the LCFS, biomethane is the lowest carbon intensity alternative fuel readily available in California.
Biomethane can be genCommission favors the use of waste stream feedstocks for the transportation sector due tohigh emission reduction potential and other environmental and health benefits realized on a wells‐to‐wheels basis with these feedstocks. California’s waste streams have a gross production potential of 124 BCF per year and a technical potential of 23 BCF per year, equivalent to 174 million DGE287, representing about 7 percent of the state’s on‐road diesel fuel usage. Some of the most likely feedstock sources include diverted organic material from post‐recycled municipal solid waste streams, animal manure, woody biomass from forest fuels management activities, agricultural residues, food waste, and w
conversion to biomethane as it will not only be using a waste product for energy production, but will also be diverting waste from entering landfills, thus extending the life of landfills.
286 Detailed California‐Modified GREET Pathway for Compressed Natural Gas (CNG) from Landfill
k for the Production and Use of Renewable Natural limited to
ling. 800 million DGE.
Gas, February 2009. Detailed California‐Modified GREET Pathway for Ultra Low Sulfur Diesel (ULSD)from Average Crude Refined in California, February 2009. 87 percent reduction based on landfill gas toCNG pathway compared to diesel baseline. 287 Ken Krich, Biomethane from Dairy Waste: A SourcebooGas in California. Technical potential is based on physical system constraints including but not agronomic and ecological requirements, terrain limitation, and inefficiencies in collection and handDGE calculated based on technical potential using conversion of 106 BCF =
114

Approximately 39 million tons of MSW are landfilled annually, and about 22 percent of that issuitable for anaerobic digestion. Two of CalRecycle’s Strategic Directives further support the diversion of organic matter from the landfills, requiring 50 percent reduction of organics in the waste stream by 2020 and encouraging the development of alternative energy and biofuels.
ith
ck source is that an
s out
gas, s are
million DGE.
As more biomethane projec ere is access to natural gas pipelines. When connecting to the natural gas pipelines interconnection can be a financial
rtification are expensive processe y over who should pay for them, such as biogas developers, natural gas s third parties. For
such as agricultural residues and food waste to be able to enter the natural gas pipeline, extensive gas quality testing must be performed. This testing can be very costly.291 Without access to the natural gas pipeline, a number of producers will have to determine other methods for moving their product into the market.
For the biomethane for transportation industry to develop successfully, California will have to ensure supportive government policies and additional financial incentives. Because this is a relatively new industry, additional financial incentives are needed to help offset high capital costs. In light of the $33 million already allocated to biomethane projects, funding is still a substantial need. Consequently the Energy Commission is allocating $8 million for FY 2011‐2012 to help further establish the biomethane for transportation industry. The allocation will
288 MSW is composed of 57 percent biomass, which can be separated using various methods, wthe remainder being plastics, textiles, and non‐organics.289 When diverted from landfills, the organic fraction of MSW has 10 times greater energy production potential on a per‐ton basis compared to landfilled waste.290 Another benefit to MSW as a feedstoestablished collection system is already in place, and the waste is already transported to centralized locations.
Although production potential for biomethane is significant, currently there are a limited number of biomethane or biogas projects operational in California. To date, the program hafunded nine biomethane projects with more than $33 million. These projects, spread throughthe state, are in various phases ranging from feasibility to commercialization and use a varietyof feedstocks including waste water treatment sludge, food waste, animal manures, landfillwoody biomass residues, and post‐sorted MSW. Once fully commercialized, these projectexpected to displace more than 6.5
ts come on‐line, it will be important that th
burden. Gas quality testing and ce s with no certaintutilitie , or other
biomethane from new feedstocks
288 CalRecycle’s “Strategic Directive 6.1” identifies a reduction of the amount of organics in the waste stream by 50 percent by 2020, and “Strategic Directive 9.2” encourages the development of alternative energy and biofuels. More information is available at: http://www.calrecycle.ca.gov/AboutUs/StrategicPlan/. 289 Rob Williams, Biofuels from Municipal Wastes Background Discussion Paper, March 28, 2007. 290 One ton of organic waste landfilled has a 65kW potential while one ton of MSW has a 550 kW potential. Energy Commission meeting with CalRecycle, October 28, 2010. 291 E‐mail to Energy Commission staff from Ken Brennan, November 18, 2009. Initial research for new biomass feedstocks will cost between $340,000 and $500,000 as a one‐time expense, and then each project will require ongoing gas sampling, which is estimated at $20,000 per month. These numbers are subject to increase with more complex feedstocks.
115

focus on projects that use a variety of prelandfilled waste materials as a feedstock and will provide financial assistance to projects that require gas quality testing on new feedstocks entering the natural gas pipeline.
Table 25: Biomethane Funding Allocation
Biomethane Production and Support $8 Million Total $8 Million
Source: California Energy Commission
116

Medium- and Heavy-Duty Vehicles Medium‐ and heavy‐duty v vehicle weight rating (GVWR) ,000 signi onent oftransportation v ab e consumption and 16 percent of GH ons within rtation low summarizes the number of vehicles and petroleum demand in each GVWR class.
Med ty leum Use
sification Vehicles Petroleum (Gallons/Year)
Average Petroleum Use per V cle (Gallons/Year)
ehicles, consisting of vehicles with a gross of more than 10
sector. These pounds, represent aehicles account for
G emissi
ficant compout 16 percent of th
the transpo
California’s state’s petroleum sector. Table 26 be
Table 26: ium- and Heavy-Du Vehicles and Petro
Truck Clas Use ehi
GVWR 3 TRUCK 283,939 341,673,885 1,203
GVWR 4 TRUCK 154,235 230,804,674 1,496
GVWR 5 TRUCK 65,034 123,506,209 1,899
GVWR 6 TRUCK 182,872 410,903,496 2,247
GVWR 7 TRUCK 83,210 496,086,082 5,962
GVWR 8 TRUCK 147,186 986,248,158 6,701
Total 916,476 2,767,053,537
Source: California Energy Commission, DMV
As shown, each of these vehicles uses a significant amount of petroleum fuel, particularly whencompared to a light‐duty vehicle.
For comparison, a light‐duty truck that averages 20 MPG and
er year, while a passenger sedan that averages 30 MPG 12,000 miles per year uses 600 gallons pand 12,000 miles per year uses 400 gallons per year. On a per‐vehicle basis, then, medium‐ and heavy‐duty vehicles represent an excellent opportunity to expand alternative fuel use, reduce petroleum consumption, and lower GHG emissions, as outlined in Table 27.
117

Table 27: Petroleum and GHG Reductions
pe remAltern
Vehicle
trouction (Gallons per Ye
Re tons C )292
Vehicle Ty Incan
ental Cost of ative Fuel
PeRed
leum
ar)
GHG Emission duction (metric
O2e/year
GVWR 8 Diesel Truck $40,000 (for CNG) 6,70
(based on historic averag
12.0 1
e)
Light-duty Sedan 0 miles $10,000 (fo 400 (30 MPG; 12,00
per year) r BEV) 3.2
Source: California Energy C n staff estim ysis for 2009
Medium‐ and heavy‐du les serve purpose lifornia’s e s ivery to long‐haul goods movement. This means
e
lacement, is shown in Table 28. These numbers will further increase as a result of the Energy Commission’s funding of two natural gas deployment projects (discussed below).
ommissio ates; Total Fuel Use Anal
ty vehic a variety of s in Ca conomy, fromtudent and public transportation to urban delthat any attempt to encourage petroleum and GHG emission reductions must consider the unique applications of a particular vehicle. Using registration data from the Department of Motor Vehicles, the Energy Commission tracks the populations of nearly 40 medium‐ and heavy‐duty vehicle vocations. Using this data, as well as fuel sales data from the Board of Equalization, the Energy Commission can estimate the annual petroleum demand for various vocations. This historical fuel use information, when combined with interviews from fleet managers, alternative fuel vehicle suppliers, and infrastructure providers, begins to form a foundation for the Energy Commission to identify and implement approaches for reducing petroleum and GHG emissions.
Natural Gas and Propane Vehicles Natural gas and propane are again becoming popular alternative fuels for medium‐ and heavy‐duty vehicles in California. In particular, the number of NGVs increased from fewer than 2,000 vehicles in 2000 to more than 12,500 vehicles in 2009; an increase of 10,500 vehicles over ninyears. The number of CNG and propane vehicles as of 2009, as well as their estimated petroleum disp
Anticipated vehicle buydown incentives for natural gas and propane, also funded by the Energy Commission, will further drive this market by providing incentives for the purchase ofan estimated 715 medium‐ and heavy‐duty gaseous fuel vehicles. 293
292 Assumes heavy‐duty natural gas vehicles have a 15 percent G72 percent GHG benefit per the Energy Commission Full Fuel Cyc
HG benefit, and light‐duty BEVs have le Assessment: Wells‐to‐Wheels Energy
Inputs, Emissions, and Water Impacts Analysis, Consultant Report, August 1, 2007. 293 Energy Commission staff analysis, January 2011.
118

Table 28: Propane and NGVs and Petroleum Displacement
Truck Classification
CNG Propane
Vehicles Petroleum Displaced
(Gallons/Year) Vehicles Petroleum Displaced
(Gallons/Year)
GVWR 3 TRUCK 316 404,542 196 313,648
GVWR 4 TRUCK 567 896,664 232 458,611
GVWR 5 TRUCK 89 151,436 64 136,122
GVWR 6 TRUCK 7,617 35,925,646 1,142 3,366,408
GVWR 7 TRUCK 267 1,121,571 325 1,706,510
GVWR 8 TRUCK 2,436 11,489,415 39 229,930
Total 11,292 49,989,274 1,998 6,211,229
Source: Department of Motor Vehicles, Board of Equalization
and l
lower annual fuel demand. Sales of the Bluebird school bus continue to
and
el e
While these vehicle numbers are low compared to the overall market, they may not wholly reflect the direction of the transportation industry in recent or future years. Recent conversations with manufacturers of medium‐ and heavy‐duty vehicles and engines have shown a renewed interest in both natural gas and propane. Major vehicle manufacturers are orwill be offering natural gas and propane options in their class 1 through 8 (<6,000 through >60,000 GVW) vehicles. While product offerings are small, they are finding acceptance in manyniche markets such as refuse haulers, drayage trucks, and transit buses. United States corporations and fleets see alternative fuels as a way to reduce GHG emissions and encourage wider use and production of efficient vehicles and domestic petroleum alternatives.
School bus and other transit bus vehicles represent a significant opportunity for natural gas propane, and school districts have already shown an interest in these fuels. In particular, schoobuses may be more cost‐effectively served with propane’s lower incremental cost given schoolbuses significantlyincrease, and school districts across California are expressing increased interest in propane school buses.
Since the 1990s, transit buses within the South Coast Air Basin have favored the use of natural gas to meet air quality standards, and, statewide, all transit buses receive significant Federal Transit Agency support to cover a high percentage of the upfront vehicle cost. Public transit also encourages reduction of vehicle miles traveled, which in turn reduces GHG emissions petroleum use. Today, transit bus purchases represent nearly 600 vehicles per year, which is roughly half of all heavy‐duty NGV sales. Given existing funding commitments, alternative furequirements for transit vehicles, and comparatively low petroleum demand by buses, thEnergy Commission does not intend to supplement existing funding for transit vehicles. However, the Energy Commission plans to support workforce development and training for transit to ensure that well‐trained service and maintenance employees are available to support the deployment of these vehicles and keep them in service.
119

While light‐duty passenger vehicles can be retrofitted to use propane, retrofits and upfits aremore common for medium‐duty vehicles used in fleets. Propane is viewed as an econoupfit option for delivery trucks, shuttle buses, and school buses. Propane vehicles are an especially viable option for more rural communities looking to use an alternative fuel for theirvehicles or for an entire fleet because of its availability. The incremental cost for medium‐dutyand heavy‐duty propane vehicle upfits depends on the application for which the system is being used. Systems in the $7,500 price range are typically for applications that include lightetrucks, while the incremental costs for shuttle and school buses are around $20,000. Companies and government fleets have already begun to express interest in and place orders for various medium‐ and heavy‐duty propane
mical
r
vehicles, including: Time Warner, Primetime, Supershuttle, ez.
and
gap where there is not a natural gas engine option available.
s .
el
ks. ,708 s.
nds from the second investment plan, the Energy Commission is also preparing to
d the
use vehicles powered by non‐petroleum, lower‐carbon, alternative d
5
Santa Monica, Riverside, and Marqu
To support the development and deployment of advanced medium‐ and heavy‐duty NGVs infrastructure, the Energy Commission has already committed funding for the following projects using funding from the first investment plan:
• Gas Technology Institute (GTI) and Cummins Westport was awarded $1,777,364 todevelop an advanced ISX11.9 G natural gas engines which will be a low‐emission, highefficiency engine designed for the Class 8 market. Swift Transportation will demonstrateone engine in a highway tractor for 12 months to accumulate about 2,000 miles per month while hauling loads up to 80,000 pounds gross vehicle weight. This engine will fill an important market
• SCAQMD was awarded $5,142,000 to offset the incremental cost of 120 commercially available new 2009 or 2010 model Class 8 Freightliner M2‐112, Peterbilt, Kenworth, or other liquefied natural gas (LNG) drayage trucks. SCAQMD is partnering with the Portof Long Beach and Los Angeles, which together are America’s largest port complexThese ports together are the single largest fixed source of air pollution in the South Coast Air Basin. Each LNG drayage truck displaces about 10,000 gallons of diesel fueach year.
• The San Bernardino Association of Governments (SANBAG) was awarded $9,308,000 to purchase and deploy 202 heavy‐duty natural gas trucks. SANBAG has partnered on this project with Ryder Truck Transport Services, Inc., to purchase and deploy these trucThe U.S. DOE’s American Recovery and Reinvestment Act funds will provide $9,950for the construction of two liquefied natural gas refueling stations and truck purchase
With furelease a program opportunity notice for buydown incentives for specific classes of natural gasand propane fueled vehicles. Incentives will be provided at varying levels depending on the class of vehicle. The incentives will reduce the high initial capital cost of natural gas anpropane vehicles to assist public and private fleets and individual consumers in makingdecision to purchase and and renewable fuels. The funding available for this solicitation is $14.04 million and is estimateto cover incentives for about 1,800 natural gas and propane vehicles, with an estimated 71being medium‐duty or heavy‐duty vehicles.
120

Based on historical vehicle and fuel data available to the Energy Commission, as well as thcurrent market descriptions provided by vehicle suppliers an
e d customers, the Energy
and
s
nt,
technologies
hybrids use a hydraulic pump and motor to capture
• Coca Cola Enterprise, Inc., was awarded $750,000 to design, develop, and deploy four hydraulic hybrid Class 6 Coca Cola delivery trucks. These trucks may provide 40
Cola ts in
Commission is well‐positioned to identify effective opportunities for promoting petroleumGHG emission reductions in medium‐ and heavy‐duty vehicles. Toward this end, the EnergyCommission will allocate $14.5 million in FY 2011‐2012 for further purchase incentives to support the deployment of new, medium‐duty or heavy‐duty gaseous fuel vehicles: $3 million for propane vehicles and $11.5 million for NGVs. This funding will be available for both on‐road and off‐road vehicles. Using the same ratio from the previously discussed incentives, this level of funding should leverage roughly 375 to 750 additional medium‐duty and heavy‐duty natural gas and propane vehicles.
Advanced Vehicle Technologies In addition to gaseous alternative fuels, several medium‐ and heavy‐duty vehicle suppliers have begun incorporating a variety of advanced vehicle technologies and other alternative fuelinto their offerings, ranging from natural gas hybrid‐electric vehicles to hydrogen fuel cell buses. In each case the qualities of the alternative fuel or advanced technology are being carefully matched to the duty cycles of the customer’s vehicle. For this reason, the use of alternative fuels or advanced technology may be limited to certain niche market applications where the payback period is most attractive. As the technologies evolve and if associated costs fall, the opportunity for broader deployment of these technologies will arrive, allowing them toexpand into new applications.
The Energy Commission, through the PIER Program, funded the CalStart Hybrid, EfficieAdvanced Technologies (CalHEAT) project for $3 million, establishing a center for research,development, demonstration, and commercialization of advanced, efficient truckand systems. Through this project, a roadmap will be developed, with industry input, to commercialize advanced technologies for medium‐ and heavy‐duty vehicles by 2020. The project also includes vehicle demonstrations for parcel delivery trucks and Class 8 trucks.
Hybrid‐electric and hydraulic technologies on medium and heavy duty vehicles can potentially reduce GHG emissions 60 percent on a full fuel‐cycle basis compared to conventional diesel vehicles. Hybrid electric trucks use the engine to recharge the batteries, which assists the engineand auxiliary functions. Hydraulic‐regenerative braking and offer a power boost to the engine and auxiliary functions. Refuse trucks, drayage trucks, package delivery vans, utility trucks, transit and school buses, and harbor craft are the most practical applications for this technology, due to their unique duty cycles.
The Energy Commission has funded a number of hydraulic‐hybrid demonstration projects to advance the state of the technology and match fleets and key niche markets with the appropriate vehicles. Examples of program awards made for hydraulic hybrid vehicle demonstrations include:
percent better fuel economy over the conventional delivery trucks. CocaEnterprises has the largest fleet of hybrid trucks currently deployed with 335 uni
121

fleet operations as of January 1, 2010. Coca Cola Enterprise and the SCAQMD are providing matching funding totaling $1.25 million.
fuel d e
ARB has
e ARB’s AQIP Funding Plan for FY
Los
gine t and t bus to 40
345,552 to integrate Motiv’s customizable electric‐ viability
a of the
n
out of Motiv’s electric‐drive vehicle platform, which can be configured with different
• Kenworth Truck Company and its partners were awarded $1,458,735 and will demonstrate one truck with an advanced Class 8 hybrid electric system and an intercooled recuperated 350 kW microturbine. The ICR microturbine will be run onnatural gas for this demonstration due to its low GHG potential, low cost, and available distribution infrastructure. However, the microturbine will be capable of using any including ethanol, LNG, hydrogen, and biodiesel. The system will initially be designefor Class 8 but can be readily scaled to fit all Class 6, 7, and 8 vehicles over a wide rangof operation.
Additionally, the ARB funds the Hybrid Voucher Incentive Program (HVIP), which providesvouchers up to $40,000 for the purchase of eligible new hybrid trucks and buses. Theselected CALSTART to administer the HVIP; however, the ARB maintains responsibility for designing and guiding the program. Unlike the Energy Commission’s advanced vehicle technology demonstration projects, the HVIP provides incremental funding for vehicle deployment. Funding is provided on a first‐come basis. Th2010‐11 allocated $19 million for this program; the funding level for FY 2011‐2012 is still under development but is still expected to remain a large AQIP investment. 294 Due to higher costs associated with purely electric medium‐ and heavy‐duty vehicles, the Energy Commission has supplemented the HVIP with $2 million to provide a higher incentive for these vehicles.
Battery‐electric and battery‐electric hybrid vehicles have also shown promise for certain applications. The following projects were funded under the same solicitation:
• ISE was awarded $888,595 to produce a battery‐electric 45‐foot transit bus for theAngeles Metropolitan Transportation Authority (LAMTA) Battery Electric Bus Program. ISE will install its electric drive system and lithium ion batteries in place of the enand fuel storage tank. This is the first battery‐based technology to meet the “40 feegreater” transit bus requirements. This size class represents two‐thirds of the transimarket. If this demonstration is successful, the LAMTA is expected to purchase 30 buses per year on average.
• Motiv Power Systems, Inc. (Motiv), Bauer Worldwide Transportation, Inc. (Bauer), and Seeo, Inc. (Seeo) were awarded $1,drive Power Control System into a prototype Class 4 vehicle to demonstrate theand benefits of the system’s 100‐mile all‐electric range. Motiv will install its system onnew shuttle bus chassis as a test platform to illustrate the large‐scale applicabilitytechnology. This shuttle will operate along routes at campuses of Bauer’s client companies, including Google, Cisco, Facebook, and Yahoo. Upon successful completioof the proposed project, Bauer will employ the vehicle technology in a large‐scale roll‐
294 ARB, “AB 118: Air Quality Improvement Program (AQIP),” January 11, 2011, http://www.arb.ca.gov/msprog/aqip/meetings/fy%202010‐11/fp11_12_presentation_011111.pdf.
122

battery packs and with or without generators on board to meet the specific needs of medium‐ and heavy‐duty vehicle fleets.
• Terex, in collaboration with PG&E and CalStart, was awarded $494,678 to demonstrate the economic and environmental viability of its innovative new Hypower Hybrid system retrofitting 12 medium‐ and heavy‐duty PG&E utility service vehicles. The Hypower Hybrid uses stored energy from the systemʹs rechargeable batteries to provide
site
otypes for onsite testing with partners.
on the method of hydrogen production.295 ,296 Fuel cell transit buses also conventional diesel er and air toxics associated
S develop fuel cell bus (FC stration programs in the Bay Area and in Southern California. The HyRoad Program, led by AC Transit in O il 2011 ( have been delivered). the ARB cofunded two FCBs with SunLine Transit in Twentynine Palms. Proterra, a Colorado‐based vehicle manufacturer, has u y‐assisted
One such bus is located at the Burbank city yard in Southern alifornia but it has not entered regular transit service due to the lack of sufficient fuel supply t the Burbank hydrogen fueling station.
Hydrogen fuel cell technology is not strictly limited to bus applications. Vision Motor Corporation of Santa Monica is developing hydrogen fuel cell hybrid heavy‐duty drayage trucks for goods movement in and around ports. Additional testing, validation, and demonstration are needed to prepare the technology for commercial demonstration or deployment. To test the technology for its potential for commercialization, Vision will be putting two trucks to work at the ports of Los Angeles in early 2011 for an 18‐month project.
power for aerial boom operation, cabin heating and air conditioning, and worklighting. This will virtually eliminate the need for chassis engine idling during these types of operation, which typically exceed more than 4 hours per day for the average utility service vehicle.
• Electric Vehicles International (EVI) was awarded $1,153,053 to design, develop, and deploy a range‐extended electric vehicle powertrain for medium‐duty truck applications. EVI will build 10 range‐extended LNG medium‐duty pickup trucks, whichwill use Valence Technology lithium‐phosphate batteries for a 100‐115 mile range. EVI will integrate the new powertrain into an industry standard pickup truck and will deploy prot
Opportunities for hydrogen and fuel cell use in medium‐ and heavy‐duty applications are also on the horizon. California has pursued development and deployment of alternative‐fueled and hydrogen fuel cell transit buses through regulations and incentives for more than 10 years. Hydrogen fuel cell buses can reduce GHG emissions from 26 percent to 86 percent compared to conventional diesel buses, depending
almost double the fuel mileage (on a DGE basis compared to a transit bus) and reduce particulate matt with diesel.
ince 2004, the ARB has directed its staff to B) demon
akland/Emeryville, will roll out 12 hydrogen FCBs by Apr In addition,
five buses
prod ced a batterhydrogen hybrid transit bus. Ca
295 California Air Resources Board, Detailed California Modified GREET Pathway for Compressed Gaseous Hydrogen from North American Natural Gas Version 2.1. http://www.arb.ca.gov/fuels/lcfs/lcfs.htm. 296 Full Fuel Cycle Assessment: Well‐to‐Wheels Energy Inputs, Emissions, and Water Impacts. Consultant Report. 2007. California Energy Commission, CEC‐600‐2007‐004‐REV.
123

One “terminal tractor” will be an in‐port goods‐mover and the other one a big‐rig vehicle for moving cargo from the port to short‐haul destinations. Both will operate under real‐life scenarioconditions. Funding for this battery‐dominated hydrogen fuel cell truck commercialization project comes from the ports authorities (as well as some U.S. EPA funding from the 2010 Clean Air Technologies Award) under the ports’ Technology Advancement Program and is being supported by local trucking companies.297
A federal tax credit of $10,000 to $40,000 is available for heavy‐duty fuel cell vehicles, depending on the vehicle weight. The credit may be claimed for vehicles placed in service after December 31, 2005, and purchased on or before December 31, 2014. The SCAQMD aas an important funding partner, reserving about 13 percent of its $16.6 million in Clean FuelsProgram fundin
lso serves
g for hydrogen and fuel cells. This is mostly intended for research and
ts of the AQIP to potentially fund and support hydrogen FCBs in future
ologies for the medium‐ and heavy‐duty s, ents
development in transit and heavy‐duty applications, with the goal of improving air quality. Cofunding demonstration and test fleet projects through the AQMDs is already in progress as explained in the ZEB section above. Additionally, ARB is reviewing, monitoring and reassessing componenfunding plans.
To build on these opportunities, the Energy Commission intends to offer $7 million for the further development and demonstration of new technvehicle sector. This funding will extend to a broad variety of advanced technology projectincluding hybrid hydraulics, battery electric, and fuel cells, but will also consider improvemto gaseous fuel engines and systems.
Table 29: Medium- and Heavy-Duty Vehicles Funding Allocation
Deployment Incentives for Natural Gas Vehicles $11.5 Million
Deployment Incentives for Propane Vehicles $3 Million
Develop and Demonstrate Advanced Technology Medium- and Heavy-Duty Vehicles
$7 Million
Total $22 Million
Source: California Energy Commission
297 Fuel Cell Industry Report, “Vision Motors Testing Fuel Cell Trucks,” Volume 12, No. 2, February 2011.
124
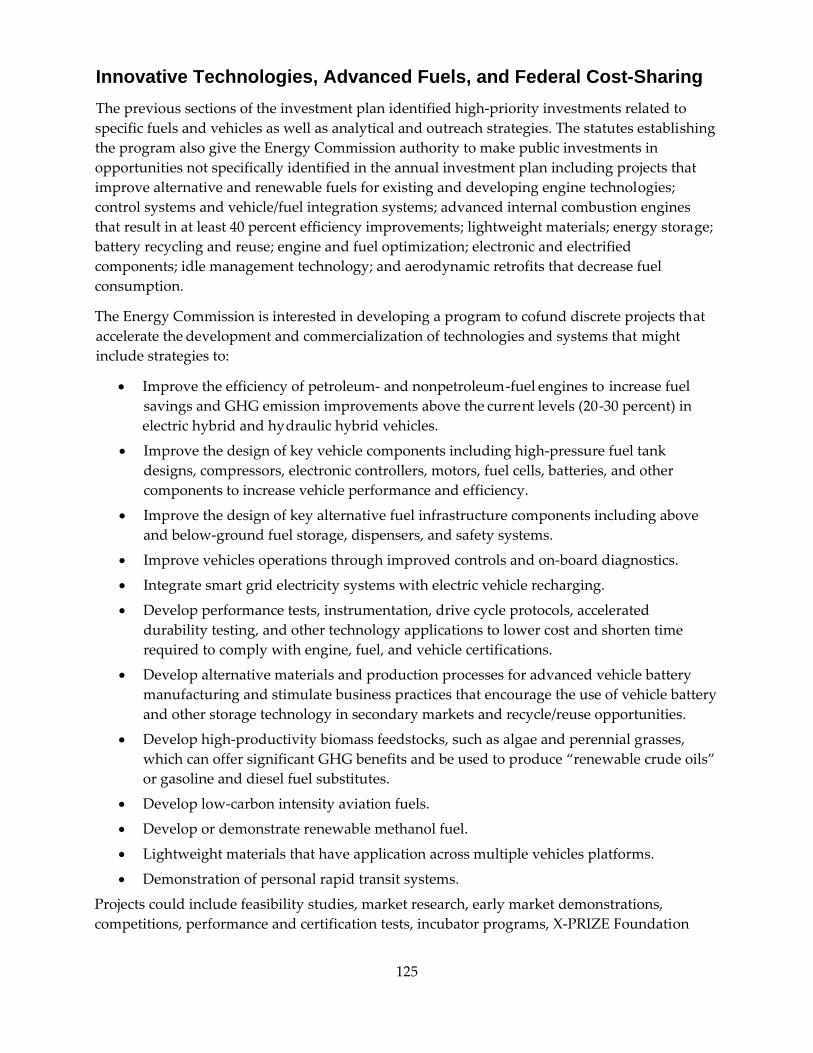
Innovative Technologies, Advanced Fuels, and Federal Cost-Sharing The previous sections of the investment plan identified high‐priority investments related to
shing
ogies;
ge;
at accelerate the might include strategies to:
‐fuel increase fuel savings and GHG emission improvements above the n ‐30 percent) in
draulic hybrid vehicles.
• Improve the design of key vehicle components including high‐pressure fuel tank designs, compressors, electronic controllers, motors, fuel cells, batteries, and other components to increase vehicle performance and efficiency.
• Improve the design of key alternative fuel infrastructure components including above and below‐ground fuel storage, dispensers, and safety systems.
• Improve vehicles operations through improved controls and on‐board diagnostics.
• Integrate smart grid electricity systems with electric vehicle recharging.
• Develop performance tests, instrumentation, drive cycle protocols, accelerated durability testing, and other technology applications to lower cost and shorten time required to comply with engine, fuel, and vehicle certifications.
• Develop alternative materials and production processes for advanced vehicle battery manufacturing and stimulate business practices that encourage the use of vehicle battery and other storage technology in secondary markets and recycle/reuse opportunities.
• Develop high‐productivity biomass feedstocks, such as algae and perennial grasses, which can offer significant GHG benefits and be used to produce “renewable crude oils” or gasoline and diesel fuel substitutes.
• Develop low‐carbon intensity aviation fuels.
• Develop or demonstrate renewable methanol fuel.
• Lightweight materials that have application across multiple vehicles platforms.
• Demonstration of personal rapid transit systems.
on
specific fuels and vehicles as well as analytical and outreach strategies. The statutes establithe program also give the Energy Commission authority to make public investments in opportunities not specifically identified in the annual investment plan including projects that improve alternative and renewable fuels for existing and developing engine technolcontrol systems and vehicle/fuel integration systems; advanced internal combustion engines that result in at least 40 percent efficiency improvements; lightweight materials; energy storabattery recycling and reuse; engine and fuel optimization; electronic and electrified components; idle management technology; and aerodynamic retrofits that decrease fuel consumption.
The Energy Commission is interested in developing a program to cofund discrete projects th development and commercialization of technologies and systems that
• Improve the efficiency of petroleum‐ and nonpetroleum engines tocurre t levels (20
electric hybrid and hy
Projects could include feasibility studies, market research, early market demonstrations, competitions, performance and certification tests, incubator programs, X‐PRIZE Foundati
125

and other similar awof financial investors, or a
Additionally, the federal go
ards,298 research consortiums such as “Centers of Excellence,” recruitment combination of such activities.
vernment is increasingly providing funding opportunities for
possibility m akin to the Energy Innovations Small Grants administered by the
te $3
innovative low‐carbon fuels and vehicle technology research, development, and deployment through agencies such as U.S. DOE, U.S. EPA, U.S. DOT, and the USDA. California’s ability to capture these funds will rely significantly on the ability of the state to partner with organizations and institutions to develop and cost‐share proposals to the federal agencies.299
The Energy Commission allocated a combined $8 million for these activities in the previous fiscal year. This funding will provide support for a variety of projects, including the of a “small grants” prograEnergy Commission’s PIER Program. For FY 2011‐2012, the Energy Commission will allocamillion for innovative technologies, advanced fuels, and federal cost‐sharing opportunities.
Table 30: Innovative Fuels, Advanced Fuels, and Federal Cost-Sharing
Innovative Fuels, Advanced Fuels, and Federal Cost-Sharing $3 Million
Total $3 Million
Source: California Energy Commission
298 The X PRIZE Foundation is an educational nonprofit organization that promotes public competitionto encourage accelerated technological development. 299 The Energy Commi
s
ssion will also consider funding for highly leveraged proposals with local governments.
126

Chapter 4: Manufacturing Encouraging manufacturers of PEVs and their components to locate or expand their operations
to the
t s in raising upfront capital can impede these manufacturers from
ts
stments have
loans to help
nt in
in California has the potential to create thousands of green jobs and substantial benefitsstate’s economy. For example, at its peak production before it closed in early 2010, the New United Motor Manufacturing, Inc., plant in Fremont, California, employed 4,500 high‐skilledlaborers and up to 35,000 supply chain workers in a joint venture between GM and Toyota. California‐based Tesla Motors, Inc., bought the Fremont plant to expand its in‐state manufacturing capacity.
Several California manufacturers produce batteries and component parts for automakers, components for the electronics industry, electric vehicle charging stations, and stationary powerstorage systems for military and industrial customers. In addition, several startup vehicle manufacturers have emerged in California and begun developing prototype and early markePEVs. However, difficultiedeveloping and expanding the plants and assembly lines to make advanced PEV componenand produce electric and alternative fuel vehicles for commercial sales.300
Large vehicle manufacturers have made many capital‐intensive investments in alternative fuel vehicle and component production capacity in recent years. These corporate invebeen bolstered by large‐scale financial support from the federal government in the form of grants, loans, and loan guarantees. Under the DOE’s Advanced Technology Vehicle Manufacturing program, $8.5 billion was loaned to companies such as Fisker Automotive, Ford Motor Company, Nissan, and Tesla Motors.301
s manufacturers in California,Mo t however, do not have the funds required to invest tens or hundreds of millions in facility improvements, or the size to attract federal support. They relyn ombination of venture capital, commercial credit, and state ao a c nd local incentives to fuel
their growth. The availability of state and local incentives, therefore, can play a large role in determining where companies locate their manufacturing facilities. By offering Program funds
port of manufacturing, the Energy Commin sup ission can ensure California attracts and retainsvibrant, job‐producing, and sustainable manufacturing facilities.
Using FY 2008‐2010 program funding, the Energy Commission awarded $19 million for a combination of grants for predevelopment stages of manufacturing plants andfinance assembly and production plants that make vehicles, batteries, electric propulsion systems, and other components in California. This solicitation encouraged investmeCalifornia‐based manufacturing and assembly plants that produce alternative fuel vehicles and
300 Although the U.S. DOE awarded nearly $1.7 billion nationwide for vehicle and battery manufacturing incentives, no California firm was selected for federal ARRA economic stimulus funding. However, the ARRA funds that were awarded nationwide will still have a large impact on the nation’s
sultant report, Analysis of Alternative Fuel and Vehicle Investments.
ability to manufacture electric vehicles and components and will in turn affect California’s market for electric drive vehicles. 301 ICF Report, draft con
127

components that help the state meet its GHG emissions and petroleum fuel demand redtargets. In addition to awarding grants and loans, the Energy Commission will support California manufacturing by collaborating with the California Alternative Energy and Advanced Transportation Financing Authority to establish loan mechanisms and facilitate sales tax exemptions for the purchase of equipment to manufacture ZEVs.
The Energy Commission reviewed a number of worthy responses to
uction
PON‐09‐605, Manufacturing Plants, wh ent and expansion of manufacturing and assembly plants in California that produce electric vehicles, alternative fuel
t parts for electric and alternat hicles.302 Below is a list of the successful applicants and a brief description of th o jects:
• Boulder Electric Vehicles will produce MD/HD electric vehicles from its 20,000 square foot manufacturing facility in Los Angeles.
• Coulomb Technologies will design and manufacture its Charge Point Communications Processor, which allows existing electric vehicle chargers to be retrofitted with smart grid connectivity.
• Electric Vehicles International will develop, test, and improve an automated, pilot, electric vehicle production process that realizes cost savings by bringing many parts of a diverse supply chain under one roof.
• Green Vehicles will install a 2,000 vehicle per year assembly line in its Salinas facility to manufacture a three‐wheeled highway capable electric vehicle, the Triac.
• Leyden Energy will develop and test a new lithium‐ion battery technology and build a pilot production line that is capable of assembling electric vehicle battery packs.
• Mission Motor Company will develop its battery module and motor control systems and install a manufacturing line capable of producing 30,000 battery packs and control systems per year by 2015.
• Quallion is developing a pilot‐scale automated production line that will allow for the large‐scale manufacturing of lithium‐ion battery modules.
• Quantum Fuel Systems Technologies Worldwide, Inc., will retool one of its Lake Forest, California facilities in order to develop, test, and produce a combination inverter/charger for hybrid‐electric vehicle applications.
• Transpower is studying the feasibility of constructing a manufacturing facility for Class 8 electric trucks in California by 2013.
• Wrightspeed will validate a new electric drive retrofit kit for Class 3 through Class 6 trucks, which includes a range‐extending micro‐turbine generator.
• Zero Motorcycles will design and bring to pilot production a new advanced electric motor and integrated controller for use in next‐generation electric vehicles.
Through PON‐09‐605, the Energy Commission has made substantial investments in California alternative fuel vehicle and component manufacturers. These investments support manufacturers as they develop products and install pilot‐scale assembly lines in preparation for
ich was designed to cost‐share the developm
vehicles, and batteries and componen ive fuel veeir pr posed pro
302 As part of its earlier ARRA cost‐sharing solicitation, the Energy Commission is also providing $1 million toward a project to develop advanced anodes and cathodes that will increase the energy density of lithium‐ion batteries.
128

full commercial‐scalproduction orders, and will soon need greater manufacturing capacity.ensure that these commercial‐scale manufacturing plants are locate
e production. Successful projects will attract customers and receive State support can help
d in California with their attendant jobs, environmental benefits, and tax revenue. Therefore, in FY 2011‐2012, the Energy Commission will allocate $8 million to fund projects that establish commercial‐scale alternative fuel vehicle and component manufacturing facilities in California.
Table 31: Manufacturing Funding Allocation
Manufacturing Facilities and Equipment $8 Million
Total $8 Million Source: California Energy Commission
129

Chapter 5: Workforce Training and Development Workforce development and training are critical in the Energy Commission’s efforts to develop California’s clean transportation market. Training is required to respond to new technologimprove efficiencies, minimize wastage, and reduce pro
y, duction costs. Skilled workers are
sions vehicles and components, produce alternative fuels, maintain fleets and equipment, and inform ongoing
establish interagency agreements with
as a
the
This funding structure has required a concerted effort by Energy Commission staff and partners, to identify those elements within each training project that best suit the mission and goals of each funding source. Partner agencies provide traditional workforce training services as well as basic fuel and vehicle training, and program funds are used to support advanced training in alternative fuels and vehicle technologies. While this approach is not a common model in the workforce training system, the strategic alignment of multiple agencies’ goals and resources has served to leverage limited funds and better serves the multifaceted workforce training needs of the alternative transportation industry and individuals alike.
Workforce development and training grantees have developed programs that establish or expand regional partnerships with local workforce investment boards, community colleges, local training organizations, public/private employers, community and business development organizations, labor organizations, and other key stakeholders to address the workforce training needs of the industry within their region, based on the fuels and vehicle technologies adopted.
To date, partner agencies have awarded more than $7.9 million in program funding, which includes four regional industry cluster assessment and planning grants, eight regional training grants, and eight employer training contracts to train more than 3,500 individuals.
These grants and contracts have secured more than $8.7 million in non‐state matching funds. Partner agencies have also conducted an industry assessment and developed the Green
needed to manufacture low‐emisbuild fueling infrastructure, service andinnovation and refinement to increase market acceptance. As the Energy Commission funds alternative fuel and low‐emission vehicle projects, it is critical that funds are allocated to help develop a skilled workforce to implement and sustain those projects.
Workforce Development and Training Implementation A combined $15.78 million was allocated to support workforce development and training in thefirst two investment plans. The funds were used toEmployment Development Department (EDD), the California Community Colleges Chancellor’s Office (CCCCO), and the Employment Training Panel (ETP). The interagency agreements have been structured to fund alternative fuel and low‐emission vehicle training portion of the partner agency’s broader workforce projects. This approach serves to ensure that program funds supplement workforce training programs to include training consistent with program investment plan.
130

Transportation Jobs Report, analysis of the Green Jobs Survey.
Through these partnerships with California’s education, tr orkf lopm d e opmen rgy Commission leverages program resources and augments workforce t evolving kforceCalifornia’s developin ustry.
Workforce Training AC ment T supportt y s workforce syst pingb e lif incumbent and workers.
The ‐based training contracts that provide w related to alternative fuels and vehicl technologies are consistent with t ish t plan.
T eragency a ne 2010. E mmed edt s befo e to delays resulting from the extended p state dditio ject rT rogram‐related contracts were awarded during its Ja 201 ti
which provides a transportation‐focused
aining, w orce deve ent, anconomic devel t professionals, the Ene
raining programs to meet the wor training needs of g clean transportation ind
ctivities alifornia Employhe
Training Panel ETP provides financial
e ETP pla assistance to California businesses to customized
em by hel worker raining. Th
usinesses provid
ETP was allocated
s an important role in California’elong learning opportunities to their
$5.78 million to fund performance
new hire
orkforce traininghe priorities estab
e thatl ed in this investmen
he ETP int greement was finalized in Ju TP i iately fund five raining contracteriod without a
re the close of FY 2009‐2010. Du budget, it was unable to fund a nal pro s until Janua y 2011.
hree p nuary 1 Panel Mee ng for eight t 172,830 to train more than 2,400 individuals and secured more than $4.5 million in non‐state match (Table 32). raining contracts totaling $4,
131

Table 32: ETP-Funded Training Contracts
Contractor PTrainees
rogram Funding
Non-State Match
rogram-Related Training Focus Number of P
% ion, sermaintenance training
r aeria44 $1 $2
Terex Utilities Installat vice and related to
HyPowe l device. 58,400 42,644
ISE Corp% Hybrid dmanufactur9001
rive veing; quality control ISO 00 $546,0
hicles; lean 126 $453,6 84
ElectricInc%
Vehicles, el hicles $494MD and HD ectric drive ve 100 ,000 $315,000
Fillner Construction% Alternative fue $149,240 ls fueling Storage 28 122,500 *California ManufacturersTech Assoc (
& CMTA)
Hydrogen fuelelectric lean manufaproduction solutions; quality 305 $559,060 $900,000
cell; Alt fuels; hybrid cturing;
controls **CaliforniaFederation
Labor (CLF)
Blue Sky Bio-Fuels San Francisco 19 $59,280 $56,883 MV Public Transportation os Angeles, Tulare $180Alameda, L 100 ,000 $200,000
California Labor Federation
Sacramento, Santa Clara Valley, Los Angeles Regional Transits 2,119,250 $ 2,200,000 1,750 $
Totals 2,472 $4,172 $,830 4,583,111 Source: Californi*CMTA is a multi-em
a Ener plo ctor th hich may include: Alterg
P so d Cummins W**CLF is a multi-employ act that w g for multip may in acraRegional Transit Distric ra Valley uthority
opmen roject gr
California Employ lopmen C kforce Investment Board (CWIB)
operate the largest en erations e worogr e of loc hout the state an
job seek r gh nsive One‐Stop Career ese re ters provide access to a full range of programs pertaining to
iv mploye refe rop ocia pre d ervice , underemploorke helps empl skilled workers.
d CWIB have awarded eigh local workforce training programs and regi implementation program grants related to alternative fuels
$3.9
gy Commissionyer training contra at supports training for multiple companies, w y Systems,
acific Ethanol, Peter
% Program devel
n Power, aner training contrt, and Santa Clat or deployment p
ment Deve
est ill provide trainin
Transportation Aantees
t Department and
le companies, which
alifornia Wor
clude: S mento
The EDDJob Service p1 million Centers. Th
s one ofam offers resourcers with employegional cen
public employm t services opations throug its comprehe
in th rld. The s at hundredss each year throu
d connects
educational actEDD deliversincumbent w
ities, local epaid training anrs and
r services, and employment s
rrals to other apps to unemployed
riate s l services. yed, and
oyers connect with
EDD an t four onal and industry cluster planning and
vehicle technologies consistent with the investment plan. These 12 grants totaled more than million in program funds and attracted more than $6.3 million in non‐state match.
132
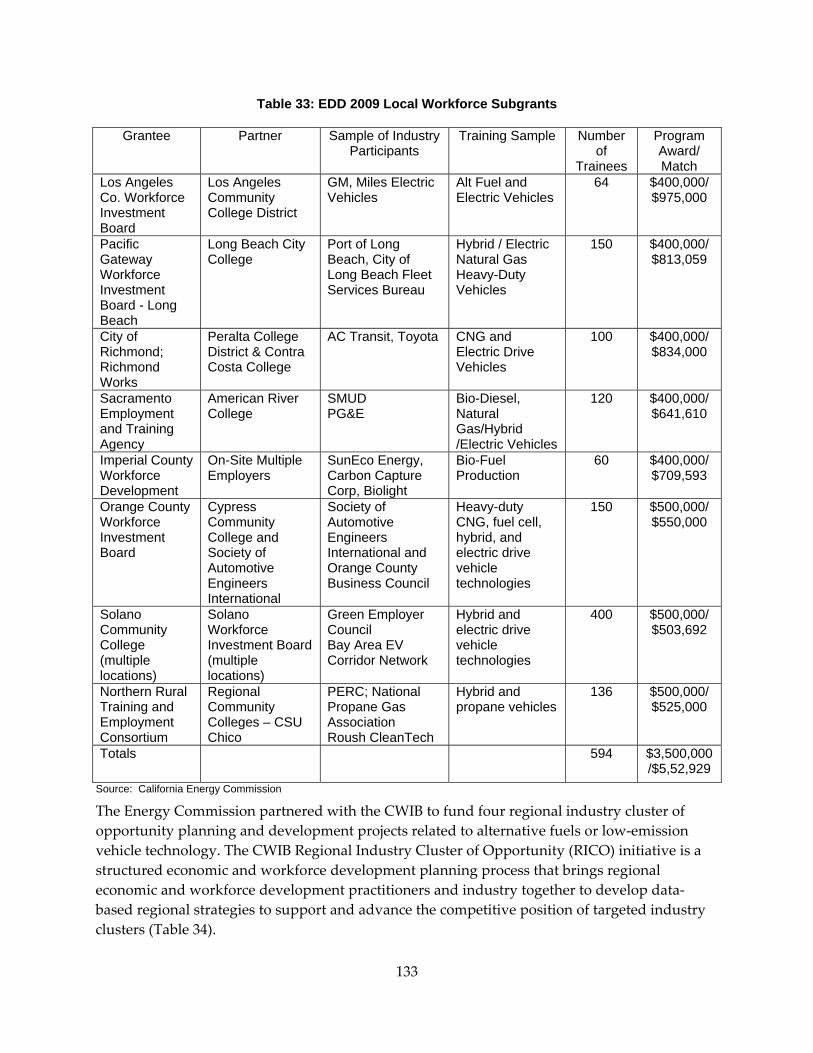
Table 33: EDD 2009 Local Workforce Subgrants
Grantee Partner Sample of Industry Training Sample Number Program / Participants of
Trainees AwardMatch
Los Angeles Los Angeles GM, Miles Electric Alt Fuel and Co. Workforce Investment Board
Community College District
Vehicles Electric Vehicles $975,000 64 $400,000/
Pacific Gateway
Beac
Long Beach City College
Port of Long Beach, City of
Services Bureau
Hybrid / Electric Natural Gas
Vehicles
150 $400,000/ $813,059
Workforce Investment Board - Long
Long Beach Fleet Heavy-Duty
h City of RRicWo
Peralta College DistCosta Coll
AC Transit, Toyota CNG and ElectricVehicle
100 $400,000/ ichmond;
hmond rks
rict & Contra ege
Drive s
$834,000
SEaA
eCollege PG&E
Bio-Diesel, Natural Gas/Hybrid /Electric Vehicles
120 / $641,610
acramento mployment
Am
nd Training gency
rican River SMUD $400,000
ImWDevelo
On-SEmp Production
60 / 3
perial County orkforce
pment
ite Multiple loyers
SunEco Energy, Carbon Capture
Bio-Fuel
Corp, Biolight
$400,000$709,59
OWInB
CypComCollSociety of Automotive
ers International and Orange County Business Council
vy-duty CNG, fuel cell, hybrid, and electric drive vehicle technologies
150 / $550,000
range County orkforce vestment oard
ress munity
ege and
Society of Automotive Engine
Hea $500,000
Engineers International
Solano Community College (multiple locations)
Solano Workforce Investment Board (multiple locations)
Green Employer Council Bay Area EV Corridor Network
Hybrid and electric drive vehicle technologies
400 $500,000/$503,692
Northern Rural Training and Employment Consortium
Regional Community Colleges – CSU Chico
PERC; National Propane Gas Association Roush CleanTech
Hybrid and propane vehicles
136 $500,000/ $525,000
Totals 594 $3,5/$5,52,929
00,000
Source: California Energy Commission
The Energy Commission partnered with the CWIB to fund four regional industry cluster of opportunity planning and development projects related to alternative fuels or low‐emission vehicle technology. The CWIB Regional Industry Cluster of Opportunity (RICO) initiative is a structured economic and workforce development planning process that brings regional economic and workforce development practitioners and industry together to develop data‐based regional strategies to support and advance the competitive position of targeted industry clusters (Table 34).
133

The RICOG process consists of four phases, which include:303
er
ents of regionally targeted
• Clusters of Opportunity Diagnosis: Research and analyses to identify regional industryclusters.
• Collaborative Priority‐Setting: Design and implementation of a collaborative clustengagement plan based on results of the research and analyses.
• Cluster of Opportunity Investment Strategy: Identify and connect specific investmand other commitments to advance the competitive positionclusters.
• Sustainable Implementation: Support the long‐term sustainability and growth of regional clusters.
Regional Industry Cluster Opportunity Subgrants Table 34: CWIB Clean Transportation
Grantee Counties Program Funding ARRA Match
Pacific Gateway – Long Beach
Los Angeles, Orange, and Ventura $49,987 $200,000
San Bernardino County
Riverside & San Bernardino $49,000 $200,000
Santa Barbara County
San Luis Obispo, Santa Barbara and Ventura
$50,000 $200,000
Northern Rural Training and Employment Consortium
Butte, Del Oro, Lassen, Modoc, Nevada, Plumas, Shasta, Sierra, Siskiyou, Tehama, and Trinity
$49,000 $200,000
Total $197,987 $800,000 Source: California Energy Commission
As an example of a RICO grant, the Northern Rural Training and Employment Consortium (NorTec) is developing a regional action plan to support propane auto gas market dewithin its 11‐county region. Propane
velopment has been selected as one of NorTec’s industry clusters due
to regional familiarity and comfort with the fuel, widespread use of propane in other ec’s
d
d demand e as an example of successful economic and workforce development.
applications, and the industry’s interest in developing the propane auto gas market. NorTpropane auto gas regional action plan is being developed in partnership with vehicle manufacturers/suppliers, fleets, municipalities, service and maintenance providers, fuel aninfrastructure suppliers, community colleges, universities, and economic, business, and workforce training agencies. The full market approach, including both the supply anside of this market, being adopted by NorTec should servimplementation of the RICO sector strategy approach to
303 California Workforce Investment Board, “Fact Sheet: Regional Industry Clusters Opportunity Grant,” http://www.cwib.ca.gov/page/library/RICOG_Fact_Sheet.pdf.
134

California Community College California’s community college system is theconsists of 72 districts, and 112 colleges and enr
largest higher education system in the nation. It olls more than 209 million students.
lion to assess industry workforce training need, rently available, the need for training course ed courses, and development of instructor training and completed only the industry assessment in 2010.
Workforce Demand below.
rkforce training partners alike are reporting a mounting skilled workforce gap , and
ner
s, and on‐board diagnostic cian’s diagnostic skills to maintain new bus
• The Southern California Regional Transit Training Consortium Workforce Needs ctronics, basic
ic
manuals and specifications.306
and schematics.
The CCCCO has been allocated $4.5 milalternative fuel and vehicle courses curdevelopment, the development of needcourse materials. To date, CCCCO hasFindings are represented under
Workforce Demand These partnership and outreach efforts have provided access to regional training service providers, transit agencies, OEMs and fleets providing on the ground information to inform workforce planning for the coming year.
Industry and woresulting from the combined impact of the economic downturn, reduced training resourcesthe aging workforce; these challenges are compounded further with the current need for a workforce trained in advanced transportation technologies. An example of industry and partinput on the need for workforce training assistance for transit is provided below:
• The transit sector is experiencing significant technological change along with the retirement of existing workers. New technology designs in bus systems relating to alternative fueled engines, hybrid buses, multiplex systempanels created the need to improve technifleets.304
• Today’s technicians use computers in their daily work on public transit vehicles. Operators and mechanics use laptops, scanners, programmers and electronic communication devices to diagnose these new sub‐systems in transit buses and rail vehicles. These trends are resulting in skill shortages, particularly in vehicle maintenance occupations.305
Assessments report transit technician skill gaps in basic electrical, basic elecomputer skills, troubleshooting skills, diagnostics and software analysis, specifvendor supplied training, computerized engine controls, plus the ability to readschematics and locate and interpret technical
A sampling of program‐related training needs includes:
• Electronics systems for transit; include troubleshooting
304 Santa Clara Valley Transportation Authority, submitted to docket 10‐ALT‐1, March 3, 2011.
on discussions with regional transit agencies and statewide and regional workforce training 305 Based partners 306 Based on excerpts from the Southern California Regional Transit Training Consortium Transit Workforce Needs Assessment Update 2009
135

• Network electronics diagnosis and repair, including multiplexing.
gine controls.
icle Collaborative states high unemployment, additional
“green” economy and to attract ing
ased a part of the New United Motor
icle shortage due to the loss of 70 to 80 percent of their
potential to
• Training for customer vehicle technicians who perform their own maintenance
• Training related to propane vehicle retrofit, service and maintenance
training for vehicle technicians
• Electric light‐rail
• CNG computerized en
• Hybrid electric transit training.
• Hybrid transit safety training.
• CNG transit safety training.307
Electric Vehicle Manufacturers
The recent Taking Charge report published by the California Plug‐in Electric Vehthat while the state has a skilled workforce and currently facesworkforce training is needed to prepare employees for the burgeoningPEV‐related manufacturing to the state. The report goes on to suggest that workforce training tosupport growing PEV markets should be incorporated into current training programs using existpartnerships.308
Tesla recently communicated that their most pressing need was to find assistance to fund workforce training for 500 immediate hires and 1,000 near‐term workers they plan to hire to begin production on the Model S. In 2010, Tesla purchManufacturing, Inc., plant in Fremont in order to expand their in‐state production capacity toproduce electric vehicles and components. Tesla products include the Roadster and the Model S, which is expected to rollout in 2012. Tesla’s Model S sedan will be the first vehicle produced at the plant with future vehicles to follow in the coming years.309
Medium and Heavy-Duty Vehicle Manufacturers Energy Commission staff recently conducted outreach meetings with medium‐ and heavy‐duty vehicle manufacturers to obtain information on current and planned alternative‐fueled vehrollouts. The industry is facing a workforce journey‐level technicians. If they should chose to exit in large numbers, this has the create a skills gap. The situation is compounded by the industry’s adoption of alternative fueland vehicle technologies. Workforce training development is needed to address this pending skilled workforce shortage. Training must focus on the following:
• CNG certified training for vehicle technicians at 29 California dealerships
(Caltrans, Ryder, Sysco, and so forth)
• Hybrid vehicle
307 Ibid. 308 California Plug‐in Electric Vehicle Collaborative, Takinthe Plug‐in Electric Vehicle Marketplace, December 2010,
g Charge: Establishing California’s Leadership in cdavis.edu/Taking_Charge_final2.pdfhttp://phev.u .
309 Energy Commission staff meeting with Tesla Motors, Inc.
136

• Dedicated electric‐drive310
Workforce Training Partners Employers must be able toindustry needs. While the
train workers effectively in response to changing business and need for workforce training is critical, businesses generally reserve
s for highly technical and professional occupations – limiting
h eds
The
e
lternative Fuel Vehicles Training Needs Assessment
ive
; and their need for or interest in
iverside and San Bernardino
capacity building dollarinvestment in training for frontline workers who produce goods and deliver services.311
Regional training providers report an increased demand in training related to new vehicle rollouts and specifically note an overwhelming need for troubleshooting and diagnostics training for transit vehicle technicians and hybrid and electric‐drive vehicles.312
Clean Transportation Workforce ResearchClean transportation is a fledgling entrant in California’s Green Jobs assessment efforts, whicresults in a lack of industry‐focused data to measure the current and near term workforce neand inform development of the program’s workforce training efforts. Current efforts rely on informal survey, stakeholder input, anecdotal information, and bits of data pieced together from studies of the larger green economy, which primarily focus on energy efficiency, clean energy, and the building and construction industry.
Three such research efforts focused on California’s Green Economy and Jobs are the Next 10 Shades of Green, the California Community Colleges’ Chancellor’s Office Fleet Training NeedsAssessment, and the EDD’s Labor Market Information Division (LMID) Green Jobs Survey. fleet assessment, developed in collaboration with Energy Commission staff, provides alternative fuel‐ and vehicle‐dedicated information, while the Next 10 and LMID reports wermined for data related to the clean transportation industry and jobs. The results will be used to guide continued development of the workforce training program. A summary of programapplicable information is provided below.
Alternative Fuels and AIn spring 2010, the CCCCO conducted an informal training needs survey with public and private employers throughout California that currently own or otherwise work with alternatfuels and alternative fuel vehicles. The survey questioned employers about their vehicle use, now and in the future; their current occupational employmenttraining topics.
The report provides information on survey efforts and responses from employers in five geographic regions.
• Los Angeles Region – includes the counties of Los Angeles, R
310 Based on Energy CoKenworth, and Freightli
mmission staff meetings with industry, including International/Navistar, Roush, ner.
311 Employment Training Panel, 2010‐2011 Strategic Plan, http://www.etp.ca.gov/packet/Strategic%20Plan%202010‐2011.pdf 312 Based on Energy Commission staff discussions with regional training providers.
137

• Sacramento Region – includes the counties of Sacramento, Solano, and Yolo
• San Joaquin Valley – includes the counties of Fresno, Kings, Madera, Merced, and Tulare
a
e next highest amount of responses among employers
in the short‐term future (next two years) or long‐term future (within three to six , with
and repair, it is not of these services in‐house (57
nt
ther
comments confirmed that general repairs, preventive maintenance
some
s
• Imperial County
• Modoc County
The 65 survey respondents working with fleets statewide are responsible for close to 68,416 vehicles. Of these, almost 21 percent or 14,351 are alternative fuel vehicles. Transit agencies reported the highest concentration of alternative fuel fleet ownership (92 percent of vehicles are alternative fuel), followed by private fleets (48 percent), state government (19 percent), and city/county government (14 percent).
Fleet Alternative Fuel and Vehicles Employers were asked to provide more detail on the alternative fuel vehicles in their fleets, including fuel types, type of usage, makes, and models. CNG vehicles seem to be the most prevalent choice among these respondents. Fifty‐two of the 65 fleet employers operate CNG vehicles. Eleven employers use all three light‐, medium‐ and heavy‐duty vehicles fueled by CNG; 12 indicated they own a combination of two types of CNG vehicles, while 29 operate single type.
Hybrid and electric vehicles received th(42 and 30, respectively); in both cases, the majority of responses were for light duty usage.
Looking forward, employers indicated the types of alternative fuel vehicles they plan on purchasingyears). As in current ownership, the most popular fuel choice for future purchases is CNG38 respondents expecting to add this fuel type in the next two years and 12 respondents anticipating a purchase in the next three to six years.
Repair and Maintenance Given the large numbers of vehicles these employers need to maintainsurprising that 88 percent reported they support at least someemployers). Of these, 71 percent perform all maintenance and repairs needed, while 15 percelimit their on‐site shop to maintenance and light repair work.
The majority of fleet employers support general repairs, such as brake repair, lube and oil changes as well as vehicle tune up and diagnostics (54 and 49 employers, respectively). Ano38 employers conduct major repairs on‐site, such as engine rebuilds, replacements, and transmission repair. Otherinspections, and select major repairs are subcontracted to vendors.
Only 3 of the 65 employers responded that they outsource or are still under warranty foror all maintenance and repair work.
Current Employment To better understand training needs, the survey queried respondents about their current staffing levels and specific occupations in their organizations. Within the sample, 82 employer
138

responded to this question – accounting for 25,197 workers; of these, 41 percent, or 10,271, are estimated to work directly with or around alternative fuels and/or vehicles.
To assess training needs, the survey first asked employers to indicate their immediate need training across seven broad
sion systems inspection, high‐pressure fuel system ms and battery technologies, first responder safety
employers indicated a need for all seven
have a preference for, or an already established inventory, of to ans to
these
n Jobs Report
maintenance
reported by firms related to the program, findings consistent across
(next six months) and their future need (next two years) forcategories: engine diagnosis and repair, emisanalysis, fuel properties, electrical drive systetraining, and fuel station maintenance. A majority oftraining areas (a combined need of 53 percent for fuel station maintenance to 87 percent for engine diagnosis and repair and repair, electrical drive systems and battery technologies is most in demand by transit agencies and city/county government, although other groups showed interest as well.)
Overall, the surveyed employersthree types of alternative fuels and/or vehicles: CNG/LNG, hybrid, and electric. In additioncurrent ownership, these types of alternative fuel vehicles are consistent with employer plincrease fleets in the short‐ and long‐term future as well as respondent support for training topics and subject areas that focus on maintaining, repairing, or otherwise working withfuels and vehicles. These responses are also consistent with the majority of employers who support on‐site fueling and on‐site repair and maintenance functions.
Green TransportatioAs part of the EDD interagency agreement, the Energy Commission tasked EDD’s LMID to analyze relevant data from the California Green Economy Survey (Green Survey) that relate to the program.
The Energy Commission asked for a special focus on the following industrial activities:
• Production, storage, and transportation of renewable fuels
• Green transportation manufacturing, distribution, installation and
• Sustainable fuel feedstock production and extraction
The LMID used data collected from the Green Survey to support analyses of employment in green jobs and businesses, and green occupations. In addition to analyzing the Green Survey, further research on program‐related occupations helps increase understanding of knowledge, skills, and other variables associated with workforce development for related occupations.
Green business practicesindustry groups include:
• On‐the‐job training was the most prevalent method for preparing current workers.
• Economic conditions and costs of implementation were the greatest barriers to implementing green practices.
Program Industry Groups To analyze the survey data on green industries and green business practices relevant to the program, LMID needed to relate the Energy Commission’s focus areas above to industries, as
139

defined according to the North American Industry Classification System (NAICS). To do thLMID coordinated with the California Community Colleg
is, es’ Centers of Excellence and the
tion Systems – 20 NAICS codes
green
in California for
The
than 20,000 employees), with Alternative Fuel Vehicle Technicians
lytics 2.0.
y Commission, and as part of the standard agreement, follow‐up focus groups are planned for some of the approximately 5,000 employers who responded to the Green Survey that expressed a willingness to provide additional information about green jobs, associated training requirements, and desirable skill sets. This information will be delivered as an addendum to this report by the end of 2012.
l th
Energy Commission to develop the following three groups:
• Alternative Advanced Vehicles – 11 NAICS codes
• Alternative Fuels – 13 NAICS codes
• Transporta
Analysis based on employees working 50 percent or more of their time in a green transportationjob reveals an estimated 15,208 jobs in Alternative Advanced Vehicles, 35,546 jobs in Alternative Fuels, and 21,466 jobs in Transportation Systems. This analysis depicts the extent to whichemployment exists in each of the program industry groups.
Program-Related Occupations Research focused on 14 occupations relevant to the program’s goals with potential for re‐skilling programs. Findings include estimated green employment for the six program‐related occupations included in the Green Survey. The data from the Green Survey also support comparisons of estimated green employment to estimated total employment three established program‐related occupations. In addition to analyzing the survey, employment demand and occupational profiles were developed for each of the 14 program‐related occupations.
The Green Survey results provide employment data on six green transportation occupations.largest estimated green employment was reported for Industrial Production Managers involved in green activities (more coming in second (more than 19,000 employees). Further, data from the Green Survey show a substantial portion of estimated employment (approximately 30‐50 percent) being involved in green activities at least some of the time for the three established occupations of Electrical Engineers, Mechanical Engineers, and Automotive Service Technicians.
In addition to reporting the Green Survey findings, the LMID conducted demand analyses forprogram‐related occupations by using a proprietary software tool, WANTED AnaWhile job listings declined for almost every occupation from May 2009 through April 2010, jobads for automotive service technicians grew 4 percent in California during this period. While 4 percent may appear low, the occupation is growing, and the need for these workers to service and repair the growing number of alternative fuel vehicles is expected to rise as current vehicles age and need servicing.
As a final deliverable to the Energ
Next 10 Many Shades of Green Report The second edition of Next 10’s “Many Shades of Green” reports, Many Shades of Green: RegionaDistribution and Trends in California Green Economy, tracks employment and business grow
140

related to products and service that improve efficiencies in the consumption of all natural
erging in
e of the state’s hot spots for clean transportation, lar, the
, alternative fuels are taking off: Employment expanded more than 700 percent
2
tric vehicle company.
tion 50 percent above the state average, this segment represents Growth has been driven in most part by alternative fuels, which
is te as a whole and grew
resources and reduce negative environmental impacts.313
Clean transportation, including alternative fuels and vehicle and equipment, is identified as oneof 15 segments of California’s Core Green Economy. Clean transportation hubs are emOrange County, the Bay Area, San Diego, and the Inland Empire, but activities associated specifically with fuels and vehicles are showing up in different places.
Regional Trends Los Angeles Area: The Los Angeles Area is onincreasing 33 percent since 1995 and 9 percent between January 2008 and 2009. In particuregion has a high concentration of employment in motor vehicles and equipment, which witnessed a leap of 11 percent in jobs in the recent single‐year period.
Orange County: Orange County is a leader in the clean transportation in the vehicle sector as well as the alternative fuels sector. With employment shares 2.1 times higher that the state average, the region reflects a mounting strength in clean transportation, building from expertise in its conventional auto industry. Motor vehicles and equipment are driving much of thisgrowth, increasing employment by 116 percent (450 jobs) from 1995 to 2009.
San Diego Region: Clean transportation employment growth accelerated by a factor of six between January 1995 and 2009. Establishments grew at a similar rate during that time. Over half of the employment in this segment is in alternative fuels. Employment in particular segments soared from fewer than 50 to more than 350 between 1995 and 2009. Primarily in Imperial Countybetween 1995 and 2009.
Inland Empire: In clean transportation, the Inland Empire has become a leader in alternative fuels with employment shares nearly triple the statewide average. Overall clean transportation employment increased 42 percent over the 15 years. The merger of two locally based electric vehicle companies resulted in employment losses in the nineties. The employment jump in 200was the result of a cheap producer leveraging its wastewater for the production of biofuels. New jobs created in 2008 following formation of a new elec
San Joaquin Valley: Clean transportation employment more than tripled from 1995 to 2005.With an employment concentraan important regional strength.accounts for 85 percent of employment in clean transportation. Alternative fuel employment three times more concentrated in the San Joaquin Valley than in the sta364 percent from 1995 to 2009.314
313 Next 10, Many Shades of Green: Diversity and Distribution of California’s Green Jobs,” December 2009, http://www.next10.org/next10/publications/green_jobs/2011.html. 314 Next 10, Many Shadse of Green: Regional Distribution and Trends in California’s Green Economy, January 2011, http://www.next10.org/next10/publications/pdf/2011_Many_Shades_of_Green_FINAL.pdf.
141

2011-2012 Workforce Training and Development Plan The Energy Commission intends to provide $6,500,00 for0 additional implementation of
ergy Commission staff will continue to work with
g delivery ment of
, and allocate funds to support additional partnerships, g program development.
Ca rWith th ining funds from previous years (about $3 million), the CCCCO will focus on cur u d development of traicommutraining the industr ent for community colleges (non‐program grantees) that have identified
aining modules developed will be made available
l and
munity
al in
The r d refinement of the program’s workforce training efforts nning. EmThe ant funds ($1,182,170) to fund workforce training contracts to sup r ative fuels and vehicle technologies.
The Report indicates that 79 percent of employers prefer on‐the‐job training, specific production process needs while min i th ETP supports training identified by
ETP a companies interested in funding to support alternative fuel and vehicle . With the level of interest expressed by the employer community, combined with ETP’s marketing efforts, it is anticipated that the initial $5,780,000 allocation will
ission will allocate
workforce training and development. The Enpartner agencies, California business, labor, local economic development, and other stakeholders to provide access to workforce training resources, to obtain timely information on current and evolving workforce training needs, and to develop and refine traininsystems that provide a well‐trained workforce to support the development and deployalternative fuels, infrastructure, and vehicles.
This effort will use existing partnerships and funding to complete the projects and goals formalized in the last investment plansworkforce training contracts and workforce trainin
lifo nia Community College Office of the Chancellor e rema
ric lum development, train‐the‐trainer instruction, training equipment, anning materials to meet the immediate program‐related training needs of program
nity college grantees (funded through EDD). In addition, the CCCCO will develop modules. Training modules are intended to target those areas identified throughy assessm
demand for program‐related training. The trto community colleges throughout the state with similar programs and/or regional workforce training needs.
The CCCCO will use remaining available grant funds ($575,000) to provide occupationaindustry information to identify training needs by region. They CCCCO will prepare environmental scan reports to provide regional workforce information for use by comcolleges in program planning and resource development. In addition, CCCCO will also preparea draft community colleges assessment report that will itemize the training and instructionneeds of each college in need of a program, along with training and instructional resources existence within the community college network/system.
se eports will guide development anand provide information for future investment pla
ployment Training Panel ETP will use remaining grpo t training related to altern
Green Transportation Jobs where the curriculum can be tailored to meet
im zing production disruption. The partnership wibusiness and industry that can be delivered at the employer’s worksite.
h s received inquiries from technology training
be obligated in contracts before the close of FY 2010‐2011. The Energy Comm142

$3.5 ning needs of businesses developing and/or dep es.315
Em ent Department ED munity college grantees achieve their workforce trai g ogram‐funded workforce training grants, to ensure that regional
Using theg
rough
ort long‐lternative fuel and/or vehicle regional cluster.
Only those gr t of the m funding. Fundable action plans de p ing market elements:
• Vehicle manufacturers/suppliers
nd/purchase commitments
d implementation funds will provide sector strategy‐related data, which at
million to the ETP to meet the workforce trailoying alternative fuels and vehicle technologi
ployment DevelopmD will continue to help regional and comnin goals, as established in their Pr
workforce training needs related to the program are being addressed.
remaining available grant funds ($300,000) in the EDD‐Energy Commission interagency agreement, EDD will work with Energy Commission staff and workforce traininpartners to develop a plan to deliver workforce training related to 2011 vehicle rollouts thexisting workforce training grantees.
To be eligible for additional funds grantees must:
• Demonstrate a new or unmet training need, which was not addressed in the original grant.
• Have demonstrated successful performance under the original grant.
• Establish partnerships with at least one training provider; with the capacity to provide training in clean alternative fuels and/or vehicles and with one employer; who employsworkers in the development and/or deployment of clean alternative fuels and/or vehicles.
California Workforce Investment Board CWIB will continue to work with the Energy Commission’s funded RICO grantees to finalize development of regional sector strategies related to alternative fuels and vehicles. Working in collaboration with Energy Commission staff, CWIB will use funds remaining available ($300,000) to support RICO grantees in implementing regional action plans that suppterm sustainability and growth of an a
antees that develop a regional action plan, which addresses all aspecarket chain, will be eligible for additional would incluartnerships and commitments in the follow
• Vehicle market dema
• Fuel producer/supplier
• Fueling infrastructure
• Economic development
• Business development
• Workforce development and training agencies
Each region awardea minimum will quantify and include:
• Vehicles deployed.
315 Letter from Brian McMahon, Employment Training Panel, dated June 27, 2010.
143

• Increase in alternative fuel consumption.
• Decrease in traditional fuel consumption.
• GHG reductions.
• Number of jobs created or retained.
• Number of instructors trained.
• Businesses served (vehicles purchased, infrastructure installed, workforce trained).
In addition, the Energy Commission will allocate $2.0 million to fund three to five regional industry cluster of opportunity planning and development projects, which are related to alternative fuels or low‐emission vehicle technology. This year’s effort will focus primarilythose regions not addressed in the first round of the RICO project, which may include the San Diego, Central Valley, Sacramento and the three Bay Area regions. The effort also will providesupport to first‐round RICO projects with demon
on
strated success in applying the RICO process
ecting alternative fuel and vehicle industries to the regional effort and plan
ces, and/or fund resources to their cluster industries.
ery
principles and connresources. As described above, only those grantees that have developed a regional action that addresses all aspect of the market chain will be eligible for additional funding. As notedabove, fundable projects would also be required to demonstrate how program funding wouldbe used to expand their RICO effort to reach broader segments of the market chain, provide additional support servi
New Entrant Career Path Development Future Planning Energy Commission staff will work with education departments, workforce training agencies, and stakeholder groups to identify possible programs geared to develop career paths for new industry entrants and address white‐collar workers training needs related to alternative fuel and vehicle technologies. The Energy Commission will allocate $500,000 to develop partnerships and fund a pilot project.
Table 35: Funding for Workforce Development and Training Deliv
ETP Workforce Training Contracts $3.5 Million CWIB Regional Industry Cluster Opportunities $2 Million New Entrant Career Path Partnerships and Pilot Program Development $.5 Million
Total $6 Million Source: California Energy Commission
Workforce Development and Training Outreach A primary workforce training goal for the coming year will be to increase the level of connectivity between existing Program fuel and technology projects and industry requests for training with the training resources available through Energy Commission’s partner agencies and training delivery grantees. Toward this end, the Energy Commission intends to allocate $250,000 for outreach in expanding workforce development and training. Agency Partners ETP has developed a marketing plan to get the word out to the clean transportation industry on the availability of program workforce training funds. They also work closely with Energy Commission staff to respond to requests for workforce training assistance received by the
is well Energy Commission. ETP, with more than 20 years of reputation building performance,
144

positioned to g y. Even greater Energy Commission staff resources will be rededicated to working with ETP partners to
native fuel and vehicle
ommunity college gra al workforce investment boards provide the opportunity for outreach on a statewide, regional, and local
tion on indust needs flow in both directions with these leading workforce and training a s regional needs
e local level and communicated up to the state level for funding consideration or strategic planning, while statewide initiative and funding opportunities are communicated to local workforce boards and one‐stops who inform local businesses. The Energy Commission staff will work with EDD and community college partners to develop an outreach and marketing plan to increase awareness of training resources available to support clean transportation industry workforce needs.
Industry Partners The Energy Commission engages with industry and stakeholders to obtain real time and projected workforce training needs, to identify specific skill set needs, guide curriculum and training program development, to improve access to training resources, and to inform future workforce investment.
In addition, based the recommendation provided by the California Workforce Investment Board during the development of the previous Investment Plan, Energy Commission staff will collaborate with the CWIB’s Regional One‐Stop Business Services, Small Business Development Centers, and the Governor’s Office of Economic Development to increase small and medium‐sized businesses awareness of workforce training and other program resources available to help them transition to clean transportation.316
Workforce Development and Training Demand Research To develop effective workforce programs, to address immediate workforce needs, and to inform long‐term planning, information must be compiled on types of alternative fuel and/or vehicle technology being adopted by each region, where clean energy jobs will be located, and what skills are needed to meet the needs of those industries.
The Energy Commission will allocate $250,000 to solicit for research services dedicated to quantifying workforce training needs of the alternative fuel and vehicle industry. The information obtained through a clean transportation research effort will shape the program’s workforce training efforts and provide information for future funding allocation assessments.
et program training funds out into the clean transportation industr
ensure that funding is accessible to the alter industry.
The EDD and Energy Commission‐funded c ntees and loc
basis. Workforce training opportunities and informa ry workforcegencie . Local and
are often communicated at th
316 California Workforce Investment Board, submitted to docket 09‐ALT‐1, April 1, 2010.
145

Table
Workforce Development and Training Delivery
36: Workforce Development and Training Funding Allocation
$6 Million
Workforce Development and Training Outreach $0.25 Million
Dedicated Clean Transportation Workforce Needs Study $0.25 Million
Total $6.5 Million Source: California Energy Commission
146

Chapter 6: Market and Program Development Outreach and Marketing An essential component for achieving the program goals is getting information out to the various enterprises as incentives and financing options become available. Businesses discouraged by the sluggish economy and wanting to leverage their costs of development ancommercialization plans toward cleaner transportation systems need to be aware of funding opportunities that can benefit them. The
d
developers of the AB 118 legislation had the foresight g into the program to ensure its success
and
refined the communications plan, the stage was set for
are
and partner/stakeholder sites. The Media and Public s press releases to announce program opportunities and
‐
nd gram, the types of projects that are being funded, and
incentives. The program site offers users easy access to
that
to include critical activities like outreach and marketinin advancing California’s transportation.
So far, the most visible method of public marketing and outreach has been a series of workshops held by the Energy Commission during the development of the Investment Plans those describing guidelines for the various funding opportunities and solicitations. As the number and types of funding mechanisms increase and funded projects progress into self‐sustaining marketing concerns, the need for up‐to‐date program information and news is intensified.
Communication Plan In 2009, when Energy Commission staff the 2010‐12 launch of the Program’s media and marketing campaign. Working within the Energy Commission’s internal Media and Public Communications Office, and collaborating with key agency partners, marketing materials such as fact sheets, brochures, and press kitsbeing developed to offer simple, straightforward details about the program, and highlight the funding priorities identified in the Investment Plan, and provide links to more detailed information via the program’s websiteCommunications Office also coordinateevents and to feature up‐to‐date program milestones and success stories.
Website Redevelopment In 2010, Energy Commission staff, in recognition of the importance of providing the public upto‐date information on program activities and opportunities and providing the most current information on the fuels and vehicle technologies the program supports, began redesigning theprogram website to promote easier access to program and technology information. The first phase of this undertaking, launched in early 2011, enables interested people to quickly fibasic information about the proopportunities for financing or otheragencies and programs such as ARB’s Drive Clean Campaign and the Bureau of Automotive Repair’s Drive Healthy information site and others promoting related projects or events. Additionally, in compliance with SB 1455 (Kehoe, Chapter 337, Statutes of 2010), the site alsoincludes links to local publicly owned electric utility companies to provide consumer information about charging infrastructure for PEVs. The Energy Commission anticipates
147

the website redesign will be completed by July 2011, and content will be updated on a monthlybasis thereafter.
Marketing and Media Solicitation
A m tuniverstargetefirm wi ed to develop audience and regional ‐specific print, radio, television, and cable adssele ed measur
AlternaIn MayTransp n industr admini l and sta th of the advanced transportation industry sharing the latest information on funding opportunities, regulatory policies, and inside
projects
c
ining funds from the 2010‐2011 allocation. While no additional allocation for program marketing and public outreach is required in this round of investment planning, it is
r s is going toward the development of “type‐approved” retail fuel dispensers for
ke
evaluation criteria. The Energy Commission is required to “establish sustainability goals to
state and federal lands.” In
ul imedia campaign is required to reach the wide range of businesses, fleet managers, ities, elected officials, air districts, environmental organizations, and early adopters d in the investment plan. The services of an outside public awareness and marketing ll be secur
and to negotiate media buys that maximize exposure to these targeted audiences. The ct firm will also work with the Energy Commission’s staff to develop metrics and tools to
e the campaign’s effectiveness.
tive Clean Transportation Expo 2011 2011, the Energy Commission will sponsor and participate in the Alternative Clean ortation Expo 2011. This nationally publicized event targets advanced transportatioy officials, government and policy professionals, legislators, public and private fleetstrators, and consumers. The expo is expected to bring together a wide range of nationate businesses and other groups influencing the grow
details on new and emerging technologies. The conference will give the Energy Commission anopportunity to showcase the Program and could potentially bring new and innovativein under future funding opportunities.
The FY 2010‐11 Investment Plan allocated $2.5 million to support program marketing and publioutreach activities. The goals and activities described in this investment plan will be supported using rema
expected that additional funds will be allocated in future investment plans for this area.
Standards and Certification As new fuels and technologies are developed, standards and certifications will need to be researched and adopted for the fuels, vehicles, and fueling infrastructure. The Energy Commission continues to assess possible needs for funding in this area. Previous funding fothese activitiehydrogen and fuel quality standards for hydrogen and biodiesel blends. This will be accomplished via a $4 million agreement with the CDFA’s DMS. Unless further needs for this category are identified, the Energy Commission will not likely allocate further funding.
Sustainability Studies The Energy Commission is the first major government energy agency in the country to matransportation energy project funding decisions based on specific sustainability goals and
ensure that alternative and renewable fuel and vehicle projects, on a full fuel‐cycle assessment basis, will not adversely impact natural resources, especiallyresponse to this statutory directive, the Energy Commission developed the following
148

sustainability goals317 to identify and promote transportation‐related GHG reduction projethat are exemplary in sustainability and environmental performance and that can servenational and international models:
• The first sustainability goal is the substantial reduction of life‐cycle GHG emissions associated with California’s
cts as
transportation system to help meet California’s 2020 and
l
. The
oals from the transportation
usly en
p
ndent species of fauna and flora,
habitat‐quality lands at risk of loss from bioenergy crop production.318 For example, the United
2050 targets as defined in Health and Safety Code Section 38550 and Executive Order S‐03‐05.
• The second sustainability goal is to protect the environment, including all natural resources, from the effects of alternative and renewable fuel development and promote the superior environmental performance of alternative and renewable fuels, infrastructure, and vehicle technologies.
• The third sustainability goal is to enhance market and public acceptance of sustainably produced alternative and renewable fuels by developing, promoting, and creating incentives for the production of such fuels in accordance with certified sustainable production practices and standards as established by government agencies, academic institutions, and nongovernmental organizations.
Biofuels (referred to as renewable fuels under the federal RFS) are projected to play a criticarole in meeting the GHG reduction goals for the state’s transportation sector, and the production and use of biofuels must grow substantially to meet RFS fuel use requirementsEnergy Commission recognizes that the transition to large volumes of alternative andrenewable fuels needed to help meet the state’s GHG reduction gsector must be managed properly to avoid environmentally and socially destructive productionpractices.
The potential for indirect land use change effects from biofuels production has emerged as a proxy for sustainability concerns about biofuels produced at industrial scales from purpose‐grown energy crops such as corn, soy, oil palm, and sugarcane. As described in the previoreferenced paper from Holly Gibbs of Stanford, about 100 million hectares of land have becleared and developed for plantations, much of which has occurred in tropical zones. Brazil, Indonesia, and Malaysia now account for 40 percent of global soy, oil palm, and sugarcane production.
Estimating indirect land use change values from energy crop production is a legally and methodologically complex endeavor, as evidenced by the work of the ARB’s Expert Workgrouduring 2010. ILUC values do not directly address primary issues of concern, such as tropical deforestation, loss of high‐quality ecosystems and their depewater pollution, or air pollution. The Energy Commission staff encourages ongoing support and investigation into alternative systems for conservation of sensitive, high carbon and high‐
317 The implementing regulations for the program include 13 sustainability evaluation criteria that are used by staff during review and evaluation of funding proposals. 318 Jim McKinney, Energy Commission Staff Representative to the Expert Workgroup, oral comments aNovember 5, 2010 Expert Workgroup Meeting.
t
149

Nation’s Reducing Emissions from Deforestation and Forest Degradation program needs ongoing development. The United Kingdom and European Union are also evaluating alternative approaches that would identify and preserve high‐carbon and high‐habitat‐quality lands and disqualify any biofuels produced from such land types from receiving advanced biofuels credits in Europe.319
When AB 118 was being drafted in the State Legislature, there was strong concern that in‐state energy crop production could displace prime farmlands used for primary human food production or could result in large acreages of grasslands or forestlands being converted to energy crop production. The program sustainability goals and evaluation criteria were craftedto ensure that no program money was allocated to projects with such potential. Neither phenomena has occurred, and several project proposals with non‐sustainable features were notfunded.
The Energy Commission
supports the development of an environmentally sustainable in‐state
arch
g offer to the LCFS Sustainability Working Group to fund for meetings.
bioenergy industry so that California can benefit economically from in‐state biofuels productionfrom the waste‐based feedstocks and alternative purpose‐grown energy crops described earlier.
For internationally produced biofuel feedstocks, Energy Commission staff continues to assess the major international initiatives and sustainable certification programs that are in development. The Energy Commission is working with the ARB and other stakeholders to decide how to evaluate international certification programs to determine if they will meet California’s goals and standards for sustainable production. To this end, the Energy Commission has joined the Roundtable on Sustainable Biofuels.
Previous year’s sustainability funding has been spent on forest biomass sustainability reseto implement the sustainability work plan developed by the Energy Commission for the Interagency Agency Forestry Working Group, 320 which aims to develop consistent definitions and standards for sustainable woody biomass from California’s 40 million acres of private andpublic forestlands. Substantial technical and scientific field work are needed to establish sustainability definitions and standards for the emerging woody biomass fuels industry.
For FY 2011‐2012, the Energy Commission is allocating $1.5 million for sustainability research and technical support in the areas of biofuel feedstocks, water use concerns, potential of third party sustainability certification programs to ensure sustainability, and manufacturing sustainability. At this time, sustainability research funding is not available through any other California regulatory programs such as AQIP or the federal ARRA program. Energy Commission staff has a standinresearch issues identified in their working group
Next, sustainability assessments need to be expanded from the project level to the regional levelto develop a more comprehensive understanding of how increased bioenergy crop production
319 Paul Hodson, European Commission, Presentation to the ARB Expert Workgroup, February 26320 The Interagency Forestry Working Group was convened by the California Natural Resources Agencyand California Environmental Protection Agency to develop consistent metrics for forest carbon accounting and sustainability definitions and standards for the energy and climate change programs at
, 2010.
the California Air Resources Board and California Energy Commission.
150

in California could be integrated into existing cropping mixes without adversely affectingcrop or animal feed production, agricultural water use, or
food wastewater discharges. These studies
could includassesugar b es for bioe l viabilitalso ne
To ensu are used in the productiondiff n t manag e discharge cou a
Califor on imported biofuel feedstocks and finished products to help ntal issues w fuels used in California are sustainably produced. In‐countryoil mare nee of international sus nto sustarestora bility standarUnited ty certific
Finally,Califormanufahave th , or to release uation criteria for AB 11 ociated with potential biofuels production. Different sustainability goals and evaluation criteria are needed
le manufacturing sector for technologies assoc ectric drive or
alysis need continuous updates of the status of vehicle technology and
fuels, market analyses, financing trends, and other factors that attract the introduction and growth of alternative and renewable fuels in California to monitor the progress of funding decisions and develop future, annual investment plans. Ongoing refinement of analytical methods, such as full fuel‐cycle analysis models, will be needed to evaluate the potential GHG emission and other environmental impacts of new fuel and vehicle technology options. The
e the assessment of the environmental performance of current crops and regional ssments of energy crop expansion (such as Imperial Valley sugarcane, San Joaquin Valley
eets and sweet sorghum, or Sacramento Valley sweet sorghum). Similar regional studinergy crops such as algae and perennial grasses may also be needed as the commerciay of these crops and their associated process technologies mature. Specific studies are eded on water use, wastewater discharge, land use, and fertilizer and pesticide inputs.
re that water use reduction measures and best management practices of biofuels, investigative studies are also needed that quantify water use for
ere t types of biofuel production processes and for bioenergy crops. Examining water besement practices and emerging technologies that reduce water use and wast
ld lso be beneficial.
nia will likely continue to depend meet GHG goals for the transportation sector. Investigating international environmeill be critical to ensure that all field assessments of industry practices for the harvest and production of Southeast Asia
pal , cane ethanol and oil palm in Brazil and greater South America, and African oil palm ded to meet this goal. It is also important that there are field tests
tai ability programs and third‐party audits of international biofuels and feedstocks subject inability certification programs along with examinations of habitat conservation and tion efforts for areas affected by plantation development. Assessments of sustainads, protocols, and the efficacy of using sustainability certification programs in the States and internationally could be very helpful in determining which sustainabiliation programs are most relevant to California’s regulations and transportation needs.
California has the potential to attract many firms vying to capture market share in nia’s green technology, alternative transportation sector and potentially locate cturing facilities in California. Manufacturing facilities – even for green technologies – e potential to consume natural resources at non‐sustainable levels (such as water) toxic wastes into the air, water or land. The current sustainability goals and eval
8 were crafted to ensure sustainable use of natural resources ass
to ensure a sustainab iated with elother alternative powertrains.
Technical Assistance and AnThe Energy Commission will
151

Energy Commissionassistance and analytical work, which
• Ongoing technical support ne
has allocated $7 million in grants or contracts to fund this technical is likely to include:
cessary to establish the life‐cycle scale GHG emissions for new and eme nalyzed in the LCFS program or through the Energy Commissionʹs existing contract with Life Cycle Associates. The Program will ne hnical and traininCalifornia Greenhouse Gases, Regulated ns, and Energy U
el pdated to include new climate‐c ses, n athways, and sustainability parameters such .
• cle analysis to help small demonstrate the eir alternative and fue
• e effect of alternative fuels on engines and includ ional boats and other
• T ssista new technologies, and verificat s made by program applicants.
• A on of aborative’s work to identi tify all oma ks available for fuel production.
• Program measurement, s the s 2011 Integ Policy
Report, and in subsequently adopted reports. The goals are tty an and financial perform e
program and its funding recipients. The Energy Commi ll examexpected benefit use HG
uc ss toward ac ese e o rd prom nsition
t e port fuels and reduced petroleum in California; 3) key obstacles and challeng tingoug for future
37: Technical Assistance and Analysis Funding Allocation
Sustainability Studies $1.5 Million
rging alternative fuel pathways that have not yet been a
ed additional tec g support with the Emissio se in Transportation
(GREET) modew fuel p
as it is expanded and u hanging gaas water
Full fuel‐cy for new fuel pathways, companies renewable
develop andls. carbon intensity of th
Studies on th vehicles, ing recreatmarine vehicles.
echnical a nce with evaluation of ion of claim
n expansiCalifornia bi
the California Biomass Coll fy and quanss feedstoc
verification, and evaluation (MV&E)sion to evaluate the program’s efforts in the
efforts. Statute requireEnergy Commi rated Energy
of MV&E o provide accountabili d ensure effective administrative ance of th
ssion wi ine: 1) the s of the projects in terms of air quality, petroleum reduction, G
emissions redbenefits; 2) tho a divers
tion, technology advancement, and progre hieving thverall contribution of the funded projects towafolio of clean, alternative transportation
oting a tra
dependencyidentified thr
Table
es to mee these goals h funded projects; and 4) recommendations actions.
Techn nd Analysis illion ical Assistance a $4 M
Measurement, Verification, and Evaluatio n $3 Million
Total $8.5 Million Source: Californi y Commission a Energ
152

Chapter 7: Funding Allocations
Table 38: Funding Allocation Summary for FY 2011-2012
Project/Activity Funding Allocation for FY (2011-2012)
Plug-In Electric Vehicles
Charging Infrastructure $8 Million Subtotal $8 Million
Hydrogen Fueling Infrastructure $8 Million
Subtotal $8 Million
Natural Gas Fueling Infrastructure $8 Million
Subtotal $8 Million
Propane Light-Duty Vehicle Incentives $1 Million Fueling Infrastructure $.5 Million
Subtotal $1.5 Million
Gasoline Substitutes
Advanced Cellulosic Ethanol and Gasoline Substitute Production Plants $7.5 Million
E85 Retail $4 Million Subtotal $11.5 Million
Diesel Substitutes Advanced Diesel Substitute Production Plants $7.5 Million
Subtotal $7.5 Million
Biomethane Pre-Landfill Biomethane Production $8 Million
Subtotal $8 Million
Medium- and Heavy-Duty
Vehicles
Deployment Incentives for Natural Gas Vehicles $11.5 Million Deployment Incentives for Propane Vehicles $3 Million Develop and Demonstrate Advanced Technology Medium- and Heavy-Duty Vehicles $7 Million
Subtotal $21.5 Million Innovative
Technologies, Innovative Technologies, Advanced Fuels, and Federal Cost-Sharing Advanced Fuels,
and Federal Cost-Sharing
$3 Million
Subtotal $3 Million
Manufacturing Manufacturing Facilities and Equipment $8 Million
Subtotal $8 Million
Workforce and Training
Workforce Development and Training Agreements $6.5 Million
Subtotal $6.5 Million
Market and Program
Development
Sustainability Studies $1.5 Million Technical Assistance and Analysis $4 Million Measurement, Verification, and Evaluation $3 Million
Subtotal $8.5 Million Grand Total $100 Million
Source: California Energy Commission
153

APPENDIX A: Carbon Intensities for Fuel Pathways
Figure A-1: Carbon Intensity for Gasoline and Substitutes
Source: ARB LCFS. *California sweet sorghum is an Energy Commission staff estimate; error bars indicate range of estimates; ILUC unknown. **Liquefied hydrogen is derived from ARB LCFS pathway document.
154

Figure A-2: Carbon Intensity for Diesel and Substitutes
Source d hydrogen is derived f FS cumen
: ARB LCFS. **Liquefie rom ARB LC pathway do t.
155

APPENDIX B: Hydroge
le B-1: Hydrogen Fuel Demand an aps ugh
2011
n Fuel Demand and Supply Tab d Supply G Thro 2014
Basin/Co. Su y Demand G # of S ions ppl ap tatSacramento/Yolo 1 00 22 78 1 San Diego 0 5 (5) 0 Alameda 60 7 53 1 San Francisco 0 6 (6) 0 San Mateo 0 2 (2) 0 Santa Clara 0 13 (13) 0 Santa Barbara 0 0 0 0 Northwest LA County, Coastal 170 115 55 2 Southwest LA County, Coastal 150 45 105 2 Southern LA County, Coastal 0 0 0 0 Western San Fernando Valley 0 0 0 0 Pomona/Walnut Valley 12 4 8 1 Northern Orange County 0 0 0 0 Central Orange County321 0 2 (2) 0 Northern Orange C 14 186 2 ounty, Coastal 200 Saddleback Valley 0 27 0 (27) Central Orange County, Coastal 25 37 (12) 1 Capistrano Valley 0 13 (13) 0
2012 Basin/Co. Su y Demand G # of S ions ppl ap tatSacramento/Yolo 2 40 22 218 1 San Diego 0 7 (7) 0 Alameda 60 10 50 1 San Francisco 0 6 (6) 0 San Mateo 240 10 230 1 Santa Clara 0 13 (13) 0 Santa Barbara 0 3 (3) 0 Northwest LA County, Coastal 710 67 643 5 Southwest LA County, Coastal 510 54 456 4 Southern LA County, Coastal 0 0 0 0 Western San Fernando Valley 0 0 0 0 Pomona/Walnut Valley 180 4 176 1 Northern Orange County 0 0 0 0 Central Orange County 0 5 (5) 0 Northern Orange C 18 182 2 ounty, Coastal 200 Saddleback Valley 180 35 1 145 Central Orange County, Coastal 420 40 2 380 Capistrano Valley 0 17 0 (17)
321 Regions in green may have some overlapping supply and demand.
156

Table B-1 (co rough 2014 nt.): Hydrogen Fuel Demand and Supply Th
2013 Basin/Co. Supply Demand p # of Stations GaSacrament 240 25 15 1 o/Yolo 2San Diego 0 3 ) 0 (3Alameda 60 10 1 50San Franci 0 6 0 sco (6)San Mateo 240 18 22 1 2Santa Clar 0 16 ) 0 a (16Santa Barbara 4 ) 0 0 (4Northwes 80 630 5 t LA County, Coastal 710Southwest LA County, Coastal 510 65 445 4 Southern LA County, Coastal 0 0 0 0 Western San Fernando Valley 0 0 0 0 Pomona/Walnut Valley 180 4 176 1 Northern Orange County 0 6 (6) 0 Central Orange County 0 20 0 (20) Northern Orange County, Coastal 200 30 2 170 Saddleback Valley 180 48 1 132 Central Orange County, Coastal 420 63 2 357 Capistrano Valley 0 31 0 (31)
2014 Basin/Co. Supply Demand Gap # of stations Sacramento/Yolo 240 48 192 1 San Diego 0 29 (29) 0 Alameda 60 37 23 1 San Francisco 0 28 (28) 0 San Mateo 240 41 199 1 Santa Clara 0 38 (38) 0 Santa Barbara 0 6 (6) 0 Northwest LA County, Coastal 710 277 433 5 Southwest LA County, Coastal 510 183 327 4 Southern LA County, Coastal 0 10 (10) 0 Western San Fernando Valley 0 10 (10) 0 Pomona/Walnut Valley 180 4 176 1 Northern Orange County 0 10 (10) 0 Central Orange County 0 52 0 (52) Northern Orange County, Coastal 200 167 2 33 Saddleback Valley 180 143 1 37 Central Orange County, Coastal 420 148 2 272 Capistrano Valley 0 157 0 (157)
157

158
l 2: FCV asin in 2015-2017
2015-2017 FCV Pop
Tab e B- s by Air B
Air Basin ulation Sacramento Valley 1,730 Salton Sea 100 San Diego 1,725 San Francisco Bay Area 14,500 San Joaquin Valley 310 South Central Coast 405 So oast uth C 34,230
TOTAL 53,000 Source: California Energy Commission

159
APPENDIX C:
Tabl sion Pr ellulos
ks
Fuel Conversion Processes e C-1: Fuel Conver ocesses for Non-C
Non-cellulosic Feedstoc
ic Feedstocks
Fermentation322 Anaerobic Digestion Transesterification Thermochemical Processes Algae
Description
Fermentation is the simplest process of producing ethanol. ile solids to
e
stewater treatment plants, and manure lagoons, or can occur in specially constructed containers.
with methanol, a catalyst, and heat to produce
esel, ol.
rolysis, and depolymerization are applicable
ocks.
processes are listed under the Cellulosic Feedstocks table.
s:
open, closed, and
arbohydrates and pids325; direct synthesis f fuels326; or putting the lgae directly into a onversion process327.
Yeast anaerobically converts sugar to alcohol and CO2.
In the absence of oxygen, “acid formers” convert volatfatty acids. “Methanformers” convert the acids to methane-rich biogas. The process occurs naturally in landfill cells, wa
Oils are processed
trademarked Biodiglycerin, and alcohBiodiesel must meet ASTM323 D6751 specifications.
Gasification, py
processes for non-cellulosic feedstThe descriptions of the
Three primary stagecultivation includes
offshore324; harvesting/processing includes dewatering, fractionation, and extraction; conversion includes processing algae-produced clioac
322 “The definition of cellulosic biomass ethanol . . . made at any facility – regardless of whether cellulosic feedstock is used or not – may be defined as cellulosic if at such facility ‘animal wastes or waste materials are digested or otherwise used to displace 90 percent or more of the fossil fuel normally used in the production of ethanol”, Federal Register, 40 CFR Part 80, Environmental Protection Agency, Regulation of Fuels and Fuel Additives: Renewable Fuel Standard Program; Final Rule, May 1, 2007. 323 American Society for Testing and Materials. 324 Open systems are typically open ponds. Closed systems include clear vessels known as photobioreactors or dark tanks. Offshore is growing contained algae in the ocean. 325 Carbohydrates to fermentation and lipids to transesterification or refinery process for gasoline, diesel, and/or jet fuel. 326 Alcohols (ethanol) and hydrocarbons. 327 Biochemical, thermochemical, and/or anaerobic digestion.

160
Non-cellulosic Feedstocks
Fermentation322 Anaerobic Digestion Transesterification Thermochemical Processes Algae
Potential Feedstocks
Sugar cane, sugar beets, corn, wheat, barley and other grains.
Almost all organic material, including agricultural residues andwoody materials (with size processing to speed up decompoand, with some
sition
cellulosic material, hydrolysis).
e ybean328,
rape seed, and canola. Used oils from cooking are also used.
nd
,
ss, and/or c material.
Plant, animal, and algae derived oils. Plant derived oils includvegetable, so
Almost all non-cellulosic feedstocks. Some processing such as dewatering may be required, depending on the thermochemical process used.
Depending on algae acultivation method, growth can be in solutions of sugar, municipal green wastemunicipal wastewater, switchgracellulosi
Sustainabilityand Emissions
d
2 2
aries with process and feedstock (see Cellulosic Feedstocks)
nd s,
r n t needed, non-competitive with food/feed production. CO2 can be used to
Well-to-Wheels (WTW) Mid-west corn ethanol – 65.66 gCO2e/MJ.329 WTW Brazilian cane ethanol – 27.40 gCO2e/MJ.330
WTW Compresselandfill gas – 11.26 gCO2e/MJ.331 WTW Compressed dairy digester gas – 13.45 gCO e/MJ.332
WTW Cooking oil Biodiesel – 15.84 gCO2e/MJ.333 WTW Midwest soybeans Biodiesel – 21.25 gCO e/MJ.334
V Reduced direct aindirect land impactfresh wate o
enhance cultivation.335
328 According to the American Soybean Association, for every 1.5 gallons of soybean oil derived iodiesel, more than 6 pounds of protein‐rich soybean meal is available for animal and human consumption.
Brazilian Ethanol,
Landfill Gas, February
,
B
329 California Air Resources Board, Detailed California‐Modified GREET Pathway for Corn Ethanol, February 27, 2009. alifornia‐Modified GREET Pathways for Brazilian Sugarcane Ethanol: Average 330 California Air Resources Board, Detailed C
With Mechanized Harvesting and Electricity Co‐product Credit, With Electricity Co‐product Credit; September 23, 2009. oard, Detailed California‐Modified GREET Pathway for Compressed Natural Gas (CNG) from331 California Air Resources B
28, 2009. 332 California Air Resources Board, Detailed California‐Modified GREET Pathway for Compressed Natural Gas (CNG) from Dairy Digester BiogasJuly 20, 2009. 333 California Air Resources Board, Detailed California‐Modified GREET Pathway for Biodiesel Produced in California from Used Cooking Oil, September 23, 2009. 334 California Air Resources Board, Detailed California‐Modified GREET Pathway for Conversion of Midwest Soybeans to Biodiesel (Fatty AcidMethyl Esters‐FAME), December 14, 2009. 335 Morello, Joanne and Ron Pate, “The Promise and Challenge of Algae as Renewable Sources of Biofuels, DOE‐EERE‐Office of Biomass Program,”September 8, 2010.

161
Non-cellulosic Feedstocks
Fermentation322 Anaerobic Digestion Transesterification Thermochemical Processes Algae
SummaExisting Projects
ry of e on
ill –
n
ry
were
re; or pilot plant; Solazyme/PA – heterotrophic340 pilot plant.
195 facilities nationwidproducing 13,508 milligallons/year.336 In California, 3 plants produce 120 million gallons/year.337
Altamont Pass Landfup to 13,000 gallons LNG/day.338 BowermaLandfill – 4,000 gallons LNG/day capacity. Hilarides Dai
550 million gallons produced in 2009 nationwide.339
Depolymerization: palmand vegetable oil – Neste Oil/Finland, Holland, and Singapochicken processing waste – Dynamic Fuels/LA
Sapphire/NM – open pond demonstration; Algenol/TX – photobioreact
Technology maturity and
technology
Corn/grain fermentation is mature. Three ompanies produce 1/3
of the ethanol: Archer Daniels Midland, Valero, and POET.341
Technology well established. Various
ter
pture of gas.
Commercial plants range from 1 - 40 million
Four major R&D Consortia:342
Companies working on
c landfills and wastewatreatment facilities pursuing ca
gallons/year. There is a100 million gallons/year plant in Washington.
Process cost Corn ethanol production cost - $1.26 to $1.32 per gallon in 2012 (2004 dollars)343
r
production.344
e.
Varies with process and feedstock. Depolymerization economically
wn and will vary on the process used.
Cost varies with digestetechnology and scale of
Feedstock costs are 80 percent of the final fuelcost. Larger plants are more profitabl
competitive at $80-$120/bbl crude oil prices.
Not yet kno
336 Renewable Fuels Association, “Biorefinery Locations,” http://www.ethanolrfa.org/bio‐refinery‐locations/, February 3, 2011. 337 Pacific Ethanol, Calgren, Parallel Products. 338 Ted Barnes, Altamont Landfill Gas Purification Testing and Monitoring – Critical project Review Draft Report, August 30, 2010. 339 National Biodiesel Board. 340 “. . . heterotrophic methods (where algae are grown without light and are fed a carbon source, such as sugars, to generate new biomass)”, from National Algal Biofuels Technology Roadmap, DOE‐EERE‐Office of Biomass Program, May 2010, p. 8. 341 Renewable Fuels Association, “Biorefinery Locations,” http://www.ethanolrfa.org/bio‐refinery‐locations/ 342 National Alliance for Advanced Biofuels and Bioproducts, Cellana Consortium, Consortium for Algal Biofuels Commercialization, Sustainable
Biofuels,” DOE‐
am;
Algal Biofuels Consortium; from Morello, Joanne and Ron Pate, “The Promise and Challenge of Algae as Renewable Sources ofEERE‐Office of Biomass Program, September 8, 2010 343 Federal Register, 40 CFR Part 80, Environmental Protection Agency, Regulation of Fuels and Fuel Additives: Renewable Fuel Standard ProgrFinal Rule, May 1, 2007 344 Patrick Chen, et. al., “Economic Assessment of Biogas and Biomethane Production from Manure,” March 20, 2010

162
Non-cellulosic Feedstocks
Fermentation322 Anaerobic Digestion Transesterification chemical Processes Algae Thermo
Market potential
Ethanol is not new to transportation sector and marketneceand mech
Current low price of nbiogas hardeomst
rutilized. Consideremarket pon the typrodcompetrpipe
c
Potential yields of at least 70 f oil/acre/year. already has
ssary production distribution anisms in place.345
cco
atural gas is making under to
pete on production basis.
Existing plants are d as having otential based pe of fuel
uced. Fuels are patible with oleum infrastructure, lines, and engines
luding jets). (in
0 gallons o346
Gap analysis euier
natural g
1perc
00ssustor12/3
Supfeeand
F er for g ae er w ot
Supinveqint
port with capital stments for pment, connection fees to
as pipeline.
20
2i
0 estimates are 70 ent less than 8347 due in part to es with underground age tanks348 and 1/09 expiration of
fuel subsidy.
port with improved dstock processing transport.349
Raldp
S is a policy drivae fuel R&D. Algived biofuels shoential.
C ded app echnologies and feedstocks discussed in this table. Application requests were greater than amount available.
alifornia Energy Commission solicitations for biofuels to include above processes. Responses to previous solicitation inclulications in all the t
P
fuel product
tha gd/
Syngasmetdim
ha
rimary transportation
E nol Bioan
as, compressed or liquefied
Biodiesel gas, diesel, oline, ethanol, hanol, jet fuel, and ethyl ether
Etg
anol, Biodiesel, soline, diesel, jet fuel
Source: California Energ
y Commission
345 Federal Register, 40 CFR Part 80, Environmental Protection Agency, Regulation of Fuels and Fuel Additives: Renewable Fuel Standard Program; Final Rule, May 1, 2007. 346 Comparable gallons of oil/acre/year: corn – 18, soybeans – 48, sunflower – 102, rapeseed – 127, palm – 635. 347 California Board of Equalization, Clear and Dyed Biodiesel Transition Reported by Diesel Fuel Suppliers Jan‐05 to Dec‐08. 348 California governmental policies have had a chilling effect on Biodiesel production. The 2008‐2009 State Water Resources Control Board’s actions that prohibited Biodiesel blends greater than 5 percent in underground storage tanks has identified as a key impediment by producers. 349 Federal Register, 40 CFR Part 80, Environmental Protection Agency, Regulation of Fuels and Fuel Additives: 2011 Renewable Fuel Standards/Final Rule, December 9, 2010.

163
Table C-2: Fuel Conversion Processes for Cellulosic Feedstocks
Cellulosic Feedstocks Thermochemical Conversion350 Biochemical
351Conversion Other352 Gasification Pyrolysis Depolymerization Hydrolysis
Description There are two general classes of gasifiers:
Pyrolysis thermally
partial oxidation and indirect. Indirect gasifiers use steam as the gasifying agent. The
s
breaks down biomass into pyrolysis oils at lower temperatures than gasification. The primary product is a
sis
d
rmal
upgrading stage is water slurry pulping and heating under pressure,
k
s nd
,
in and e
re
Other processes include hybrids of thermochemical and biochemical processes, hybrids of thermochemical
primary product of gasification is a synthesis gas or syngathat may be cleaned and used as a fuel gas or as the feedstock for other fuel production
353processes .
liquid instead of a synthesis gas. Pyrolyoil requires further treatment be used to produce gasoline andiesel fuel.
Depolymerization includes two stages.The hydrothe
flashing, and cracking the produced oil. The hydrotreating stageuses hydrogen, heat,and pressure to breathe light hydrocarbons into fuels for vehicles and jets.
The full process beginwith size reduction apretreatment with heatpressure, acid, or base to break up lignemicellulos s.h
Cellulose and hemicellulose are converted to sugars viaenzymatic or acid hydrolysis. Sugars afermented or used in some other fuel conversion step.
or biochemical conversion processes with new processes, and all-new technology processes.
Potential Feedstocks
ma rn stov t stalks, sugarcane and nn s, woo lar and willow, and
Any cellulosic biomass sorghum bagasse, pereforestry residues.
terial including agricultural residues such as coial grasses such as switchgrass and Miscanthu
er, rice straw, wheady crops such as pop
Sustainability and Emissions
gasification is 22.20
percent GHG
California GREET well-to-wheels GHG analysis not conducted. For forestry waste: collection is 8.61 g/MJ, transport is 3.67 g/MJ, and CO2 credit from not burning is -130.15 g/MJ.
-wheels GHG for cellulosic ethanol from farmed trees by fermentation is 2.4
Information not found for cellulosic feedstock.
Well-to-wheels GHG forcellulosic ethanol fromforest waste via
gCO2e/MJ.354 Biomass derived Fischer-Tropsch
gCO2e/MJ.356
diesel: approx. 88
reduction.355
Well-to
350 Thermochemical conversion involves biomass being broken down using heat and upgraded to fuels using a combination of heat and pressure in
fuel
at can be
iled California‐Modified GREET Pathway for Cellulosic Ethanol from Forest Waste, February 27, 2009.
the presence of catalysts. 351 The general process of most biochemical cellulosic biofuel process consists of feedstock handling, pretreatment, hydrolysis, fermentation orconversion, and a final distillation/separation step. 352 Federal Register, 40 CFR Part 80, Environmental Protection Agency, Regulation of Fuels and Fuel Additives: 2011 Renewable Fuel Standards/Final Rule, December 9, 2010. 353 Syngas to Fischer‐Tropsch is the leading method for producing diesel substitute fuel. Fischer‐Tropsch produces a paraffin wax threfined into diesel, jet fuel, and naptha.
ornia Air Resources Board, Deta354 Calif

164
Cellulosic Feedstocks Thermochemical Conversion350 Biochemical
Conversion351 Other352 Gasification Pyrolysis Hydrolysis Depolymerization
Summary of Existing Projects
fus in
ngdom.357
is to s
,
There are more than 50thermochemical facilitiethe United Ki
lly commercial Japan, Germany, and
Existing projects currently use palm oils. See Non-Cellulosic table.
Enzymatic hydrolysethanol: AE Biofuel(California), DuPont Danisco Cellulosic Ethanol (Tennessee)KL Energy (Wyoming).358
Primarily in R&D.
Technology maturity359 and
gy360
. Green Power Inc., Cello Energy.
skata, Fulcrum, POET, and Vercipia) intend to have
tion
INEOS ch,
Zeachem, Virent.
Companies working on technolo
With Fischer-Tropsch: Choren, Flambeau
National Renewable Energy Laboratory
Hydrothermal upgrading is 8 years old and
EPA is tracking progress of more than
Processes are considered
River Biofuels, Baard, Clearfuels, Gulf Coast
, TRI,
investigating stabilized higher quality oil.
requires R&D. Hydrotreating is a 3
70 facilities. Several companies (e.g.
, BlueFire
second generaor new.
,Energy, RentechNature’s Fuel, Chemrec, New PageWith catalytic
Dynamotive Energy Systems.
year old commercial technology.361
AbengoaEthanol, Co
CoskataBio, Lanzate
355 Well‐to‐Wheel assessments by California Energy Commission, ConocoPhillips, Sasol Chevron, Shell International. 356 California Air Resources Board, Detailed California‐Modified GREET Pathway for Cellulosic Ethanol from Farmed Trees by Fermentation, February 27, 2009. 357 Federal Register, 40 CFR Part 80, Environmental Protection Agency, Regulation of Fuels and Fuel Additives: 2011 Renewable Fuel Standards/Final Rule, December 9, 2010. 358 Federal Register, “Regulation of Fuels and Fuel Additives: 2011 Renewable Fuel Standards,” http://www.federalregister.gov/articles/2010/07/20/2010‐17281/regulation‐of‐fuels‐and‐fuel‐additives‐2011‐renewable‐fuel‐standards#p‐127.
chnology process components (gasification, pyrolysis, Fischer‐Tropsch, etc.) are in commercial use. Advancements are being made in 359 The temaking the process more efficient, providing higher quality products, new catalysts, and hybridizations. 360 Federal Register, 40 CFR Part 80, Environmental Protection Agency, Regulation of Fuels and Fuel Additives: 2011 Renewable Fuel Standards/Final Rule, December 9, 2010. 361 Status of Neste Oil’s Biobased NExBTL Diesel Production for 2007, Neste Oil, Synbios, Stockholm, May 19, 2005.

165
Cellulosic Feedstocks Thermochemical Conversion350 Biochemical
Conversion351 Other352 Gasification Pyrolysis Depolymerization Hydrolysis
coRTeBi
nveangch
oen
rsie funolo
on telsgie
gy, E
o e, Pes, Fne
thaarsulcrke
nol:on rumm,
er
Gulf Coast Energy.
vePyEn
rolysisrge
witnt,
h DPetr
epobr
olymas3
eri63
zation: Dynamotive, coce20
mmllul12.
ercosic362
ial et
salhan
e ofol i
n
Process cost Varieand feed
s with tsto
echck.
nology Varies with techck.
nology and feedsto based o s at
converti ck g sic ethanol: $1.65 in 201
tified. Environmental Protection Agency
r
Pr
enpe
oce
ergrce
ss
y cnt t
cosn effng fonto 8
t vaicie
eedent 0 p
rienciesto(50erce
s
nt).
Pr
(2pecosa
oduallon
004rcern me
cti of
dont h
etha pa
on ccel
llarighnol
ram
ostlulo
s) oer t usete
of
r 3haning rs.3
2 1
64
No
is tprRF
t ye
racoceS.
t q
kinsse
uan
g s fo
Market potential Thtraw
e Ecki
aste
nving ts p
ronhe roc
meproess
ntalgreing
Prss .365
otecof m
tioore
n A th
genan
cy 100
ack cel
nowlulo
ledsic
gesbio
thfuel
at t pr
he cojec
elluts.
losThe
ic b te
iofuchn
el iolo
ndugies
str als
y is o h
proave
gre ap
ssiplic
ng aati
t a on f
rapor m
id pun
acicip
e anal s
d is olid
Gap lysis e a al ana Improved pre-processing of fe dstock material nd methods to use lignin in biochemic processes.366 ove
Fue pr
l inoce
censse
tives.
s for s. gy to inclcellulosic biomass based fuel California Ener Commission solicitations for biofuels ude ab
Primary transportation fuel products
es ol V Sgamet
yngsolethher.
as,ine,ano
367
die ethl, di
selanme
, ol, thyl
Difuel.
el, gasoline, jet Diesel and gasoline. Ethan aries.
363 Ibid. 362 Federal Register, 40 CFR Part 80, Environmental Protection Agency, Regulation of Fuels and Fuel Additives: 2011 Renewable Fuel Standards/Final Rule, December 9, 2010. 364 Ibid. 365 Conversion Technologies Status Update Survey, Publication #IWMB‐2009‐008, Integrated Waste Management Board, April 2009 366 Federal Register, 40 CFR Part 80, Environmental Protection Agency, Regulation of Fuels and Fuel Additives: 2011 Renewable Fuel Standards/Final Rule, December 9, 2010 367 Requires syngas to Fischer‐Tropsch, biochemical, or some other process to convert to liquid transportation fuel product.

GLOSSARY AC alternating current
Disabilities Act
ARB oard ency‐Energy
einvestment Act and Materials
District
hancement goals ction Plan
É Average Fuel Economy rid, Efficient, Advanced Technologies
ges Chancellor’s Office enter for Sustainable Energy
culture ducer Incentive Program
gas
Utilities Commission ogram
nt Board
ipal Utility District
Act Institute
t
ADA Americans with AQIP Air Quality Improvement Program
Air Resources BARPA‐E Advanced Research Projects AgARRA American Recovery and RASTM American Society for TestingBAAQMD Bay Area Air Quality ManagementBCF billion cubic feet BDT bone dry tons BEV battery electric vehicle BOEG biorefinery operational enCAAP Clean Air ACAF CorporateCalHEAT California HybCaltrans California Department of Transportation CCCCO California Community ColleCCSE California CCDFA California Department of Food and AgriCEPIP California Ethanol ProCNG compressed naturalCO2 carbon dioxide CPUC California PublicCTP Clean Trucks PrCVRP Clean Vehicle Rebate Program CWIB California Workforce InvestmeDC direct current DGE diesel gallon equivalent DMS Division of Measurement Standards EBMUD East Bay MunicEDD Employment Development Department EISA Energy Independence and SecurityEPRI Electric Power ResearchEREV extended range electric vehicleETP Employment Training Panel EVI Electric Vehicles International EVSE electric vehicle supply equipmenFCB fuel cell bus FCV fuel cell vehicle FOG fats, oils and greases FY fiscal year
166

g CO2e/MJ grams carbon dioxide equivalent per megajoule
missions, and Energy Use in
tan Transportation Authority LCFS Low Carbon Fuel Standard LFG landfill gas LMID Labor Market Information Division LNG liquefied natural gas MDU multidwelling unit MGY million gallons per year MPG miles per gallon mph miles per hour NAICS North American Industry Classification System NBPOL New Britain Palm Oil Limited NGV natural gas vehicle NHTSA National Highway Traffic Safety Administration NorTec Northern rural Training and Employment Consortium NOx nitrogen oxide NREL National Renewable Energy Laboratory OEM original equipment manufacturer PEV plug‐in electric vehicle PG&E Pacific Gas and Electric PH&EV plug‐in hybrid and electric vehicle PHEV plug‐in hybrid electric vehicle PIER Public Interest Energy Research PZEV partial zero emission vehicle RFS Renewable Fuel Standard RICO Regional Industry Cluster of Opportunity RIN Renewable Identification Number
GGE gasoline gallon equivalent GHG greenhouse gas GM General Motors GREET Greenhouse Gases, Regulated E
Transportation GTAP Global Trade Analysis Project GTI Gas Technology Institute GVWR gross vehicle weight rating HESA home energy storage appliance HICEV hydrogen internal combustion engine vehicle HVIP Hybrid Voucher Incentive Program ICTC Interstate Clean Transportation Corridor ILUC indirect land use change kg kilograms kW kilowatts kWh kilowatt‐hour LAMTA Los Angeles Metropoli
167

168
RPS Renewables Portfolio Standard SAE Society of Automotive Engineers SANBAG San Bernardino Association of Governments SCAQMD South Coast Air Quality Management District scfm standard cubic feet per minute SDG&E San Diego Gas & Electric SFPUC San Francisco Public Utility Commission SMR steam methane reformation SMUD Sacramento Municipal Utility District STREET Spatially and Temporally Resolved Energy and Environmental Tool TIGGER Transit Investments for Greenhouse Gas and Energy Reduction U.S. DOE United States Department of Energy U.S. DOT United States Department of Transportation U.S. EPA United States Environmental Protection Agency UL Underwriters Laboratory USDA United States Department of Agriculture ZEB zero emission bus ZEV zero emission vehicle


![Implementing conceptual model using renewable energies in ... · reserve in the world [19]. Since Iran has plenty of fossil fuel resources, alternative fuel and renewable resources](https://img.dokumen.tips/doc/110x75/6039c7144da0051db801262d/implementing-conceptual-model-using-renewable-energies-in-reserve-in-the-world.jpg)