Embed Size (px)
Citation preview

2011. 12. 2011. 12.
KANG BooSik, Professor/Ph.D.Dept. of Civil & Environmental EngineeringDankook University
KANG BooSik, Professor/Ph.D.Dept. of Civil & Environmental EngineeringDankook University
Evaluation for the Effects of Flood Controlfor Side-weir Detention Basin using Equivalent Peak Hydrograph
Evaluation for the Effects of Flood Controlfor Side-weir Detention Basin using Equivalent Peak Hydrograph
YOON ByeongMan, Professor/Ph.D.Dept. of Civil EngineeringMyongji University
YOON ByeongMan, Professor/Ph.D.Dept. of Civil EngineeringMyongji University

2/28
Contents
33
22
44
Conclusion66
Introduction11
General Process of Design Flood Estimation
EPH for the Yeoju site of the detention basin
Representative Synthetic Unit Hydrograph
55 Analysis of the Effects of Flood Control

3/28
Side-weir detention basin is an off-line storage located at
river side for improving the flood control capacity in the
downstream
※ White Oak detention basin, Harris County, U.S.
Introduction : Side-weir detention basin
4/28
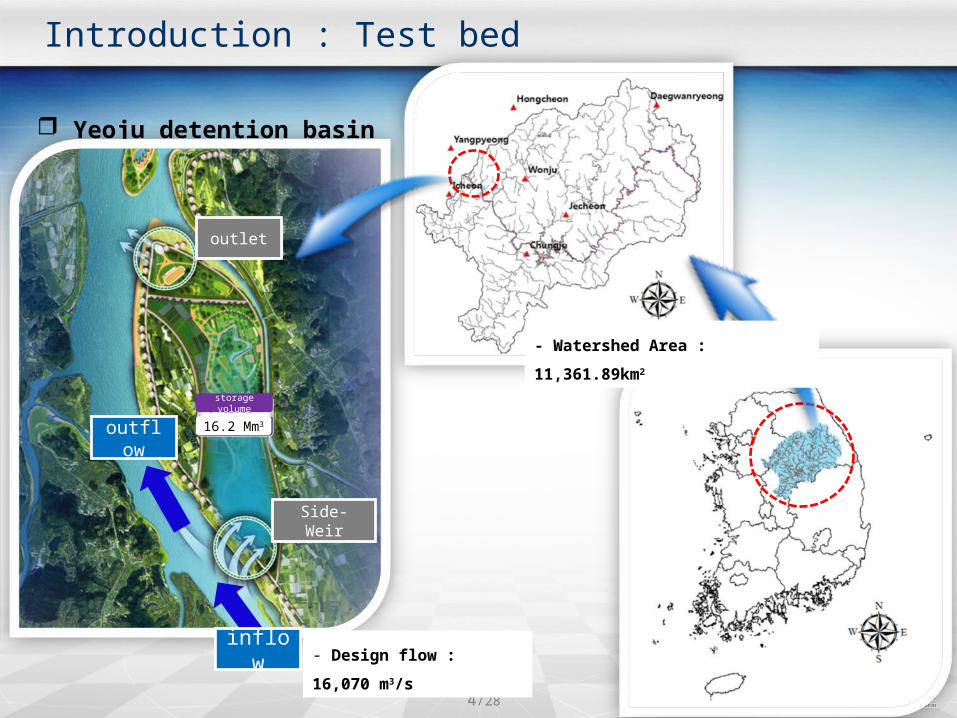
Introduction : Test bed
Yeoju detention basin
Side-Weir
storage volume
outlet
outflow
inflow
16.2 Mm3
- Watershed Area : 11,361.89km2
- Design flow : 16,070 m3/s

5/28
Introduction : Factors influencing the effects of flood control
Design factors of the side-weir
: side-weir length(Ls), side-weir height(hs), storage volume(Vs)
Environmental factors
: roughness coefficients of river(n), shape of inflow hydrograph
side-weir length (Ls)
river width (B)
side-weir detention basin
detention storage (Vs)
side-weir detention basin
river
levee height(h) side-weir
height (hs)
complete overflow incomplete overflow

6/28
Introduction : The effects of flood control
peak discharge without / with storage.
effects of flood control
with storage
without storage
The effects of flood control is a difference between
Inflow=streamflow without detention basin
Overflow into the detention basin begins.A
BOverflow out of the detention basin begins.
outflow=streamflow with detention basin
7/28
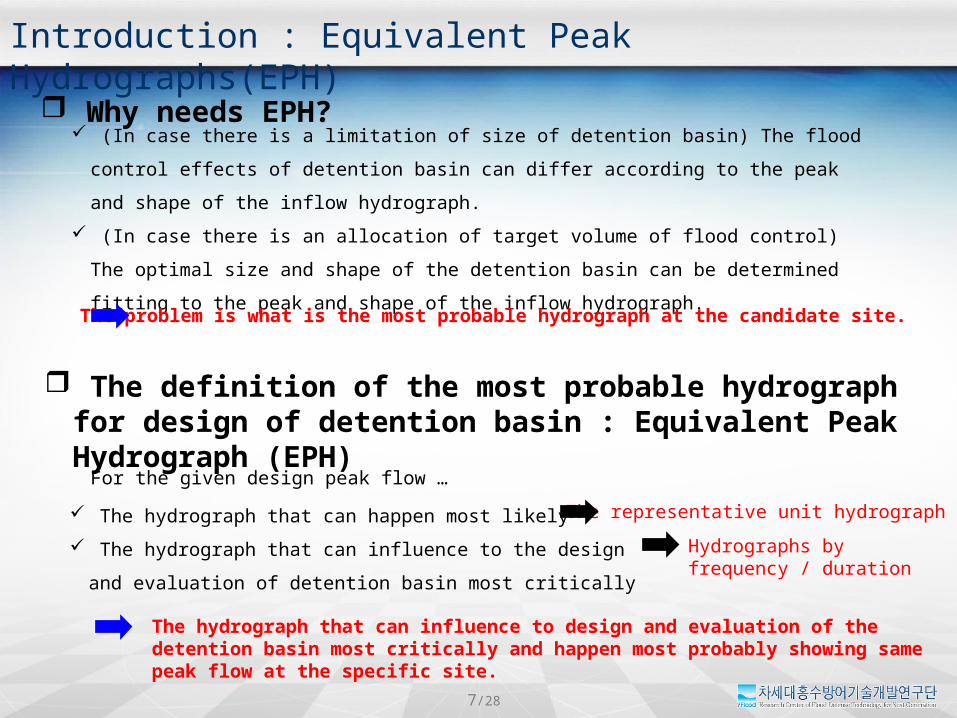
Why needs EPH?
(In case there is a limitation of size of detention basin) The flood control effects of detention
basin can differ according to the peak and shape of the inflow hydrograph.
(In case there is an allocation of target volume of flood control) The optimal size and shape of
the detention basin can be determined fitting to the peak and shape of the inflow hydrograph.
Introduction : Equivalent Peak Hydrographs(EPH)
The representative unit hydrograph
Hydrographs by frequency / duration
The problem is what is the most probable hydrograph at the candidate site.
The hydrograph that can influence to design and evaluation of the detention basin most critically and happen most probably showing same peak flow at the specific site.
The definition of the most probable hydrograph for design of detention basin : Equivalent Peak Hydrograph (EPH)
The hydrograph that can happen most likely
The hydrograph that can influence to the design and evaluation of
detention basin most critically
For the given design peak flow …

8/28
Introduction : Design Hydrograph with Various Rainfall Duration
- Estimation method of representative unit hydrograph : Nash Model
- Rainfall duration: Thiessen average by the most frequency quartile Huff distribution
(“Han river” Basic plan of river, 2009,Ministry of Land, Transport and Maritime Affairs)
Design flood=16,070m3/sec

9/28
Process of design flood estimation

10/28
)(
)/exp()(
1)( 1
n
Kt
K
t
Ktq n
nnn
<Linear reservoir theory by Nash >
dt
dOK
dt
dS
The entire basin consists of succesive n reservoirs, and the inflows and outflows at each
reservoir have linear relationship.
The IUH is determined through the flood routing from the first to the n-th reservoir using linearity.
Theory of Nash Model
dt
dOKOI
KOS
dt
dOKO 1
1
)exp(1
1 K
t
KO )exp()
1(
12 K
t
KKO
Estimating Instaneous Unit Hydrograph
differenciating
Simultaneous eq.
Computing till nth reservoir

11/28
Estimating parameter of Nash model
22
1
)1( KnnM
nKM
The parameters of the IUH formula, i.e. 2-param. Gamma distribution become n, K, the 1st
and 2nd moments for the original point(t=0) follows;
The 1st moment, : the delayed time from the origin to the centroid of the IUH curve.
: The 1st moments of the effective rainfall and direct runoff divided by the total
effective rainfall and direct runoff.
nKMM IO 11
12
22 2)1( IIO nKMKnnMM
: The 2st moments of the effective rainfall and direct runoff divided by the total
effective rainfall and direct runoff.
22 , OI MM
11, OI MM
1M
Estimating Instaneous Unit Hydrograph

12/28
Estimating representative unit hydrograph
)(
)/exp()(
1)( 1
n
Kt
K
t
Ktq n
nnn
Therefore, if the peak flow and time are determined using the unit hydrographs of the rainfall
events, the parameters n and K can be determined using the trial and error method for the
differentiated Nash Model.
ppnn Tqen
n
n
)1(1)1(
)(
1
where is the peak specific flow (cm/hr) and time (hr) of unit hydrograph, n, the # of
reservoirs, can be determined if the peak specific flow and time are given. The storage constant
K can be estimated using the n.
1n
TK p
The formulas of peak specific flow and time can be obtained by differentiating Nash model
formulas.
The representative peak flow and time can be estimated by taking averages of peak flows
and times of individual rainfall events.
pt Tq ,
Estimating Instaneous Unit Hydrograph
differentiate

13/28
Composite unit hydrograph method of Korea Institute of Construction Technology(KICT) (2000)
Composite unit hydrograph considering basin characteristic
The new methodology for composing unit hydrograph using the multiple linear
regression, which derived using the UH from 70 sites and their basin charateristics.
136.0037.0255.09580.0 cp SLAT
The Tp and Qp are applied to the Nash model for the purpose of estimating the
ordinates of the UH.
Slope(m/m)River S
Length(km)River L
)Area(kmBasin A
mm/hr)Discharge(Peak Q
Time(hr)Peak T
c
2
p
p
637.02395.0 TQp

14/28
Improvement of composite unit hydrograph method
The previous studies for the composite unit hydrograph are the results of different rainfall
events, method of effective rainfall, baseflow separation, method of representative UH, which
makes difficult in showing consistence outcome.
In this study, the improved methodology for composing UH will be suggested by differing in
estimating the major components of the UH even though the composing method is basically
the same as the existing the method of composing UH.
Primary factor KICT’s formula Proposed formula
Separating base flow Horizontal method Local Minimum Method
Unit hydrograph Ridge Regression Nash Model
Rainfall Complex rainfall Single rainfall
Parameter of unit
hydrograph
Basin Area, River
length, River slope
Basin Area, Shape
factor, River slope
Composite unit hydrograph considering basin characteristic

15/28
Parameter of Nash model
n K
2.115 11.514
Representative unit hydrograph for Yeoju site
Representative Unit Hydrograph
)(
)/exp()(
1)( 1
n
Kt
K
t
Ktq n
nnn

16/28
Estimating IDF Curve
Probable rainfall-intensity formula (Yangpyeong)
Class 2 yr 5 yr 10 yr 100 yr 200 yr
Short term
Long term
77.0
08.366
t 09.1
90.510
t 24.1
36.608
t 55.1
95.914
t 61.1
41.1005
t
65.0
82.736
t 61.0
91.817
t 60.0
02.889
t 57.0
36.1139
t 57.0
62.1216
t

17/28
- The 100-yr IDF couve in the AWS in Han river basin
- Yangpyeong, Icheon, Wonju, Hongcheon, Chungju, Jecheon, etc.
- Taking average using Thiessen areal ratio.
Estimating IDF Curve

18/28
Estimating Precipitation producing equivalent peak flow
Duration(hr)
Effective precipitation
(mm)
Effective intensity(mm/hr)
Precipitation producing equivalent
peak flow (mm)
Precipitation intensity producing equivalent
peak flow (mm)(mm/hr)
6 hr 168.3 28.05 422.3 70.88
12 hr 171.3 14.27 390.8 32.56
18 hr 176.5 9.81 395.5 21.97
24 hr 184.5 7.69 385.7 16.07
36 hr 206.2 5.73 424.1 11.78
48 hr 227.3 4.73 452.6 9.42
60 hr 249.0 4.15 680.6 8.01
72 hr 271.9 3.78 509.3 7.07
96 hr 320.6 3.34 583.1 6.07
120 hr 372.0 3.10 666.7 5.56
144 hr 425.1 2.95 751.3 5.22
168 hr 479.6 2.85 835.7 4.97
- Design (Peak) flood : 16,070 m3/s

19/28
Frequency analysis
- Analyzing the probability that cause the rainfall producing the design flood.
- The transform of the real precipitation considering runoff ratio is necessary because
the input of UH is the effective rainfall.

20/28
Representative Hydrograph for Various Rainfall Duration
- Estimation method of representative unit hydrograph : Nash Model
- Rainfall duration: Thiessen average by the most frequency quartile Huff distribution
(“Han river” Basic plan of river, 2009,Ministry of Land, Transport and Maritime Affairs)
Design flood=16,070m3/sec(Return period = 100yr)

21/28
Analysis on the effects of flood control
stream lengths bed slope river width peak discharge side-weir height side-weir width
44 km 0.0005 360 ~1830m 16030m3/s 36.4 EL.m 300 m
[volume elevation relationship] [unsteady boundary condition] [flow hydrograph]
Numerical analysis : HEC-RAS

22/28
Analysis on the effects of flood control
Duration : 24 hours
roughness
coefficient
(n)
peak flow
(m3/s)
effects of
flood control
(m3/s)
0.025 15922 108
0.030 15619 411
0.035 15722 308
inflow
inflow
23/28
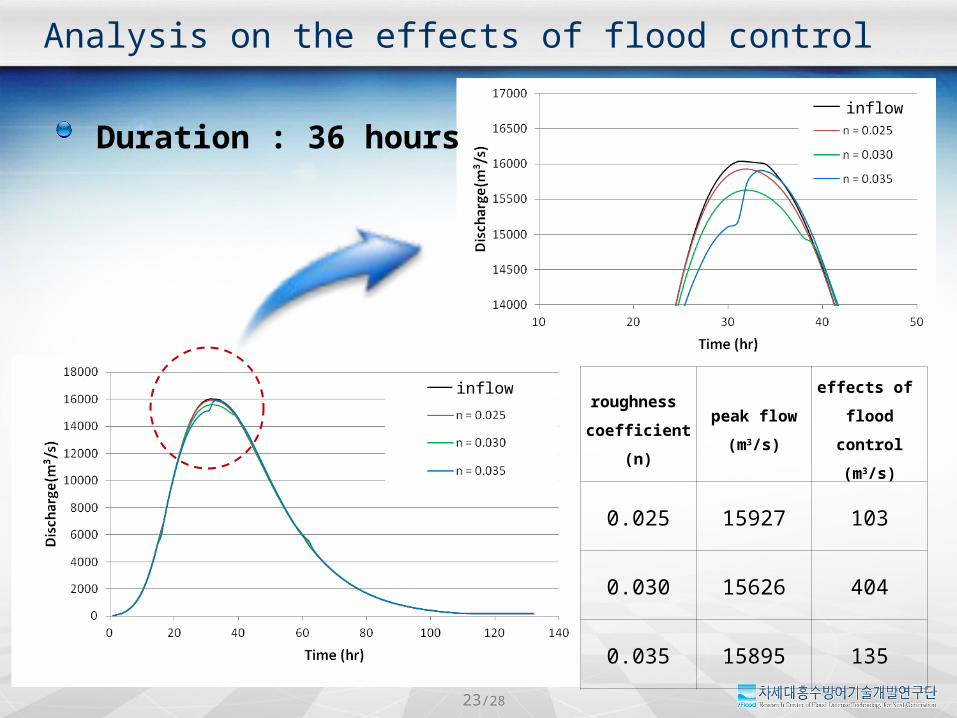
Analysis on the effects of flood control
roughness
coefficient
(n)
peak flow
(m3/s)
effects of
flood control
(m3/s)
0.025 15927 103
0.030 15626 404
0.035 15895 135
Duration : 36 hoursinflow
inflow

24/28
Analysis on the effects of flood control
roughness
coefficient
(n)
peak flow
(m3/s)
effects of
flood control
(m3/s)
0.025 15926 104
0.030 15625 404
0.035 15909 121
Duration : 48 hoursinflow
inflow

25/28
Analysis on the effects of flood control
roughness
coefficient
(n)
peak flow
(m3/s)
effects of
flood control
(m3/s)
0.025 15922 108
0.030 15622 408
0.035 15945 84
Duration : 60 hoursinflow
inflow

26/28
Analysis on the effects of flood control
roughness
coefficient
(n)
peak flow
(m3/s)
effects of
flood control
(m3/s)
0.025 15925 105
0.030 15626 404
0.035 15985 45
Duration : 72 hoursinflow
inflow

27/28
Analysis on the effects of flood control
duration
(hour)
roughness
coefficient
(n)
peak flow of inflow
hydrograph
(m3/s)
effects of
flood control
(m3/s)
rate
(%)
24
0.025
16030
107.25 0.66
0.030 393.29 2.45
0.035 286.15 1.78
360.025
16030
102.79 0.64
0.030 403.94 2.520.035 137.45 0.85
480.025
16030
102.56 0.64
0.030 404.41 2.520.035 122.63 0.76
600.025
16030
107.06 0.66
0.030 405.92 2.530.035 81.32 0.50
72
0.025
16030
104.18 0.64
0.030 401.58 2.50
0.035 46.34 0.28
Results analysis

28/28
Conclusion
Analysis on the effects of flood control for side-weir detention basin should consider the prediction uncertainty of water level and hydrograph.
The effects of flood control are analyzed for possible roughness coefficients to remove the uncertainty of prediction of the water level.
The effects of flood control are analyzed for various hydrograph considering a possible rainfall characteristics to remove the uncertainty of the hydrograph.
Because the Yeoju detention basin is located at the mid-stream of the Han River basin, its flood mitigation effects reveals relatively low under the condition of disregarding control gate. However, if we can consider the control gate, we can expect much higher mitigation effects by controlling secondary peak.