Embed Size (px)
Citation preview

2010 Tokyo AnalystM ti P t tiMeeting Presentation
Slides
September 13, 2010September 13, 2010
For more information contact:Ken Janke Jr. or
Robin Wilkeyy800.235.2667, Option 3
Fax: 706.324.6330aflac.com
Aflac Worldwide Headquarters1932 Wynnton RoadyColumbus, GA 31999

ABOUT AFLAC
When a policyholder gets sick or hurt, Aflac pays cash benefits fast. For 55 years, Aflac insurance policies have given policyholders the opportunity to focus on recovery, not financial stress. In the United States, Aflac is the number one provider of guaranteed-renewable insurance. In Japan, Aflac is the number one insurance company in terms of individual insurance policies in force. Aflac insurance products provide protection to more than 50 million people worldwide. For four consecutive years, Aflac has been recognized by Ethisphere magazine as one of the World's Most Ethical Companies, and Forbes magazine named Aflac as America's Best-Managed Company in the Insurance category. In 2010, Fortune magazine recognized Aflac as one of the 100 Best Companies to Work For in America for the twelfth consecutive year and also included Aflac on its list of Most Admired Companies for the ninth time. Aflac Incorporated is a Fortune 500 company listed on the New York Stock Exchange under the symbol AFL. To find out more about Aflac, visit aflac.com.
FORWARD-LOOKING INFORMATION
The Private Securities Litigation Reform Act of 1995 provides a “safe harbor” to encourage companies to provide prospective information, so long as those informational statements are identified as forward-looking and are accompanied by meaningful cautionary statements identifying important factors that could cause actual results to differ materially from those included in the forward-looking statements. We desire to take advantage of these provisions. This document contains cautionary statements identifying important factors that could cause actual results to differ materially from those projected herein, and in any other statements made by Company officials in communications with the financial community and contained in documents filed with the Securities and Exchange Commission (SEC).
Forward-looking statements are not based on historical information and relate to future operations, strategies, financial results or other developments. Furthermore, forward-looking information is subject to numerous assumptions, risks and uncertainties. In particular, statements containing words such as “expect,” “anticipate,” “believe,” “goal,” “objective,” “may,” “should,” “estimate,” “intends,” “projects,” “will,” “assumes,” “potential,” “target” or similar words as well as specific projections of future results, generally qualify as forward-looking. Aflac undertakes no obligation to update such forward-looking statements. We caution readers that the following factors, in addition to other factors mentioned from time to time, could cause actual results to differ materially from those contemplated by the forward-looking statements: difficult conditions in global capital markets and the economy; governmental actions for the purpose of stabilizing the financial markets; defaults and downgrades in certain securities in our investment portfolio; impairment of financial institutions; credit and other risks associated with Aflac’s investment in perpetual securities; differing judgments applied to investment valuations; subjective determinations of amount of impairments taken on our investments; limited availability of acceptable yen-denominated investments; concentration of our investments in any particular sector; concentration of business in Japan; ongoing changes in our industry; exposure to significant financial and capital markets risk; fluctuations in foreign currency exchange rates; significant changes in investment yield rates; deviations in actual experience from pricing and reserving assumptions; subsidiaries’ ability to pay dividends to Aflac Incorporated (the Parent Company); changes in law or regulation by governmental authorities; ability to attract and retain qualified sales associates and employees; decreases in our financial strength or debt ratings; ability to continue to develop and implement improvements in information technology systems; changes in U.S. and/or Japanese accounting standards; failure to comply with restrictions on patient privacy and information security; level and outcome of litigation; ability to effectively manage key executive succession; catastrophic events; and failure of internal controls or corporate governance policies and procedures.

1
Introduction to Aflac JapanTohru TonoikePresident Chief Operating OfficerPresident, Chief Operating Officer Aflac Japan
Life Insurance Policies in Force (FSA Basis, In Millions)
100
120
140
First sector Third sector
109.3 109.6 109.8110.0 110.0 113.0 117.1
Source: Life Insurance Association of Japan
0
20
40
60
80
3/04 3/05 3/06 3/07 3/08 3/09 3/10
20.3
The Number One Life Insurer in Japan(Policies in Force, FSA Basis, In Millions)
12
14
16
18
20 Aflac = No. 1
0
2
4
6
8
10
3/75 3/80 3/85 3/90 3/95 3/00 3/103/05

2
Third Sector Contribution to Life Insurance Industry New Policy Sales(FSA Basis, In Thousands)
8,000
10,000
12,000
14,000
Life industryThird sector
Source: Life Insurance Association of Japan, Insurance Research Institute
0
2,000
4,000
6,000
2002 2003 2004 2005 2006 2007 2008 200944.2% 47.7% 44.9%47.4%41.4% 40.3% 41.7%34.3%
% Third Sector
Japan’s Aging Population andDeclining Fertility Rate(In Thousands)
80,000
100,000
120,000
140,000 Actual Estimate
0
20,000
40,000
60,000
1950 1960 1970 1980 1990 2000 2010 2020 2030 2040 2050
Juvenile (0-14) Productive (15-64) Retirement (65+)
Source: National Institute of Population and Social Security Research, Future Estimated Population of Japan, 12/06
National Medical Expenses(Yen in Trillions)
10
12
14
60
70
80
90
100
Medical expenses For elderly National medical expenses to national income
%¥
¥698.9%
9.9%
13.2%
0
2
4
6
8
0
10
20
30
40
50
60
2007 2010 2025
Source: Ministry of Health, Labor and Welfare, 7/08
¥33¥41

3
Competitors in the Third Sector(Number of Life and Non-life Insurance Companies)
30
40
50
37
33
40
30
43
31
44
30
46
31
4747
3129
27
46
25
45
25
48
0
10
20
12/01 12/02 12/03 12/04 12/05 12/06 12/07 12/08 4/09 6/10
Stand-alone cancer Stand-alone medical
Reflects results of company mergers and companies that have discontinued sales Source: Web sites of each company
2525
21.3 21.5 21.7 22.8 23.5
60
80
100
Market Growth Market Share
Aflac’s Share of In-Force Business: Cancer(FSA Basis, Stand-alone, Life Industry Only)
%
(Policies in Thousands)
18,500
19,000
0
20
40
60
3/06 3/07 3/08 3/09 3/10
Aflac Others
17,000
17,500
18,000
3/06 3/07 3/08 3/09 3/10
Source: Insurance Research Institute,
Life Insurance Association of Japan
Aflac’s Share of New Business: Cancer(FSA Basis, Stand-alone, Life Industry Only)
60
80
100
1 000
1,200
1,400
1,600
Market Growth Market Share
%
(Policies in Thousands)
Source: Insurance Research Institute,Life Insurance Association of Japan
0
20
40
60
3/06 3/07 3/08 3/09 3/10
Aflac Others
0
200
400
600
800
1,000
3/06 3/07 3/08 3/09 3/10

4
80
100
Market Growth Market Share
Aflac’s Share of In-Force Business: Medical(FSA Basis, Stand-alone, Life Industry Only)
%
(Policies in Thousands)
20,000
22,000
24,000
0
20
40
60
3/06 3/07 3/08 3/09 3/10
Aflac Others
10,000
12,000
14,000
16,000
18,000
3/06 3/07 3/08 3/09 3/10
Source: Insurance Research Institute,Life Insurance Association of Japan
Aflac’s Share of New Business: Medical(FSA Basis, Stand-alone, Life Industry Only)
60
80
100
Market Growth Market Share
%
(Policies in Thousands)
2,500
3,000
3,500
0
20
40
60
3/06 3/07 3/08 3/09 3/10
Aflac Others
0
500
1,000
1,500
2,000
3/06 3/07 3/08 3/09 3/10
Source: Insurance Research Institute,
Life Insurance Association of Japan
Insurance Product Penetration (Individual Basis)
60
80
100 %
77.7 77.979.9
73.069.3
71.3
0
20
40
2001 2004 2007
Life insurance Medical insurance Cancer insurance
Source: Japan Institute of Life Insurance
21.225.3
31.2

5
Economic IndicatorsComposite Indexes (2005=100)
85
90
95
100
105
Source: Cabinet OfficeThe periods indicated in light blue show economic expansion period
70
75
80
1/02 1/03 1/04 1/05 1/06 1/07 1/08 1/09 1/10
Leading Indicator Coincident Indicator
Aflac Japan’s Competitive Strengths
Products
Distribution
Internal Controls
Administrative Efficiency
Financial Strength
Midterm Management Policy
Midterm
Midterm Management Policy(2011-2013)
Company that gains confidence of all the stakeholders as an insurer that exists to “Support Your Way of Life”
Management Policy
(2008-2010)
Build a “Strong management base”
Establish a system that enables timely provision of products and services that contribute to customers’ high satisfaction and stable growth of new businesses and profits.

6
Aflac Japan Marketing and SalesKoji AriyoshiFirst Senior Vice President;First Senior Vice President;Director of Marketing and SalesAflac Japan
Aflac Japan’s Product Line
1st Sector 3rd Sector
Children Child Endowment
Young
Middle
Senior
Ordinary Life
Cancer Medical

7
Aflac Japan’s Product Mix
60
80
100 Others
Child Endowment
Life Insurance
%
0
20
40
1992 2000 6/2010
Medical
Rider Max
Cancer
New Business in Policies(FSA Basis, Policies in Thousands )
Nippon
Sumitomo
Aflac
1,400
1,600
1,800
Dai-ichiSumitomo
Alico
*Excludes Kampo
600
800
1,000
1,200
3/05 3/06 3/07 3/08 3/09 3/10
Meiji-Yasuda
Individual Policies in Force(FSA Basis, Policies in Thousands)
15,000
20,000
25,000
D i i hi
Nippon
Aflac
*Excludes Kampo
0
5,000
10,000
3/05 3/06 3/07 3/08 3/09 3/10
Dai-ichi
Alico
SumitomoMeiji-Yasuda

8
Consumers’ Brand Association with Cancer Insurance(Unaided Recognition Ratio)
40
50
60 Aflac Alico Nippon%
0
10
20
30
12/05 07/06 12/06 8/07 12/07 8/08 1/09 6/09 12/09 6/10
Source: Dentsu and Nippon Research Center
Consumers’ Brand Association with Medical Insurance(Unaided Recognition Ratio)
40
50
60 Aflac Alico Nippon%
Source: Dentsu and Nippon Research Center
0
10
20
30
12/05 7/06 12/06 8/07 12/07 8/08 1/09 6/09 12/09 6/10
MedicalCancer
The Most Preferred Insurer forCancer and Medical Insurance
Aflac30
3431
29
8/10 4/10 12/09 8/09
Aflac13
201617
8/10 4/10 12/09 8/09
% %0 10 20 30 40
Nippon
Alico
5
3
8
7
6
6
5
8
0 5 10 15 20
Nippon
Alico
8
5
9
5
7
6
7
7
Source: Macromill, Inc., 8/09, 12/09, 4/10, 8/10
9
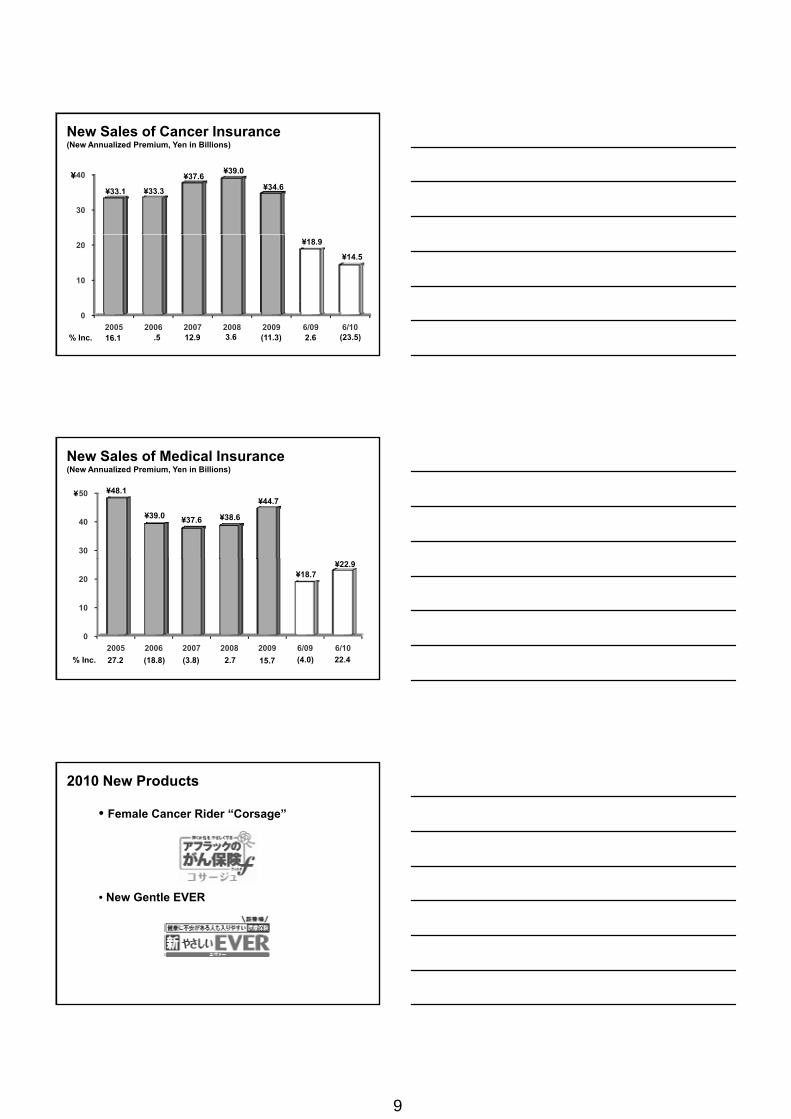
New Sales of Cancer Insurance(New Annualized Premium, Yen in Billions)
30
40 ¥
¥33.3
¥37.6¥39.0
¥34.6¥33.1
0
10
20
2005 2006 2007 2008 2009 6/09 6/10% Inc. 12.9.5 3.6 2.6
¥18.9
(11.3) (23.5)
¥14.5
16.1
New Sales of Medical Insurance(New Annualized Premium, Yen in Billions)
30
40
50 ¥
¥39.0 ¥37.6 ¥38.6
¥44.7¥48.1
0
10
20
2005 2006 2007 2008 2009 6/09 6/10
% Inc. (3.8)(18.8) 2.7 15.7 (4.0)
¥18.7
22.4
¥22.9
27.2
2010 New Products
• Female Cancer Rider “Corsage”
• New Gentle EVER

10
New Sales of Life Insurance(New Annualized Premium, Yen in Billions)
30
40 Child endowment Others
¥
¥27.5¥25.6 ¥26.2
¥35.0
¥23.3¥23.5
0
10
20
2005 2006 2007 2008 2009 6/09 6/10
% Inc. (6.9) 2.6 33.9 21.7
¥15.4
17.0 51.42.6
Number of Agencies by Type
19,782
15,000
20,000Bank
Independent/Individual
Affiliated
0
5,000
10,000
1998 1999 2000 2001 2002 2003 2004 2005 2006 2007 2008 2009 6/10
No. of companies listed on the Tokyo Stock Exchange: 2,334
Worksite Marketing
89%

11
30
40
3331
34
27
32
27
34
26
8/09 12/09 4/10 8/10
Communication Preferences for Insurance Purchases
%
0
10
2017
8
17
10
18
9
16
9
On the Internet Sales at home Sales at agencies/shops
Sales at worksite
Source: Macromill, Inc., 8/09, 12/09, 4/10, 8/10
100
120
140 %
(In Billions)
¥99.8
Historical Transition of Sales Channels(New Annualized Premium Sales)
¥¥122.3
60
80
100
Bank
0
20
40
60
80
1992 2000 2009
¥68.4
0
20
40
60
1992 2000 2009
Dai-ichi
Individual/ independent
Affiliated corporate
CorporateMarketing
Retail MarketingBank Channel
Marketing
Aflac Japan Sales Organization
Director of Marketing and Sales
11 corporatesales offices
Affiliated corporate
agencies in Tokyo, Osaka,
Nagoya district
61 retailsales offices
Independent,individual,
other affiliatedcorporate,Dai-ichi,
Japan Post
11 financial Institution
sales offices
Bank

12
3,000
4,000
5,000
Recruitment of New Agencies
3,4633,195
4,651
3,944
2,413 2,499
4,388
0
1,000
2,000
2005 2006 2007 2008 2009 6/09 6/10% Inc. (7.7) 23.4 17.9 14.4(21.0) 3.55.4
Aflac’s Support for New Agencies - Training
• New Associates Basic Training
• Light Consulting Training
Aflac’s Support for New Agencies -Incentives
• Advanced commissions
• Rookie Challenge Bonus
• e-App incentives

13
1,500
2,000
2,500
Growth of Newly Recruited Producing Agencies*
1,580
2,008
1,715
2,449
1,970
0
500
1,000
2005 2006 2007 2008 2009
*Three months after registered as an agency
% Inc. (19.7) 8.5 17.0 22.04.0
92.3% 80.3%
Public Recognition of Aflac Characters
Question: Do you recognize them as an Aflac character?
Aflac Duck Maneki Neko Duck
TV Commercials
• Female Cancer Rider “Corsage”
• New Gentle EVER

14
TV Commercials
Female Cancer Rider “Corsage”
TV Commercials
New Gentle EVER
80
100
120
140¥
Aflac Japan New Annualized Premium Sales(Yen in Billions)
¥117.4 ¥114.6 ¥114.6¥122.3
¥64 1
¥128.7
0
20
40
60
2005 2006 2007 2008 2009 6/09 6/10% Inc. (8.8) (2.4) - 6.7 2.3 11.4
¥57.6¥64.1
5.1

15
The Operations of an AffiliatedCorporate AgencyYoshinori YunokiPresidentPresident, Aeon Insurance Service Co., Ltd.
Company Overview
Founded in 2008
425 employees
Annual sales of ¥3.9 billion (2009)
Target markets:
Customers visiting our insurance shops
Cardholders of Aeon Card
Employees of the Aeon Group
Other Aeon Group companies

16
Share of Aflac Business in Our Life Insurance Business
61%Aflac61%
Others
400
500
600
700
¥549
¥668
¥478
New Annualized Premium Sales(Yen in Millions)
¥
0
100
200
300
400
2008 2009 2009 2010
¥263
(Jan.-Jun.)(Jan.-Jun.)
Premium Income(Yen in Billions)
5
6
7 ¥6.0 ¥6.2¥
0
1
2
3
4
2008 2009

17
Commissions from Aflac(Yen in Millions)
600
700
800
900
¥857 ¥837
¥
0
100
200
300
400
500
600
2008 2009
Aflac in Our View
Solid brand
Appealing products
Good service
Strong support for sales activities
Sales Approach
Insurance shops

18
Sales Approach
Insurance shops
Worksite sales within the Aeon Group
Sales Approach
Insurance shops
Worksite sales within the Aeon Group
Internet and direct mailing
Typical Insurance Shop

19
The Operations of an Independent Corporate AgencyMikio YoshizawaMikio YoshizawaPresident; Representative Director,Miki Business Corporation
Location of the Miki Business Corporation
Saitama City, Saitama Pref.

20
Company Overview
Founded in July 1982
More than 70,000 policies in force
46 employees (including 37 salespeople)
Premium Income(Yen in Millions)
2,000
2,500
3,000
¥1,890 ¥2,060
¥2,288¥2,446
¥2,586¥
% Inc. 6.9 5.710.1 9.0 11.1
0
500
1,000
1,500
2005 2006 2007 2008 2009
Commissions from Aflac(Yen in Millions)
300
350
400
450
¥320 ¥328¥355
¥382¥407
¥
% Inc. 7.6 6.78.6 2.6 8.3
0
50
100
150
200
250
2005 2006 2007 2008 2009

21
Changes in Consumers’ Needs
Coverage: From first to third sector products
Increasing needs for reviewing
existing coverage
Sales approach: More customers prefer
face-to-face consultation
Only face-to-face sales
Aflac’s Strengths
Strong brand
Excellent products:
» Competitive medical, cancer and other
insurance policies
High-quality customer service:
» Good response to claims payments
New Sales of Cancer Insurance(Yen in Millions)
120
140
160
180
¥88.6
¥126.6
¥168.4¥
% Inc. 51.5 34.6(21.3) 10.3 95.6
0
20
40
60
80
100
2005 2006 2007 2008 2009
¥36.9 ¥40.7
¥88.6

22
New Annualized Premium Sales(Yen in Millions)
300
350
400
450
500
¥321 ¥313¥342
¥371
¥439¥
% Inc. 8.5 18.1(1.1) (3.5) 9.4
0
50
100
150
200
250
2005 2006 2007 2008 2009
Main Markets and Sales Approach
Markets: Prefectural government,
Public offices (city hall, etc.),
Hojinkai (small businesses such as
restaurants and repair garages)
Sales approach: Face-to-face sales
Efforts on Development of Human Resources
Focus on training employees
Fair and transparent personnel policy
Implementing benefits program
Results in high productivity of sales persons

23
Productivity of Producing Salespeople(Yen in Millions)
10
12
14
¥9.39 ¥9.06¥9.85
¥
0
2
4
6
8
2007 2008 2009
Future Strategies
Continue to focus on third sector products
Respond to needs for policy reviewing
Enhance development of human resources
Pursue new sales approaches

24
Aflac Japan Bank Channel SalesHisayuki ShinkaiHisayuki ShinkaiFirst Senior Vice President,Financial InstitutionsAflac Japan
History of Bank Channel Deregulation
December 1998 Investment trusts first offered
April 2001 Long-term fire insurance related to housing loans, etc.
October 2002 Individual annuity, accident insurance with annuity, etc.insurance with annuity, etc.
December 2005 Single premium whole-life, single-premium endowment insurance, etc.
December 2007 All remaining insurance products
Financial Institutions in Japan(June 30, 2010)
Mega banks 4 2,192 548 86,431 21,608
Major banks 7 451 64 26,868 3,838
No. of Institutions Total
Avg. per Institution Total
Avg. per Institution
No. of Branches No. of Employees
Regional banks 105 10,638 101 181,068 1,724
Shinkin banks 272 7,618 28 115,569 425
Other banks* 14 325 23 5,555 397
Total 402 21,224 53 415,491 1,034
*Includes Citibank Japan, Seven Bank, e-Bank, Jibun Bank, Aeon Bankand nine credit associations.

25
Reasons for Banks' Compatibility with Insurance Sales
• Consumers have strong comfort level with banks
• Consumers have strong level of familiarity and
confidence with banksconfidence with banks
• Many regional and Shinkin banks sell door-to-door
Considerations for Insurer Selection
• Company with products that will drive sales
• Brand recognition of insurer
• Easy-to-explain products
• Commission levelCommission level
• Sales support and training
Aflac's Extensive Reach Within the Bank Channel(June 30, 2010)
Mega banks 4 4 100 100 100
Major banks 7 3 43 53 45
Regional banks 105 95 90 93 93
TotalAflac
Agencies
CoverageNo. of Banks
No. ofBanks
No. ofEmployees
No. ofBranches
% % %
Regional banks 105 95 90 93 93
Shinkin banks 272 239 88 89 90
Other banks* 14 13 93 98 94
Total 402 354 88 91 90
*Includes Citibank Japan, Seven Bank, e-Bank, Jibun Bank, Aeon Bankand nine credit associations
% % %

26
The Shinkin Industry
Insurance companies
National Association of Shinkin Banks
Selection
• Sales policy• Recommendation of products
Application for selection
companies
272 Shinkin banksnationwide
7,700 branches
Recommendation of products• Administration system
Contracts
Regulatory Restrictions Related to Bank Sales
• Bank cannot make insurance sales a lending condition and certain limits for coverage amount are imposed.
• Restrictions may be loosened after three-year FSA it i i dFSA monitoring period
Aflac Bank Channel Sales(Annualized Premium Basis, In Millions of Yen)
2,500
3,000
3,500
4,000
¥2,178
¥2,904¥3,094
¥¥3,897
0
500
1,000
1,500
2,000
1Q/08 2Q/08 3Q/08 4Q/08 1Q/09 2Q/09 3Q/09 4Q/09 1Q/10 2Q/10
¥276
¥680
¥1,311
¥959 ¥1,009
¥1,403

27
Aflac Sales Contribution by Type of Bank(Annualized Premium Basis)
60%
70%
80%
90%
100%
Mega banks Regional banks Shinkin banks Other
0%
10%
20%
30%
40%
50%
1Q/08 2Q08 3Q/08 4Q/08 1Q/09 2Q/09 3Q/09 4Q/09 1Q/10 2Q/10
25,000
30,000
35,000
40,000 Cancer EVER Sanjuso WAYS Child Annuity
No. of Policies Sold
Policy Sales by Product
24,35527,229
36,70734,533
36,418
0
5,000
10,000
15,000
20,000
,
1Q/08 2Q/08 3Q/08 4Q/08 1Q/09 2Q/09 3Q/09 4Q/09 1Q/10 2Q/10
5,075
12,635
17,49016,205
21,649
Sales Activity at the Branch Level
Mega banks 30.6% 14.3%
Regional banks 17.4 9.7
Percentage of Branches Selling
Six or MorePolicies
Percentage of Branches Selling Twelve or More
Policies
g
Shinkin banks 28.6 17.0
Avg. for bank branches 23.0% 12.9%

28
Number of Banks Offering Aflac Products
Cancer 227 271 274
EVER 180 215 223
Gentle EVER 24 43 50
WAYS 9 22 29
12/31/08 6/30/103/31/10Products
No. of Banks
WAYS 9 22 29
Sanjuso 6 32 32
Child endowment 133 207
Annuity 89 89 92
Total 535 805 907
Average per bank 1.6 2.3 2.6
Strategy for Bank Sales in Fourth Quarter and 2011
• Focus on increasing sales at existing banks
• Promote adoption of multiple products
• Leverage government initiatives
» Child subsidies» Child subsidies
» Cancer screening and education
• Strategic promotion of WAYS

29
Insurance Sales at Resona BankMasahito KumakuraChief ManagerChief Manager,Consumer Banking Division,Resona Bank, Ltd.
Overview of Resona Holdings
Consists of three banks» Resona Bank» Saitama Resona» Kinki Osaka Bank
Total assets (March 2010)Total assets (March 2010)» ¥41 trillion → 4th largest banking group in Japan
No. of branches (March 2010)» 576 – on a par with other three major banking
groups in Japan » Concentrated in Tokyo and Osaka areas
Strengthening Trust Banking Function
Resona Holdings
SaitamaResona
ResonaResona
TrustKinki
Osaka+
Resona Bank
» Offer trust banking services» Support customers’ life plan

30
Next Generation Sales Outlets• Branch renewal initiatives
Eliminating inefficiencies in the branch
Goal
・ administrative costReduce ・ administrative space by half
・ administrative personnel
Double the space for sales activities
Next Generation Sales Outlets
Quick Navi Consulting Booths
General Reception Counter
Call Center
• 220 operator booths• 2 million inbound and 600,000 outbound calls a year

31
Collaboration Between Channels
Customers
Branch Call Center InternetATM
Customer Relations Management System
Branch Call CenterBanking ATM
Next generationsales outlet
Call centerIzumo City
Convenience for customers
No withdrawal fee during
closed times
Products – Reflecting Customers’ Feedback
Credit Agricole Asset ManagementAsia Fund Series
Dai-ichi Frontier LifeAnshin Series (Individual annuity)
Products – Preparing for Life Events
Risks Aflac Products
• Illness
• Nursing
• New EVER• Cancer Forte
Aflac Products
WAYSNursing
• Post retirement
• Death
(Ippo, Ippo)
32
1,200
1,400
1,600
1,800
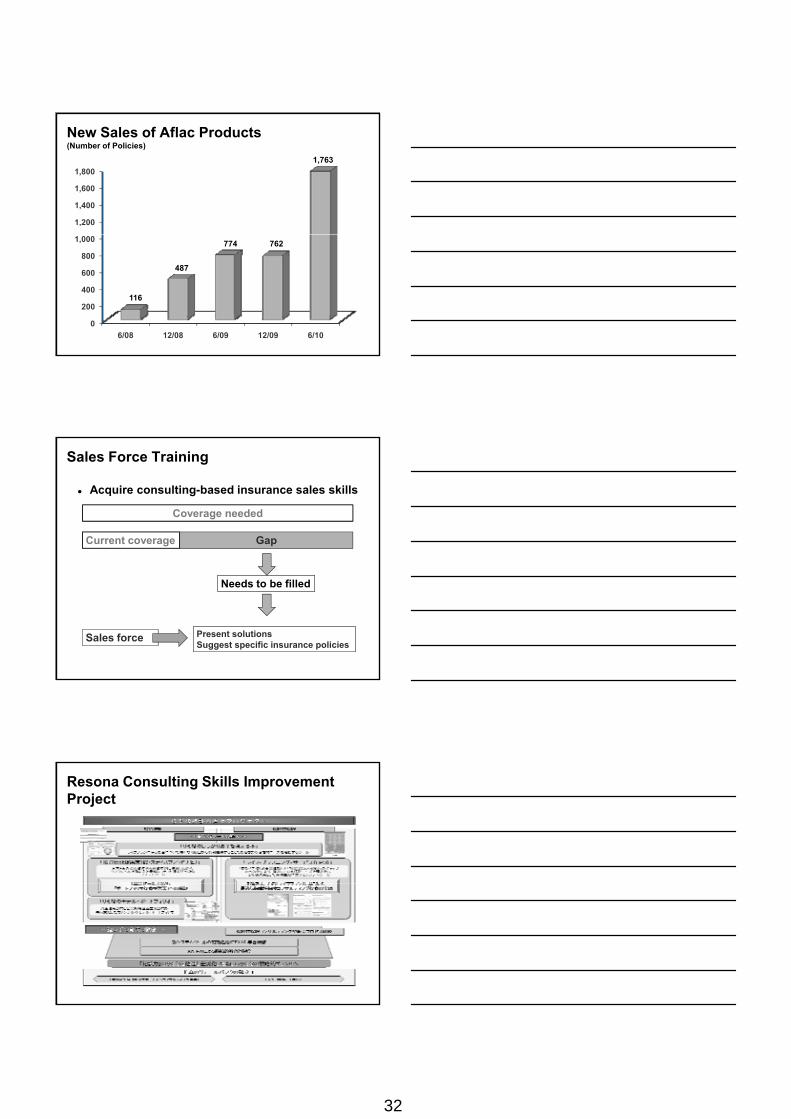
New Sales of Aflac Products(Number of Policies)
1,763
0
200
400
600
800
1,000
6/08 12/08 6/09 12/09 6/10
116
487
774 762
Sales Force Training
Acquire consulting-based insurance sales skills
Coverage needed
Current coverage Gap
Sales force Present solutionsSuggest specific insurance policies
Needs to be filled
Resona Consulting Skills Improvement Project

33
Support Customers’ Life Planning
Large
Potential of Financial Business
• Inheritance• Single premium
whole-life insurance• Saving type of product
Protection type of insurance products
Employment Marriage/Childbirth Home/Education Retirement Inheritance
Life Stage
Mortgage loans
The No.1 Bank for Women
150 frontline female employees voluntarily take part
Discuss products they really want to purchase
Come up with tools or leaflets to convey that message
to customers
The Power of Mine Project
Activities to improve cancer screening rate
Remain committed to CSR activities at Resona Bank
through various initiatives
Establishing our brand

34

35
Japan’s Public Policy and Regulatory EnvironmentCharles D. Lake IIChairman Aflac Japan
The Japanese Government
• Constitutional monarchy with parliamentary government
• Bicameral parliament
» House of Representatives (“Lower House”)
» House of Councillors (“Upper House”)
• Executive power vested in a cabinet composed of a prime minister and ministers of state (all civilians)
• Prime minister must be member of parliament and is chosen by peers
LDP116
members DPJ307
members
House of Representatives (Lower House)
• 480 members elected for four-year terms
• The prime minister can dissolve the Lower House and call for an
People's New Party (4)Japan Communist Party (9)New Komeito (21)
Your Party (5)
LDP (116)
DPJ (307) Social Democratic Party (6)Other (12)
election at any time
• Can override Upper House decisions with a 2/3 majority vote

36
LDP83
members DPJ106
members
House of Councillors (Upper House)
• 242 members elected for six-year terms
• Elections held every three
People's New Party (3)Japan Communist Party (6)New Komeito (19)
Your Party (11)
LDP (83)
DPJ (106) Social Democratic Party (4)Other (10)
yyears, for 1/2 of seats
Control of the Government
• The Lower House is the key to gaining control of Japan’s government.
• A bill passed by the Lower House, but voted down by the Upper House, can be overridden by the Lower House with a two-thirds vote.
• In the case of disagreements over treaties, the budget, and the selection of the prime minister, the Lower House decision becomes the will of the Diet.
• The president of the majority party generally serves as prime minister.
Political Parties and Coalitions
• Japan’s political parties often form partnerships, or coalitions, with other parties.
• The DPJ currently has a coalition with the People’s New Party.
• New Party Nippon
• New Reform Party
• People’s New Party
• Social Democratic Party
• Sunrise Party
• Your Party
• Democratic Party of Japan
• Japan Communist Party
• Liberal Democratic Party
• New Komeito
Japan’s Political Parties Include:

37
Historic Change of Government
• The Democratic Party of Japan (DPJ) wins historic election in September 2009 and establishes first real non-Liberal Democratic Party (LDP) administration in post-war period.
• The DPJ is attempting to consolidate policymaking and governmental control within the Cabinet, which has
t ib t d t di i li kicontributed to disarray in policymaking process.
• Major DPJ defeat in July 2010 election leads to “twisted,”or divided, Diet, where the DPJ controls the Lower House, but not the Upper House.
• Governance, innovation, and reform continue to take place in Japan.
Goals of New Government Growth Strategy (June 2010)
• Increase nominal growth rate to higher than 3% and real growth rate to higher than 2% by fiscal year 2020
• Reduce the unemployment rate to between 3.0% and 4.0%
• Create ¥50 trillion in environment- and energy-related
Source: Office of the Prime Minister
Create ¥50 trillion in environment and energy related markets and 1.4 million new green jobs
• Foster health industry growth to meet demand for medical, nursing care and other health-related services
• Realize a Free Trade Area of Asia-Pacific by 2020
• Increase tourism to 25 million people by start of 2020
Progress in Financial Regulatory Reform
MOF“Convoy system”
Rules based approach1998 - June 2007
Pre-1998
FSA
Rules-based approach
“Better Regulation” policy
(The best mix of principles-based regulation and rules-based regulation)
July 2007-

38
Regulatory Developments Pertaining to Japan’s Financial and Capital Markets
New Growth Strategy commits to establishing Japan as a major financial player in Asia and supporting financial sector’s role in promoting overall economic growth
» Improvements in markets and exchanges
» Reforms to legal infrastructure for financing
» Development of bond market for professional investors
» Expansion of English financial disclosure scope
Postal Reform Developments
12/4/09 IPO freeze legislation
3/24/10 Postal reform outline
4/30/10 Postal legislation submitted to Dietsubmitted to Diet
6/16/10 Diet session ends without postal legislation passing
120
160Welfare Medical Pension
Rapidly Increasing Social Security Benefits(Yen in Trillions)
¥
¥116¥105
¥89 1
¥141
0
40
80
FY 2006 FY 2011 FY 2015 FY 2025
¥89.1
(Actual)Source: Ministry of Health, Labor and Welfare

39
Major Changes in Copayments for the Employed and Elderly
• Japan’s health care system is under great financial strain
» Copayments are now 30% for salaried workers under 70 and high-income seniors
• Advanced Elderly Health system was introduced in 2008 to try to separate fees for advanced elderly from that of the younger population, but the DPJ is currently designing a replacement system
• Details of the new system are unknown, but the reforms should lead to enhanced consumer interest in Aflac’s core products
21.7%
Daily Out-of-Pocket Hospitalization Expenses
¥15,000 to ¥20,000
More than ¥20,000
13.0%
32.0%
14.3%
2004 2007
15.9%
11.8%
25.9%
Less than ¥5,000
¥5,000 to ¥7,000
¥7,000 to ¥10,000
¥10,000 to ¥15,000
11.6%
Source: Japan Institute of Life Insurance, 12/07
10.8%
7.3%
28.0%
7.5%
The Public’s View on the NationalHealth Care System
58 8
63.8
65.5
2001
2004
2007
Adequate Don't know Inadequate
Source: Japan Institute of Life Insurance, 12/07
41.2
55.0
60.1
58.8
0% 20% 40% 60% 80% 100%
1993
1996
1998
2001

40
Aflac Japan AdministrationJun IsonakaSenior Vice President;Senior Vice President;Chief Administrative OfficerAflac Japan
Maintenance Expenses Per Policy in Force(FSA Basis, 03/10)
CostPer Policy
General OperatingExpenses
(In Millions)Rank byAssets
Policiesin Force**
(In Thousands)
1 Nippon ¥260,401 11,775 ¥22,1142 Dai-ichi 201,196 10,970 18,3403 Meiji Yasuda 177,294 8,535 20,772
*Excludes renewal commissions**Excludes individual annuitiesSource: Disclosure statement from each company
j , , ,4 Sumitomo 166,891 8,459 19,7296 Alico 78,431 5,773 13,585 7 Aflac* 104,379 20,100 5,1928 Taiyo 52,100 4,430 11,760
13 Sony 38,214 4,954 7,71316 Tokio Anshin 37,448 2,738 13,677

41
Number of Policies Per Administrative Employee(FSA Basis, 03/10)
Administrative Employees
Rank byAssets
Policies perEmployee
Policiesin Force*
(In Thousands)
1 Nippon 14,242 11,775 826 2 Dai-ichi 13,570 10,970 8083 Meiji Yasuda 9 071 8 535 940
*Excludes individual annuitiesSource: Disclosure statement from each company
3 Meiji Yasuda 9,071 8,535 9404 Sumitomo 9,612 8,459 8806 Alico 4,533 5,773 1,273 7 Aflac 3,791 20,100 5,3028 Taiyo 3,013 4,430 1,470
13 Sony 1,318 4,954 3,75816 Tokio Anshin 1,531 2,738 1,788
Efficiency Improvement Measures by Leveraging IT
• AANET
• Aflac Net Billing
Aflac’s Inbound Call Centers
Aflac Call Center(Inquiries from existing policyholders)(Inquiries from prospective customers)
Associates Support Center(Inquiries from sales agencies)
Alliance Support Center(Inquiries from banks, Japan Post and Dai-ichi Life)
42
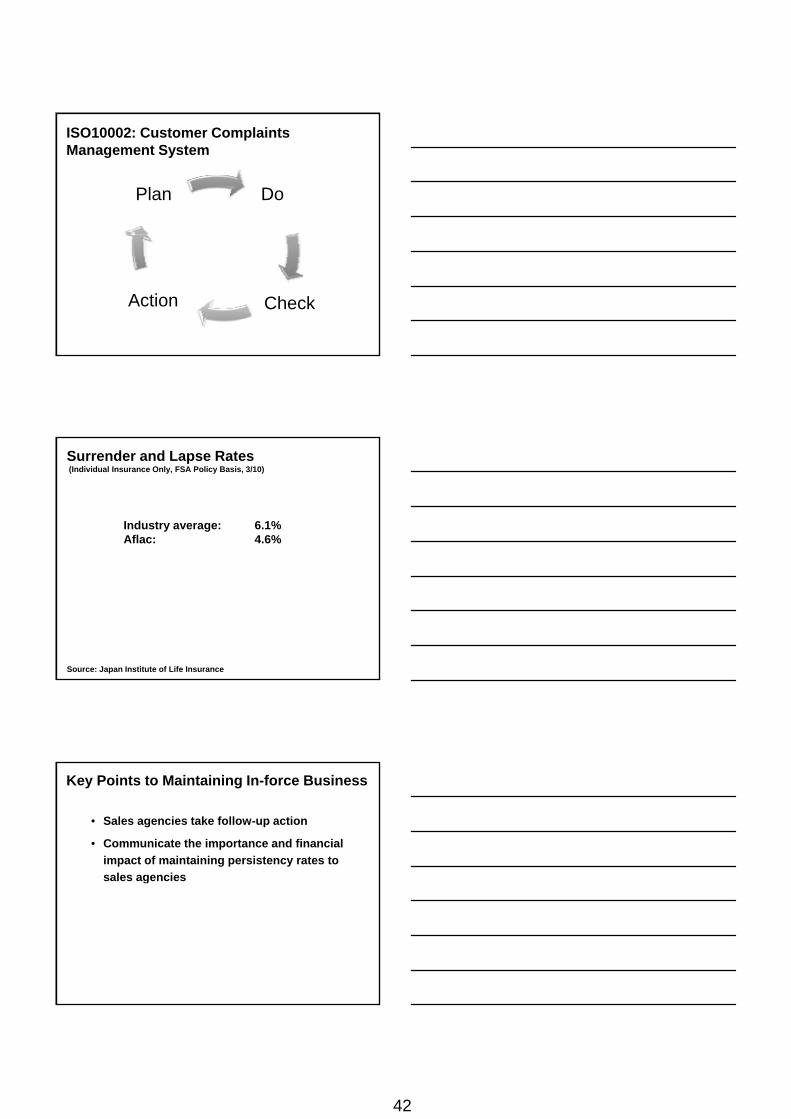
ISO10002: Customer Complaints Management System
DoPlan
CheckAction
Surrender and Lapse Rates (Individual Insurance Only, FSA Policy Basis, 3/10)
Industry average: 6.1%Aflac: 4.6%
Source: Japan Institute of Life Insurance
Key Points to Maintaining In-force Business
• Sales agencies take follow-up action
• Communicate the importance and financial
impact of maintaining persistency rates to
sales agencies

43
Claims Payments(Yen in Billions)
¥
300
400 Cancer Medical/Rider MAX
Source: Internal Aflac data
0
100
200
2000 2001 2002 2003 2004 2005 2006 2007 2008 2009
Aflac Japan InvestmentsHitoshi OdaVice President,Investment Department,Aflac Japan

44
Aflac Japan Investment Considerations
• Product needs - Japan
» Long liability durations
» Yen-denominated policy liabilities
• Credit risk
• Aflac Incorporated objectives
Aflac Japan’s Investment Portfolio(June 30, 2010, In Millions of Dollars)
Book Value % of Total
Yen-denominated $65,331 94.6%
Dollar-denominated 3,758 5.4
Total Aflac Japan $69,089 100.0%
$Fixed-maturity securities $60,350 87.4%
Perpetual securities 7,225 10.4
Securitized securities 1,492 2.2
Equity securities 22
Total Aflac Japan $69,089 100.0%
Officers 2 3
General managers 1 3
Staff/Managers:
3/2007 8/2010
Organizational Chart for Aflac Japan Investment Division
Investments 9 9
Risk management 4 12
Credit analysis 5 10
Investment accounting 10 12
Total number of employees 31 49

45
Process of Privately Issued Yen Purchases
• Ideas sourced from investment banks
• Rules of engagement
• Credit analysis
• Documentation
• Negotiation
• Pricing
Investment Pricing Methods*
Level I (Active market feeds) 26% 28%
Level II (Model pricing, custodian feeds, broker quotes) 63 71
3/2010 6/2010
Level III (Best efforts) 11 1
Total 100% 100%
*Applies to available-for-sale securities only on a consolidated basis
2010 Investment Activities

46
Challenges
• Low interest rate
• Tight credit spread
• Swap and other costs
• Credit diversificationCredit diversification
• Overall market conditions
New Money Investments(In Billions of Yen)
JGBs ¥105.4 17.6%
Privately issued yen securities 381.6 63.6
Dollar bonds 31.9 5.3
Publicly traded bonds 26.7 4.5
Other 54.1 9.0
Total ¥599.7 100.0%
Amount % of Total2009
JGBs ¥120.7 42.8%
Privately issued yen securities 87.1 30.8
RDCs 40.0 14.2
Dollar bonds 16.6 5.9
Other 17.8 6.3
Total ¥282.2 100.0%
Amount % of Total6/30/10
U.S. Dollar Investments
• Interest rate differential
• Rated ‘A’ or better on average
• 7-10 years remaining to maturity
• Investment of $1 billion in third and fourth quarters of 2010

47
Tender/Exchange Offers and Other Disposals (6/30/10, In Billions of Yen)
Tenders ¥31.5 -30.5 +34.4
Exchanges 53.8 -25.6
AmountDecreasing
HybridsIncreasing
JGBs
Other disposals 42.7 +25.1
Total -56.1 +59.5
JGBs 14.7% 14.8% 15.2% 17.3%Financials 45.3 42.4 38.0 36.3Perpetuals 16.4 14.0 11.2 10.1
2008 2009 6/30/10
Changes in Aflac Japan Portfolio Composition(Percentage of Total Portfolio)
2007
pSecuritized assets 1.9 2.6 2.1 2.2
Comparison of Fixed Income Ratio(FSA Basis)
%
75
80
85
90
95
100 Industry Aflac Japan
Source: Life Insurance Association of Japan
50
55
60
65
70
75
89 90 91 92 93 94 95 96 97 98 99 00 01 02 03 04 05 06 07 08 09

48
Comparison of Yields(FSA Basis)
%
4
5
6
7
8 Industry Aflac Japan
Source: Life Insurance Association of Japan
0
1
2
3
4
91 92 93 94 95 96 97 98 99 00 01 02 03 04 05 06 07 08 09
Comparison of Interest Margin Ratio(FSA Basis)
%
0.0
0.5
1.0 Aflac Japan Nine Domestic Insurers
Source: Press reports and company disclosure statements
-1.5
-1.0
-0.5
2000 2001 2002 2003 2004 2005 2006 2007 2008
Net Investment Income (In Billions of Yen)
¥
150
200
250
¥180.2¥196.4
¥212.1 ¥211.4¥212.0
(.0)9.07.0% Inc. 8.0 0.1 2.7(.3)
0
50
100
2005 2006 2007 2008 2009 6/09 6/10
¥105.3 ¥108.1

49
Aflac Japan Financial Results Yuji Arai Senior Vice President;Senior Vice President;Principal Financial Officer,Aflac Japan
Comparison of Premium Income Growth(FSA Basis, 3/05 = 100)
100
125
150%
50
75
100
3/05 3/06 3/07 3/08 3/09 3/10
Aflac Life Industry
Source: Japan Institute of Life Insurance

50
Premium Income(FSA Basis, 3/10)
1 Nippon ¥4,817 (4.3) %2 Meiji Yasuda 3,281 22.23 Sumitomo 3,059 21.04 Dai-ichi 2,836 (2.3)
RankAmount
(In Billions)Company % Increase
, ( )5 Aflac 1,231 5.96 Alico 863 (21.2)7 Daido 860 6.0 8 Dai-ichi Frontier 805 119.6 9 Taiyo 714 19.6
10 Sony 698 5.7
Source: Disclosure statement from each company
Total Assets(FSA Basis, 3/10)
RankAmount
(In Billions)Company % Increase
1 Nippon ¥48,685 6.2%2 Dai-ichi 30,822 2.73 Meiji Yasuda 25,012 4.64 Sumitomo 23,018 1.85 Mit i 7 499 1 6
Source: Disclosure statement from each company
5 Mitsui 7,499 1.66 Alico 6,716 5.97 Aflac 6,414 8.08 Taiyo 5,842 1.29 Asahi 5,668 .6
10 Fukoku 5,613 1.8
Individual Policies in Force(FSA Basis, 3/10, Policies in Thousands)
1 Aflac 20,302 3.3%2 Nippon 14,714 (1.1)3 Dai-ichi 12,203 (.4)4 Sumitomo 11,076 .85 Meiji Yasuda 10 516 ( 8)
Rank No. of PoliciesCompany % Increase
5 Meiji Yasuda 10,516 (.8)6 Asahi 8,255 (1.2)7 Alico 6,548 1.98 Taiyo 5,656 21.29 Sony 5,010 6.4
10 AXA 4,017 7.7
Source: Disclosure statement from each company

51
Nippon 2.81% 2.67% ¥(60)Dai-ichi 2.89 2.56 (83)Meiji Yasuda 2.48 2.19 (59)Sumitomo 3.11 2.56 (91)
AssumedInterest Rate
Actual Investment Yield
Amount Gain/Loss
Investment Margin(FSA Basis, Yen in Billions)
Company
Source: Disclosure statement from each company* N/D: No disclosure is available
Mitsui 3.14 2.12 (59)Alico 4.44 4.65 N/D*Aflac 3.79 3.84 3Taiyo 2.66 2.42 (13)Asahi 3.85 2.18 (84)Fukoku 2.38 2.07 (15)
Other
Medical
Ordinary
Premiums in Force by Product
100%
80
60Ordinary
Care
Riders
Cancer
1992 1998 6/10
40
20
0
2007
Traditional cancer life - full CSV 68% - 73%
Cancer life - reduced CSV 63% - 68%
21st Century Cancer life - full CSV 55% - 60%
21st Century Cancer life - reduced CSV 50% - 55%
Cancer Forte full CSV 55% 60%
Expected Benefit Ratios by Product
Cancer Forte - full CSV 55% - 60%
Cancer Forte - reduced CSV 48% - 53%
Riders to cancer and medical 40% - 53%
Ordinary life products 60% - 75%
EVER 50% - 55%

52
Persistency Rates*
96
98
100%
94 093 994 094.594.794.794.7
90
92
94
2005 2006 2007 2008 2009 6/09 6/10
*All product lines, excluding annuities
94.093.994.0
Comparison of Persistency Rates(FSA Policy Basis)
95
100Aflac Industry
%
85
90
3/03 3/04 3/05 3/06 3/07 3/08 3/09 3/10
Source: Japan Institute of Life Insurance, Life Insurance Association of Japan
Operating Expense Ratio*(GAAP Basis)
20
25%
15
2005 2006 2007 2008 2009 6/09 6/10
*As percentage of total revenue

53
Solvency Margin, Real Net Asset, Basic Earnings(FSA Basis, 3/10)
Solvency margin 939.3%
Real net assets ¥501 billion
* Real Net Assets/Total Assets** Basic Earnings/Total Assets
Real net asset ratio* 7.8%
Basic earnings ¥158 billion
Basic earnings ratio** 2.46%
Financial Strength Ratings
S&PRating*
Rank byPoliciesin Force
1 Aflac AA- Aa22 Nippon AA- Aa33 Dai-ichi A A14 Sumitomo BBB+ A2
Moody’sRating*Company
4 Sumitomo BBB A25 Meiji Yasuda A- A16 Asahi BB- -7 Alico A+ A18 Taiyo A- A29 Sony A+ Aa3
10 AXA AA- -
* As of 8/31/10
Impact of Solvency Margin Calculation Revision
• Limitations on recognition of policy reserves, hybrid capital, etc.
• Risk factors to reflect greater volatility g y
• Solvency margin ratios to decline significantly
• New rule to take effect 3/31/12

54
Pretax Operating Earnings Growth(Yen in Billions)
2005 ¥1,146.1 × 14.5% = ¥166.4
2006 1,218.8 × 15.8 = 192.1
2007 1 279 0 × 16 8 214 7
TotalRevenues
ProfitMargin
PretaxOperatingEarnings
2007 1,279.0 × 16.8 = 214.7
2008 1,314.7 × 17.7 = 232.8
2009 1,353.7 × 19.3 = 261.7