Embed Size (px)
Citation preview

●Zamora
2010 PROCESSING TOMATO VARIETY TRIALS
Clarksburg
University of California Cooperative Extension 70 Cottonwood Street Woodland, CA 95695
(530) 666-8143
Trial
YOLO
SOLANO
●Woodland
●Esparto
●Winters
●Dixon

CONTRIBUTORS GROWER COOPERATOR: Special appreciation to our cooperating grower. Their generous donation of resources (management, land, labor and equipment) remains essential. STEVE MEEK AND JOHN PON, J.H. Meek and Sons, Woodland
FIELD ASSISTANCE: MARK KOCHI, Field Research Assistant, Yolo County
PROJECT COORDINATION: UC ADVISORS SCOTT STODDARD (PROJECT LEADER), BRENNA AEGERTER, MICHELLE LE
STRANGE, TOM TURINI AND JOE NUNEZ DIANE BARRETT & SAM MATOBA, Food Science and Technology Department, UCD TIM HARTZ, Vegetable Crops Specialist, UCD
FRUIT QUALITY EVALUATIONS: TOM RAMME, RICHARD MONTGOMERY AND CREW, Processing Tomato Advisory Board DIANE BARRETT, SAM MATOBA AND CREW, Food Science and Technology Department, UCD
TRANSPLANT SUPPORT: ANDY PON & DANIEL ACEVEDO, WESTSIDE TRANSPLANTS TIMOTHY, STEWART AND LEKOS SEED COMPANY, WOODLAND.
FUNDING SUPPORT: CHUCK RIVARA AND THE CALIF. TOMATO RESEARCH INSTITUTE SEED COMPANIES CALIFORNIA LEAGUE OF FOOD PROCESSORS (PROCESSING STUDY COMPONENT, #T-4)
STATISTICAL ANALYSIS FOR STATEWIDE REPORT: GAIL NISHIMOTO, Statistician SCOTT STODDARD, VARIETY PROJECT COORDINATOR FOR UC
BOOKLET COMPILATION: KATIE CHURCHILL, Secretary, Yolo County
Respectfully submitted,
Gene Miyao Farm Advisor, Yolo/Solano/Sacramento counties Dec 2010 105 copies
Cooperative Extension in Agriculture and Home Economics. US Department of Agriculture, University of California and Yolo County Cooperating.
To simplify information, when trade names of products have been used, no endorsement of named products is intended, nor criticism implied of similar products which are not mentioned. The University of California prohibits discrimination against or harassment of any person on the basis of race, color, national origin, religion, sex, physical condition (cancer-related or genetic characteristics), ancestry, marital status, age, sexual orientation, citizenship, or status as a covered veteran (special disabled veteran, Vietnam-era veteran or any other veteran who served on active duty during a war or in a campaign or expedition for which a campaign badge has been authorized). University Policy is intended to be consistent with the provisions of applicable State and Federal laws. Inquiries regarding the University's nondiscrimination policies may be directed to the Affirmative Action/Staff Personnel Services Director, University of California, Agriculture and Natural Resources., 1111 Franklin, 6th Floor, Oakland, CA 94607-5200. (510) 987-0096.

TABLE OF CONTENTS SUMMARY OF 2010 YOLO/SOLANO/SACRAMENTO COUNTY TRIALS 1-4 Table 1A. Mid-Maturity Variety Entries, Davis ..............................................................5 Table 1B. Disease Resistance Legend .............................................................................6 Table 2. Plot Specifications, Mid-Maturity, Davis/Woodland .....................................7 Table 3. Fruit Quality Factor Definitions .....................................................................8 REPLICATED, MID-MATURITY Table 4A. Yields, °Brix, color and defects at harvest ....................................................9 Table 4B. Stand, vine size, canopy and maturity ..........................................................10 OBSERVATIONAL, MID-MATURITY Table 5A. Yields, °Brix, color and defects at harvest ..................................................11 Table 5B. Stand, vine size, canopy and maturity ..........................................................11 STATEWIDE COMBINED- REPLICATED, MID-MATURITY Table 6A. Yield and Fruit Quality……………………………………..……………12 Table 6B. Yield by Location…………………………………………..……………13 ---------------------------------------------------------------------------------------------------------- Statewide compile variety report is located on the Internet at: http://vric.ucdavis.edu/
or as a pdf file as:
http://vric.ucdavis.edu/pdf/TOMATO/UCCE process tomato var trial10.pdf
This local report is electronically available at UCCE Yolo web site:
http://ceyolo.ucdavis.edu/Vegetable_Crops/Processing_Tomato_Variety_Trials/

UC Yolo-Solano-Sac 2010 Variety Report page 1
2010 Processing Tomato Variety Evaluation Trial Yolo/Solano/Sacramento Counties
by Gene Miyao, UC Farm Advisor, and Mark Kochi, Field Assistant, Yolo County
California tomato growers averaged over 45 tons per acre for a total of 12.3 million tons in 2010. Last year, 13.3 million tons were produced with an average yield of 43 tons per acre. The 2010 per-acre yield is a new record, while statewide production in 2009 remains the high-water mark.
Spring rains caused planting delays in 2010 as well as created severe incidence of bacterial speck in many local fields. From mid-March to May 28th, at our Woodland office, we measured over 4 inches of rainfall collected from 24 rainy days.
Temperatures were relatively mild over the growing season. The only incidences over 100°F were 2 days at the end of June, 6 days during July, 2 days in August and a day at the end of September, based on Woodland recordings. Heat-units were substantially below the norm from April to June and continued to be cooler in July and August as well. The region experienced almost a 30-day delay in harvest with low activity in July in our area from the combination of delays in planting, cooler springtime weather and setback with bacterial speck.
Were changes observed locally in pest pressure in the 2010 season? Tomato powdery mildew infestations were much less severe than in the past several years. Tomato spotted wilt virus continued to be widespread, but generally at low severity levels. Fusarium wilt continued to spread. Verticillium wilt remained an issue. A latent pathogen, Fusarium foot and crown rot, impacted several fields.
Variety Evaluation Trials The evaluation of varieties for local adaptation continued to be a part of the University of California farm advisor program. Our objective was to identify dependable, high yielding and high quality variety releases that can be grown over a wide geographic area under varying environmental conditions. The varieties were compared side-by-side in an experimentally sound-designed test within local counties in the Central Valley from Yolo to Kern. Tests were conducted in a similar fashion to compare local results with tests by UC farm advisors in other locations. All trials except Yolo were conducted in fields with buried drip irrigation systems. Entries: Varieties included in the trial were selected in consultation with processors and seed companies.
Sixteen replicated and 13 observational varieties were included in the field trial (table 1A). The comparative standard varieties were AB 2, H 9780 and Sun 6366. All mid entries except AB 2 have nematode resistance; and most varieties have bacterial speck
Heat Units: Historic vs. year 2010 Davis‐area weather station (CIMIS #6)
(base 50°F)
degree days per month %Month Historic 2010 changeMarch 200 142 ‐29April 304 185 ‐39May 600 333 ‐45June 924 618 ‐33July 740 676 ‐9Aug 720 604 ‐16Sept 619 614 ‐1Total 4107 3172

UC Yolo-Solano-Sac 2010 Variety Report page 2
resistance, while several varieties have resistance to tomato spotted wilt (Table 1A). Campbell’s CXD 282 and WoodBridge BQ 187 also have Fusarium wilt race 3 resistance.
Included in the local test was an evaluation of a late application of a foliar nutrient. HyPeel 849 was compared with and without the additional fertilizer.
Locations: Our local trial was north of Davis with J.H. Meek and Sons. Farm advisors representing San Joaquin, Merced, Fresno-Tulare/Kings and Kern counties conducted other UC tests.
Methods: The local trial was established from commercially grown greenhouse transplants. Plants were pulled from trays, counted, bundled and bagged ahead of the field planting for the observational portion of the test. Varieties in the replicated portion of the test were directly planted from the greenhouse trays. The grower’s equipment and crew mechanically set the transplants. Skips were filled within a day of the planting. The few transplants that did not survive were replaced over a 2-week period.
The transplants were grown on twin lines, a foot apart from each other, centered on a 5’ bed. All plots were 100' long. A short alley separated each replicate block.
All cultural practices in the ~1 acre experimental site were those of the cooperating grower and matched management in the remainder of the larger commercial field.
A field meeting was held at the site as fruit ripened to provide a public viewing opportunity to examine the performance of the varieties in side-by-side comparisons.
To measure yield, fruit from the entire plot were harvested into specialized weigh trailers using the grower's harvesting equipment and crew. A 5-gallon volumetric sample of non-sorted fruit was collected from the mechanical harvester to evaluate fruit defects. Fruit was sampled along the length of the plot. These fruit were graded into categories of marketable red, pink, green, sun-damage, mold and blossom end rot and measured by weight.
From the marketable reds, an ~7 pound sample from each plot was bagged and delivered to a local inspection station of the Processing Tomato Advisory Board. Color, °Brix (soluble solids) and pH were determined by PTAB with a procedure consistent with commercial grading. Additionally, similar samples were hand picked by the Diane Barrett Lab from the UC Davis Food Science and Technology Department to evaluate processing quality.
Statistical analysis of variance methods were used to help interpret the replicated data. Results derived from non-replicated data should be viewed with much less confidence.
MID-MATURITY EVALUATION (TRANSPLANTED ON DOUBLE ROWS)
Our local mid-maturity variety trial evaluation was transplanted with J.H. Meek and Sons north of Davis on a class 2, Rincon silty clay loam soil. Seedling plugs were mechanically transplanted on April 26th in double lines per bed (Table 2). Seedbed soil tilth was very good, although the soil retained high moisture from earlier rainfall. The field was entirely irrigated by furrow. Vine growth was good. Verticillium wilt was prevalent early while powdery mildew occurrence was late. Tomato spotted wilt incidence was low. Harvest on September 2 appeared optimal for fruit maturity and vine condition. The field variety planted by the grower was HyPeel 849, which we added to the experiment.

UC Yolo-Solano-Sac 2010 Variety Report page 3
REPLICATED ENTRIES Table 4A mid replicated— yield, fruit quality and culls: The top yielding variety was H 5508 with almost 58 tons per acre. HyPeel 849 with 53.7 tons/A along with 7 others were in the next high yielding group, all with more than 50 tons/A.
The highest Brix group was led by Sun 6366 and N 6394, both with an impressive 5.9° Brix and included 9 other varieties in the same group, all with a minimum level of 5.48. The trial averaged 5.6 (although the statistical variation was high, masking potential differences). Sun 6366 had both relatively high yield together with high Brix.
Best color group was led by CXD 282 with 21.5 and included N 6394 and N 6385, both under 22.6.
Fruit pH was lowest with UG 19406 at 4.31 and included H 8504 at 4.32 and H 9780 at 4.36 in the same statistical group. Conversely, fruit pH was elevated with HMX 7885 at 4.59 and both Sun 6366 and N 6394 at 4.56.
The level of pink, green and moldy fruit were low with a maximum of 4% in any one category.
Blossom end rot (BER) damage was unexpected given the mild weather and careful irrigation regime. BER level was 5% with HMX 7885 and 4% with H 5508%. For this category, the damage level raises some concern.
Table 4B mid replicated— vine size, canopy cover and estimated maturity: The larger-vine varieties in this double row test were AB 2, Sun 6366, UG 19406, N 6394 and H 5608. None of the varieties appeared particularly small- vined in this test.
Fruit canopy cover was evaluated shortly before harvest. In this visual assessment, a fruit canopy cover of 80% or more was desirable, while levels below 50% are usually problematic for fruit protection from sun damage. Canopy was poorest with HMX 7885 at 58%, but also in that low group were HMX 6903, HMX 783 and HMX 7885. Canopy cover was best with UG 19406, HyPeel 849, AB 2, AB 3 and CXD 255, all with 88% or better.
Vine necrosis level averaged 30% as a visual assessment. The healthiest vines included CXD 255, AB 2, UG 19406, HyPeel 849, BQ 163, and CXD 282 with 21% or less damage. Maturity influenced the level of necrosis, with a disadvantage with early maturity.
A visual estimate of days to harvest was assessed and compared to the standard AB 2. Sun 6366, BQ 205 and H 4007 appeared to be 9 to 6 days earlier maturing than AB 2. The later maturing varieties in our test appeared to be H 9780 and UG 19406 as well as CXD 255, all about 2 to 3 days later maturing than AB 2. NOTE: later maturity was difficult to assess, especially in this test period.
Tomato powdery mildew incidence was apparent, but occurred relatively late in this trial. Sun 6366 and N 6394 appeared to have high incidence of infection along with BQ 205 and AB 3. The lesser diseased cultivars appeared to be HyPeel 849, CXD 255, H 5608, H 4007 and AB 2.
NON-REPLICATED ENTRIES
Table 5A: mid observational— yield, fruit quality and culls: The highest yielding non-replicated variety was H 7709 with 49.4 tons per acre. Yields on average were lower in the non-replicated portion of the trial.
Brix levels were highest with UG 19006 at 6.0 and BOS 7210246 and BQ 187, both with 5.9. Color ranged from 22 to 25 amongst the varieties. Sunburn levels were high amongst
UC Yolo-Solano-Sac 2010 Variety Report page 4
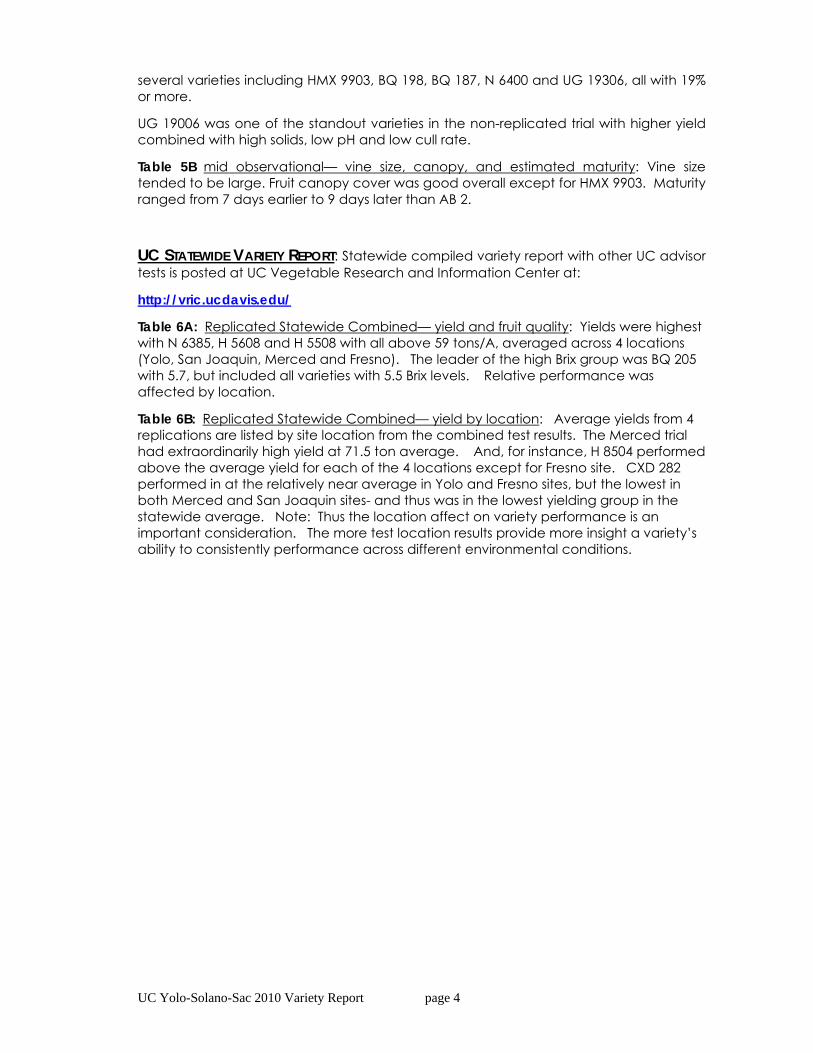
several varieties including HMX 9903, BQ 198, BQ 187, N 6400 and UG 19306, all with 19% or more.
UG 19006 was one of the standout varieties in the non-replicated trial with higher yield combined with high solids, low pH and low cull rate.
Table 5B mid observational— vine size, canopy, and estimated maturity: Vine size tended to be large. Fruit canopy cover was good overall except for HMX 9903. Maturity ranged from 7 days earlier to 9 days later than AB 2.
UC STATEWIDE VARIETY REPORT: Statewide compiled variety report with other UC advisor tests is posted at UC Vegetable Research and Information Center at:
http://vric.ucdavis.edu/
Table 6A: Replicated Statewide Combined— yield and fruit quality: Yields were highest with N 6385, H 5608 and H 5508 with all above 59 tons/A, averaged across 4 locations (Yolo, San Joaquin, Merced and Fresno). The leader of the high Brix group was BQ 205 with 5.7, but included all varieties with 5.5 Brix levels. Relative performance was affected by location.
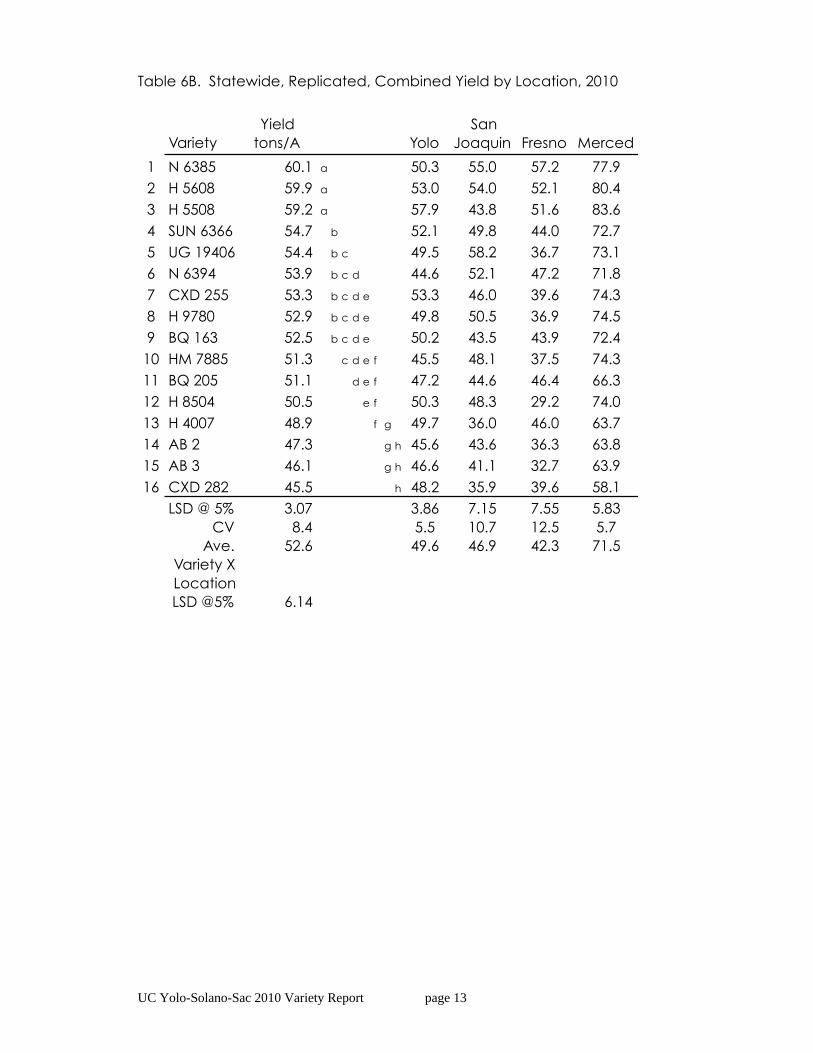
Table 6B: Replicated Statewide Combined— yield by location: Average yields from 4 replications are listed by site location from the combined test results. The Merced trial had extraordinarily high yield at 71.5 ton average. And, for instance, H 8504 performed above the average yield for each of the 4 locations except for Fresno site. CXD 282 performed in at the relatively near average in Yolo and Fresno sites, but the lowest in both Merced and San Joaquin sites- and thus was in the lowest yielding group in the statewide average. Note: Thus the location affect on variety performance is an important consideration. The more test location results provide more insight a variety’s ability to consistently performance across different environmental conditions.

UC Yolo-Solano-Sac 2010 Variety Report page 5
Table 1A. Mid-Maturity Varieties, 2010 UC Processing Tomato Variety Trial, JH Meek and Sons.
Check with seed company to confirm disease resistance.

UC Yolo-Solano-Sac 2010 Variety Report page 6
Table 1B. Disease Code Legend
Code: Disease Resistance* V = VERTICILLIUM WILT RESISTANT F = RACE 1 FUSARIUM WILT RESISTANT FF = RACE 1 AND 2 FUSARIUM WILT RESISTANT FFF3 = RACE 1, 2 AND 3 FUSARIUM WILT RESISTANT N = ROOT KNOT NEMATODE RESISTANT (SOME SPECIES) P = BACTERIAL SPECK RESISTANT (RACE 0) SW = SPOTTED WILT VIRUS
* Check with seed company to confirm disease resistance.

UC Yolo-Solano-Sac 2010 Variety Report page 7
Table 2. Plot Specifications, Transplant, Mid-Maturity, Davis, 2010
Cooperator: Steve Meek and John Pon, J.H. Meek and Sons, Woodland Location: ~0.5 mile south of CR 29, adjacent to east side of CR 98.
SW ¼ of NW ¼ of section 31, T 9N, R 2E, MDM SCS map #60. Field Variety: HyPeel 849, double lines on 5’-centered beds. Plot Design: Randomized complete block with 4 reps. Non-replicated plots
adjacent to 1st rep. All individual plots 500 square feet (100' x 5') Greenhouse: Westside Transplants, Winters in #338 trays for replicated and #392
trays for observational entries Planting Date: 26 April as transplants Population: ~8700 plugs per acre. Fertilizers: 10-34-0 plus zinc as starter @12 gallons/acre
28-0-0 plus 5 S @ 140 lbs N/acre sidedressed 28-0-0 plus 5 S @ 10 lbs N/acre additional
Field Meeting: 19 August Fruit Quality Sample: 23 August, Food Science, UCD; 2 September, PTAB Harvest 2 September (128 days after transplanting) Soil type: Rincon silty clay loam, class 2, Storie Index 73 Previous Crop: wheat Irrigation method: furrow, exclusively General Notes: Transplants established and grew well. Verticillium wilt was very
prevalent. Low incidence of Tomato spotted wilt virus. Late incidence of powdery mildew. Good tonnage with relatively high solids. Timely harvest with grower scheduling harvest specifically for the trial many days ahead of returning to field to pick remainder of the field.

UC Yolo-Solano-Sac 2010 Variety Report page 8
Table 3. Fruit Quality Factor Definitions
SOLUBLE SOLIDS OR °BRIX A measure of mostly fruit sugars. Soluble solids are directly related to finished processed product yield of pastes andsauces. Soluble solids are estimated with a refractometer,and measured as °Brix.
pH A measure of acidity. A level below 4.35 is desirable toprevent bacterial spoilage of finished product. pH rises as fruit matures.
COLOR Measured with a Processing Tomato Advisory Board LEDinstrument simulating Agtron. Lower numbers correspond tobetter red fruit color.
FIELD SAMPLING PROCEDURE
Fruit quality determinations were obtained by collecting ~7 pound sample of ripe, non-defect fruit from each plot. A local grade station of the Processing Tomato Advisory Board evaluated our fruit samples for soluble solids (Brix), color and pH.
To determine finished product thickness, additional samples were collected by Sam Matoba and crew and evaluated in the Diane Barrett lab at the UC Davis Food Science and Technology Department as part of a California League of Food Processors-funded project. Two blocks of replicated varieties and all non-replicated plots were evaluated. °Brix, pH, titratable acidity (reported as percent citric acid), and juice Bostwick were the factors measured. The results of the Food Science project are in a separate report.
Fruit defects in the field were estimated by collecting ~5 gallons of unsorted fruit from the mechanical harvester. Fruit were separated into marketable red, pink, green, sun-damaged, mold and blossom end rot categories. Measurements were on a weight basis and reported as percent. PTAB sample was from a collection of the marketable red fruit also used from this sort out.

UC Yolo-Solano-Sac 2010 Variety Report page 9
Table 4A. Davis, Replicated, Mid-Maturity: Yield, fruit quality and defects from processing tomato variety trial (transplant), JH Meek and Sons, 2010
lbs.Replicated Yield LSD 5% PTAB % % % sun % % per 50Variety tons/A yield Brix color pH pink green burn mold BER fruit
1 H 5508 57.9 a 5.10 22.8 4.39 1 0 5 1 4 8.62 HyPeel 849 53.7 b 5.28 23.8 4.38 1 1 5 3 2 8.73 CXD 255 53.3 bc 5.50 23.0 4.42 1 1 9 2 3 8.44 H 5608 53.0 bc 5.48 23.0 4.49 0 1 6 1 1 9.05 SUN 6366 52.1 bc 5.90 23.3 4.56 0 1 18 4 2 8.86 HP 849 w/ foliar 51.7 bcd 5.25 25.0 4.38 0 2 5 2 1 8.77 H 8504 50.3 bcde 5.38 23.0 4.32 1 1 5 2 3 8.88 N 6385 50.3 bcde 5.40 22.5 4.49 0 1 16 3 1 8.49 BQ 163 50.2 bcde 5.83 23.8 4.41 0 1 14 2 1 8.5
10 H 9780 49.8 cde 5.48 24.3 4.36 0 0 11 1 2 8.411 H 4007 49.7 cde 5.73 22.8 4.45 0 1 13 2 1 8.612 UG 19406 49.5 cdef 5.70 22.8 4.31 1 1 4 4 1 8.813 CXD 282 48.2 defg 5.33 21.5 4.46 0 1 9 4 2 8.614 BQ 205 47.2 efg 5.83 23.5 4.43 1 1 16 2 1 8.815 AB 3 46.6 efg 5.78 24.5 4.43 1 1 14 3 0 8.616 AB 2 45.6 fg 5.85 23.3 4.39 1 1 13 3 1 8.617 HMX 7885 45.5 g 5.25 24.0 4.59 1 1 10 3 5 8.818 N 6394 44.6 g 5.90 22.3 4.56 0 1 21 2 0 8.9
LSD 5% 3.8 0.44 1.1 0.06 1.1 0.8 7.1 2.3 1.9 NS% CV 5 6 3 1 125 58 46 67 80 5average 50.0 5.6 23.3 4.4 0.6 0.9 10.8 2.4 1.7 8.7
Foliar fertilizer = 3-12-3 plus Fe & Zn @ 1 gpa applied ~ 30 days from harvest. Major Points:
Overall, high yield Brix levels high Low levels of pink/green and mold Blossom end rot moderate and high sunburn with several varieties Foliar fertilizer application did not improve yield or quality of HyPeel 849
(Treatment label #2 vs #6 HyPeel 849 with vs without foliar fertilizer)

UC Yolo-Solano-Sac 2010 Variety Report page 10
Table 4B. Davis, Replicated, Mid-Maturity: stand, vine size, canopy cover and fruit maturity notes (transplant), JH Meek and Sons, 2010.
vine fruit estimated
vine size canopy mildew maturity Replicated necrosis (% row cover infection (days Variety ( %) width) (%) (%) to AB 2)
1 AB 2 14 100 89 59 0 2 AB 3 26 88 89 83 -2 3 BQ 163 21 95 86 68 0 4 BQ 205 35 88 79 83 -6 5 CXD 255 13 95 89 48 2 6 CXD 282 21 88 83 63 -1 7 H 4007 44 95 65 58 -6 8 H 5508 36 95 73 75 -1 9 H 5608 39 100 64 50 -1
10 H 8504 33 98 76 64 1 11 H 9780 44 100 65 68 3 12 HMX 7885 53 98 58 65 -3 13 N 6385 35 98 70 63 -2 14 N 6394 43 100 71 83 -4 15 SUN 6366 38 100 78 90 -9 16 UG 19406 18 100 90 73 3 17 HyPeel 849 20 90 88 48 0 18 HyPeel 849 w/ foliar 18 90 90 48 0
LSD 5% 9.1 6.4 6.7 14.0 3.5 % CV 9 5 6 15 9 average 30 86 78 61 -1.3
Foliar fertilizer = 3-12-3 plus Fe & Zn @ 1 gpa applied ~30 days before harvest.

UC Yolo-Solano-Sac 2010 Variety Report page 11
Table 5A. Davis, Non-Replicated, Mid-Maturity: Yield, fruit quality and defects, JH Meek and Sons, 2010.
Data is non-replicated and should be viewed with much less confidence than replicated tests.
Table 5B Davis, Non-Replicated, Mid-Maturity: Stand, vine size, canopy cover,
and fruit maturity notes, transplants, JH Meek and Sons, 2010.
vine fruit estimatedvine size canopy mildew maturity
Observational necrosis (% row cover infection (daysVariety ( %) width) (%) (%) to AB 2)
1 BOS 7210246 10 90 90 100 92 H 7709 25 100 65 50 63 UG 19006 25 100 75 65 14 N 6398 30 97 75 60 -75 BQ 187 40 83 70 80 -76 HMX 9903 70 90 40 50 -77 UG 19306 25 100 85 100 18 N 6400 30 100 75 80 -49 BQ 198 35 90 70 90 -610 HMX 9905 30 93 80 40 -211 CXD 280 35 90 70- 40 -612 HMX 9906 30 83 75 40 -713 H 6809 35 93 65 40 1
average 32 93 72 64 -2.4
Data is non-replicated and should be viewed with much less confidence than replicated tests.

UC Yolo-Solano-Sac 2010 Variety Report page 12
Table 6A. Statewide, Combined Replicated Trial, Combined Yield and Fruit Quality, 2010
VarietyYield
tons/A Brix Color pH1 N 6385 60.1 a 4.8 (15) 23.3 (04) 4.44 (11)
2 H 5608 59.9 a 4.9 (12) 22.4 (01) 4.43 (10)
3 H 5508 59.2 a 4.7 (16) 23.7 (06) 4.35 (03)
4 SUN 6366 54.7 b 5.5 (05) 23.3 (04) 4.49 (14)
5 UG 19406 54.4 b c 5.6 (03) 24.2 (10) 4.32 (01)
6 N 6394 53.9 b c d 5.5 (04) 23.9 (07) 4.53 (15)
7 CXD 255 53.3 b c d e 5.2 (08) 24.4 (13) 4.42 (09)
8 H 9780 52.9 b c d e 5.0 (11) 25.1 (16) 4.41 (08)
9 BQ 163 52.5 b c d e 5.6 (02) 23.9 (07) 4.40 (06)
10 HM 7885 51.3 c d e f 4.9 (13) 25.0 (15) 4.56 (16)
11 BQ 205 51.1 d e f 5.7 (01) 24.2 (10) 4.39 (05)
12 H 8504 50.5 e f 5.1 (09) 24.3 (12) 4.34 (02)
13 H 4007 48.9 f g 5.0 (10) 23.1 (03) 4.47 (12)
14 AB 2 47.3 g h 5.5 (07) 24.0 (09) 4.37 (04)
15 AB 3 46.1 g h 5.5 (06) 24.7 (14) 4.41 (07)
16 CXD 282 45.5 h 4.9 (14) 23.0 (02) 4.47 (13)
LSD @ 5% 3.07 0.18 0.83 0.034CV 8.4 5.4 5.6 1.2
Ave. 52.6 5.2 23.9 4.42Interaction
LSD @ 5% 6.14 0.39 1.85 0.077Location 4 5 5 5
Yield from 4 locations (Yolo, San Joaquin, Fresno and Merced) PTAB fruit quality combined from Yolo, San Joaquin, Fresno, Merced and Kern Number in parentheses is ranking for an attribute in the combined statewide evaluation. Example: N 7385 is highest for yield, 15th ranked for Brix, 4th for color and 11th for pH.
UC Yolo-Solano-Sac 2010 Variety Report page 13
Table 6B. Statewide, Replicated, Combined Yield by Location, 2010
VarietyYield
tons/A YoloSan
Joaquin Fresno Merced1 N 6385 60.1 a 50.3 55.0 57.2 77.92 H 5608 59.9 a 53.0 54.0 52.1 80.43 H 5508 59.2 a 57.9 43.8 51.6 83.64 SUN 6366 54.7 b 52.1 49.8 44.0 72.75 UG 19406 54.4 b c 49.5 58.2 36.7 73.16 N 6394 53.9 b c d 44.6 52.1 47.2 71.87 CXD 255 53.3 b c d e 53.3 46.0 39.6 74.38 H 9780 52.9 b c d e 49.8 50.5 36.9 74.59 BQ 163 52.5 b c d e 50.2 43.5 43.9 72.410 HM 7885 51.3 c d e f 45.5 48.1 37.5 74.311 BQ 205 51.1 d e f 47.2 44.6 46.4 66.312 H 8504 50.5 e f 50.3 48.3 29.2 74.013 H 4007 48.9 f g 49.7 36.0 46.0 63.714 AB 2 47.3 g h 45.6 43.6 36.3 63.815 AB 3 46.1 g h 46.6 41.1 32.7 63.916 CXD 282 45.5 h 48.2 35.9 39.6 58.1
LSD @ 5% 3.07 3.86 7.15 7.55 5.83CV 8.4 5.5 10.7 12.5 5.7
Ave. 52.6 49.6 46.9 42.3 71.5Variety X Location LSD @5% 6.14