Embed Size (px)
Citation preview

8/12/2019 2010 Insurance Industry Report
http://slidepdf.com/reader/full/2010-insurance-industry-report 1/50
8/12/2019 2010 Insurance Industry Report
http://slidepdf.com/reader/full/2010-insurance-industry-report 2/50
The 2010 Economic Impact of the Insurance Industry onMetropolitan and Non-Metropolitan Nebraska
This study was prepared for the Nebraska Insurance Federation. Findings from thisstudy remain the sole property of the Insurance Federation and may not be used with-
out prior approval of this organization. Any errors or misstatements contained in this
study are the responsibility of the authors. Please address all correspondence to:
Dr. Eric ThompsonAssociate Professor
Bureau of Business Research andDepartment of Economics
University of Nebraska-LincolnLincoln, Nebraska 68588-0406
Voice-(402) 472-3318Fax-(402) 472-9700
Email- [email protected]
and
Dr. Ernest GossMacAllister Chair
Department of EconomicsCreighton University
Omaha, Nebraska 68178-0130Voice-(402) 280-4757
Fax-(402) 280-2172e-mail- [email protected]
8/12/2019 2010 Insurance Industry Report
http://slidepdf.com/reader/full/2010-insurance-industry-report 3/50
i | P a g e
Table of Contents
Executive Summary Iii
Chapter 1: Nebraska‟s Insurance Industry: An Important Economic Building Block 1Introduction 1The Economic Significance of Nebraska‟s Insurance Industry 3The Geography of the Nebraska Insurance Industry 11The Location of Insurance Firms 15Summary 18
Chapter 2: Measuring the Economic Impact of the Insurance Industry 19Implan Multipliers 20
Factors that Determine the Magnitude of Economic Multipliers 21Chapter 3: Estimated Impacts of the Insurance Industry 23
Introduction 23Impacts by Geographic Area 24Impacts by Industry 29Impacts by Insurance Sector 32Comparisons with Other Major Nebraska Industries 32Impacts on Tax Collections 33Summary 34
Chapter 4: Nebraska‟s Insurance Industry: Contributions to Brain Gain 36Introduction 36Net Jobs Openings in the Nebraska Insurance Industry 37
References 42
Appendix 1: Biographies of Authors 44
8/12/2019 2010 Insurance Industry Report
http://slidepdf.com/reader/full/2010-insurance-industry-report 4/50
ii | P a g e
List of Tables and Fi ures
Table 1.1: Average weekly salaries by industry, May 2010 and 2006 2Table 1.2: Employment and LQs for the Insurance Industry (2008 5Fi ure 1.1: Insurance Industr Location Quotients for US States 2008 5Table 1.3: LQs By State, 2008 7Table 1.4: Employment in insurance carriers (2008) 8Table 1.5: Employment in Direct Life, Health and Medical Insurance (2008) 8Table 1.6: Employment in Direct Insurance (Except Life and Medical) (2008) 8Table 1.7: Employment in Reinsurance (2008) 9Table 1.8: Business of Property and Casualty Insurance Companies, 1999 and 10Table 1.9: Business of Life and Health Insurance Companies, 2002 and 2009 10Figure 1.2: Growth in Nebraska insurance Jobs by Area, 2000-2010 12Figure 1.3: Location Quotients, 2000-2010 12Figure 1.4: LQs by Nebraska County, 2008 13Table 1.10: Insurance Industry LQs by Nebraska County (2008) 14Table 1.11: Change in the Number of Insurance Firms, 1999-2008 15Figure 1.5: Growth in Insurance Firms, 1999-2008 16Figure 1.6: Average Firm Size Insurance & Related, U.S. vs. NE, 2000-2008 17Figure 1.7: Average Firm Size Insurance Carriers, U.S. vs. NE, 2000-2008 17Table 1.12: Nebraska Insurance Companies by Type, 1960-2008 18Table 3.1: Gross Premium Receipts by Nebraska Insurance Companies 24Table 3.2: Impacts for 2010 by Area of State 25Figure 3.1: Jobs Supported by Area Each Year by Insurance Industry Spending 25Figure 3.2: Wages & Salaries Created by Area by Nebraska Insurance Industry 26Figure 3.3: Self-employment income Created by Area by Insurance Industry 26
Figure 3.4: Sales & Revenues Created by Area by NE Insurance Industry In-
27Table 3.3: Impacts by Senatorial District Outside of Lincoln and Omaha 28Table 3.4: Impacts by Industry, 2010 30Table 3.5: Average pay of jobs created by insurance spending by industry 31Table 3.6: Impacts by Insurance Sector, 2010 32Table 3.7: Economic Impact of Major Nebraska Industries, 2010 33Table 3.8: Taxes and Fees Paid Directly To Insurance Department 34Table 3.9: Tax Impacts for 2010 By Area of State 35Table 3.10: State & Local Taxes Created by Nebraska‟s Insurance Industry 35Table 4.1: Net Projected Job Growth in Nebraska for Insurance Carriers 37Table 4.2: Estimated Annual “Other Separations” in the Nebraska Insu r-
39
Table 4.3: Top Ten Occupations in Nebraska for Insurance Carriers 40
8/12/2019 2010 Insurance Industry Report
http://slidepdf.com/reader/full/2010-insurance-industry-report 5/50
iii | P a g e
The Economic Impact of the Insurance Industry on
Metropolitan and Non-Metropolitan Nebraska
Executive Summary
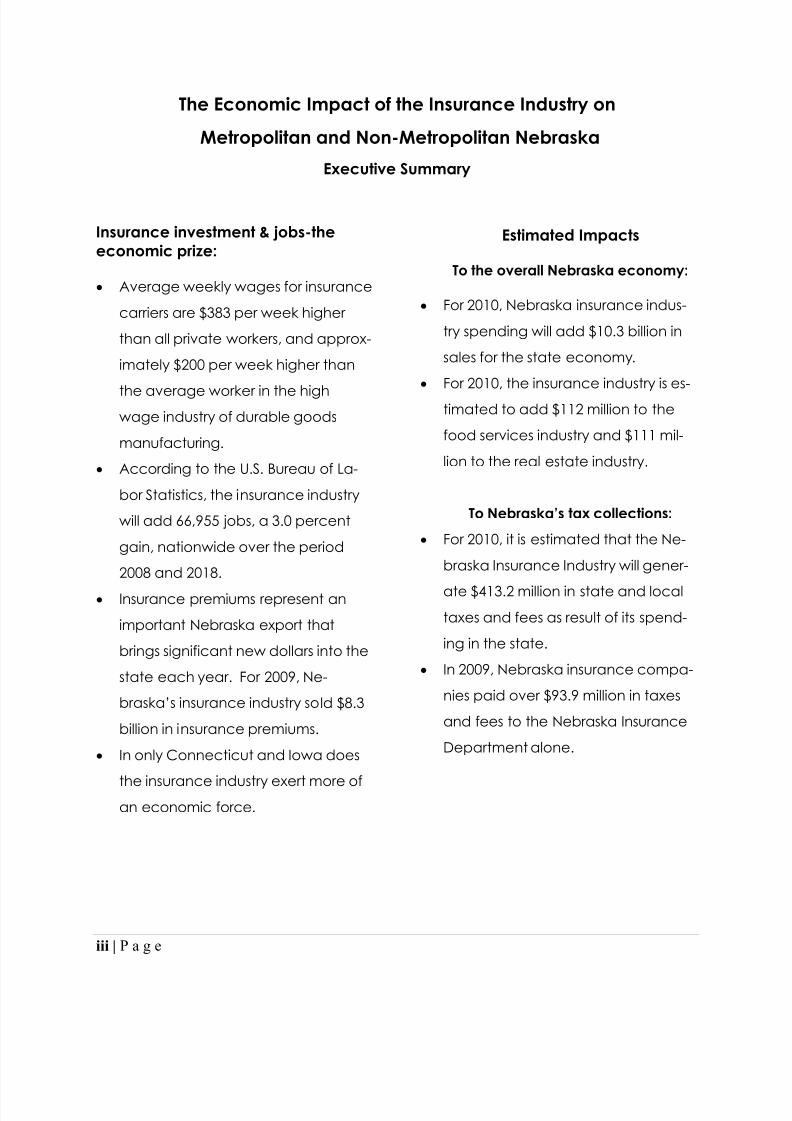
Insurance investment & jobs-theeconomic prize:
Average weekly wages for insurance
carriers are $383 per week higher
than all private workers, and approx-
imately $200 per week higher than
the average worker in the highwage industry of durable goods
manufacturing.
According to the U.S. Bureau of La-
bor Statistics, the insurance industry
will add 66,955 jobs, a 3.0 percent
gain, nationwide over the period
2008 and 2018.
Insurance premiums represent an
important Nebraska export that
brings significant new dollars into the
state each year. For 2009, Ne-
braska‟s insurance industry so ld $8.3
billion in insurance premiums.
In only Connecticut and Iowa does
the insurance industry exert more ofan economic force.
Estimated Impacts
To the overall Nebraska economy:
For 2010, Nebraska insurance indus-
try spending will add $10.3 billion in
sales for the state economy.
For 2010, the insurance industry is es-
timated to add $112 million to the
food services industry and $111 mil-
lion to the real estate industry.
To Nebraska’s tax collections:
For 2010, it is estimated that the Ne-
braska Insurance Industry will gener-
ate $413.2 million in state and localtaxes and fees as result of its spend-
ing in the state.
In 2009, Nebraska insurance compa-
nies paid over $93.9 million in taxes
and fees to the Nebraska Insurance
Department alone.
8/12/2019 2010 Insurance Industry Report
http://slidepdf.com/reader/full/2010-insurance-industry-report 6/50
iv | P a g e
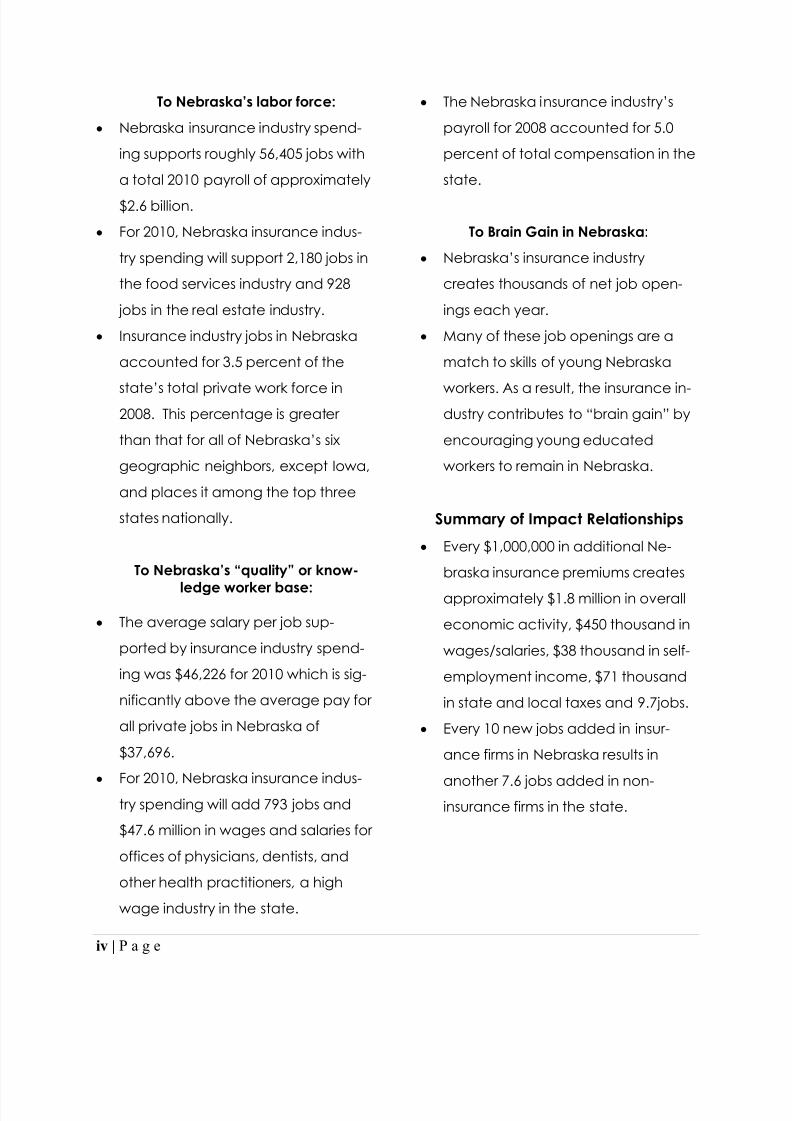
To Nebraska’s labor force:
Nebraska insurance industry spend-
ing supports roughly 56,405 jobs with
a total 2010 payroll of approximately
$2.6 billion.
For 2010, Nebraska insurance indus-
try spending will support 2,180 jobs in
the food services industry and 928
jobs in the real estate industry.
Insurance industry jobs in Nebraska
accounted for 3.5 percent of the
state‟s total private work force in2008. This percentage is greater
than that for all of Nebraska‟s six
geographic neighbors, except Iowa,
and places it among the top three
states nationally.
To Nebraska’s “quality” or kno w-
ledge worker base:
The average salary per job sup-
ported by insurance industry spend-
ing was $46,226 for 2010 which is sig-
nificantly above the average pay for
all private jobs in Nebraska of
$37,696.
For 2010, Nebraska insurance indus-try spending will add 793 jobs and
$47.6 million in wages and salaries for
offices of physicians, dentists, and
other health practitioners , a high
wage industry in the state.
The Nebraska insurance industry‟s
payroll for 2008 accounted for 5.0
percent of total compensation in the
state.
To Brain Gain in Nebraska:
Nebraska‟s insurance industry
creates thousands of net job open-
ings each year.
Many of these job openings are a
match to skills of young Nebraska
workers. As a result, the insurance in-dustry contributes to “brain gain” by
encouraging young educated
workers to remain in Nebraska.
Summary of Impact Relationships Every $1,000,000 in additional Ne-
braska insurance premiums creates
approximately $1.8 million in overall
economic activity, $450 thousand in
wages/salaries, $38 thousand in self-
employment income, $71 thousand
in state and local taxes and 9.7jobs.
Every 10 new jobs added in insur-
ance firms in Nebraska results in
another 7.6 jobs added in non-insurance firms in the state.
8/12/2019 2010 Insurance Industry Report
http://slidepdf.com/reader/full/2010-insurance-industry-report 7/50
1 | P a g e
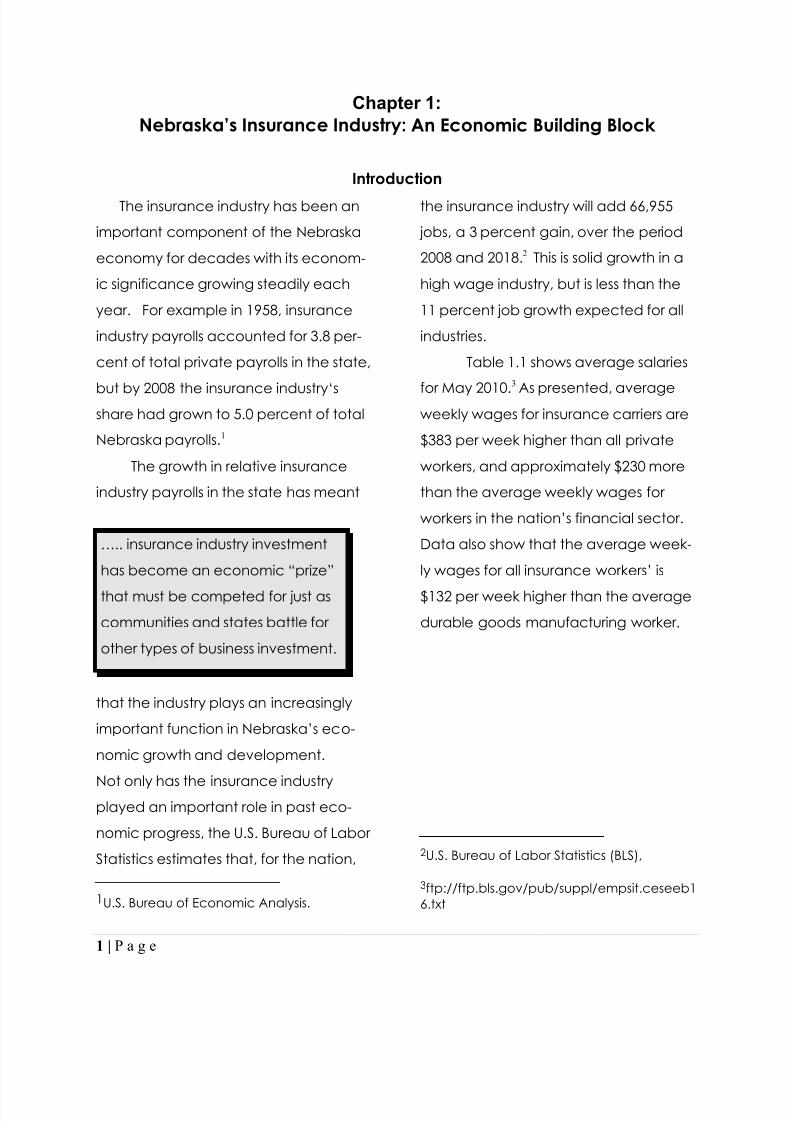
Chapter 1:Nebraska’s Insurance Industry: An Economic Building Block
Introduction
The insurance industry has been an
important component of the Nebraska
economy for decades with its econom-
ic significance growing steadily each
year. For example in 1958, insurance
industry payrolls accounted for 3.8 per-
cent of total private payrolls in the state,
but by 2008 the insurance industry„sshare had grown to 5.0 percent of total
Nebraska payrolls. 1
The growth in relative insurance
industry payrolls in the state has meant
that the industry plays an increasingly
important function in Nebraska‟s ec o-
nomic growth and development.
Not only has the insurance industryplayed an important role in past eco-
nomic progress, the U.S. Bureau of Labor
Statistics estimates that, for the nation,
1U.S. Bureau of Economic Analysis.
the insurance industry will add 66,955
jobs, a 3 percent gain, over the period
2008 and 2018. 2 This is solid growth in a
high wage industry, but is less than the
11 percent job growth expected for all
industries.
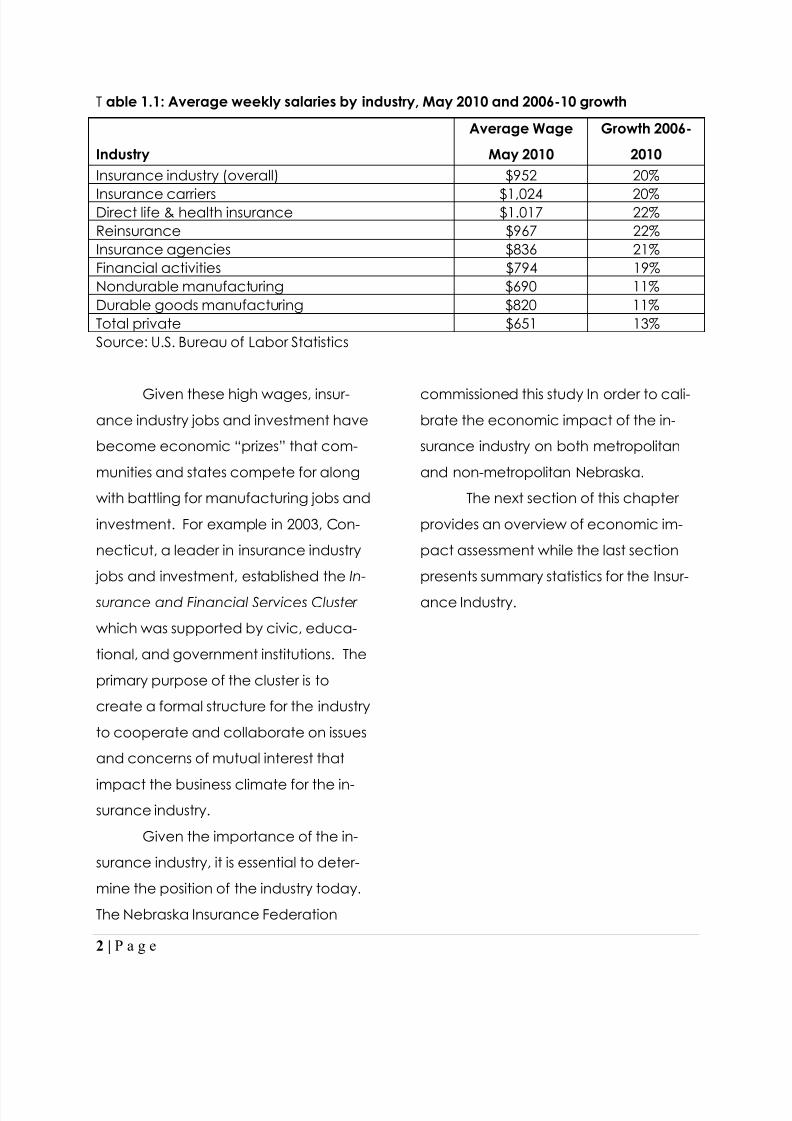
Table 1.1 shows average salaries
for May 2010.3
As presented, averageweekly wages for insurance carriers are
$383 per week higher than all private
workers, and approximately $230 more
than the average weekly wages for
workers in t he nation‟s financial sector.
Data also show that the average week-
ly wages for all insurance workers‟ is
$132 per week higher than the average
durable goods manufacturing worker.
2U.S. Bureau of Labor Statistics (BLS),
3ftp://ftp.bls.gov/pub/suppl/empsit.ceseeb16.txt
….. insurance industry investment
has become an economic “prize”
that must be competed for just as
communities and states battle for
other types of business investment.
8/12/2019 2010 Insurance Industry Report
http://slidepdf.com/reader/full/2010-insurance-industry-report 8/50
2 | P a g e
Table 1.1: Average weekly salaries by industry, May 2010 and 2006-10 growth
Industry
Average Wage
May 2010
Growth 2006-
2010Insurance industry (overall) $952 20%
Insurance carriers $1,024 20%Direct life & health insurance $1.017 22%Reinsurance $967 22%Insurance agencies $836 21%Financial activities $794 19%Nondurable manufacturing $690 11%Durable goods manufacturing $820 11%Total private $651 13%Source: U.S. Bureau of Labor Statistics
Given these high wages, insur-ance industry jobs and investment have
become economic “prizes” th at com-
munities and states compete for along
with battling for manufacturing jobs and
investment. For example in 2003, Con-
necticut, a leader in insurance industry
jobs and investment, established the In-
surance and Financial Services Cluster
which was supported by civic, educa-
tional, and government institutions. The
primary purpose of the cluster is to
create a formal structure for the industry
to cooperate and collaborate on issues
and concerns of mutual interest that
impact the business climate for the in-surance industry.
Given the importance of the in-
surance industry, it is essential to deter-
mine the position of the industry today.
The Nebraska Insurance Federation
commissioned this study In order to cali-brate the economic impact of the in-
surance industry on both metropolitan
and non-metropolitan Nebraska.
The next section of this chapter
provides an overview of economic im-
pact assessment while the last section
presents summary statistics for the Insur-
ance Industry.
8/12/2019 2010 Insurance Industry Report
http://slidepdf.com/reader/full/2010-insurance-industry-report 9/50
3 | P a g e
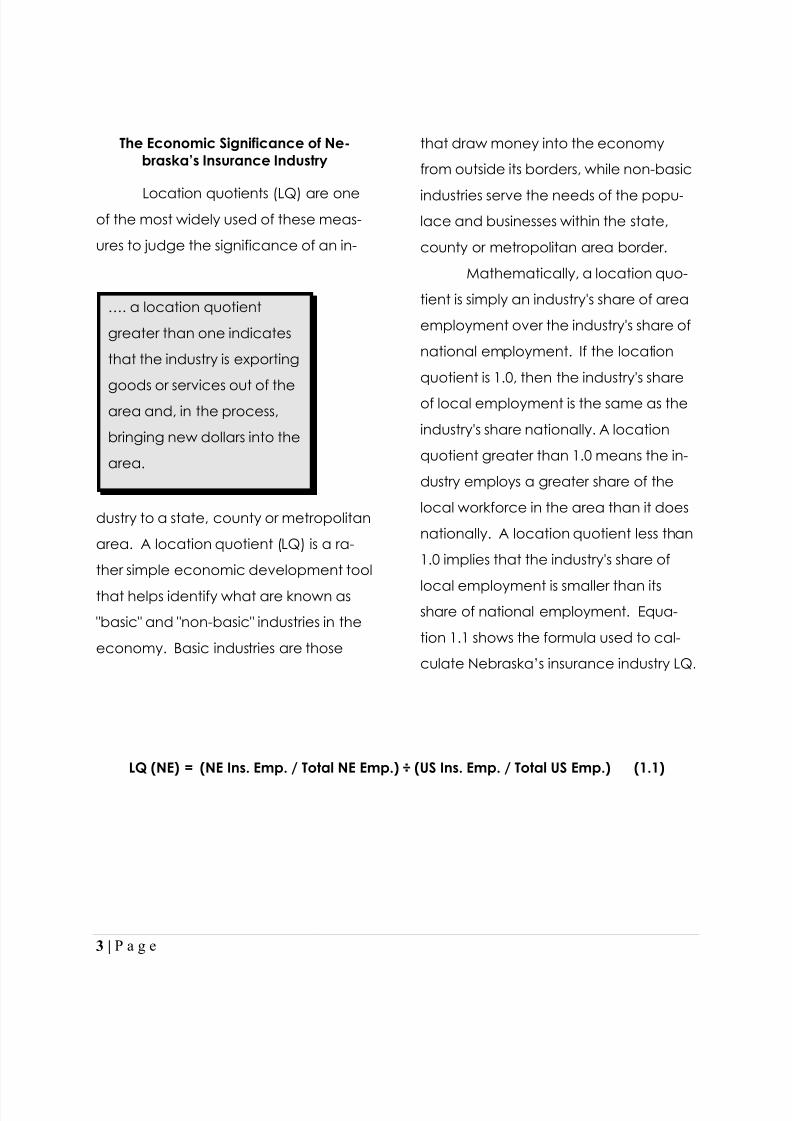
The Economic Significance of Ne-braska’s Insurance Industry
Location quotients (LQ) are oneof the most widely used of these meas-
ures to judge the significance of an in-
dustry to a state, county or metropolitan
area. A location quotient (LQ) is a ra-
ther simple economic development tool
that helps identify what are known as
"basic" and "non-basic" industries in the
economy. Basic industries are those
that draw money into the economy
from outside its borders, while non-basic
industries serve the needs of the popu-lace and businesses within the state,
county or metropolitan area border.
Mathematically, a location quo-
tient is simply an industry's share of area
employment over the industry's share of
national employment. If the location
quotient is 1.0, then the industry's share
of local employment is the same as the
industry's share nationally. A location
quotient greater than 1.0 means the in-
dustry employs a greater share of the
local workforce in the area than it does
nationally. A location quotient less than
1.0 implies that the industry's share of
local employment is smaller than itsshare of national employment. Equa-
tion 1.1 shows the formula used to cal-
cu late Nebraska‟s insurance industry LQ.
LQ (NE) = (NE Ins. Emp. / Total NE Emp.) ÷ (US Ins. Emp. / Total US Emp.) (1.1)
…. a location quotient
greater than one indicates
that the industry is exporting
goods or services out of thearea and, in the process,
bringing new dollars into the
area.
8/12/2019 2010 Insurance Industry Report
http://slidepdf.com/reader/full/2010-insurance-industry-report 10/50
4 | P a g e
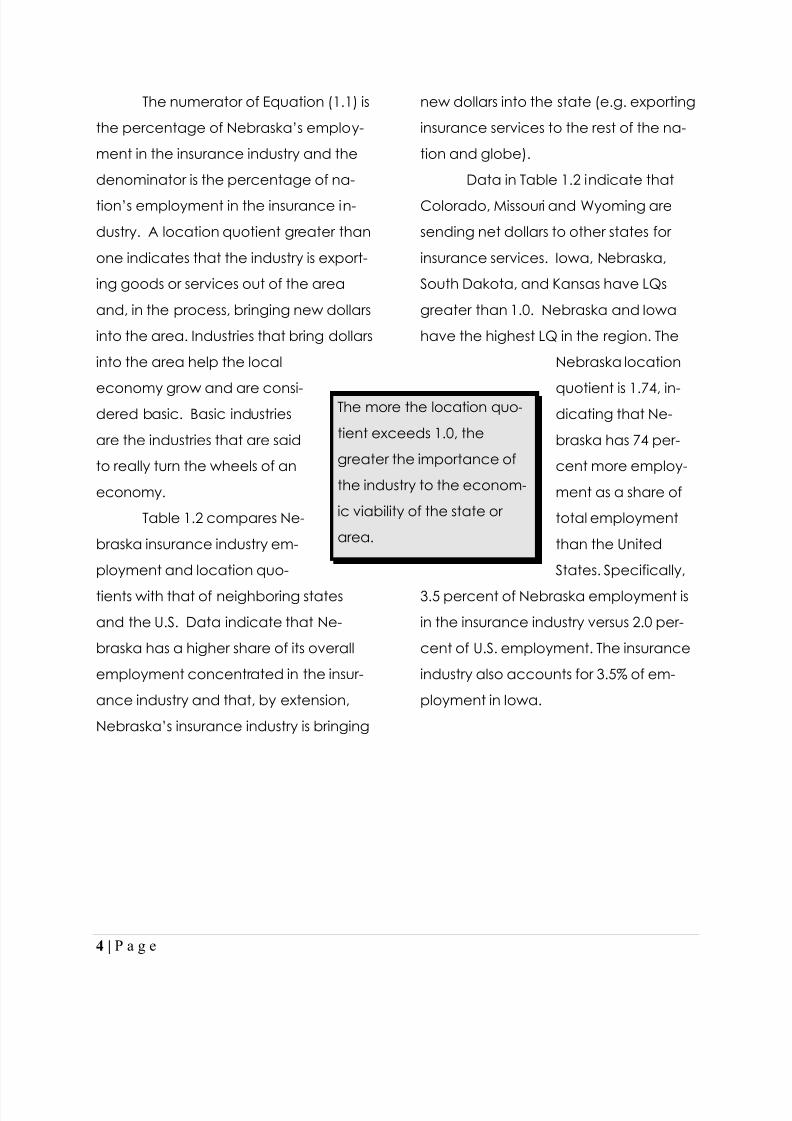
The numerator of Equation (1.1) is
the percentage of Nebraska‟s emplo y-
ment in the insurance industry and the
denominator is the percentage of na-
tion‟s employment in the insurance i n-
dustry. A location quotient greater than
one indicates that the industry is export-
ing goods or services out of the area
and, in the process, bringing new dollars
into the area. Industries that bring dollars
into the area help the local
economy grow and are consi-dered basic. Basic industries
are the industries that are said
to really turn the wheels of an
economy.
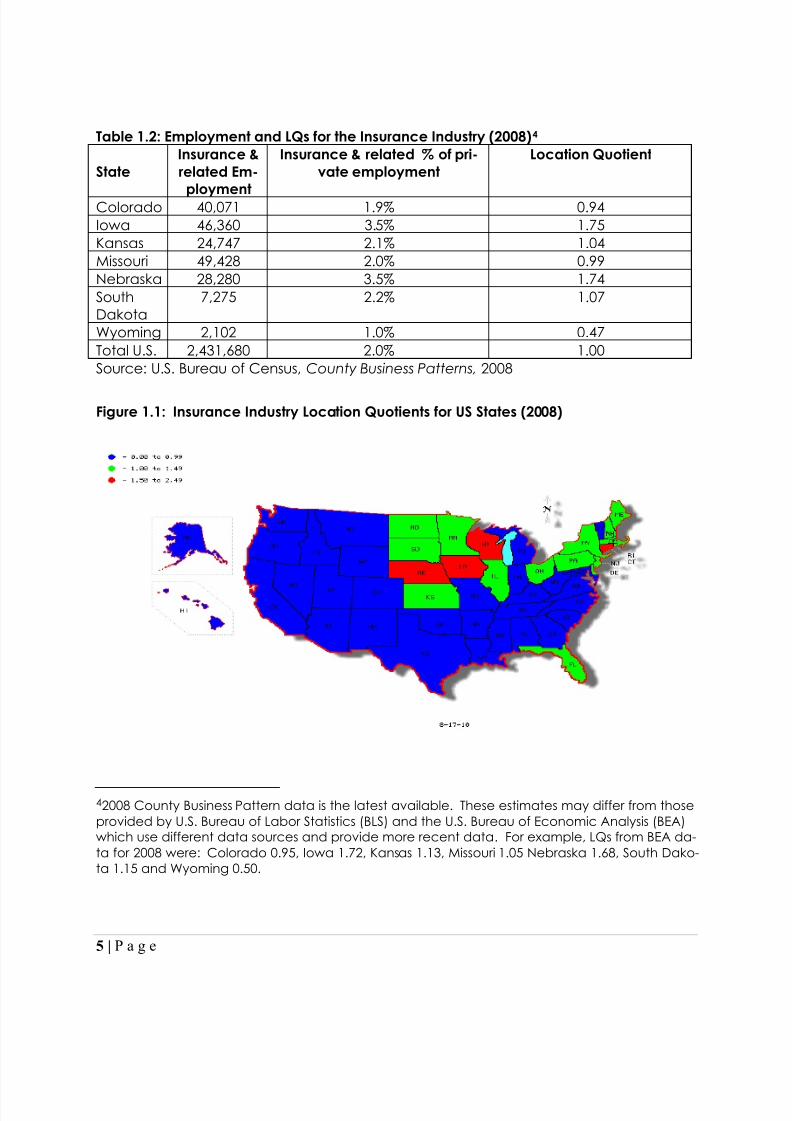
Table 1.2 compares Ne-
braska insurance industry em-
ployment and location quo-
tients with that of neighboring states
and the U.S. Data indicate that Ne-
braska has a higher share of its overall
employment concentrated in the insur-
ance industry and that, by extension,
Nebraska‟s insurance industry is bringing
new dollars into the state (e.g. exporting
insurance services to the rest of the na-
tion and globe).
Data in Table 1.2 indicate that
Colorado, Missouri and Wyoming are
sending net dollars to other states for
insurance services. Iowa, Nebraska,
South Dakota, and Kansas have LQs
greater than 1.0. Nebraska and Iowa
have the highest LQ in the region. The
Nebraska location
quotient is 1.74, in-dicating that Ne-
braska has 74 per-
cent more employ-
ment as a share of
total employment
than the United
States. Specifically,
3.5 percent of Nebraska employment is
in the insurance industry versus 2.0 per-
cent of U.S. employment. The insurance
industry also accounts for 3.5% of em-
ployment in Iowa.
The more the location quo-
tient exceeds 1.0, the
greater the importance of
the industry to the econom-
ic viability of the state or
area.
8/12/2019 2010 Insurance Industry Report
http://slidepdf.com/reader/full/2010-insurance-industry-report 11/50
5 | P a g e
Table 1.2: Employment and LQs for the Insurance Industry (2008) 4
StateInsurance &related Em-
ployment
Insurance & related % of pri-vate employment
Location Quotient
Colorado 40,071 1.9% 0.94Iowa 46,360 3.5% 1.75Kansas 24,747 2.1% 1.04Missouri 49,428 2.0% 0.99Nebraska 28,280 3.5% 1.74SouthDakota
7,275 2.2% 1.07
Wyoming 2,102 1.0% 0.47Total U.S. 2,431,680 2.0% 1.00Source: U.S. Bureau of Census, County Business Patterns, 2008
Figure 1.1: Insurance Industry Location Quotients for US States (2008)
42008 County Business Pattern data is the latest available. These estimates may differ from thoseprovided by U.S. Bureau of Labor Statistics (BLS) and the U.S. Bureau of Economic Analysis (BEA)which use different data sources and provide more recent data . For example, LQs from BEA da-ta for 2008 were: Colorado 0.95, Iowa 1.72, Kansas 1.13, Missouri 1.05 Nebraska 1.68, South Dako-ta 1.15 and Wyoming 0.50.
8/12/2019 2010 Insurance Industry Report
http://slidepdf.com/reader/full/2010-insurance-industry-report 12/50
6 | P a g e
Next location quotients are com-
puted for each U.S. state. Figure 1.1
profiles LQs for all 50 states and the Dis-
trict of Columbia. As presented, only
four states have location quotients
greater than 1.5. Those states are Con-
necticut, Nebraska, Iowa and Wiscon-
sin. Figure 1.1 shows that the insurance
industry is rather concentrated implying
that it benefits from clustering. That is,
insurance firms gain from locating closeto other insurance firms. Clustering of
insurance firms tends to cause tradition-
al suppliers to the insurance industry to
locate close by, and also ensure that
there is a large pool of skilled insurance
industry workers in the region .
Table 1.3 lists location quotients
by state. Only 19 states had LQs above
1.0 and only 8 states have LQs above
1.25 . LQs ranged from DC‟s 0.33 to
Connecticut‟s 2.28. Iowa and Nebraska
are ranked second and third, respec-
tively, in location quotient values. These
findings suggest that Nebraska brings
income to the state by exporting insur-
ance services. Most states are net im-
porters of insurance services.
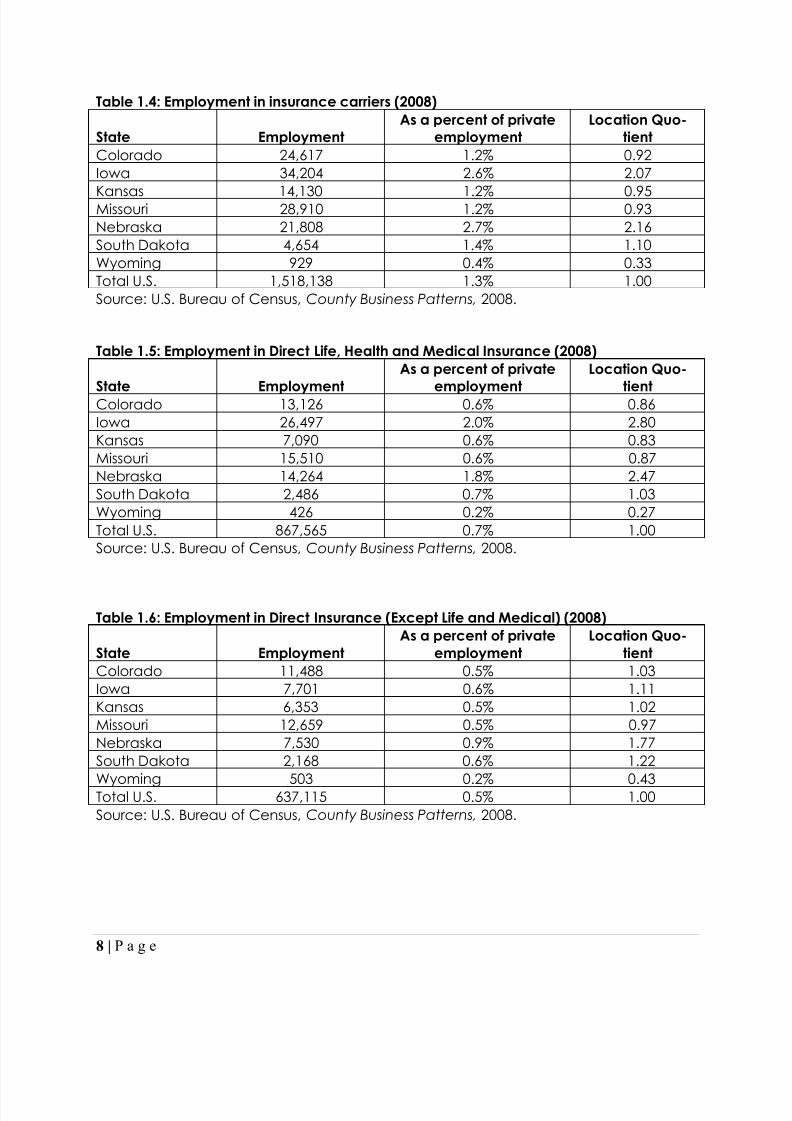
These results represent all insur-
ance industry employment. Location
quotients are even greater in Nebraska
for key segments of the industry, such as
insurance carriers, as seen in Tables 1.4,
1.5, 1.6 and 1.7. Table 1.4 and 1.5 list
employment and LQs for insurance car-
riers and for direct life, health and med-
ical. Tables 1.6 and 1.7 list employment
and LQs for direct insurance (excluding
life, health and medical) and for rein-
surance. With the exception of reinsur-
ance, the tables show that Nebraska
has a much larger share of its employ-
ment in each of the more narrowly de-
fined insurance industries than neighbor-
ing states.
…. only four states have location
quotients greater than 1.5. Those
states are Connecticut, Nebraska,
Iowa and Wisconsin.

8/12/2019 2010 Insurance Industry Report
http://slidepdf.com/reader/full/2010-insurance-industry-report 13/50
7 | P a g e
Table 1.3: LQs by State, 2008
State LQ State LQConnecticut 2.28 Missouri 0.99Iowa 1.75 Arizona 0.96
Nebraska 1.74 Georgia 0.96Wisconsin 1.60 Michigan 0.95North Dakota 1.48 Colorado 0.94New Hampshire 1.35 Texas 0.90Rhode Island 1.28 Oregon 0.90Ohio 1.26 Virginia 0.87Minnesota 1.23 South Carolina 0.87Pennsylvania 1.19 Oklahoma 0.86Illinois 1.17 Tennessee 0.86Maine 1.15 Indiana 0.86Massachusetts 1.13 Maryland 0.85Florida 1.12 California 0.85New Jersey 1.11 Montana 0.82South Dakota 1.07 Alabama 0.78New York 1.07 Washington 0.78Kansas 1.04 North Carolina 0.74Delaware 1.00 Kentucky 0.73
Vermont 0.73Louisiana 0.71
Utah 0.70Idaho 0.69Hawaii 0.68West Virginia 0.65New Mexico 0.62Mississippi 0.56Arkansas 0.55Wyoming 0.47Nevada 0.46Alaska 0.41District of Columbia 0.33U.S. 1.00
Source: U.S. Bureau of Census, County Business Patterns, 2008.
8/12/2019 2010 Insurance Industry Report
http://slidepdf.com/reader/full/2010-insurance-industry-report 14/50
8 | P a g e
Table 1.4: Employment in insurance carriers (2008)
State EmploymentAs a percent of private
employmentLocation Quo-
tientColorado 24,617 1.2% 0.92Iowa 34,204 2.6% 2.07
Kansas 14,130 1.2% 0.95Missouri 28,910 1.2% 0.93Nebraska 21,808 2.7% 2.16South Dakota 4,654 1.4% 1.10Wyoming 929 0.4% 0.33Total U.S. 1,518,138 1.3% 1.00Source: U.S. Bureau of Census, County Business Patterns, 2008.
Table 1.5: Employment in Direct Life, Health and Medical Insurance (2008)
State Employment
As a percent of private
employment
Location Quo-
tientColorado 13,126 0.6% 0.86Iowa 26,497 2.0% 2.80Kansas 7,090 0.6% 0.83Missouri 15,510 0.6% 0.87Nebraska 14,264 1.8% 2.47South Dakota 2,486 0.7% 1.03Wyoming 426 0.2% 0.27Total U.S. 867,565 0.7% 1.00Source: U.S. Bureau of Census, County Business Patterns, 2008.
Table 1.6: Employment in Direct Insurance (Except Life and Medical) (2008)
State EmploymentAs a percent of private
employmentLocation Quo-
tientColorado 11,488 0.5% 1.03Iowa 7,701 0.6% 1.11Kansas 6,353 0.5% 1.02Missouri 12,659 0.5% 0.97Nebraska 7,530 0.9% 1.77South Dakota 2,168 0.6% 1.22
Wyoming 503 0.2% 0.43Total U.S. 637,115 0.5% 1.00Source: U.S. Bureau of Census, County Business Patterns, 2008.
8/12/2019 2010 Insurance Industry Report
http://slidepdf.com/reader/full/2010-insurance-industry-report 15/50
9 | P a g e
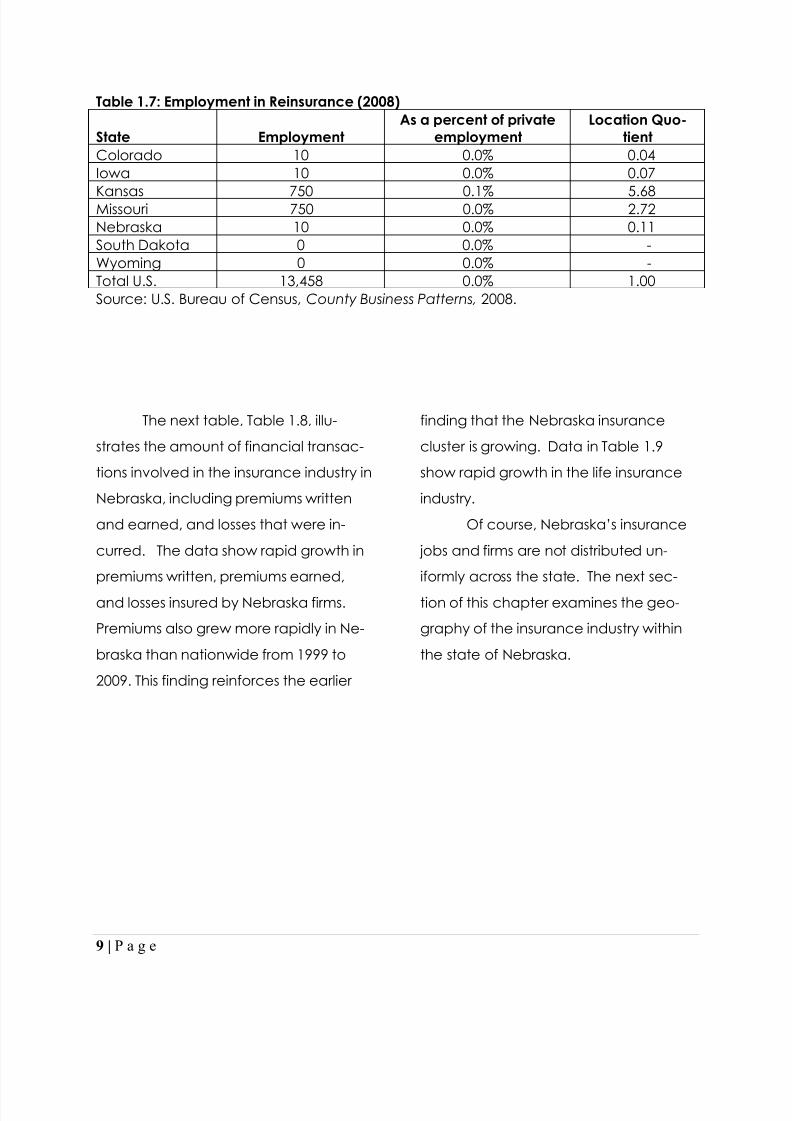
Table 1.7: Employment in Reinsurance (2008)
State EmploymentAs a percent of private
employmentLocation Quo-
tientColorado 10 0.0% 0.04Iowa 10 0.0% 0.07
Kansas 750 0.1% 5.68Missouri 750 0.0% 2.72Nebraska 10 0.0% 0.11South Dakota 0 0.0% -Wyoming 0 0.0% -Total U.S. 13,458 0.0% 1.00Source: U.S. Bureau of Census, County Business Patterns, 2008.
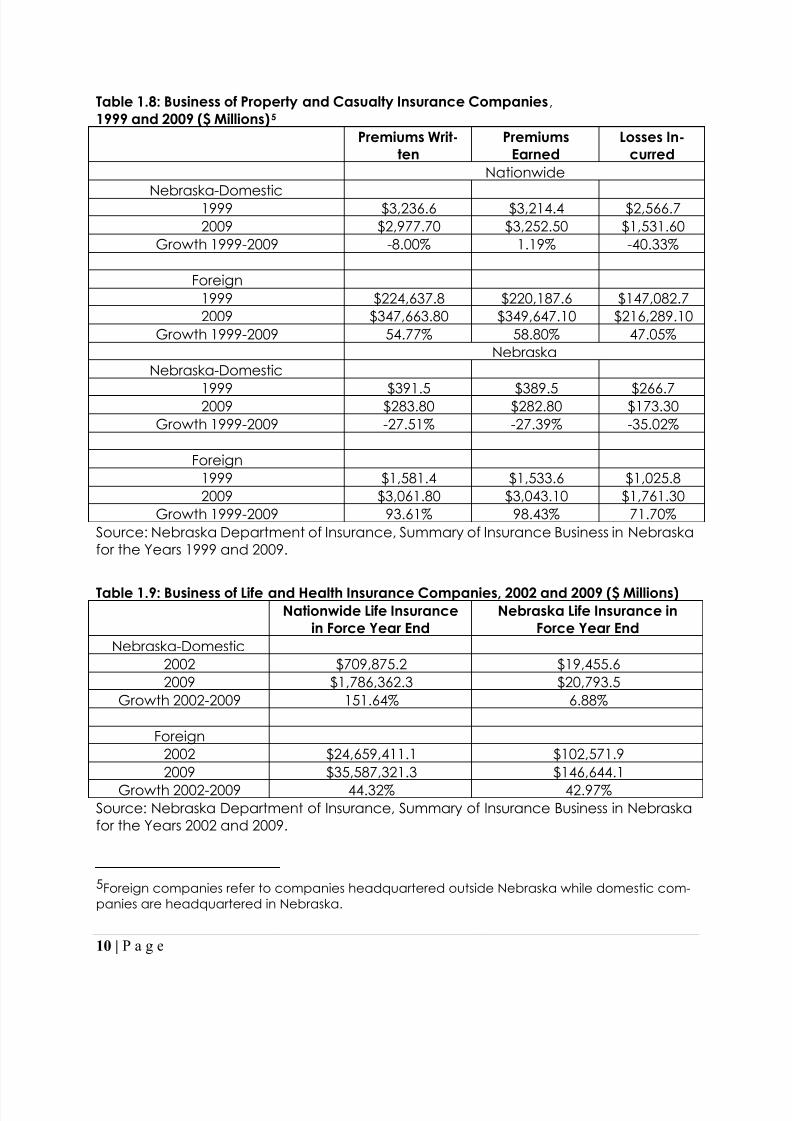
The next table, Table 1.8, illu-
strates the amount of financial transac-
tions involved in the insurance industry in
Nebraska, including premiums written
and earned, and losses that were in-
curred. The data show rapid growth in
premiums written, premiums earned,
and losses insured by Nebraska firms.
Premiums also grew more rapidly in Ne-
braska than nationwide from 1999 to
2009. This finding reinforces the earlier
finding that the Nebraska insurance
cluster is growing. Data in Table 1.9
show rapid growth in the life insurance
industry.
Of course, Nebraska‟s insurance
jobs and firms are not distributed un-
iformly across the state. The next sec-
tion of this chapter examines the geo-
graphy of the insurance industry within
the state of Nebraska.
8/12/2019 2010 Insurance Industry Report
http://slidepdf.com/reader/full/2010-insurance-industry-report 16/50
10 | P a g e
Table 1.8: Business of Property and Casualty Insurance Companies ,1999 and 2009 ($ Millions) 5
Premiums Writ-ten
PremiumsEarned
Losses In-curred
Nationwide
Nebraska-Domestic1999 $3,236.6 $3,214.4 $2,566.72009 $2,977.70 $3,252.50 $1,531.60
Growth 1999-2009 -8.00% 1.19% -40.33%
Foreign1999 $224,637.8 $220,187.6 $147,082.72009 $347,663.80 $349,647.10 $216,289.10
Growth 1999-2009 54.77% 58.80% 47.05%Nebraska
Nebraska-Domestic
1999 $391.5 $389.5 $266.72009 $283.80 $282.80 $173.30Growth 1999-2009 -27.51% -27.39% -35.02%
Foreign1999 $1,581.4 $1,533.6 $1,025.82009 $3,061.80 $3,043.10 $1,761.30
Growth 1999-2009 93.61% 98.43% 71.70%Source: Nebraska Department of Insurance, Summary of Insurance Business in Nebraskafor the Years 1999 and 2009.
Table 1.9: Business of Life and Health Insurance Companies, 2002 and 2009 ($ Millions) Nationwide Life Insurance
in Force Year EndNebraska Life Insurance in
Force Year EndNebraska-Domestic
2002 $709,875.2 $19,455.62009 $1,786,362.3 $20,793.5
Growth 2002-2009 151.64% 6.88%
Foreign2002 $24,659,411.1 $102,571.92009 $35,587,321.3 $146,644.1
Growth 2002-2009 44.32% 42.97%Source: Nebraska Department of Insurance, Summary of Insurance Business in Nebraskafor the Years 2002 and 2009.
5Foreign companies refer to companies headquartered outside Nebraska while domestic com-panies are headquartered in Nebraska.
8/12/2019 2010 Insurance Industry Report
http://slidepdf.com/reader/full/2010-insurance-industry-report 17/50
11 | P a g e
The Geography of the Nebraska In-surance Industry
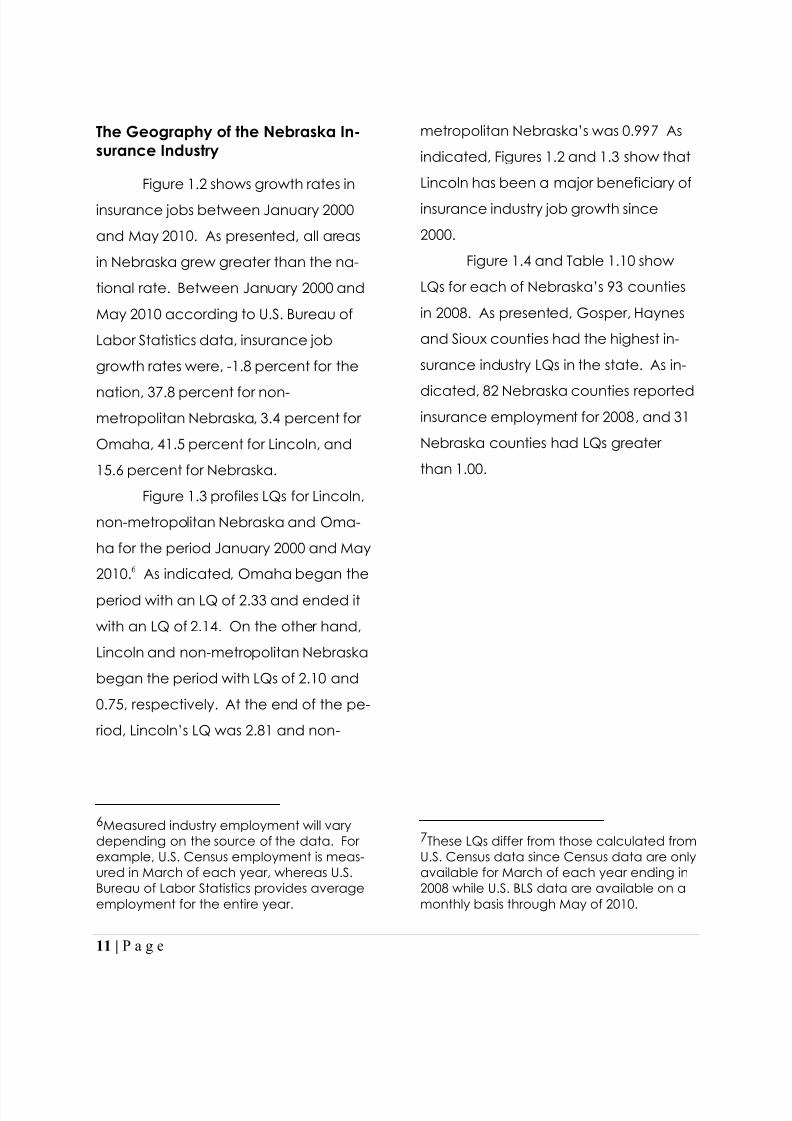
Figure 1.2 shows growth rates in
insurance jobs between January 2000
and May 2010. As presented, all areas
in Nebraska grew greater than the na-
tional rate. Between January 2000 and
May 2010 according to U.S. Bureau of
Labor Statistics data, insurance job
growth rates were, -1.8 percent for the
nation, 37.8 percent for non-metropolitan Nebraska, 3.4 percent for
Omaha, 41.5 percent for Lincoln, and
15.6 percent for Nebraska.
Figure 1.3 profiles LQs for Lincoln,
non-metropolitan Nebraska and Oma-
ha for the period January 2000 and May
2010. 6 As indicated, Omaha began the
period with an LQ of 2.33 and ended it
with an LQ of 2.14. On the other hand,
Lincoln and non-metropolitan Nebraska
began the period with LQs of 2.10 and
0.75, respectively. At the end of the pe-
riod, Lincoln‟s LQ was 2.81 and non -
6Measured industry employment will varydepending on the source of the data. Forexample, U.S. Census employment is meas-ured in March of each year, whereas U.S.Bureau of Labor Statistics provides averageemployment for the entire year.
metropolitan Nebraska‟s was 0.99 7 As
indicated, Figures 1.2 and 1.3 show that
Lincoln has been a major beneficiary of
insurance industry job growth since
2000.
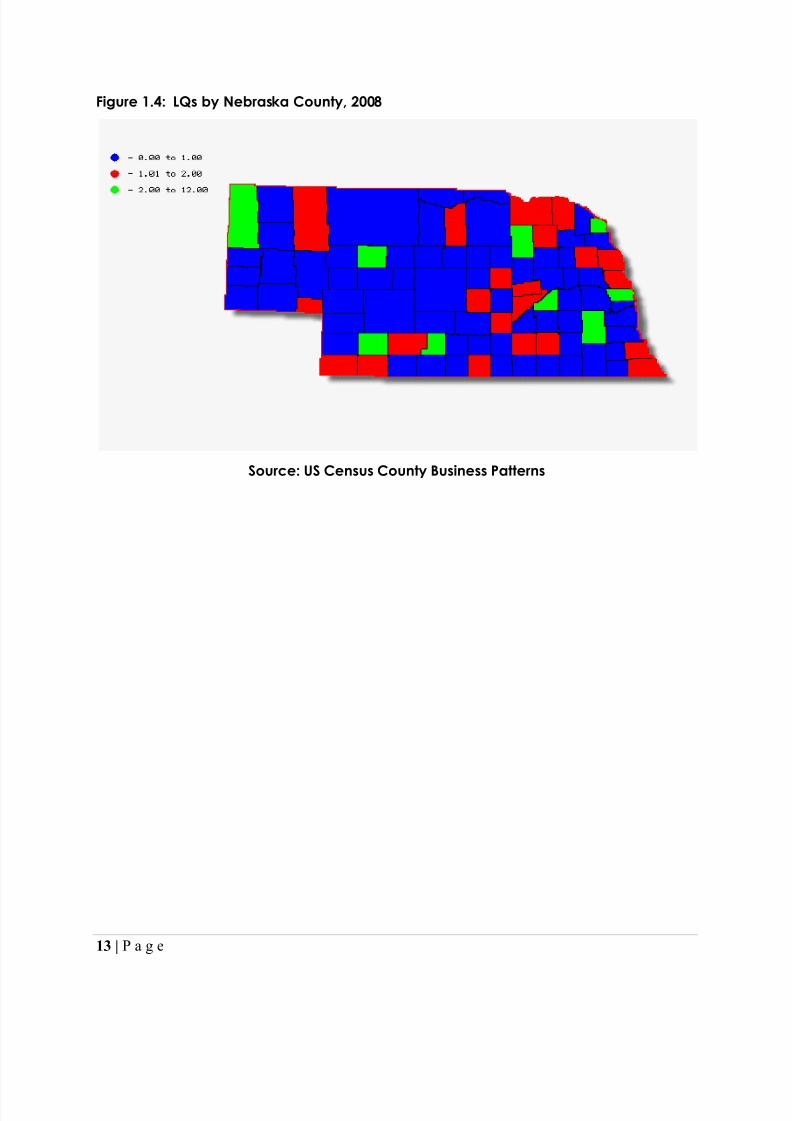
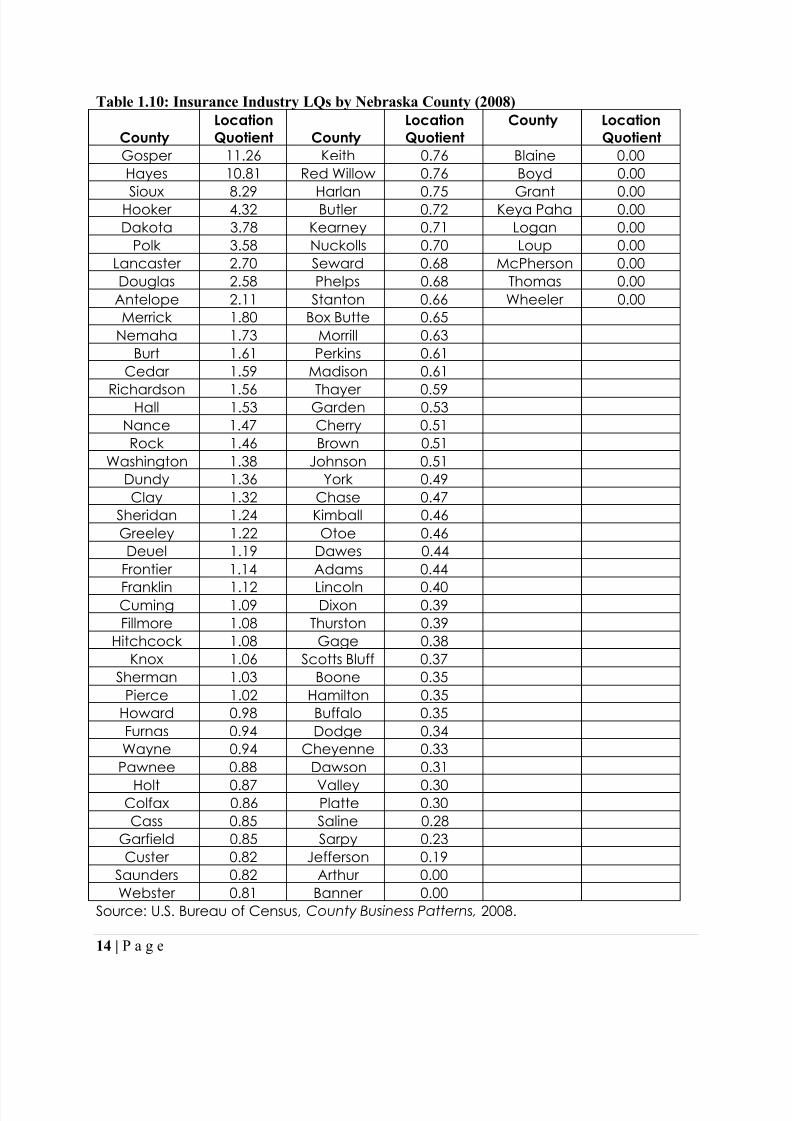
Figure 1.4 and Table 1.10 show
LQs for each of Nebraska‟s 93 counties
in 2008. As presented, Gosper, Haynes
and Sioux counties had the highest in-
surance industry LQs in the state. As in-
dicated, 82 Nebraska counties reportedinsurance employment for 2008, and 31
Nebraska counties had LQs greater
than 1.00.
7These LQs differ from those calculated fromU.S. Census data since Census data are onlyavailable for March of each year ending in2008 while U.S. BLS data are available on amonthly basis through May of 2010.
8/12/2019 2010 Insurance Industry Report
http://slidepdf.com/reader/full/2010-insurance-industry-report 18/50
12 | P a g e
Figure 1.2: Growth in Nebraska Insurance Jobs by Area, 2000-2010
Source: U.S. Bureau of Labor Statistics
Figure 1.3: Location Quotients, 2000-2010
Source: U.S. Bureau of Labor Statistics
-1.8%
37.8%
3.4%
41.5%
15.6%
-5.0%
0.0%
5.0%
10.0%
15.0%
20.0%
25.0%
30.0%
35.0%
40.0%
45.0%
U.S. Non-Metro Omaha Lincoln NE
0
0.5
1
1.5
2
2.5
3
2000 2001 2002 2003 2004 2005 2006 2007 2008 2009 2010
Omaha
Lincoln
Non-Metro NE
8/12/2019 2010 Insurance Industry Report
http://slidepdf.com/reader/full/2010-insurance-industry-report 19/50
13 | P a g e
Figure 1.4: LQs by Nebraska County, 2008
Source: US Census County Business Patterns
8/12/2019 2010 Insurance Industry Report
http://slidepdf.com/reader/full/2010-insurance-industry-report 20/50
14 | P a g e
Table 1.10: Insurance Industry LQs by Nebraska County (2008)
CountyLocationQuotient County
LocationQuotient
County LocationQuotient
Gosper 11.26 Keith 0.76 Blaine 0.00Hayes 10.81 Red Willow 0.76 Boyd 0.00
Sioux 8.29 Harlan 0.75 Grant 0.00Hooker 4.32 Butler 0.72 Keya Paha 0.00Dakota 3.78 Kearney 0.71 Logan 0.00
Polk 3.58 Nuckolls 0.70 Loup 0.00Lancaster 2.70 Seward 0.68 McPherson 0.00Douglas 2.58 Phelps 0.68 Thomas 0.00
Antelope 2.11 Stanton 0.66 Wheeler 0.00Merrick 1.80 Box Butte 0.65
Nemaha 1.73 Morrill 0.63Burt 1.61 Perkins 0.61
Cedar 1.59 Madison 0.61
Richardson 1.56 Thayer 0.59Hall 1.53 Garden 0.53Nance 1.47 Cherry 0.51Rock 1.46 Brown 0.51
Washington 1.38 Johnson 0.51Dundy 1.36 York 0.49Clay 1.32 Chase 0.47
Sheridan 1.24 Kimball 0.46Greeley 1.22 Otoe 0.46
Deuel 1.19 Dawes 0.44Frontier 1.14 Adams 0.44
Franklin 1.12 Lincoln 0.40Cuming 1.09 Dixon 0.39Fillmore 1.08 Thurston 0.39
Hitchcock 1.08 Gage 0.38Knox 1.06 Scotts Bluff 0.37
Sherman 1.03 Boone 0.35Pierce 1.02 Hamilton 0.35
Howard 0.98 Buffalo 0.35Furnas 0.94 Dodge 0.34Wayne 0.94 Cheyenne 0.33
Pawnee 0.88 Dawson 0.31
Holt 0.87 Valley 0.30Colfax 0.86 Platte 0.30Cass 0.85 Saline 0.28
Garfield 0.85 Sarpy 0.23Custer 0.82 Jefferson 0.19
Saunders 0.82 Arthur 0.00Webster 0.81 Banner 0.00
Source: U.S. Bureau of Census, County Business Patterns, 2008.
8/12/2019 2010 Insurance Industry Report
http://slidepdf.com/reader/full/2010-insurance-industry-report 21/50
15 | P a g e
The Location of Insurance Firms
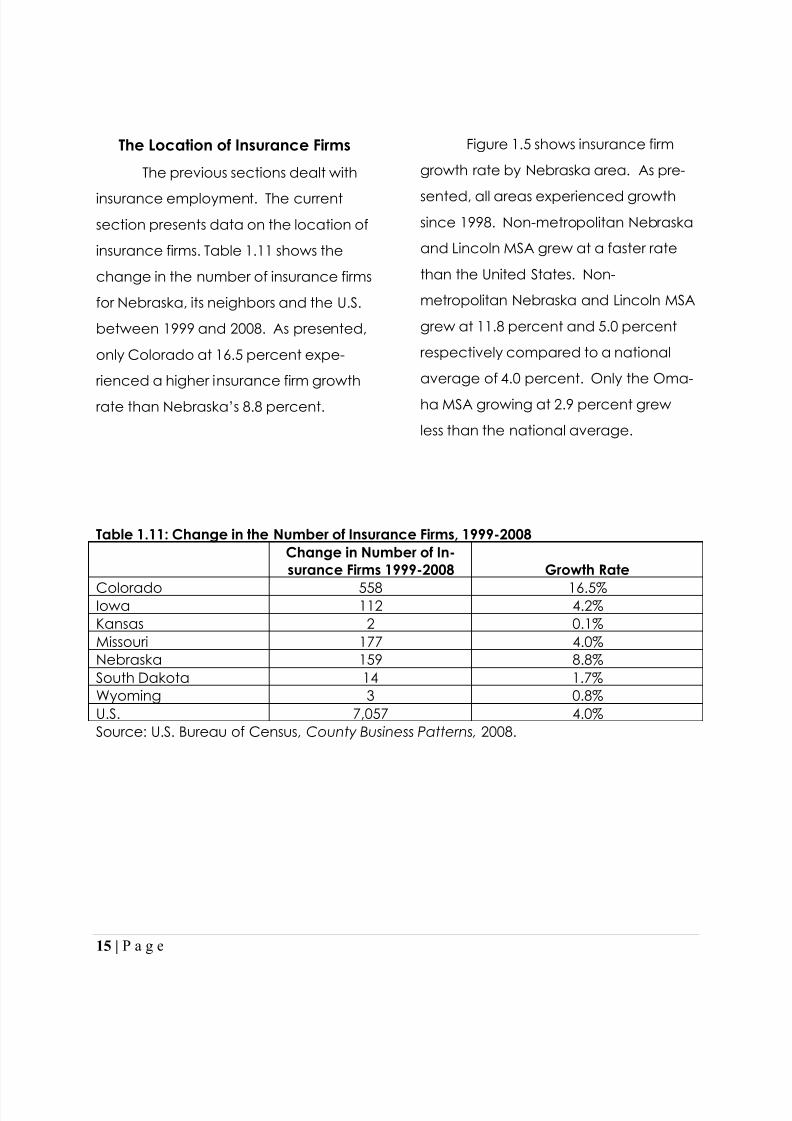
The previous sections dealt with
insurance employment. The currentsection presents data on the location of
insurance firms. Table 1.11 shows the
change in the number of insurance firms
for Nebraska, its neighbors and the U.S.
between 1999 and 2008. As presented,
only Colorado at 16.5 percent expe-
rienced a higher insurance firm growth
rate than Nebraska‟s 8.8 percent.
Figure 1.5 shows insurance firm
growth rate by Nebraska area. As pre-
sented, all areas experienced growthsince 1998. Non-metropolitan Nebraska
and Lincoln MSA grew at a faster rate
than the United States. Non-
metropolitan Nebraska and Lincoln MSA
grew at 11.8 percent and 5.0 percent
respectively compared to a national
average of 4.0 percent. Only the Oma-
ha MSA growing at 2.9 percent grew
less than the national average.
Table 1.11: Change in the Number of Insurance Firms, 1999-2008 Change in Number of In-surance Firms 1999-2008 Growth Rate
Colorado 558 16.5%Iowa 112 4.2%Kansas 2 0.1%Missouri 177 4.0%Nebraska 159 8.8%South Dakota 14 1.7%Wyoming 3 0.8%U.S. 7,057 4.0%Source: U.S. Bureau of Census, County Business Patterns, 2008.

8/12/2019 2010 Insurance Industry Report
http://slidepdf.com/reader/full/2010-insurance-industry-report 22/50
16 | P a g e
Figure 1.5: Growth in Insurance Firms, 1999-2008
Source: County Business Patterns
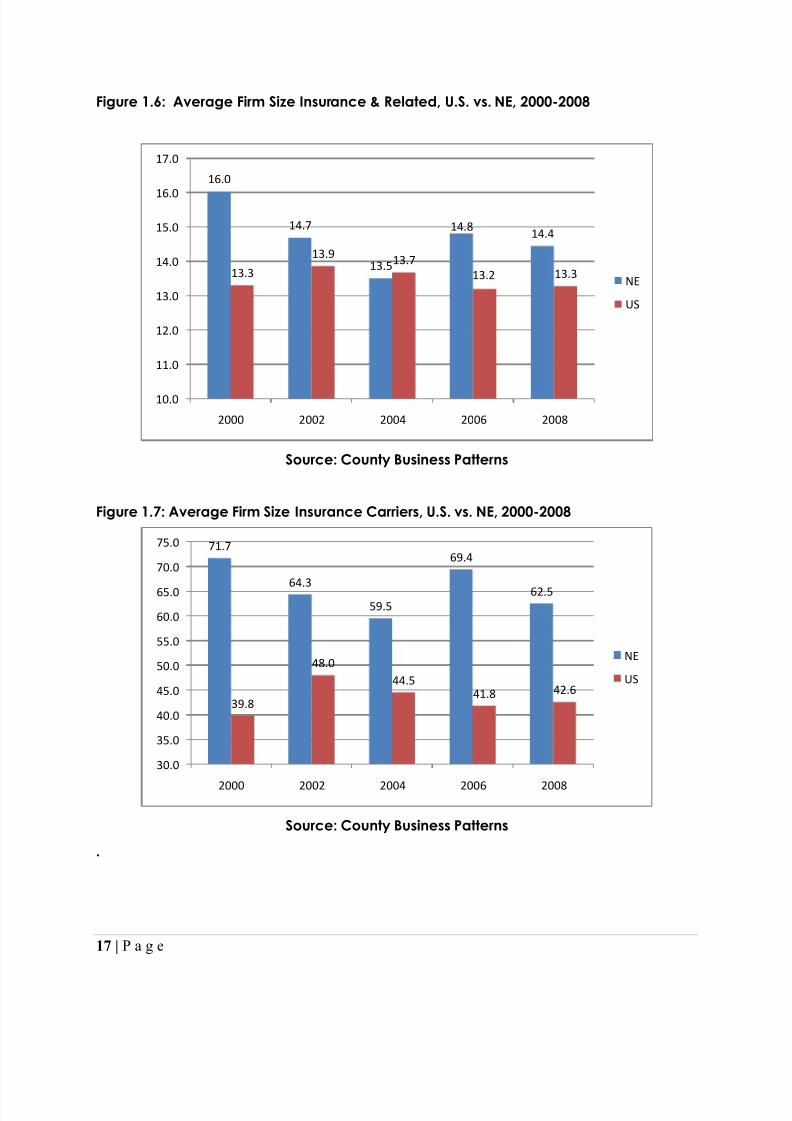
Figures 1.6 and 1.7 show the average
employment size of all insurance firms
and insurance carriers between 2000
and 2008 for Nebraska and for the U.S.
As presented, the average insurance
firm in Nebraska employed 16.0 in 2000
and 14.4 in 2008. On the other hand,
the average U.S. insurance company
employed 13.3 workers in 2000 and 13.3
in 2008. In terms of insurance carriers,the average size of Nebraska‟s insu r-
ance carriers declined from 71.7 workers
in 2000 to 62.5 in 2008 while that of the
U.S. insurance carriers grew from 39.8 to
42.6 between 2000 and 2008.
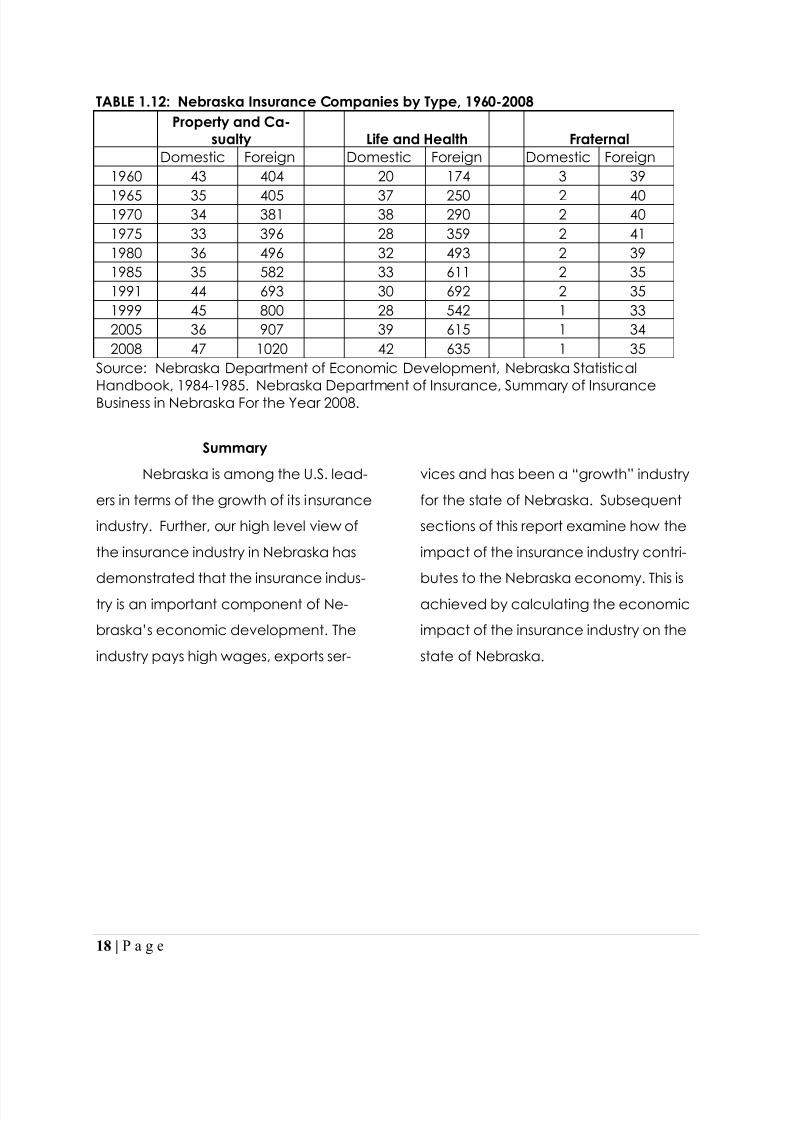
Table 1.12, profiles the number of
insurance companies in Nebraska, by
type of insurance – property and ca-
sualty, life and health, and fraternal – as
well as whether foreign or domestic.
The table also demonstrates the
change in the number of companiesover time.
4.0%
11.8%
2.9%
5.0%
0.0%
2.0%
4.0%
6.0%
8.0%
10.0%
12.0%
14.0%
US Non-Metro NE Omaha MSA Lincoln MSA
8/12/2019 2010 Insurance Industry Report
http://slidepdf.com/reader/full/2010-insurance-industry-report 23/50
17 | P a g e
Figure 1.6: Average Firm Size Insurance & Related, U.S. vs. NE, 2000-2008
Source: County Business Patterns
Figure 1.7: Average Firm Size Insurance Carriers, U.S. vs. NE, 2000-2008
Source: County Business Patterns
.
16.0
14.7
13.5
14.8 14.4
13.3
13.9 13.713.2 13.3
10.0
11.0
12.0
13.0
14.0
15.0
16.0
17.0
2000 2002 2004 2006 2008
NE
US
71.7
64.3
59.5
69.4
62.5
39.8
48.044.5
41.8 42.6
30.0
35.0
40.0
45.0
50.0
55.0
60.0
65.0
70.0
75.0
2000 2002 2004 2006 2008
NE
US
8/12/2019 2010 Insurance Industry Report
http://slidepdf.com/reader/full/2010-insurance-industry-report 24/50
18 | P a g e
TABLE 1.12: Nebraska Insurance Companies by Type, 1960-2008Property and Ca-
sualty Life and Health FraternalDomestic Foreign Domestic Foreign Domestic Foreign
1960 43 404 20 174 3 39
1965 35 405 37 250 2 401970 34 381 38 290 2 401975 33 396 28 359 2 411980 36 496 32 493 2 391985 35 582 33 611 2 351991 44 693 30 692 2 351999 45 800 28 542 1 332005 36 907 39 615 1 342008 47 1020 42 635 1 35
Source: Nebraska Department of Economic Development, Nebraska Statistical
Handbook, 1984-1985. Nebraska Department of Insurance, Summary of InsuranceBusiness in Nebraska For the Year 2008.
Summary
Nebraska is among the U.S. lead-
ers in terms of the growth of its insurance
industry. Further, our high level view of
the insurance industry in Nebraska has
demonstrated that the insurance indus-
try is an important component of Ne-
braska ‟s economic development. The
industry pays high wages, exports ser-
vices and has been a “growth” industry
for the state of Nebraska. Subsequent
sections of this report examine how the
impact of the insurance industry contri-
butes to the Nebraska economy. This is
achieved by calculating the economic
impact of the insurance industry on the
state of Nebraska.

8/12/2019 2010 Insurance Industry Report
http://slidepdf.com/reader/full/2010-insurance-industry-report 25/50
19 | P a g e
Chapter 2
Measuring the Economic Impact of the Insurance Industry
Introduction
It was clear from the location qu-
otient (LQ) analysis in Chapter 1 that a
large share of Nebraska‟s insurance i n-
dustry revenues derive from funds from
outside of the state. Thus, the insurance
industry creates new spending in the
state. These new dollars are considered
net injections and are thus very powerful
direct income and job generators. The
impact that the insurance industry has
on the community begins with these di-
rect impacts, and grows to include indi-
rect and induced impacts.
The revenue of insurance firms is
the direct impact of the Nebraska insur-ance industry. This direct impact, in turn,
drives additional economic activity in
the state economy through the spend-
ing of insurance business and insurance
industry employees. Large portions of
insurance industry expenditures are
made within the state economy. The
portion spent locally increases econom-
ic activity in the state. Specifically, insur-
ance businesses make purchase from
suppliers and service providers, many of
which are located in Nebraska. These
are the indirect impacts. Further, the
employees of Nebraska insurance busi-
nesses spend their paychecks on the
various components of household
spending on food, retail items, rent or
mortgage payments, insurance, per-
sonal services, entertainment and
recreation; again primarily within Ne-
braska. These are the induced impacts.
The indirect and induced impacts are
collectively known as the multiplier im-
pact. All of this spending implies addi-
tional economic activity in businesses
throughout the economy. The total
economic impact is the sum of the di-rect spending and the multiplier impact.
Various regional economic im-
pact models can be used to calculate
multiplier effects. The three most com-
mon types of impact models are eco-
nomic base, econometric, and input-
output (I-O). Two of the three impact
models have inherent disadvantages
that markedly reduce their viability for
estimating the impact of spending on
the economy.
8/12/2019 2010 Insurance Industry Report
http://slidepdf.com/reader/full/2010-insurance-industry-report 26/50
20 | P a g e
Economic Base Model. The eco-
nomic base model divides the economy
into two sectors - the local/service sec-
tor and the export sector. The economic
base multiplier is an average for all the
economy making it impossible to distin-
guish, for example, the impact of retail
spending from that of a new manufac-
turing plant.
Econometric Models. Econome-
tric models have two major weaknesses.
First, the time series data used in con-structing econometric models are often
unavailable even at the state level.
Second, econometric models are costly
to build and maintain.
Input-Output (I-O) Models. I-O
models are the most frequently used
types of analysis tool for economic im-
pact assessment. Input-output is a sim-
ple, general equilibrium approach
based on an accounting system of in-
jections and leakages. Input-output
analysis assumes that each sector pur-
chases supplies from other sectors and
then sells its output to other sectors
and/or final consumers.Historically, high development
costs precluded the extensive use of I-O
models in regional impact analysis.
However, with the advent of "ready-
made" multipliers produced by third par-
ties such as the U.S. Forestry Service, I-O
multipliers became a much more viable
option for performing impact analysis.
All purely non-survey techniques
or "ready-made" multipliers take a na-
tional I-O table as a first approximation
of regional inter-industry relationships.
The national table is then made region-
specific by removing those input re-
quirements that are not produced in the
region. This study will use the most widely
recognized “ready -made” multiplier sy s-tem, IMPLAN Multipliers.
IMPLAN Multipliers
The Forestry Service of the U.S.
Department of Agriculture developed
the IMPLAN multipliers in the 1980s (U.S.
Forest Service, 1985). For very populous
areas, IMPLAN divides the economy into
approximately 500 industrial sectors. In-
dustries that do not exist in the state are
automatically eliminated during user
construction of the model (e.g. coal
mining in Nebraska). IMPLAN uses an in-
dustry-based methodology to derive its
input-out coefficients and multipliers.Primary sources for data are County
Business Patterns and Bureau of Eco-
nomic Analysis.
Researchers have used IMPLAN
to estimate the impact of changes in
8/12/2019 2010 Insurance Industry Report
http://slidepdf.com/reader/full/2010-insurance-industry-report 27/50
21 | P a g e
military spending on the Washington
State economy (Hughes, et. al, 1991). 8
IMPLAN and RIMS (Regional Input-
Output Modeling System) are two of the
most widely used multiplier models. IM-
PLAN has been compared to other mul-
tiplier systems and found to produce re-
liable estimates (Richman and Schwer,
1993). Likewise, Crihfield and Campbell
(1991), in estimating the impacts of
opening an automobile assembly plant,
concluded that IMPLAN's outcomes are,on balance, somewhat more accurate
than RIMS.
IMPLAN multipliers possess these
advantages over other I-O Multiplier Sys-
tems:
1. Price changes are ac-
counted for in the creation of the mul-
tipliers.
2. Employment increases or
decreases are assumed to produce
immediate In- or out-migration.
8 Data and software: Minnesota IMPLANGroup, Inc., IMPLAN System (data andsoftware), 1725 Tower Drive West, Suite140, Stillwater, MN 55082.www.implan.com.
Factors that Determine the Magni-tude of Economic Multipliers
Economic multipliers occur as in-
come circulates within a state econo-
my, creating additional sales, employ-
ment, and worker earnings. The magni-
tude of the multiplier depends on the
degree to which state businesses and
households spend within the state, and
the extent to which their spending leaks
over to purchases in other states. The
magnitude of economic multipliers de-
clines as the amount of “leakage” to
other states rises. There are three factors
that determine the size of the spillover
effect.
Location. Distance to suppliers
affects willingness to purchase within the
state. If state firms are unable to provide
many of the supplies at competitiveprices and there are alternative suppliers
in a nearby state who are more price-
competitive, then insurance businesses
will be encouraged to spend outside the
state. This results in greater leakages,
lowering economic multipliers and
economic impacts.
Population size. A larger
population provides more opportunities
for companies and workers to purchase
within the state. States with a larger
population have a greater number and
8/12/2019 2010 Insurance Industry Report
http://slidepdf.com/reader/full/2010-insurance-industry-report 28/50
22 | P a g e
variety of businesses, making it more
likely that a competitive supplier is
located within the state. Therefore,
larger population states are associated
with fewer leakages and larger
multipliers.
Clustering. A state will gain more if
the inputs required by state industries for
production match state resources and
are purchased within the state. Thus, over
time, as new supplier firms are created to
match the requirements of the insuranceindustry, leakages will be fewer, resulting
in larger multipliers and impacts. This issue
is at the heart of economic develop-
ment, amplifying the impacts of the clus-
tering of facilities, investment and jobs. As
a community gains more and more in-
surance businesses, suppliers critical to
the industry are more likely to locate with-
in the state.
The next chapter of this study pro-
vides the estimated impact of the insur-
ance industry on metropolitan and non-
metropolitan Nebraska using the Implan
Multiplier System.
8/12/2019 2010 Insurance Industry Report
http://slidepdf.com/reader/full/2010-insurance-industry-report 29/50
23 | P a g e
Chapter 3
Estimated Impacts of the Insurance Industry
Introduction
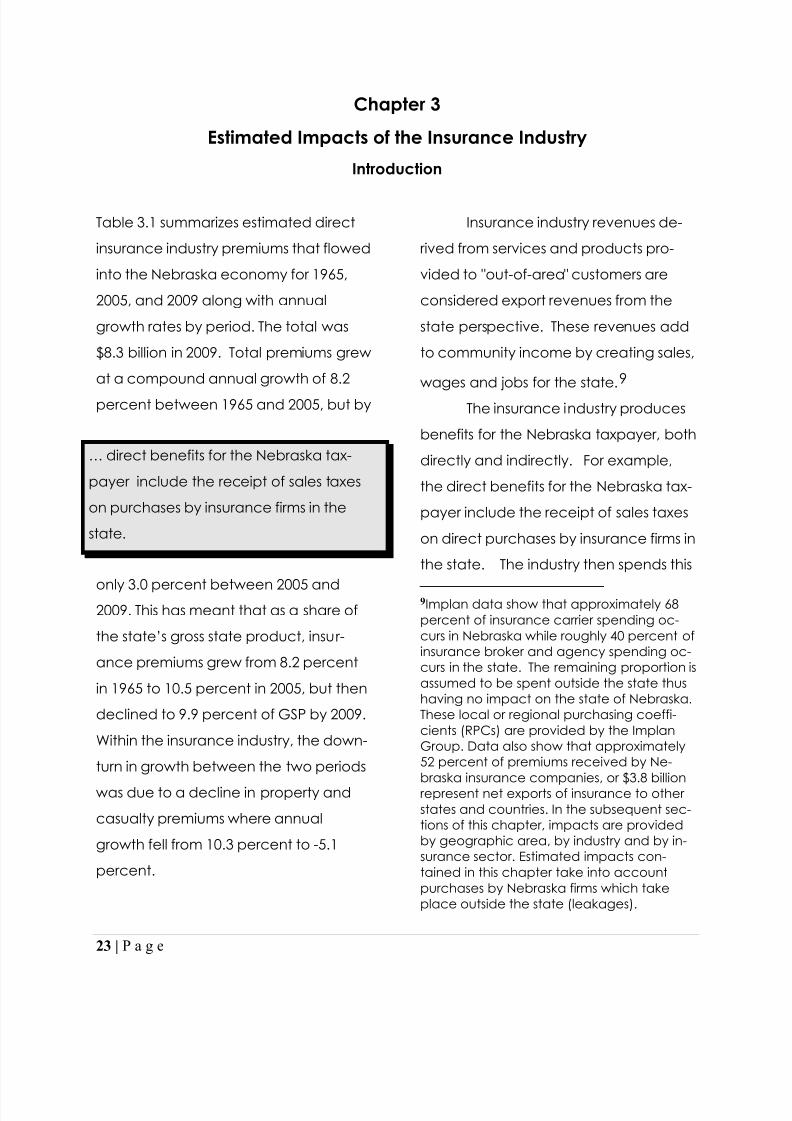
Table 3.1 summarizes estimated direct
insurance industry premiums that flowed
into the Nebraska economy for 1965,
2005, and 2009 along with annual
growth rates by period. The total was
$8.3 billion in 2009. Total premiums grew
at a compound annual growth of 8.2
percent between 1965 and 2005, but by
only 3.0 percent between 2005 and2009. This has meant that as a share of
the state‟s gross state product, insu r-
ance premiums grew from 8.2 percent
in 1965 to 10.5 percent in 2005, but then
declined to 9.9 percent of GSP by 2009.
Within the insurance industry, the down-
turn in growth between the two periods
was due to a decline in property and
casualty premiums where annual
growth fell from 10.3 percent to -5.1
percent.
Insurance industry revenues de-
rived from services and products pro-
vided to "out-of-area" customers are
considered export revenues from the
state perspective. These revenues add
to community income by creating sales,
wages and jobs for the state. 9
The insurance industry produces
benefits for the Nebraska taxpayer, both
directly and indirectly. For example,
the direct benefits for the Nebraska tax-
payer include the receipt of sales taxes
on direct purchases by insurance firms in
the state. The industry then spends this
9Implan data show that approximately 68percent of insurance carrier spending oc-curs in Nebraska while roughly 40 percent ofinsurance broker and agency spending oc-curs in the state. The remaining proportion isassumed to be spent outside the state thushaving no impact on the state of Nebraska.These local or regional purchasing coeffi-cients (RPCs) are provided by the ImplanGroup. Data also show that approximately52 percent of premiums received by Ne-braska insurance companies, or $3.8 billionrepresent net exports of insurance to otherstates and countries. In the subsequent sec-tions of this chapter, impacts are providedby geographic area, by industry and by in-surance sector. Estimated impacts con-tained in this chapter take into accountpurchases by Nebraska firms which takeplace outside the state (leakages).
… direct benefits for the Nebraska tax-
payer include the receipt of sales taxes
on purchases by insurance firms in the
state.
8/12/2019 2010 Insurance Industry Report
http://slidepdf.com/reader/full/2010-insurance-industry-report 30/50
24 | P a g e
revenue and provides insurance settle-
ments in and outside the state. This di-
rect spending creates spillover spending
termed indirect and induced impacts.
To estimate overall direct and
spillover impacts, the IMPLAN multipliers
are applied to insurance industry reve-
nues brought about by yearly opera-
tions as listed in Table 3.1.
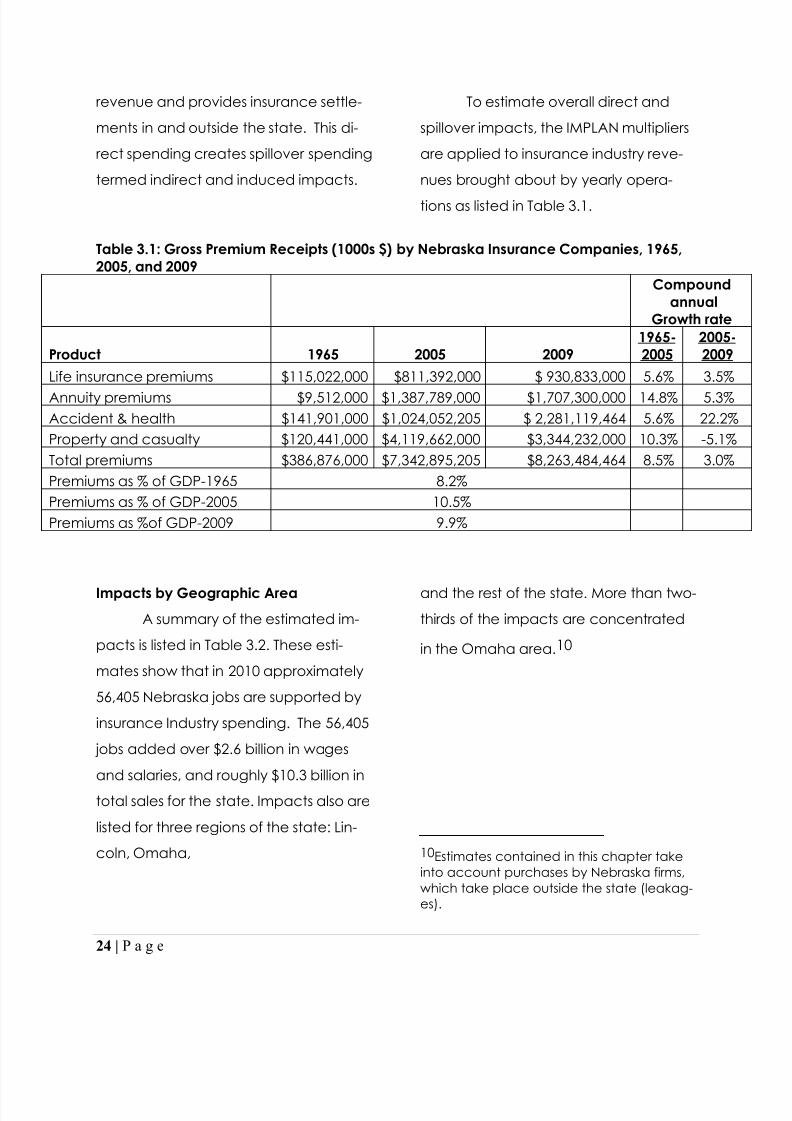
Table 3.1: Gross Premium Receipts (1000s $) by Nebraska Insurance Companies, 1965,2005, and 2009
Compoundannual
Growth rate
Product 1965 2005 20091965-2005
2005-2009
Life insurance premiums $115,022,000 $811,392,000 $ 930,833,000 5.6% 3.5%Annuity premiums $9,512,000 $1,387,789,000 $1,707,300,000 14.8% 5.3%Accident & health $141,901,000 $1,024,052,205 $ 2,281,119,464 5.6% 22.2%Property and casualty $120,441,000 $4,119,662,000 $3,344,232,000 10.3% -5.1%Total premiums $386,876,000 $7,342,895,205 $8,263,484,464 8.5% 3.0%Premiums as % of GDP-1965 8.2%Premiums as % of GDP-2005 10.5%Premiums as %of GDP-2009 9.9%
Impacts by Geographic Area
A summary of the estimated im-
pacts is listed in Table 3.2. These esti-
mates show that in 2010 approximately
56,405 Nebraska jobs are supported by
insurance Industry spending. The 56,405
jobs added over $2.6 billion in wages
and salaries, and roughly $10.3 billion in
total sales for the state. Impacts also are
listed for three regions of the state: Lin-
coln, Omaha,
and the rest of the state. More than two-
thirds of the impacts are concentrated
in the Omaha area. 10
10 Estimates contained in this chapter takeinto account purchases by Nebraska firms,which take place outside the state (leakag-es).
8/12/2019 2010 Insurance Industry Report
http://slidepdf.com/reader/full/2010-insurance-industry-report 31/50
25 | P a g e
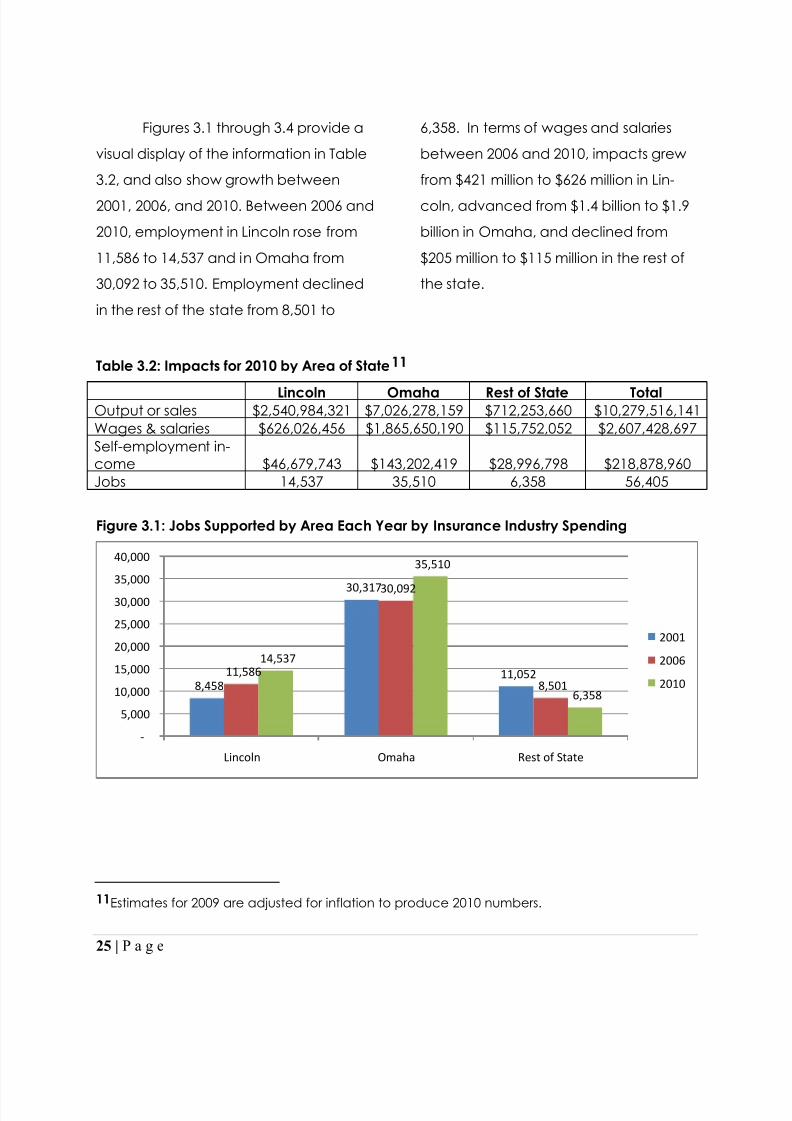
Figures 3.1 through 3.4 provide a
visual display of the information in Table
3.2, and also show growth between
2001, 2006, and 2010. Between 2006 and
2010, employment in Lincoln rose from
11,586 to 14,537 and in Omaha from
30,092 to 35,510. Employment declined
in the rest of the state from 8,501 to
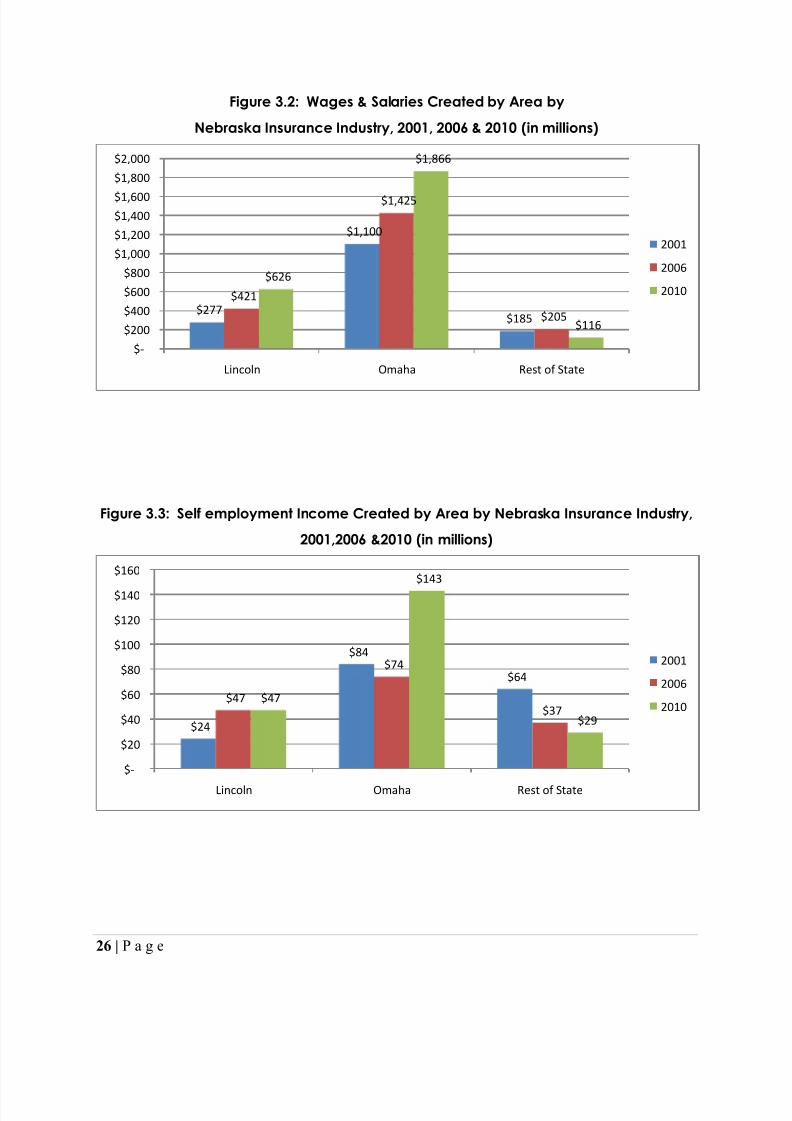
6,358. In terms of wages and salaries
between 2006 and 2010, impacts grew
from $421 million to $626 million in Lin-
coln, advanced from $1.4 billion to $1.9
billion in Omaha, and declined from
$205 million to $115 million in the rest of
the state.
Table 3.2: Impacts for 2010 by Area of State 11
Lincoln Omaha Rest of State TotalOutput or sales $2,540,984,321 $7,026,278,159 $712,253,660 $10,279,516,141Wages & salaries $626,026,456 $1,865,650,190 $115,752,052 $2,607,428,697Self-employment in-come $46,679,743 $143,202,419 $28,996,798 $218,878,960Jobs 14,537 35,510 6,358 56,405
Figure 3.1: Jobs Supported by Area Each Year by Insurance Industry Spending
11 Estimates for 2009 are adjusted for inflation to produce 2010 numbers.
8,458
30,317
11,05211,586
30,092
8,501
14,537
35,510
6,358
-
5,000
10,000
15,000
20,000
25,000
30,000
35,000
40,000
Lincoln Omaha Rest of State
2001
2006
2010
8/12/2019 2010 Insurance Industry Report
http://slidepdf.com/reader/full/2010-insurance-industry-report 32/50
26 | P a g e
Figure 3.2: Wages & Salaries Created by Area by
Nebraska Insurance Industry, 2001, 2006 & 2010 (in millions)
Figure 3.3: Self employment Income Created by Area by Nebraska Insurance Industry,
2001,2006 &2010 (in millions)
$277
$1,100
$185
$421
$1,425
$205
$626
$1,866
$116
$-
$200
$400
$600
$800
$1,000
$1,200
$1,400$1,600
$1,800
$2,000
Lincoln Omaha Rest of State
2001
2006
2010
$24
$84
$64
$47
$74
$37$47
$143
$29
$-
$20
$40
$60
$80
$100
$120
$140
$160
Lincoln Omaha Rest of State
2001
2006
2010
8/12/2019 2010 Insurance Industry Report
http://slidepdf.com/reader/full/2010-insurance-industry-report 33/50
27 | P a g e
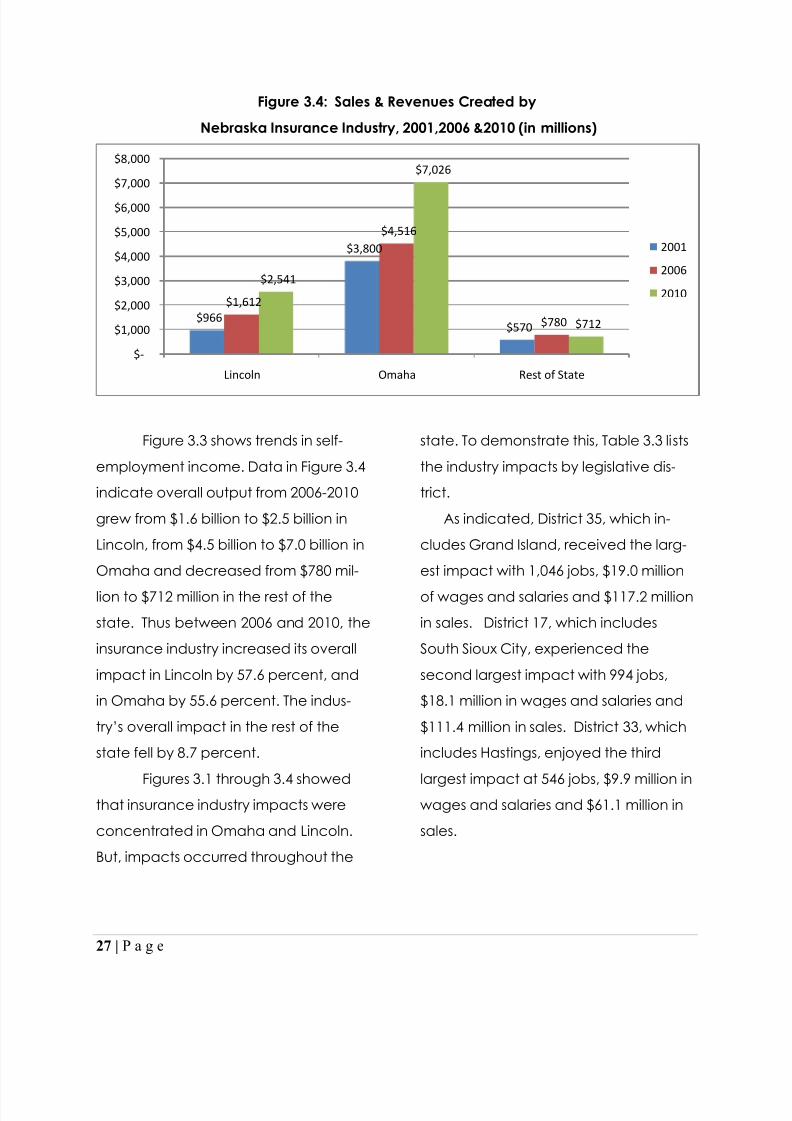
Figure 3.4: Sales & Revenues Created by
Nebraska Insurance Industry, 2001,2006 &2010 (in millions)
Figure 3.3 shows trends in self-
employment income. Data in Figure 3.4
indicate overall output from 2006-2010
grew from $1.6 billion to $2.5 billion in
Lincoln, from $4.5 billion to $7.0 billion in
Omaha and decreased from $780 mil-
lion to $712 million in the rest of the
state. Thus between 2006 and 2010, the
insurance industry increased its overall
impact in Lincoln by 57.6 percent, and
in Omaha by 55.6 percent. The indus-
try‟s overall impact in the rest of the
state fell by 8.7 percent.
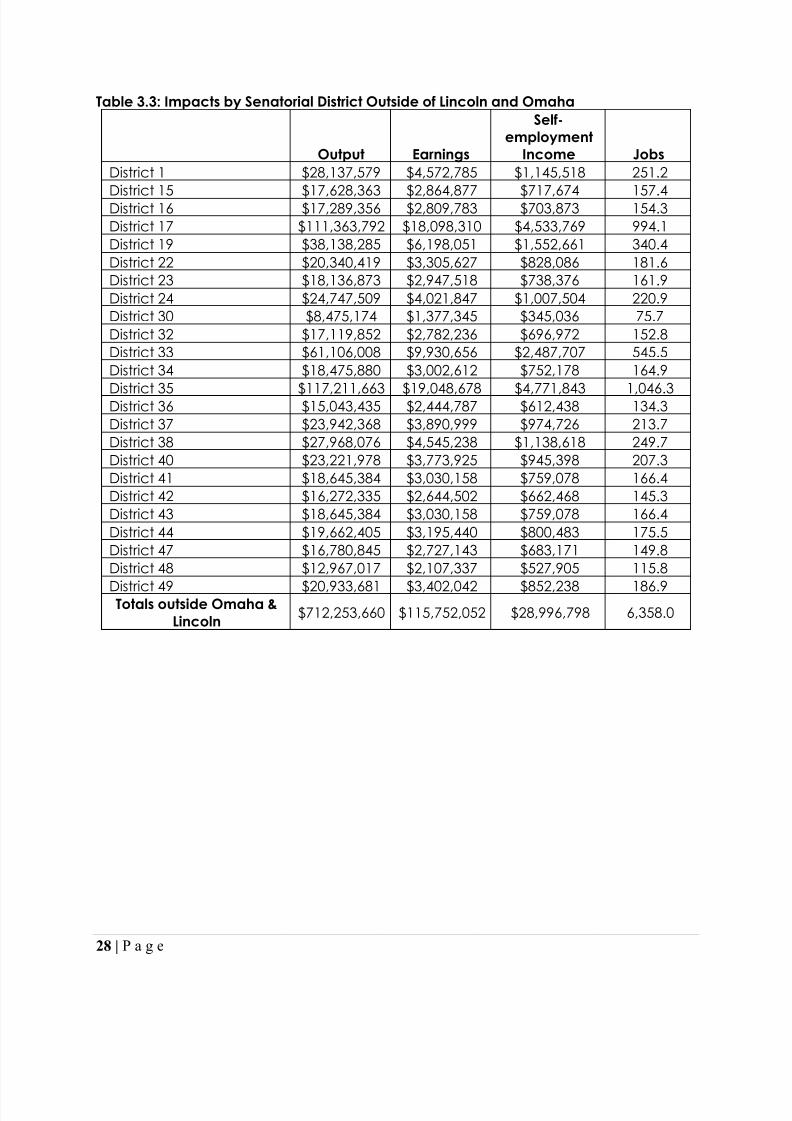
Figures 3.1 through 3.4 showedthat insurance industry impacts were
concentrated in Omaha and Lincoln.
But, impacts occurred throughout the
state. To demonstrate this, Table 3.3 lists
the industry impacts by legislative dis-
trict.
As indicated, District 35, which in-
cludes Grand Island, received the larg-
est impact with 1,046 jobs, $19.0 million
of wages and salaries and $117.2 million
in sales. District 17, which includes
South Sioux City, experienced the
second largest impact with 994 jobs,
$18.1 million in wages and salaries and
$111.4 million in sales. District 33, which
includes Hastings, enjoyed the third
largest impact at 546 jobs, $9.9 million inwages and salaries and $61.1 million in
sales.
$966
$3,800
$570
$1,612
$4,516
$780
$2,541
$7,026
$712
$-
$1,000
$2,000
$3,000
$4,000
$5,000
$6,000
$7,000
$8,000
Lincoln Omaha Rest of State
2001
2006
2010
8/12/2019 2010 Insurance Industry Report
http://slidepdf.com/reader/full/2010-insurance-industry-report 34/50
28 | P a g e
Table 3.3: Impacts by Senatorial District Outside of Lincoln and Omaha
Output Earnings
Self-employment
Income JobsDistrict 1 $28,137,579 $4,572,785 $1,145,518 251.2
District 15 $17,628,363 $2,864,877 $717,674 157.4District 16 $17,289,356 $2,809,783 $703,873 154.3District 17 $111,363,792 $18,098,310 $4,533,769 994.1District 19 $38,138,285 $6,198,051 $1,552,661 340.4District 22 $20,340,419 $3,305,627 $828,086 181.6District 23 $18,136,873 $2,947,518 $738,376 161.9District 24 $24,747,509 $4,021,847 $1,007,504 220.9District 30 $8,475,174 $1,377,345 $345,036 75.7District 32 $17,119,852 $2,782,236 $696,972 152.8District 33 $61,106,008 $9,930,656 $2,487,707 545.5District 34 $18,475,880 $3,002,612 $752,178 164.9
District 35 $117,211,663 $19,048,678 $4,771,843 1,046.3District 36 $15,043,435 $2,444,787 $612,438 134.3District 37 $23,942,368 $3,890,999 $974,726 213.7District 38 $27,968,076 $4,545,238 $1,138,618 249.7District 40 $23,221,978 $3,773,925 $945,398 207.3District 41 $18,645,384 $3,030,158 $759,078 166.4District 42 $16,272,335 $2,644,502 $662,468 145.3District 43 $18,645,384 $3,030,158 $759,078 166.4District 44 $19,662,405 $3,195,440 $800,483 175.5District 47 $16,780,845 $2,727,143 $683,171 149.8District 48 $12,967,017 $2,107,337 $527,905 115.8
District 49 $20,933,681 $3,402,042 $852,238 186.9Totals outside Omaha &Lincoln $712,253,660 $115,752,052 $28,996,798 6,358.0
8/12/2019 2010 Insurance Industry Report
http://slidepdf.com/reader/full/2010-insurance-industry-report 35/50
29 | P a g e
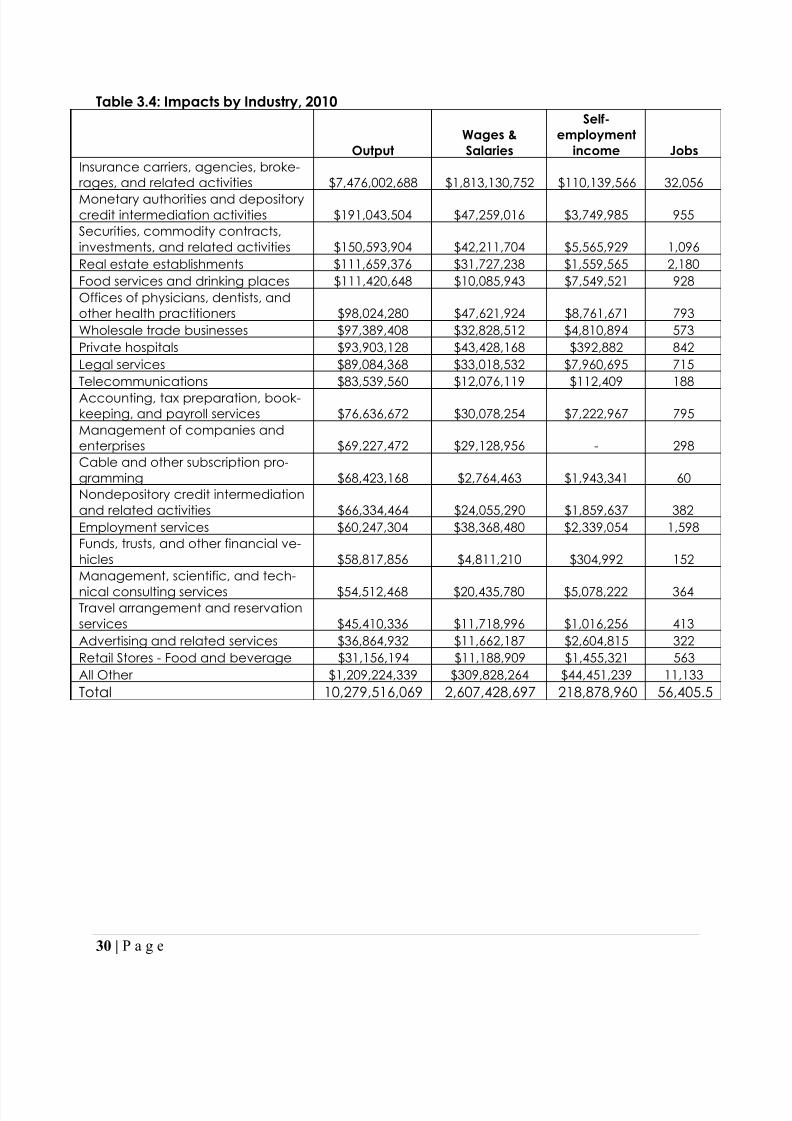
Impacts by Industry
Table 3.4 shows 2010 impacts
broken down by industry. Of the 56,405
total jobs supported, the real estate in-
dustry is the major recipient industry,
outside of insurance, with 2,180 jobs
supported indirectly in 2010 by
insurance industry premiums. As pre-
sented in Table 3.4 insurance industry
spending had the largest wage & salary
spillover impact on the Offices of physi-
cians, dentists, and other health practi-
tioners industry with more than $47.6 mil-lion in wages and salaries created for
2010.
Data in Table 3.4 show that the
insurance industry supports 24,350 spil-
lover jobs for 2010. This means that for
every ten insurance job created in the
state by the insurance industry another
7.6 jobs are supported in spillover indus-
tries in the state.
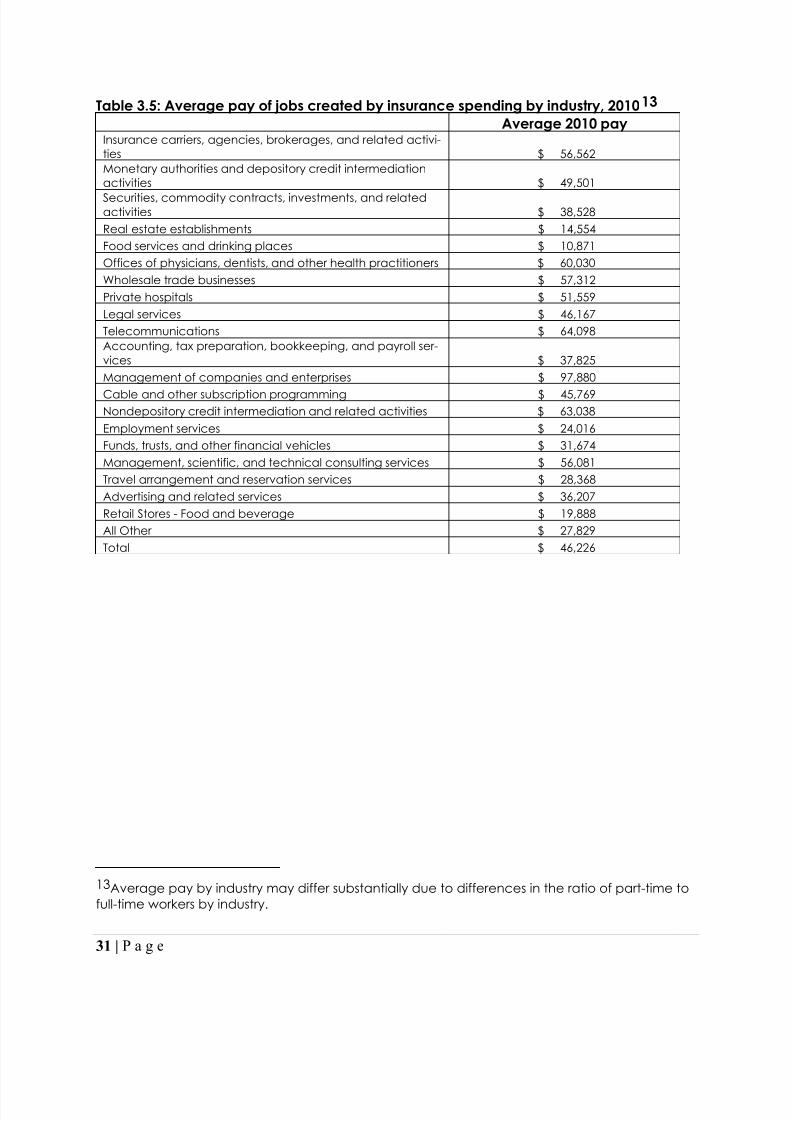
Table 3.5 lists average salary per
spillover job created by insurance indus-
try spending in the state of Nebraska.
The top earning industries in terms of
wages and salaries per job were man-
agement consulting at $97,880, and tel-
ecommunications at $64,098. The av-
erage salary per job supported by insur-
ance industry spending was $46,226
which is significantly above the average
pay for all private jobs in Nebraska of
$37,696. 12
12 Total wages and salaries were$37,527,418,000 for 995,523 jobs (2008, U.S.Bureau of Economic Analysis).
… approximately 56,405 Nebraska
jobs are supported for 2010 by insur-
ance industry spending .
8/12/2019 2010 Insurance Industry Report
http://slidepdf.com/reader/full/2010-insurance-industry-report 36/50
30 | P a g e
Table 3.4: Impacts by Industry, 2010
OutputWages &Salaries
Self-employment
income JobsInsurance carriers, agencies, broke-rages, and related activities $7,476,002,688 $1,813,130,752 $110,139,566 32,056Monetary authorities and depositorycredit intermediation activities $191,043,504 $47,259,016 $3,749,985 955Securities, commodity contracts,investments, and related activities $150,593,904 $42,211,704 $5,565,929 1,096Real estate establishments $111,659,376 $31,727,238 $1,559,565 2,180Food services and drinking places $111,420,648 $10,085,943 $7,549,521 928Offices of physicians, dentists, andother health practitioners $98,024,280 $47,621,924 $8,761,671 793Wholesale trade businesses $97,389,408 $32,828,512 $4,810,894 573Private hospitals $93,903,128 $43,428,168 $392,882 842Legal services $89,084,368 $33,018,532 $7,960,695 715Telecommunications $83,539,560 $12,076,119 $112,409 188Accounting, tax preparation, book-keeping, and payroll services $76,636,672 $30,078,254 $7,222,967 795Management of companies andenterprises $69,227,472 $29,128,956 - 298Cable and other subscription pro-gramming $68,423,168 $2,764,463 $1,943,341 60Nondepository credit intermediationand related activities $66,334,464 $24,055,290 $1,859,637 382Employment services $60,247,304 $38,368,480 $2,339,054 1,598Funds, trusts, and other financial ve-hicles $58,817,856 $4,811,210 $304,992 152Management, scientific, and tech-nical consulting services $54,512,468 $20,435,780 $5,078,222 364Travel arrangement and reservationservices $45,410,336 $11,718,996 $1,016,256 413Advertising and related services $36,864,932 $11,662,187 $2,604,815 322Retail Stores - Food and beverage $31,156,194 $11,188,909 $1,455,321 563All Other $1,209,224,339 $309,828,264 $44,451,239 11,133Total 10,279,516,069 2,607,428,697 218,878,960 56,405.5
8/12/2019 2010 Insurance Industry Report
http://slidepdf.com/reader/full/2010-insurance-industry-report 37/50
31 | P a g e
Table 3.5: Average pay of jobs created by insurance spending by industry, 2010 13 Average 2010 pay
Insurance carriers, agencies, brokerages, and related activi-ties $ 56,562Monetary authorities and depository credit intermediationactivities $ 49,501
Securities, commodity contracts, investments, and relatedactivities $ 38,528Real estate establishments $ 14,554Food services and drinking places $ 10,871Offices of physicians, dentists, and other health practitioners $ 60,030Wholesale trade businesses $ 57,312Private hospitals $ 51,559Legal services $ 46,167Telecommunications $ 64,098Accounting, tax preparation, bookkeeping, and payroll ser-vices $ 37,825Management of companies and enterprises $ 97,880
Cable and other subscription programming $ 45,769Nondepository credit intermediation and related activities $ 63,038Employment services $ 24,016Funds, trusts, and other financial vehicles $ 31,674Management, scientific, and technical consulting services $ 56,081Travel arrangement and reservation services $ 28,368Advertising and related services $ 36,207Retail Stores - Food and beverage $ 19,888All Other $ 27,829Total $ 46,226
13 Average pay by industry may differ substantially due to differences in the ratio of part-time tofull-time workers by industry.
8/12/2019 2010 Insurance Industry Report
http://slidepdf.com/reader/full/2010-insurance-industry-report 38/50
32 | P a g e
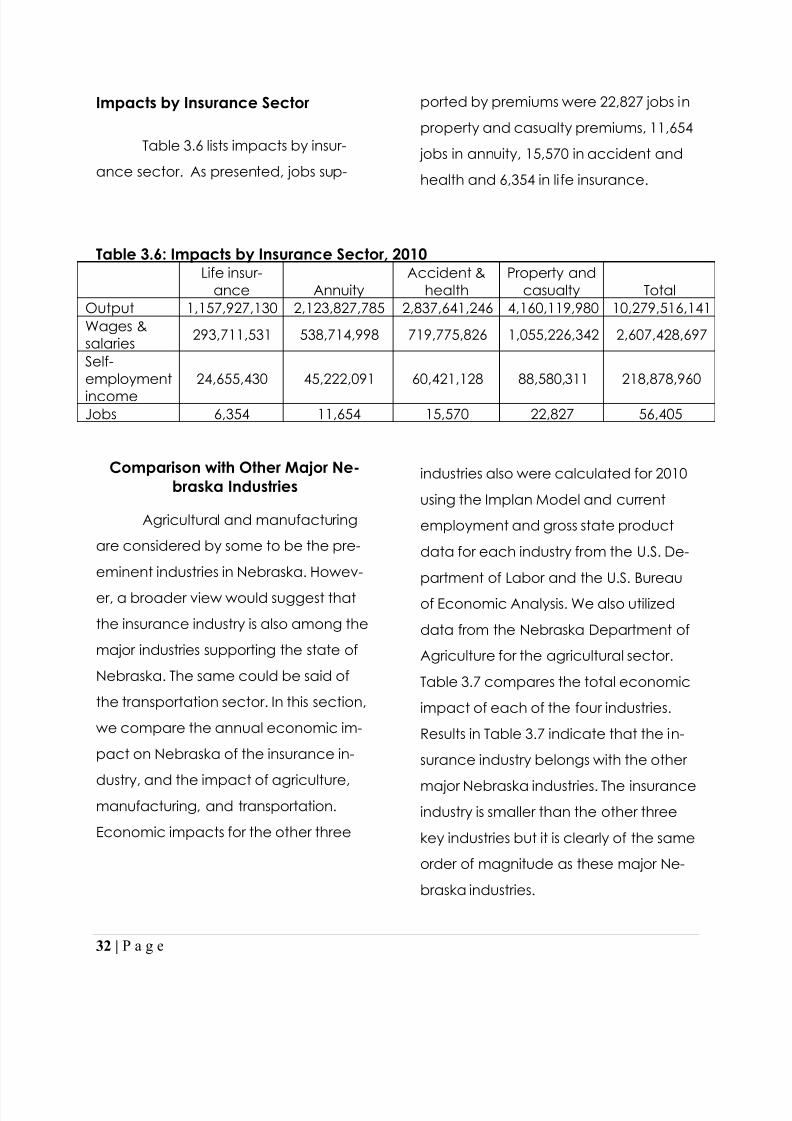
Impacts by Insurance Sector
Table 3.6 lists impacts by insur-
ance sector. As presented, jobs sup-
ported by premiums were 22,827 jobs in
property and casualty premiums, 11,654
jobs in annuity, 15,570 in accident and
health and 6,354 in life insurance.
Table 3.6: Impacts by Insurance Sector, 2010Life insur-
ance AnnuityAccident &
healthProperty and
casualty TotalOutput 1,157,927,130 2,123,827,785 2,837,641,246 4,160,119,980 10,279,516,141Wages &salaries 293,711,531 538,714,998 719,775,826 1,055,226,342 2,607,428,697
Self-employmentincome
24,655,430 45,222,091 60,421,128 88,580,311 218,878,960
Jobs 6,354 11,654 15,570 22,827 56,405
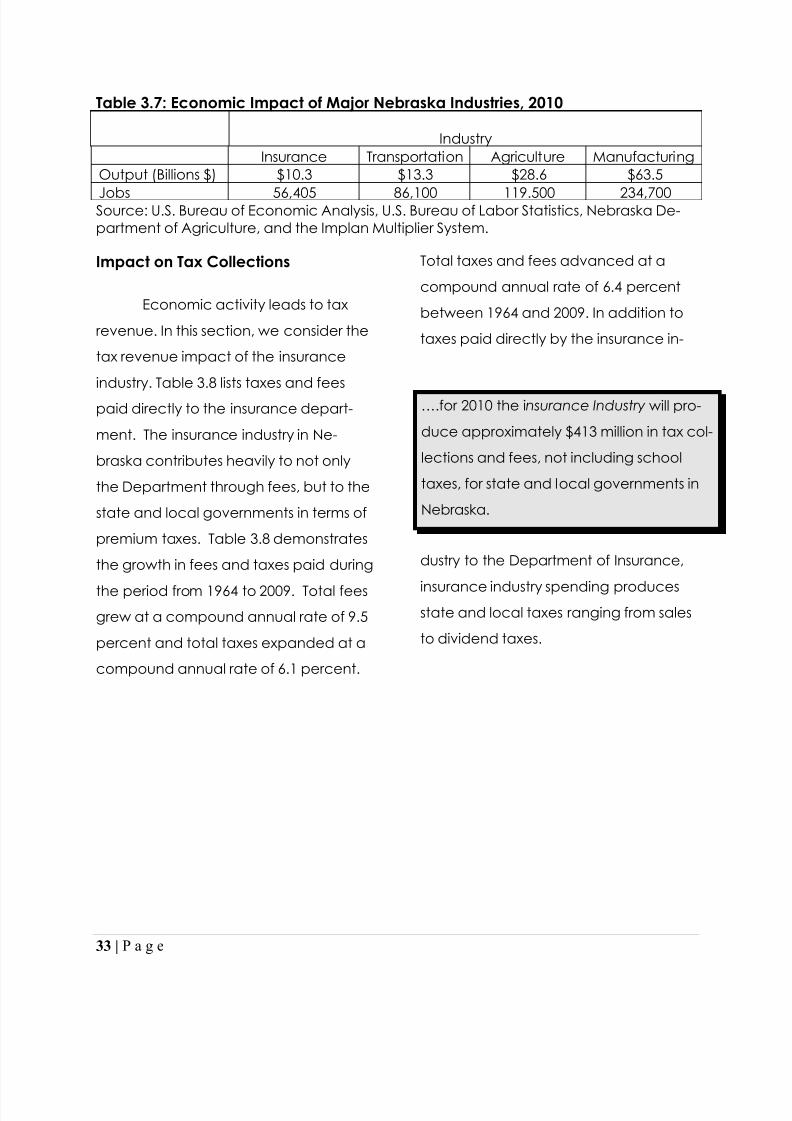
Comparison with Other Major Ne-braska Industries
Agricultural and manufacturing
are considered by some to be the pre-
eminent industries in Nebraska. Howev-
er, a broader view would suggest that
the insurance industry is also among the
major industries supporting the state of
Nebraska. The same could be said of
the transportation sector. In this section,
we compare the annual economic im-
pact on Nebraska of the insurance in-
dustry, and the impact of agriculture,manufacturing, and transportation.
Economic impacts for the other three
industries also were calculated for 2010
using the Implan Model and current
employment and gross state product
data for each industry from the U.S. De-
partment of Labor and the U.S. Bureau
of Economic Analysis. We also utilized
data from the Nebraska Department of
Agriculture for the agricultural sector.
Table 3.7 compares the total economic
impact of each of the four industries.
Results in Table 3.7 indicate that the in-
surance industry belongs with the other
major Nebraska industries. The insuranceindustry is smaller than the other three
key industries but it is clearly of the same
order of magnitude as these major Ne-
braska industries.
8/12/2019 2010 Insurance Industry Report
http://slidepdf.com/reader/full/2010-insurance-industry-report 39/50
33 | P a g e
Table 3.7: Economic Impact of Major Nebraska Industries, 2010
IndustryInsurance Transportation Agriculture Manufacturing
Output (Billions $) $10.3 $13.3 $28.6 $63.5
Jobs 56,405 86,100 119.500 234,700Source: U.S. Bureau of Economic Analysis, U.S. Bureau of Labor Statistics, Nebraska De-partment of Agriculture, and the Implan Multiplier System.
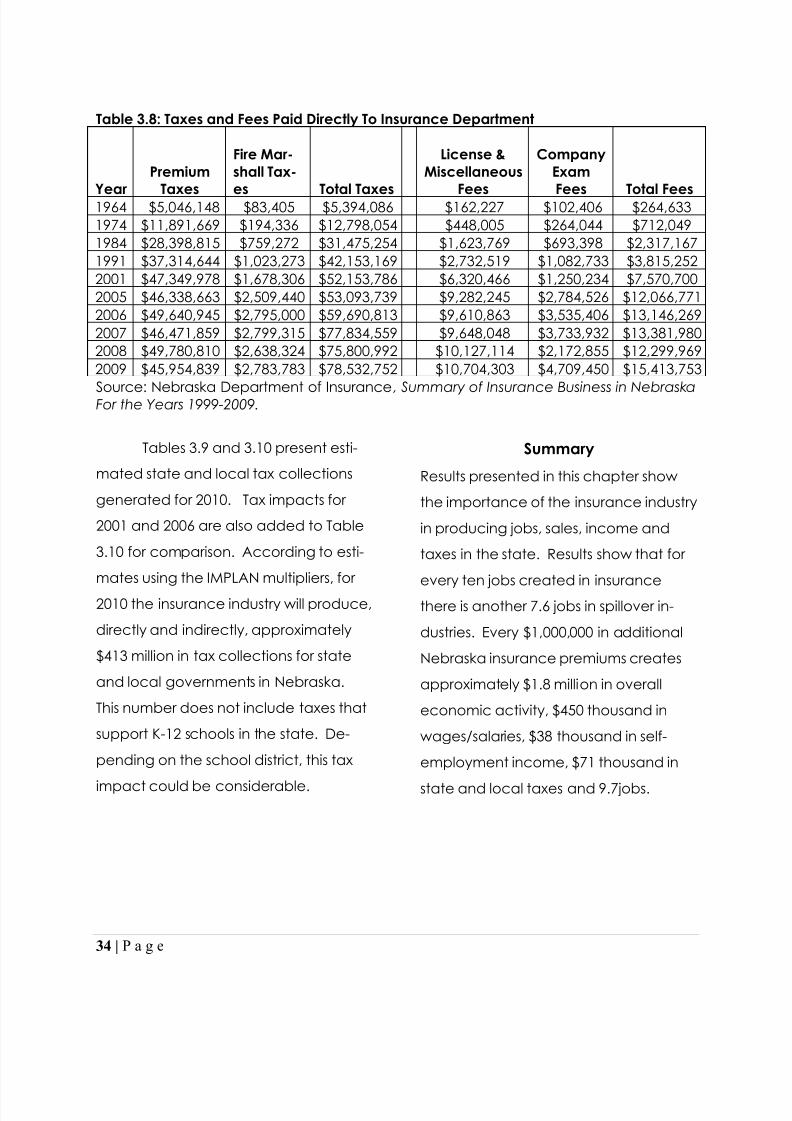
Impact on Tax Collections
Economic activity leads to tax
revenue. In this section, we consider the
tax revenue impact of the insurance
industry. Table 3.8 lists taxes and fees
paid directly to the insurance depart-
ment. The insurance industry in Ne-
braska contributes heavily to not only
the Department through fees, but to the
state and local governments in terms of
premium taxes. Table 3.8 demonstrates
the growth in fees and taxes paid during
the period from 1964 to 2009. Total feesgrew at a compound annual rate of 9.5
percent and total taxes expanded at a
compound annual rate of 6.1 percent.
Total taxes and fees advanced at a
compound annual rate of 6.4 percent
between 1964 and 2009. In addition to
taxes paid directly by the insurance in-
dustry to the Department of Insurance,
insurance industry spending producesstate and local taxes ranging from sales
to dividend taxes.
….for 2010 the i nsurance Industry will pro-
duce approximately $413 million in tax col-
lections and fees, not including school
taxes, for state and local governments in
Nebraska.
8/12/2019 2010 Insurance Industry Report
http://slidepdf.com/reader/full/2010-insurance-industry-report 40/50
34 | P a g e
Table 3.8: Taxes and Fees Paid Directly To Insurance Department
Year
Premium
Taxes
Fire Mar-shall Tax-
es Total Taxes
License &Miscellaneous
Fees
CompanyExam
Fees Total Fees1964 $5,046,148 $83,405 $5,394,086 $162,227 $102,406 $264,6331974 $11,891,669 $194,336 $12,798,054 $448,005 $264,044 $712,0491984 $28,398,815 $759,272 $31,475,254 $1,623,769 $693,398 $2,317,1671991 $37,314,644 $1,023,273 $42,153,169 $2,732,519 $1,082,733 $3,815,2522001 $47,349,978 $1,678,306 $52,153,786 $6,320,466 $1,250,234 $7,570,7002005 $46,338,663 $2,509,440 $53,093,739 $9,282,245 $2,784,526 $12,066,7712006 $49,640,945 $2,795,000 $59,690,813 $9,610,863 $3,535,406 $13,146,2692007 $46,471,859 $2,799,315 $77,834,559 $9,648,048 $3,733,932 $13,381,9802008 $49,780,810 $2,638,324 $75,800,992 $10,127,114 $2,172,855 $12,299,9692009 $45,954,839 $2,783,783 $78,532,752 $10,704,303 $4,709,450 $15,413,753
Source: Nebraska Department of Insurance , Summary of Insurance Business in NebraskaFor the Years 1999-2009.
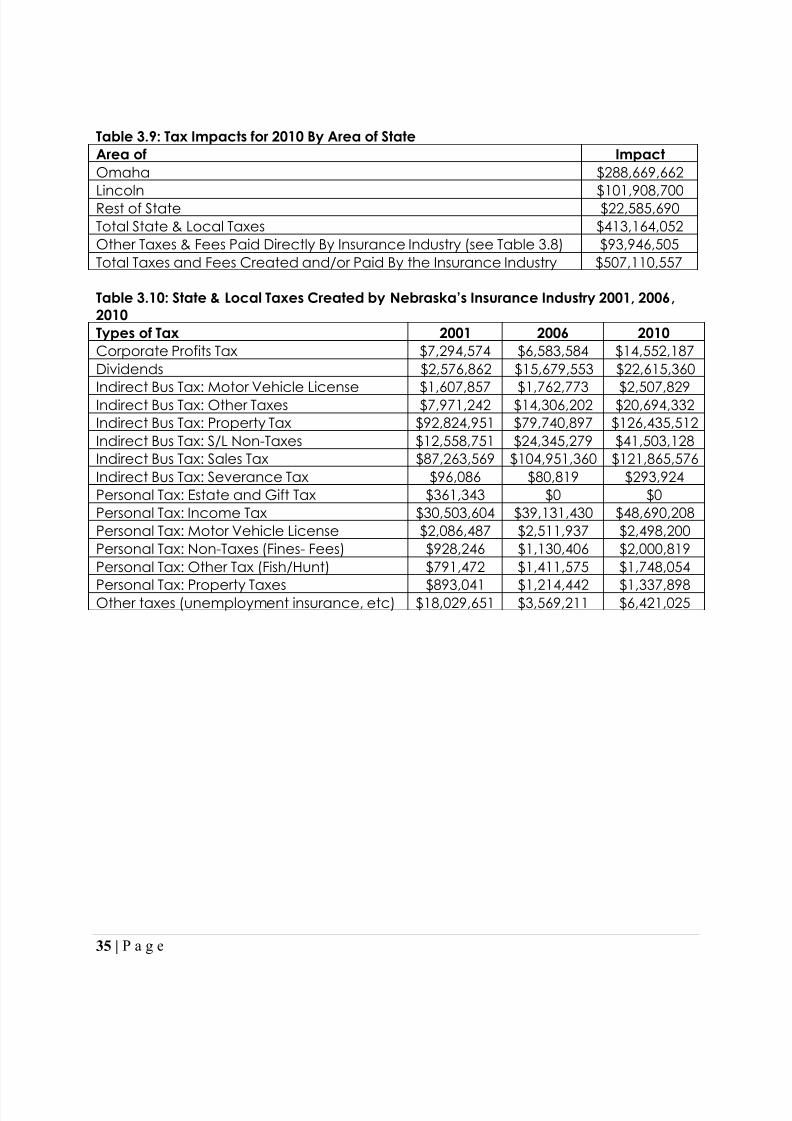
Tables 3.9 and 3.10 present esti-
mated state and local tax collections
generated for 2010. Tax impacts for
2001 and 2006 are also added to Table
3.10 for comparison. According to esti-
mates using the IMPLAN multipliers, for
2010 the insurance industry will produce,
directly and indirectly, approximately
$413 million in tax collections for state
and local governments in Nebraska.
This number does not include taxes that
support K-12 schools in the state. De-
pending on the school district, this tax
impact could be considerable.
Summary
Results presented in this chapter show
the importance of the insurance industry
in producing jobs, sales, income and
taxes in the state. Results show that for
every ten jobs created in insurance
there is another 7.6 jobs in spillover in-
dustries. Every $1,000,000 in additional
Nebraska insurance premiums creates
approximately $1.8 million in overall
economic activity, $450 thousand in
wages/salaries, $38 thousand in self-
employment income, $71 thousand in
state and local taxes and 9.7jobs.
8/12/2019 2010 Insurance Industry Report
http://slidepdf.com/reader/full/2010-insurance-industry-report 41/50
35 | P a g e
Table 3.9: Tax Impacts for 2010 By Area of StateArea of ImpactOmaha $288,669,662
Lincoln $101,908,700Rest of State $22,585,690Total State & Local Taxes $413,164,052Other Taxes & Fees Paid Directly By Insurance Industry (see Table 3.8) $93,946,505Total Taxes and Fees Created and/or Paid By the Insurance Industry $507,110,557
Table 3.10: State & Local Taxes Created by Nebraska’s Insurance Industry 2001, 2006 ,2010Types of Tax 2001 2006 2010Corporate Profits Tax $7,294,574 $6,583,584 $14,552,187Dividends $2,576,862 $15,679,553 $22,615,360
Indirect Bus Tax: Motor Vehicle License $1,607,857 $1,762,773 $2,507,829Indirect Bus Tax: Other Taxes $7,971,242 $14,306,202 $20,694,332Indirect Bus Tax: Property Tax $92,824,951 $79,740,897 $126,435,512Indirect Bus Tax: S/L Non-Taxes $12,558,751 $24,345,279 $41,503,128Indirect Bus Tax: Sales Tax $87,263,569 $104,951,360 $121,865,576Indirect Bus Tax: Severance Tax $96,086 $80,819 $293,924Personal Tax: Estate and Gift Tax $361,343 $0 $0Personal Tax: Income Tax $30,503,604 $39,131,430 $48,690,208Personal Tax: Motor Vehicle License $2,086,487 $2,511,937 $2,498,200Personal Tax: Non-Taxes (Fines- Fees) $928,246 $1,130,406 $2,000,819Personal Tax: Other Tax (Fish/Hunt) $791,472 $1,411,575 $1,748,054
Personal Tax: Property Taxes $893,041 $1,214,442 $1,337,898Other taxes (unemployment insurance, etc) $18,029,651 $3,569,211 $6,421,025
8/12/2019 2010 Insurance Industry Report
http://slidepdf.com/reader/full/2010-insurance-industry-report 42/50
36 | P a g e
Chapter 4
Nebraska’s Insurance Industry: Contributions to Brain Gain
Introduction
In the previous three Chapters we
established that the Nebraska insurance
industry has a substantial economic im-
pact on the state, that the industry pays
above average wages, and that the
industry continues to grow. All three find-
ings strongly suggest that the industry
creates substantial opportunities for Ne-
braska workers. The magnitude and na-
ture of these opportunities is examined
in more detail in this Chapter. In particu-
lar, we examine the ability of the Ne-
braska insurance industry to create new
job opportunities within the state
through net job growth, and throughretirements or other types of separations
of the existing workforce. We also con-
sider the nature of these job opportuni-
ties in terms of education requirementsand skills, and the related potential of
the industry to create job opportunities
for young Nebraskans. The latter issue is
particularly important in a state like Ne-
braska that is affected by “brain drain”
or the net loss of younger, educated
workers to other states. In particular, by
creating many high wage job opportun-
ities each year with significant skill re-
quirements, the industry may help retain
young education workers within the
state. In this sense, the insurance industry
contributes to “brain gain ” in Nebraska.
In the next section of the report
we estimate the annual number of job
openings that will occur in the Nebraska
insurance industry over the next dec-
ade. In the last section, we consider the
skill requirements of new job opportuni-
ties in the Nebraska insurance industry.We specifically seek to identify occupa-
tions that hire workers with post-
secondary education. Throughout this
chapter, we also report on a series of
interviews we conducted with Nebraska
insurance executives.
… the insurance industry contributes to
“brain gain” in the Nebraska.
8/12/2019 2010 Insurance Industry Report
http://slidepdf.com/reader/full/2010-insurance-industry-report 43/50
37 | P a g e
Net Job Openings in the NebraskaInsurance Industry
Job openings in an economy
flow from two sources. Job openings na-
turally result when an industry expands
and requires an increase in the number
of workers. Net job openings also occur
when existing industry employees leave
the industry through retirement, death,
or disability. We examine both net job
growth and net job opportunities from
retirement, beginning with openingsdue to net job growth.
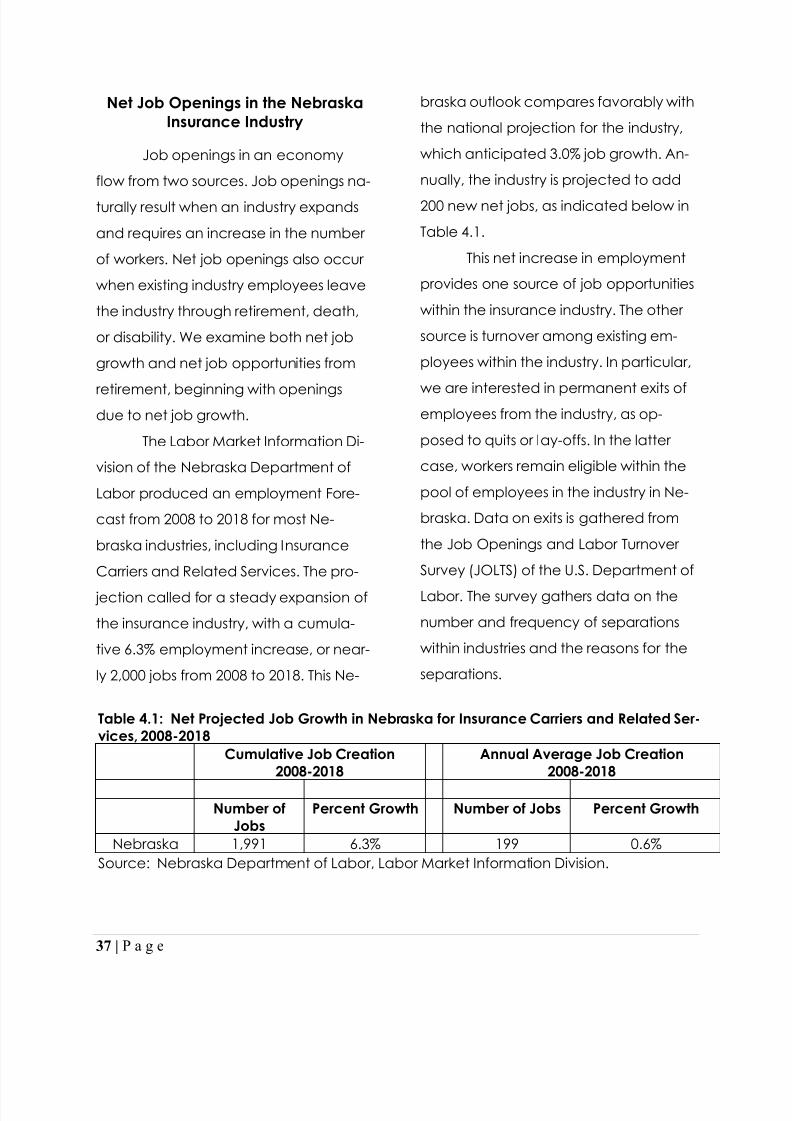
The Labor Market Information Di-
vision of the Nebraska Department of
Labor produced an employment Fore-
cast from 2008 to 2018 for most Ne-
braska industries, including Insurance
Carriers and Related Services. The pro-
jection called for a steady expansion of
the insurance industry, with a cumula-
tive 6.3% employment increase, or near-
ly 2,000 jobs from 2008 to 2018. This Ne-
braska outlook compares favorably with
the national projection for the industry,
which anticipated 3.0% job growth. An-
nually, the industry is projected to add
200 new net jobs, as indicated below in
Table 4.1.
This net increase in employment
provides one source of job opportunities
within the insurance industry. The other
source is turnover among existing em-
ployees within the industry. In particular,
we are interested in permanent exits ofemployees from the industry, as op-
posed to quits or lay-offs. In the latter
case, workers remain eligible within the
pool of employees in the industry in Ne-
braska. Data on exits is gathered from
the Job Openings and Labor Turnover
Survey (JOLTS) of the U.S. Department of
Labor. The survey gathers data on the
number and frequency of separations
within industries and the reasons for the
separations.
Table 4.1: Net Projected Job Growth in Nebraska for Insurance Carriers and Related Ser-vices, 2008-2018
Cumulative Job Creation2008-2018
Annual Average Job Creation2008-2018
Number ofJobs
Percent Growth Number of Jobs Percent Growth
Nebraska 1,991 6.3% 199 0.6%Source: Nebraska Department of Labor, Labor Market Information Division.
8/12/2019 2010 Insurance Industry Report
http://slidepdf.com/reader/full/2010-insurance-industry-report 44/50
8/12/2019 2010 Insurance Industry Report
http://slidepdf.com/reader/full/2010-insurance-industry-report 45/50
39 | P a g e
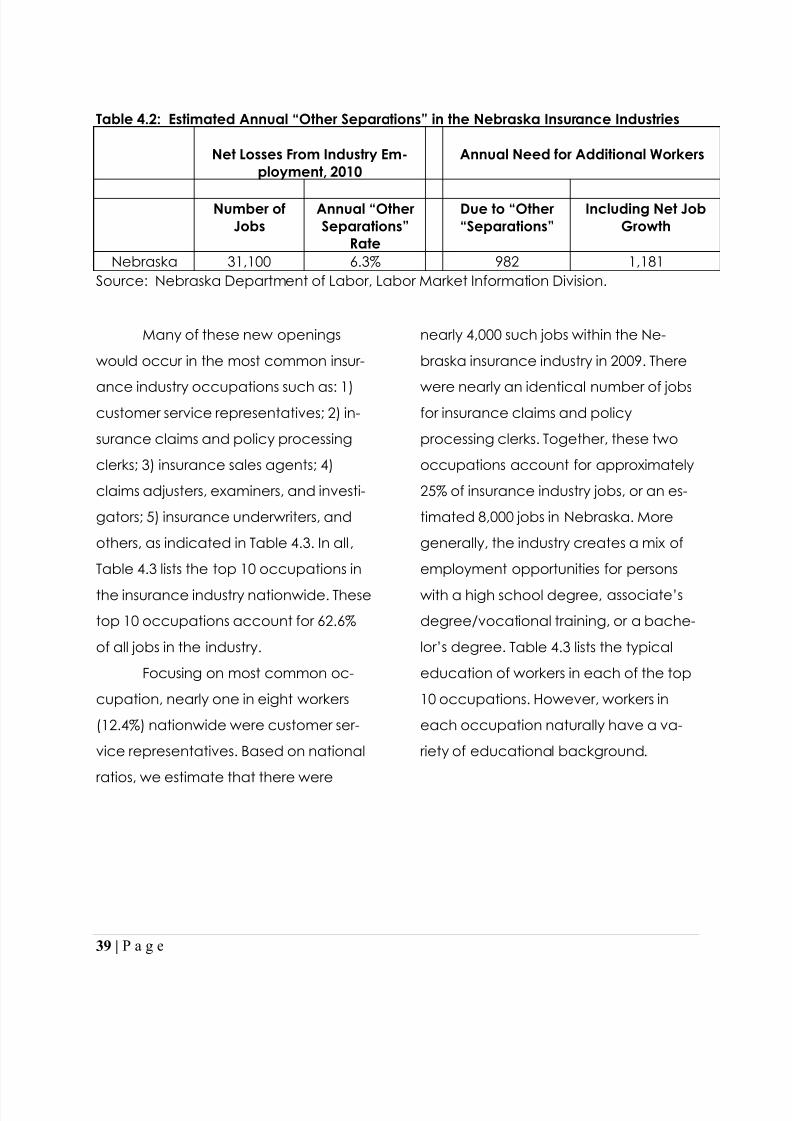
Table 4.2: Estimated Annual “Other Separations” in the Nebraska Insurance Industries
Net Losses From Industry Em-ployment, 2010
Annual Need for Additional Workers
Number ofJobs
Annual “OtherSeparations”
Rate
Due to “Other“Separations”
Including Net JobGrowth
Nebraska 31,100 6.3% 982 1,181Source: Nebraska Department of Labor, Labor Market Information Division.
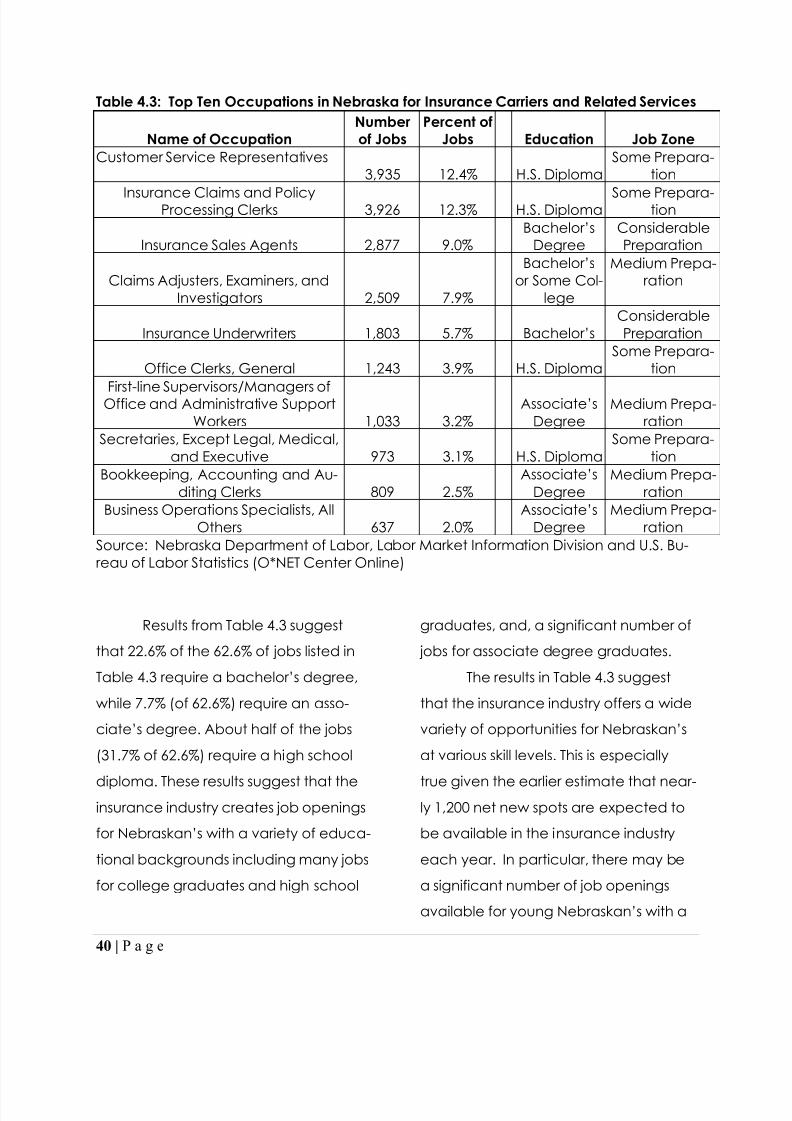
Many of these new openings
would occur in the most common insur-
ance industry occupations such as: 1)customer service representatives; 2) in-
surance claims and policy processing
clerks; 3) insurance sales agents; 4)
claims adjusters, examiners, and investi-
gators; 5) insurance underwriters, and
others, as indicated in Table 4.3. In all,
Table 4.3 lists the top 10 occupations in
the insurance industry nationwide. These
top 10 occupations account for 62.6%
of all jobs in the industry.
Focusing on most common oc-
cupation, nearly one in eight workers
(12.4%) nationwide were customer ser-
vice representatives. Based on national
ratios, we estimate that there were
nearly 4,000 such jobs within the Ne-
braska insurance industry in 2009. There
were nearly an identical number of jobsfor insurance claims and policy
processing clerks. Together, these two
occupations account for approximately
25% of insurance industry jobs, or an es-
timated 8,000 jobs in Nebraska. More
generally, the industry creates a mix of
employment opportunities for persons
with a high school degree, associate‟s
degree/vocational training, or a bache-
lor‟s degree. Table 4.3 lists the typical
education of workers in each of the top
10 occupations. However, workers in
each occupation naturally have a va-
riety of educational background.
8/12/2019 2010 Insurance Industry Report
http://slidepdf.com/reader/full/2010-insurance-industry-report 46/50
40 | P a g e
Table 4.3: Top Ten Occupations in Nebraska for Insurance Carriers and Related Services
Name of OccupationNumberof Jobs
Percent ofJobs Education Job Zone
Customer Service Representatives3,935 12.4% H.S. Diploma
Some Prepara-tion
Insurance Claims and PolicyProcessing Clerks 3,926 12.3% H.S. Diploma Some Prepara-tion
Insurance Sales Agents 2,877 9.0%Bachelor‟s
DegreeConsiderablePreparation
Claims Adjusters, Examiners, andInvestigators 2,509 7.9%
Bachelor‟sor Some Col-
lege
Medium Prepa-ration
Insurance Underwriters 1,803 5.7% Bachelor‟s ConsiderablePreparation
Office Clerks, General 1,243 3.9% H.S. DiplomaSome Prepara-
tion
First-line Supervisors/Managers ofOffice and Administrative SupportWorkers 1,033 3.2%
Associate‟sDegree
Medium Prepa-ration
Secretaries, Except Legal, Medical,and Executive 973 3.1% H.S. Diploma
Some Prepara-tion
Bookkeeping, Accounting and Au-diting Clerks 809 2.5%
Associate‟sDegree
Medium Prepa-ration
Business Operations Specialists, AllOthers 637 2.0%
Associate‟sDegree
Medium Prepa-ration
Source: Nebraska Department of Labor, Labor Market Information Division and U.S. Bu-reau of Labor Statistics (O*NET Center Online)
Results from Table 4.3 suggest
that 22.6% of the 62.6% of jobs listed in
Table 4.3 require a bachelor‟s degree,
while 7.7% (of 62.6%) require an asso-
ciate‟s degree. About half of the jobs
(31.7% of 62.6%) require a high school
diploma. These results suggest that theinsurance industry creates job openings
for Nebraskan‟s with a variety of educ a-
tional backgrounds including many jobs
for college graduates and high school
graduates, and, a significant number of
jobs for associate degree graduates.
The results in Table 4.3 suggest
that the insurance industry offers a wide
variety of opportunities for Nebraskan‟s
at various skill levels. This is especially
true given the earlier estimate that near-ly 1,200 net new spots are expected to
be available in the insurance industry
each year. In particular, there may be
a significant number of job openings
available for young Nebraskan‟s with a
8/12/2019 2010 Insurance Industry Report
http://slidepdf.com/reader/full/2010-insurance-industry-report 47/50
41 | P a g e
variety of educational backgrounds,
including many jobs for young workers
who have obtained post-secondary
education. Therefore, these results show
that the insurance industry has and can
continue to create opportunities to
keep young Nebraskan‟s in the state
and contribute to “brain gain” among
the educated workforce.
Such efforts a brain gain can be
enhanced through efforts to improve
education opportunities for youngworkers. In particular, in our interview
with insurance industry executives, res-
pondents expressed satisfaction with the
quality of Nebraska workers. Executives
also identified far more advantages for
location in the State of Nebraska than
disadvantages. The principal advan-
tages included reasonable insurance
taxes, a quality workforce with an inter-
est in remaining in the region, and good
schools at the primary, secondary and
post-secondary level. The primary con-
cern among respondents was income
and property tax rates in the state.
The executives also saw a num-
ber of advantages and opportunities for
building the insurance industry work-
force in Nebraska. Executives noted
programs to train insurance industry
workers such as the actuarial science
program at the University of Nebraska-
Lincoln and training programs offered
by community colleges in both theOmaha and Lincoln areas. The execu-
tives also suggested that additional
training programs be offered including
increased information technology train-
ing for business students, and more
coursework to inform students about is-
sues central to the insurance industry.
Such additional efforts to prepare Ne-
braska students for success in the insur-
ance industry could further enhance
brain gain in the State of Nebraska.
8/12/2019 2010 Insurance Industry Report
http://slidepdf.com/reader/full/2010-insurance-industry-report 48/50
42 | P a g e
References
Bartik, T. Who benefits from state and local economic development policies?Kalamazoo, MI: W.E. Upjohn Institute, 1991.
Christianson, J. and L. Faulkner. "The Contribution of Rural Hospitals to LocalEconomies," Inquiry, Vol. 18(1), 1981, pp. 46-60.
Crihfield, J. B. and Harrison S. Campbell. "Evaluating Alternative Regional Plan-ning Models." Growth and Change, 22, 1991, pp. 1-16.
Erickson, R. A. Gavin, N. and S. Cordes. "The Economic Impacts of the HospitalSector." Growth and Change, Vol. 17, pp. 17-27.
Farmer, F.L., M.K. Miller and D.E. Voth. "Evaluation of Rural Health Care Programs
Employing Unobserved Variable Models: Impact on Infant Mortality." Rural Sociology,Vol. 95(1), 1991, pp. 127-142.
Garrison, Charles. "The Impact of a Rural Hospital on Economic Development,"Growth and Change, 1974.
Gooding, E.P. and S.J. Weiss. "Estimation Of Differential Employment Multiplier ina Small Regional Economy," Research Report No. 37, 1966, Federal Research Bank ofBoston, Boston, MA.
Goss, E.P. “The Impact of the College World Series on the Omaha MetropolitanArea,” Omaha Visitors and Convention Bureau, Spring 2000.
Goss, E.P. and G.S. Vozikis. “High Tech Manufacturing: Firm Size, Industry andPopulation Density,” Small Business Economics, Vol. 6(3), 1994, pp. 291-297.
Hoffman, M., J.J. Jimason and W.C. McGinly. "The State of U.S. Hospitals in theNext Decade: A Review of the Hospital Crisis," National Association for Hospital Devel-opment, 1989, Falls Church, VA.
Hughes, D., Holland, D. and P. Wandschneider, "The Impact of Changes in Mili-tary Expenditures on the Washington State Economy," The Review of Regional Studies,Vol. 21(3), 1991, pp. 221-234.
Krahower, J. Y., Paul Jolly and Robert Beran. "U.S. Medical School Finances,"Journal of the American Medical Association, September 1, 1993, Vol. 270(9), pp. 1085-1092.
Leontief, W. The Structure of the American Economy, 1919-1929. New York: Ox-ford University Press, 1941.
8/12/2019 2010 Insurance Industry Report
http://slidepdf.com/reader/full/2010-insurance-industry-report 49/50
8/12/2019 2010 Insurance Industry Report
http://slidepdf.com/reader/full/2010-insurance-industry-report 50/50
Appendix 1
Biographies of Authors
ERNEST GOSS
Ernest Goss is currently the JackMacAllister Chair in Regional Economicsat Creighton University. He received hisPh.D. in Economics from The University ofTennessee in 1983 and is a former facul-ty research fellow at NASA's MarshallSpace Flight Center. He was a visitingscholar with the Congressional BudgetOffice for 2003-04 and is a research fel-low at the Theodore Roosevelt Institute.In the Fall of 2005, the Nebraska Attor-
ney General appointed Goss to head atask force examining gasoline pricing inthe state.
He has published over eighty re-search studies focusing primarily oneconomic forecasting and on the statis-tical analysis of business and economicdata. His research paper entitled, "TheInternet's Contribution to U.S. Productivi-ty Growth," received the National Asso-
ciation of Business Economics EdmundA. Mennis Contributed Papers Award for2001. His book, Changing Attitudes to-ward Economic Reform during the Yelt-sin Era was published by Praeger Press in2003 and his book Governing Fortune:Casino Gambling in America will bepublished by the University of MichiganPress in 2006.
He is a member of the EditorialBoard of The Review of Regional Studiesand editor of Economic Trends, an eco-nomics newsletter published three timesper year. He is the past president of theOmaha Association of Business Econom-ics and President of the Nebraska Pur-
Goss produces a monthly busi-ness conditions index for the nine stateMid-American region and the threestate Mountain region. He also con-ducts a survey of bank CEOs in sevenMid-American states. Survey results fromall three surveys are cited each monthin approximately 100 newspapers.Newspaper citations have included theNew York Times, Wall Street Journal, In-vestors Business Daily, The ChristianScience Monitor, Chicago Sun Timesand other national and regional news-
papers and magazines. Each month 75-100 radio stations carry his RegionalEconomic Report.
ERIC THOMPSONEric Thompson is an Associate
Professor of Economics and the Directorof the Bureau of Business Research atthe University of Nebraska-Lincoln. Dr.Thompson‟s research on the Nebraskaand national economy examines
competitive factors affecting state andlocal economic growth, the impact ofinfrastructure on the economy, andeconomic development. In the 2008-09, Thompson served as the President ofthe Association for University Businessand Economic Research. He is a pastEditor of Growth and Change: A Journalof Urban and Regional Policy and is co-author of the 2008 bookEntrepreneurship in Nebraska:
Conditions, Attitudes and Actions. Hisresearch has appeared in the Journal ofRegional Science , Regional Scienceand Urban Economics , and American
Journal of Agricultural Economics .