Embed Size (px)
Citation preview

2010ANNUAL REPORT
C I T Y O F H O L Y O K E G A S & E L E C T R I C D E P A R T M E N T

1 H O L Y O K E G A S & E L E C T R I C D E P A R T M E N T
Manager:James M. Lavelle
Commissioners:Francis J. Hoey, III
Robert H. Griffin
Raymond H. Feyre
Tel: 413.536.9300 • Fax: 413.536.9315 City of Holyoke Gas & Electric Department
gas | electric | steam | telecom
To the Honorable Mayor, Members of the City Council, and our Valued Customers:
Submitted herewith is the One Hundred and Eighth Annual Report of the City of Holyoke Gas & Electric Department for the year ending December 31, 2010.
Holyoke Gas & Electric produced favorable operating results in 2010, in spite of a continued weak economy and increasing regulatory mandates.
This year, 68% of the Department's electric supply came from clean renewable sources, and was delivered at rates that were significantly lower than those from utilities in neighboring communities.
This powerful combination of low-cost renewable power played a critical role in the attraction of a high performance computing center project to the City. This $168 million project is being developed by a consortium of higher education institutions and private industries, and will harness the City's low cost green energy to run powerful super computing systems.
The Department continues to upgrade its fleet of hydroelectric generators and is exploring other clean energy solutions to produce additional low cost energy.
In September 2010, HG&E experienced a significant reduction in sales, resulting from the loss of several large steam customers, and steam distribution operations were shut down. HG&E assisted remaining steam customers with the conversion to on-site gas-fired solutions to replace the district steam.
In 2010, the electric division continued to modernize the Department's distribution system for increased reliability of electric services to the City of Holyoke, which included the upgrade of six sections of primary cable. Additionally, many new services were installed for new homes and businesses.
We thank the City officials and Department employees for their continued faithful service to HG&E, and we will continue to work diligently to provide our customers with reliable utility services at competitive rates, backed by an unprecedented dedication to customer service.
Respectfully,
Francis J. Hoey III, Commission ChairmanRobert H. Griffin, Commission TreasurerRaymond H. Feyre, Commission SecretaryJames M. Lavelle, Manager

gas
H O L Y O K E G A S & E L E C T R I C — 2 0 1 0 A N N U A L R E P O R T2
Other Preventative Maintenance -Corrosion MitigationThe Gas Division continued its aggressive program to mitigate corrosion on its coated steel piping systems. In 2010, professional inspections were made of all 64 of the cathodically protected systems, and the 26 coated steel services longer than 100 feet. At year's end 78% of the systems exceeded the federal requirements for corrosion control, with the rest requiring some remedial action in 2010. Additionally, 47 isolated steel gas services (less than 100 feet in length) were inspected and maintained, and appropriate repairs are scheduled for 2010, along with more inspections.
Gas Supply and Flow ControlThe Gas Division continues to operate its Liquefied Natural Gas storage and vaporizing system, providing the extra gas needed during the coldest winter days and as an emergency supply for the entire city if needed.
The Department also provided peaking service to Bay State Gas as part of a LNG supply and vapor displacement contract. This arrangement has enabled the Department to better utilize its LNG assets, and has provided benefits for both companies. It is expected to be continued in 2011-2012.
New ServicesIn 2010, the Department installed 88 services lines to new customers - 48 in Holyoke and 40 in Southampton. The Department also replaced a record 103 existing services in Holyoke by burying new plastic pipe or inserting it through older existing steel lines. The Department abandoned 51 service lines in Holyoke that were no longer needed.
New and Replacement MainsIn Holyoke, gas main construction continues for replacing cast iron. In the Elmwood neighborhood the Department continued its reconstruction efforts and replaced a total of 2,300 feet of small diameter, wrought iron pipes with new plastic ones on Claremont, Woods, Florence, Edwin, and Sydney Avenues. Numerous smaller projects were completed in the replacement of nearly 4,100 feet of cast iron and wrought iron pipe. The new plastic mains are generally four or six inches in diameter.
The Gas Division continued to expand in Southampton by extending the gas main on Pomeroy Meadow Rd and installing a new gas main on Meadow Ln preparing to potentially connect 18 customers.
The Holyoke/Southampton natural gas distribution system now consists of over 173 miles of mains 7,500 service lines and 12,000 gas meters.
Leak SurveysThe Department helps ensure the safety and reliability of the gas distribution system through an extensive series of compulsory and voluntary comprehensive leak surveys. Each year the Department conducts public building, mobile and walking flame ionization patrols, special monthly winter patrols, and vegetation observation surveys. The full-length walking survey over each individual gas service covered more than 3,750 lines in 2010, or about one-half of the service pipes in the system. The combined surveys accounted for the detection of 70 mostly minor underground leaks. All leaks were investigated and prioritized. A total of 65 underground leaks were repaired in 2009, and the remainder were monitored throughout the year or scheduled for repair.
2010 Gas Division Revenues (by Customer Class)
Municipal 2.9%
Residential39.8%
Commercial36.6%
Industrial11.2%
Department Sales 7.1%
Sales for Resale 2.4%

3 H O L Y O K E G A S & E L E C T R I C — 2 0 1 0 A N N U A L R E P O R T
gas & steamProduction - Facilities In 2010, the electric station had a maximum steam production load, during electrical generation, of 2600,000 lbs/hr. The maximum steam production load for steam sales was non generation hourly load was 105,000 lbs/hr.
In 2010, The electric station produced 158,592,000 lbs of steam.
Steam
Operations As previously planned, the Steam Distribution operations were shut down in 2010 due to decreased sales. The distribution system ceased operations in early September but the boilers remained in standby for Sonoco Paper products as they commissioned their new boilers through the end of the month. The department assisted the remaining steam customers to convert their steam heating and processes needs to locally installed natural gas fired systems. The number of employees at the station was reduced between an early retirement incentive, transfers and a single layoff. HG&E retains the ability to produce steam for electric generation at Cabot Street Station. Employees that have been transferred remain available to man the boilers and turbines if the need for electric generation arises.
- Steam Facilities
Gas WorksThe Department operated its two tar removal systems during the year. The tailrace system, which intercepts dense, non-aqueous phase liquid (DNAPL) coal tar before it can migrate beneath the river, collected 1,147 gallons of tar; bring the year-to-date total to 6,619 gallons. The tar is collected and then sent offsite for disposal. The second system is on the site itself, and pumps DNAPL in a similar fashion to the tailrace area recovery system. The onsite DNAPL only collected 32 gallons of tar in 2010 bringing the total to 187 gallons. The tar is less mobile then anticipated, even with steam injection, and may not need to be recovered.
As part of Phase IV Redemption Plan for Old Gas Works, which was found to be contaminated with coal tar, a cap was installed over a raceway adjacent to the Old Gas Works. Eliminating potentially significant risk to human and ecological receptors, installation included a sand cap and a protective layer of rip rap, along with structures that will allow for future testing of cap integrity. The cap was completed in 2010, with the exception of planting restoration, which will be completed in 2011.
A bulkhead wall was installed adjacent to the Old Gas Works along the tailrace bank to stop migration of coal tar into the tailrace. During operations at Old Gas Works, coal tar was released into the environment causing an underground plume of tar that migrated towards the tailrace. At the bank of the tailrace, sheen has appeared on the surface water. The wall was installed to prevent the occurrence of the sheen and enhance subsurface tar recovery in the area. The wall consists of sheet piling that was installed from a depth of 2 feet below grade to bedrock preventing the sheen from appearing. The length of the wall is approximately 170 feet. In addition to the installation of the wall, contaminated soil between the bulkhead wall and the bank of the tailrace was excavated and removed offsite.
All work, including the cap, was completed in 2010, with the exception of planting restoration, which will be completed in 2011.

electric
4 H O L Y O K E G A S & E L E C T R I C — 2 0 1 0 A N N U A L R E P O R T
Boatlock Station: As part of the Canal Optimization Plan, the hydro division is working towards a reduction in generators in conjunction with increased capacity. A 2010 effort towards this goal included the Boatlock Station Electrical Upgrade which included MCC Switchgear and Basler Static Excitation systems, vacuum type breakers for protection and isolation of electrical machinery and the transformer, and station service equipment.
Hadley Station Unit 1: A major Dewatering Inspection of Hadley Unit 1 was conducted in the summer of 2010 and included: wicket gate packing replacement, gate alignment and shear pin replacement, a turbine bearing inspection, and thrust oil replacement. A plan major outage is being considered for 2012/13.
City 4 J Wheel: On-going rehabilitation of City 4 J Wheel included a Generator Rewind, Exciter Upgrade, and mechanical repairs to restore unit into service. Completion of work is scheduled for February 2011, it is estimated that the City 4 Station will generate approximately 997,000 additional kWh per year. The rehabilitation of this unit is important to increased efficiency of the water flow from the first level canal to the second level canal. The Department was the recipient of Mass Clean Energy Center (CEC) funding in the amount of $309,825 for this project.
Flood Protection Structures: Completed installation of Flood Protection Structures at Hadley Falls and Riverside Stations. The Department was awarded a Hazard Mitigation Grant through the Federal Emergency Management Agency (FEMA). The grant was used to reimburse the Department for 75% of the project cost. Grant funding in the amount of $ 309,292.50 was received to offset the cost of the flood control structures.
Annual Spring and Fall Canal Inspections: Assessment of canals and canal walls including overflows, intakes, penstocks, powerhouses, and tailraces.
Production - Hydroelectric Facilities A number of projects were completed which improved or will contribute to future generation capacity and reliability of the Department's Hydroelectric facilities. These projects included:
Boatlock Station Unit 1: In 2010, HG&E installed a replacement turbine which included a bottom ring, wicket gates, headcover, runner, operating linkages, servomotor, and a new governor. This turbine generator upgrade increased generation from 200 kW to 704 kW. HG&E was the recipient of a Clean Renewable Energy Bond (CREB) of $2.5 million dollars towards this project.
A new galvanized Trash Rack structure was fabricated and installed at the Boatlock Unit 1 intake. The new intake arrangement included steel rack supports, galvanized steel handrails, and extruded HDPE trash racks anchored to the rack supports.
2010 Fish Passage Counts
The fishlift at HG&E’s Robert E. Barrett Fishway helps migrating fish over the Holyoke Hydroelectric Dam. It was the first and most successful fish lift on the Atlantic coast. It consists of two elevators or “lifts” which carry migrating fish up and over the dam.
6,789 human visitors during the 6-week public viewing period. In addition, the following quantities of monitored fish species were observed utilizing the lift system this year:
Atlantic Salmon 41
American Shad 164,439
Blueback Herring 76
In 2010, the facility attracted
Sea Lamprey 39,782
Striped Bass 298
Gizzard Shad 371
electric
5 H O L Y O K E G A S & E L E C T R I C — 2 0 1 0 A N N U A L R E P O R T
Production - Hydroelectric Compliance ActivitiesThe Hydro Division has a number of technical agreements and environmental requirements mandated through FERC and the Massachusetts Department of Environmental Protection (MADEP). Major compliance issues addressed in 2010 include:
Hadley Intake Racks: Design and evaluation of and stakeholder consultation pertaining to downstream fish passage options for the Hadley Falls intake at the Holyoke Dam.
Potential Failure Mode Analysis (PFMA): Continued implementation of FERC Part 12 and on-going efforts to update the FERC security plan. This year's work continued to build upon previous PFMA studies that have been in effect since 2008.
Deformation Monitoring Surveys: Geodetic surveys were completed of the South Hadley canal gatehouse, all four active Holyoke canal overflow structures, and the Boatlock Station powerhouse. This is the fourth year of five continuous yeas of observation data that is required for finalizing the preliminary network design and in preparation of structures for future monitoring on a five year cycle.
Run of River Operations (ROR): HG&E completed a 3rd year of monitoring of modified ROR operations. An extension of time was filed with FERC due to 2 out of 3 wetted study years. One additional year of monitoring is planned in 2011 with plans to file a permanent modification to the Comprehensive Operation and Flow Plan.
Beebe Holbrook Station: The “A Wheel” unit was retired as a result of a sink hole that occurred in the tailrace, building, and parking lot in 2007. The penstock was capped to prevent any further occurrence of water from the 1st Level Canal from entering into the sinkhole areas.
Operations - Electric DivisionWork continued throughout the year on three capital improvement transmission level substation projects. At Holyoke Substation all 115kV Air Break Switches identified with critical maintenance issues were replaced with new equipment. Five (5) 115kV relay packages were replaced, including the 1657 Line Primary and Backup Relays, and the 79BF reclosing and breaker failure relays for the 52W-1T-2, 52W-2T-2, and 17L-1T-2 circuit breakers. Finally, work continued on the project to replace Prospect Substation in multiple areas: (1) Needs analysis for the new station was presented to and accepted by the ISO-NE Planning Advisory Committee (PAC), placing the project on the ISO quarterly project list as a “conceptual” project. (2) Engineering design was furthered resulting in a change to 34.5kV to feed the proposed data center and other large loads, as well as Hadley Falls generation, and possible future wind generation at Mt. Tom. (3) Geotechnical borings at the “sand shed” site revealed a sub-grade consisting of primarily rubble fill from when the original mill buildings were knocked down. In addition, a large tailrace structure from the original mill hydro system remains in place and was discovered to be flowing a considerable amount of water. Therefore, a reevaluation of the Riverside site adjacent to the 1525 Line is underway. Early indications suggest that this site appears less expensive to build while having less environmental permitting concerns and less scheduling risk.
Distribution level substation capital work included completion of Highland Substation SCADA retrofit, which enables the remote operation of the station. We also made significant progress on the recloser auto-loop scheme. Eight (8) reclosers and controls have been installed in the field, and the Distribution Automation Controller (DAC) was programmed and factory acceptance tested. In 2011, all reclosers will be cut over to the new DAC which ties into SCADA system.
As part of the Department's preventative maintenance (PM) plan, major maintenance and testing was performed on various substation and plant equipment throughout the year. In summary, testing was performed on ten (10) power transformers, ten (10) 15kV vacuum circuit breakers, four (4) 15kV air magnetic breakers, one (1) spare bushing, one (1) surge arrestor, and one (1) voltage regulator.

electric
6 H O L Y O K E G A S & E L E C T R I C — 2 0 1 0 A N N U A L R E P O R T
Operations Electric Division-ContinuedSupport for Electric Distribution during the year included the preparation of forty seven (47) switching orders with thirty nine (39) clearances issued for planned and emergency high voltage work. Maintenance/repair operations were also performed as required on various distribution equipment including monthly inspections of line recloser and capacitor switching controls. Support was again provided for the City owned Flood Control Pumping Stations in the form of emergency maintenance and pumping operations as required.
Electric Distribution System improvements in 2010 for increased reliability of electric service to the City of Holyoke included the upgrade of six sections of primary cable: an 1,100' section of the 36H2 underground getaway cable along Northampton Street between Highland Sub and Hampden Street, a 600' section of the 36H1 main line underground circuit along Northampton Street between Allyn and Lincoln Streets, a 1,700' section of aerial cable on the 17L5 circuit along Northampton Street between W. Franklin and Dwight Streets, a 550' section of the 32W3 main line underground circuit along Cabot Street between Commercial and High Streets, a 300' section of the 17L6 main line underground circuit along Bowers Street near the intersection of Mosher Street, and a 350' section of underground lateral cable on Lyman Street on the 32W2 circuit. Two padmounted switchgear and primary metering cabinets were replaced at the Waste Water Treatment Plant to update aging equipment. Three new above grade termination cabinets were also installed on St. Kolbe Drive and Arbor Way which eliminated the use of feed thru devices inside the manholes while providing sectionalizing and isolation capabilities should circuit issues arise.
The second and final phase of revamping the Lynch & Autumn Drive area was completed eliminating any direct buried primary cable in the area. This phase incorporated some of the customers located on Lynch Drive between Whiting Farms Road and Autumn Drive and Autumn Drive between Whiting Farms Road and Lynch Drive. Approximately 400' of new conduit and 500' of new primary cable was installed.
There were two areas that were converted from overhead to underground in the Highlands. Approximately 1,200' of new conduit bank and underground cable, two new manholes, and three new padmount transformers were installed on George Street to eliminate backyard primary wire in heavy tree growth area. At this time, customers were also transferred from the H1 4.8 kV circuit to the 36H1 13.8 kV circuit. Approximately 2,100' of new conduit bank and underground cable, five new manholes, and two new padmount transformers were installed through the former Mountain Park complex to accommodate a new music venue. At this time, any remaining 4.8 kV circuits were removed and the music venue and the Whiting Reservoir pump station were transferred to 13.8 kV.
Work to eliminate the old paper insulated lead cable (PILC) originating from Holyoke Substation continued in 2010. This is the second year of a multi-year project to replace all 50-60 year old PILC with ethylene propylene rubber (EPR) insulated cable to improve reliability and eliminate the environmental issues associated with lead. The next circuits that were upgraded were the 17L9 and 17L10 circuits that provide a 13.8 kV source at Walnut Substation to a 4.8 kV transformer supplying power to the surrounding substation area as well as the southern portion of the Highlands and three 13.8 kV distribution circuits that feed the St. Kolbe Drive area as well as along Cabot Street between Commercial Street and Walnut Street. In total, approximately two and a half miles of PILC was replaced with EPR cable.
Seven new reclosers were installed in place of existing air break switches at various tie points throughout the City. Two sets of three phase transformer banks were also installed at each recloser which act as voltage sensing devices to the recloser controls which communicates to the recloser when it can close thereby picking up load from the nearby circuit reducing and/or eliminating potential customer downtime. These reclosers are part of an effort to further automate the distribution system.

electric
7 H O L Y O K E G A S & E L E C T R I C — 2 0 1 0 A N N U A L R E P O R T
Electric Distribution-ContinuedPreparation for the conversion of the O2 4.8 kV circuit originating from Oakdale Substation to 13.8 kV was completed in 2010. This area included Beech Street between Sargeant Street and Cabot Street and Cabot Street between Walnut Street and Pleasant Street including all connecting nearby laterals. Approximately three circuit miles of wire were upgraded as part of the project. One additional sectionalizing device on Sargeant Street was also installed to assist with reducing the number of customers without power due to unscheduled outages or required maintenance work. This work also included other reliability upgrades such as replacing all porcelain hardware with polymer and installing new crossarms, insulators, connectors, and fault indicators.
There were two multi-year State projects that were completed in 2010. The new bridge on route 202 south bound over the Pan Am Railways owned railroad tracks was replaced with additional safety features and lighting. Existing aluminum poles were reinstalled near and on the bridge for lighting and new underground conduit was installed across the bridge to maintain lighting connectivity to both sides of the bridge from the same source. The other State project was the replacement of the Lyman Street bridge over the Second Level Canal. A new 600' main line underground cable from the 24B5 circuit was extended from Canal Street to Gatehouse Road to refeed existing customers with provisions for future backup capabilities to the 32W2 circuit.
Twelve services on Nonotuck Street, Sargeant Street, Parker Street, Beacon Avenue, View Street, Camp Jahn Road, Sycamore Street, Taylor Street, and Magnolia Avenue were relocated from heavily overgrown areas with difficult accessibility to the street. This will provide these customers with not only a more reliable electric service but also protection from potential safety hazards and safety code violations which will, in turn, reduce some of the tree trimming and outage costs of the Department.
A number of preventative maintenance activities continued throughout the year. Consulting Engineers Group and Three-C Electrical were hired to perform testing of 70 new and used transformers. Annual visual inspections were also performed by in-house staff on all three transmission lines to meet ISO-NE OP3 requirements. Osmose was also hired to perform manhole inspections in the downtown and Highlands areas of the City. Infrared Analyzers was hired to perform infrared inspections while Exacter was hired to perform RF inspections on all distribution circuits throughout the City. Stray voltage testing of approximately 10% of the City, predominantly in the West Holyoke area, was also completed by in-house staff. Reliability statistics allow the Department to track its service reliability and compare them from year to year with other municipal and private utilities. There are five statistics used to define the length and frequency of interruptions to customers, system availability, and the number of customers impacted by outages. They are defined as follows:
HG&E 2010 HG&E 2009
TYPICALMUNICIPAL
UTILITYPRIVATE
UTILITIES
ASAI 99.989% 99.982%
CAIDI 57.60 min 95.98 min 60 min 90 min
SAIDI 44.95 min 30.48 min 60 min 102.32 min
SAIFI 0.78 outages 0.32 outages 1 outage 1.02 outages
MAIFI 1.43 events 1.68 events 2-4 events 3.13 events
99.991% 99.994%
Average System Availability Index (ASAI) - represents how much of the time a customer actually has service available to them.
Customer Average Interruption Duration Index (CAIDI) represents the average time expected to take to restore service after a sustained interruption.
System Average Interruption Duration Index (SAIDI) defines the average interruption duration per customer served.
System Average Interruption Frequency Index (SAIFI) defines the average number of times that a customer's service is interrupted during a given year.
Momentary Average Interruption Frequency Index (MAIFI) - defines the average number of momentary outages a customer may experience in a year.
Electric Distribution System Reliability Statistics

electricElectric Distribution-ContinuedThree new electric services, Taco Bell on Northampton Street, Racing Mart gas station complex on Main Street, and Mt. Park Music Venue at the former Mountain Park site, resulted in a net additional connected load of 825 kVA. There were also 6 new homes that required new electric services resulting in a connected load of 30 kVA. The new homes were constructed on available lots along Briarwood Drive, Claren Drive, Elm Street, Line Road, Lower Westfield Road, and Samosett Street.
In summary for 2010, HG&E set 79 poles and removed 68. A net 1,708 kVA connected load was installed on the distribution system. Some 37,682 circuit feet of underground cable was installed while 15,429 was removed. Similarly, 57,434 circuit feet of overhead wire was installed while 16,640 was removed. Approximately 6.3 miles of conduit was installed including 33,222 feet of PVC and 140 feet of steel. There was a net total of 4 contract lights removed from the distribution system and no change in the total number of street lights.
MeteringThe metering group continued to make progress in its gas and electric automatic meter reading (AMR) migration as 98% of the entire City can now be read remotely. On the electric side, the group installed 46 AMR meters in the field this year. There are now a total of 17,291 AMR electric meters installed, which represents approximately 97% of all electric meters. Most installations are predominantly single phase residential and smaller three phase commercial customers. On the gas side, the metering group installed a total of 1,082 AMR-enabled gas meter indexes. Along with assistance from the gas service department, the total number of AMR gas meters installed is 11,800, which represents approximately 99% of all gas meters.
Forty seven commercial and industrial gas customers with volume correcting instruments on their gas meters were retrofitted with a new Itron ERT. At these locations, there are 67 meters that can now be read remotely each month via a handheld device and/or a fixed network infrastructure while ensuring its reading accuracy.
Signal output of all single phase residential and 200 A polyphase commercial services was increased from 0.25 w to 1.0 w in order to increase network connectivity and reliability. There were 6,642 meters retrofitted with a new register board accommodating this increase in signal output. In addition to obtaining a further radio frequency signal reach, these new registers also provide outage management and load profiling capabilities.
A total of 10 transformer, station service, and generation meters were tested to meet ISO-NE's OP-18 metering requirements which include meters at Ingleside Substation and Boatlock, Cabot, City 4, and Cobble Mountain generation stations. Two of these meters at Boatlock were upgraded to accommodate Ethernet connectivity. These meters are tested by Electric Operations/Hydro personnel on a biannual basis through the use of the Department's own portable test unit.
Throughout the year, the metering group continued to support the Credit Department performing delinquent customer ons and offs, tagging notifications, meter reads, and collections. In total, 6,490 credit related duties were performed in 2010. From spring 2009 to end of year 2010, physical reads were performed at all metered locations in order to validate the AMR readings.
2010 Electric Division Revenues (by Customer Class)
H O L Y O K E G A S & E L E C T R I C — 2 0 1 0 A N N U A L R E P O R T
Residential34.1%
Commercial48.4%
Industrial12.1%
Municipal5.4%
8
electric
9 H O L Y O K E G A S & E L E C T R I C — 2 0 1 0 A N N U A L R E P O R T
Metering-ContinuedIn summary, there were a net total of 1 electric meter removed, 6,862 electric meters replaced, and 252 electric meters retired having an average age of 33.87 years. A total of 13,096 electric meters were tested and calibrated, 64 voltage tests, 2,455 electric successions performed, and 135 no or low consumption reports investigated for metering problems and/or theft of service. A net total of 12 current transformers were installed and 210 current transformer rated services were tested. On the gas side, 1,309 meters were removed and tested, 1,444 meters were installed, another 1,450 meters were sealed, and 100 meters were retired.
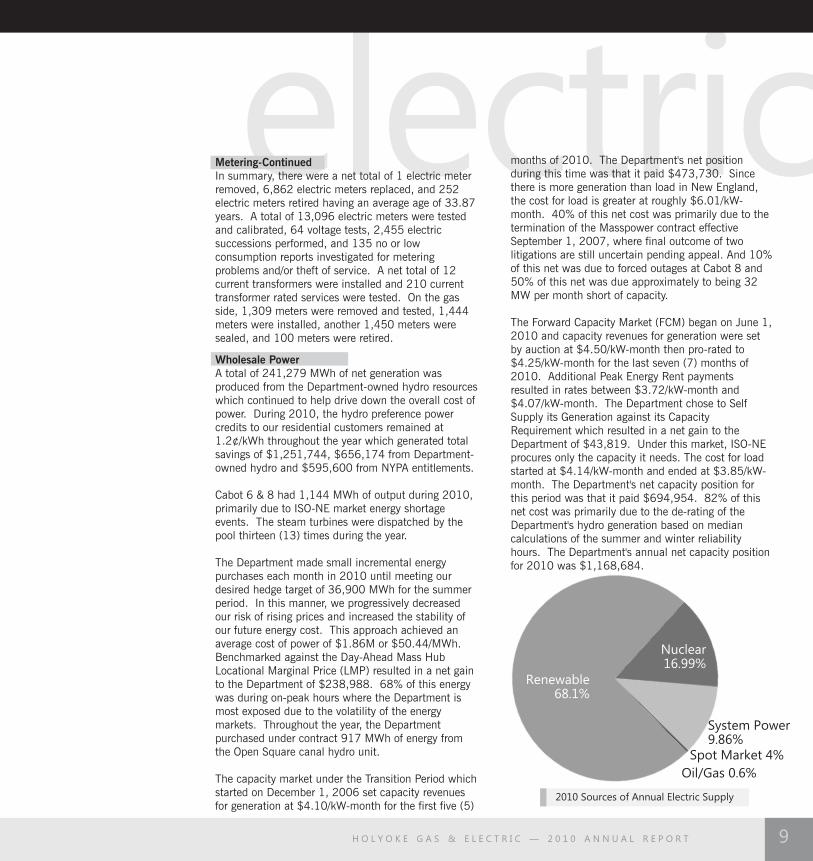
Wholesale PowerA total of 241,279 MWh of net generation was produced from the Department-owned hydro resources which continued to help drive down the overall cost of power. During 2010, the hydro preference power credits to our residential customers remained at 1.2¢/kWh throughout the year which generated total savings of $1,251,744, $656,174 from Department-owned hydro and $595,600 from NYPA entitlements.
Cabot 6 & 8 had 1,144 MWh of output during 2010, primarily due to ISO-NE market energy shortage events. The steam turbines were dispatched by the pool thirteen (13) times during the year.
The Department made small incremental energy purchases each month in 2010 until meeting our desired hedge target of 36,900 MWh for the summer period. In this manner, we progressively decreased our risk of rising prices and increased the stability of our future energy cost. This approach achieved an average cost of power of $1.86M or $50.44/MWh. Benchmarked against the Day-Ahead Mass Hub Locational Marginal Price (LMP) resulted in a net gain to the Department of $238,988. 68% of this energy was during on-peak hours where the Department is most exposed due to the volatility of the energy markets. Throughout the year, the Department purchased under contract 917 MWh of energy from the Open Square canal hydro unit.
The capacity market under the Transition Period which started on December 1, 2006 set capacity revenues for generation at $4.10/kW-month for the first five (5)
months of 2010. The Department's net position during this time was that it paid $473,730. Since there is more generation than load in New England, the cost for load is greater at roughly $6.01/kW-month. 40% of this net cost was primarily due to the termination of the Masspower contract effective September 1, 2007, where final outcome of two litigations are still uncertain pending appeal. And 10% of this net was due to forced outages at Cabot 8 and 50% of this net was due approximately to being 32 MW per month short of capacity.
The Forward Capacity Market (FCM) began on June 1, 2010 and capacity revenues for generation were set by auction at $4.50/kW-month then pro-rated to $4.25/kW-month for the last seven (7) months of 2010. Additional Peak Energy Rent payments resulted in rates between $3.72/kW-month and $4.07/kW-month. The Department chose to Self Supply its Generation against its Capacity Requirement which resulted in a net gain to the Department of $43,819. Under this market, ISO-NE procures only the capacity it needs. The cost for load started at $4.14/kW-month and ended at $3.85/kW-month. The Department's net capacity position for this period was that it paid $694,954. 82% of this net cost was primarily due to the de-rating of the Department's hydro generation based on median calculations of the summer and winter reliability hours. The Department's annual net capacity position for 2010 was $1,168,684.
Renewable68.1%
Nuclear16.99%
System Power9.86%
Oil/Gas 0.6%
2010 Sources of Annual Electric Supply
Spot Market 4%

10 H O L Y O K E G A S & E L E C T R I C — 2 0 1 0 A N N U A L R E P O R T
Wholesale Power-ContinuedWith the beginning of FCM and effective May 31, 2010, all reliability must run (RMR) agreements were terminated resulting in a net gain of approximately $216,700 to the Department. Transmission Regional Network Service (RNS) rates increased 8% from $59.94701/kW-year to $64.82884/kW-year in June 2010. The Department's RNS annual charge of $3,910,006 was offset by 9.17 circuit miles of Pool Transmission Facility revenues of $1,814,516, reducing the Department's annual RNS charge to $2,095,490.
Effective February 2010, the Department resolved under a Settlement Agreement certain disputes and outstanding issues with NU Companies. In addition to resolving these matters, the parties additionally executed an Asset Demarcation Agreement and Equipment Rental Agreement which allowed the Department to obtain connection of its Prospect Substation in Chicopee directly at RNS hence avoiding any local network service charges or direct assignment charges from NU. Later in June 2010, the Department sold 11.885 acres of excess land in Chicopee to NU's affiliate, Western Massachusetts Electric Company (WMECO), for $420,000.
The Department executed several contracts for the sale of renewable certificates through the Nepool-GIS market system. These transactions brought in $28,952 of revenues through selling CT Class 2 and ME respective renewable portfolio standard market requirements. Remaining 2010 calendar year certificates were banked to allow for sale during 2011.
Wholesale Power - Green Power68.10% of the Department's 2010 generation is from renewable resources and 85.09% of its generation is carbon free (renewable hydro and nuclear). The following graph summarizes the Department's resource mix by energy type. Note that System Power represents short-term bilateral contracts that were procured during the summer time frame.
electric2010 Annual Carbon Footprint
ENERGY (MWh)FUEL TYPE TONS lbs CO2 / MWh
CO2 EMISSIONS
Oil 1,078 1,018
Renewable 254,904 0
Nuclear 63,596 0
Spot Market 16,687 9,011
Gas 1,144 572
System Power 36,900 19,926
Total 374,309 30,527 163lbs/MWh
Wholesale Power - Renewable Energy In 2009, the City of Holyoke received $175,000 for the upgrade of two boilers in City owned buildings along with the development of a city-wide Energy Efficiency Conservation Strategy through a Federal Energy Efficiency and Conservation Block Grant. In January of 2010, HG&E received Clean Renewable Energy Bonds for a Hydroelectric and Wind project for $18.1M and $19.3M respectively. Along with 35 other cities and towns, Holyoke was designated a Green Community in July of 2010 and was awarded $321,000 for the upgrade of LED traffic lights, LED road lights, and insulation for City Hall.
As a member of the Massachusetts Clean Energy Center (MassCEC), formerly Massachusetts Technology Collaborative (MTC), HG&E paid $61,829 in 2009 and $154,244 in 2010 into the Renewable Energy Trust (RET) through an added $0.00050/kWh Renewable Energy Charge in each rate class. By joining the RET, HG&E – and all of its customers - are eligible to receive grant money for renewable energy projects. In 2010, through the Commonwealth Hydro Initiative, HG&E received $309,825 for the refurbishment of its Holyoke 4-J hydroelectric wheel and $135,000 for the proposed Overflow #3 Siphon Hydro Units. The Siphon Units also received a $75,000 grant from the American Public Power Association's Demonstration of Energy-Efficient Developments program.

11
BASE UNITSNYPA FIRM HYDRO 1985 2,662 2,662 9/1/25
MILLSTONE 3 - MIX 1 NUCLEAR 1986 1,334 1,334 11/25/45 *
MILLSTONE 3 - PROJ 3 NUCLEAR 1986 2,325 2,325 11/25/45 *
SEABROOK - MIX 1 NUCLEAR 1990 147 147 3/31/30 *
SEABROOK - PROJ 4 NUCLEAR 1990 3,306 3,306 3/31/30 *
SEABROOK - PROJ 5 NUCLEAR 1990 408 408 3/31/30 *
INTERMEDIATE UNITSHYDRO QUEBEC 1 N/A 1986 1,189 1,189LOU **
HYDRO QUEBEC 2 N/A 1989 1,938 1,938LOU **
W.F. WYMAN 4 #2 OIL 1978 4,199 4,152 LOU *
PEAKING UNITSHOLYOKE #6 & #8 #2 OIL, #6 OIL, GAS 1951 18,605 18,605 OWNED *
NYPA PEAK HYDRO 1985 578 578 9/1/25
STONYBROOK GT 2A #2 OIL 1982 2,476 1,910 LOU *
STONYBROOK GT 2B #2 OIL 1982 2,413 1,850 LOU *
HYDRO UNITSHADLEY FALLS 1&2 HYDRO 1949 33,400 33,400 OWNED *
RIVERSIDE 8 HYDRO 1931 4,500 4,500 OWNED *
RIVERSIDE 4-7 HYDRO 1921 3,435 3,435 OWNED *
BOATLOCK HYDRO 1924 3,094 3,094 OWNED *
HOLYOKE HYDRO / CABOT 1-4 HYDRO 1923 3,147 3,147 OWNED *
CHEMICAL HYDRO 1935 1,600 1,600 OWNED *
BEEBE HOLBROOK HYDRO 1948 304 304 OWNED *
SKINNER HYDRO 1924 280 280 OWNED *
VALLEY HYDRO HYDRO 2004 790 790 OWNED *
ALBION A HYDRO 2004 281 281 OWNED *
ALBION D HYDRO 2004 395 395 OWNED *
GILL D HYDRO 2004 330 330 OWNED *
OPEN SQUARE HYDRO 2004 525 525 YR TO YR
CROCKER AB HYDRO 2004 370 370 OWNED * ***
CROCKER C HYDRO 2004 230 230 OWNED * ***
GILL A HYDRO 2004 450 450 OWNED * ***
MT. TOM HYDRO 2004 473 473 OWNED * ***
NONOTUCK HYDRO 2004 472 472 OWNED * ***
PROJECT NAMECONTRACTEND DATEFUEL TYPE WINTER
CONTRACT CAPACITY (kW)PROJECT
START DATE SUMMER
(All
cap
aci
ty c
on
tract
s fo
llow
th
e ISO
New
En
gla
nd
cale
nd
ar
syst
em
)*
- In
vest
men
ts c
on
tin
ue f
or
the lif
e o
f th
e u
nit
(LO
U)
** -
Aft
er
8/3
1/0
1 t
here
is
no
fir
m e
nerg
y co
ntr
act
, on
lyca
paci
ty e
nti
tlem
en
t w
hic
h c
on
tin
ues
for
life o
f u
nit
***
- U
nit
off
line p
en
din
g r
eti
rem
en
t
2 0 1 0 P O W E R S U P P L Y R E S O U R C E S
H O L Y O K E G A S & E L E C T R I C — 2 0 1 0 A N N U A L R E P O R T
supply

telecom
12 H O L Y O K E G A S & E L E C T R I C — 2 0 1 0 A N N U A L R E P O R T
Telecom DivisionIn 2010, the Telecom Division continued its sales growth in both fiber optic and wireless services and executed a business telephone partnership with OTT Communication.
The Division also continued its efforts to upgrade and maintain the HGE.net service network. A summary of the Division's major accomplishments follows:
Network Expansion - Service Provider NetworkIn 2010 the Telecom Division aided the fiber plant design for the Green High Performance Computing Center, and enabled Cisco Smart + Connected Communities efforts.
Network Upgrades - Service Provider NetworkA major fiber cable audit was completed on the Division's Service Provider Network and a fiber cable system mapping project was 40% complete at the end of 2010. This network provides connectivity via fiber optic lines to business-class customers that are located in Holyoke, Chicopee and Downtown Springfield. Both the Department itself and the City receive services from this network.
All customers were migrated to MetroE Platform. The division implemented Cisco ASR1002 Aggregation Routers as well as Alcate/Lucent 9700E MetroE switches. New equipment replaces a combination of ATM and Ethernet based equipment installed over the last twelve years, and provides the Division with a solid standards-based platform to prepare it for future growth.
Network Upgrades - Enterprise NetworkIn addition to provisioning and maintaining retail internet customers, the Telecom Division is also responsible for the design, operation and maintenance of the Department's internal network and Information Systems needs. A summary of work accomplished in 2010 follows below:
Completed a dual blade server system. This system will provide a centralized platform for the deployment of computing resources. In this system, server blades that are contained within a single chassis will replace multiple stand-alone PC servers, increasing reliability and simplifying management activities.
Continued its support for the Electric Division's NERC compliance, SCADA, and distribution system automation projects in 2010. Work under these initiatives included the connection of numerous sectionalizers and reclosures to the fiber network. These devices allow the Electric Division to remotely isolate and clear distribution system faults.
Procured utility network and core switching equipment.
Consulting Services - City NetworkThe Telecom Division has responsibility for ongoing maintenance, installation and operation of applications on the City's network. In 2010, the Division replaced all periphery network switches, and conducted a substantial upgrade of the internet firewall system that provides protection to both the City and the Holyoke Public Schools networks.
Telecom Help Desk - Service SummaryThe Telecom Division administers a centralized help desk, accepting support calls from Department, City and retail internet customers. In 2010, the help desk closed: 959 requests from Department employees, 784 requests from City employees, and requests from outside customers.
371

goodwillEconomic DevelopmentIn 2010, the Department provided in additional discounts to businesses that have relocated or expanded within the City under the Economic Development Discount Program. This program provides an additional 10% off their gas and electric bills for a 3 year period.
The Department also offers a similar program for residential customers, under which first-time Holyoke homebuyers can receive 10 percent off their first three years of gas and electricity bills. In 2010, the Department provided in additional discounts under this program.
HG&E also promotes economic growth through our Commercial and Residential Energy Conservation Programs. These plans offer interest-free financial assistance to our customers, thus helping them make their homes or businesses more energy efficient. In 2009, the Department paid out over
in zero-interest assistance to Holyoke home and business owners.
Municipal BenefitsThe Department contributed $1,058,320 to the City of Holyoke's General Fund during 2010 as an in-lieu of tax payment. Payment discounts of $318,913 were provided on the City's utility accounts.
Beyond these direct financial benefits, HG&E continues to provide other valuable services to the City including: offering low-cost street lighting, low-cost maintenance on city-owned gas and electric equipment, and low municipal rates to City departments on their gas and electric accounts.
$26,590
$78,150
$1,084,233
Community GoodwillCommunity involvement is a central belief of the public power philosophy, and the Department is proud of the role it takes in making Holyoke a better place to call home.
Neil J. Moriarty, Jr. Scholarship for Cadet EngineersThe Cadet Engineer program is dedicated in memory of our late Commission Chairperson, Neil J. Moriarty, Jr. He often noted that the admission of new students into the program was one of most rewarding actions that the Commission made each year.
The program offered aid to 2 Holyoke students in 2010 who are pursuing a Bachelor of Science in Engineering. The Commission voted to admit as new participants to this program in 2010.
In 2010, HG&E offered support to several major community events including the Hispanic Family Festival, the St. Patrick's Day Parade, and the Holyoke Fireworks, which is underwritten by the department. In total, over $106,905 in sponsorships, and over $7,900 in labor was provided for nonprofit causes.
Peter Lynch and Kevin Tierney
Nonprofit Sponsorships $106,905
Nonprofit Labor $7,900
Cadet Engineer Program $63,750
Payment in Lieu of Taxes $1,058,320
Total Community Support $3,274,697
Municipal Payment Discounts 318,913
Discounted Street Lighting 530,092
Economic Dev. Discounts $26,590
New Homeowner Discounts 78,150
Energy ConservationAssistance Programs $1,084,233
Summary of Community Support
* Based on market average of 22.5¢/kWh vs. 10.59¢/kWh billed** Programs that encourage conservation and economic development,
assistance is paid back at zero interest over a number of years
**
*
13 H O L Y O K E G A S & E L E C T R I C — 2 0 1 0 A N N U A L R E P O R T

14 H O L Y O K E G A S & E L E C T R I C — 2 0 1 0 A N N U A L R E P O R T
This page intentionally left blank.

H O L Y O K E G A S & E L E C T R I C D E P A R T M E N T A1

H O L Y O K E G A S & E L E C T R I C D E P A R T M E N TA2
This page intentionally left blank.

Plant, Property and Equipment:
Plant, property and equipment in service $169,463,325 $ 164,631,850
Construction in progress 3,671,706 3,386,026
173,135,031 168,017,876
Less accumulated depreciation 75,188,764 73,443,374
Total Plant, Property and Equipment 97,946,267 94,574,502
Restricted Assets:Funds required under bond indenture 12,803,318 15,316,632
Customers' deposits 576,237 573,458
Total Restricted Assets 13,379,555 15,890,090
Other Fund Reserves:Purchased Power Funds 2,729,765 2,803,181
Rate Stabilization Funds 30,644,699 35,403,446
Post employment benefit funds 2,013,458
Total Other Funded Reserves 35,387,922 38,206,627
Current Assets:Cash 20,170 20,132
Operating Cash Invested 1,066,947 1,604,990
Accounts receivable net of reserve for uncollectible accounts
of $515,024 in 2010 and 2009 7,075,463 6,625,718
Accounts receivable - City of Holyoke 435,615 463,311
Materials and supplies 2,120,630 2,578,543
Fuel for electric generation and gas in storage 1,181,012 1,592,288
Prepaid expense 455,558 468,172
Other receivables 3,570,924 2,430,867
Total Current Assets 15,926,319 15,784,021
Other Assets:Other investments 222,772 234,529
Preliminary investigation charges 2,529,285 2,781,807
Intangible assets 3,344,803 3,996,449
Other receivables - after one year 2,694,391 2,013,564
Total Other Assets 8,791,251 9,026,349
TOTAL ASSETS $ 171,431,314 $ 173,481,589
Long-Term Liabilities:Bonds payable - long-term $37,770,000 $38,988,333
Notes payable - long-term 1,828,030 2,435,346
Leases payable - long-term 86,862 48,749
Accrued compensated absences 2,400,382 2,533,986
Accrued environmental costs 745,443
Deferred rate stabilization costs 37,353,290 35,457,290
Total Long-Term Liabilities 79,438,564 80,209,147
Current Liabilities:
Due to other funds 271,956 5,095,107
Accounts payable 7,402,898 4,974,880
Current portion bonds, notes and leases payable 1,863,357 1,791,841
Customers' deposits 523,625 555,662
Accrued liabilities 1,436,568 1,411,737
Accrued interest 161,232 166,164
Current portion - accrued compensated absences 203,896 189,387
Current portion - accrued environmental costs 169,627 367,059
Current portion - deferred rate stabilization costs 4,800,000 3,600,000
Deferred credits - current 227,412 519,825
Total Current Liabilities 17,060,571 18,671,662
Total Liabilities: 96,499,135 98,880,809
Retained Earnings: 74,932,179 74,600,780
TOTAL LIABILITIES AND RETAINED EARNINGS $171,431,314 $173,481,589
See a
cco
mp
an
yin
g n
ote
s.
ASSETS
LIABILITIES AND RETAINED EARNINGS
2010
2010
2009
2009
H O L Y O K E G A S & E L E C T R I C D E P A R T M E N T A3
Balance Sheets — December 31, 2010 and 2009

H O L Y O K E G A S & E L E C T R I C D E P A R T M E N TA4
This page intentionally left blank.

H O L Y O K E G A S & E L E C T R I C D E P A R T M E N T A5
Statement of Revenues, Expenses and Changes in Retained Earnings
December 31, 2010 and 2009
Ele
ctri
c /
Ste
am
Ele
ctri
c /
Ste
am
Gas
Tele
com
mu
nic
ati
on
s T
ota
lG
as
Tele
com
mu
nic
ati
on
s T
ota
l
Op
era
tin
g R
eve
nu
es
$22,7
59,3
73
$46,1
08,9
33
$68,8
68,3
06
$26,2
33,7
68
$45,5
73,0
12
$71,8
06,7
80
Op
era
tin
g E
xpen
ses:
Co
st o
f p
ow
er,
gas
wate
r
an
d s
team
so
ld14,9
24,9
37
23,7
34,7
83
38,6
59,7
20
18,9
06,3
26 2
2,7
41,9
38 4
1,6
48,2
64
Tra
nsm
issi
on
3,1
33,3
77
3,1
33,3
77
3,1
38,0
09
3,1
38,0
09
Dis
trib
uti
on
2,5
77,2
23
4,3
90,8
76
6,9
68,0
99
2,4
61,0
62
4,4
49,6
03
6,9
10,6
65
Cu
sto
mer
acc
ou
nts
337,0
62
686,1
90
1,0
23,2
52
523,8
77
1,0
68,7
96
1,5
92,6
73
Gen
era
l an
d a
dm
inis
trati
ve 2
,690,2
75
6,6
22,9
48
9,3
13,2
23
2,5
61,4
27
6,3
48,4
61
8,9
09,8
88
Dep
reci
ati
on
pla
nt
an
d e
qu
ipm
en
t 999,1
74
3,8
44,8
65
4,8
44,0
39
953,1
72
3,7
17,8
15
4,6
70,9
87
To
tal O
pera
tin
g E
xpen
ses
21,5
28,6
71
42,4
13,0
39
63,9
41,7
10
25,4
05,8
64
41,4
64,6
22
66,8
70,4
86
Op
era
tin
g In
com
e
$3,6
95,8
94
$
4,9
26,5
96
$4,1
08,3
90
$4,9
36,2
94
Oth
er
Reve
nu
es
(Exp
en
ses)
:
Inve
stm
en
t in
com
e
1,3
37,2
66
1,4
03,8
23
Net
gain
(lo
ss)
on
in
vest
men
ts
Bo
nd
in
tere
st e
xpen
se
Oth
er
inte
rest
exp
en
se
Mis
cella
neo
us
inco
me -
net
714,7
40
705,9
45
Am
ort
izati
on
Imp
air
men
t lo
ss -
Harr
is w
ate
r ri
gh
ts
Net
loss
- p
lan
t re
tire
men
ts
Net
gain
- m
erc
han
dis
e jo
bb
ing
No
rth
east
Uti
litie
s se
ttle
men
t g
ain
284,2
42
Refu
nd
of
clean
-up
fu
nd
ove
rpaym
en
t595,4
05
Mt.
To
m p
rop
ert
y ass
ess
men
t exp
en
ses
Taxe
s -
oth
ers
To
tal O
ther
Reve
nu
es
(Exp
en
ses)
Inco
me B
efo
re O
pera
tin
g T
ran
sfers
1,3
89,7
19
5,2
64,3
47
Paym
en
t in
lie
u o
f ta
xes
- C
ity
of
Ho
lyo
ke
Net
Inco
me (
Loss
)
331,3
99
Reta
ined
Earn
ing
s -
Beg
inn
ing
of
Year
74,6
00,7
80
70,3
94,5
97
Reta
ined
Earn
ing
s -
En
d o
f Y
ear
$74,9
32,1
79
$74,6
00,7
80
$1,2
30,7
02
$827,9
04
1,6
08,5
63
1,6
97,5
14
Bo
iler
dem
olit
ion
exp
en
se
63,1
93
4,2
06,1
83
-1,9
25,8
50
-1,9
71,7
87
-154,2
35
-191,8
53
-147,8
76
-210,3
99
-503,7
70
-1,6
51,0
01
-1,9
09,9
06
-207,9
32
-1,4
57,4
63
-93,9
28
-1,0
79,7
46
-81,7
93
-84,3
12
-1,0
58,3
20
-1,0
58,1
64
52,3
36
328,0
53
-3,5
36,8
77
2010
2009
See accompanying notes.
H O L Y O K E G A S & E L E C T R I C D E P A R T M E N TA6
This page intentionally left blank.
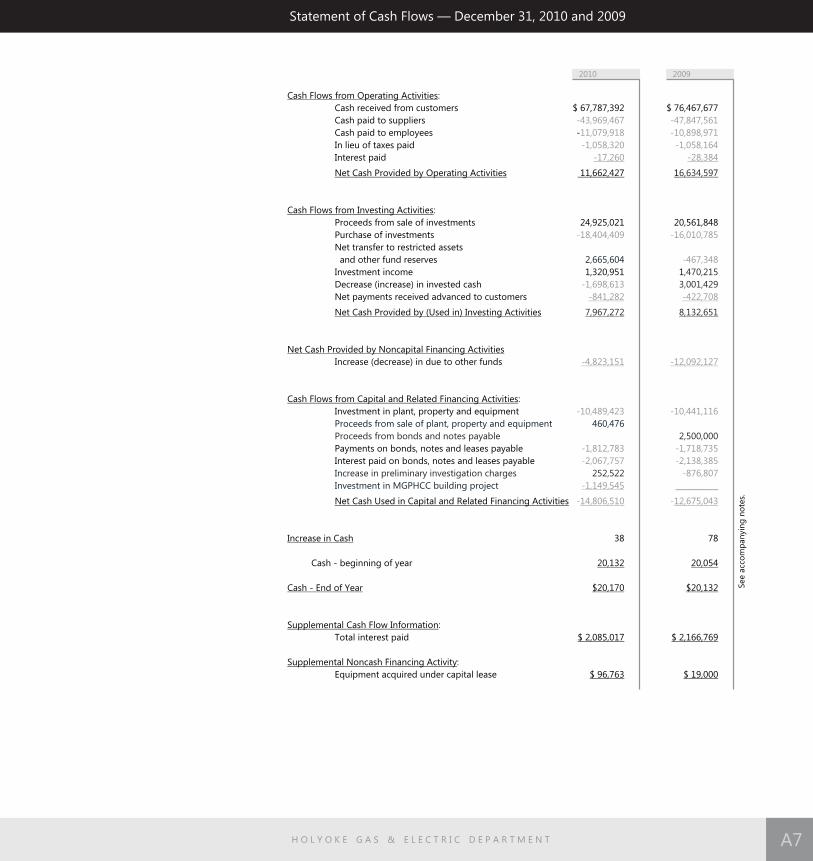
Cash Flows from Operating Activities:
Cash received from customers $ 67,787,392 $ 76,467,677
Cash paid to suppliers
Cash paid to employees -
In lieu of taxes paid
Interest paid
Net Cash Provided by Operating Activities 11,662,427 1
Cash Flows from Investing Activities:
Proceeds from sale of investments 24,925,021 20,561,848
Purchase of investments
Net transfer to restricted assets
and other fund reserves
Investment income 1,320,951 1
Decrease (increase) in invested cash
Net payments received advanced to customers
Net Cash Provided by (Used in) Investing Activities
Net Cash Provided by Noncapital Financing Activities
Increase (decrease) in due to other funds
Cash Flows from Capital and Related Financing Activities:
Investment in plant, property and equipment
Payments on bonds, notes and leases payable
Interest paid on bonds, notes and leases payable
Net Cash Used in Capital and Related Financing Activities
Increase in Cash 38 78
Cash - beginning of year 20,132 20,054
Cash - End of Year $20,170 $20,132
Supplemental Cash Flow Information:
Total interest paid $ 2,085,017 $ 2,166,769
Supplemental Noncash Financing Activity:
Equipment acquired under capital lease $ 96,763 $ 19,000
-43,969,467 -47,847,561
11,079,918 -10,898,971
-1,058,320 -1,058,164
-17,260 -28,384
-18,404,409 -16,010,785
-467,348
-841,282 -422,708
-4,823,151 -12,092,127
-10,489,423 -10,441,116
-1,812,783 -1,718,735
-2,067,757 -2,138,385
-876,807
-1,149,545 ___________
-14,806,510 -12,675,043
6,634,597
,470,215
3,001,429
7,967,272 8,132,651
Proceeds from bonds and notes payable 2,500,000
rease in preliminary investigation charges 252,522
2,665,604
Proceeds from sale of plant, property and equipment 460,476
Inc
Investment in MGPHCC building project
-1,698,613
See a
cco
mp
an
yin
g n
ote
s.
Statement of Cash Flows — December 31, 2010 and 2009
H O L Y O K E G A S & E L E C T R I C D E P A R T M E N T A7
2010 2009

H O L Y O K E G A S & E L E C T R I C D E P A R T M E N TA8
This page intentionally left blank.

Operating Income $ 4,926,596
Adjustments to Reconcile Operating Income to Net Cash
Provided by Operating Activities
Deprecation 4,844,039 4,670,987
Other interest expense
Other income 887,433 869
Boiler demolition expense
Payment in lieu of taxes
Changes in operating assets and liabilities
(Increase) decrease - accounts receivable 2,020,799
- materials and supplies
- fuel for electric generation
and gas in storage 411,276
- prepaid expense
- other receivables 76,758
Increase (decrease) - accounts payable
- customers’ deposits
- accrued liabilities 24,831 2
- accrued compensated absences 181
- accrued environmental costs
- deferred credits
Total Adjustments 6,735,831 11,698,303
Net Cash Provided by Operating Activities
$ 4,936,294
-17,260 -28,384
-1,457,463 -93,928
-1,079,746
-1,140,113 -1,142,476
-422,049
-457,913 -206,837
-85,787
-1,203,552
-32,037
-119,095
-942,875
-292,413 -123,033
,777
and other property taxes
1,475,214
12,614
1,998,495
59,157
,493
,187
- deferred rate stabilization costs 3,096,000 3,096,000
208,191
$ 11,662,427 $ 16,634,597
Mt. Tom property assessment expense
2,428,018
See a
cco
mp
an
yin
g n
ote
s.
Schedule of Reconciliation of Operating Income to Net CashProvided by Operating Activities — December 31, 2010 and 2009
H O L Y O K E G A S & E L E C T R I C D E P A R T M E N T A9
2010 2009

H O L Y O K E G A S & E L E C T R I C D E P A R T M E N TA10
This page intentionally left blank.

Nature of Business - The financial statements present information on the activities of the Gas and Electric
Department (the Department), an Enterprise Fund of the City of Holyoke, Massachusetts (the City). The
Department provides gas, electric, water, and telecommunications services to its customers, substantially all
of whom are local residents and commercial and industrial businesses. The Department also provided steam
services through September 30, 2010. Approximately 61% of the Department's revenues are derived from
its electric division. The Department is subject to regulation by the Federal Energy Regulatory Commission
(FERC), the Massachusetts Department of Public Utilities (DPU), and the Massachusetts Department of
Telecommunication & Cable (DTC).
Accounting Method - The financial statements are prepared on the accrual basis. The Department applies
all Governmental Accounting Standards Board (GASB) pronouncements as well as the Financial Accounting
Standards Board (FASB) pronouncements issued after November 30, 1989, unless those pronouncements
conflict with or contradict GASB pronouncements.
Expense Allocation - Expenses associated with a particular division are charged to that division. For the
years ended December 31, 2010 and 2009, shared expenses including administrative and supporting costs
are allocated to each division as follows:
Gas 35.0%
Electric, Steam and Telecommunications 65.0%
Use of Estimates - The preparation of financial statements in conformity with generally accepted accounting
principles requires management to make estimates and assumptions that affect the reported amounts of
assets and liabilities and disclosure of contingent assets and liabilities at the date of the financial statements
and the reported amounts of revenues and expenses during the reporting period. Actual results could differ
from those estimates.
Plant, Property and Equipment - Additions to and replacements of plant, property and equipment are
recorded at cost. The cost of plant, property and equipment retired, less accumulated depreciation and
salvage, is charged against revenue in the year retired. The cost of repairs and minor renewals is charged to
maintenance expense.
Depreciation - Depreciation of $4,844,039 in 2010 and $4,670,987 in 2009 is computed using the straight-
line method. The composite rate for 2010 and 2009 is 3% of depreciable property in service. The composite
rate is in accordance with Massachusetts Department of Public Utilities regulations.
Preliminary Investigation Charges - This account represents expenditures for preliminary surveys, plans,
investigations, etc. made for the purpose of determining the feasibility of utility projects under
contemplation. At December 31, 2010 and 2009 the balance included costs associated with the Mt. Tom
wind pre-permitting phase.
Materials, Supplies and Fuel - Materials, supplies and fuel are valued at average cost.
Revenue Recognition - Operating revenues are recognized on the basis of cycle billings rendered monthly,
net of discounts. Revenues are not accrued for services delivered beyond such cycle billing dates.
Discounts reported for the years ended December 31, 2010 and 2009 are as follows:
Gas $ 1,892,894 $ 2,254,773
Electric 3,599,184 3,548,217
Steam 12,861 25,725
Total $ 5,504,939 $ 5,828,715
Income Taxes - Income of the Department is excluded from taxation by Section 115 of the United States
H O L Y O K E G A S & E L E C T R I C D E P A R T M E N T A11
1.0 - SUMMARY OF SIGNIFICANT ACCOUNTING POLICIES:
2010 2009
Notes to Financial Statements — December 31, 2010 and 2009
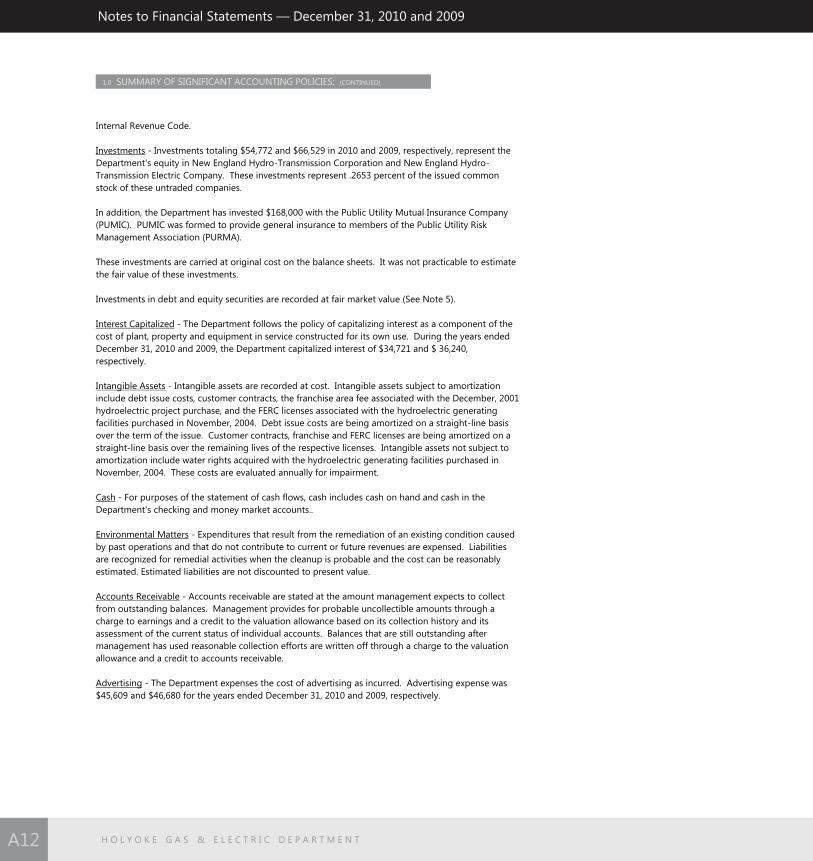
Internal Revenue Code.
Investments - Investments totaling $54,772 and $ in 2010 and 2009, respectively, represent the
Department's equity in New England Hydro-Transmission Corporation and New England Hydro-
Transmission Electric Company. These investments represent .2653 percent of the issued common
stock of these untraded companies.
In addition, the Department has invested $168,000 with the Public Utility Mutual Insurance Company
(PUMIC). PUMIC was formed to provide general insurance to members of the Public Utility Risk
Management Association (PURMA).
These investments are carried at original cost on the balance sheets. It was not practicable to estimate
the fair value of these investments.
Investments in debt and equity securities are recorded at fair market value (See Note 5).
Interest Capitalized - The Department follows the policy of capitalizing interest as a component of the
cost of plant, property and equipment in service constructed for its own use. During the years ended
December 31, 2010 and 2009, the Department capitalized interest of $34,721 and $ 36,240,
respectively.
Intangible Assets - Intangible assets are recorded at cost. Intangible assets subject to amortization
include debt issue costs, customer contracts, the franchise area fee associated with the December, 2001
hydroelectric project purchase, and the FERC licenses associated with the hydroelectric generating
facilities purchased in November, 2004. Debt issue costs are being amortized on a straight-line basis
over the term of the issue. Customer contracts, franchise and FERC licenses are being amortized on a
straight-line basis over the remaining lives of the respective licenses. Intangible assets not subject to
amortization include water rights acquired with the hydroelectric generating facilities purchased in
November, 2004. These costs are evaluated annually for impairment.
Cash - For purposes of the statement of cash flows, cash includes cash on hand and cash in the
Department's checking and money market accounts..
Environmental Matters - Expenditures that result from the remediation of an existing condition caused
by past operations and that do not contribute to current or future revenues are expensed. Liabilities
are recognized for remedial activities when the cleanup is probable and the cost can be reasonably
estimated. Estimated liabilities are not discounted to present value.
Accounts Receivable - Accounts receivable are stated at the amount management expects to collect
from outstanding balances. Management provides for probable uncollectible amounts through a
charge to earnings and a credit to the valuation allowance based on its collection history and its
assessment of the current status of individual accounts. Balances that are still outstanding after
management has used reasonable collection efforts are written off through a charge to the valuation
allowance and a credit to accounts receivable.
Advertising - The Department expenses the cost of advertising as incurred. Advertising expense was
$45,609 and $46,680 for the years ended December 31, 2010 and 2009, respectively.
66,529
Notes to Financial Statements — December 31, 2010 and 2009
H O L Y O K E G A S & E L E C T R I C D E P A R T M E N TA12
1.0 SUMMARY OF SIGNIFICANT ACCOUNTING POLICIES: (CONTINUED)

Electric/
Telecommunications Steam Gas Total
Land $ 3,412,358 $ 0 $ 288,804 $ 3,701,162
Plant Investment 124,511,721 0 32,330,920 156,842,641
Office Furniture and Equip. 2,473,466 0 1,186,231 3,659,697
Transportation Equip. 3,271,606 0 998,959 4,270,565
Other 704,689 0 284,571 989,260
Total $ 134,373,840 $ 0 $ 35,089,485 $ 169,463,325
The Department participates in a cash and investment pool maintained by the City. In addition, the
Department holds certain cash separately from the pool.
Custody and use of restricted assets are subject to requirements and restrictions imposed under
contractual agreements, bond indentures, and the General Laws of the Commonwealth of
Massachusetts, and are not available for normal operating purposes. Purchased power funds are on
deposit with Massachusetts Municipal Wholesale Electric Company (MMWEC) to pay for energy and
related services as required under existing agreements. Rate stabilization funds are amounts set aside to
be used to stabilize current and future power costs.
Electric/
Telecommunications Steam Gas Total
Land $ 3,035,537 $ 240,418 $ 408,845 $ 3,684,800
Plant Investment 105,462,244 16,493,735 30,857,786 152,813,765
Office Furniture and Equip. 2,056,821 24,580 998,345 3,079,746
Transportation Equip. 3,123,286 68,020 1,001,721 4,193,027
Other 669,432 18,510 172,570 860,512
Total $ 114,347,320 $ 16,845,263 $ 33,439,267 $ 164,631,850
2.0 PLANT, PROPERTY AND EQUIPMENT IN SERVICE:
3.0 CASH AND RESTRICTED ASSETS:
2010
2009
H O L Y O K E G A S & E L E C T R I C D E P A R T M E N T A13
"Due to/from other funds" represents the amount by which the Department's equity in pooled cash
differs from the expenditures paid and receipts collected by the City.
Plant, property and equipment in service consists of the following:
4.0 DUE TO / FROM OTHER FUNDS:
Notes to Financial Statements — December 31, 2010 and 2009

The Department invests various funds in debt and equity securities which are held in the Department's name by Flynn
Financial Partners Ltd. All investments must be made in securities or deposits as authorized by Massachusetts General Laws,
Chapters 54 and 55.
Investments are stated at fair value, which is the amount at which an investment could be exchanged in a current
transaction between willing parties. Fair values are based on quoted market prices.
Net unrealized loss on investments at December 31, 2010 and 2009 is $1,620,911 and $(447,564), respectively
Interest Rate Risk - Interest rate risk is the risk that changes in interest rates will adversely affect the fair value of an
investment. The Department does not have a formal investment policy that limits investment maturities.
At December 31, 2010, the Department's investments were as follows:
5.0 INVESTMENTS IN DEBT AND EQUITY SECURITIES
H O L Y O K E G A S & E L E C T R I C D E P A R T M E N TA14
Debt Securities:
U.S. Agency Bonds $4,071,438 $1,020,084 $2,375,854 $675,500
Corporate Bonds 9,603,790 4,346,690 5,257,100
Municipal Bonds 337,195 99,709 237,486
Preferred Securities 440,300 440,300
14,495,723 $5,466,483 $7,870,440 $1,115,800
Other Investments:
Equity Mutual Funds 7,310,616
Fixed Income Mutual Funds 11,474,393
Cash and Cash Equivalents 1,693,299
$34,974,031
Fair Value 1-5
Maturity in Years
6-10 Over 10
At December 31, 2009, the Department's investments were as follows:
Debt Securities:
U.S. Agency Bonds $7,540,919 $2,605,475 $449,033 $2,769,300 $1,717,111
Corporate Bonds and Notes 6,362,409 1,320,309 5,042,100
Preferred Securities 440,300 440,300
14,343,628 $2,605,475 $1,769,342 $7,811,400 $2,157,411
Other Investments:
Equity Mutual Funds 5,904,350
Fixed Income Mutual Funds 5,833,593
Common Stock 105,910
Cash and Money Market Funds 114,253
$26,301,734
Fair Value 1-5
Maturity in Years
Less Than 1 6-10 Over 10
Notes to Financial Statements — December 31, 2010 and 2009

Federal Home Loan Bank
Agency Bonds 14.81%
There were no such concentrations at December 31, 2010.
The investments are included on the Balance Sheet as follows:
Funds required under bond
indenture $3,000,000 $3,000,000
Customers' deposits 564,408 520,211
Rate stabilization funds 28,329,218 21,176,533
Post employment benefit funds 2,013,458
Operating cash invested 1,066,947 1,604,990
$34,974,031 $26,301,734
In addition, rate stabilization funds of $2,315,481 at December 31, 2010 and $14,226,913 at December 31,
2009 are on deposit with and are invested through the Massachusetts Municipal Wholesale
Electric Company (MMWEC). These funds are reported on the Balance Sheet at fair value.
U.S. Government &
Credit Risk - Credit risk is the risk that an issuer or other counterparty to an investment will not fulfill its
obligations. The Department does not have a separate formal policy regarding credit risk.
As of December 31, 2010 and 2009, the Department's investments were rated as follows:
2009
Percentage of Portfolio
Standard &Poor’s
Standard &Poor’s
2009
2010
Investment TypeIssuer
2010
Moody’sInvestment Service
Moody’sInvestment Service
2009
U.S. Agency Bonds AAA to A AAA to AA2
Corporate Bonds and Notes AAA to BBB- AAA to BAA2 A to BBB- A1 to BAA3
Municipal Bonds AA to AA+ AA2 to AA3
Preferred Securities A- to BB+ BAA2 A- to BBB A3 to BAA2
Custodial Credit Risk
Deposits - Custodial credit risk is the risk that the Department's deposits may not be returned to the
Department. As of December 31, 2010 and 2009, $1,693,299 and $114,253, respectively, were uninsured
and uncollateralized and subject to custodial credit risk.
Investments - For an investment, custodial credit risk is the risk that, in the event of the failure of the
counterparty, the Department will not be able to recover the value of its investment or collateral securities
that are in the possession of an outside party. The Department's investment policy addresses credit risk by
defining allowable investments.
Concentration of Credit Risk - Concentration of credit risk is the risk of loss attributed to the magnitude of
the Department's investment in a single issuer.
At December 31, 2009, the Department's investment portfolio was concentrated as follows:
AAA to A AAA to AA2
H O L Y O K E G A S & E L E C T R I C D E P A R T M E N T A15
5.0 INVESTMENTS IN DEBT AND EQUITY SECURITIES (CONTINUED)
Notes to Financial Statements — December 31, 2010 and 2009

H O L Y O K E G A S & E L E C T R I C D E P A R T M E N TA16
6.0 OTHER RECEIVABLES
Other receivables consist of the following:
Hi-Lite Program - receivable from customers for loans
used to make energy efficient improvements to the
customers property, secured by municipal liens $3,766,142 $2,924,860
Accrued interest receivable 175,911 159,596
MGPHCC building project 1,149,545
Miscellaneous other receivables 1,173,717 1,359,975
6,265,315 4,444,431
Less - amount due in one year 3,570,924 2,430,867
Other Receivables - After One Year (Hi-Lite Program) $ 2,694,391 $ 2,013,564
2010 2009
Life inYears
Gross CarryingAmount
2009
Accumulated Amortization
Gross CarryingAmount
2010
Accumulated Amortization
7.0 INTANGIBLE ASSETS
Debt issue costs 30 $1,297,211 $391,326 $1,297,211 $348,085
Customer contracts
and franchise fees 30 2,000,000 603,333 2,000,000 536,667
License fees 8 90,000 48,769 90,000 10,800
$3,387,211 $1,043,428 $3,387,211 $895,552
Unamortized Intangibles:
Water rights $1,001,020 $1,504,790
Aggregate amortization expense was $147,876 and $210,399 for the years ended December 31, 2010 and
2009, respectively. Estimated aggregate amortization expense is $130,522 for each of the next two years
and $109,907 for the following three years.
In accordance with generally accepted accounting principles, water rights were tested for impairment by
comparing their fair value to their carrying value. The fair value was established based upon a
combination of the discounted cash flows, projected output, and projected market value of output. Using
this procedure, the carrying value of the water rights exceeded its fair value creating an impairment loss of
$503,770 and $1,651,001 for the years ended December 31, 2010 and 2009, respectively, which is shown
separately on the Statement of Revenues, Expenses and Changes in Retained Earnings.
Amortized Intangibles:
2010 Fair Value
2009Fair Value
Notes to Financial Statements — December 31, 2010 and 2009

Electric Power Purchases were as follows:
Masspower MWEC $416,958 $371,207
NYPA MWEC 164,359 185,995
Wyman No. 4 274,031 361,459
MWEC -Nuclear Mix No. 1 2,828,587 2,814,325
MWEC -Nuclear Project No. 3 2,804,811 3,019,155
MWEC - Stony Brook/Peaking 98,593 190,232
MWEC- Special Project 2006A 34,455 46,445
EPEX - net of sales 2,067,139
Open Square 75,554 73,979
Sonoco 52,544
Short-term power supply - net of Hydro sales 3,001,415 3,612,923
$11,765,902 $9,425,763
-1,302,501
H O L Y O K E G A S & E L E C T R I C D E P A R T M E N T A17
During 2003, the Department began to set aside funds which will be used for rate stabilization in the
development of future rates and allow the Department to remain competitive when (it) deregulation goes
into effect. In addition, the Department set aside funds received from the buyout of a power contract
from Select Energy during 2005. These funds will be used to stabilize future power costs.
Amounts set aside are as follows:
Current year's expense set aside 3,096,000 3,096,000
Balance - end of year $42,153,290 $39,057,290
Balance - beginning of year $39,057,290 $35,961,290
2010 2009
8.0 DEFERRED RATE STABILIZATION COSTS
Notes to Financial Statements — December 31, 2010 and 2009
9.0 DEFERRED RATE STABILIZATION COSTS
8.0 DEFERRED RATE STABILIZATION COSTS8.0 ELECTRIC POWER PURCHASES
2010 2009

H O L Y O K E G A S & E L E C T R I C D E P A R T M E N TA18
10.0 BONDS PAYABLE:
Principal maturing and interest payments are anticipated to be as follows:
Principal Interest Total
2011 $ 1,218,333 $ 1,909,010 $ 3,127,343
2012 1,268,333 1,851,409 3,119,742
2013 1,328,333 1,790,918 3,119,251
2014 1,388,333 1,727,282 3,115,615
2015 1,453,333 1,660,396 3,113,729
2016-2020 8,331,668 7,178,789 15,510,457
2021-2025 9,340,000 5,072,583 14,412,583
2026-2030 11,910,000 2,482,375 14,392,375
2031 2,750,000 126,042 2,876,042
$38,988,333 $23,798,804 $62,787,137
Revenue Bonds-
Bond payable - 2001 Series A
Date of issue: December 13, 2001
Interest rates:
2002-2008 4.00%
2009-2010 5.00%
2011-2018 5.375%
2019-2031 5.00% $36,905,000 $37,865,000
Clean Renewable Energy Bond
Boatlock Hydroelectric Station Project - 2009 Series A
Date of issue: January 15, 2009
Interest rate: 1.5%
Secured by revenues of the Department
(subject to existing pledge of revenues
under the Revenue Bonds 2001 Series A) 2,083,333 2,291,667
38,988,333 40,156,667
Less - amount due within one year 1,218,333 1,168,334
Bonds Payable - Due After One Year $ 37,770,000 $ 38,988,333
2010 2009
Notes to Financial Statements — December 31, 2010 and 2009

A19 H O L Y O K E G A S & E L E C T R I C D E P A R T M E N T
10.0 BONDS PAYABLE (CONTINUED)
The Department is required to satisfy certain bond covenant requirements in connection with the bonds
payable. The following funds are required as part of the Bond agreements:
2001 Series A -
Debt Service Fund:
The debt service fund represents amounts held by a trustee to
provide for debt service payments. $ 535,992 $ 535,992
Debt Service Reserve Fund:
The debt service reserve fund represents amounts held by a trustee
in order to provide a reserve for the payment of the principal
or redemption price and interest on the Bonds. 2,900,913 2,900,913
Operating Expense Fund:
The operating expense fund is held by the City of Holyoke and
represents an amount sufficient to pay only the operating expenses
of the Department for the next succeeding month. 6,115,046 6,862,419
Operation and Maintenance Reserve Fund:
The operation and maintenance reserve fund is invested with other
funds as described in Note 5. 3,000,000 3,000,000
2009 Series A -
Debt Service Fund:
The debt service reserve fund represents amounts held
by the Bond owner in an amount equal to one year's principal
and interest payment. 251,367 249,421
Bond Proceeds Fund:
The bond proceeds are deposited in an account with the
Bond owner and represents funds to be used as project
expenses are incurred. 0 1,767,887
$12,803,318 $15,316,632
20092010
Notes to Financial Statements — December 31, 2010 and 2009
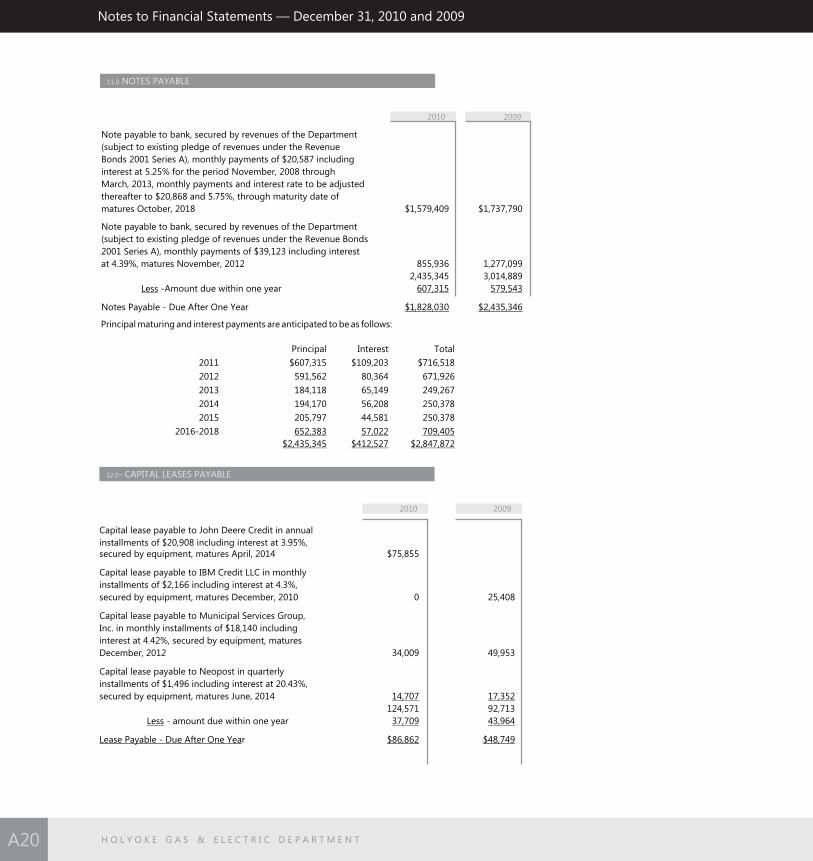
H O L Y O K E G A S & E L E C T R I C D E P A R T M E N TA20
Principal maturing and interest payments are anticipated to be as follows:
Principal Interest Total
2011 $607,315 $109,203 $716,518
2012 591,562 80,364 671,926
2013 184,118 65,149 249,267
2014 194,170 56,208 250,378
2015 205,797 44,581 250,378
2016-2018 652,383 57,022 709,405
$2,435,345 $412,527 $2,847,872
Note payable to bank, secured by revenues of the Department
(subject to existing pledge of revenues under the Revenue
Bonds 2001 Series A), monthly payments of $20,587 including
interest at 5.25% for the period November, 2008 through
March, 2013, monthly payments and interest rate to be adjusted
thereafter to $20,868 and 5.75%, through maturity date of
matures October, 2018 $1,579,409 $1,737,790
Note payable to bank, secured by revenues of the Department
(subject to existing pledge of revenues under the Revenue Bonds
2001 Series A), monthly payments of $39,123 including interest
at 4.39%, matures November, 2012 855,936 1,277,099
2,435,345 3,014,889
Less -Amount due within one year 607,315
Notes Payable - Due After One Year $1,828,030 $2,435,346
579,543
20092010
11.0 NOTES PAYABLE
12.0- CAPITAL LEASES PAYABLE
Capital lease payable to John Deere Credit in annual
installments of $20,908 including interest at 3.95%, secured by equipment, matures April, 2014 $75,855
Capital lease payable to IBM Credit LLC in monthly
installments of $2,166 including interest at 4.3%,
secured by equipment, matures December, 2010 0 25,408
Capital lease payable to Municipal Services Group,
Inc. in monthly installments of $18,140 including
interest at 4.42%, secured by equipment, matures
December, 2012 34,009 49,953
Capital lease payable to Neopost in quarterly
installments of $1,496 including interest at 20.43%,
secured by equipment, matures June, 2014 14,707 17,352
124,571 92,713
Less - amount due within one year 37,709 43,964
Lease Payable - Due After One Year $86,862 $48,749
2010 2009
Notes to Financial Statements — December 31, 2010 and 2009

A21 H O L Y O K E G A S & E L E C T R I C D E P A R T M E N T
13.0 OPERATING LEASES
In March, 2006, the Department entered into a four year lease on a copier. Monthly payments are $329.
The lease expires February, 2010 and has a fair market value purchase option.
In January, 2009, the Department entered into a five year lease for three copiers. Monthly payments are
$537. The lease expires December, 2013 and has a fair market value purchase option.
In December, 2009, the Department entered into a four year equipment lease which begins February, 2010.
Monthly payments to be made in accordance with the rental agreement. The lease expires January, 2014
and may be extended for additional one year periods. The Department has the option to purchase the
equipment at any time for the net book value of the equipment.
Lease expense for the years ended December 31, 2010 and 2009 was $78,371 and $10,720, respectively.
Future minimum lease payments are as follows:
2011 82,823
2012 81,325
2013 79,836
2014 6,106
$250,090
The following is a schedule of future minimum lease payments under capital leases together with
the present value of the net minimum lease payments as of December 31, 2010:
2011 $ 44,556
2012 44,537
2012 26,377
2013 23,365
138,835
Less - amount representing interest 14,264
Present value of future minimum lease payments $124,571
Leased assets recorded under plant, property and equipment include:
Mail Machine $ 19,000
IBM Server 95,361
Dump truck 79,813
Backhoe 96,763
290,937
Less - accumulated depreciation 99,904
$191,033
12.0 CAPITAL LEASES PAYABLE (CONTINUED)
Notes to Financial Statements — December 31, 2010 and 2009

H O L Y O K E G A S & E L E C T R I C D E P A R T M E N TA22
Contributory Plan - Substantially all full-time employees participate in the Holyoke Contributory Retirement
System, a cost sharing multiple employer public employee retirement system. The system is partially
funded by employee contributions.
The plan provides pension benefits, deferred allowances and death and disability benefits. A member may
retire after reaching age 55 with 10 years of creditable service, or with no age requirement after 20 years of
service. Members become vested after ten full years of creditable service.
Retirement allowance is based on the following factors: age, length of creditable service, level of salary,
and group classification. Age at retirement and group classification determine a benefit rate. This rate,
multiplied by the length of creditable service, is multiplied by the average of the three highest
(consecutive) years' compensation. Percentages are specified in Chapter 32 of the Massachusetts General
Laws. Participants may elect to receive their retirement in one of three optional forms of payment.
Member employers are required by state statutes to make contributions to the plan. Contributions are
determined by the Commonwealth of Massachusetts Division of Public Employee Retirement
Administration (PERA). The Department's contributions charged to expense for the years ended December
31, 2010, 2009 and 2008 are $2,731,102, $2,678,264 and $2,348,650, respectively. The total contribution
figure represents approximately 23%, 23% and 21% of covered payroll for the years ended December 31,
2010, 2009 and 2008, respectively. Total payroll for the same periods was approximately $11,904,003,
$11,536,866 and $11,448,753, respectively. The Department's contributions for the years ended December
31, 2010, 2009 and 2008 was 19.4%, 19.9% and 19.3%, respectively, of the total contributions for all
employers covered by the plan.
Covered employees are required by state statute to contribute a fixed percentage of their earnings into the
plan. The percentage varies from 5 to 9 percent depending upon date of hire. All employees hired after
January 1, 1979 contribute an additional 2% on all gross regular earnings over $30,000 per year.
Employee contributions for the years ended December 31, 2010, 2009 and 2008 are $829,237, $936,942
and $895,811, respectively.
The plan issues a publicly available financial report that includes financial statements and required
supplementary information. This report may be obtained by writing or calling the plan as follows:
Attn: Daniel Owens, Executive Director
Holyoke Retirement Board
City Hall Annex - Room 207
Holyoke, Massachusetts 01040
(413) 534-2179
Noncontributory Plan - Employees hired prior to January 1, 1938, participate in the noncontributory
pension plan. The Department is required by state statutes to pay benefits as the obligation arises.
Benefits are established by state statutes. The Department's contributions for the years ended December
31, 2010, 2009 and 2008 are $21,427, $21,081 and $20,745, respectively.
14.0 DISCONTINUED OPERATIONS
Notes to Financial Statements — December 31, 2010 and 2009
15.0 RETIREMENT PLANS (CONTINUED)
As of September, 2010, the Department discontinued providing steam services to its customers. The
Department provided assistance to its customers to obtain replacement heating systems. Through
September 30, 2010, the steam division had revenue of $2,146,751 and a loss of $986,135 from
operations. For the year ended December 31, 2009, the steam division had revenue of $3,249,749 and a
loss of $1,204,446 from operations. Plant, property and equipment, net of accumulated depreciation,
which has been written off as part of the discontinued operations, totaled $1,822,748. Expenses associated
with the plant removal were $1,457,463 and $93,928 for the years ended December 31, 2010 and
2009, respectively.
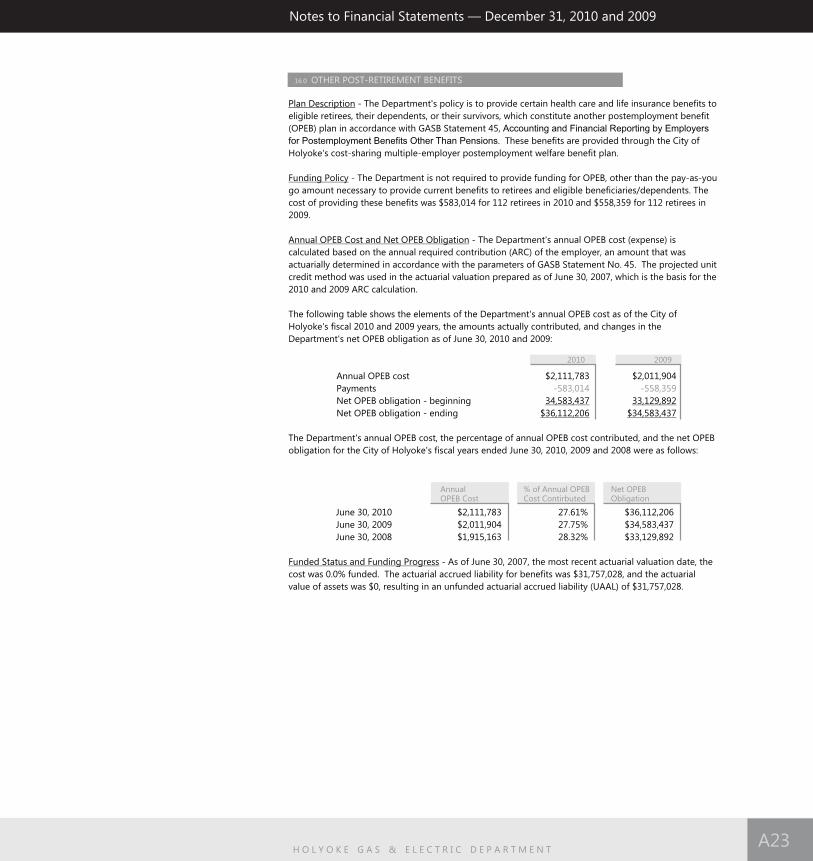
Plan Description - The Department's policy is to provide certain health care and life insurance benefits to
eligible retirees, their dependents, or their survivors, which constitute another postemployment benefit
(OPEB) plan in accordance with GASB Statement 45, Accounting and Financial Reporting by Employers
for Postemployment Benefits Other Than Pensions. These benefits are provided through the City of
Holyoke's cost-sharing multiple-employer postemployment welfare benefit plan.
Funding Policy - The Department is not required to provide funding for OPEB, other than the pay-as-you
go amount necessary to provide current benefits to retirees and eligible beneficiaries/dependents. The
cost of providing these benefits was $583,014 for 112 retirees in 2010 and $558,359 for 112 retirees in
2009.
Annual OPEB Cost and Net OPEB Obligation - The Department's annual OPEB cost (expense) is
calculated based on the annual required contribution (ARC) of the employer, an amount that was
actuarially determined in accordance with the parameters of GASB Statement No. 45. The projected unit
credit method was used in the actuarial valuation prepared as of June 30, 2007, which is the basis for the
2010 and 2009 ARC calculation.
The following table shows the elements of the Department's annual OPEB cost as of the City of
Holyoke's fiscal 2010 and 2009 years, the amounts actually contributed, and changes in the
Department's net OPEB obligation as of June 30, 2010 and 2009:
Annual OPEB cost $2,111,783 $2,011,904
Payments
Net OPEB obligation - beginning 34,583,437 33,129,892
Net OPEB obligation - ending $36,112,206 $34,583,437
The Department's annual OPEB cost, the percentage of annual OPEB cost contributed, and the net OPEB
obligation for the City of Holyoke's fiscal years ended June 30, 2010, 2009 and 2008 were as follows:
June 30, 2010 $2,111,783 27.61% $36,112,206
June 30, 2009 $2,011,904 27.75% $34,583,437
June 30, 2008 $1,915,163 28.32% $33,129,892
Funded Status and Funding Progress - As of June 30, 2007, the most recent actuarial valuation date, the
cost was 0.0% funded. The actuarial accrued liability for benefits was $31,757,028, and the actuarial
value of assets was $0, resulting in an unfunded actuarial accrued liability (UAAL) of $31,757,028.
-583,014 -558,359
AnnualOPEB Cost
% of Annual OPEBCost Contirbuted
Net OPEBObligation
20092010
Notes to Financial Statements — December 31, 2010 and 2009
16.0 OTHER POST-RETIREMENT BENEFITS
H O L Y O K E G A S & E L E C T R I C D E P A R T M E N TA23

H O L Y O K E G A S & E L E C T R I C D E P A R T M E N TA24
Notes to Financial Statements — December 31, 2010 and 2009
16.0 (CONTINUED)OTHER POST-RETIREMENT BENEFITS
Actuarial Methods and Assumptions - Actuarial valuations of an ongoing plan involve estimates of the value of
reported amounts and assumptions about the probability of occurrence of events far into the future, such as
assumptions about future employment, mortality and the healthcare cost trend. Amounts determined regarding
the funded status of the Plan and the annual required contributions of the Department are subject to continual
revision as actual results are compared with past expectations and new estimates are made about the future.
Projections of benefits for financial reporting purposes are based on the types of benefits provided at the time of
each valuation and the historical pattern of sharing of benefit costs between the employer and the employees to
that point. The actuarial methods and assumptions used include techniques that are designed to reduce short-
term volatility in actuarial accrued liabilities, consistent with the long-term perspective of the calculations.
The actuarial methods and significant assumptions used to determine the annual required contribution are
detailed in the City of Holyoke Actuarial Valuation and Review of Other Postemployment Benefits (OPEB) Report as
of June 30, 2007. The report is available in the City Auditor's office, City Hall Annex - Room 101, Holyoke, MA
01040.
The schedule of funding progress, shown as required supplementary information below, presents the results of
OPEB valuations as of June 30, 2007, and looking forward, the schedule will eventually provide multiyear trend
information about whether the actuarial values of plan assets are increasing or decreasing over time relative to the
actuarial accrued liabilities for benefits.
Required Supplementary Information (unaudited)
Schedule of Funding Progress
June 30, 2007 $ -0- $31,757,028 $31,757,028 $ -0- N/A N/A
ValuationDate
Value ofAssets
ActuarialAccruedLiability (AAL)
Unfunded AAL(UAAL)
Funded Ratio
Covered Payroll
Percentageof CoveredPayroll
At December 31, 2010 and 2009, the Department had amounts on deposit with a bank which exceeded FDIC
insurance limits by $5,880,843 and $4,679,910, respectively.
In the ordinary course of business, the Department extends unsecured credit to its regular customers. Amounts
outstanding at December 31, 2010 and 2009 were $8,026,282 and $7,604,233, respectively.
Sources of Labor Supply - Sixty-four percent of the Department's labor force is covered under a collective
bargaining agreement between the City of Holyoke Gas and Electric Department and the Holyoke Municipal Gas,
Light & Power Guild, Inc. The agreement was extended through March 31,2013.
The Department had one customer that accounted for 73% and 58% of steam sales in 2010 and 2009,
respectively.
17.0 CONCENTRATIONS OF CREDIT RISKS:

H O L Y O K E G A S & E L E C T R I C D E P A R T M E N T A25
Notes to Financial Statements — December 31, 2010 and 2009
The Department provides gas, electric and steam sales and service, as well as, telecommunication
services to the City ofHo1yoke: Total sales were $3,779,393 and $3,777,619 for the years ending
December 31, 2010 and 2009, respectively. Amounts due from the City totaled $435,615 and $463,311
at December 31, 2010 and 2009, respectively.
The Department has also recorded contributions in lieu of taxes to the City of Holyoke of $1,058,320
and $1,058,164 for the years ended December 31, 2010 and 2009, respectively.
18.0 RELATED PARTY TRANSACTIONS
Purchased Power Contracts:
Masspower - During 1989, a contract was signed with Masspower, through MMWEC, for approximately
9.157 MW during the winter and 7.781 MW during the summer per year starting in 1993 until July 31,
2013. Annual charges were to be approximately $5 million depending on level of dispatch of the facility.
During 2006, MMWEC filed a civil action against Masspower. The court ruled in favor of Masspower and
MMWEC appealed this decision, which was later affirmed by the Massachusetts Appeals Court. In
addition, in July, 2007, MMWEC terminated the contract for material breach. Masspower filed a civil
action against MMWEC and in January, 2008 the court ruled in favor of MMWEC. Masspower appealed
this decision. In January, 2011, the court ruled in favor of MMWEC in three of the four counts. In March,
2011 both Masspower and MMWEC filed notices of appeal relating to the January, 2011 ruling. It is
unknown at this time how the outcome of this litigation will affect future contract terms (including
pricing). During 2007, the Department started recognizing a liability for the potential estimated losses
that could be incurred as a result of the lawsuits by and against Masspower. The total amount included
in deferred rate stabilization costs as of December 31, 2010 and 2009 is $10,288,000 and $7,192,000,
respectively.
Short-term power - On a continuing basis, the Department also enters into several short-term power
supply contracts for either the purchase or sale of capacity, energy, renewable certificates or ancillary
services with various suppliers.
MMWEC Special Project 2006A - In August, 2006, the Department executed a Participation
Acknowledgement Certificate and Project Development Agreement (PDA) with MMWEC for all pre-
development costs associated with its share of a new generating facility to meet a projected future
need of baseload energy and capacity. Under the PDA, the Department's share of project development
costs were $428,100 and no further costs within this phase are expected. It is expected that this plant
will be operational by June, 2014.
Telecommunications Contracts - The Department has entered into long-term contracts for dedicated
point-to-point data lines and Internet Access services from several companies. These contracts have
five to ten year terms. In addition the Department has entered into one-year contracts with two
companies for frame relay lines, dialup help desk support and dedicated line monitoring services.
In 2006, the Department entered into an agreement with the City of Chicopee Electric Light Department
(CEL) to offer and provide telecommunication services to Chicopee residents and businesses. This
agreement is for an initial term of six years.
In 2002, the Department entered into a lease with Fiber Technologies Networks, LLC (Fibertech) for use
of the Department's fiber optic lines. The lease provides for an annual payment per route mile for 20
years with an option to renew for an additional five years.
19.0 COMMITMENTS AND CONTINGENCIES:

H O L Y O K E G A S & E L E C T R I C D E P A R T M E N TA26
MMWEC - General -The Department is a Participant in certain Projects of the Massachusetts Municipal
Wholesale Electric Company (MMWEC), a public corporation and a political subdivision of the
Commonwealth of Massachusetts. Currently, the Department is a member of MMWEC on a month to
month basis. Any decision regarding membership status will have no effect on the Department's
commitments and contingencies on MMWEC projects in existence prior to the Department's
membership termination.
MMWEC was created as a means to develop bulk power supply for its Members and Project Participants.
MMWEC is authorized to construct, own or purchase ownership interests in and to issue revenue bonds
to finance electric facilities (Projects). MMWEC has acquired ownership interests in electric facilities
operated by other utilities and also operates its own electric facilities. MMWEC sells all of the capability
of each of its Projects to its Members and other utilities (Project Participants) under Power Sales
Agreements (PSAs). Among other things, the PSAs require each Project Participant to pay its pro rata
share of MMWEC's costs related to the Project, which costs include debt service on bonds issued by
MMWEC to finance the Project, plus 10% of MMWEC's debt service to be paid into a Reserve and
Contingency Fund. In addition, should any Project Participant fail to make any payment, other Project
Participants may be required to increase (step-up) their payments and correspondingly their Participants'
share of Project Capability to an additional amount not to exceed 25% of their original Participants' share
of the Project Capability. Project Participants have covenanted to fix, revise and collect rates at least
sufficient to meet their obligations under the PSAs.
The Department has entered into Power Sales Agreements (PSAs) and Power Purchase Agreements
(PPAs) with MMWEC. Under both the PSAs and PPAs, the Department is required to make certain
payments to MMWEC payable solely from the Department's revenues. Under the PSAs, each participant
is unconditionally obligated to make payments due to MMWEC whether or not the Project(s) is
completed or operating and notwithstanding the suspension or interruption of the output of the
Project(s).
MMWEC operates the Stony Brook Intermediate Project and Stony Brook Peaking Project fossil-fueled
power plants, (the latter which the Department has a 4.818 MW share). In addition, MMWEC has a 3.7%
interest in the W.F. Wyman Unit No. 4 plant owned and operated by FPL Energy Wyman IV, an indirect
subsidiary of NextEra Energy Resources LLC and a 4.8% ownership interest in the Millstone Unit 3 nuclear
unit operated by Dominion Nuclear Connecticut, Inc. (DNCI) a subsidiary of Dominion Resources, Inc. In
addition to Millstone Unit 3, DNCI also is the owner of Millstone Unit 2. DNCI requested and received an
exemption from the Nuclear Regulatory Commission (NRC) enabling them to submit an application
earlier than 20 years before the expiration of the operating license for Unit 3 so that DNCI could submit
its application for license renewal for Unit 2 and Unit 3 at the same time. In November, 2006, the NRC
renewed the operating licenses for Unit 2 and Unit 3 for an additional twenty years. The license for Unit
2 was extended to July 31, 2035 and the license for Unit 3 was extended to November 25, 2045.
A substantial portion of MMWEC's plant investment and financing program is an 11.6% ownership
interest in the Seabrook Station nuclear generating unit operated by NextEra Energy Seabrook, LLC, an
indirect subsidiary of NextEra Energy Resources LLC. In December, 2005, the NRC issued an amendment
to the operating license that extends the expiration date from October, 2026 to March, 2030 to recapture
the period from 1986 to 1990 during which time Seabrook Station had an operating license but did not
operate. NextEra Energy Seabrook, LLC intends to request an extension of the Seabrook Station
operating license beyond March, 2030. Pursuant to the PSAs, the MMWEC Seabrook and Millstone
Project Participants are liable for their proportionate share of the costs associated with decommissioning
the plants, which is being funded through monthly Project billings. The Project Participants are also
liable for their proportionate share of the uninsured costs of a nuclear incident that might be imposed
under the Price-Anderson Act. In July, 2005, as part of the Energy Policy Act of 2005, Congress extended
the Price-Anderson Act through the end of 2025.
MMWEC represents certain municipal light plants, including the Department, with respect to the Hydro
Quebec-Phase II project (Project). The Department is an equity participant in the Project. The
agreements which comprise the Project include requirements that the participant make equity
contributions, provide credit support and furnish certain guarantees. In addition, the Project contains a
step-up mechanism which requires participants to assume obligations of other participants who are in
default, subject to certain limitations. The Department's potential liability cannot be reasonably
estimated at this time.
Notes to Financial Statements — December 31, 2010 and 2009
19.0 COMMITMENTS AND CONTINGENCIES: (CONTINUED)

H O L Y O K E G A S & E L E C T R I C D E P A R T M E N T A27
As of December 31, 2010, total capital expenditures by MMWEC amounted to $1,573,048,000 of which
$45,284,000 represents the amount associated with the Department's Project Capability. MMWEC's debt
outstanding for the Projects includes Power Supply System Revenue Bonds totaling $444,255,000 of which
$14,500,000 is associated with the Department's share of Project Capability. As of December 31,
2010, MMWEC's total future debt service requirement on outstanding Bonds issued for the Projects is
$491,543,000, of which $15,643,000 is anticipated to be billed to the Department in the future.
The estimated aggregate amount of the Department's required payments under the PSAs and PPAs, exclusive
of the Reserve and Contingency Fund billings, to MMWEC at December 31, 2010 and estimated for future
years is shown below:
For the years ended December 31, 2011 $ 2,885,000
2012 2,889,000
2013 2,765,000
2014 2,382,000
2015 2,155,000
2016-2019 2,567,000
$15,643,000
In addition, the Department is required to pay its share of the operation and maintenance (O&M) costs of the
Projects in which they participate. The Department's total O&M costs including debt service under the PSAs
were $6,326,000 and $6,470,000 for the years ended December 31, 2010 and 2009, respectively.
Deregulation - In 1997, legislation was passed mandating retail wheeling of electricity for private electric
utilities. If the Department opts to open its borders, it will no longer have a franchise area and all utilities may
have the ability to enter into contracts to provide electricity generation to any customer. The potential impact
on the Department's revenue from retail competition cannot be reasonably estimated at this time.
Hydroelectric Facility - As part of the Department's purchase of hydroelectric generating assets and a
distribution franchise in 2001, FERC required certain modifications to the hydroelectric facility. The cost of
these modifications over the next several years is likely to exceed ten million dollars.
Self Insurance - For general liability purposes, the Department is self-insured up to $50,000, has self-insurance
trust coverage in the amount of $400,000 and general liability insurance for $50,000 to $10,000,000 per
occurrence. The Department is also self insured for workers compensation up to $250,000 per occurrence. A
policy is in effect for excess workers compensation.
Environmental Protection and Other Issues - In 1990, the Massachusetts Department of Environmental
Protection (MDEP) sent a notice of responsibility to the Department and other parties regarding the presence
of coal tar on property known as the gas works, adjacent to the Connecticut River. An investigation of the site
has revealed concentrations of contaminants on the site and MDEP classified the area as a priority site. A
second notice of responsibility was issued in September, 1993 for gas tar deposits in the Connecticut River,
effectively separating the gas works into a land site and a river site.
Effective February, 2003, the Department increased the gas rates in order to collect additional dollars for clean-
up of the gas works site and is accruing amounts, based on management's best estimate of the probable and
reasonably estimable costs related to this clean-up. The current estimate for the clean-up of the land site is
approximately $914,000. No estimate is currently available for the river site. The measurement of the accrual
for remediation costs is subject to uncertainty, including the evolving nature of environmental regulations and
the difficulty in estimating the extent and type of remediation activity that will be utilized.
19.0 COMMITMENTS AND CONTINGENCIES: (CONTINUED)
Notes to Financial Statements — December 31, 2010 and 2009

H O L Y O K E G A S & E L E C T R I C D E P A R T M E N TA28
Notes to Financial Statements — December 31, 2010 and 2009
19.0 COMMITMENTS AND CONTINGENCIES: (CONTINUED)
Environmental Protection and Other Issues (continued) - During 2009, a Department contractor
brought suit in federal and state court alleging civil rights and discrimination violations. In addition,
an individual is alleging injuries incurred during 2010 while working as a Department contractor.
The Department denies liability and is vigorously defending these suits.
In July, 2009, a “preliminary non-public investigation” was initiated by the Office of Enforcement,
Division of Investigations of the Federal Energy Regulatory Commission. The investigation concerns
the reporting by the Department to ISO New England, Inc. of certain unit outages during 2008. The
investigation remains pending and it is not reasonable to estimate whether any penalties or charges
might be imposed on the Department (or its employees), as a result of the investigation. The
Department's management has been cooperating fully in all stages of the investigation.
Construction Programs - The Department has budgeted construction expenditures of
approximately $10 million to be incurred during 2011.
Prior year's financial statements have been reclassified to conform with the current year's
presentation. The reclassification has no effect on the previously reported net income for the year
ended December 31, 2009.
The Department has evaluated events that have occurred subsequent to December 31, 2010,
through April 7, 2011, the date these financial statements were available to be issued and has
determined there were no material events requiring recognition or disclosure.
20.0 PRIOR PERIOD RECLASSIFICATION
21.0 SUBSEQUENT EVENT

H O L Y O K E G A S & E L E C T R I C D E P A R T M E N T A29

H O L Y O K E G A S & E L E C T R I C D E P A R T M E N TA30
Schedule of Operating Revenues and Expenses — December 31, 2010 and 2009
Operating Revenues:
Residential $ 9,050,499 $10,699,101
Commercial 8,793,287 9,229,413
Industrial 2,082,905 2,425,854
Municipal 655,995 746,649
Department sales 1,629,812 2,204,751
Sales for resale 546,875 928,000
Total Operating Revenues $ 22,759,373 $ 26,233,768
Cost of Gas Sold:
Purchases - natural gas $13,550,669 $16,913,408
Liquid natural gas processed 568,746 1,174,147
Environmental response 575,250 575,250
Supplies and expenses 230,272 243,521
Total Cost of Gas Sold $14,924,937 $18,906,326
Distribution:
Salaries and wages
- system control and load dispatch $253,781 $245,226
- supervision and engineering 275,644 292,852
- customer installation 428,834 405,398
- operation 448,200 443,557
- maintenance 476,408 465,192
Supplies and expenses 694,356 608,837
Total Distribution $2,577,223 $2,461,062
Customer Accounts:
Salaries and wages
- meter reading $69,214 $ 66,407
- accounting and collection 139,708 144,762
Supplies and expenses 13,453 16,046
Uncollectible accounts 114,687 296,662
Total Customer Accounts $337,062 $523,877
General and Administrative:
Salaries $696,042 $ 674,029
Pensions and benefits 1,309,917 1,326,546
Insurance 122,880 113,944
General supplies and expenses 561,436 446,908
Total General and Administrative $2,690,275 $2,561,427
GAS DIVISION
2010 2009

H O L Y O K E G A S & E L E C T R I C D E P A R T M E N TA31
Operating Revenues:
Electric Sales-
Residential $ 13,845,075 $12,515,829
Commercial 19,948,711 19,717,009
Industrial 4,910,511 4,768,308
Municipal 2,698,002 2,622,142
Interdepartmental 439,016 480,067
Water 6,312 5,734
Cobble Mountain operation - net 294,857 389,673
Steam sales 2,146,751 3,249,749
Telecommunication sales 1,819,698 1,824,501
Total Operating Revenues $46,108,933 $45,573,012
Cost of Electricity/Steam/Water Sold:
Purchases - electricity $11,765,902 $9,425,763
Replacement power 3,096,000 3,096,000
Fuel for electric generation 173,195 113,133
Salaries and wages - production 1,517,953 1,479,129
- maintenance 1,341,062 1,441,240
Supplies and expenses 2,846,234 2,844,840
Cost of water sold 445,127 700,160
Cost of steam sold 2,549,310 3,641,673
Total Cost of Electricity Sold $23,734,783 $22,741,938
Electric Transmission:
Salaries and wages $443,811 $434,649
Supplies and expenses 56,579 106,034
Transmission by others 2,632,987 2,597,326
Total Electric Transmission $3,133,377 $3,138,009
Distribution:
Electric-
Salaries and wages - lines, equipment and street lights $1,670,206 $1,548,868
- customer installations 193,229 194,727
Supplies and expenses 1,431,519 1,543,526
Steam Distribution 119,711 122,536
Telecommunications distribution 976,211 1,039,946
Total Distribution $4,390,876 $4,449,603
Customer Accounts:
Electric-
Salaries and wages - meter reading $116,302 $114,962
- accounting and collection 259,377 268,844
Supplies and expenses 24,217 27,129
Uncollectible accounts 275,642 541,264
Steam customer accounts 7,962 114,816
Telecommunications customer accounts 2,690 1,781
Total Customer Accounts $686,190 $1,068,796
General and Administrative:
Electric-
Salaries $ 1,203,739 $ 1,090,516
Pensions and benefits 2,469,657 2,321,156
Insurance 425,282 432,001
General supplies and expenses 1,637,346 1,531,980
Steam general and administrative 455,903 575,170
Telecommunications general and administrative 431,021 397,638
Total General and Administrative $6,622,948 $6,348,461
ELECTRIC, STEAM AND TELECOMMUNICATIONS DIVISIONS
2010 2009
Schedule of Operating Revenues and Expenses — December 31, 2010 and 2009