Embed Size (px)
Citation preview

2010 HCS Signalized Intersection Results Summary
General Information Intersection Information
Agency Qk4 Duration, h 0.25
Analyst JJL Analysis Date Aug 27, 2012 Area Type Other
Jurisdiction KYTC Time Period AM Peak Hour Build
PHF 0.94
Intersection KY 18 & Mall Rd Analysis Year 2012 Analysis Period 1> 7:00
File Name 1 AM KY 18 & Mall Rd.xus
Project Description Mall Rd Interchange AM
Demand Information EB WB NB SB
Approach Movement L T R L T R L T R L T R
Demand (v), veh/h 10 1920 120 150 1140 10 100 70 60 20 40 10
Signal Information
GreenYellowRed
8.0 0.7 69.0 7.1 8.1 0.03.5 0.0 4.8 4.0 4.0 0.03.0 0.0 1.9 3.0 3.0 0.0
1 2 3 4
5 6 7
Cycle, s 120.0 Reference Phase 2
Offset, s 0 Reference Point End
Uncoordinated No Simult. Gap E/W Off
Force Mode Fixed Simult. Gap N/S Off
Timer Results EBL EBT WBL WBT NBL NBT SBL SBT
Assigned Phase 5 2 1 6 8 8 4 4
Case Number 2.0 3.0 2.0 3.0 9.0 9.0 12.0 12.0
Phase Duration, s 14.5 89.8 15.2 90.4 15.1 15.1 14.1 14.1
Change Period, (Y+Rc), s 6.5 6.7 6.5 6.7 7.0 7.0 7.0 7.0
Max Allow Headway (MAH), s 4.0 0.0 4.0 0.0 4.1 4.1 4.0 4.0
Queue Clearance Time (gs), s 2.7 8.1 7.3 7.3 7.0 7.0
Green Extension Time (ge), s 0.0 0.0 0.6 0.0 0.8 0.8 0.0 0.0
Phase Call Probability 1.00 1.00 1.00 1.00 1.00 1.00
Max Out Probability 0.00 0.00 0.00 0.00 1.00 1.00
Movement Group Results EB WB NB SB
Approach Movement L T R L T R L T R L T R
Assigned Movement 5 2 12 1 6 16 3 8 18 7 4 14
Adjusted Flow Rate (v), veh/h 11 2043 128 160 1213 11 106 74 64 74 0 0
Adjusted Saturation Flow Rate (s), veh/h/ln 1723 1810 1412 1541 1643 1533 1541 1810 1412 1740 0 0
Queue Service time (gs ), s 0.7 21.2 5.1 6.1 9.9 0.4 4.0 4.8 5.3 5.0 0.0 0.0
Cycle Queue Clearance Time (gc), s 0.7 21.2 5.1 6.1 9.9 0.4 4.0 4.8 5.3 5.0 0.0 0.0
Capacity (c), veh/h 115 3120 812 223 2860 890 207 122 95 103
Volume-to-Capacity Ratio (X) 0.093 0.655 0.157 0.717 0.424 0.012 0.513 0.612 0.672 0.724 0.000 0.000
Available Capacity (ca), veh/h 400 3120 812 972 2860 890 665 391 305 159
Back of Queue (Q), veh/ln 0.3 5.3 1.6 2.4 2.7 0.1 1.6 2.3 2.1 2.4
Overflow Queue (Q3), veh/ln 0.0 0.0 0.0 0.0 0.0 0.0 0.0 0.0 0.0 0.0 0.0 0.0
Queue Storage Ratio (RQ) 0.0 0.0 0.0 0.0 0.0 0.0 0.0 0.0 0.0 0.0 0.0 0.0
Uniform Delay (d1), s/veh 52.6 8.4 11.9 54.5 6.8 10.6 54.1 54.4 54.7 55.5
Incremental Delay (d2), s/veh 0.3 1.1 0.4 4.3 0.5 0.0 2.0 4.9 8.0 9.2 0.0 0.0
Initial Queue Delay (d3), s/veh 0.0 0.0 0.0 0.0 0.0 0.0 0.0 0.0 0.0 0.0 0.0 0.0
Control Delay (d), s/veh 52.9 9.5 12.3 58.7 7.3 10.7 56.0 59.3 62.6 64.7
Level of Service (LOS) D A B E A B E E E E
Approach Delay, s/veh / LOS 9.9 A 13.2 B 58.8 E 64.7 E
Intersection Delay s/veh / LOS 15.2 B
MultiModal Results EB WB NB SB
Pedestrian LOS Score / LOS 2.5 B 2.1 B 3.5 D 3.4 C
Bicycle LOS Score / LOS 1.7 A 1.2 A 0.9 A 0.6 A
Copyright © 2010 University of Florida, All Rights Reserved HCS 2010™ Version 6.1 Generated: 12/19/2012 2:41:49 PM

2010 HCS Signalized Intersection Results Summary
General Information Intersection Information
Agency Qk4 Duration, h 0.25
Analyst JJL Analysis Date Aug 27, 2012 Area Type Other
Jurisdiction KYTC Time Period PM Peak Hour Build
PHF 0.94
Intersection KY 18 & Mall Rd Analysis Year 2012 Analysis Period 1> 7:00
File Name 1 PM KY 18 & Mall Rd.xus
Project Description Mall Rd Interchange PM
Demand Information EB WB NB SB
Approach Movement L T R L T R L T R L T R
Demand (v), veh/h 40 1600 610 450 1700 150 500 80 250 150 110 30
Signal Information
GreenYellowRed
8.0 11.2 45.9 20.0 31.3 0.03.5 3.5 4.8 4.0 4.0 0.03.0 3.0 1.9 3.0 3.0 0.0
1 2 3 4
5 6 7
Cycle, s 150.0 Reference Phase 2
Offset, s 0 Reference Point End
Uncoordinated No Simult. Gap E/W Off
Force Mode Fixed Simult. Gap N/S Off
Timer Results EBL EBT WBL WBT NBL NBT SBL SBT
Assigned Phase 5 2 1 6 8 8 4 4
Case Number 2.0 3.0 2.0 3.0 9.0 9.0 12.0 12.0
Phase Duration, s 14.5 79.6 32.2 97.2 38.3 38.3 27.0 27.0
Change Period, (Y+Rc), s 6.5 6.7 6.5 6.7 7.0 7.0 7.0 7.0
Max Allow Headway (MAH), s 4.0 0.0 4.0 0.0 4.1 4.1 4.0 4.0
Queue Clearance Time (gs), s 5.6 25.3 30.1 30.1 22.0 22.0
Green Extension Time (ge), s 0.0 0.0 0.3 0.0 1.1 1.1 0.0 0.0
Phase Call Probability 1.00 1.00 1.00 1.00 1.00 1.00
Max Out Probability 0.00 1.00 1.00 1.00 1.00 1.00
Movement Group Results EB WB NB SB
Approach Movement L T R L T R L T R L T R
Assigned Movement 5 2 12 1 6 16 3 8 18 7 4 14
Adjusted Flow Rate (v), veh/h 43 1702 649 479 1809 160 532 85 266 309 0 0
Adjusted Saturation Flow Rate (s), veh/h/ln 1723 1810 1388 1515 1643 1533 1515 1810 1388 1732 0 0
Queue Service time (gs ), s 3.6 45.9 45.9 23.3 46.9 10.0 25.3 5.9 28.1 20.0 0.0 0.0
Cycle Queue Clearance Time (gc), s 3.6 45.9 45.9 23.3 46.9 10.0 25.3 5.9 28.1 20.0 0.0 0.0
Capacity (c), veh/h 92 1660 424 518 2087 649 632 377 289 231
Volume-to-Capacity Ratio (X) 0.463 1.025 1.529 0.924 0.866 0.246 0.842 0.226 0.919 1.336 0.000 0.000
Available Capacity (ca), veh/h 158 1660 424 540 2087 649 666 398 305 231
Back of Queue (Q), veh/ln 1.7 23.0 44.9 10.3 16.8 3.8 10.3 2.7 12.1 20.1
Overflow Queue (Q3), veh/ln 0.0 0.0 0.0 0.0 0.0 0.0 0.0 0.0 0.0 0.0 0.0 0.0
Queue Storage Ratio (RQ) 0.0 0.0 0.0 0.0 0.0 0.0 0.0 0.0 0.0 0.0 0.0 0.0
Uniform Delay (d1), s/veh 68.9 44.4 52.1 61.2 29.0 27.8 57.0 49.3 58.1 65.0
Incremental Delay (d2), s/veh 3.6 28.8 249.7 21.4 5.1 0.9 9.2 0.3 30.6 177.4 0.0 0.0
Initial Queue Delay (d3), s/veh 0.0 0.0 0.0 0.0 0.0 0.0 0.0 0.0 0.0 0.0 0.0 0.0
Control Delay (d), s/veh 72.5 73.2 301.7 82.6 34.2 28.7 66.2 49.6 88.7 242.4
Level of Service (LOS) E F F F C C E D F F
Approach Delay, s/veh / LOS 135.1 F 43.3 D 71.4 E 242.4 F
Intersection Delay s/veh / LOS 94.0 F
MultiModal Results EB WB NB SB
Pedestrian LOS Score / LOS 2.6 B 2.1 B 3.5 D 3.4 C
Bicycle LOS Score / LOS 1.8 A 1.8 A 1.9 A 1.0 A
Copyright © 2010 University of Florida, All Rights Reserved HCS 2010™ Version 6.1 Generated: 12/19/2012 2:42:16 PM

2010 HCS Signalized Intersection Results Summary
General Information Intersection Information
Agency Qk4 Duration, h 0.25
Analyst JJL Analysis Date Aug 27, 2012 Area Type Other
Jurisdiction KYTC Time Period AM Peak Hour Build
PHF 0.93
Intersection KY 18 & Interstate 75 SB R Analysis Year 2012 Analysis Period 1> 7:00
File Name 2 AM KY 18 & I 75 SB Ramps.xus
Project Description Mall Rd Interchange AM
Demand Information EB WB NB SB
Approach Movement L T R L T R L T R L T R
Demand (v), veh/h 1740 260 100 700 260 0 600
Signal Information
GreenYellowRed
10.5 65.7 24.5 0.0 0.0 0.03.5 4.8 4.4 0.0 0.0 0.03.0 1.7 1.9 0.0 0.0 0.0
1 2 3 4
5 6 7 8
Cycle, s 120.0 Reference Phase 2
Offset, s 0 Reference Point End
Uncoordinated No Simult. Gap E/W Off
Force Mode Fixed Simult. Gap N/S Off
Timer Results EBL EBT WBL WBT NBL NBT SBL SBT
Assigned Phase 5 2 1 6 0 4 4
Case Number 0.0 3.0 2.0 4.0 0.0 9.0 9.0
Phase Duration, s 0.0 103.0 17.0 120.0 0.0 30.8 30.8
Change Period, (Y+Rc), s 6.5 6.5 6.5 6.5 0.0 6.3 6.3
Max Allow Headway (MAH), s 0.0 0.0 4.0 0.0 0.0 4.2 4.2
Queue Clearance Time (gs), s 10.3 26.5 26.5
Green Extension Time (ge), s 0.0 0.0 0.2 0.0 0.0 0.0 0.0
Phase Call Probability 1.00 1.00 1.00
Max Out Probability 0.00 1.00 1.00
Movement Group Results EB WB NB SB
Approach Movement L T R L T R L T R L T R
Assigned Movement 5 2 12 1 6 16 3 8 18 7 4 14
Adjusted Flow Rate (v), veh/h 0 1871 280 108 753 0 0 280 0 645
Adjusted Saturation Flow Rate (s), veh/h/ln 0 1643 1365 1533 1723 0 0 1616 1900 1438
Queue Service time (gs ), s 0.0 24.9 14.0 8.3 3.0 0.0 0.0 20.0 0.0 24.5
Cycle Queue Clearance Time (gc), s 0.0 24.9 14.0 8.3 3.0 0.0 0.0 20.0 0.0 24.5
Capacity (c), veh/h 2700 747 134 2374 330 388 294
Volume-to-Capacity Ratio (X) 0.000 0.693 0.374 0.804 0.317 0.000 0.000 0.848 0.000 2.198
Available Capacity (ca), veh/h 2700 747 294 2374 330 388 294
Back of Queue (Q), veh/ln 5.9 4.3 3.5 0.8 9.4 0.0 53.3
Overflow Queue (Q3), veh/ln 0.0 0.0 0.0 0.0 0.0 0.0 0.0 0.0
Queue Storage Ratio (RQ) 0.0 0.0 0.0 0.0 0.0 0.0 0.0 0.0 0.0 0.0
Uniform Delay (d1), s/veh 10.7 15.4 53.8 1.6 46.0 0.0 47.8
Incremental Delay (d2), s/veh 0.0 1.5 1.4 10.6 0.4 0.0 0.0 18.2 0.0 550.1
Initial Queue Delay (d3), s/veh 0.0 0.0 0.0 0.0 0.0 0.0 0.0 0.0
Control Delay (d), s/veh 12.2 16.9 64.4 2.0 64.2 0.0 597.9
Level of Service (LOS) B B E A E F
Approach Delay, s/veh / LOS 12.8 B 9.8 A 0.0 436.5 F
Intersection Delay s/veh / LOS 111.7 F
MultiModal Results EB WB NB SB
Pedestrian LOS Score / LOS 1.9 A 1.9 A 3.2 C 3.0 C
Bicycle LOS Score / LOS 1.7 A 1.2 A 2.0 B
Copyright © 2010 University of Florida, All Rights Reserved HCS 2010™ Version 6.1 Generated: 12/19/2012 2:42:36 PM

2010 HCS Signalized Intersection Results Summary
General Information Intersection Information
Agency Qk4 Duration, h 0.25
Analyst JJL Analysis Date Aug 27, 2012 Area Type Other
Jurisdiction KYTC Time Period PM Peak Hour Build
PHF 0.97
Intersection KY 18 & Interstate 75 SB R Analysis Year 2012 Analysis Period 1> 7:00
File Name 2 PM KY 18 & I 75 SB Ramps.xus
Project Description Mall Rd Interchange PM
Demand Information EB WB NB SB
Approach Movement L T R L T R L T R L T R
Demand (v), veh/h 1600 400 100 1250 300 0 1050
Signal Information
GreenYellowRed
11.4 80.8 38.5 0.0 0.0 0.03.5 4.8 4.4 0.0 0.0 0.03.0 1.7 1.9 0.0 0.0 0.0
1 2 3 4
5 6 7 8
Cycle, s 150.0 Reference Phase 2
Offset, s 0 Reference Point End
Uncoordinated No Simult. Gap E/W Off
Force Mode Fixed Simult. Gap N/S Off
Timer Results EBL EBT WBL WBT NBL NBT SBL SBT
Assigned Phase 5 2 1 6 0 4 4
Case Number 0.0 3.0 2.0 4.0 0.0 9.0 9.0
Phase Duration, s 0.0 132.1 17.9 150.0 0.0 44.8 44.8
Change Period, (Y+Rc), s 6.5 6.5 6.5 6.5 0.0 6.3 6.3
Max Allow Headway (MAH), s 0.0 0.0 4.0 0.0 0.0 4.2 4.2
Queue Clearance Time (gs), s 11.2 40.5 40.5
Green Extension Time (ge), s 0.0 0.0 0.2 0.0 0.0 0.0 0.0
Phase Call Probability 1.00 1.00 1.00
Max Out Probability 0.00 1.00 1.00
Movement Group Results EB WB NB SB
Approach Movement L T R L T R L T R L T R
Assigned Movement 5 2 12 1 6 16 3 8 18 7 4 14
Adjusted Flow Rate (v), veh/h 0 1649 412 103 1289 0 0 309 0 1082
Adjusted Saturation Flow Rate (s), veh/h/ln 0 1643 1477 1660 1723 0 0 1587 1900 1412
Queue Service time (gs ), s 0.0 25.5 26.8 9.2 13.7 0.0 0.0 27.0 0.0 38.5
Cycle Queue Clearance Time (gc), s 0.0 25.5 26.8 9.2 13.7 0.0 0.0 27.0 0.0 38.5
Capacity (c), veh/h 2657 796 126 2267 407 488 363
Volume-to-Capacity Ratio (X) 0.000 0.621 0.518 0.820 0.568 0.000 0.000 0.759 0.000 2.986
Available Capacity (ca), veh/h 2657 796 243 2267 407 488 363
Back of Queue (Q), veh/ln 7.2 9.5 4.3 3.2 11.4 0.0 104.1
Overflow Queue (Q3), veh/ln 0.0 0.0 0.0 0.0 0.0 0.0 0.0 0.0
Queue Storage Ratio (RQ) 0.0 0.0 0.0 0.0 0.0 0.0 0.0 0.0 0.0 0.0
Uniform Delay (d1), s/veh 13.3 22.1 68.3 4.0 51.5 0.0 55.8
Incremental Delay (d2), s/veh 0.0 1.1 2.4 12.2 1.0 0.0 0.0 8.1 0.0 901.1
Initial Queue Delay (d3), s/veh 0.0 0.0 0.0 0.0 0.0 0.0 0.0 0.0
Control Delay (d), s/veh 14.4 24.5 80.6 5.0 59.5 0.0 956.8
Level of Service (LOS) B C F A E F
Approach Delay, s/veh / LOS 16.4 B 10.6 B 0.0 757.4 F
Intersection Delay s/veh / LOS 227.6 F
MultiModal Results EB WB NB SB
Pedestrian LOS Score / LOS 1.9 A 1.9 A 3.2 C 3.0 C
Bicycle LOS Score / LOS 1.6 A 1.6 A 2.8 C
Copyright © 2010 University of Florida, All Rights Reserved HCS 2010™ Version 6.1 Generated: 12/19/2012 2:43:05 PM

2010 HCS Signalized Intersection Results Summary
General Information Intersection Information
Agency Qk4 Duration, h 0.25
Analyst JJL Analysis Date Jan 2, 2013 Area Type Other
Jurisdiction KYTC Time Period AM Design Hour PHF 0.96
Intersection KY 18 & I75 NB Ramps Analysis Year 2012 Build Analysis Period 1> 7:00
File Name 3 AM KY 18 & I 75 NB Ramps.xus
Project Description Mall Road Interchange
Demand Information EB WB NB SB
Approach Movement L T R L T R L T R L T R
Demand (v), veh/h 1200 800 400 200 400 0 200
Signal Information
GreenYellowRed
42.0 22.1 35.4 0.0 0.0 0.03.5 4.8 4.4 0.0 0.0 0.03.0 1.6 3.0 0.0 0.0 0.0
1 2 3 4
5 6 7
Cycle, s 119.8 Reference Phase 2
Offset, s 0 Reference Point End
Uncoordinated Yes Simult. Gap E/W Off
Force Mode Fixed Simult. Gap N/S Off
Timer Results EBL EBT WBL WBT NBL NBT SBL SBT
Assigned Phase 5 2 1 6 8 8 7
Case Number 2.0 4.0 0.0 3.0 10.0 10.0 0.0
Phase Duration, s 48.5 77.0 0.0 28.5 42.8 42.8 0.0
Change Period, (Y+Rc), s 6.5 6.4 5.0 6.4 7.4 7.4 5.0
Max Allow Headway (MAH), s 6.1 6.0 0.0 6.1 6.2 6.2 0.0
Queue Clearance Time (gs), s 44.0 17.7 17.9 37.4 37.4
Green Extension Time (ge), s 0.0 8.1 0.0 4.3 0.0 0.0 0.0
Phase Call Probability 1.00 1.00 1.00 1.00 1.00
Max Out Probability 1.00 0.13 0.33 1.00 1.00
Movement Group Results EB WB NB SB
Approach Movement L T R L T R L T R L T R
Assigned Movement 5 2 12 1 6 16 3 8 18 7 4 14
Adjusted Flow Rate (v), veh/h 1250 833 0 0 417 208 417 0 208 0
Adjusted Saturation Flow Rate (s), veh/h/ln 1627 1723 0 0 1723 1491 1573 0 1610 0
Queue Service time (gs ), s 42.0 15.7 0.0 0.0 13.4 15.9 30.4 35.4 12.5 0.0
Cycle Queue Clearance Time (gc), s 42.0 15.7 0.0 0.0 13.4 15.9 30.4 35.4 12.5 0.0
Capacity (c), veh/h 1140 2031 636 275 465 0 476
Volume-to-Capacity Ratio (X) 1.096 0.410 0.000 0.000 0.655 0.757 0.896 0.000 0.438 0.000
Available Capacity (ca), veh/h 1140 2031 891 386 465 0
Back of Queue (Q), veh/ln 25.3 6.0 5.9 6.5 14.2 5.0
Overflow Queue (Q3), veh/ln 0.0 0.0 0.0 0.0 0.0 0.0 0.0 0.0
Queue Storage Ratio (RQ) 0.0 0.0 0.0 0.0 0.0 0.0 0.0 0.0 0.0 0.0
Uniform Delay (d1), s/veh 38.9 13.3 45.3 46.3 40.5 34.2
Incremental Delay (d2), s/veh 56.9 0.6 0.0 0.0 2.4 9.5 20.6 0.0 1.4 0.0
Initial Queue Delay (d3), s/veh 0.0 0.0 0.0 0.0 0.0 0.0 0.0 0.0
Control Delay (d), s/veh 95.8 13.9 47.8 55.8 61.1 35.5
Level of Service (LOS) F B D E E D
Approach Delay, s/veh / LOS 63.1 E 50.4 D 52.6 D 0.0
Intersection Delay s/veh / LOS 58.7 E
MultiModal Results EB WB NB SB
Pedestrian LOS Score / LOS 1.7 A 1.9 A 2.9 C 3.0 C
Bicycle LOS Score / LOS 2.2 B 1.0 A 1.5 A
Copyright © 2010 University of Florida, All Rights Reserved HCS 2010™ Version 6.1 Generated: 1/3/2013 9:25:45 AM
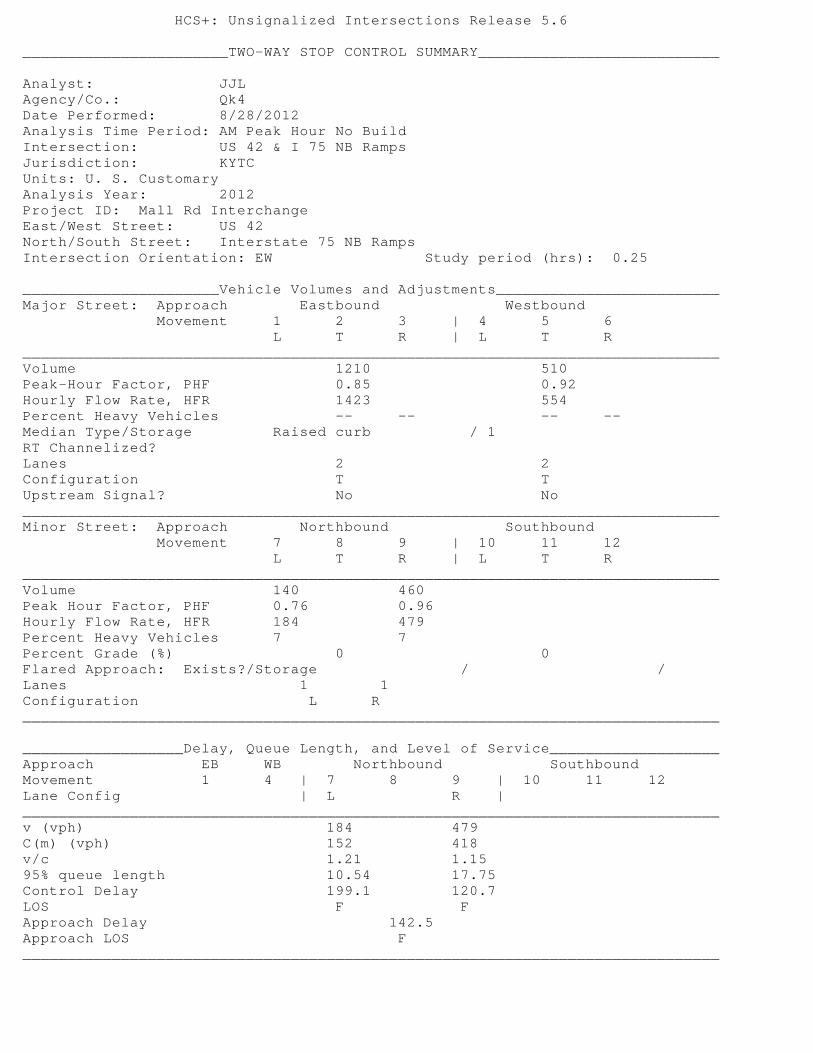
2010 HCS Signalized Intersection Results Summary
General Information Intersection Information
Agency Qk4 Duration, h 0.25
Analyst JJL Analysis Date Jan 2, 2013 Area Type Other
Jurisdiction KYTC Time Period PM Design Hour PHF 0.96
Intersection KY 18 & I75 NB Ramps Analysis Year 2012 Build Analysis Period 1> 7:00
File Name 3 PM KY 18 & I 75 NB Ramps.xus
Project Description Mall Road Interchange
Demand Information EB WB NB SB
Approach Movement L T R L T R L T R L T R
Demand (v), veh/h 900 1000 900 300 450 0 100
Signal Information
GreenYellowRed
31.5 50.8 47.4 0.0 0.0 0.03.5 4.8 4.4 0.0 0.0 0.03.0 1.6 3.0 0.0 0.0 0.0
1 2 3 4
5 6 7
Cycle, s 150.0 Reference Phase 2
Offset, s 0 Reference Point End
Uncoordinated Yes Simult. Gap E/W Off
Force Mode Fixed Simult. Gap N/S Off
Timer Results EBL EBT WBL WBT NBL NBT SBL SBT
Assigned Phase 5 2 1 6 8 8 7
Case Number 2.0 4.0 0.0 3.0 10.0 10.0 0.0
Phase Duration, s 38.0 95.2 0.0 57.2 54.8 54.8 0.0
Change Period, (Y+Rc), s 6.5 6.4 5.0 6.4 7.4 7.4 5.0
Max Allow Headway (MAH), s 6.1 6.0 0.0 6.1 6.2 6.2 0.0
Queue Clearance Time (gs), s 33.5 28.5 39.1 49.4 49.4
Green Extension Time (ge), s 0.0 2.1 0.0 11.7 0.0 0.0 0.0
Phase Call Probability 1.00 1.00 1.00 1.00 1.00
Max Out Probability 1.00 1.00 0.43 1.00 1.00
Movement Group Results EB WB NB SB
Approach Movement L T R L T R L T R L T R
Assigned Movement 5 2 12 1 6 16 3 8 18 7 4 14
Adjusted Flow Rate (v), veh/h 938 1042 0 0 938 313 469 0 104 0
Adjusted Saturation Flow Rate (s), veh/h/ln 1627 1723 0 0 1723 1491 1573 0 1610 0
Queue Service time (gs ), s 31.5 26.5 0.0 0.0 37.1 26.3 43.5 47.4 7.1 0.0
Cycle Queue Clearance Time (gc), s 31.5 26.5 0.0 0.0 37.1 26.3 43.5 47.4 7.1 0.0
Capacity (c), veh/h 683 2040 1167 505 497 0 509
Volume-to-Capacity Ratio (X) 1.372 0.511 0.000 0.000 0.803 0.619 0.943 0.000 0.205 0.000
Available Capacity (ca), veh/h 683 2040 1401 606 497 0
Back of Queue (Q), veh/ln 29.7 10.6 16.4 10.0 20.7 2.9
Overflow Queue (Q3), veh/ln 0.0 0.0 0.0 0.0 0.0 0.0 0.0 0.0
Queue Storage Ratio (RQ) 0.0 0.0 0.0 0.0 0.0 0.0 0.0 0.0 0.0 0.0
Uniform Delay (d1), s/veh 59.3 17.9 45.1 41.5 50.0 37.5
Incremental Delay (d2), s/veh 176.6 0.9 0.0 0.0 3.9 2.7 27.2 0.0 0.4 0.0
Initial Queue Delay (d3), s/veh 0.0 0.0 0.0 0.0 0.0 0.0 0.0 0.0
Control Delay (d), s/veh 235.9 18.8 49.0 44.2 77.2 37.9
Level of Service (LOS) F B D D E D
Approach Delay, s/veh / LOS 121.6 F 47.8 D 70.1 E 0.0
Intersection Delay s/veh / LOS 89.6 F
MultiModal Results EB WB NB SB
Pedestrian LOS Score / LOS 1.7 A 1.9 A 2.9 C 3.0 C
Bicycle LOS Score / LOS 2.1 B 1.5 A 1.4 A
Copyright © 2010 University of Florida, All Rights Reserved HCS 2010™ Version 6.1 Generated: 1/3/2013 9:24:10 AM

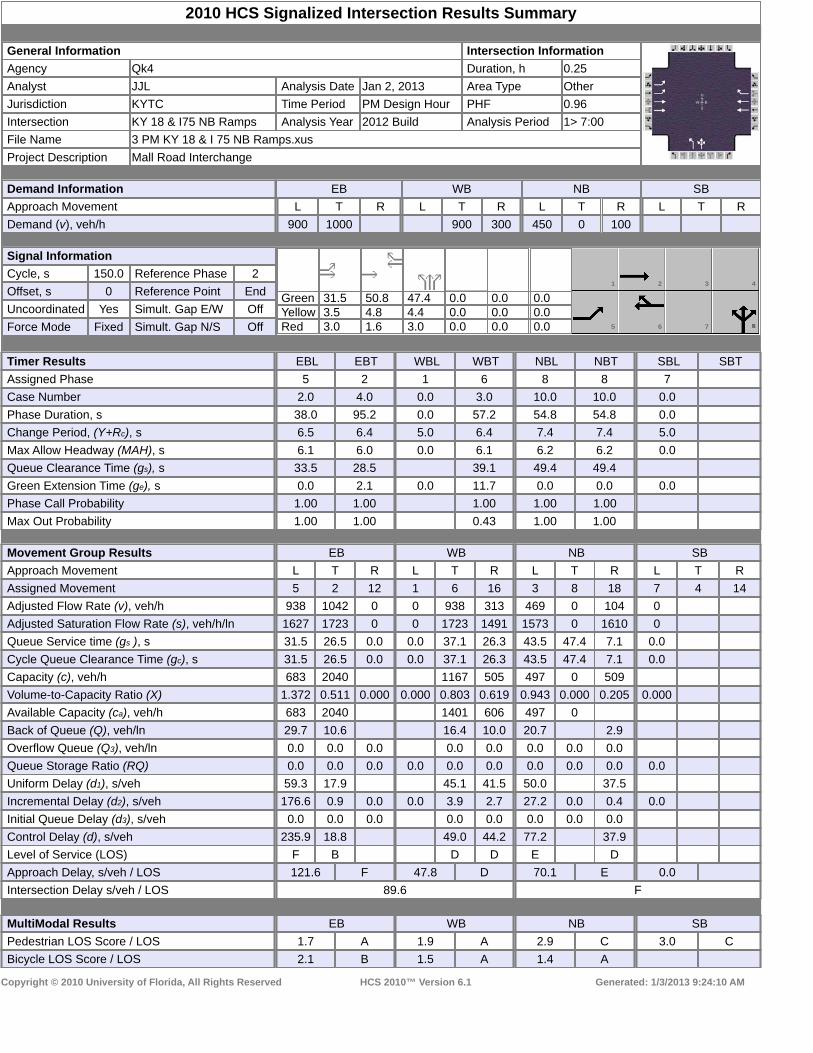
HCS+: Unsignalized Intersections Release 5.6 _______________________TWO-WAY STOP CONTROL SUMMARY___________________________ Analyst: JJL Agency/Co.: Qk4 Date Performed: 8/28/2012 Analysis Time Period: AM Peak Hour Build Intersection: US 42 & I 75 NB Ramps Jurisdiction: KYTC Units: U. S. Customary Analysis Year: 2012 Project ID: Mall Rd Interchange East/West Street: US 42 North/South Street: Interstate 75 NB Ramps Intersection Orientation: EW Study period (hrs): 0.25 ______________________Vehicle Volumes and Adjustments_________________________ Major Street: Approach Eastbound Westbound Movement 1 2 3 | 4 5 6 L T R | L T R ______________________________________________________________________________ Volume 1200 500 Peak-Hour Factor, PHF 0.85 0.92 Hourly Flow Rate, HFR 1411 543 Percent Heavy Vehicles -- -- -- -- Median Type/Storage Raised curb / 1 RT Channelized? Lanes 2 2 Configuration T T Upstream Signal? No No ______________________________________________________________________________ Minor Street: Approach Northbound Southbound Movement 7 8 9 | 10 11 12 L T R | L T R ______________________________________________________________________________ Volume 150 300 Peak Hour Factor, PHF 0.76 0.96 Hourly Flow Rate, HFR 197 312 Percent Heavy Vehicles 7 7 Percent Grade (%) 0 0 Flared Approach: Exists?/Storage / / Lanes 1 1 Configuration L R ______________________________________________________________________________ __________________Delay, Queue Length, and Level of Service___________________ Approach EB WB Northbound Southbound Movement 1 4 | 7 8 9 | 10 11 12 Lane Config | L R | ______________________________________________________________________________ v (vph) 197 312 C(m) (vph) 154 421 v/c 1.28 0.74 95% queue length 11.69 5.97 Control Delay 223.1 34.3 LOS F D Approach Delay 107.4 Approach LOS F ______________________________________________________________________________

HCS+: Unsignalized Intersections Release 5.6 _______________________TWO-WAY STOP CONTROL SUMMARY___________________________ Analyst: JJL Agency/Co.: Qk4 Date Performed: 8/28/2012 Analysis Time Period: PM Peak Hour Build Intersection: US 42 & I 75 NB Ramps Jurisdiction: KYTC Units: U. S. Customary Analysis Year: 2012 Project ID: Mall Rd Interchange East/West Street: US 42 North/South Street: Interstate 75 NB Ramps Intersection Orientation: EW Study period (hrs): 0.25 ______________________Vehicle Volumes and Adjustments_________________________ Major Street: Approach Eastbound Westbound Movement 1 2 3 | 4 5 6 L T R | L T R ______________________________________________________________________________ Volume 950 1120 Peak-Hour Factor, PHF 0.94 0.83 Hourly Flow Rate, HFR 1010 1349 Percent Heavy Vehicles -- -- -- -- Median Type/Storage Raised curb / 1 RT Channelized? Lanes 2 2 Configuration T T Upstream Signal? No No ______________________________________________________________________________ Minor Street: Approach Northbound Southbound Movement 7 8 9 | 10 11 12 L T R | L T R ______________________________________________________________________________ Volume 180 220 Peak Hour Factor, PHF 0.83 0.89 Hourly Flow Rate, HFR 216 247 Percent Heavy Vehicles 5 5 Percent Grade (%) 0 0 Flared Approach: Exists?/Storage / / Lanes 1 1 Configuration L R ______________________________________________________________________________ __________________Delay, Queue Length, and Level of Service___________________ Approach EB WB Northbound Southbound Movement 1 4 | 7 8 9 | 10 11 12 Lane Config | L R | ______________________________________________________________________________ v (vph) 216 247 C(m) (vph) 203 557 v/c 1.06 0.44 95% queue length 9.85 2.26 Control Delay 130.4 16.5 LOS F C Approach Delay 69.6 Approach LOS F ______________________________________________________________________________

2010 HCS Signalized Intersection Results Summary
General Information Intersection Information
Agency Qk4 Duration, h 0.25
Analyst JJL Analysis Date Aug 27, 2012 Area Type Other
Jurisdiction KYTC Time Period AM Peak Hour Build
PHF 0.90
Intersection US 42 & Interstate 75 SB R Analysis Year 2012 Analysis Period 1> 7:00
File Name 5 AM US 42 & I75 SB Ramps.xus
Project Description Mall Rd Interchange AM
Demand Information EB WB NB SB
Approach Movement L T R L T R L T R L T R
Demand (v), veh/h 1400 100 150 500 650 300
Signal Information
GreenYellowRed
17.9 82.4 42.0 0.0 0.0 0.03.5 4.1 3.5 0.0 0.0 0.03.0 1.6 2.0 0.0 0.0 0.0
1 2 3 4
5 6 7 8
Cycle, s 160.0 Reference Phase 2
Offset, s 0 Reference Point End
Uncoordinated No Simult. Gap E/W Off
Force Mode Fixed Simult. Gap N/S Off
Timer Results EBL EBT WBL WBT NBL NBT SBL SBT
Assigned Phase 5 2 1 6 0 4 4
Case Number 0.0 3.0 2.0 4.0 0.0 9.0 9.0
Phase Duration, s 0.0 135.6 24.4 160.0 0.0 47.5 47.5
Change Period, (Y+Rc), s 5.0 5.7 6.5 5.7 0.0 5.5 5.5
Max Allow Headway (MAH), s 0.0 0.0 4.6 0.0 0.0 4.6 4.6
Queue Clearance Time (gs), s 17.9 44.0 44.0
Green Extension Time (ge), s 0.0 0.0 0.1 0.0 0.0 0.0 0.0
Phase Call Probability 1.00 1.00 1.00
Max Out Probability 1.00 1.00 1.00
Movement Group Results EB WB NB SB
Approach Movement L T R L T R L T R L T R
Assigned Movement 5 2 12 1 6 16 3 8 18 7 4 14
Adjusted Flow Rate (v), veh/h 0 1556 111 167 556 0 0 722 0 333
Adjusted Saturation Flow Rate (s), veh/h/ln 0 1630 1477 1660 1630 0 0 1597 0 1464
Queue Service time (gs ), s 0.0 65.9 6.3 15.9 3.9 0.0 0.0 34.5 42.0 34.8
Cycle Queue Clearance Time (gc), s 0.0 65.9 6.3 15.9 3.9 0.0 0.0 34.5 42.0 34.8
Capacity (c), veh/h 1677 760 186 2175 839 0 384
Volume-to-Capacity Ratio (X) 0.000 0.927 0.146 0.895 0.255 0.000 0.000 0.861 0.000 0.868
Available Capacity (ca), veh/h 1677 760 202 2175 839 0 384
Back of Queue (Q), veh/ln 22.7 2.3 8.5 1.2 14.8 14.7
Overflow Queue (Q3), veh/ln 0.0 0.0 0.0 0.0 0.0 0.0 0.0 0.0
Queue Storage Ratio (RQ) 0.0 0.0 0.0 0.0 0.0 0.0 0.0 0.0 0.0 0.0
Uniform Delay (d1), s/veh 22.5 20.4 70.1 3.1 56.2 0.0 56.3
Incremental Delay (d2), s/veh 0.0 10.4 0.4 35.0 0.3 0.0 0.0 9.2 0.0 18.8
Initial Queue Delay (d3), s/veh 0.0 0.0 0.0 0.0 0.0 0.0 0.0 0.0
Control Delay (d), s/veh 32.9 20.8 105.1 3.4 65.4 0.0 75.1
Level of Service (LOS) C C F A E E
Approach Delay, s/veh / LOS 32.1 C 26.9 C 0.0 68.5 E
Intersection Delay s/veh / LOS 42.2 D
MultiModal Results EB WB NB SB
Pedestrian LOS Score / LOS 0.7 A 1.9 A 2.9 C 2.9 C
Bicycle LOS Score / LOS 1.9 A 1.1 A F
Copyright © 2010 University of Florida, All Rights Reserved HCS 2010™ Version 6.1 Generated: 12/19/2012 2:43:25 PM

2010 HCS Signalized Intersection Results Summary
General Information Intersection Information
Agency Qk4 Duration, h 0.25
Analyst JJL Analysis Date Aug 27, 2012 Area Type Other
Jurisdiction KYTC Time Period PM Peak Hour Build
PHF 0.97
Intersection US 42 & Interstate 75 SB R Analysis Year 2012 Analysis Period 1> 7:00
File Name 5 PM US 42 & I75 SB Ramps.xus
Project Description Mall Rd Interchange PM
Demand Information EB WB NB SB
Approach Movement L T R L T R L T R L T R
Demand (v), veh/h 1100 300 350 950 400 750
Signal Information
GreenYellowRed
14.5 82.8 45.0 0.0 0.0 0.03.5 4.1 3.5 0.0 0.0 0.03.0 1.6 2.0 0.0 0.0 0.0
1 2 3 4
5 6 7 8
Cycle, s 160.0 Reference Phase 2
Offset, s 0 Reference Point End
Uncoordinated No Simult. Gap E/W Off
Force Mode Fixed Simult. Gap N/S Off
Timer Results EBL EBT WBL WBT NBL NBT SBL SBT
Assigned Phase 5 2 1 6 0 4 4
Case Number 0.0 3.0 2.0 4.0 0.0 9.0 9.0
Phase Duration, s 0.0 139.0 21.0 160.0 0.0 50.5 50.5
Change Period, (Y+Rc), s 5.0 5.7 6.5 5.7 0.0 5.5 5.5
Max Allow Headway (MAH), s 0.0 0.0 4.6 0.0 0.0 4.7 4.7
Queue Clearance Time (gs), s 16.5 47.0 47.0
Green Extension Time (ge), s 0.0 0.0 0.0 0.0 0.0 0.0 0.0
Phase Call Probability 1.00 1.00 1.00
Max Out Probability 1.00 1.00 1.00
Movement Group Results EB WB NB SB
Approach Movement L T R L T R L T R L T R
Assigned Movement 5 2 12 1 6 16 3 8 18 7 4 14
Adjusted Flow Rate (v), veh/h 0 1134 309 361 979 0 0 412 0 773
Adjusted Saturation Flow Rate (s), veh/h/ln 0 1630 1563 1757 1630 0 0 1689 0 1548
Queue Service time (gs ), s 0.0 32.2 19.0 14.5 10.8 0.0 0.0 16.0 45.0 45.0
Cycle Queue Clearance Time (gc), s 0.0 32.2 19.0 14.5 10.8 0.0 0.0 16.0 45.0 45.0
Capacity (c), veh/h 1687 809 159 2114 950 0 435
Volume-to-Capacity Ratio (X) 0.000 0.672 0.382 2.266 0.463 0.000 0.000 0.434 0.000 1.776
Available Capacity (ca), veh/h 1687 809 159 2114 950 0 435
Back of Queue (Q), veh/ln 10.4 7.3 32.6 2.8 6.8 60.7
Overflow Queue (Q3), veh/ln 0.0 0.0 0.0 0.0 0.0 0.0 0.0 0.0
Queue Storage Ratio (RQ) 0.0 0.0 0.0 0.0 0.0 0.0 0.0 0.0 0.0 0.0
Uniform Delay (d1), s/veh 17.0 23.2 72.8 4.5 47.1 0.0 57.5
Incremental Delay (d2), s/veh 0.0 2.2 1.4 589.4 0.7 0.0 0.0 0.4 0.0 358.3
Initial Queue Delay (d3), s/veh 0.0 0.0 0.0 0.0 0.0 0.0 0.0 0.0
Control Delay (d), s/veh 19.1 24.6 662.2 5.3 47.5 0.0 415.8
Level of Service (LOS) B C F A D F
Approach Delay, s/veh / LOS 20.3 C 182.1 F 0.0 287.7 F
Intersection Delay s/veh / LOS 154.8 F
MultiModal Results EB WB NB SB
Pedestrian LOS Score / LOS 0.7 A 1.9 A 2.9 C 2.9 C
Bicycle LOS Score / LOS 1.7 A 1.6 A F
Copyright © 2010 University of Florida, All Rights Reserved HCS 2010™ Version 6.1 Generated: 12/19/2012 2:44:14 PM

2010 HCS Signalized Intersection Results Summary
General Information Intersection Information
Agency Qk4 Duration, h 0.25
Analyst JJL Analysis Date Aug 27, 2012 Area Type Other
Jurisdiction KYTC Time Period AM Peak Hour Build
PHF 0.84
Intersection US 42 & Mall Rd Analysis Year 2012 Analysis Period 1> 7:00
File Name 6 AM US 42 & Mall Rd.xus
Project Description Mall Rd Interchange AM
Demand Information EB WB NB SB
Approach Movement L T R L T R L T R L T R
Demand (v), veh/h 280 1320 10 10 590 200 20 20 30 150 10 110
Signal Information
GreenYellowRed
5.0 25.0 67.3 20.8 9.8 0.03.5 3.5 4.2 3.5 3.5 0.03.0 3.0 2.0 3.0 3.0 0.0
1 2 3 4
5 6 7
Cycle, s 160.0 Reference Phase 2
Offset, s 0 Reference Point End
Uncoordinated No Simult. Gap E/W Off
Force Mode Fixed Simult. Gap N/S Off
Timer Results EBL EBT WBL WBT NBL NBT SBL SBT
Assigned Phase 5 2 1 6 8 8 4 4
Case Number 2.0 4.0 2.0 3.0 12.0 12.0 9.0 9.0
Phase Duration, s 43.0 132.2 11.5 100.8 16.3 16.3 27.3 27.3
Change Period, (Y+Rc), s 6.5 6.2 6.5 6.2 6.5 6.5 6.5 6.5
Max Allow Headway (MAH), s 4.6 0.0 4.6 0.0 4.6 4.6 4.7 4.7
Queue Clearance Time (gs), s 34.8 3.0 9.6 9.6 19.7 19.7
Green Extension Time (ge), s 1.6 0.0 0.0 0.0 0.2 0.2 1.1 1.1
Phase Call Probability 1.00 1.00 1.00 1.00 1.00 1.00
Max Out Probability 0.00 0.00 0.00 0.00 0.04 0.04
Movement Group Results EB WB NB SB
Approach Movement L T R L T R L T R L T R
Assigned Movement 5 2 12 1 6 16 3 8 18 7 4 14
Adjusted Flow Rate (v), veh/h 333 792 791 12 702 238 83 0 0 179 12 131
Adjusted Saturation Flow Rate (s), veh/h/ln 1587 1712 1707 1810 1712 1412 1741 0 0 1587 1900 1412
Queue Service time (gs ), s 32.8 34.2 34.7 1.0 19.8 18.8 7.6 0.0 0.0 17.7 0.9 14.2
Cycle Queue Clearance Time (gc), s 32.8 34.2 34.7 1.0 19.8 18.8 7.6 0.0 0.0 17.7 0.9 14.2
Capacity (c), veh/h 362 1057 1054 57 1440 594 106 206 246 183
Volume-to-Capacity Ratio (X) 0.922 0.750 0.751 0.211 0.488 0.401 0.783 0.000 0.000 0.867 0.048 0.715
Available Capacity (ca), veh/h 778 1057 1054 299 1440 594 280 313 374 278
Back of Queue (Q), veh/ln 14.2 8.5 8.8 0.5 7.5 6.8 3.8 8.0 0.4 5.4
Overflow Queue (Q3), veh/ln 0.0 0.0 0.0 0.0 0.0 0.0 0.0 0.0 0.0 0.0 0.0 0.0
Queue Storage Ratio (RQ) 0.0 0.0 0.0 0.0 0.0 0.0 0.0 0.0 0.0 0.0 0.0 0.0
Uniform Delay (d1), s/veh 60.4 8.5 8.6 75.6 24.7 32.3 74.1 68.3 61.0 66.8
Incremental Delay (d2), s/veh 11.5 4.9 4.9 2.2 1.2 2.0 13.9 0.0 0.0 16.4 0.1 6.1
Initial Queue Delay (d3), s/veh 0.0 0.0 0.0 0.0 0.0 0.0 0.0 0.0 0.0 0.0 0.0 0.0
Control Delay (d), s/veh 71.9 13.3 13.6 77.8 25.9 34.3 88.0 84.7 61.1 72.9
Level of Service (LOS) E B B E C C F F E E
Approach Delay, s/veh / LOS 23.6 C 28.6 C 88.0 F 79.0 E
Intersection Delay s/veh / LOS 32.2 C
MultiModal Results EB WB NB SB
Pedestrian LOS Score / LOS 2.1 B 2.4 B 3.0 C 2.9 C
Bicycle LOS Score / LOS 2.1 B 1.3 A 0.6 A 1.0 A
Copyright © 2010 University of Florida, All Rights Reserved HCS 2010™ Version 6.1 Generated: 12/19/2012 2:44:37 PM

2010 HCS Signalized Intersection Results Summary
General Information Intersection Information
Agency Qk4 Duration, h 0.25
Analyst JJL Analysis Date Aug 27, 2012 Area Type Other
Jurisdiction KYTC Time Period PM Peak Hour Build
PHF 0.98
Intersection US 42 & Mall Rd Analysis Year 2012 Analysis Period 1> 7:00
File Name 6 PM US 42 & Mall Rd.xus
Project Description Mall Rd Interchange PM
Demand Information EB WB NB SB
Approach Movement L T R L T R L T R L T R
Demand (v), veh/h 340 940 20 20 1330 350 20 40 20 440 30 650
Signal Information
GreenYellowRed
5.0 24.7 57.3 31.5 9.3 0.03.5 3.5 4.2 3.5 3.5 0.03.0 3.0 2.0 3.0 3.0 0.0
1 2 3 4
5 6 7
Cycle, s 160.0 Reference Phase 2
Offset, s 0 Reference Point End
Uncoordinated No Simult. Gap E/W Off
Force Mode Fixed Simult. Gap N/S Off
Timer Results EBL EBT WBL WBT NBL NBT SBL SBT
Assigned Phase 5 2 1 6 8 8 4 4
Case Number 2.0 4.0 2.0 3.0 12.0 12.0 9.0 9.0
Phase Duration, s 42.7 132.7 11.5 101.5 15.8 15.8 38.0 38.0
Change Period, (Y+Rc), s 6.5 6.2 6.5 6.2 6.5 6.5 6.5 6.5
Max Allow Headway (MAH), s 4.6 0.0 4.6 0.0 4.6 4.6 4.7 4.7
Queue Clearance Time (gs), s 37.4 3.8 9.2 9.2 33.5 33.5
Green Extension Time (ge), s 0.0 0.0 0.0 0.0 0.1 0.1 0.0 0.0
Phase Call Probability 1.00 1.00 1.00 1.00 1.00 1.00
Max Out Probability 1.00 0.00 0.32 0.32 1.00 1.00
Movement Group Results EB WB NB SB
Approach Movement L T R L T R L T R L T R
Assigned Movement 5 2 12 1 6 16 3 8 18 7 4 14
Adjusted Flow Rate (v), veh/h 347 492 488 20 1357 357 82 0 0 449 31 663
Adjusted Saturation Flow Rate (s), veh/h/ln 1560 1712 1699 1810 1712 1388 1797 0 0 1560 1900 1388
Queue Service time (gs ), s 35.4 19.5 20.0 1.8 57.3 35.6 7.2 0.0 0.0 31.5 2.1 31.5
Cycle Queue Clearance Time (gc), s 35.4 19.5 20.0 1.8 57.3 35.6 7.2 0.0 0.0 31.5 2.1 31.5
Capacity (c), veh/h 353 947 940 57 1226 497 104 307 374 273
Volume-to-Capacity Ratio (X) 0.982 0.519 0.519 0.361 1.107 0.718 0.784 0.000 0.000 1.462 0.082 2.427
Available Capacity (ca), veh/h 353 947 940 353 1226 497 168 307 374 273
Back of Queue (Q), veh/ln 18.1 6.3 6.5 0.9 32.3 13.3 3.7 31.6 1.0 60.6
Overflow Queue (Q3), veh/ln 0.0 0.0 0.0 0.0 0.0 0.0 0.0 0.0 0.0 0.0 0.0 0.0
Queue Storage Ratio (RQ) 0.0 0.0 0.0 0.0 0.0 0.0 0.0 0.0 0.0 0.0 0.0 0.0
Uniform Delay (d1), s/veh 61.6 11.9 12.3 75.9 41.8 44.4 74.4 64.3 52.4 64.3
Incremental Delay (d2), s/veh 43.1 2.0 2.0 4.6 60.2 8.6 14.2 0.0 0.0 225.0 0.1 653.2
Initial Queue Delay (d3), s/veh 0.0 0.0 0.0 0.0 0.0 0.0 0.0 0.0 0.0 0.0 0.0 0.0
Control Delay (d), s/veh 104.6 14.0 14.4 80.5 102.0 53.0 88.6 289.3 52.6 717.4
Level of Service (LOS) F B B F F D F F D F
Approach Delay, s/veh / LOS 37.8 D 91.7 F 88.6 F 531.4 F
Intersection Delay s/veh / LOS 192.2 F
MultiModal Results EB WB NB SB
Pedestrian LOS Score / LOS 2.1 B 2.5 B 3.0 C 2.9 C
Bicycle LOS Score / LOS 1.6 A 1.9 A 0.6 A 2.4 B
Copyright © 2010 University of Florida, All Rights Reserved HCS 2010™ Version 6.1 Generated: 12/19/2012 2:45:06 PM

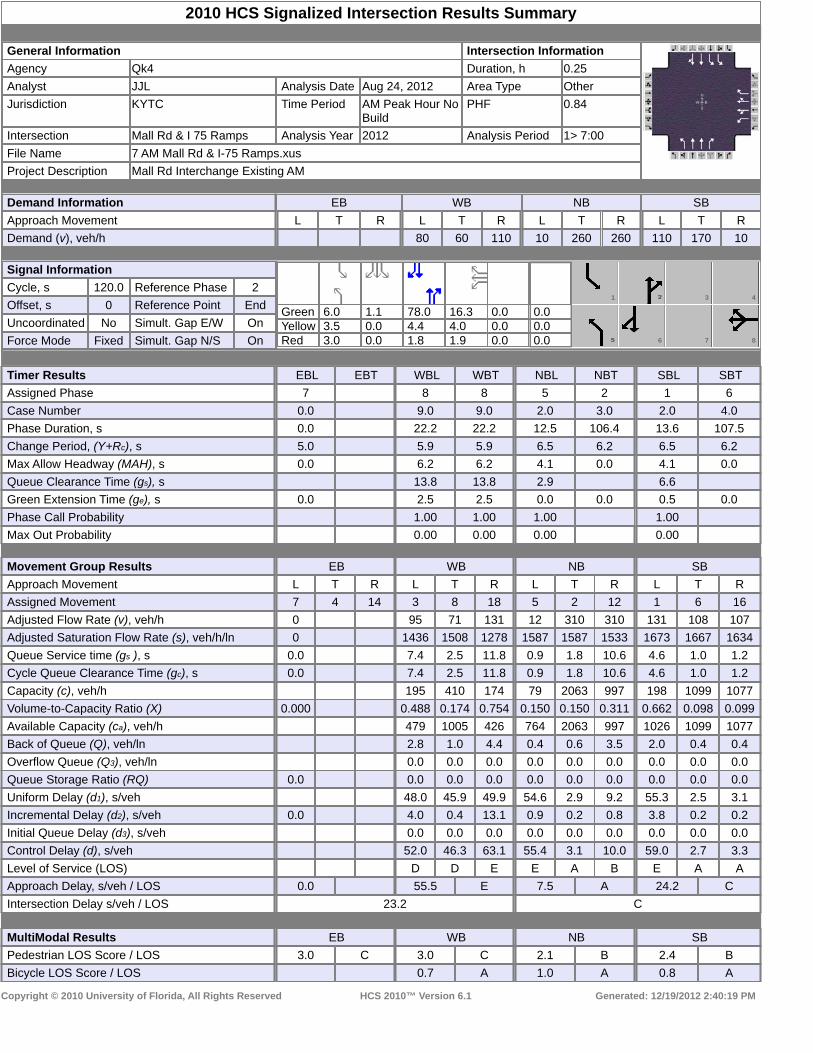
2010 HCS Signalized Intersection Results Summary
General Information Intersection Information
Agency Qk4 Duration, h 0.25
Analyst JJL Analysis Date Aug 24, 2012 Area Type Other
Jurisdiction KYTC Time Period AM Peak Hour Build
PHF 0.84
Intersection Mall Rd & I 75 Ramps Analysis Year 2012 Analysis Period 1> 7:00
File Name 7 AM Mall Rd & I-75 Ramps.xus
Project Description Mall Rd Interchange Existing AM
Demand Information EB WB NB SB
Approach Movement L T R L T R L T R L T R
Demand (v), veh/h 90 60 100 10 250 350 150 150 10
Signal Information
GreenYellowRed
6.0 3.0 77.2 15.2 0.0 0.03.5 0.0 4.4 4.0 0.0 0.03.0 0.0 1.8 1.9 0.0 0.0
1 3 4
6 7 8
Cycle, s 120.0 Reference Phase 2
Offset, s 0 Reference Point End
Uncoordinated No Simult. Gap E/W On
Force Mode Fixed Simult. Gap N/S On
Timer Results EBL EBT WBL WBT NBL NBT SBL SBT
Assigned Phase 7 8 8 5 2 1 6
Case Number 0.0 9.0 9.0 2.0 3.0 2.0 4.0
Phase Duration, s 0.0 21.1 21.1 12.5 104.5 15.5 107.5
Change Period, (Y+Rc), s 5.0 5.9 5.9 6.5 6.2 6.5 6.2
Max Allow Headway (MAH), s 0.0 6.2 6.2 4.1 0.0 4.1 0.0
Queue Clearance Time (gs), s 12.8 12.8 2.9 8.3
Green Extension Time (ge), s 0.0 2.5 2.5 0.0 0.0 0.7 0.0
Phase Call Probability 1.00 1.00 1.00 1.00
Max Out Probability 0.00 0.00 0.00 0.00
Movement Group Results EB WB NB SB
Approach Movement L T R L T R L T R L T R
Assigned Movement 7 4 14 3 8 18 5 2 12 1 6 16
Adjusted Flow Rate (v), veh/h 0 107 71 119 12 298 417 179 96 95
Adjusted Saturation Flow Rate (s), veh/h/ln 0 1436 1508 1278 1587 1587 1533 1673 1667 1630
Queue Service time (gs ), s 0.0 8.4 2.5 10.8 0.9 1.8 16.0 6.3 0.8 1.0
Cycle Queue Clearance Time (gc), s 0.0 8.4 2.5 10.8 0.9 1.8 16.0 6.3 0.8 1.0
Capacity (c), veh/h 182 383 162 79 2041 986 250 1113 1089
Volume-to-Capacity Ratio (X) 0.000 0.587 0.186 0.733 0.150 0.146 0.422 0.714 0.086 0.087
Available Capacity (ca), veh/h 479 1005 426 778 2041 986 1056 1113 1089
Back of Queue (Q), veh/ln 3.3 1.0 4.0 0.4 0.6 5.4 2.7 0.3 0.4
Overflow Queue (Q3), veh/ln 0.0 0.0 0.0 0.0 0.0 0.0 0.0 0.0 0.0
Queue Storage Ratio (RQ) 0.0 0.0 0.0 0.0 0.0 0.0 0.0 0.0 0.0 0.0
Uniform Delay (d1), s/veh 49.4 46.8 50.4 54.6 3.2 10.5 54.3 2.2 2.8
Incremental Delay (d2), s/veh 0.0 6.3 0.5 12.7 0.9 0.2 1.3 3.8 0.2 0.2
Initial Queue Delay (d3), s/veh 0.0 0.0 0.0 0.0 0.0 0.0 0.0 0.0 0.0
Control Delay (d), s/veh 55.7 47.3 63.2 55.4 3.3 11.8 58.0 2.4 3.0
Level of Service (LOS) E D E E A B E A A
Approach Delay, s/veh / LOS 0.0 56.7 E 9.0 A 29.5 C
Intersection Delay s/veh / LOS 24.6 C
MultiModal Results EB WB NB SB
Pedestrian LOS Score / LOS 3.0 C 3.0 C 2.1 B 2.4 B
Bicycle LOS Score / LOS 0.7 A 1.1 A 0.8 A
Copyright © 2010 University of Florida, All Rights Reserved HCS 2010™ Version 6.1 Generated: 12/19/2012 2:45:25 PM

2010 HCS Signalized Intersection Results Summary
General Information Intersection Information
Agency Qk4 Duration, h 0.25
Analyst JJL Analysis Date Aug 24, 2012 Area Type Other
Jurisdiction KYTC Time Period PM Peak Hour Build
PHF 0.97
Intersection Mall Rd & I 75 Ramps Analysis Year 2012 Analysis Period 1> 7:00
File Name 7 PM Mall Rd & I-75 Ramps.xus
Project Description Mall Rd Interchange Existing PM
Demand Information EB WB NB SB
Approach Movement L T R L T R L T R L T R
Demand (v), veh/h 330 150 600 50 620 130 240 620 20
Signal Information
GreenYellowRed
7.0 6.1 83.3 35.0 0.0 0.03.5 0.0 4.4 4.0 0.0 0.03.0 0.0 1.8 1.9 0.0 0.0
1 3 4
6 7 8
Cycle, s 150.0 Reference Phase 2
Offset, s 0 Reference Point End
Uncoordinated No Simult. Gap E/W On
Force Mode Fixed Simult. Gap N/S On
Timer Results EBL EBT WBL WBT NBL NBT SBL SBT
Assigned Phase 7 8 8 5 2 1 6
Case Number 0.0 9.0 9.0 2.0 3.0 2.0 4.0
Phase Duration, s 0.0 40.9 40.9 13.5 130.4 19.6 136.5
Change Period, (Y+Rc), s 5.0 5.9 5.9 6.5 6.2 6.5 6.2
Max Allow Headway (MAH), s 0.0 6.3 6.3 4.1 0.0 4.1 0.0
Queue Clearance Time (gs), s 37.0 37.0 6.9 12.6
Green Extension Time (ge), s 0.0 0.0 0.0 0.1 0.0 0.5 0.0
Phase Call Probability 1.00 1.00 1.00 1.00
Max Out Probability 1.00 1.00 0.00 0.20
Movement Group Results EB WB NB SB
Approach Movement L T R L T R L T R L T R
Assigned Movement 7 4 14 3 8 18 5 2 12 1 6 16
Adjusted Flow Rate (v), veh/h 0 340 155 619 52 639 134 247 332 328
Adjusted Saturation Flow Rate (s), veh/h/ln 0 1331 1397 1184 1560 1559 1579 1723 1638 1620
Queue Service time (gs ), s 0.0 35.0 6.7 35.0 4.9 11.0 6.2 10.6 8.5 9.0
Cycle Queue Clearance Time (gc), s 0.0 35.0 6.7 35.0 4.9 11.0 6.2 10.6 8.5 9.0
Capacity (c), veh/h 310 652 276 73 1732 877 301 976 965
Volume-to-Capacity Ratio (X) 0.000 1.096 0.237 2.239 0.706 0.369 0.153 0.822 0.340 0.340
Available Capacity (ca), veh/h 310 652 276 407 1732 877 439 976 965
Back of Queue (Q), veh/ln 18.5 2.4 54.1 2.2 3.4 2.3 5.0 2.8 3.0
Overflow Queue (Q3), veh/ln 0.0 0.0 0.0 0.0 0.0 0.0 0.0 0.0 0.0
Queue Storage Ratio (RQ) 0.0 0.0 0.0 0.0 0.0 0.0 0.0 0.0 0.0 0.0
Uniform Delay (d1), s/veh 57.5 46.7 57.5 70.5 10.1 16.2 67.3 7.1 7.6
Incremental Delay (d2), s/veh 0.0 79.2 0.4 569.1 11.7 0.6 0.4 8.0 0.9 1.0
Initial Queue Delay (d3), s/veh 0.0 0.0 0.0 0.0 0.0 0.0 0.0 0.0 0.0
Control Delay (d), s/veh 136.7 47.1 626.6 82.2 10.7 16.6 75.3 8.1 8.6
Level of Service (LOS) F D F F B B E A A
Approach Delay, s/veh / LOS 0.0 396.4 F 16.1 B 26.6 C
Intersection Delay s/veh / LOS 168.3 F
MultiModal Results EB WB NB SB
Pedestrian LOS Score / LOS 3.0 C 3.0 C 2.1 B 2.4 B
Bicycle LOS Score / LOS 1.4 A 1.2 A 1.2 A
Copyright © 2010 University of Florida, All Rights Reserved HCS 2010™ Version 6.1 Generated: 12/19/2012 2:45:54 PM

2010 HCS Signalized Intersection Results Summary
General Information Intersection Information
Agency Qk4 Duration, h 0.25
Analyst JJL Analysis Date Aug 27, 2012 Area Type Other
Jurisdiction KYTC Time Period AM Peak Hour No Build
PHF 0.94
Intersection KY 18 & Mall Rd Analysis Year 2012 Analysis Period 1> 7:00
File Name 1 AM KY 18 & Mall Rd.xus
Project Description Mall Rd Interchange AM
Demand Information EB WB NB SB
Approach Movement L T R L T R L T R L T R
Demand (v), veh/h 10 1880 130 150 1190 10 80 70 50 20 60 10
Signal Information
GreenYellowRed
8.0 0.7 68.2 8.5 7.5 0.03.5 0.0 4.8 4.0 4.0 0.03.0 0.0 1.9 3.0 3.0 0.0
1 2 3 4
5 6 7
Cycle, s 120.0 Reference Phase 2
Offset, s 0 Reference Point End
Uncoordinated No Simult. Gap E/W Off
Force Mode Fixed Simult. Gap N/S Off
Timer Results EBL EBT WBL WBT NBL NBT SBL SBT
Assigned Phase 5 2 1 6 8 8 4 4
Case Number 2.0 3.0 2.0 3.0 9.0 9.0 12.0 12.0
Phase Duration, s 14.5 90.4 15.2 91.0 14.5 14.5 15.5 15.5
Change Period, (Y+Rc), s 6.5 6.7 6.5 6.7 7.0 7.0 7.0 7.0
Max Allow Headway (MAH), s 4.0 0.0 4.0 0.0 4.0 4.0 4.0 4.0
Queue Clearance Time (gs), s 2.7 8.1 6.8 6.8 8.4 8.4
Green Extension Time (ge), s 0.0 0.0 0.6 0.0 0.6 0.6 0.0 0.0
Phase Call Probability 1.00 1.00 1.00 1.00 1.00 1.00
Max Out Probability 0.00 0.00 0.00 0.00 1.00 1.00
Movement Group Results EB WB NB SB
Approach Movement L T R L T R L T R L T R
Assigned Movement 5 2 12 1 6 16 3 8 18 7 4 14
Adjusted Flow Rate (v), veh/h 11 2000 138 160 1266 11 85 74 53 96 0 0
Adjusted Saturation Flow Rate (s), veh/h/ln 1723 1810 1412 1541 1643 1533 1541 1810 1412 1755 0 0
Queue Service time (gs ), s 0.7 21.1 5.6 6.1 11.0 0.4 3.2 4.8 4.4 6.4 0.0 0.0
Cycle Queue Clearance Time (gc), s 0.7 21.1 5.6 6.1 11.0 0.4 3.2 4.8 4.4 6.4 0.0 0.0
Capacity (c), veh/h 115 3085 803 223 2828 880 192 113 88 124
Volume-to-Capacity Ratio (X) 0.093 0.648 0.172 0.717 0.448 0.012 0.444 0.661 0.605 0.772 0.000 0.000
Available Capacity (ca), veh/h 388 3085 803 952 2828 880 630 370 289 161
Back of Queue (Q), veh/ln 0.3 5.4 1.8 2.4 3.0 0.1 1.3 2.4 1.7 3.3
Overflow Queue (Q3), veh/ln 0.0 0.0 0.0 0.0 0.0 0.0 0.0 0.0 0.0 0.0 0.0 0.0
Queue Storage Ratio (RQ) 0.0 0.0 0.0 0.0 0.0 0.0 0.0 0.0 0.0 0.0 0.0 0.0
Uniform Delay (d1), s/veh 52.6 8.8 12.4 54.5 7.3 11.0 54.3 55.0 54.8 54.8
Incremental Delay (d2), s/veh 0.3 1.1 0.5 4.3 0.5 0.0 1.6 6.5 6.5 15.6 0.0 0.0
Initial Queue Delay (d3), s/veh 0.0 0.0 0.0 0.0 0.0 0.0 0.0 0.0 0.0 0.0 0.0 0.0
Control Delay (d), s/veh 52.9 9.9 12.9 58.8 7.8 11.0 55.9 61.5 61.4 70.4
Level of Service (LOS) D A B E A B E E E E
Approach Delay, s/veh / LOS 10.3 B 13.5 B 59.2 E 70.4 E
Intersection Delay s/veh / LOS 15.6 B
MultiModal Results EB WB NB SB
Pedestrian LOS Score / LOS 2.5 B 2.1 B 3.5 D 3.4 C
Bicycle LOS Score / LOS 1.7 A 1.3 A 0.8 A 0.6 A
Copyright © 2010 University of Florida, All Rights Reserved HCS 2010™ Version 6.1 Generated: 12/19/2012 2:35:39 PM

2010 HCS Signalized Intersection Results Summary
General Information Intersection Information
Agency Qk4 Duration, h 0.25
Analyst JJL Analysis Date Aug 27, 2012 Area Type Other
Jurisdiction KYTC Time Period PM Peak Hour No Build
PHF 0.94
Intersection KY 18 & Mall Rd Analysis Year 2012 Analysis Period 1> 7:00
File Name 1 PM KY 18 & Mall Rd.xus
Project Description Mall Rd Interchange PM
Demand Information EB WB NB SB
Approach Movement L T R L T R L T R L T R
Demand (v), veh/h 50 1900 600 550 1850 200 500 100 300 100 100 30
Signal Information
GreenYellowRed
8.0 10.5 44.8 20.0 33.0 0.03.5 3.5 4.8 4.0 4.0 0.03.0 3.0 1.9 3.0 3.0 0.0
1 2 3 4
5 6 7
Cycle, s 150.0 Reference Phase 2
Offset, s 0 Reference Point End
Uncoordinated No Simult. Gap E/W Off
Force Mode Fixed Simult. Gap N/S Off
Timer Results EBL EBT WBL WBT NBL NBT SBL SBT
Assigned Phase 5 2 1 6 8 8 4 4
Case Number 2.0 3.0 2.0 3.0 9.0 9.0 12.0 12.0
Phase Duration, s 14.5 78.5 31.5 95.5 40.0 40.0 27.0 27.0
Change Period, (Y+Rc), s 6.5 6.7 6.5 6.7 7.0 7.0 7.0 7.0
Max Allow Headway (MAH), s 4.0 0.0 4.0 0.0 4.1 4.1 4.0 4.0
Queue Clearance Time (gs), s 6.5 27.0 35.0 35.0 22.0 22.0
Green Extension Time (ge), s 0.0 0.0 0.0 0.0 0.0 0.0 0.0 0.0
Phase Call Probability 1.00 1.00 1.00 1.00 1.00 1.00
Max Out Probability 0.16 1.00 1.00 1.00 1.00 1.00
Movement Group Results EB WB NB SB
Approach Movement L T R L T R L T R L T R
Assigned Movement 5 2 12 1 6 16 3 8 18 7 4 14
Adjusted Flow Rate (v), veh/h 53 2021 638 585 1968 213 532 106 319 245 0 0
Adjusted Saturation Flow Rate (s), veh/h/ln 1723 1810 1388 1515 1643 1533 1515 1810 1388 1731 0 0
Queue Service time (gs ), s 4.5 44.8 44.8 25.0 57.7 14.2 24.9 7.3 33.0 20.0 0.0 0.0
Cycle Queue Clearance Time (gc), s 4.5 44.8 44.8 25.0 57.7 14.2 24.9 7.3 33.0 20.0 0.0 0.0
Capacity (c), veh/h 92 1621 415 505 2031 632 666 398 305 231
Volume-to-Capacity Ratio (X) 0.579 1.247 1.540 1.159 0.969 0.337 0.798 0.267 1.045 1.060 0.000 0.000
Available Capacity (ca), veh/h 138 1621 415 505 2031 632 666 398 305 231
Back of Queue (Q), veh/ln 2.1 35.7 44.5 15.9 22.3 5.4 10.0 3.3 16.7 13.5
Overflow Queue (Q3), veh/ln 0.0 0.0 0.0 0.0 0.0 0.0 0.0 0.0 0.0 0.0 0.0 0.0
Queue Storage Ratio (RQ) 0.0 0.0 0.0 0.0 0.0 0.0 0.0 0.0 0.0 0.0 0.0 0.0
Uniform Delay (d1), s/veh 69.4 45.1 52.6 62.5 32.9 30.1 55.3 48.5 58.5 65.0
Incremental Delay (d2), s/veh 5.6 116.4 254.7 91.7 13.9 1.4 6.8 0.4 63.8 76.0 0.0 0.0
Initial Queue Delay (d3), s/veh 0.0 0.0 0.0 0.0 0.0 0.0 0.0 0.0 0.0 0.0 0.0 0.0
Control Delay (d), s/veh 75.0 161.5 307.3 154.2 46.8 31.5 62.1 48.8 122.3 141.0
Level of Service (LOS) E F F F D C E D F F
Approach Delay, s/veh / LOS 194.1 F 68.3 E 80.7 F 141.0 F
Intersection Delay s/veh / LOS 123.8 F
MultiModal Results EB WB NB SB
Pedestrian LOS Score / LOS 2.6 B 2.1 B 3.5 D 3.4 C
Bicycle LOS Score / LOS 2.0 A 2.0 B 2.1 B 0.9 A
Copyright © 2010 University of Florida, All Rights Reserved HCS 2010™ Version 6.1 Generated: 12/19/2012 2:36:56 PM

2010 HCS Signalized Intersection Results Summary
General Information Intersection Information
Agency Qk4 Duration, h 0.25
Analyst JJL Analysis Date Aug 27, 2012 Area Type Other
Jurisdiction KYTC Time Period AM Peak Hour No Build
PHF 0.93
Intersection KY 18 & Interstate 75 SB R Analysis Year 2012 Analysis Period 1> 7:00
File Name 2 AM KY 18 & I 75 SB Ramps.xus
Project Description Mall Rd Interchange AM
Demand Information EB WB NB SB
Approach Movement L T R L T R L T R L T R
Demand (v), veh/h 1730 220 90 720 260 0 630
Signal Information
GreenYellowRed
9.6 66.6 24.5 0.0 0.0 0.03.5 4.8 4.4 0.0 0.0 0.03.0 1.7 1.9 0.0 0.0 0.0
1 2 3 4
5 6 7 8
Cycle, s 120.0 Reference Phase 2
Offset, s 0 Reference Point End
Uncoordinated No Simult. Gap E/W Off
Force Mode Fixed Simult. Gap N/S Off
Timer Results EBL EBT WBL WBT NBL NBT SBL SBT
Assigned Phase 5 2 1 6 0 4 4
Case Number 0.0 3.0 2.0 4.0 0.0 9.0 9.0
Phase Duration, s 0.0 103.9 16.1 120.0 0.0 30.8 30.8
Change Period, (Y+Rc), s 6.5 6.5 6.5 6.5 0.0 6.3 6.3
Max Allow Headway (MAH), s 0.0 0.0 4.0 0.0 0.0 4.2 4.2
Queue Clearance Time (gs), s 9.4 26.5 26.5
Green Extension Time (ge), s 0.0 0.0 0.2 0.0 0.0 0.0 0.0
Phase Call Probability 1.00 1.00 1.00
Max Out Probability 0.00 1.00 1.00
Movement Group Results EB WB NB SB
Approach Movement L T R L T R L T R L T R
Assigned Movement 5 2 12 1 6 16 3 8 18 7 4 14
Adjusted Flow Rate (v), veh/h 0 1860 237 97 774 0 0 280 0 677
Adjusted Saturation Flow Rate (s), veh/h/ln 0 1643 1365 1533 1723 0 0 1616 1900 1438
Queue Service time (gs ), s 0.0 23.7 11.2 7.4 3.1 0.0 0.0 20.0 0.0 24.5
Cycle Queue Clearance Time (gc), s 0.0 23.7 11.2 7.4 3.1 0.0 0.0 20.0 0.0 24.5
Capacity (c), veh/h 2735 757 123 2374 330 388 294
Volume-to-Capacity Ratio (X) 0.000 0.680 0.312 0.787 0.326 0.000 0.000 0.848 0.000 2.308
Available Capacity (ca), veh/h 2735 757 294 2374 330 388 294
Back of Queue (Q), veh/ln 5.6 3.5 3.2 0.9 9.4 0.0 57.3
Overflow Queue (Q3), veh/ln 0.0 0.0 0.0 0.0 0.0 0.0 0.0 0.0
Queue Storage Ratio (RQ) 0.0 0.0 0.0 0.0 0.0 0.0 0.0 0.0 0.0 0.0
Uniform Delay (d1), s/veh 10.0 14.4 54.2 1.6 46.0 0.0 47.8
Incremental Delay (d2), s/veh 0.0 1.4 1.1 10.5 0.4 0.0 0.0 18.2 0.0 599.2
Initial Queue Delay (d3), s/veh 0.0 0.0 0.0 0.0 0.0 0.0 0.0 0.0
Control Delay (d), s/veh 11.4 15.5 64.7 2.0 64.2 0.0 646.9
Level of Service (LOS) B B E A E F
Approach Delay, s/veh / LOS 11.9 B 9.0 A 0.0 476.7 F
Intersection Delay s/veh / LOS 124.6 F
MultiModal Results EB WB NB SB
Pedestrian LOS Score / LOS 1.9 A 1.9 A 3.2 C 3.0 C
Bicycle LOS Score / LOS 1.6 A 1.2 A 2.1 B
Copyright © 2010 University of Florida, All Rights Reserved HCS 2010™ Version 6.1 Generated: 12/19/2012 2:37:24 PM

2010 HCS Signalized Intersection Results Summary
General Information Intersection Information
Agency Qk4 Duration, h 0.25
Analyst JJL Analysis Date Aug 27, 2012 Area Type Other
Jurisdiction KYTC Time Period PM Peak Hour No Build
PHF 0.97
Intersection KY 18 & Interstate 75 SB R Analysis Year 2012 Analysis Period 1> 7:00
File Name 2 PM KY 18 & I 75 SB Ramps.xus
Project Description Mall Rd Interchange PM
Demand Information EB WB NB SB
Approach Movement L T R L T R L T R L T R
Demand (v), veh/h 1900 400 300 1600 500 0 1000
Signal Information
GreenYellowRed
22.0 70.2 38.5 0.0 0.0 0.03.5 4.8 4.4 0.0 0.0 0.03.0 1.7 1.9 0.0 0.0 0.0
1 2 3 4
5 6 7 8
Cycle, s 150.0 Reference Phase 2
Offset, s 0 Reference Point End
Uncoordinated No Simult. Gap E/W Off
Force Mode Fixed Simult. Gap N/S Off
Timer Results EBL EBT WBL WBT NBL NBT SBL SBT
Assigned Phase 5 2 1 6 0 4 4
Case Number 0.0 3.0 2.0 4.0 0.0 9.0 9.0
Phase Duration, s 0.0 121.5 28.5 150.0 0.0 44.8 44.8
Change Period, (Y+Rc), s 6.5 6.5 6.5 6.5 0.0 6.3 6.3
Max Allow Headway (MAH), s 0.0 0.0 4.0 0.0 0.0 4.2 4.2
Queue Clearance Time (gs), s 24.0 40.5 40.5
Green Extension Time (ge), s 0.0 0.0 0.0 0.0 0.0 0.0 0.0
Phase Call Probability 1.00 1.00 1.00
Max Out Probability 1.00 1.00 1.00
Movement Group Results EB WB NB SB
Approach Movement L T R L T R L T R L T R
Assigned Movement 5 2 12 1 6 16 3 8 18 7 4 14
Adjusted Flow Rate (v), veh/h 0 1959 412 309 1649 0 0 515 0 1031
Adjusted Saturation Flow Rate (s), veh/h/ln 0 1643 1477 1660 1723 0 0 1587 1900 1412
Queue Service time (gs ), s 0.0 47.7 30.9 22.0 24.4 0.0 0.0 38.5 0.0 38.5
Cycle Queue Clearance Time (gc), s 0.0 47.7 30.9 22.0 24.4 0.0 0.0 38.5 0.0 38.5
Capacity (c), veh/h 2307 691 243 2267 407 488 363
Volume-to-Capacity Ratio (X) 0.000 0.849 0.596 1.270 0.728 0.000 0.000 1.265 0.000 2.844
Available Capacity (ca), veh/h 2307 691 243 2267 407 488 363
Back of Queue (Q), veh/ln 16.0 11.4 19.3 4.5 30.6 0.0 97.7
Overflow Queue (Q3), veh/ln 0.0 0.0 0.0 0.0 0.0 0.0 0.0 0.0
Queue Storage Ratio (RQ) 0.0 0.0 0.0 0.0 0.0 0.0 0.0 0.0 0.0 0.0
Uniform Delay (d1), s/veh 24.0 29.4 64.0 4.6 55.8 0.0 55.8
Incremental Delay (d2), s/veh 0.0 4.1 3.8 149.8 2.1 0.0 0.0 137.6 0.0 837.3
Initial Queue Delay (d3), s/veh 0.0 0.0 0.0 0.0 0.0 0.0 0.0 0.0
Control Delay (d), s/veh 28.1 33.2 213.8 6.7 193.4 0.0 893.0
Level of Service (LOS) C C F A F F
Approach Delay, s/veh / LOS 29.0 C 39.4 D 0.0 659.8 F
Intersection Delay s/veh / LOS 198.5 F
MultiModal Results EB WB NB SB
Pedestrian LOS Score / LOS 1.9 A 1.9 A 3.2 C 3.0 C
Bicycle LOS Score / LOS 1.8 A 2.1 B 3.0 C
Copyright © 2010 University of Florida, All Rights Reserved HCS 2010™ Version 6.1 Generated: 6/13/2013 3:19:11 PM

2010 HCS Signalized Intersection Results Summary
General Information Intersection Information
Agency Qk4 Duration, h 0.25
Analyst JJL Analysis Date Jan 2, 2013 Area Type Other
Jurisdiction KYTC Time Period AM Design Hour PHF 0.96
Intersection KY 18 & I75 NB Ramps Analysis Year 2012 No Build Analysis Period 1> 7:00
File Name 3 AM KY 18 & I 75 NB Ramps.xus
Project Description
Demand Information EB WB NB SB
Approach Movement L T R L T R L T R L T R
Demand (v), veh/h 1230 760 380 170 430 0 40
Signal Information
GreenYellowRed
44.5 19.8 35.4 0.0 0.0 0.03.5 4.8 4.4 0.0 0.0 0.03.0 1.6 3.0 0.0 0.0 0.0
1 2 3 4
5 6 7
Cycle, s 120.0 Reference Phase 2
Offset, s 0 Reference Point End
Uncoordinated Yes Simult. Gap E/W Off
Force Mode Fixed Simult. Gap N/S Off
Timer Results EBL EBT WBL WBT NBL NBT SBL SBT
Assigned Phase 5 2 1 6 8 8 7
Case Number 2.0 4.0 0.0 3.0 10.0 10.0 0.0
Phase Duration, s 51.0 77.1 0.0 26.2 42.8 42.8 0.0
Change Period, (Y+Rc), s 6.5 6.4 5.0 6.4 7.4 7.4 5.0
Max Allow Headway (MAH), s 6.1 6.0 0.0 6.1 6.1 6.1 0.0
Queue Clearance Time (gs), s 46.5 16.7 15.5 37.4 37.4
Green Extension Time (ge), s 0.0 8.1 0.0 4.2 0.0 0.0 0.0
Phase Call Probability 1.00 1.00 1.00 1.00 1.00
Max Out Probability 1.00 0.07 0.20 1.00 1.00
Movement Group Results EB WB NB SB
Approach Movement L T R L T R L T R L T R
Assigned Movement 5 2 12 1 6 16 3 8 18 7 4 14
Adjusted Flow Rate (v), veh/h 1281 792 0 0 396 177 448 0 42 0
Adjusted Saturation Flow Rate (s), veh/h/ln 1627 1723 0 0 1723 1491 1573 0 1610 0
Queue Service time (gs ), s 44.5 14.7 0.0 0.0 13.0 13.5 33.6 35.4 2.2 0.0
Cycle Queue Clearance Time (gc), s 44.5 14.7 0.0 0.0 13.0 13.5 33.6 35.4 2.2 0.0
Capacity (c), veh/h 1207 2032 567 245 464 0 475
Volume-to-Capacity Ratio (X) 1.061 0.390 0.000 0.000 0.698 0.721 0.965 0.000 0.088 0.000
Available Capacity (ca), veh/h 1207 2032 890 385 464 0
Back of Queue (Q), veh/ln 24.5 5.6 5.8 5.5 17.0 0.9
Overflow Queue (Q3), veh/ln 0.0 0.0 0.0 0.0 0.0 0.0 0.0 0.0
Queue Storage Ratio (RQ) 0.0 0.0 0.0 0.0 0.0 0.0 0.0 0.0 0.0 0.0
Uniform Delay (d1), s/veh 37.7 13.1 47.3 47.5 41.7 30.6
Incremental Delay (d2), s/veh 43.9 0.6 0.0 0.0 3.3 8.2 33.0 0.0 0.2 0.0
Initial Queue Delay (d3), s/veh 0.0 0.0 0.0 0.0 0.0 0.0 0.0 0.0
Control Delay (d), s/veh 81.6 13.7 50.6 55.7 74.7 30.8
Level of Service (LOS) F B D E E C
Approach Delay, s/veh / LOS 55.7 E 52.2 D 71.0 E 0.0
Intersection Delay s/veh / LOS 57.4 E
MultiModal Results EB WB NB SB
Pedestrian LOS Score / LOS 1.7 A 1.9 A 2.9 C 3.0 C
Bicycle LOS Score / LOS 2.2 B 1.0 A 1.3 A
Copyright © 2010 University of Florida, All Rights Reserved HCS 2010™ Version 6.1 Generated: 1/3/2013 9:24:40 AM

2010 HCS Signalized Intersection Results Summary
General Information Intersection Information
Agency Qk4 Duration, h 0.25
Analyst JJL Analysis Date Jan 2, 2013 Area Type Other
Jurisdiction KYTC Time Period PM Design Hour PHF 0.96
Intersection KY 18 & I75 NB Ramps Analysis Year 2012 No Build Analysis Period 1> 7:00
File Name 3 PM KY 18 & I 75 NB Ramps.xus
Project Description Mall Road Interchange
Demand Information EB WB NB SB
Approach Movement L T R L T R L T R L T R
Demand (v), veh/h 1150 1250 1250 400 650 0 50
Signal Information
GreenYellowRed
22.0 60.5 47.4 0.0 0.0 0.03.5 4.8 4.4 0.0 0.0 0.03.0 1.6 3.0 0.0 0.0 0.0
1 2 3 4
5 6 7
Cycle, s 150.2 Reference Phase 2
Offset, s 0 Reference Point End
Uncoordinated Yes Simult. Gap E/W Off
Force Mode Fixed Simult. Gap N/S Off
Timer Results EBL EBT WBL WBT NBL NBT SBL SBT
Assigned Phase 5 2 1 6 8 8 7
Case Number 2.0 4.0 0.0 3.0 10.0 10.0 0.0
Phase Duration, s 28.5 95.4 0.0 66.9 54.8 54.8 0.0
Change Period, (Y+Rc), s 6.5 6.4 5.0 6.4 7.4 7.4 5.0
Max Allow Headway (MAH), s 6.1 6.0 0.0 6.1 6.1 6.1 0.0
Queue Clearance Time (gs), s 24.0 39.2 56.5 49.4 49.4
Green Extension Time (ge), s 0.0 0.0 0.0 4.0 0.0 0.0 0.0
Phase Call Probability 1.00 1.00 1.00 1.00 1.00
Max Out Probability 1.00 1.00 1.00 1.00 1.00
Movement Group Results EB WB NB SB
Approach Movement L T R L T R L T R L T R
Assigned Movement 5 2 12 1 6 16 3 8 18 7 4 14
Adjusted Flow Rate (v), veh/h 1198 1302 0 0 1302 417 677 0 52 0
Adjusted Saturation Flow Rate (s), veh/h/ln 1627 1723 0 0 1723 1491 1573 0 1610 0
Queue Service time (gs ), s 22.0 37.2 0.0 0.0 54.5 34.8 47.4 47.4 3.4 0.0
Cycle Queue Clearance Time (gc), s 22.0 37.2 0.0 0.0 54.5 34.8 47.4 47.4 3.4 0.0
Capacity (c), veh/h 477 2041 1387 600 497 0 508
Volume-to-Capacity Ratio (X) 2.513 0.638 0.000 0.000 0.939 0.694 1.363 0.000 0.102 0.000
Available Capacity (ca), veh/h 477 2041 1400 606 497 0
Back of Queue (Q), veh/ln 54.6 15.0 25.2 13.3 42.8 1.4
Overflow Queue (Q3), veh/ln 0.0 0.0 0.0 0.0 0.0 0.0 0.0 0.0
Queue Storage Ratio (RQ) 0.0 0.0 0.0 0.0 0.0 0.0 0.0 0.0 0.0 0.0
Uniform Delay (d1), s/veh 64.1 20.1 43.1 37.2 51.4 36.3
Incremental Delay (d2), s/veh 687.0 1.5 0.0 0.0 12.6 4.4 176.1 0.0 0.2 0.0
Initial Queue Delay (d3), s/veh 0.0 0.0 0.0 0.0 0.0 0.0 0.0 0.0
Control Delay (d), s/veh 751.1 21.6 55.7 41.6 227.5 36.5
Level of Service (LOS) F C E D F D
Approach Delay, s/veh / LOS 371.2 F 52.2 D 213.8 F 0.0
Intersection Delay s/veh / LOS 237.2 F
MultiModal Results EB WB NB SB
Pedestrian LOS Score / LOS 1.7 A 1.9 A 2.9 C 3.0 C
Bicycle LOS Score / LOS 2.6 B 1.9 A 1.7 A
Copyright © 2010 University of Florida, All Rights Reserved HCS 2010™ Version 6.1 Generated: 1/3/2013 9:23:40 AM
HCS+: Unsignalized Intersections Release 5.6 _______________________TWO-WAY STOP CONTROL SUMMARY___________________________ Analyst: JJL Agency/Co.: Qk4 Date Performed: 8/28/2012 Analysis Time Period: AM Peak Hour No Build Intersection: US 42 & I 75 NB Ramps Jurisdiction: KYTC Units: U. S. Customary Analysis Year: 2012 Project ID: Mall Rd Interchange East/West Street: US 42 North/South Street: Interstate 75 NB Ramps Intersection Orientation: EW Study period (hrs): 0.25 ______________________Vehicle Volumes and Adjustments_________________________ Major Street: Approach Eastbound Westbound Movement 1 2 3 | 4 5 6 L T R | L T R ______________________________________________________________________________ Volume 1210 510 Peak-Hour Factor, PHF 0.85 0.92 Hourly Flow Rate, HFR 1423 554 Percent Heavy Vehicles -- -- -- -- Median Type/Storage Raised curb / 1 RT Channelized? Lanes 2 2 Configuration T T Upstream Signal? No No ______________________________________________________________________________ Minor Street: Approach Northbound Southbound Movement 7 8 9 | 10 11 12 L T R | L T R ______________________________________________________________________________ Volume 140 460 Peak Hour Factor, PHF 0.76 0.96 Hourly Flow Rate, HFR 184 479 Percent Heavy Vehicles 7 7 Percent Grade (%) 0 0 Flared Approach: Exists?/Storage / / Lanes 1 1 Configuration L R ______________________________________________________________________________ __________________Delay, Queue Length, and Level of Service___________________ Approach EB WB Northbound Southbound Movement 1 4 | 7 8 9 | 10 11 12 Lane Config | L R | ______________________________________________________________________________ v (vph) 184 479 C(m) (vph) 152 418 v/c 1.21 1.15 95% queue length 10.54 17.75 Control Delay 199.1 120.7 LOS F F Approach Delay 142.5 Approach LOS F ______________________________________________________________________________

HCS+: Unsignalized Intersections Release 5.6 _______________________TWO-WAY STOP CONTROL SUMMARY___________________________ Analyst: JJL Agency/Co.: Qk4 Date Performed: 8/28/2012 Analysis Time Period: PM Peak Hour No Build Intersection: US 42 & I 75 NB Ramps Jurisdiction: KYTC Units: U. S. Customary Analysis Year: 2012 Project ID: Mall Rd Interchange East/West Street: US 42 North/South Street: Interstate 75 NB Ramps Intersection Orientation: EW Study period (hrs): 0.25 ______________________Vehicle Volumes and Adjustments_________________________ Major Street: Approach Eastbound Westbound Movement 1 2 3 | 4 5 6 L T R | L T R ______________________________________________________________________________ Volume 950 1200 Peak-Hour Factor, PHF 0.94 0.83 Hourly Flow Rate, HFR 1010 1445 Percent Heavy Vehicles -- -- -- -- Median Type/Storage Raised curb / 1 RT Channelized? Lanes 2 2 Configuration T T Upstream Signal? No No ______________________________________________________________________________ Minor Street: Approach Northbound Southbound Movement 7 8 9 | 10 11 12 L T R | L T R ______________________________________________________________________________ Volume 150 400 Peak Hour Factor, PHF 0.83 0.89 Hourly Flow Rate, HFR 180 449 Percent Heavy Vehicles 5 5 Percent Grade (%) 0 0 Flared Approach: Exists?/Storage / / Lanes 1 1 Configuration L R ______________________________________________________________________________ __________________Delay, Queue Length, and Level of Service___________________ Approach EB WB Northbound Southbound Movement 1 4 | 7 8 9 | 10 11 12 Lane Config | L R | ______________________________________________________________________________ v (vph) 180 449 C(m) (vph) 198 557 v/c 0.91 0.81 95% queue length 7.17 7.88 Control Delay 91.4 33.0 LOS F D Approach Delay 49.7 Approach LOS E ______________________________________________________________________________

2010 HCS Signalized Intersection Results Summary
General Information Intersection Information
Agency Qk4 Duration, h 0.25
Analyst JJL Analysis Date Aug 27, 2012 Area Type Other
Jurisdiction KYTC Time Period AM Peak Hour No Build
PHF 0.90
Intersection US 42 & Interstate 75 SB R Analysis Year 2012 Analysis Period 1> 7:00
File Name 5 AM US 42 & I75 SB Ramps.xus
Project Description Mall Rd Interchange AM
Demand Information EB WB NB SB
Approach Movement L T R L T R L T R L T R
Demand (v), veh/h 1360 100 170 480 630 310
Signal Information
GreenYellowRed
19.5 80.8 42.0 0.0 0.0 0.03.5 4.1 3.5 0.0 0.0 0.03.0 1.6 2.0 0.0 0.0 0.0
1 2 3 4
5 6 7 8
Cycle, s 160.0 Reference Phase 2
Offset, s 0 Reference Point End
Uncoordinated No Simult. Gap E/W Off
Force Mode Fixed Simult. Gap N/S Off
Timer Results EBL EBT WBL WBT NBL NBT SBL SBT
Assigned Phase 5 2 1 6 0 4 4
Case Number 0.0 3.0 2.0 4.0 0.0 9.0 9.0
Phase Duration, s 0.0 134.0 26.0 160.0 0.0 47.5 47.5
Change Period, (Y+Rc), s 5.0 5.7 6.5 5.7 0.0 5.5 5.5
Max Allow Headway (MAH), s 0.0 0.0 4.6 0.0 0.0 4.6 4.6
Queue Clearance Time (gs), s 20.0 44.0 44.0
Green Extension Time (ge), s 0.0 0.0 0.0 0.0 0.0 0.0 0.0
Phase Call Probability 1.00 1.00 1.00
Max Out Probability 1.00 1.00 1.00
Movement Group Results EB WB NB SB
Approach Movement L T R L T R L T R L T R
Assigned Movement 5 2 12 1 6 16 3 8 18 7 4 14
Adjusted Flow Rate (v), veh/h 0 1511 111 189 533 0 0 700 0 344
Adjusted Saturation Flow Rate (s), veh/h/ln 0 1630 1477 1660 1630 0 0 1597 0 1464
Queue Service time (gs ), s 0.0 63.5 6.4 18.0 3.7 0.0 0.0 33.1 42.0 36.3
Cycle Queue Clearance Time (gc), s 0.0 63.5 6.4 18.0 3.7 0.0 0.0 33.1 42.0 36.3
Capacity (c), veh/h 1646 746 202 2175 839 0 384
Volume-to-Capacity Ratio (X) 0.000 0.918 0.149 0.934 0.245 0.000 0.000 0.835 0.000 0.896
Available Capacity (ca), veh/h 1646 746 202 2175 839 0 384
Back of Queue (Q), veh/ln 22.1 2.3 10.1 1.1 14.1 15.7
Overflow Queue (Q3), veh/ln 0.0 0.0 0.0 0.0 0.0 0.0 0.0 0.0
Queue Storage Ratio (RQ) 0.0 0.0 0.0 0.0 0.0 0.0 0.0 0.0 0.0 0.0
Uniform Delay (d1), s/veh 23.3 21.2 69.6 3.1 55.7 0.0 56.9
Incremental Delay (d2), s/veh 0.0 9.7 0.4 45.0 0.3 0.0 0.0 7.4 0.0 23.0
Initial Queue Delay (d3), s/veh 0.0 0.0 0.0 0.0 0.0 0.0 0.0 0.0
Control Delay (d), s/veh 33.0 21.6 114.6 3.4 63.2 0.0 79.9
Level of Service (LOS) C C F A E E
Approach Delay, s/veh / LOS 32.2 C 32.5 C 0.0 68.7 E
Intersection Delay s/veh / LOS 43.5 D
MultiModal Results EB WB NB SB
Pedestrian LOS Score / LOS 0.7 A 1.9 A 2.9 C 2.9 C
Bicycle LOS Score / LOS 1.8 A 1.1 A F
Copyright © 2010 University of Florida, All Rights Reserved HCS 2010™ Version 6.1 Generated: 12/19/2012 2:38:28 PM

2010 HCS Signalized Intersection Results Summary
General Information Intersection Information
Agency Qk4 Duration, h 0.25
Analyst JJL Analysis Date Aug 27, 2012 Area Type Other
Jurisdiction KYTC Time Period PM Peak Hour No Build
PHF 0.97
Intersection US 42 & Interstate 75 SB R Analysis Year 2012 Analysis Period 1> 7:00
File Name 5 PM US 42 & I75 SB Ramps.xus
Project Description Mall Rd Interchange PM
Demand Information EB WB NB SB
Approach Movement L T R L T R L T R L T R
Demand (v), veh/h 1100 300 400 950 400 700
Signal Information
GreenYellowRed
14.5 82.8 45.0 0.0 0.0 0.03.5 4.1 3.5 0.0 0.0 0.03.0 1.6 2.0 0.0 0.0 0.0
1 2 3 4
5 6 7 8
Cycle, s 160.0 Reference Phase 2
Offset, s 0 Reference Point End
Uncoordinated No Simult. Gap E/W Off
Force Mode Fixed Simult. Gap N/S Off
Timer Results EBL EBT WBL WBT NBL NBT SBL SBT
Assigned Phase 5 2 1 6 0 4 4
Case Number 0.0 3.0 2.0 4.0 0.0 9.0 9.0
Phase Duration, s 0.0 139.0 21.0 160.0 0.0 50.5 50.5
Change Period, (Y+Rc), s 5.0 5.7 6.5 5.7 0.0 5.5 5.5
Max Allow Headway (MAH), s 0.0 0.0 4.6 0.0 0.0 4.7 4.7
Queue Clearance Time (gs), s 16.5 47.0 47.0
Green Extension Time (ge), s 0.0 0.0 0.0 0.0 0.0 0.0 0.0
Phase Call Probability 1.00 1.00 1.00
Max Out Probability 1.00 1.00 1.00
Movement Group Results EB WB NB SB
Approach Movement L T R L T R L T R L T R
Assigned Movement 5 2 12 1 6 16 3 8 18 7 4 14
Adjusted Flow Rate (v), veh/h 0 1134 309 412 979 0 0 412 0 722
Adjusted Saturation Flow Rate (s), veh/h/ln 0 1630 1563 1757 1630 0 0 1689 0 1548
Queue Service time (gs ), s 0.0 32.2 19.0 14.5 10.8 0.0 0.0 16.0 45.0 45.0
Cycle Queue Clearance Time (gc), s 0.0 32.2 19.0 14.5 10.8 0.0 0.0 16.0 45.0 45.0
Capacity (c), veh/h 1687 809 159 2114 950 0 435
Volume-to-Capacity Ratio (X) 0.000 0.672 0.382 2.590 0.463 0.000 0.000 0.434 0.000 1.657
Available Capacity (ca), veh/h 1687 809 159 2114 950 0 435
Back of Queue (Q), veh/ln 10.4 7.3 38.9 2.8 6.8 54.3
Overflow Queue (Q3), veh/ln 0.0 0.0 0.0 0.0 0.0 0.0 0.0 0.0
Queue Storage Ratio (RQ) 0.0 0.0 0.0 0.0 0.0 0.0 0.0 0.0 0.0 0.0
Uniform Delay (d1), s/veh 17.0 23.2 72.8 4.5 47.1 0.0 57.5
Incremental Delay (d2), s/veh 0.0 2.2 1.4 733.5 0.7 0.0 0.0 0.4 0.0 305.9
Initial Queue Delay (d3), s/veh 0.0 0.0 0.0 0.0 0.0 0.0 0.0 0.0
Control Delay (d), s/veh 19.1 24.6 806.3 5.3 47.5 0.0 363.4
Level of Service (LOS) B C F A D F
Approach Delay, s/veh / LOS 20.3 C 242.6 F 0.0 248.5 F
Intersection Delay s/veh / LOS 163.4 F
MultiModal Results EB WB NB SB
Pedestrian LOS Score / LOS 0.7 A 1.9 A 2.9 C 2.9 C
Bicycle LOS Score / LOS 1.7 A 1.6 A F
Copyright © 2010 University of Florida, All Rights Reserved HCS 2010™ Version 6.1 Generated: 12/19/2012 2:39:09 PM

2010 HCS Signalized Intersection Results Summary
General Information Intersection Information
Agency Qk4 Duration, h 0.25
Analyst JJL Analysis Date Aug 27, 2012 Area Type Other
Jurisdiction KYTC Time Period AM Peak Hour No Build
PHF 0.84
Intersection US 42 & Mall Rd Analysis Year 2012 Analysis Period 1> 7:00
File Name 6 AM US 42 & Mall Rd.xus
Project Description Mall Rd Interchange AM
Demand Information EB WB NB SB
Approach Movement L T R L T R L T R L T R
Demand (v), veh/h 300 1290 10 20 570 200 10 20 20 150 10 120
Signal Information
GreenYellowRed
5.0 27.4 67.1 20.8 7.5 0.03.5 3.5 4.2 3.5 3.5 0.03.0 3.0 2.0 3.0 3.0 0.0
1 2 3 4
5 6 7
Cycle, s 160.0 Reference Phase 2
Offset, s 0 Reference Point End
Uncoordinated No Simult. Gap E/W Off
Force Mode Fixed Simult. Gap N/S Off
Timer Results EBL EBT WBL WBT NBL NBT SBL SBT
Assigned Phase 5 2 1 6 8 8 4 4
Case Number 2.0 4.0 2.0 3.0 12.0 12.0 9.0 9.0
Phase Duration, s 45.4 134.5 11.5 100.6 14.0 14.0 27.3 27.3
Change Period, (Y+Rc), s 6.5 6.2 6.5 6.2 6.5 6.5 6.5 6.5
Max Allow Headway (MAH), s 4.6 0.0 4.6 0.0 4.6 4.6 4.7 4.7
Queue Clearance Time (gs), s 37.2 4.1 7.4 7.4 19.6 19.6
Green Extension Time (ge), s 1.8 0.0 0.0 0.0 0.2 0.2 1.2 1.2
Phase Call Probability 1.00 1.00 1.00 1.00 1.00 1.00
Max Out Probability 0.00 0.00 0.00 0.00 0.04 0.04
Movement Group Results EB WB NB SB
Approach Movement L T R L T R L T R L T R
Assigned Movement 5 2 12 1 6 16 3 8 18 7 4 14
Adjusted Flow Rate (v), veh/h 357 775 773 24 679 238 60 0 0 179 12 143
Adjusted Saturation Flow Rate (s), veh/h/ln 1587 1712 1707 1810 1712 1412 1756 0 0 1587 1900 1412
Queue Service time (gs ), s 35.2 28.9 29.4 2.1 19.0 18.8 5.4 0.0 0.0 17.6 0.9 15.7
Cycle Queue Clearance Time (gc), s 35.2 28.9 29.4 2.1 19.0 18.8 5.4 0.0 0.0 17.6 0.9 15.7
Capacity (c), veh/h 386 1080 1077 57 1435 592 82 206 247 184
Volume-to-Capacity Ratio (X) 0.925 0.717 0.718 0.421 0.473 0.402 0.723 0.000 0.000 0.865 0.048 0.778
Available Capacity (ca), veh/h 801 1080 1077 324 1435 592 282 313 374 278
Back of Queue (Q), veh/ln 15.2 6.6 6.7 1.1 7.2 6.8 2.7 8.0 0.4 6.1
Overflow Queue (Q3), veh/ln 0.0 0.0 0.0 0.0 0.0 0.0 0.0 0.0 0.0 0.0 0.0 0.0
Queue Storage Ratio (RQ) 0.0 0.0 0.0 0.0 0.0 0.0 0.0 0.0 0.0 0.0 0.0 0.0
Uniform Delay (d1), s/veh 59.1 7.0 7.1 76.1 24.7 32.5 75.2 68.2 60.9 67.4
Incremental Delay (d2), s/veh 11.3 4.1 4.1 5.9 1.1 2.0 13.4 0.0 0.0 16.2 0.1 8.9
Initial Queue Delay (d3), s/veh 0.0 0.0 0.0 0.0 0.0 0.0 0.0 0.0 0.0 0.0 0.0 0.0
Control Delay (d), s/veh 70.4 11.0 11.3 82.0 25.8 34.5 88.6 84.4 61.0 76.2
Level of Service (LOS) E B B F C C F F E E
Approach Delay, s/veh / LOS 22.3 C 29.4 C 88.6 F 80.1 F
Intersection Delay s/veh / LOS 31.5 C
MultiModal Results EB WB NB SB
Pedestrian LOS Score / LOS 2.1 B 2.4 B 3.0 C 2.9 C
Bicycle LOS Score / LOS 2.1 B 1.3 A 0.6 A 1.0 A
Copyright © 2010 University of Florida, All Rights Reserved HCS 2010™ Version 6.1 Generated: 12/19/2012 2:39:29 PM

2010 HCS Signalized Intersection Results Summary
General Information Intersection Information
Agency Qk4 Duration, h 0.25
Analyst JJL Analysis Date Aug 27, 2012 Area Type Other
Jurisdiction KYTC Time Period PM Peak Hour No Build
PHF 0.98
Intersection US 42 & Mall Rd Analysis Year 2012 Analysis Period 1> 7:00
File Name 6 PM US 42 & Mall Rd.xus
Project Description Mall Rd Interchange PM
Demand Information EB WB NB SB
Approach Movement L T R L T R L T R L T R
Demand (v), veh/h 330 940 30 20 1230 400 30 20 20 440 20 640
Signal Information
GreenYellowRed
5.0 24.7 58.1 31.5 8.5 0.03.5 3.5 4.2 3.5 3.5 0.03.0 3.0 2.0 3.0 3.0 0.0
1 2 3 4
5 6 7
Cycle, s 160.0 Reference Phase 2
Offset, s 0 Reference Point End
Uncoordinated No Simult. Gap E/W Off
Force Mode Fixed Simult. Gap N/S Off
Timer Results EBL EBT WBL WBT NBL NBT SBL SBT
Assigned Phase 5 2 1 6 8 8 4 4
Case Number 2.0 4.0 2.0 3.0 12.0 12.0 9.0 9.0
Phase Duration, s 42.7 133.5 11.5 102.3 15.0 15.0 38.0 38.0
Change Period, (Y+Rc), s 6.5 6.2 6.5 6.2 6.5 6.5 6.5 6.5
Max Allow Headway (MAH), s 4.6 0.0 4.6 0.0 4.6 4.6 4.7 4.7
Queue Clearance Time (gs), s 36.1 3.8 8.4 8.4 33.5 33.5
Green Extension Time (ge), s 0.2 0.0 0.0 0.0 0.1 0.1 0.0 0.0
Phase Call Probability 1.00 1.00 1.00 1.00 1.00 1.00
Max Out Probability 1.00 0.00 0.15 0.15 1.00 1.00
Movement Group Results EB WB NB SB
Approach Movement L T R L T R L T R L T R
Assigned Movement 5 2 12 1 6 16 3 8 18 7 4 14
Adjusted Flow Rate (v), veh/h 337 498 492 20 1255 408 71 0 0 449 20 653
Adjusted Saturation Flow Rate (s), veh/h/ln 1560 1712 1693 1810 1712 1388 1771 0 0 1560 1900 1388
Queue Service time (gs ), s 34.1 19.4 20.1 1.8 58.1 42.4 6.4 0.0 0.0 31.5 1.4 31.5
Cycle Queue Clearance Time (gc), s 34.1 19.4 20.1 1.8 58.1 42.4 6.4 0.0 0.0 31.5 1.4 31.5
Capacity (c), veh/h 353 956 945 57 1243 504 94 307 374 273
Volume-to-Capacity Ratio (X) 0.953 0.521 0.521 0.361 1.010 0.810 0.763 0.000 0.000 1.462 0.055 2.390
Available Capacity (ca), veh/h 361 956 945 362 1243 504 166 307 374 273
Back of Queue (Q), veh/ln 16.8 6.2 6.5 0.9 27.1 16.3 3.3 31.6 0.7 59.3
Overflow Queue (Q3), veh/ln 0.0 0.0 0.0 0.0 0.0 0.0 0.0 0.0 0.0 0.0 0.0 0.0
Queue Storage Ratio (RQ) 0.0 0.0 0.0 0.0 0.0 0.0 0.0 0.0 0.0 0.0 0.0 0.0
Uniform Delay (d1), s/veh 61.0 11.5 12.1 75.9 41.3 46.0 74.8 64.3 52.2 64.3
Incremental Delay (d2), s/veh 35.1 2.0 2.0 4.6 27.9 13.2 14.2 0.0 0.0 225.0 0.1 636.5
Initial Queue Delay (d3), s/veh 0.0 0.0 0.0 0.0 0.0 0.0 0.0 0.0 0.0 0.0 0.0 0.0
Control Delay (d), s/veh 96.1 13.5 14.2 80.5 69.1 59.1 89.0 289.3 52.2 700.8
Level of Service (LOS) F B B F F E F F D F
Approach Delay, s/veh / LOS 34.7 C 66.9 E 89.0 F 524.4 F
Intersection Delay s/veh / LOS 179.2 F
MultiModal Results EB WB NB SB
Pedestrian LOS Score / LOS 2.1 B 2.4 B 3.0 C 2.9 C
Bicycle LOS Score / LOS 1.6 A 1.9 A 0.6 A 2.3 B
Copyright © 2010 University of Florida, All Rights Reserved HCS 2010™ Version 6.1 Generated: 12/19/2012 2:39:59 PM
2010 HCS Signalized Intersection Results Summary
General Information Intersection Information
Agency Qk4 Duration, h 0.25
Analyst JJL Analysis Date Aug 24, 2012 Area Type Other
Jurisdiction KYTC Time Period AM Peak Hour No Build
PHF 0.84
Intersection Mall Rd & I 75 Ramps Analysis Year 2012 Analysis Period 1> 7:00
File Name 7 AM Mall Rd & I-75 Ramps.xus
Project Description Mall Rd Interchange Existing AM
Demand Information EB WB NB SB
Approach Movement L T R L T R L T R L T R
Demand (v), veh/h 80 60 110 10 260 260 110 170 10
Signal Information
GreenYellowRed
6.0 1.1 78.0 16.3 0.0 0.03.5 0.0 4.4 4.0 0.0 0.03.0 0.0 1.8 1.9 0.0 0.0
1 3 4
6 7 8
Cycle, s 120.0 Reference Phase 2
Offset, s 0 Reference Point End
Uncoordinated No Simult. Gap E/W On
Force Mode Fixed Simult. Gap N/S On
Timer Results EBL EBT WBL WBT NBL NBT SBL SBT
Assigned Phase 7 8 8 5 2 1 6
Case Number 0.0 9.0 9.0 2.0 3.0 2.0 4.0
Phase Duration, s 0.0 22.2 22.2 12.5 106.4 13.6 107.5
Change Period, (Y+Rc), s 5.0 5.9 5.9 6.5 6.2 6.5 6.2
Max Allow Headway (MAH), s 0.0 6.2 6.2 4.1 0.0 4.1 0.0
Queue Clearance Time (gs), s 13.8 13.8 2.9 6.6
Green Extension Time (ge), s 0.0 2.5 2.5 0.0 0.0 0.5 0.0
Phase Call Probability 1.00 1.00 1.00 1.00
Max Out Probability 0.00 0.00 0.00 0.00
Movement Group Results EB WB NB SB
Approach Movement L T R L T R L T R L T R
Assigned Movement 7 4 14 3 8 18 5 2 12 1 6 16
Adjusted Flow Rate (v), veh/h 0 95 71 131 12 310 310 131 108 107
Adjusted Saturation Flow Rate (s), veh/h/ln 0 1436 1508 1278 1587 1587 1533 1673 1667 1634
Queue Service time (gs ), s 0.0 7.4 2.5 11.8 0.9 1.8 10.6 4.6 1.0 1.2
Cycle Queue Clearance Time (gc), s 0.0 7.4 2.5 11.8 0.9 1.8 10.6 4.6 1.0 1.2
Capacity (c), veh/h 195 410 174 79 2063 997 198 1099 1077
Volume-to-Capacity Ratio (X) 0.000 0.488 0.174 0.754 0.150 0.150 0.311 0.662 0.098 0.099
Available Capacity (ca), veh/h 479 1005 426 764 2063 997 1026 1099 1077
Back of Queue (Q), veh/ln 2.8 1.0 4.4 0.4 0.6 3.5 2.0 0.4 0.4
Overflow Queue (Q3), veh/ln 0.0 0.0 0.0 0.0 0.0 0.0 0.0 0.0 0.0
Queue Storage Ratio (RQ) 0.0 0.0 0.0 0.0 0.0 0.0 0.0 0.0 0.0 0.0
Uniform Delay (d1), s/veh 48.0 45.9 49.9 54.6 2.9 9.2 55.3 2.5 3.1
Incremental Delay (d2), s/veh 0.0 4.0 0.4 13.1 0.9 0.2 0.8 3.8 0.2 0.2
Initial Queue Delay (d3), s/veh 0.0 0.0 0.0 0.0 0.0 0.0 0.0 0.0 0.0
Control Delay (d), s/veh 52.0 46.3 63.1 55.4 3.1 10.0 59.0 2.7 3.3
Level of Service (LOS) D D E E A B E A A
Approach Delay, s/veh / LOS 0.0 55.5 E 7.5 A 24.2 C
Intersection Delay s/veh / LOS 23.2 C
MultiModal Results EB WB NB SB
Pedestrian LOS Score / LOS 3.0 C 3.0 C 2.1 B 2.4 B
Bicycle LOS Score / LOS 0.7 A 1.0 A 0.8 A
Copyright © 2010 University of Florida, All Rights Reserved HCS 2010™ Version 6.1 Generated: 12/19/2012 2:40:19 PM

2010 HCS Signalized Intersection Results Summary
General Information Intersection Information
Agency Qk4 Duration, h 0.25
Analyst JJL Analysis Date Aug 24, 2012 Area Type Other
Jurisdiction KYTC Time Period PM Peak Hour No Build
PHF 0.97
Intersection Mall Rd & I 75 Ramps Analysis Year 2012 Analysis Period 1> 7:00
File Name 7 PM Mall Rd & I-75 Ramps.xus
Project Description Mall Rd Interchange Existing PM
Demand Information EB WB NB SB
Approach Movement L T R L T R L T R L T R
Demand (v), veh/h 110 180 150 50 340 360 150 240 20
Signal Information
GreenYellowRed
7.0 2.1 98.2 24.0 0.0 0.03.5 0.0 4.4 4.0 0.0 0.03.0 0.0 1.8 1.9 0.0 0.0
1 3 4
6 7 8
Cycle, s 150.0 Reference Phase 2
Offset, s 0 Reference Point End
Uncoordinated No Simult. Gap E/W On
Force Mode Fixed Simult. Gap N/S On
Timer Results EBL EBT WBL WBT NBL NBT SBL SBT
Assigned Phase 7 8 8 5 2 1 6
Case Number 0.0 9.0 9.0 2.0 3.0 2.0 4.0
Phase Duration, s 0.0 29.9 29.9 13.5 134.3 15.7 136.5
Change Period, (Y+Rc), s 5.0 5.9 5.9 6.5 6.2 6.5 6.2
Max Allow Headway (MAH), s 0.0 6.2 6.2 4.1 0.0 4.1 0.0
Queue Clearance Time (gs), s 20.9 20.9 6.9 8.6
Green Extension Time (ge), s 0.0 3.1 3.1 0.2 0.0 0.5 0.0
Phase Call Probability 1.00 1.00 1.00 1.00
Max Out Probability 0.18 0.18 0.00 0.00
Movement Group Results EB WB NB SB
Approach Movement L T R L T R L T R L T R
Assigned Movement 7 4 14 3 8 18 5 2 12 1 6 16
Adjusted Flow Rate (v), veh/h 0 113 186 155 52 351 371 155 135 133
Adjusted Saturation Flow Rate (s), veh/h/ln 0 1331 1397 1184 1560 1559 1579 1723 1638 1594
Queue Service time (gs ), s 0.0 11.7 9.0 18.9 4.9 2.5 15.9 6.6 1.5 2.0
Cycle Queue Clearance Time (gc), s 0.0 11.7 9.0 18.9 4.9 2.5 15.9 6.6 1.5 2.0
Capacity (c), veh/h 213 447 189 73 2043 1034 210 1096 1066
Volume-to-Capacity Ratio (X) 0.000 0.533 0.415 0.817 0.704 0.172 0.359 0.735 0.123 0.125
Available Capacity (ca), veh/h 310 652 276 521 2043 1034 692 1096 1066
Back of Queue (Q), veh/ln 4.2 3.3 6.6 2.2 0.8 5.7 3.1 0.6 0.7
Overflow Queue (Q3), veh/ln 0.0 0.0 0.0 0.0 0.0 0.0 0.0 0.0 0.0
Queue Storage Ratio (RQ) 0.0 0.0 0.0 0.0 0.0 0.0 0.0 0.0 0.0 0.0
Uniform Delay (d1), s/veh 57.9 56.7 60.9 70.5 3.4 11.7 69.2 2.8 3.7
Incremental Delay (d2), s/veh 0.0 4.4 1.3 18.3 11.6 0.2 1.0 4.9 0.2 0.2
Initial Queue Delay (d3), s/veh 0.0 0.0 0.0 0.0 0.0 0.0 0.0 0.0 0.0
Control Delay (d), s/veh 62.2 58.0 79.1 82.1 3.6 12.6 74.2 3.0 3.9
Level of Service (LOS) E E E F A B E A A
Approach Delay, s/veh / LOS 0.0 66.3 E 13.2 B 29.3 C
Intersection Delay s/veh / LOS 31.9 C
MultiModal Results EB WB NB SB
Pedestrian LOS Score / LOS 3.0 C 3.0 C 2.1 B 2.4 B
Bicycle LOS Score / LOS 0.9 A 1.1 A 0.8 A
Copyright © 2010 University of Florida, All Rights Reserved HCS 2010™ Version 6.1 Generated: 12/19/2012 2:41:04 PM

2010 HCS Signalized Intersection Results Summary
General Information Intersection Information
Agency Qk4 Duration, h 0.25
Analyst JJL Analysis Date Aug 27, 2012 Area Type Other
Jurisdiction KYTC Time Period AM Peak Hour Build
PHF 0.94
Intersection KY 18 & Mall Rd Analysis Year 2040 Analysis Period 1> 7:00
File Name 1 AM KY 18 & Mall Rd.xus
Project Description Mall Rd Interchange AM
Demand Information EB WB NB SB
Approach Movement L T R L T R L T R L T R
Demand (v), veh/h 20 2210 160 160 1530 10 110 70 70 20 50 20
Signal Information
GreenYellowRed
8.0 1.1 66.1 8.6 9.0 0.03.5 0.0 4.8 4.0 4.0 0.03.0 0.0 1.9 3.0 3.0 0.0
1 2 3 4
5 6 7
Cycle, s 120.0 Reference Phase 2
Offset, s 0 Reference Point End
Uncoordinated No Simult. Gap E/W Off
Force Mode Fixed Simult. Gap N/S Off
Timer Results EBL EBT WBL WBT NBL NBT SBL SBT
Assigned Phase 5 2 1 6 8 8 4 4
Case Number 2.0 3.0 2.0 3.0 9.0 9.0 12.0 12.0
Phase Duration, s 14.5 88.4 15.6 89.5 16.0 16.0 15.6 15.6
Change Period, (Y+Rc), s 6.5 6.7 6.5 6.7 7.0 7.0 7.0 7.0
Max Allow Headway (MAH), s 4.0 0.0 4.0 0.0 4.1 4.1 4.0 4.0
Queue Clearance Time (gs), s 3.4 8.5 8.2 8.2 8.6 8.6
Green Extension Time (ge), s 0.0 0.0 0.6 0.0 0.8 0.8 0.0 0.0
Phase Call Probability 1.00 1.00 1.00 1.00 1.00 1.00
Max Out Probability 0.00 0.00 0.00 0.00 1.00 1.00
Movement Group Results EB WB NB SB
Approach Movement L T R L T R L T R L T R
Assigned Movement 5 2 12 1 6 16 3 8 18 7 4 14
Adjusted Flow Rate (v), veh/h 21 2351 170 170 1628 11 117 74 74 96 0 0
Adjusted Saturation Flow Rate (s), veh/h/ln 1723 1810 1412 1541 1643 1533 1541 1810 1412 1722 0 0
Queue Service time (gs ), s 1.4 32.7 7.4 6.5 17.9 0.4 4.4 4.8 6.2 6.6 0.0 0.0
Cycle Queue Clearance Time (gc), s 1.4 32.7 7.4 6.5 17.9 0.4 4.4 4.8 6.2 6.6 0.0 0.0
Capacity (c), veh/h 115 2990 778 234 2760 859 231 136 106 123
Volume-to-Capacity Ratio (X) 0.185 0.786 0.219 0.728 0.590 0.012 0.507 0.549 0.704 0.775 0.000 0.000
Available Capacity (ca), veh/h 365 2990 778 909 2760 859 627 368 287 158
Back of Queue (Q), veh/ln 0.6 8.2 2.3 2.6 4.5 0.1 1.7 2.2 2.4 3.3
Overflow Queue (Q3), veh/ln 0.0 0.0 0.0 0.0 0.0 0.0 0.0 0.0 0.0 0.0 0.0 0.0
Queue Storage Ratio (RQ) 0.0 0.0 0.0 0.0 0.0 0.0 0.0 0.0 0.0 0.0 0.0 0.0
Uniform Delay (d1), s/veh 52.9 11.5 13.8 54.2 9.0 11.7 53.4 53.5 54.2 54.7
Incremental Delay (d2), s/veh 0.8 2.2 0.6 4.3 0.9 0.0 1.7 3.4 8.2 16.6 0.0 0.0
Initial Queue Delay (d3), s/veh 0.0 0.0 0.0 0.0 0.0 0.0 0.0 0.0 0.0 0.0 0.0 0.0
Control Delay (d), s/veh 53.7 13.7 14.4 58.5 9.9 11.7 55.1 57.0 62.4 71.3
Level of Service (LOS) D B B E A B E E E E
Approach Delay, s/veh / LOS 14.0 B 14.5 B 57.7 E 71.3 E
Intersection Delay s/veh / LOS 17.8 B
MultiModal Results EB WB NB SB
Pedestrian LOS Score / LOS 2.6 B 2.1 B 3.5 D 3.4 C
Bicycle LOS Score / LOS 1.9 A 1.5 A 0.9 A 0.6 A
Copyright © 2010 University of Florida, All Rights Reserved HCS 2010™ Version 6.1 Generated: 6/10/2013 10:01:37 AM
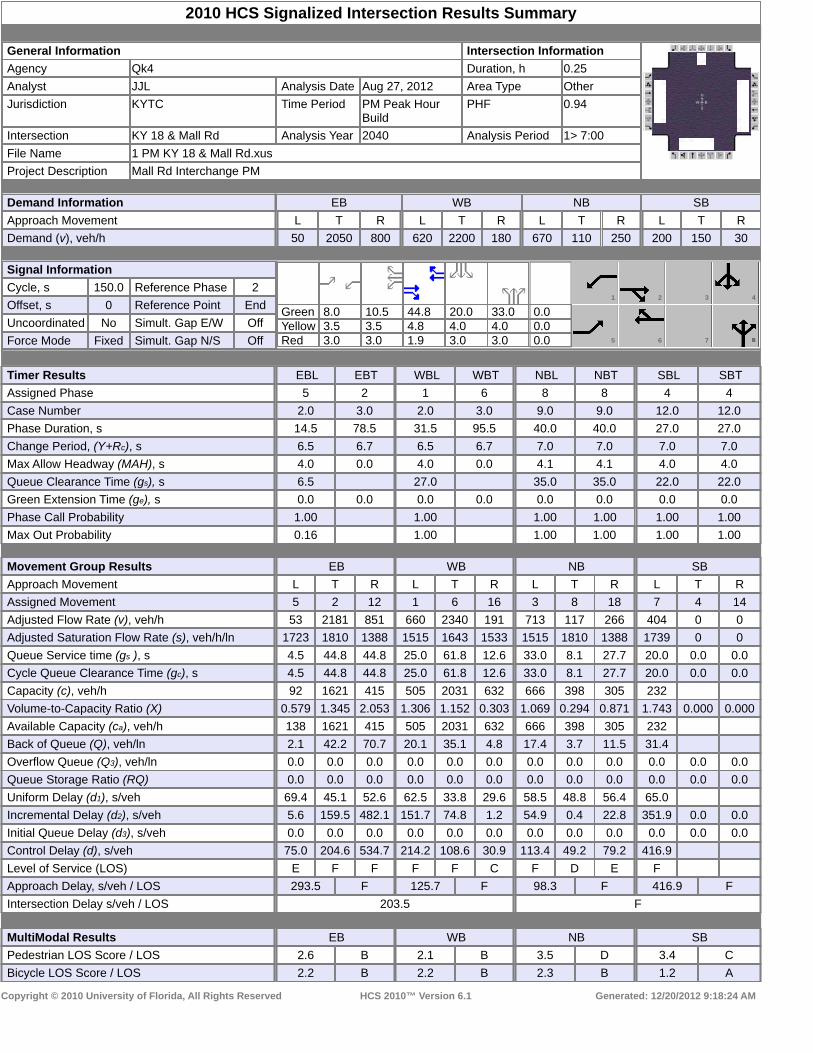
2010 HCS Signalized Intersection Results Summary
General Information Intersection Information
Agency Qk4 Duration, h 0.25
Analyst JJL Analysis Date Aug 27, 2012 Area Type Other
Jurisdiction KYTC Time Period PM Peak Hour Build
PHF 0.94
Intersection KY 18 & Mall Rd Analysis Year 2040 Analysis Period 1> 7:00
File Name 1 PM KY 18 & Mall Rd.xus
Project Description Mall Rd Interchange PM
Demand Information EB WB NB SB
Approach Movement L T R L T R L T R L T R
Demand (v), veh/h 50 2050 800 620 2200 180 670 110 250 200 150 30
Signal Information
GreenYellowRed
8.0 10.5 44.8 20.0 33.0 0.03.5 3.5 4.8 4.0 4.0 0.03.0 3.0 1.9 3.0 3.0 0.0
1 2 3 4
5 6 7
Cycle, s 150.0 Reference Phase 2
Offset, s 0 Reference Point End
Uncoordinated No Simult. Gap E/W Off
Force Mode Fixed Simult. Gap N/S Off
Timer Results EBL EBT WBL WBT NBL NBT SBL SBT
Assigned Phase 5 2 1 6 8 8 4 4
Case Number 2.0 3.0 2.0 3.0 9.0 9.0 12.0 12.0
Phase Duration, s 14.5 78.5 31.5 95.5 40.0 40.0 27.0 27.0
Change Period, (Y+Rc), s 6.5 6.7 6.5 6.7 7.0 7.0 7.0 7.0
Max Allow Headway (MAH), s 4.0 0.0 4.0 0.0 4.1 4.1 4.0 4.0
Queue Clearance Time (gs), s 6.5 27.0 35.0 35.0 22.0 22.0
Green Extension Time (ge), s 0.0 0.0 0.0 0.0 0.0 0.0 0.0 0.0
Phase Call Probability 1.00 1.00 1.00 1.00 1.00 1.00
Max Out Probability 0.16 1.00 1.00 1.00 1.00 1.00
Movement Group Results EB WB NB SB
Approach Movement L T R L T R L T R L T R
Assigned Movement 5 2 12 1 6 16 3 8 18 7 4 14
Adjusted Flow Rate (v), veh/h 53 2181 851 660 2340 191 713 117 266 404 0 0
Adjusted Saturation Flow Rate (s), veh/h/ln 1723 1810 1388 1515 1643 1533 1515 1810 1388 1739 0 0
Queue Service time (gs ), s 4.5 44.8 44.8 25.0 61.8 12.6 33.0 8.1 27.7 20.0 0.0 0.0
Cycle Queue Clearance Time (gc), s 4.5 44.8 44.8 25.0 61.8 12.6 33.0 8.1 27.7 20.0 0.0 0.0
Capacity (c), veh/h 92 1621 415 505 2031 632 666 398 305 232
Volume-to-Capacity Ratio (X) 0.579 1.345 2.053 1.306 1.152 0.303 1.069 0.294 0.871 1.743 0.000 0.000
Available Capacity (ca), veh/h 138 1621 415 505 2031 632 666 398 305 232
Back of Queue (Q), veh/ln 2.1 42.2 70.7 20.1 35.1 4.8 17.4 3.7 11.5 31.4
Overflow Queue (Q3), veh/ln 0.0 0.0 0.0 0.0 0.0 0.0 0.0 0.0 0.0 0.0 0.0 0.0
Queue Storage Ratio (RQ) 0.0 0.0 0.0 0.0 0.0 0.0 0.0 0.0 0.0 0.0 0.0 0.0
Uniform Delay (d1), s/veh 69.4 45.1 52.6 62.5 33.8 29.6 58.5 48.8 56.4 65.0
Incremental Delay (d2), s/veh 5.6 159.5 482.1 151.7 74.8 1.2 54.9 0.4 22.8 351.9 0.0 0.0
Initial Queue Delay (d3), s/veh 0.0 0.0 0.0 0.0 0.0 0.0 0.0 0.0 0.0 0.0 0.0 0.0
Control Delay (d), s/veh 75.0 204.6 534.7 214.2 108.6 30.9 113.4 49.2 79.2 416.9
Level of Service (LOS) E F F F F C F D E F
Approach Delay, s/veh / LOS 293.5 F 125.7 F 98.3 F 416.9 F
Intersection Delay s/veh / LOS 203.5 F
MultiModal Results EB WB NB SB
Pedestrian LOS Score / LOS 2.6 B 2.1 B 3.5 D 3.4 C
Bicycle LOS Score / LOS 2.2 B 2.2 B 2.3 B 1.2 A
Copyright © 2010 University of Florida, All Rights Reserved HCS 2010™ Version 6.1 Generated: 12/20/2012 9:18:24 AM
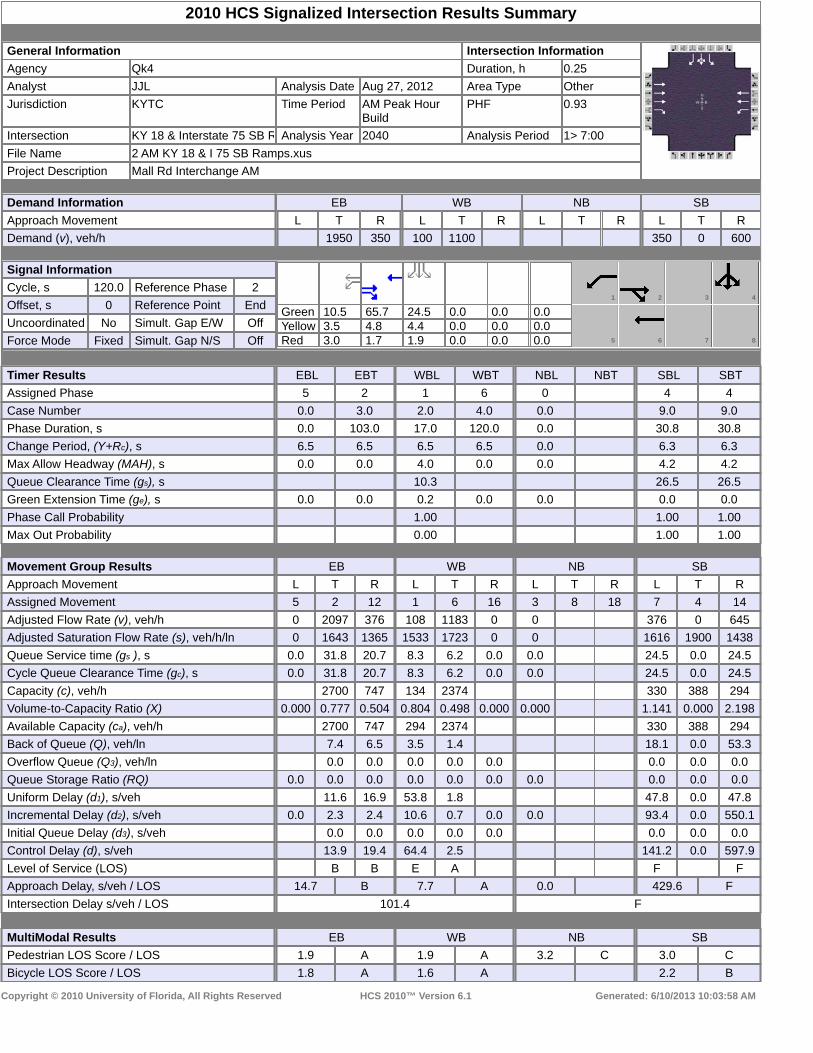
2010 HCS Signalized Intersection Results Summary
General Information Intersection Information
Agency Qk4 Duration, h 0.25
Analyst JJL Analysis Date Aug 27, 2012 Area Type Other
Jurisdiction KYTC Time Period AM Peak Hour Build
PHF 0.93
Intersection KY 18 & Interstate 75 SB R Analysis Year 2040 Analysis Period 1> 7:00
File Name 2 AM KY 18 & I 75 SB Ramps.xus
Project Description Mall Rd Interchange AM
Demand Information EB WB NB SB
Approach Movement L T R L T R L T R L T R
Demand (v), veh/h 1950 350 100 1100 350 0 600
Signal Information
GreenYellowRed
10.5 65.7 24.5 0.0 0.0 0.03.5 4.8 4.4 0.0 0.0 0.03.0 1.7 1.9 0.0 0.0 0.0
1 2 3 4
5 6 7 8
Cycle, s 120.0 Reference Phase 2
Offset, s 0 Reference Point End
Uncoordinated No Simult. Gap E/W Off
Force Mode Fixed Simult. Gap N/S Off
Timer Results EBL EBT WBL WBT NBL NBT SBL SBT
Assigned Phase 5 2 1 6 0 4 4
Case Number 0.0 3.0 2.0 4.0 0.0 9.0 9.0
Phase Duration, s 0.0 103.0 17.0 120.0 0.0 30.8 30.8
Change Period, (Y+Rc), s 6.5 6.5 6.5 6.5 0.0 6.3 6.3
Max Allow Headway (MAH), s 0.0 0.0 4.0 0.0 0.0 4.2 4.2
Queue Clearance Time (gs), s 10.3 26.5 26.5
Green Extension Time (ge), s 0.0 0.0 0.2 0.0 0.0 0.0 0.0
Phase Call Probability 1.00 1.00 1.00
Max Out Probability 0.00 1.00 1.00
Movement Group Results EB WB NB SB
Approach Movement L T R L T R L T R L T R
Assigned Movement 5 2 12 1 6 16 3 8 18 7 4 14
Adjusted Flow Rate (v), veh/h 0 2097 376 108 1183 0 0 376 0 645
Adjusted Saturation Flow Rate (s), veh/h/ln 0 1643 1365 1533 1723 0 0 1616 1900 1438
Queue Service time (gs ), s 0.0 31.8 20.7 8.3 6.2 0.0 0.0 24.5 0.0 24.5
Cycle Queue Clearance Time (gc), s 0.0 31.8 20.7 8.3 6.2 0.0 0.0 24.5 0.0 24.5
Capacity (c), veh/h 2700 747 134 2374 330 388 294
Volume-to-Capacity Ratio (X) 0.000 0.777 0.504 0.804 0.498 0.000 0.000 1.141 0.000 2.198
Available Capacity (ca), veh/h 2700 747 294 2374 330 388 294
Back of Queue (Q), veh/ln 7.4 6.5 3.5 1.4 18.1 0.0 53.3
Overflow Queue (Q3), veh/ln 0.0 0.0 0.0 0.0 0.0 0.0 0.0 0.0
Queue Storage Ratio (RQ) 0.0 0.0 0.0 0.0 0.0 0.0 0.0 0.0 0.0 0.0
Uniform Delay (d1), s/veh 11.6 16.9 53.8 1.8 47.8 0.0 47.8
Incremental Delay (d2), s/veh 0.0 2.3 2.4 10.6 0.7 0.0 0.0 93.4 0.0 550.1
Initial Queue Delay (d3), s/veh 0.0 0.0 0.0 0.0 0.0 0.0 0.0 0.0
Control Delay (d), s/veh 13.9 19.4 64.4 2.5 141.2 0.0 597.9
Level of Service (LOS) B B E A F F
Approach Delay, s/veh / LOS 14.7 B 7.7 A 0.0 429.6 F
Intersection Delay s/veh / LOS 101.4 F
MultiModal Results EB WB NB SB
Pedestrian LOS Score / LOS 1.9 A 1.9 A 3.2 C 3.0 C
Bicycle LOS Score / LOS 1.8 A 1.6 A 2.2 B
Copyright © 2010 University of Florida, All Rights Reserved HCS 2010™ Version 6.1 Generated: 6/10/2013 10:03:58 AM

2010 HCS Signalized Intersection Results Summary
General Information Intersection Information
Agency Qk4 Duration, h 0.25
Analyst JJL Analysis Date Aug 27, 2012 Area Type Other
Jurisdiction KYTC Time Period PM Peak Hour Build
PHF 0.97
Intersection KY 18 & Interstate 75 SB R Analysis Year 2040 Analysis Period 1> 7:00
File Name 2 PM KY 18 & I 75 SB Ramps.xus
Project Description Mall Rd Interchange PM
Demand Information EB WB NB SB
Approach Movement L T R L T R L T R L T R
Demand (v), veh/h 2100 400 350 1550 450 0 1450
Signal Information
GreenYellowRed
22.0 70.2 38.5 0.0 0.0 0.03.5 4.8 4.4 0.0 0.0 0.03.0 1.7 1.9 0.0 0.0 0.0
1 2 3 4
5 6 7 8
Cycle, s 150.0 Reference Phase 2
Offset, s 0 Reference Point End
Uncoordinated No Simult. Gap E/W Off
Force Mode Fixed Simult. Gap N/S Off
Timer Results EBL EBT WBL WBT NBL NBT SBL SBT
Assigned Phase 5 2 1 6 0 4 4
Case Number 0.0 3.0 2.0 4.0 0.0 9.0 9.0
Phase Duration, s 0.0 121.5 28.5 150.0 0.0 44.8 44.8
Change Period, (Y+Rc), s 6.5 6.5 6.5 6.5 0.0 6.3 6.3
Max Allow Headway (MAH), s 0.0 0.0 4.0 0.0 0.0 4.2 4.2
Queue Clearance Time (gs), s 24.0 40.5 40.5
Green Extension Time (ge), s 0.0 0.0 0.0 0.0 0.0 0.0 0.0
Phase Call Probability 1.00 1.00 1.00
Max Out Probability 1.00 1.00 1.00
Movement Group Results EB WB NB SB
Approach Movement L T R L T R L T R L T R
Assigned Movement 5 2 12 1 6 16 3 8 18 7 4 14
Adjusted Flow Rate (v), veh/h 0 2165 412 361 1598 0 0 464 0 1495
Adjusted Saturation Flow Rate (s), veh/h/ln 0 1643 1477 1660 1723 0 0 1587 1900 1412
Queue Service time (gs ), s 0.0 59.8 30.9 22.0 22.4 0.0 0.0 38.5 0.0 38.5
Cycle Queue Clearance Time (gc), s 0.0 59.8 30.9 22.0 22.4 0.0 0.0 38.5 0.0 38.5
Capacity (c), veh/h 2307 691 243 2267 407 488 363
Volume-to-Capacity Ratio (X) 0.000 0.938 0.596 1.482 0.705 0.000 0.000 1.139 0.000 4.123
Available Capacity (ca), veh/h 2307 691 243 2267 407 488 363
Back of Queue (Q), veh/ln 20.9 11.4 25.2 4.3 25.0 0.0 155.6
Overflow Queue (Q3), veh/ln 0.0 0.0 0.0 0.0 0.0 0.0 0.0 0.0
Queue Storage Ratio (RQ) 0.0 0.0 0.0 0.0 0.0 0.0 0.0 0.0 0.0 0.0
Uniform Delay (d1), s/veh 26.2 29.4 64.0 4.5 55.8 0.0 55.8
Incremental Delay (d2), s/veh 0.0 9.0 3.8 237.6 1.9 0.0 0.0 88.1 0.0 1412.1
Initial Queue Delay (d3), s/veh 0.0 0.0 0.0 0.0 0.0 0.0 0.0 0.0
Control Delay (d), s/veh 35.2 33.2 301.6 6.4 143.9 0.0 1467.8
Level of Service (LOS) D C F A F F
Approach Delay, s/veh / LOS 34.9 C 60.8 E 0.0 1154.3 F
Intersection Delay s/veh / LOS 380.3 F
MultiModal Results EB WB NB SB
Pedestrian LOS Score / LOS 1.9 A 1.9 A 3.2 C 3.0 C
Bicycle LOS Score / LOS 1.9 A 2.1 B 3.7 D
Copyright © 2010 University of Florida, All Rights Reserved HCS 2010™ Version 6.1 Generated: 12/20/2012 9:19:15 AM

2010 HCS Signalized Intersection Results Summary
General Information Intersection Information
Agency Qk4 Duration, h 0.25
Analyst JJL Analysis Date Jan 2, 2013 Area Type Other
Jurisdiction KYTC Time Period AM Design Hour PHF 0.96
Intersection KY 18 & I75 NB Ramps Analysis Year 2040 Build Analysis Period 1> 7:00
File Name 3 AM KY 18 & I 75 NB Ramps.xus
Project Description Mall Road Interchange
Demand Information EB WB NB SB
Approach Movement L T R L T R L T R L T R
Demand (v), veh/h 1600 700 550 200 650 0 200
Signal Information
GreenYellowRed
39.0 25.4 35.4 0.0 0.0 0.03.5 4.8 4.4 0.0 0.0 0.03.0 1.6 3.0 0.0 0.0 0.0
1 2 3 4
5 6 7
Cycle, s 120.1 Reference Phase 2
Offset, s 0 Reference Point End
Uncoordinated Yes Simult. Gap E/W Off
Force Mode Fixed Simult. Gap N/S Off
Timer Results EBL EBT WBL WBT NBL NBT SBL SBT
Assigned Phase 5 2 1 6 8 8 7
Case Number 2.0 4.0 0.0 3.0 10.0 10.0 0.0
Phase Duration, s 45.5 77.3 0.0 31.8 42.8 42.8 0.0
Change Period, (Y+Rc), s 6.5 6.4 5.0 6.4 7.4 7.4 5.0
Max Allow Headway (MAH), s 6.1 6.0 0.0 6.1 6.2 6.2 0.0
Queue Clearance Time (gs), s 41.0 15.2 20.9 37.4 37.4
Green Extension Time (ge), s 0.0 6.9 0.0 4.5 0.0 0.0 0.0
Phase Call Probability 1.00 1.00 1.00 1.00 1.00
Max Out Probability 1.00 0.09 0.62 1.00 1.00
Movement Group Results EB WB NB SB
Approach Movement L T R L T R L T R L T R
Assigned Movement 5 2 12 1 6 16 3 8 18 7 4 14
Adjusted Flow Rate (v), veh/h 1667 729 0 0 573 208 677 0 208 0
Adjusted Saturation Flow Rate (s), veh/h/ln 1627 1723 0 0 1723 1491 1573 0 1610 0
Queue Service time (gs ), s 39.0 13.2 0.0 0.0 18.9 15.4 35.4 35.4 12.6 0.0
Cycle Queue Clearance Time (gc), s 39.0 13.2 0.0 0.0 18.9 15.4 35.4 35.4 12.6 0.0
Capacity (c), veh/h 1057 2034 729 315 464 0 475
Volume-to-Capacity Ratio (X) 1.577 0.359 0.000 0.000 0.786 0.661 1.460 0.000 0.439 0.000
Available Capacity (ca), veh/h 1057 2034 889 385 464 0
Back of Queue (Q), veh/ln 54.0 5.0 8.5 6.1 41.6 5.1
Overflow Queue (Q3), veh/ln 0.0 0.0 0.0 0.0 0.0 0.0 0.0 0.0
Queue Storage Ratio (RQ) 0.0 0.0 0.0 0.0 0.0 0.0 0.0 0.0 0.0 0.0
Uniform Delay (d1), s/veh 40.5 12.8 44.8 43.4 42.3 34.3
Incremental Delay (d2), s/veh 264.4 0.5 0.0 0.0 5.3 5.4 218.6 0.0 1.4 0.0
Initial Queue Delay (d3), s/veh 0.0 0.0 0.0 0.0 0.0 0.0 0.0 0.0
Control Delay (d), s/veh 304.9 13.3 50.1 48.8 260.9 35.7
Level of Service (LOS) F B D D F D
Approach Delay, s/veh / LOS 216.2 F 49.8 D 207.9 F 0.0
Intersection Delay s/veh / LOS 182.4 F
MultiModal Results EB WB NB SB
Pedestrian LOS Score / LOS 1.7 A 1.9 A 2.9 C 3.0 C
Bicycle LOS Score / LOS 2.5 B 1.1 A 1.9 A
Copyright © 2010 University of Florida, All Rights Reserved HCS 2010™ Version 6.1 Generated: 6/10/2013 10:05:30 AM

2010 HCS Signalized Intersection Results Summary
General Information Intersection Information
Agency Qk4 Duration, h 0.25
Analyst JJL Analysis Date Jan 2, 2013 Area Type Other
Jurisdiction KYTC Time Period PM Design Hour PHF 0.96
Intersection KY 18 & I75 NB Ramps Analysis Year 2040 Build Analysis Period 1> 7:00
File Name 3 PM KY 18 & I 75 NB Ramps.xus
Project Description Mall Road Interchange
Demand Information EB WB NB SB
Approach Movement L T R L T R L T R L T R
Demand (v), veh/h 1100 1450 1250 400 650 0 150
Signal Information
GreenYellowRed
22.0 60.5 47.4 0.0 0.0 0.03.5 4.8 4.4 0.0 0.0 0.03.0 1.6 3.0 0.0 0.0 0.0
1 2 3 4
5 6 7
Cycle, s 150.2 Reference Phase 2
Offset, s 0 Reference Point End
Uncoordinated Yes Simult. Gap E/W Off
Force Mode Fixed Simult. Gap N/S Off
Timer Results EBL EBT WBL WBT NBL NBT SBL SBT
Assigned Phase 5 2 1 6 8 8 7
Case Number 2.0 4.0 0.0 3.0 10.0 10.0 0.0
Phase Duration, s 28.5 95.4 0.0 66.9 54.8 54.8 0.0
Change Period, (Y+Rc), s 6.5 6.4 5.0 6.4 7.4 7.4 5.0
Max Allow Headway (MAH), s 6.1 6.0 0.0 6.1 6.2 6.2 0.0
Queue Clearance Time (gs), s 24.0 49.8 56.5 49.4 49.4
Green Extension Time (ge), s 0.0 0.0 0.0 4.0 0.0 0.0 0.0
Phase Call Probability 1.00 1.00 1.00 1.00 1.00
Max Out Probability 1.00 1.00 1.00 1.00 1.00
Movement Group Results EB WB NB SB
Approach Movement L T R L T R L T R L T R
Assigned Movement 5 2 12 1 6 16 3 8 18 7 4 14
Adjusted Flow Rate (v), veh/h 1146 1510 0 0 1302 417 677 0 156 0
Adjusted Saturation Flow Rate (s), veh/h/ln 1627 1723 0 0 1723 1491 1573 0 1610 0
Queue Service time (gs ), s 22.0 47.8 0.0 0.0 54.5 34.8 47.4 47.4 11.0 0.0
Cycle Queue Clearance Time (gc), s 22.0 47.8 0.0 0.0 54.5 34.8 47.4 47.4 11.0 0.0
Capacity (c), veh/h 477 2041 1387 600 497 0 508
Volume-to-Capacity Ratio (X) 2.404 0.740 0.000 0.000 0.939 0.694 1.363 0.000 0.307 0.000
Available Capacity (ca), veh/h 477 2041 1400 606 497 0
Back of Queue (Q), veh/ln 51.3 19.4 25.2 13.3 42.8 4.5
Overflow Queue (Q3), veh/ln 0.0 0.0 0.0 0.0 0.0 0.0 0.0 0.0
Queue Storage Ratio (RQ) 0.0 0.0 0.0 0.0 0.0 0.0 0.0 0.0 0.0 0.0
Uniform Delay (d1), s/veh 64.1 22.2 43.1 37.2 51.4 38.9
Incremental Delay (d2), s/veh 638.1 2.5 0.0 0.0 12.6 4.4 176.1 0.0 0.7 0.0
Initial Queue Delay (d3), s/veh 0.0 0.0 0.0 0.0 0.0 0.0 0.0 0.0
Control Delay (d), s/veh 702.1 24.7 55.7 41.6 227.5 39.7
Level of Service (LOS) F C E D F D
Approach Delay, s/veh / LOS 316.9 F 52.2 D 192.2 F 0.0
Intersection Delay s/veh / LOS 209.6 F
MultiModal Results EB WB NB SB
Pedestrian LOS Score / LOS 1.7 A 1.9 A 2.9 C 3.0 C
Bicycle LOS Score / LOS 2.7 B 1.9 A 1.9 A
Copyright © 2010 University of Florida, All Rights Reserved HCS 2010™ Version 6.1 Generated: 1/3/2013 9:08:17 AM

HCS+: Unsignalized Intersections Release 5.6 _______________________TWO-WAY STOP CONTROL SUMMARY___________________________ Analyst: JJL Agency/Co.: Qk4 Date Performed: 8/28/2012 Analysis Time Period: AM Peak Hour Build Intersection: US 42 & I 75 NB Ramps Jurisdiction: KYTC Units: U. S. Customary Analysis Year: 2040 Project ID: Mall Rd Interchange East/West Street: US 42 North/South Street: Interstate 75 NB Ramps Intersection Orientation: EW Study period (hrs): 0.25 ______________________Vehicle Volumes and Adjustments_________________________ Major Street: Approach Eastbound Westbound Movement 1 2 3 | 4 5 6 L T R | L T R ______________________________________________________________________________ Volume 1200 500 Peak-Hour Factor, PHF 0.85 0.92 Hourly Flow Rate, HFR 1411 543 Percent Heavy Vehicles -- -- -- -- Median Type/Storage Raised curb / 1 RT Channelized? Lanes 2 2 Configuration T T Upstream Signal? No No ______________________________________________________________________________ Minor Street: Approach Northbound Southbound Movement 7 8 9 | 10 11 12 L T R | L T R ______________________________________________________________________________ Volume 200 400 Peak Hour Factor, PHF 0.76 0.96 Hourly Flow Rate, HFR 263 416 Percent Heavy Vehicles 7 7 Percent Grade (%) 0 0 Flared Approach: Exists?/Storage / / Lanes 1 1 Configuration L R ______________________________________________________________________________ __________________Delay, Queue Length, and Level of Service___________________ Approach EB WB Northbound Southbound Movement 1 4 | 7 8 9 | 10 11 12 Lane Config | L R | ______________________________________________________________________________ v (vph) 263 416 C(m) (vph) 154 421 v/c 1.71 0.99 95% queue length 18.86 12.18 Control Delay 395.8 72.6 LOS F F Approach Delay 197.8 Approach LOS F ______________________________________________________________________________

HCS+: Unsignalized Intersections Release 5.6 _______________________TWO-WAY STOP CONTROL SUMMARY___________________________ Analyst: JJL Agency/Co.: Qk4 Date Performed: 8/28/2012 Analysis Time Period: PM Peak Hour Build Intersection: US 42 & I 75 NB Ramps Jurisdiction: KYTC Units: U. S. Customary Analysis Year: 2040 Project ID: Mall Rd Interchange East/West Street: US 42 North/South Street: Interstate 75 NB Ramps Intersection Orientation: EW Study period (hrs): 0.25 ______________________Vehicle Volumes and Adjustments_________________________ Major Street: Approach Eastbound Westbound Movement 1 2 3 | 4 5 6 L T R | L T R ______________________________________________________________________________ Volume 1550 1250 Peak-Hour Factor, PHF 0.94 0.83 Hourly Flow Rate, HFR 1648 1506 Percent Heavy Vehicles -- -- -- -- Median Type/Storage Raised curb / 1 RT Channelized? Lanes 2 2 Configuration T T Upstream Signal? No No ______________________________________________________________________________ Minor Street: Approach Northbound Southbound Movement 7 8 9 | 10 11 12 L T R | L T R ______________________________________________________________________________ Volume 250 300 Peak Hour Factor, PHF 0.83 0.89 Hourly Flow Rate, HFR 301 337 Percent Heavy Vehicles 5 5 Percent Grade (%) 0 0 Flared Approach: Exists?/Storage / / Lanes 1 1 Configuration L R ______________________________________________________________________________ __________________Delay, Queue Length, and Level of Service___________________ Approach EB WB Northbound Southbound Movement 1 4 | 7 8 9 | 10 11 12 Lane Config | L R | ______________________________________________________________________________ v (vph) 301 337 C(m) (vph) 104 364 v/c 2.89 0.93 95% queue length 28.58 9.68 Control Delay 942.0 64.5 LOS F F Approach Delay 478.5 Approach LOS F ______________________________________________________________________________
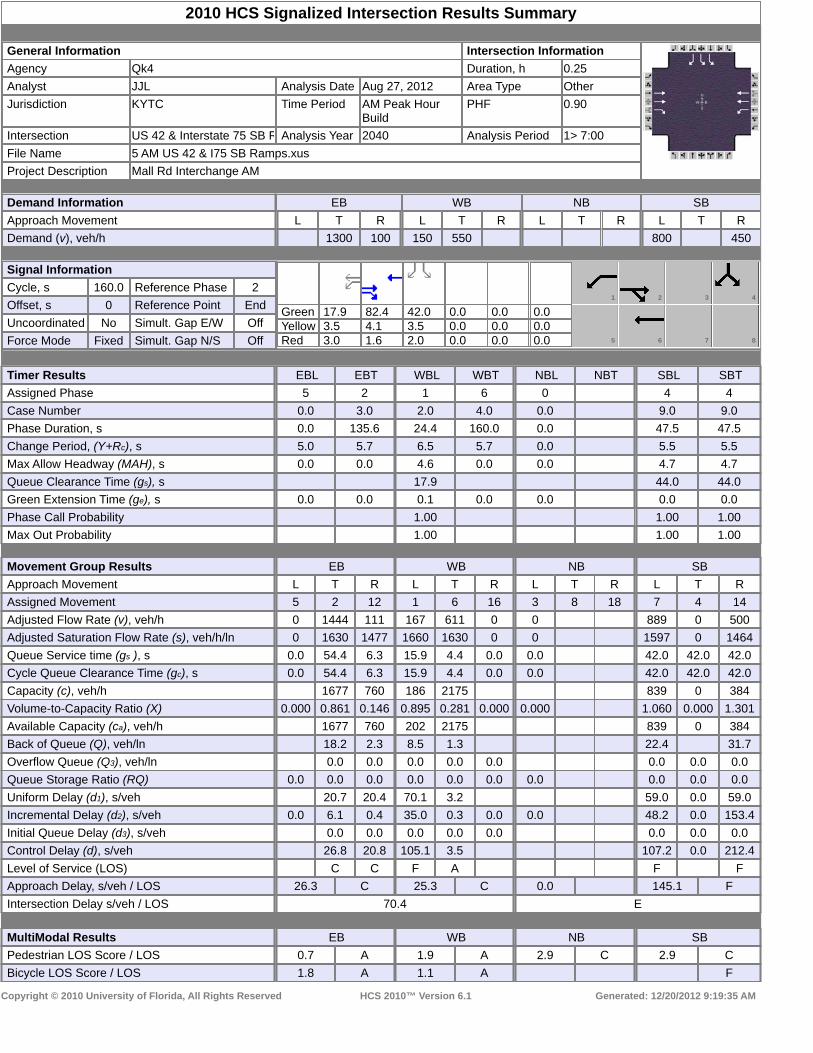
2010 HCS Signalized Intersection Results Summary
General Information Intersection Information
Agency Qk4 Duration, h 0.25
Analyst JJL Analysis Date Aug 27, 2012 Area Type Other
Jurisdiction KYTC Time Period AM Peak Hour Build
PHF 0.90
Intersection US 42 & Interstate 75 SB R Analysis Year 2040 Analysis Period 1> 7:00
File Name 5 AM US 42 & I75 SB Ramps.xus
Project Description Mall Rd Interchange AM
Demand Information EB WB NB SB
Approach Movement L T R L T R L T R L T R
Demand (v), veh/h 1300 100 150 550 800 450
Signal Information
GreenYellowRed
17.9 82.4 42.0 0.0 0.0 0.03.5 4.1 3.5 0.0 0.0 0.03.0 1.6 2.0 0.0 0.0 0.0
1 2 3 4
5 6 7 8
Cycle, s 160.0 Reference Phase 2
Offset, s 0 Reference Point End
Uncoordinated No Simult. Gap E/W Off
Force Mode Fixed Simult. Gap N/S Off
Timer Results EBL EBT WBL WBT NBL NBT SBL SBT
Assigned Phase 5 2 1 6 0 4 4
Case Number 0.0 3.0 2.0 4.0 0.0 9.0 9.0
Phase Duration, s 0.0 135.6 24.4 160.0 0.0 47.5 47.5
Change Period, (Y+Rc), s 5.0 5.7 6.5 5.7 0.0 5.5 5.5
Max Allow Headway (MAH), s 0.0 0.0 4.6 0.0 0.0 4.7 4.7
Queue Clearance Time (gs), s 17.9 44.0 44.0
Green Extension Time (ge), s 0.0 0.0 0.1 0.0 0.0 0.0 0.0
Phase Call Probability 1.00 1.00 1.00
Max Out Probability 1.00 1.00 1.00
Movement Group Results EB WB NB SB
Approach Movement L T R L T R L T R L T R
Assigned Movement 5 2 12 1 6 16 3 8 18 7 4 14
Adjusted Flow Rate (v), veh/h 0 1444 111 167 611 0 0 889 0 500
Adjusted Saturation Flow Rate (s), veh/h/ln 0 1630 1477 1660 1630 0 0 1597 0 1464
Queue Service time (gs ), s 0.0 54.4 6.3 15.9 4.4 0.0 0.0 42.0 42.0 42.0
Cycle Queue Clearance Time (gc), s 0.0 54.4 6.3 15.9 4.4 0.0 0.0 42.0 42.0 42.0
Capacity (c), veh/h 1677 760 186 2175 839 0 384
Volume-to-Capacity Ratio (X) 0.000 0.861 0.146 0.895 0.281 0.000 0.000 1.060 0.000 1.301
Available Capacity (ca), veh/h 1677 760 202 2175 839 0 384
Back of Queue (Q), veh/ln 18.2 2.3 8.5 1.3 22.4 31.7
Overflow Queue (Q3), veh/ln 0.0 0.0 0.0 0.0 0.0 0.0 0.0 0.0
Queue Storage Ratio (RQ) 0.0 0.0 0.0 0.0 0.0 0.0 0.0 0.0 0.0 0.0
Uniform Delay (d1), s/veh 20.7 20.4 70.1 3.2 59.0 0.0 59.0
Incremental Delay (d2), s/veh 0.0 6.1 0.4 35.0 0.3 0.0 0.0 48.2 0.0 153.4
Initial Queue Delay (d3), s/veh 0.0 0.0 0.0 0.0 0.0 0.0 0.0 0.0
Control Delay (d), s/veh 26.8 20.8 105.1 3.5 107.2 0.0 212.4
Level of Service (LOS) C C F A F F
Approach Delay, s/veh / LOS 26.3 C 25.3 C 0.0 145.1 F
Intersection Delay s/veh / LOS 70.4 E
MultiModal Results EB WB NB SB
Pedestrian LOS Score / LOS 0.7 A 1.9 A 2.9 C 2.9 C
Bicycle LOS Score / LOS 1.8 A 1.1 A F
Copyright © 2010 University of Florida, All Rights Reserved HCS 2010™ Version 6.1 Generated: 12/20/2012 9:19:35 AM

2010 HCS Signalized Intersection Results Summary
General Information Intersection Information
Agency Qk4 Duration, h 0.25
Analyst JJL Analysis Date Aug 27, 2012 Area Type Other
Jurisdiction KYTC Time Period PM Peak Hour Build
PHF 0.97
Intersection US 42 & Interstate 75 SB R Analysis Year 2040 Analysis Period 1> 7:00
File Name 5 PM US 42 & I75 SB Ramps.xus
Project Description Mall Rd Interchange PM
Demand Information EB WB NB SB
Approach Movement L T R L T R L T R L T R
Demand (v), veh/h 1600 400 400 1100 500 900
Signal Information
GreenYellowRed
14.5 82.8 45.0 0.0 0.0 0.03.5 4.1 3.5 0.0 0.0 0.03.0 1.6 2.0 0.0 0.0 0.0
1 2 3 4
5 6 7 8
Cycle, s 160.0 Reference Phase 2
Offset, s 0 Reference Point End
Uncoordinated No Simult. Gap E/W Off
Force Mode Fixed Simult. Gap N/S Off
Timer Results EBL EBT WBL WBT NBL NBT SBL SBT
Assigned Phase 5 2 1 6 0 4 4
Case Number 0.0 3.0 2.0 4.0 0.0 9.0 9.0
Phase Duration, s 0.0 139.0 21.0 160.0 0.0 50.5 50.5
Change Period, (Y+Rc), s 5.0 5.7 6.5 5.7 0.0 5.5 5.5
Max Allow Headway (MAH), s 0.0 0.0 4.6 0.0 0.0 4.7 4.7
Queue Clearance Time (gs), s 16.5 47.0 47.0
Green Extension Time (ge), s 0.0 0.0 0.0 0.0 0.0 0.0 0.0
Phase Call Probability 1.00 1.00 1.00
Max Out Probability 1.00 1.00 1.00
Movement Group Results EB WB NB SB
Approach Movement L T R L T R L T R L T R
Assigned Movement 5 2 12 1 6 16 3 8 18 7 4 14
Adjusted Flow Rate (v), veh/h 0 1649 412 412 1134 0 0 515 0 928
Adjusted Saturation Flow Rate (s), veh/h/ln 0 1630 1563 1757 1630 0 0 1689 0 1548
Queue Service time (gs ), s 0.0 77.2 27.7 14.5 14.0 0.0 0.0 20.7 45.0 45.0
Cycle Queue Clearance Time (gc), s 0.0 77.2 27.7 14.5 14.0 0.0 0.0 20.7 45.0 45.0
Capacity (c), veh/h 1687 809 159 2114 950 0 435
Volume-to-Capacity Ratio (X) 0.000 0.978 0.510 2.590 0.536 0.000 0.000 0.542 0.000 2.131
Available Capacity (ca), veh/h 1687 809 159 2114 950 0 435
Back of Queue (Q), veh/ln 27.7 10.7 38.9 3.4 8.8 79.8
Overflow Queue (Q3), veh/ln 0.0 0.0 0.0 0.0 0.0 0.0 0.0 0.0
Queue Storage Ratio (RQ) 0.0 0.0 0.0 0.0 0.0 0.0 0.0 0.0 0.0 0.0
Uniform Delay (d1), s/veh 23.9 25.3 72.8 4.7 48.8 0.0 57.5
Incremental Delay (d2), s/veh 0.0 17.3 2.3 733.5 1.0 0.0 0.0 0.7 0.0 516.5
Initial Queue Delay (d3), s/veh 0.0 0.0 0.0 0.0 0.0 0.0 0.0 0.0
Control Delay (d), s/veh 41.2 27.6 806.3 5.7 49.5 0.0 574.0
Level of Service (LOS) D C F A D F
Approach Delay, s/veh / LOS 38.5 D 219.2 F 0.0 386.7 F
Intersection Delay s/veh / LOS 193.3 F
MultiModal Results EB WB NB SB
Pedestrian LOS Score / LOS 0.7 A 1.9 A 2.9 C 2.9 C
Bicycle LOS Score / LOS 2.2 B 1.8 A F
Copyright © 2010 University of Florida, All Rights Reserved HCS 2010™ Version 6.1 Generated: 6/10/2013 10:06:46 AM

2010 HCS Signalized Intersection Results Summary
General Information Intersection Information
Agency Qk4 Duration, h 0.25
Analyst JJL Analysis Date Aug 27, 2012 Area Type Other
Jurisdiction KYTC Time Period AM Peak Hour Build
PHF 0.84
Intersection US 42 & Mall Rd Analysis Year 2040 Analysis Period 1> 7:00
File Name 6 AM US 42 & Mall Rd with added turn lane.xus
Project Description Mall Rd Interchange AM
Demand Information EB WB NB SB
Approach Movement L T R L T R L T R L T R
Demand (v), veh/h 300 1200 30 100 750 150 20 50 50 150 50 300
Signal Information
GreenYellowRed
10.6 4.9 65.9 31.5 14.9 0.03.5 3.5 4.2 3.5 3.5 0.03.0 3.0 2.0 3.0 3.0 0.0
1 2 3 4
5 6 7
Cycle, s 160.0 Reference Phase 2
Offset, s 0 Reference Point End
Uncoordinated No Simult. Gap E/W Off
Force Mode Fixed Simult. Gap N/S Off
Timer Results EBL EBT WBL WBT NBL NBT SBL SBT
Assigned Phase 5 2 1 6 8 8 4 4
Case Number 2.0 4.0 2.0 3.0 12.0 12.0 9.0 9.0
Phase Duration, s 28.5 121.5 17.1 110.1 21.4 21.4 38.0 38.0
Change Period, (Y+Rc), s 6.5 6.2 6.5 6.2 6.5 6.5 6.5 6.5
Max Allow Headway (MAH), s 4.6 0.0 4.6 0.0 4.6 4.6 4.7 4.7
Queue Clearance Time (gs), s 20.1 12.5 14.9 14.9 33.5 33.5
Green Extension Time (ge), s 1.9 0.0 0.0 0.0 0.0 0.0 0.0 0.0
Phase Call Probability 1.00 1.00 1.00 1.00 1.00 1.00
Max Out Probability 0.00 1.00 1.00 1.00 1.00 1.00
Movement Group Results EB WB NB SB
Approach Movement L T R L T R L T R L T R
Assigned Movement 5 2 12 1 6 16 3 8 18 7 4 14
Adjusted Flow Rate (v), veh/h 357 735 730 119 893 179 143 0 0 179 60 357
Adjusted Saturation Flow Rate (s), veh/h/ln 1541 1712 1697 1810 1712 1412 1754 0 0 1587 1900 1412
Queue Service time (gs ), s 18.1 57.1 57.7 10.5 28.8 13.6 12.9 0.0 0.0 16.3 4.2 31.5
Cycle Queue Clearance Time (gc), s 18.1 57.1 57.7 10.5 28.8 13.6 12.9 0.0 0.0 16.3 4.2 31.5
Capacity (c), veh/h 424 827 820 120 1410 582 163 313 374 278
Volume-to-Capacity Ratio (X) 0.842 0.888 0.890 0.991 0.633 0.307 0.876 0.000 0.000 0.571 0.159 1.284
Available Capacity (ca), veh/h 1207 827 820 120 1410 582 164 313 374 278
Back of Queue (Q), veh/ln 7.4 22.6 23.0 7.5 11.1 4.9 7.5 6.8 2.0 23.0
Overflow Queue (Q3), veh/ln 0.0 0.0 0.0 0.0 0.0 0.0 0.0 0.0 0.0 0.0 0.0 0.0
Queue Storage Ratio (RQ) 0.0 0.0 0.0 0.0 0.0 0.0 0.0 0.0 0.0 0.0 0.0 0.0
Uniform Delay (d1), s/veh 67.3 24.9 25.5 74.6 27.7 31.7 71.7 58.1 53.3 64.3
Incremental Delay (d2), s/veh 5.5 13.6 13.9 79.1 2.2 1.4 37.6 0.0 0.0 2.8 0.2 152.5
Initial Queue Delay (d3), s/veh 0.0 0.0 0.0 0.0 0.0 0.0 0.0 0.0 0.0 0.0 0.0 0.0
Control Delay (d), s/veh 72.7 38.5 39.4 153.8 29.9 33.0 109.2 60.9 53.5 216.7
Level of Service (LOS) E D D F C C F E D F
Approach Delay, s/veh / LOS 45.6 D 42.8 D 109.2 F 153.7 F
Intersection Delay s/veh / LOS 64.3 E
MultiModal Results EB WB NB SB
Pedestrian LOS Score / LOS 2.1 B 2.4 B 3.0 C 3.0 C
Bicycle LOS Score / LOS 2.0 A 1.5 A 0.7 A 1.5 A
Copyright © 2010 University of Florida, All Rights Reserved HCS 2010™ Version 6.1 Generated: 12/31/2012 9:27:49 AM

2010 HCS Signalized Intersection Results Summary
General Information Intersection Information
Agency Qk4 Duration, h 0.25
Analyst JJL Analysis Date Aug 27, 2012 Area Type Other
Jurisdiction KYTC Time Period AM Peak Hour Build
PHF 0.84
Intersection US 42 & Mall Rd Analysis Year 2040 Analysis Period 1> 7:00
File Name 6 AM US 42 & Mall Rd.xus
Project Description Mall Rd Interchange AM
Demand Information EB WB NB SB
Approach Movement L T R L T R L T R L T R
Demand (v), veh/h 300 1200 30 100 750 150 20 50 50 150 50 300
Signal Information
GreenYellowRed
10.6 21.7 49.1 31.5 14.9 0.03.5 3.5 4.2 3.5 3.5 0.03.0 3.0 2.0 3.0 3.0 0.0
1 2 3 4
5 6 7
Cycle, s 160.0 Reference Phase 2
Offset, s 0 Reference Point End
Uncoordinated No Simult. Gap E/W Off
Force Mode Fixed Simult. Gap N/S Off
Timer Results EBL EBT WBL WBT NBL NBT SBL SBT
Assigned Phase 5 2 1 6 8 8 4 4
Case Number 2.0 4.0 2.0 3.0 12.0 12.0 9.0 9.0
Phase Duration, s 45.3 121.5 17.1 93.3 21.4 21.4 38.0 38.0
Change Period, (Y+Rc), s 6.5 6.2 6.5 6.2 6.5 6.5 6.5 6.5
Max Allow Headway (MAH), s 4.6 0.0 4.6 0.0 4.6 4.6 4.7 4.7
Queue Clearance Time (gs), s 37.2 12.5 14.9 14.9 33.5 33.5
Green Extension Time (ge), s 1.7 0.0 0.0 0.0 0.0 0.0 0.0 0.0
Phase Call Probability 1.00 1.00 1.00 1.00 1.00 1.00
Max Out Probability 0.00 1.00 1.00 1.00 1.00 1.00
Movement Group Results EB WB NB SB
Approach Movement L T R L T R L T R L T R
Assigned Movement 5 2 12 1 6 16 3 8 18 7 4 14
Adjusted Flow Rate (v), veh/h 357 735 730 119 893 179 143 0 0 179 60 357
Adjusted Saturation Flow Rate (s), veh/h/ln 1587 1712 1697 1810 1712 1412 1754 0 0 1587 1900 1412
Queue Service time (gs ), s 35.2 57.1 57.7 10.5 37.8 16.1 12.9 0.0 0.0 16.3 4.2 31.5
Cycle Queue Clearance Time (gc), s 35.2 57.1 57.7 10.5 37.8 16.1 12.9 0.0 0.0 16.3 4.2 31.5
Capacity (c), veh/h 385 827 820 120 1050 433 163 313 374 278
Volume-to-Capacity Ratio (X) 0.927 0.888 0.890 0.991 0.850 0.412 0.876 0.000 0.000 0.571 0.159 1.284
Available Capacity (ca), veh/h 621 827 820 120 1050 433 164 313 374 278
Back of Queue (Q), veh/ln 15.6 22.6 23.0 7.5 16.2 6.0 7.5 6.8 2.0 23.0
Overflow Queue (Q3), veh/ln 0.0 0.0 0.0 0.0 0.0 0.0 0.0 0.0 0.0 0.0 0.0 0.0
Queue Storage Ratio (RQ) 0.0 0.0 0.0 0.0 0.0 0.0 0.0 0.0 0.0 0.0 0.0 0.0
Uniform Delay (d1), s/veh 59.2 24.9 25.5 74.6 43.9 44.0 71.7 58.1 53.3 64.3
Incremental Delay (d2), s/veh 15.1 13.6 13.9 79.1 8.6 2.9 37.6 0.0 0.0 2.8 0.2 152.5
Initial Queue Delay (d3), s/veh 0.0 0.0 0.0 0.0 0.0 0.0 0.0 0.0 0.0 0.0 0.0 0.0
Control Delay (d), s/veh 74.3 38.5 39.4 153.8 52.6 46.9 109.2 60.9 53.5 216.7
Level of Service (LOS) E D D F D D F E D F
Approach Delay, s/veh / LOS 45.9 D 61.8 E 109.2 F 153.7 F
Intersection Delay s/veh / LOS 70.5 E
MultiModal Results EB WB NB SB
Pedestrian LOS Score / LOS 2.1 B 2.5 B 3.0 C 2.9 C
Bicycle LOS Score / LOS 2.0 A 1.5 A 0.7 A 1.5 A
Copyright © 2010 University of Florida, All Rights Reserved HCS 2010™ Version 6.1 Generated: 12/20/2012 9:20:21 AM
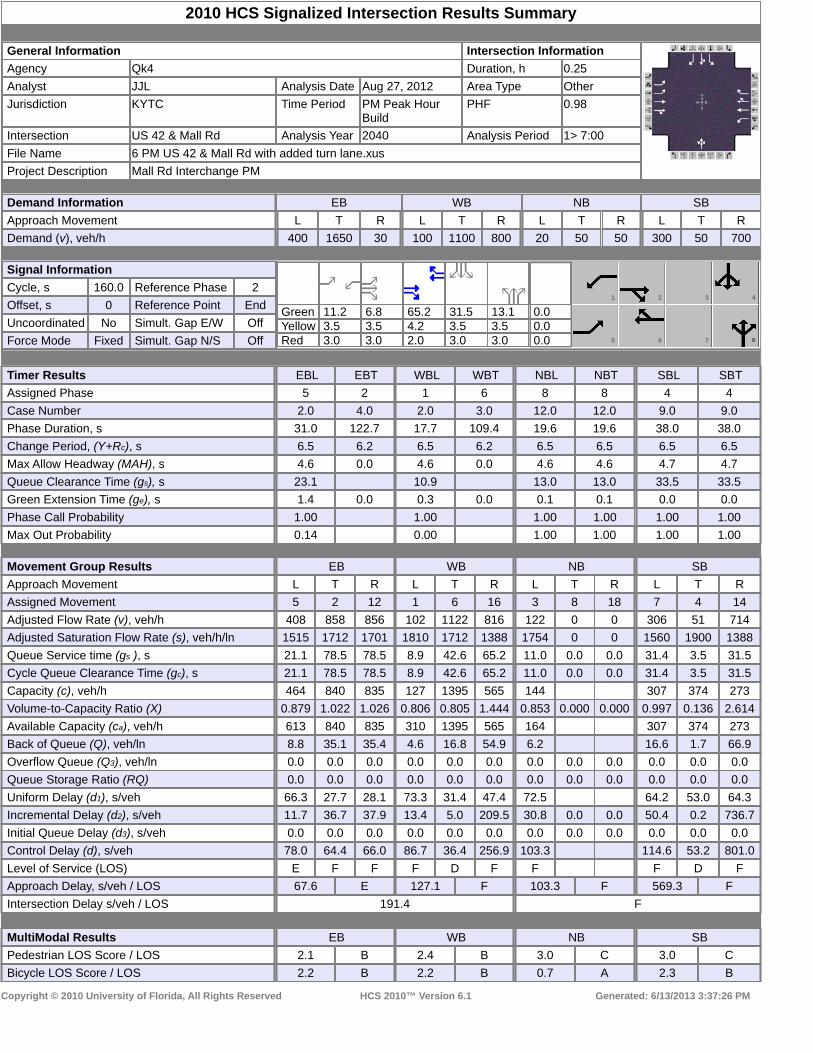
2010 HCS Signalized Intersection Results Summary
General Information Intersection Information
Agency Qk4 Duration, h 0.25
Analyst JJL Analysis Date Aug 27, 2012 Area Type Other
Jurisdiction KYTC Time Period PM Peak Hour Build
PHF 0.98
Intersection US 42 & Mall Rd Analysis Year 2040 Analysis Period 1> 7:00
File Name 6 PM US 42 & Mall Rd with added turn lane.xus
Project Description Mall Rd Interchange PM
Demand Information EB WB NB SB
Approach Movement L T R L T R L T R L T R
Demand (v), veh/h 400 1650 30 100 1100 800 20 50 50 300 50 700
Signal Information
GreenYellowRed
11.2 6.8 65.2 31.5 13.1 0.03.5 3.5 4.2 3.5 3.5 0.03.0 3.0 2.0 3.0 3.0 0.0
1 2 3 4
5 6 7
Cycle, s 160.0 Reference Phase 2
Offset, s 0 Reference Point End
Uncoordinated No Simult. Gap E/W Off
Force Mode Fixed Simult. Gap N/S Off
Timer Results EBL EBT WBL WBT NBL NBT SBL SBT
Assigned Phase 5 2 1 6 8 8 4 4
Case Number 2.0 4.0 2.0 3.0 12.0 12.0 9.0 9.0
Phase Duration, s 31.0 122.7 17.7 109.4 19.6 19.6 38.0 38.0
Change Period, (Y+Rc), s 6.5 6.2 6.5 6.2 6.5 6.5 6.5 6.5
Max Allow Headway (MAH), s 4.6 0.0 4.6 0.0 4.6 4.6 4.7 4.7
Queue Clearance Time (gs), s 23.1 10.9 13.0 13.0 33.5 33.5
Green Extension Time (ge), s 1.4 0.0 0.3 0.0 0.1 0.1 0.0 0.0
Phase Call Probability 1.00 1.00 1.00 1.00 1.00 1.00
Max Out Probability 0.14 0.00 1.00 1.00 1.00 1.00
Movement Group Results EB WB NB SB
Approach Movement L T R L T R L T R L T R
Assigned Movement 5 2 12 1 6 16 3 8 18 7 4 14
Adjusted Flow Rate (v), veh/h 408 858 856 102 1122 816 122 0 0 306 51 714
Adjusted Saturation Flow Rate (s), veh/h/ln 1515 1712 1701 1810 1712 1388 1754 0 0 1560 1900 1388
Queue Service time (gs ), s 21.1 78.5 78.5 8.9 42.6 65.2 11.0 0.0 0.0 31.4 3.5 31.5
Cycle Queue Clearance Time (gc), s 21.1 78.5 78.5 8.9 42.6 65.2 11.0 0.0 0.0 31.4 3.5 31.5
Capacity (c), veh/h 464 840 835 127 1395 565 144 307 374 273
Volume-to-Capacity Ratio (X) 0.879 1.022 1.026 0.806 0.805 1.444 0.853 0.000 0.000 0.997 0.136 2.614
Available Capacity (ca), veh/h 613 840 835 310 1395 565 164 307 374 273
Back of Queue (Q), veh/ln 8.8 35.1 35.4 4.6 16.8 54.9 6.2 16.6 1.7 66.9
Overflow Queue (Q3), veh/ln 0.0 0.0 0.0 0.0 0.0 0.0 0.0 0.0 0.0 0.0 0.0 0.0
Queue Storage Ratio (RQ) 0.0 0.0 0.0 0.0 0.0 0.0 0.0 0.0 0.0 0.0 0.0 0.0
Uniform Delay (d1), s/veh 66.3 27.7 28.1 73.3 31.4 47.4 72.5 64.2 53.0 64.3
Incremental Delay (d2), s/veh 11.7 36.7 37.9 13.4 5.0 209.5 30.8 0.0 0.0 50.4 0.2 736.7
Initial Queue Delay (d3), s/veh 0.0 0.0 0.0 0.0 0.0 0.0 0.0 0.0 0.0 0.0 0.0 0.0
Control Delay (d), s/veh 78.0 64.4 66.0 86.7 36.4 256.9 103.3 114.6 53.2 801.0
Level of Service (LOS) E F F F D F F F D F
Approach Delay, s/veh / LOS 67.6 E 127.1 F 103.3 F 569.3 F
Intersection Delay s/veh / LOS 191.4 F
MultiModal Results EB WB NB SB
Pedestrian LOS Score / LOS 2.1 B 2.4 B 3.0 C 3.0 C
Bicycle LOS Score / LOS 2.2 B 2.2 B 0.7 A 2.3 B
Copyright © 2010 University of Florida, All Rights Reserved HCS 2010™ Version 6.1 Generated: 6/13/2013 3:37:26 PM

2010 HCS Signalized Intersection Results Summary
General Information Intersection Information
Agency Qk4 Duration, h 0.25
Analyst JJL Analysis Date Aug 27, 2012 Area Type Other
Jurisdiction KYTC Time Period PM Peak Hour Build
PHF 0.98
Intersection US 42 & Mall Rd Analysis Year 2040 Analysis Period 1> 7:00
File Name 6 PM US 42 & Mall Rd.xus
Project Description Mall Rd Interchange PM
Demand Information EB WB NB SB
Approach Movement L T R L T R L T R L T R
Demand (v), veh/h 400 1650 30 100 1100 800 20 50 50 300 50 700
Signal Information
GreenYellowRed
11.2 14.7 57.3 31.5 13.1 0.03.5 3.5 4.2 3.5 3.5 0.03.0 3.0 2.0 3.0 3.0 0.0
1 2 3 4
5 6 7
Cycle, s 160.0 Reference Phase 2
Offset, s 0 Reference Point End
Uncoordinated No Simult. Gap E/W Off
Force Mode Fixed Simult. Gap N/S Off
Timer Results EBL EBT WBL WBT NBL NBT SBL SBT
Assigned Phase 5 2 1 6 8 8 4 4
Case Number 2.0 4.0 2.0 3.0 12.0 12.0 9.0 9.0
Phase Duration, s 38.9 122.7 17.7 101.5 19.6 19.6 38.0 38.0
Change Period, (Y+Rc), s 6.5 6.2 6.5 6.2 6.5 6.5 6.5 6.5
Max Allow Headway (MAH), s 4.6 0.0 4.6 0.0 4.6 4.6 4.7 4.7
Queue Clearance Time (gs), s 34.4 10.9 13.0 13.0 33.5 33.5
Green Extension Time (ge), s 0.0 0.0 0.3 0.0 0.1 0.1 0.0 0.0
Phase Call Probability 1.00 1.00 1.00 1.00 1.00 1.00
Max Out Probability 1.00 0.00 1.00 1.00 1.00 1.00
Movement Group Results EB WB NB SB
Approach Movement L T R L T R L T R L T R
Assigned Movement 5 2 12 1 6 16 3 8 18 7 4 14
Adjusted Flow Rate (v), veh/h 408 858 856 102 1122 816 122 0 0 306 51 714
Adjusted Saturation Flow Rate (s), veh/h/ln 1560 1712 1701 1810 1712 1388 1754 0 0 1560 1900 1388
Queue Service time (gs ), s 32.4 78.5 78.5 8.9 48.7 57.3 11.0 0.0 0.0 31.4 3.5 31.5
Cycle Queue Clearance Time (gc), s 32.4 78.5 78.5 8.9 48.7 57.3 11.0 0.0 0.0 31.4 3.5 31.5
Capacity (c), veh/h 316 840 835 127 1226 497 144 307 374 273
Volume-to-Capacity Ratio (X) 1.292 1.022 1.026 0.806 0.916 1.642 0.853 0.000 0.000 0.997 0.136 2.614
Available Capacity (ca), veh/h 316 840 835 310 1226 497 164 307 374 273
Back of Queue (Q), veh/ln 26.2 35.1 35.4 4.6 20.8 60.7 6.2 16.6 1.7 66.9
Overflow Queue (Q3), veh/ln 0.0 0.0 0.0 0.0 0.0 0.0 0.0 0.0 0.0 0.0 0.0 0.0
Queue Storage Ratio (RQ) 0.0 0.0 0.0 0.0 0.0 0.0 0.0 0.0 0.0 0.0 0.0 0.0
Uniform Delay (d1), s/veh 63.8 27.7 28.1 73.3 39.6 51.3 72.5 64.2 53.0 64.3
Incremental Delay (d2), s/veh 153.1 36.7 37.9 13.4 12.1 297.9 30.8 0.0 0.0 50.4 0.2 736.7
Initial Queue Delay (d3), s/veh 0.0 0.0 0.0 0.0 0.0 0.0 0.0 0.0 0.0 0.0 0.0 0.0
Control Delay (d), s/veh 216.9 64.4 66.0 86.7 51.6 349.3 103.3 114.6 53.2 801.0
Level of Service (LOS) F F F F D F F F D F
Approach Delay, s/veh / LOS 94.4 F 172.4 F 103.3 F 569.3 F
Intersection Delay s/veh / LOS 219.3 F
MultiModal Results EB WB NB SB
Pedestrian LOS Score / LOS 2.1 B 2.5 B 3.0 C 2.9 C
Bicycle LOS Score / LOS 2.2 B 2.2 B 0.7 A 2.3 B
Copyright © 2010 University of Florida, All Rights Reserved HCS 2010™ Version 6.1 Generated: 6/13/2013 3:39:02 PM

2010 HCS Signalized Intersection Results Summary
General Information Intersection Information
Agency Qk4 Duration, h 0.25
Analyst JJL Analysis Date Aug 24, 2012 Area Type Other
Jurisdiction KYTC Time Period AM Peak Hour Build
PHF 0.84
Intersection Mall Rd & I 75 Ramps Analysis Year 2040 Analysis Period 1> 7:00
File Name 7 AM Mall Rd & I-75 Ramps.xus
Project Description Mall Rd Interchange Existing AM
Demand Information EB WB NB SB
Approach Movement L T R L T R L T R L T R
Demand (v), veh/h 100 100 150 10 340 350 150 200 10
Signal Information
GreenYellowRed
6.0 2.9 71.1 21.4 0.0 0.03.5 0.0 4.4 4.0 0.0 0.03.0 0.0 1.8 1.9 0.0 0.0
1 3 4
6 7 8
Cycle, s 120.0 Reference Phase 2
Offset, s 0 Reference Point End
Uncoordinated No Simult. Gap E/W On
Force Mode Fixed Simult. Gap N/S On
Timer Results EBL EBT WBL WBT NBL NBT SBL SBT
Assigned Phase 7 8 8 5 2 1 6
Case Number 0.0 9.0 9.0 2.0 3.0 2.0 4.0
Phase Duration, s 0.0 27.3 27.3 12.5 104.6 15.4 107.5
Change Period, (Y+Rc), s 5.0 5.9 5.9 6.5 6.2 6.5 6.2
Max Allow Headway (MAH), s 0.0 6.2 6.2 4.1 0.0 4.1 0.0
Queue Clearance Time (gs), s 18.0 18.0 2.9 8.3
Green Extension Time (ge), s 0.0 3.4 3.4 0.0 0.0 0.7 0.0
Phase Call Probability 1.00 1.00 1.00 1.00
Max Out Probability 0.03 0.03 0.00 0.00
Movement Group Results EB WB NB SB
Approach Movement L T R L T R L T R L T R
Assigned Movement 7 4 14 3 8 18 5 2 12 1 6 16
Adjusted Flow Rate (v), veh/h 0 119 119 179 12 405 417 179 125 125
Adjusted Saturation Flow Rate (s), veh/h/ln 0 1436 1508 1278 1587 1587 1533 1673 1667 1638
Queue Service time (gs ), s 0.0 8.9 4.1 16.0 0.9 3.9 18.3 6.3 1.8 2.0
Cycle Queue Clearance Time (gc), s 0.0 8.9 4.1 16.0 0.9 3.9 18.3 6.3 1.8 2.0
Capacity (c), veh/h 256 538 228 79 1879 908 249 1028 1010
Volume-to-Capacity Ratio (X) 0.000 0.464 0.221 0.783 0.150 0.215 0.459 0.718 0.122 0.123
Available Capacity (ca), veh/h 479 1005 426 697 1879 908 884 1028 1010
Back of Queue (Q), veh/ln 3.3 1.5 5.8 0.4 1.2 6.4 2.7 0.7 0.7
Overflow Queue (Q3), veh/ln 0.0 0.0 0.0 0.0 0.0 0.0 0.0 0.0 0.0
Queue Storage Ratio (RQ) 0.0 0.0 0.0 0.0 0.0 0.0 0.0 0.0 0.0 0.0
Uniform Delay (d1), s/veh 44.2 42.2 47.1 54.6 5.6 13.7 54.3 4.3 4.7
Incremental Delay (d2), s/veh 0.0 2.8 0.4 11.8 0.9 0.3 1.7 3.9 0.2 0.3
Initial Queue Delay (d3), s/veh 0.0 0.0 0.0 0.0 0.0 0.0 0.0 0.0 0.0
Control Delay (d), s/veh 46.9 42.6 58.8 55.4 5.8 15.4 58.2 4.5 5.0
Level of Service (LOS) D D E E A B E A A
Approach Delay, s/veh / LOS 0.0 50.8 D 11.3 B 27.0 C
Intersection Delay s/veh / LOS 25.1 C
MultiModal Results EB WB NB SB
Pedestrian LOS Score / LOS 3.0 C 3.0 C 2.1 B 2.4 B
Bicycle LOS Score / LOS 0.8 A 1.2 A 0.8 A
Copyright © 2010 University of Florida, All Rights Reserved HCS 2010™ Version 6.1 Generated: 12/20/2012 9:21:07 AM
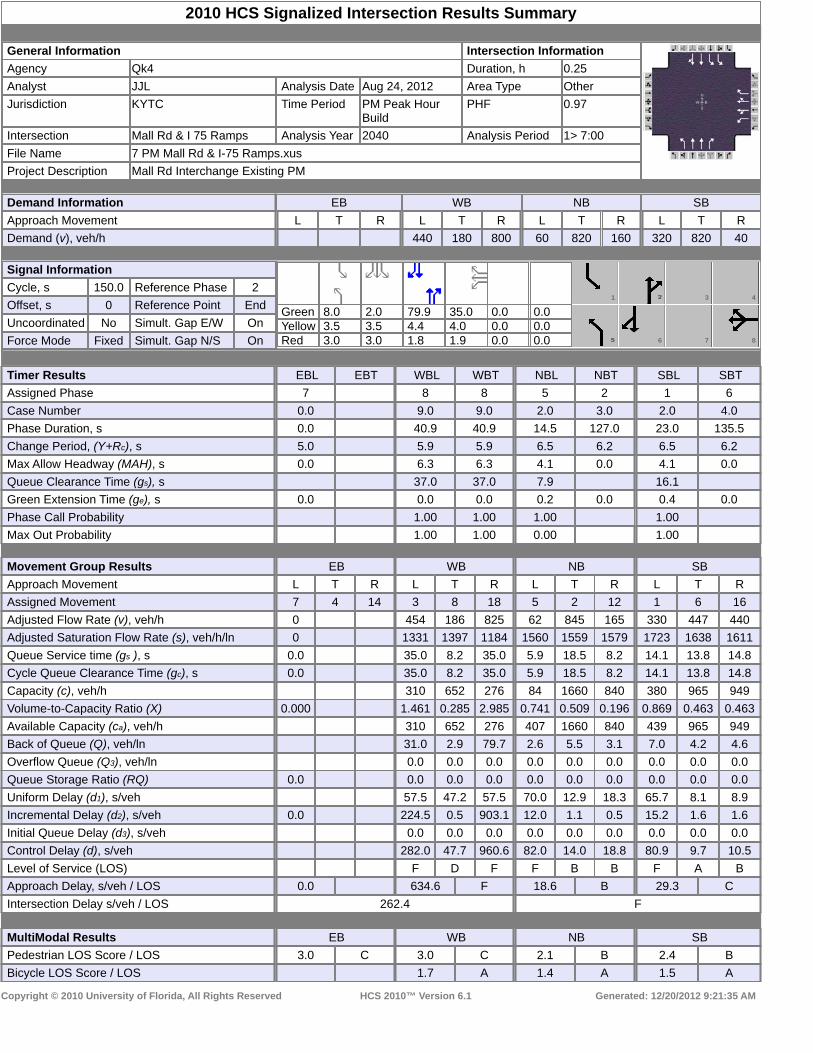
2010 HCS Signalized Intersection Results Summary
General Information Intersection Information
Agency Qk4 Duration, h 0.25
Analyst JJL Analysis Date Aug 24, 2012 Area Type Other
Jurisdiction KYTC Time Period PM Peak Hour Build
PHF 0.97
Intersection Mall Rd & I 75 Ramps Analysis Year 2040 Analysis Period 1> 7:00
File Name 7 PM Mall Rd & I-75 Ramps.xus
Project Description Mall Rd Interchange Existing PM
Demand Information EB WB NB SB
Approach Movement L T R L T R L T R L T R
Demand (v), veh/h 440 180 800 60 820 160 320 820 40
Signal Information
GreenYellowRed
8.0 2.0 79.9 35.0 0.0 0.03.5 3.5 4.4 4.0 0.0 0.03.0 3.0 1.8 1.9 0.0 0.0
1 3 4
6 7 8
Cycle, s 150.0 Reference Phase 2
Offset, s 0 Reference Point End
Uncoordinated No Simult. Gap E/W On
Force Mode Fixed Simult. Gap N/S On
Timer Results EBL EBT WBL WBT NBL NBT SBL SBT
Assigned Phase 7 8 8 5 2 1 6
Case Number 0.0 9.0 9.0 2.0 3.0 2.0 4.0
Phase Duration, s 0.0 40.9 40.9 14.5 127.0 23.0 135.5
Change Period, (Y+Rc), s 5.0 5.9 5.9 6.5 6.2 6.5 6.2
Max Allow Headway (MAH), s 0.0 6.3 6.3 4.1 0.0 4.1 0.0
Queue Clearance Time (gs), s 37.0 37.0 7.9 16.1
Green Extension Time (ge), s 0.0 0.0 0.0 0.2 0.0 0.4 0.0
Phase Call Probability 1.00 1.00 1.00 1.00
Max Out Probability 1.00 1.00 0.00 1.00
Movement Group Results EB WB NB SB
Approach Movement L T R L T R L T R L T R
Assigned Movement 7 4 14 3 8 18 5 2 12 1 6 16
Adjusted Flow Rate (v), veh/h 0 454 186 825 62 845 165 330 447 440
Adjusted Saturation Flow Rate (s), veh/h/ln 0 1331 1397 1184 1560 1559 1579 1723 1638 1611
Queue Service time (gs ), s 0.0 35.0 8.2 35.0 5.9 18.5 8.2 14.1 13.8 14.8
Cycle Queue Clearance Time (gc), s 0.0 35.0 8.2 35.0 5.9 18.5 8.2 14.1 13.8 14.8
Capacity (c), veh/h 310 652 276 84 1660 840 380 965 949
Volume-to-Capacity Ratio (X) 0.000 1.461 0.285 2.985 0.741 0.509 0.196 0.869 0.463 0.463
Available Capacity (ca), veh/h 310 652 276 407 1660 840 439 965 949
Back of Queue (Q), veh/ln 31.0 2.9 79.7 2.6 5.5 3.1 7.0 4.2 4.6
Overflow Queue (Q3), veh/ln 0.0 0.0 0.0 0.0 0.0 0.0 0.0 0.0 0.0
Queue Storage Ratio (RQ) 0.0 0.0 0.0 0.0 0.0 0.0 0.0 0.0 0.0 0.0
Uniform Delay (d1), s/veh 57.5 47.2 57.5 70.0 12.9 18.3 65.7 8.1 8.9
Incremental Delay (d2), s/veh 0.0 224.5 0.5 903.1 12.0 1.1 0.5 15.2 1.6 1.6
Initial Queue Delay (d3), s/veh 0.0 0.0 0.0 0.0 0.0 0.0 0.0 0.0 0.0
Control Delay (d), s/veh 282.0 47.7 960.6 82.0 14.0 18.8 80.9 9.7 10.5
Level of Service (LOS) F D F F B B F A B
Approach Delay, s/veh / LOS 0.0 634.6 F 18.6 B 29.3 C
Intersection Delay s/veh / LOS 262.4 F
MultiModal Results EB WB NB SB
Pedestrian LOS Score / LOS 3.0 C 3.0 C 2.1 B 2.4 B
Bicycle LOS Score / LOS 1.7 A 1.4 A 1.5 A
Copyright © 2010 University of Florida, All Rights Reserved HCS 2010™ Version 6.1 Generated: 12/20/2012 9:21:35 AM
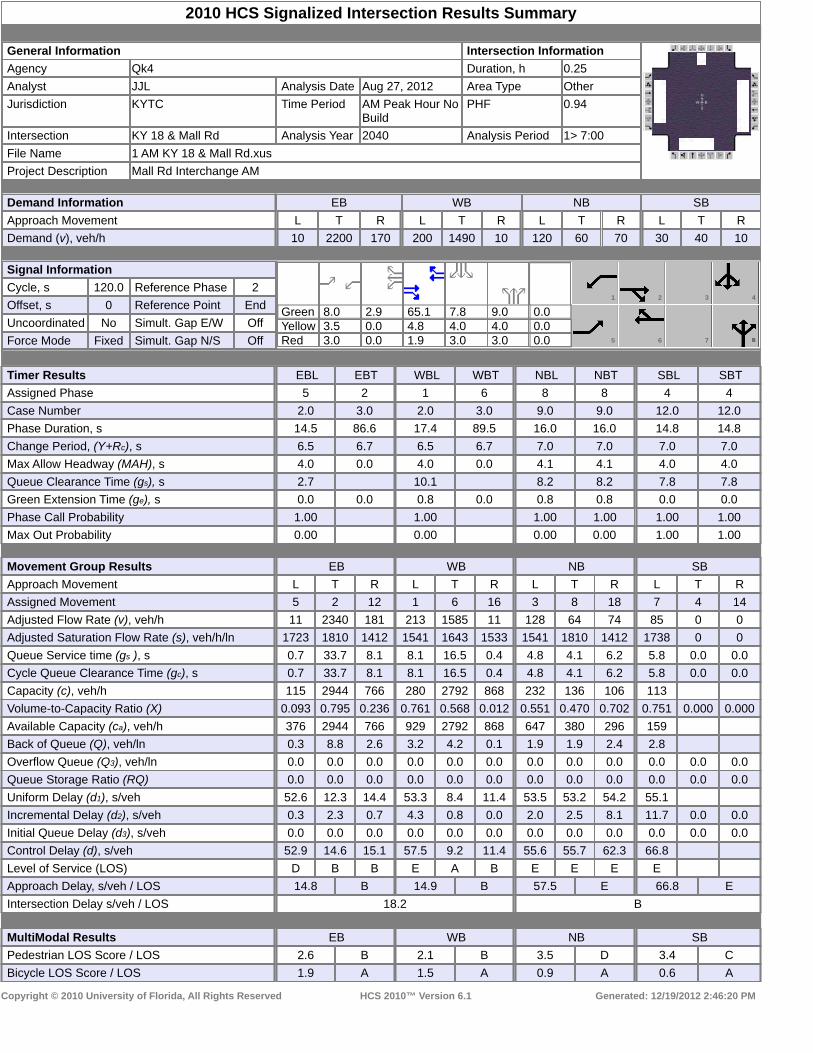
2010 HCS Signalized Intersection Results Summary
General Information Intersection Information
Agency Qk4 Duration, h 0.25
Analyst JJL Analysis Date Aug 27, 2012 Area Type Other
Jurisdiction KYTC Time Period AM Peak Hour No Build
PHF 0.94
Intersection KY 18 & Mall Rd Analysis Year 2040 Analysis Period 1> 7:00
File Name 1 AM KY 18 & Mall Rd.xus
Project Description Mall Rd Interchange AM
Demand Information EB WB NB SB
Approach Movement L T R L T R L T R L T R
Demand (v), veh/h 10 2200 170 200 1490 10 120 60 70 30 40 10
Signal Information
GreenYellowRed
8.0 2.9 65.1 7.8 9.0 0.03.5 0.0 4.8 4.0 4.0 0.03.0 0.0 1.9 3.0 3.0 0.0
1 2 3 4
5 6 7
Cycle, s 120.0 Reference Phase 2
Offset, s 0 Reference Point End
Uncoordinated No Simult. Gap E/W Off
Force Mode Fixed Simult. Gap N/S Off
Timer Results EBL EBT WBL WBT NBL NBT SBL SBT
Assigned Phase 5 2 1 6 8 8 4 4
Case Number 2.0 3.0 2.0 3.0 9.0 9.0 12.0 12.0
Phase Duration, s 14.5 86.6 17.4 89.5 16.0 16.0 14.8 14.8
Change Period, (Y+Rc), s 6.5 6.7 6.5 6.7 7.0 7.0 7.0 7.0
Max Allow Headway (MAH), s 4.0 0.0 4.0 0.0 4.1 4.1 4.0 4.0
Queue Clearance Time (gs), s 2.7 10.1 8.2 8.2 7.8 7.8
Green Extension Time (ge), s 0.0 0.0 0.8 0.0 0.8 0.8 0.0 0.0
Phase Call Probability 1.00 1.00 1.00 1.00 1.00 1.00
Max Out Probability 0.00 0.00 0.00 0.00 1.00 1.00
Movement Group Results EB WB NB SB
Approach Movement L T R L T R L T R L T R
Assigned Movement 5 2 12 1 6 16 3 8 18 7 4 14
Adjusted Flow Rate (v), veh/h 11 2340 181 213 1585 11 128 64 74 85 0 0
Adjusted Saturation Flow Rate (s), veh/h/ln 1723 1810 1412 1541 1643 1533 1541 1810 1412 1738 0 0
Queue Service time (gs ), s 0.7 33.7 8.1 8.1 16.5 0.4 4.8 4.1 6.2 5.8 0.0 0.0
Cycle Queue Clearance Time (gc), s 0.7 33.7 8.1 8.1 16.5 0.4 4.8 4.1 6.2 5.8 0.0 0.0
Capacity (c), veh/h 115 2944 766 280 2792 868 232 136 106 113
Volume-to-Capacity Ratio (X) 0.093 0.795 0.236 0.761 0.568 0.012 0.551 0.470 0.702 0.751 0.000 0.000
Available Capacity (ca), veh/h 376 2944 766 929 2792 868 647 380 296 159
Back of Queue (Q), veh/ln 0.3 8.8 2.6 3.2 4.2 0.1 1.9 1.9 2.4 2.8
Overflow Queue (Q3), veh/ln 0.0 0.0 0.0 0.0 0.0 0.0 0.0 0.0 0.0 0.0 0.0 0.0
Queue Storage Ratio (RQ) 0.0 0.0 0.0 0.0 0.0 0.0 0.0 0.0 0.0 0.0 0.0 0.0
Uniform Delay (d1), s/veh 52.6 12.3 14.4 53.3 8.4 11.4 53.5 53.2 54.2 55.1
Incremental Delay (d2), s/veh 0.3 2.3 0.7 4.3 0.8 0.0 2.0 2.5 8.1 11.7 0.0 0.0
Initial Queue Delay (d3), s/veh 0.0 0.0 0.0 0.0 0.0 0.0 0.0 0.0 0.0 0.0 0.0 0.0
Control Delay (d), s/veh 52.9 14.6 15.1 57.5 9.2 11.4 55.6 55.7 62.3 66.8
Level of Service (LOS) D B B E A B E E E E
Approach Delay, s/veh / LOS 14.8 B 14.9 B 57.5 E 66.8 E
Intersection Delay s/veh / LOS 18.2 B
MultiModal Results EB WB NB SB
Pedestrian LOS Score / LOS 2.6 B 2.1 B 3.5 D 3.4 C
Bicycle LOS Score / LOS 1.9 A 1.5 A 0.9 A 0.6 A
Copyright © 2010 University of Florida, All Rights Reserved HCS 2010™ Version 6.1 Generated: 12/19/2012 2:46:20 PM

2010 HCS Signalized Intersection Results Summary
General Information Intersection Information
Agency Qk4 Duration, h 0.25
Analyst JJL Analysis Date Aug 27, 2012 Area Type Other
Jurisdiction KYTC Time Period PM Peak Hour No Build
PHF 0.94
Intersection KY 18 & Mall Rd Analysis Year 2040 Analysis Period 1> 7:00
File Name 1 PM KY 18 & Mall Rd.xus
Project Description Mall Rd Interchange PM
Demand Information EB WB NB SB
Approach Movement L T R L T R L T R L T R
Demand (v), veh/h 50 2350 800 600 2200 200 650 110 300 150 140 50
Signal Information
GreenYellowRed
8.0 10.5 44.8 20.0 33.0 0.03.5 3.5 4.8 4.0 4.0 0.03.0 3.0 1.9 3.0 3.0 0.0
1 2 3 4
5 6 7
Cycle, s 150.0 Reference Phase 2
Offset, s 0 Reference Point End
Uncoordinated No Simult. Gap E/W Off
Force Mode Fixed Simult. Gap N/S Off
Timer Results EBL EBT WBL WBT NBL NBT SBL SBT
Assigned Phase 5 2 1 6 8 8 4 4
Case Number 2.0 3.0 2.0 3.0 9.0 9.0 12.0 12.0
Phase Duration, s 14.5 78.5 31.5 95.5 40.0 40.0 27.0 27.0
Change Period, (Y+Rc), s 6.5 6.7 6.5 6.7 7.0 7.0 7.0 7.0
Max Allow Headway (MAH), s 4.0 0.0 4.0 0.0 4.1 4.1 4.0 4.0
Queue Clearance Time (gs), s 6.5 27.0 35.0 35.0 22.0 22.0
Green Extension Time (ge), s 0.0 0.0 0.0 0.0 0.0 0.0 0.0 0.0
Phase Call Probability 1.00 1.00 1.00 1.00 1.00 1.00
Max Out Probability 0.16 1.00 1.00 1.00 1.00 1.00
Movement Group Results EB WB NB SB
Approach Movement L T R L T R L T R L T R
Assigned Movement 5 2 12 1 6 16 3 8 18 7 4 14
Adjusted Flow Rate (v), veh/h 53 2500 851 638 2340 213 691 117 319 362 0 0
Adjusted Saturation Flow Rate (s), veh/h/ln 1723 1810 1388 1515 1643 1533 1515 1810 1388 1726 0 0
Queue Service time (gs ), s 4.5 44.8 44.8 25.0 61.8 14.2 33.0 8.1 33.0 20.0 0.0 0.0
Cycle Queue Clearance Time (gc), s 4.5 44.8 44.8 25.0 61.8 14.2 33.0 8.1 33.0 20.0 0.0 0.0
Capacity (c), veh/h 92 1621 415 505 2031 632 666 398 305 230
Volume-to-Capacity Ratio (X) 0.579 1.542 2.053 1.264 1.152 0.337 1.038 0.294 1.045 1.572 0.000 0.000
Available Capacity (ca), veh/h 138 1621 415 505 2031 632 666 398 305 230
Back of Queue (Q), veh/ln 2.1 55.3 70.7 18.8 35.1 5.4 16.5 3.7 16.7 26.4
Overflow Queue (Q3), veh/ln 0.0 0.0 0.0 0.0 0.0 0.0 0.0 0.0 0.0 0.0 0.0 0.0
Queue Storage Ratio (RQ) 0.0 0.0 0.0 0.0 0.0 0.0 0.0 0.0 0.0 0.0 0.0 0.0
Uniform Delay (d1), s/veh 69.4 45.1 52.6 62.5 33.8 30.1 58.5 48.8 58.5 65.0
Incremental Delay (d2), s/veh 5.6 247.0 482.1 134.0 74.8 1.4 44.9 0.4 63.8 277.3 0.0 0.0
Initial Queue Delay (d3), s/veh 0.0 0.0 0.0 0.0 0.0 0.0 0.0 0.0 0.0 0.0 0.0 0.0
Control Delay (d), s/veh 75.0 292.1 534.7 196.5 108.6 31.5 103.4 49.2 122.3 342.3
Level of Service (LOS) E F F F F C F D F F
Approach Delay, s/veh / LOS 349.4 F 121.0 F 103.1 F 342.3 F
Intersection Delay s/veh / LOS 224.6 F
MultiModal Results EB WB NB SB
Pedestrian LOS Score / LOS 2.6 B 2.1 B 3.5 D 3.4 C
Bicycle LOS Score / LOS 2.4 B 2.2 B 2.3 B 1.1 A
Copyright © 2010 University of Florida, All Rights Reserved HCS 2010™ Version 6.1 Generated: 6/10/2013 9:45:32 AM

2010 HCS Signalized Intersection Results Summary
General Information Intersection Information
Agency Qk4 Duration, h 0.25
Analyst JJL Analysis Date Aug 27, 2012 Area Type Other
Jurisdiction KYTC Time Period AM Peak Hour No Build
PHF 0.93
Intersection KY 18 & Interstate 75 SB R Analysis Year 2040 Analysis Period 1> 7:00
File Name 2 AM KY 18 & I 75 SB Ramps.xus
Project Description Mall Rd Interchange AM
Demand Information EB WB NB SB
Approach Movement L T R L T R L T R L T R
Demand (v), veh/h 2000 300 200 1000 300 0 700
Signal Information
GreenYellowRed
18.8 57.4 24.5 0.0 0.0 0.03.5 4.8 4.4 0.0 0.0 0.03.0 1.7 1.9 0.0 0.0 0.0
1 2 3 4
5 6 7 8
Cycle, s 120.0 Reference Phase 2
Offset, s 0 Reference Point End
Uncoordinated No Simult. Gap E/W Off
Force Mode Fixed Simult. Gap N/S Off
Timer Results EBL EBT WBL WBT NBL NBT SBL SBT
Assigned Phase 5 2 1 6 0 4 4
Case Number 0.0 3.0 2.0 4.0 0.0 9.0 9.0
Phase Duration, s 0.0 94.7 25.3 120.0 0.0 30.8 30.8
Change Period, (Y+Rc), s 6.5 6.5 6.5 6.5 0.0 6.3 6.3
Max Allow Headway (MAH), s 0.0 0.0 4.0 0.0 0.0 4.2 4.2
Queue Clearance Time (gs), s 18.5 26.5 26.5
Green Extension Time (ge), s 0.0 0.0 0.3 0.0 0.0 0.0 0.0
Phase Call Probability 1.00 1.00 1.00
Max Out Probability 0.72 1.00 1.00
Movement Group Results EB WB NB SB
Approach Movement L T R L T R L T R L T R
Assigned Movement 5 2 12 1 6 16 3 8 18 7 4 14
Adjusted Flow Rate (v), veh/h 0 2151 323 215 1075 0 0 323 0 753
Adjusted Saturation Flow Rate (s), veh/h/ln 0 1643 1365 1533 1723 0 0 1616 1900 1438
Queue Service time (gs ), s 0.0 45.3 19.4 16.5 5.2 0.0 0.0 23.8 0.0 24.5
Cycle Queue Clearance Time (gc), s 0.0 45.3 19.4 16.5 5.2 0.0 0.0 23.8 0.0 24.5
Capacity (c), veh/h 2359 653 240 2374 330 388 294
Volume-to-Capacity Ratio (X) 0.000 0.912 0.494 0.896 0.453 0.000 0.000 0.978 0.000 2.564
Available Capacity (ca), veh/h 2359 653 294 2374 330 388 294
Back of Queue (Q), veh/ln 14.0 6.3 7.8 1.2 13.2 0.0 66.7
Overflow Queue (Q3), veh/ln 0.0 0.0 0.0 0.0 0.0 0.0 0.0 0.0
Queue Storage Ratio (RQ) 0.0 0.0 0.0 0.0 0.0 0.0 0.0 0.0 0.0 0.0
Uniform Delay (d1), s/veh 19.5 21.4 49.7 1.7 47.5 0.0 47.8
Incremental Delay (d2), s/veh 0.0 6.7 2.7 24.6 0.6 0.0 0.0 43.4 0.0 713.9
Initial Queue Delay (d3), s/veh 0.0 0.0 0.0 0.0 0.0 0.0 0.0 0.0
Control Delay (d), s/veh 26.3 24.0 74.2 2.3 90.9 0.0 761.6
Level of Service (LOS) C C E A F F
Approach Delay, s/veh / LOS 26.0 C 14.3 B 0.0 560.4 F
Intersection Delay s/veh / LOS 141.6 F
MultiModal Results EB WB NB SB
Pedestrian LOS Score / LOS 1.9 A 1.9 A 3.2 C 3.0 C
Bicycle LOS Score / LOS 1.8 A 1.6 A 2.3 B
Copyright © 2010 University of Florida, All Rights Reserved HCS 2010™ Version 6.1 Generated: 12/20/2012 8:56:50 AM

2010 HCS Signalized Intersection Results Summary
General Information Intersection Information
Agency Qk4 Duration, h 0.25
Analyst JJL Analysis Date Aug 27, 2012 Area Type Other
Jurisdiction KYTC Time Period PM Peak Hour No Build
PHF 0.97
Intersection KY 18 & Interstate 75 SB R Analysis Year 2040 Analysis Period 1> 7:00
File Name 2 PM KY 18 & I 75 SB Ramps.xus
Project Description Mall Rd Interchange PM
Demand Information EB WB NB SB
Approach Movement L T R L T R L T R L T R
Demand (v), veh/h 2200 600 350 1600 400 0 1400
Signal Information
GreenYellowRed
22.0 70.2 38.5 0.0 0.0 0.03.5 4.8 4.4 0.0 0.0 0.03.0 1.7 1.9 0.0 0.0 0.0
1 2 3 4
5 6 7 8
Cycle, s 150.0 Reference Phase 2
Offset, s 0 Reference Point End
Uncoordinated No Simult. Gap E/W Off
Force Mode Fixed Simult. Gap N/S Off
Timer Results EBL EBT WBL WBT NBL NBT SBL SBT
Assigned Phase 5 2 1 6 0 4 4
Case Number 0.0 3.0 2.0 4.0 0.0 9.0 9.0
Phase Duration, s 0.0 121.5 28.5 150.0 0.0 44.8 44.8
Change Period, (Y+Rc), s 6.5 6.5 6.5 6.5 0.0 6.3 6.3
Max Allow Headway (MAH), s 0.0 0.0 4.0 0.0 0.0 4.2 4.2
Queue Clearance Time (gs), s 24.0 40.5 40.5
Green Extension Time (ge), s 0.0 0.0 0.0 0.0 0.0 0.0 0.0
Phase Call Probability 1.00 1.00 1.00
Max Out Probability 1.00 1.00 1.00
Movement Group Results EB WB NB SB
Approach Movement L T R L T R L T R L T R
Assigned Movement 5 2 12 1 6 16 3 8 18 7 4 14
Adjusted Flow Rate (v), veh/h 0 2268 619 361 1649 0 0 412 0 1443
Adjusted Saturation Flow Rate (s), veh/h/ln 0 1643 1477 1660 1723 0 0 1587 1900 1412
Queue Service time (gs ), s 0.0 67.1 57.5 22.0 24.4 0.0 0.0 38.5 0.0 38.5
Cycle Queue Clearance Time (gc), s 0.0 67.1 57.5 22.0 24.4 0.0 0.0 38.5 0.0 38.5
Capacity (c), veh/h 2307 691 243 2267 407 488 363
Volume-to-Capacity Ratio (X) 0.000 0.983 0.895 1.482 0.728 0.000 0.000 1.012 0.000 3.981
Available Capacity (ca), veh/h 2307 691 243 2267 407 488 363
Back of Queue (Q), veh/ln 24.6 22.9 25.2 4.5 20.4 0.0 149.1
Overflow Queue (Q3), veh/ln 0.0 0.0 0.0 0.0 0.0 0.0 0.0 0.0
Queue Storage Ratio (RQ) 0.0 0.0 0.0 0.0 0.0 0.0 0.0 0.0 0.0 0.0
Uniform Delay (d1), s/veh 27.6 36.5 64.0 4.6 55.8 0.0 55.8
Incremental Delay (d2), s/veh 0.0 15.2 16.4 237.6 2.1 0.0 0.0 47.7 0.0 1348.2
Initial Queue Delay (d3), s/veh 0.0 0.0 0.0 0.0 0.0 0.0 0.0 0.0
Control Delay (d), s/veh 42.8 52.9 301.6 6.7 103.4 0.0 1403.9
Level of Service (LOS) D D F A F F
Approach Delay, s/veh / LOS 45.0 D 59.7 E 0.0 1114.9 F
Intersection Delay s/veh / LOS 343.4 F
MultiModal Results EB WB NB SB
Pedestrian LOS Score / LOS 1.9 A 1.9 A 3.2 C 3.0 C
Bicycle LOS Score / LOS 2.1 B 2.1 B 3.5 D
Copyright © 2010 University of Florida, All Rights Reserved HCS 2010™ Version 6.1 Generated: 6/10/2013 9:47:54 AM

2010 HCS Signalized Intersection Results Summary
General Information Intersection Information
Agency Qk4 Duration, h 0.25
Analyst JJL Analysis Date Jan 2, 2013 Area Type Other
Jurisdiction KYTC Time Period AM Design Hour PHF 0.96
Intersection KY 18 & I75 NB Ramps Analysis Year 2040 No Build Analysis Period 1> 7:00
File Name 3 AM KY 18 & I 75 NB Ramps.xus
Project Description Mall Road Interchange
Demand Information EB WB NB SB
Approach Movement L T R L T R L T R L T R
Demand (v), veh/h 1850 450 550 50 650 0 50
Signal Information
GreenYellowRed
42.0 22.6 35.4 0.0 0.0 0.03.5 4.8 4.4 0.0 0.0 0.03.0 1.6 3.0 0.0 0.0 0.0
1 2 3 4
5 6 7
Cycle, s 120.3 Reference Phase 2
Offset, s 0 Reference Point End
Uncoordinated Yes Simult. Gap E/W Off
Force Mode Fixed Simult. Gap N/S Off
Timer Results EBL EBT WBL WBT NBL NBT SBL SBT
Assigned Phase 5 2 1 6 8 8 7
Case Number 2.0 4.0 0.0 3.0 10.0 10.0 0.0
Phase Duration, s 48.5 77.5 0.0 29.0 42.8 42.8 0.0
Change Period, (Y+Rc), s 6.5 6.4 5.0 6.4 7.4 7.4 5.0
Max Allow Headway (MAH), s 6.1 3.0 0.0 3.1 6.1 6.1 0.0
Queue Clearance Time (gs), s 44.0 9.7 21.5 37.4 37.4
Green Extension Time (ge), s 0.0 1.1 0.0 1.2 0.0 0.0 0.0
Phase Call Probability 1.00 1.00 1.00 1.00 1.00
Max Out Probability 1.00 0.00 0.02 1.00 1.00
Movement Group Results EB WB NB SB
Approach Movement L T R L T R L T R L T R
Assigned Movement 5 2 12 1 6 16 3 8 18 7 4 14
Adjusted Flow Rate (v), veh/h 1927 469 0 0 573 52 677 0 52 0
Adjusted Saturation Flow Rate (s), veh/h/ln 1627 1723 0 0 1723 1491 1573 0 1610 0
Queue Service time (gs ), s 42.0 7.7 0.0 0.0 19.5 3.5 35.4 35.4 2.8 0.0
Cycle Queue Clearance Time (gc), s 42.0 7.7 0.0 0.0 19.5 3.5 35.4 35.4 2.8 0.0
Capacity (c), veh/h 1136 2037 648 280 463 0 474
Volume-to-Capacity Ratio (X) 1.697 0.230 0.000 0.000 0.884 0.186 1.463 0.000 0.110 0.000
Available Capacity (ca), veh/h 1136 2037 888 384 463 0
Back of Queue (Q), veh/ln 66.3 2.9 8.8 1.3 41.7 1.1
Overflow Queue (Q3), veh/ln 0.0 0.0 0.0 0.0 0.0 0.0 0.0 0.0
Queue Storage Ratio (RQ) 0.0 0.0 0.0 0.0 0.0 0.0 0.0 0.0 0.0 0.0
Uniform Delay (d1), s/veh 39.2 11.6 47.6 41.1 42.5 31.0
Incremental Delay (d2), s/veh 317.4 0.3 0.0 0.0 6.5 0.1 219.9 0.0 0.2 0.0
Initial Queue Delay (d3), s/veh 0.0 0.0 0.0 0.0 0.0 0.0 0.0 0.0
Control Delay (d), s/veh 356.6 11.9 54.1 41.2 262.4 31.2
Level of Service (LOS) F B D D F C
Approach Delay, s/veh / LOS 289.2 F 53.0 D 245.9 F 0.0
Intersection Delay s/veh / LOS 241.4 F
MultiModal Results EB WB NB SB
Pedestrian LOS Score / LOS 1.7 A 1.9 A 2.9 C 3.0 C
Bicycle LOS Score / LOS 2.5 B 1.0 A 1.7 A
Copyright © 2010 University of Florida, All Rights Reserved HCS 2010™ Version 6.1 Generated: 1/3/2013 9:26:13 AM
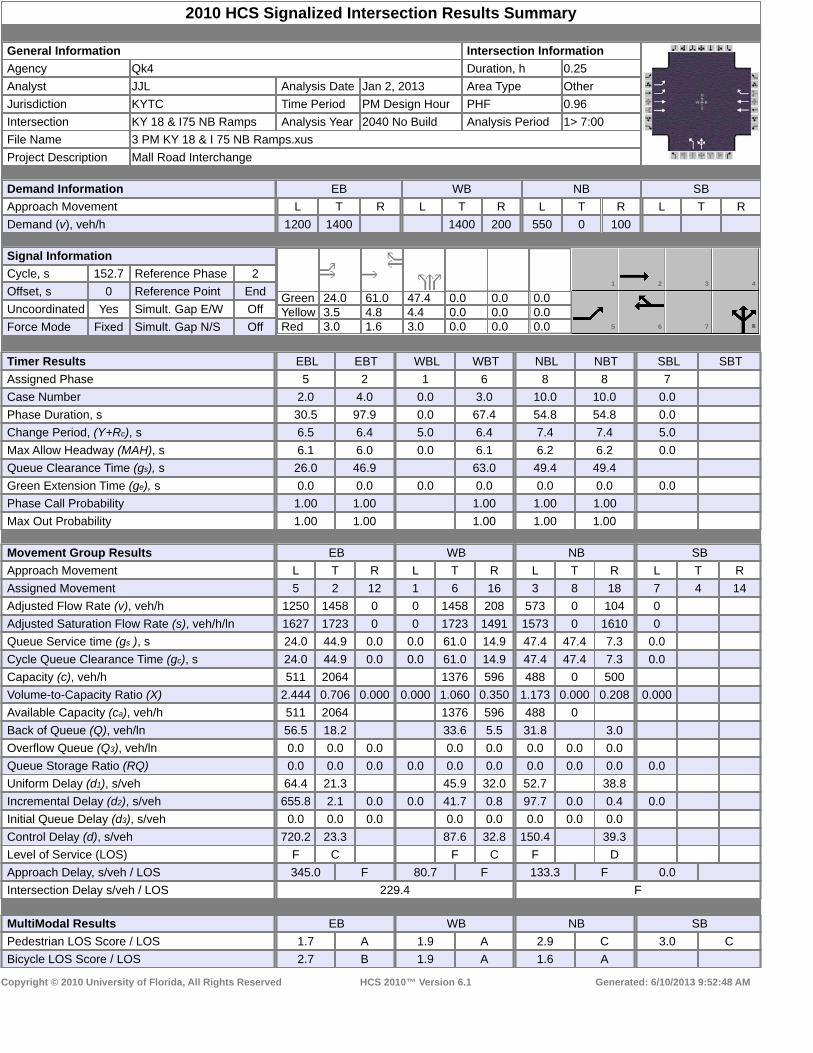
2010 HCS Signalized Intersection Results Summary
General Information Intersection Information
Agency Qk4 Duration, h 0.25
Analyst JJL Analysis Date Jan 2, 2013 Area Type Other
Jurisdiction KYTC Time Period PM Design Hour PHF 0.96
Intersection KY 18 & I75 NB Ramps Analysis Year 2040 No Build Analysis Period 1> 7:00
File Name 3 PM KY 18 & I 75 NB Ramps.xus
Project Description Mall Road Interchange
Demand Information EB WB NB SB
Approach Movement L T R L T R L T R L T R
Demand (v), veh/h 1200 1400 1400 200 550 0 100
Signal Information
GreenYellowRed
24.0 61.0 47.4 0.0 0.0 0.03.5 4.8 4.4 0.0 0.0 0.03.0 1.6 3.0 0.0 0.0 0.0
1 2 3 4
5 6 7
Cycle, s 152.7 Reference Phase 2
Offset, s 0 Reference Point End
Uncoordinated Yes Simult. Gap E/W Off
Force Mode Fixed Simult. Gap N/S Off
Timer Results EBL EBT WBL WBT NBL NBT SBL SBT
Assigned Phase 5 2 1 6 8 8 7
Case Number 2.0 4.0 0.0 3.0 10.0 10.0 0.0
Phase Duration, s 30.5 97.9 0.0 67.4 54.8 54.8 0.0
Change Period, (Y+Rc), s 6.5 6.4 5.0 6.4 7.4 7.4 5.0
Max Allow Headway (MAH), s 6.1 6.0 0.0 6.1 6.2 6.2 0.0
Queue Clearance Time (gs), s 26.0 46.9 63.0 49.4 49.4
Green Extension Time (ge), s 0.0 0.0 0.0 0.0 0.0 0.0 0.0
Phase Call Probability 1.00 1.00 1.00 1.00 1.00
Max Out Probability 1.00 1.00 1.00 1.00 1.00
Movement Group Results EB WB NB SB
Approach Movement L T R L T R L T R L T R
Assigned Movement 5 2 12 1 6 16 3 8 18 7 4 14
Adjusted Flow Rate (v), veh/h 1250 1458 0 0 1458 208 573 0 104 0
Adjusted Saturation Flow Rate (s), veh/h/ln 1627 1723 0 0 1723 1491 1573 0 1610 0
Queue Service time (gs ), s 24.0 44.9 0.0 0.0 61.0 14.9 47.4 47.4 7.3 0.0
Cycle Queue Clearance Time (gc), s 24.0 44.9 0.0 0.0 61.0 14.9 47.4 47.4 7.3 0.0
Capacity (c), veh/h 511 2064 1376 596 488 0 500
Volume-to-Capacity Ratio (X) 2.444 0.706 0.000 0.000 1.060 0.350 1.173 0.000 0.208 0.000
Available Capacity (ca), veh/h 511 2064 1376 596 488 0
Back of Queue (Q), veh/ln 56.5 18.2 33.6 5.5 31.8 3.0
Overflow Queue (Q3), veh/ln 0.0 0.0 0.0 0.0 0.0 0.0 0.0 0.0
Queue Storage Ratio (RQ) 0.0 0.0 0.0 0.0 0.0 0.0 0.0 0.0 0.0 0.0
Uniform Delay (d1), s/veh 64.4 21.3 45.9 32.0 52.7 38.8
Incremental Delay (d2), s/veh 655.8 2.1 0.0 0.0 41.7 0.8 97.7 0.0 0.4 0.0
Initial Queue Delay (d3), s/veh 0.0 0.0 0.0 0.0 0.0 0.0 0.0 0.0
Control Delay (d), s/veh 720.2 23.3 87.6 32.8 150.4 39.3
Level of Service (LOS) F C F C F D
Approach Delay, s/veh / LOS 345.0 F 80.7 F 133.3 F 0.0
Intersection Delay s/veh / LOS 229.4 F
MultiModal Results EB WB NB SB
Pedestrian LOS Score / LOS 1.7 A 1.9 A 2.9 C 3.0 C
Bicycle LOS Score / LOS 2.7 B 1.9 A 1.6 A
Copyright © 2010 University of Florida, All Rights Reserved HCS 2010™ Version 6.1 Generated: 6/10/2013 9:52:48 AM

HCS+: Unsignalized Intersections Release 5.6 _______________________TWO-WAY STOP CONTROL SUMMARY___________________________ Analyst: JJL Agency/Co.: Qk4 Date Performed: 8/28/2012 Analysis Time Period: AM Peak Hour No Build Intersection: US 42 & I 75 NB Ramps Jurisdiction: KYTC Units: U. S. Customary Analysis Year: 2040 Project ID: Mall Rd Interchange East/West Street: US 42 North/South Street: Interstate 75 NB Ramps Intersection Orientation: EW Study period (hrs): 0.25 ______________________Vehicle Volumes and Adjustments_________________________ Major Street: Approach Eastbound Westbound Movement 1 2 3 | 4 5 6 L T R | L T R ______________________________________________________________________________ Volume 1600 650 Peak-Hour Factor, PHF 0.85 0.92 Hourly Flow Rate, HFR 1882 706 Percent Heavy Vehicles -- -- -- -- Median Type/Storage Raised curb / 1 RT Channelized? Lanes 2 2 Configuration T T Upstream Signal? No No ______________________________________________________________________________ Minor Street: Approach Northbound Southbound Movement 7 8 9 | 10 11 12 L T R | L T R ______________________________________________________________________________ Volume 200 400 Peak Hour Factor, PHF 0.76 0.96 Hourly Flow Rate, HFR 263 416 Percent Heavy Vehicles 7 7 Percent Grade (%) 0 0 Flared Approach: Exists?/Storage / / Lanes 1 1 Configuration L R ______________________________________________________________________________ __________________Delay, Queue Length, and Level of Service___________________ Approach EB WB Northbound Southbound Movement 1 4 | 7 8 9 | 10 11 12 Lane Config | L R | ______________________________________________________________________________ v (vph) 263 416 C(m) (vph) 86 306 v/c 3.06 1.36 95% queue length 25.93 21.13 Control Delay 1032 214.9 LOS F F Approach Delay 531.2 Approach LOS F ______________________________________________________________________________
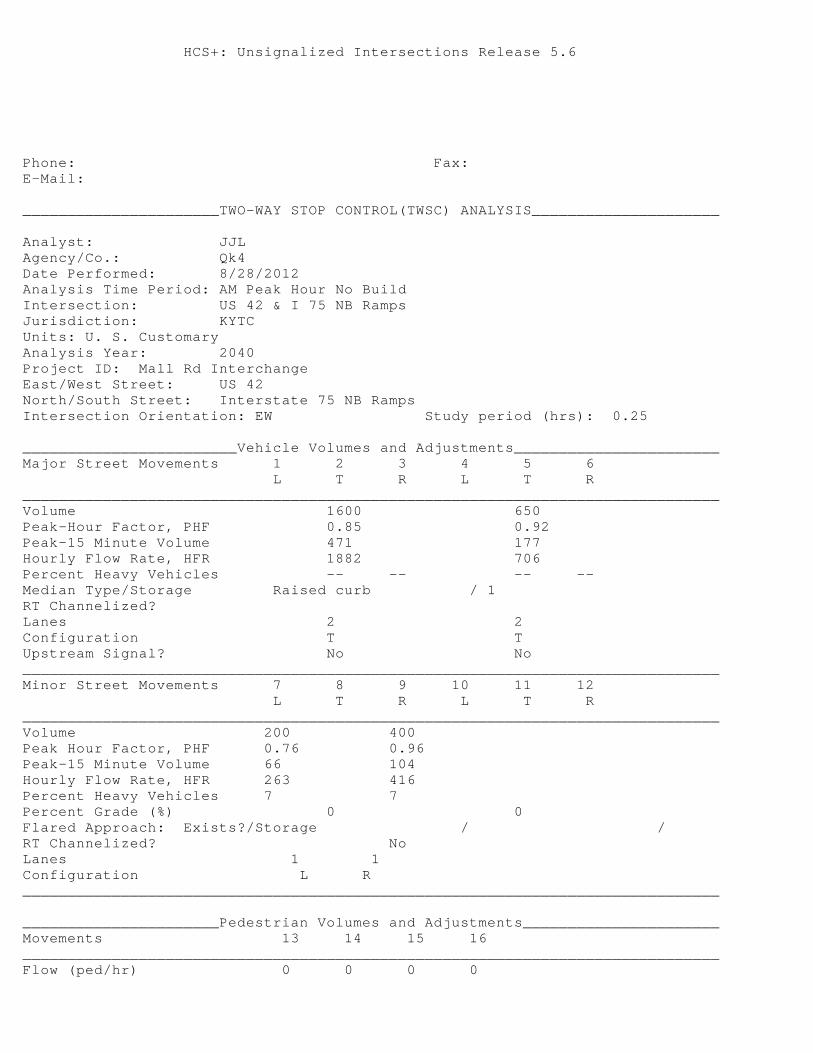
HCS+: Unsignalized Intersections Release 5.6 Phone: Fax: E-Mail: ______________________TWO-WAY STOP CONTROL(TWSC) ANALYSIS_____________________ Analyst: JJL Agency/Co.: Qk4 Date Performed: 8/28/2012 Analysis Time Period: AM Peak Hour No Build Intersection: US 42 & I 75 NB Ramps Jurisdiction: KYTC Units: U. S. Customary Analysis Year: 2040 Project ID: Mall Rd Interchange East/West Street: US 42 North/South Street: Interstate 75 NB Ramps Intersection Orientation: EW Study period (hrs): 0.25 ________________________Vehicle Volumes and Adjustments_______________________ Major Street Movements 1 2 3 4 5 6 L T R L T R ______________________________________________________________________________ Volume 1600 650 Peak-Hour Factor, PHF 0.85 0.92 Peak-15 Minute Volume 471 177 Hourly Flow Rate, HFR 1882 706 Percent Heavy Vehicles -- -- -- -- Median Type/Storage Raised curb / 1 RT Channelized? Lanes 2 2 Configuration T T Upstream Signal? No No ______________________________________________________________________________ Minor Street Movements 7 8 9 10 11 12 L T R L T R ______________________________________________________________________________ Volume 200 400 Peak Hour Factor, PHF 0.76 0.96 Peak-15 Minute Volume 66 104 Hourly Flow Rate, HFR 263 416 Percent Heavy Vehicles 7 7 Percent Grade (%) 0 0 Flared Approach: Exists?/Storage / / RT Channelized? No Lanes 1 1 Configuration L R ______________________________________________________________________________ ______________________Pedestrian Volumes and Adjustments______________________ Movements 13 14 15 16 ______________________________________________________________________________ Flow (ped/hr) 0 0 0 0
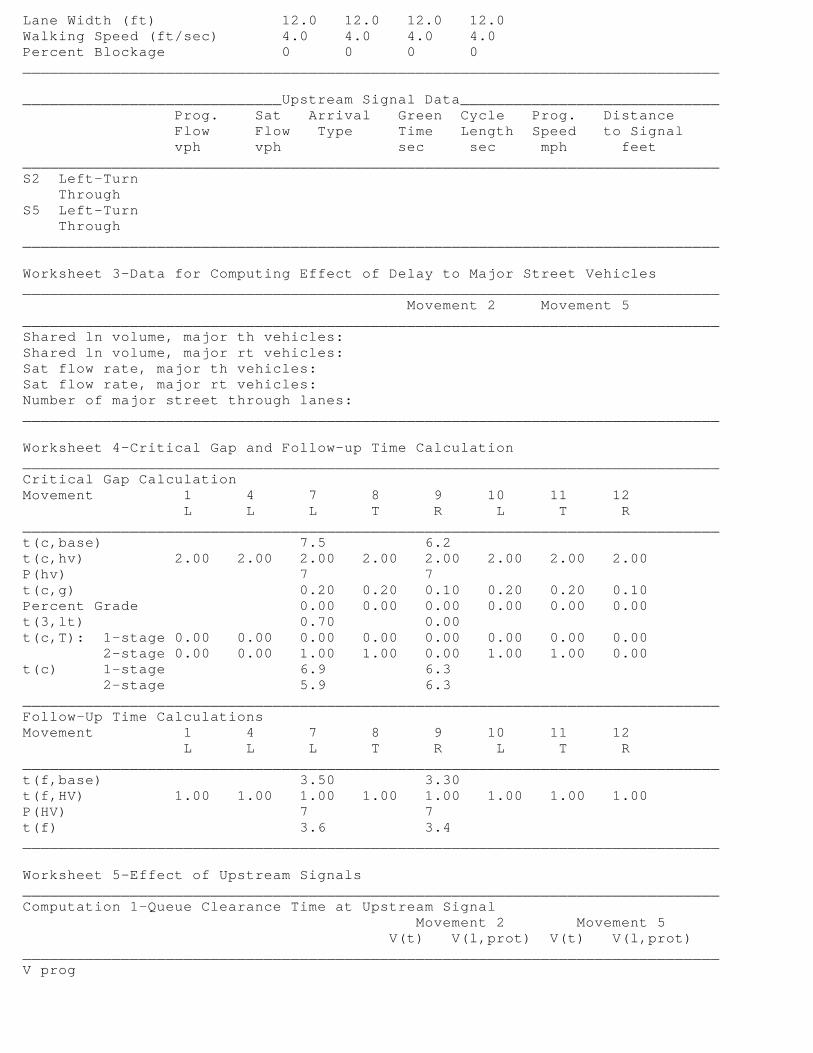
Lane Width (ft) 12.0 12.0 12.0 12.0 Walking Speed (ft/sec) 4.0 4.0 4.0 4.0 Percent Blockage 0 0 0 0 ______________________________________________________________________________ _____________________________Upstream Signal Data_____________________________ Prog. Sat Arrival Green Cycle Prog. Distance Flow Flow Type Time Length Speed to Signal vph vph sec sec mph feet ______________________________________________________________________________ S2 Left-Turn Through S5 Left-Turn Through ______________________________________________________________________________ Worksheet 3-Data for Computing Effect of Delay to Major Street Vehicles ______________________________________________________________________________ Movement 2 Movement 5 ______________________________________________________________________________ Shared ln volume, major th vehicles: Shared ln volume, major rt vehicles: Sat flow rate, major th vehicles: Sat flow rate, major rt vehicles: Number of major street through lanes: ______________________________________________________________________________ Worksheet 4-Critical Gap and Follow-up Time Calculation ______________________________________________________________________________ Critical Gap Calculation Movement 1 4 7 8 9 10 11 12 L L L T R L T R ______________________________________________________________________________ t(c,base) 7.5 6.2 t(c,hv) 2.00 2.00 2.00 2.00 2.00 2.00 2.00 2.00 P(hv) 7 7 t(c,g) 0.20 0.20 0.10 0.20 0.20 0.10 Percent Grade 0.00 0.00 0.00 0.00 0.00 0.00 t(3,lt) 0.70 0.00 t(c,T): 1-stage 0.00 0.00 0.00 0.00 0.00 0.00 0.00 0.00 2-stage 0.00 0.00 1.00 1.00 0.00 1.00 1.00 0.00 t(c) 1-stage 6.9 6.3 2-stage 5.9 6.3 ______________________________________________________________________________ Follow-Up Time Calculations Movement 1 4 7 8 9 10 11 12 L L L T R L T R ______________________________________________________________________________ t(f,base) 3.50 3.30 t(f,HV) 1.00 1.00 1.00 1.00 1.00 1.00 1.00 1.00 P(HV) 7 7 t(f) 3.6 3.4 ______________________________________________________________________________ Worksheet 5-Effect of Upstream Signals ______________________________________________________________________________ Computation 1-Queue Clearance Time at Upstream Signal Movement 2 Movement 5 V(t) V(l,prot) V(t) V(l,prot) ______________________________________________________________________________ V prog

Total Saturation Flow Rate, s (vph) Arrival Type Effective Green, g (sec) Cycle Length, C (sec) Rp (from Exhibit 16-11) Proportion vehicles arriving on green P g(q1) g(q2) g(q) ______________________________________________________________________________ Computation 2-Proportion of TWSC Intersection Time blocked Movement 2 Movement 5 V(t) V(l,prot) V(t) V(l,prot) ______________________________________________________________________________ alpha beta Travel time, t(a) (sec) Smoothing Factor, F Proportion of conflicting flow, f Max platooned flow, V(c,max) Min platooned flow, V(c,min) Duration of blocked period, t(p) Proportion time blocked, p 0.000 0.000 ______________________________________________________________________________ Computation 3-Platoon Event Periods Result ______________________________________________________________________________ p(2) 0.000 p(5) 0.000 p(dom) p(subo) Constrained or unconstrained? ______________________________________________________________________________ Proportion unblocked (1) (2) (3) for minor Single-stage Two-Stage Process movements, p(x) Process Stage I Stage II ______________________________________________________________________________ p(1) p(4) p(7) p(8) p(9) p(10) p(11) p(12) ______________________________________________________________________________ Computation 4 and 5 Single-Stage Process Movement 1 4 7 8 9 10 11 12 L L L T R L T R ______________________________________________________________________________ V c,x 2235 941 s Px V c,u,x ______________________________________________________________________________ C r,x C plat,x ______________________________________________________________________________ Two-Stage Process 7 8 10 11

Stage1 Stage2 Stage1 Stage2 Stage1 Stage2 Stage1 Stage2 ______________________________________________________________________________ V(c,x) 1882 353 s 3000 P(x) V(c,u,x) ______________________________________________________________________________ C(r,x) C(plat,x) ______________________________________________________________________________ Worksheet 6-Impedance and Capacity Equations ______________________________________________________________________________ Step 1: RT from Minor St. 9 12 ______________________________________________________________________________ Conflicting Flows 941 Potential Capacity 306 Pedestrian Impedance Factor 1.00 1.00 Movement Capacity 306 Probability of Queue free St. 0.00 1.00 ______________________________________________________________________________ Step 2: LT from Major St. 4 1 ______________________________________________________________________________ Conflicting Flows Potential Capacity Pedestrian Impedance Factor 1.00 1.00 Movement Capacity Probability of Queue free St. 1.00 1.00 Maj L-Shared Prob Q free St. ______________________________________________________________________________ Step 3: TH from Minor St. 8 11 ______________________________________________________________________________ Conflicting Flows Potential Capacity Pedestrian Impedance Factor 1.00 1.00 Cap. Adj. factor due to Impeding mvmnt 1.00 1.00 Movement Capacity Probability of Queue free St. 1.00 1.00 ______________________________________________________________________________ Step 4: LT from Minor St. 7 10 ______________________________________________________________________________ Conflicting Flows 2235 Potential Capacity 34 Pedestrian Impedance Factor 1.00 1.00 Maj. L, Min T Impedance factor 1.00 Maj. L, Min T Adj. Imp Factor. 1.00 Cap. Adj. factor due to Impeding mvmnt 1.00 0.00 Movement Capacity 34 ______________________________________________________________________________ Worksheet 7-Computation of the Effect of Two-stage Gap Acceptance ______________________________________________________________________________ Step 3: TH from Minor St. 8 11 ______________________________________________________________________________ Part 1 - First Stage Conflicting Flows Potential Capacity 121 442 Pedestrian Impedance Factor 1.00 1.00 Cap. Adj. factor due to Impeding mvmnt 1.00 1.00 Movement Capacity 121 442 Probability of Queue free St. 1.00 1.00

______________________________________________________________________________ Part 2 - Second Stage Conflicting Flows Potential Capacity 442 121 Pedestrian Impedance Factor 1.00 1.00 Cap. Adj. factor due to Impeding mvmnt 1.00 1.00 Movement Capacity 442 121 ______________________________________________________________________________ Part 3 - Single Stage Conflicting Flows Potential Capacity Pedestrian Impedance Factor 1.00 1.00 Cap. Adj. factor due to Impeding mvmnt 1.00 1.00 Movement Capacity ______________________________________________________________________________ Result for 2 stage process: a 0.91 0.91 y C t Probability of Queue free St. 1.00 1.00 ______________________________________________________________________________ Step 4: LT from Minor St. 7 10 ______________________________________________________________________________ Part 1 - First Stage Conflicting Flows 1882 Potential Capacity 100 456 Pedestrian Impedance Factor 1.00 1.00 Cap. Adj. factor due to Impeding mvmnt 1.00 1.00 Movement Capacity 100 456 ______________________________________________________________________________ Part 2 - Second Stage Conflicting Flows 353 Potential Capacity 668 345 Pedestrian Impedance Factor 1.00 1.00 Cap. Adj. factor due to Impeding mvmnt 1.00 0.00 Movement Capacity 668 0 ______________________________________________________________________________ Part 3 - Single Stage Conflicting Flows 2235 Potential Capacity 34 Pedestrian Impedance Factor 1.00 1.00 Maj. L, Min T Impedance factor 1.00 Maj. L, Min T Adj. Imp Factor. 1.00 Cap. Adj. factor due to Impeding mvmnt 1.00 0.00 Movement Capacity 34 ______________________________________________________________________________ Results for Two-stage process: a 0.91 0.91 y 0.10 C t 86 ______________________________________________________________________________ Worksheet 8-Shared Lane Calculations ______________________________________________________________________________ Movement 7 8 9 10 11 12 L T R L T R ______________________________________________________________________________ Volume (vph) 263 416 Movement Capacity (vph) 86 306 Shared Lane Capacity (vph) ______________________________________________________________________________
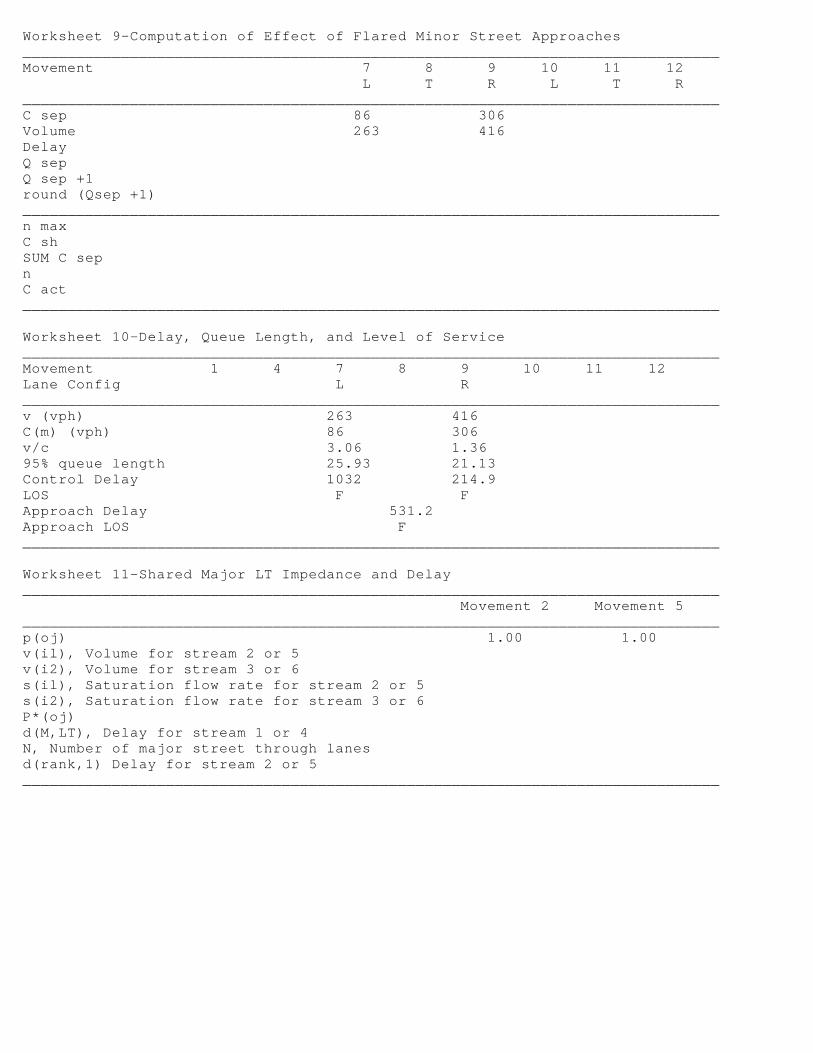
Worksheet 9-Computation of Effect of Flared Minor Street Approaches ______________________________________________________________________________ Movement 7 8 9 10 11 12 L T R L T R ______________________________________________________________________________ C sep 86 306 Volume 263 416 Delay Q sep Q sep +1 round (Qsep +1) ______________________________________________________________________________ n max C sh SUM C sep n C act ______________________________________________________________________________ Worksheet 10-Delay, Queue Length, and Level of Service ______________________________________________________________________________ Movement 1 4 7 8 9 10 11 12 Lane Config L R ______________________________________________________________________________ v (vph) 263 416 C(m) (vph) 86 306 v/c 3.06 1.36 95% queue length 25.93 21.13 Control Delay 1032 214.9 LOS F F Approach Delay 531.2 Approach LOS F ______________________________________________________________________________ Worksheet 11-Shared Major LT Impedance and Delay ______________________________________________________________________________ Movement 2 Movement 5 ______________________________________________________________________________ p(oj) 1.00 1.00 v(il), Volume for stream 2 or 5 v(i2), Volume for stream 3 or 6 s(il), Saturation flow rate for stream 2 or 5 s(i2), Saturation flow rate for stream 3 or 6 P*(oj) d(M,LT), Delay for stream 1 or 4 N, Number of major street through lanes d(rank,1) Delay for stream 2 or 5 ______________________________________________________________________________
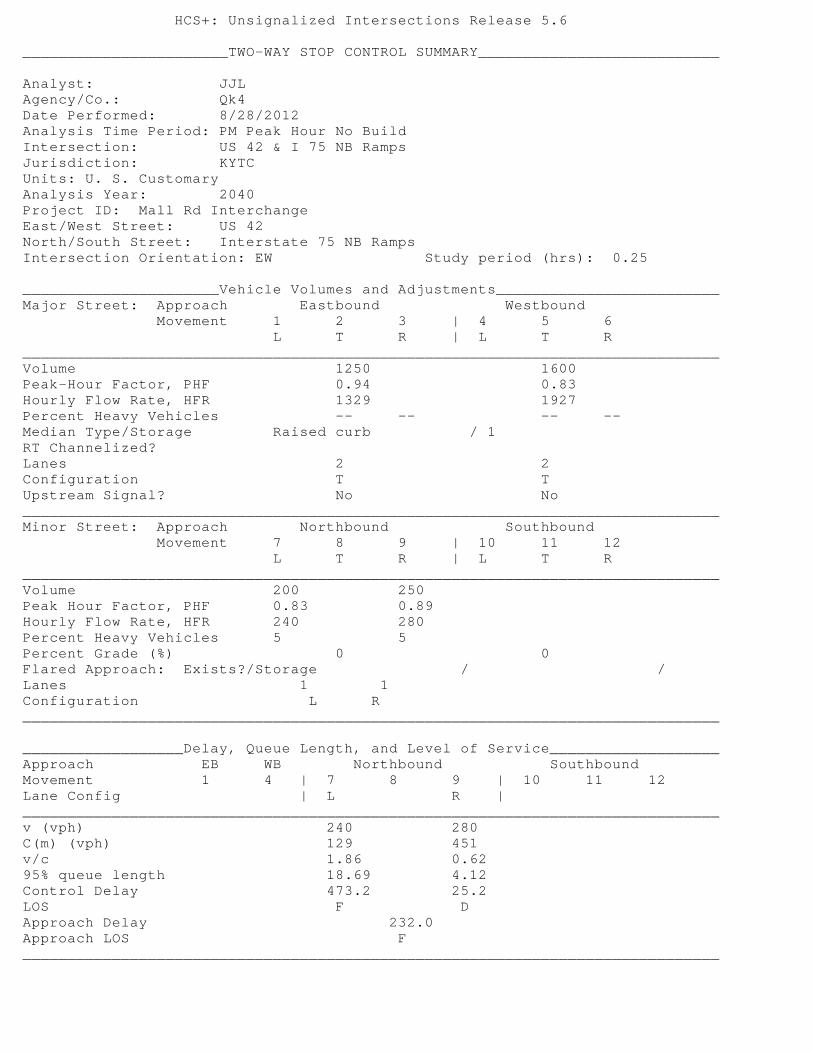
HCS+: Unsignalized Intersections Release 5.6 _______________________TWO-WAY STOP CONTROL SUMMARY___________________________ Analyst: JJL Agency/Co.: Qk4 Date Performed: 8/28/2012 Analysis Time Period: PM Peak Hour No Build Intersection: US 42 & I 75 NB Ramps Jurisdiction: KYTC Units: U. S. Customary Analysis Year: 2040 Project ID: Mall Rd Interchange East/West Street: US 42 North/South Street: Interstate 75 NB Ramps Intersection Orientation: EW Study period (hrs): 0.25 ______________________Vehicle Volumes and Adjustments_________________________ Major Street: Approach Eastbound Westbound Movement 1 2 3 | 4 5 6 L T R | L T R ______________________________________________________________________________ Volume 1250 1600 Peak-Hour Factor, PHF 0.94 0.83 Hourly Flow Rate, HFR 1329 1927 Percent Heavy Vehicles -- -- -- -- Median Type/Storage Raised curb / 1 RT Channelized? Lanes 2 2 Configuration T T Upstream Signal? No No ______________________________________________________________________________ Minor Street: Approach Northbound Southbound Movement 7 8 9 | 10 11 12 L T R | L T R ______________________________________________________________________________ Volume 200 250 Peak Hour Factor, PHF 0.83 0.89 Hourly Flow Rate, HFR 240 280 Percent Heavy Vehicles 5 5 Percent Grade (%) 0 0 Flared Approach: Exists?/Storage / / Lanes 1 1 Configuration L R ______________________________________________________________________________ __________________Delay, Queue Length, and Level of Service___________________ Approach EB WB Northbound Southbound Movement 1 4 | 7 8 9 | 10 11 12 Lane Config | L R | ______________________________________________________________________________ v (vph) 240 280 C(m) (vph) 129 451 v/c 1.86 0.62 95% queue length 18.69 4.12 Control Delay 473.2 25.2 LOS F D Approach Delay 232.0 Approach LOS F ______________________________________________________________________________

2010 HCS Signalized Intersection Results Summary
General Information Intersection Information
Agency Qk4 Duration, h 0.25
Analyst JJL Analysis Date Aug 27, 2012 Area Type Other
Jurisdiction KYTC Time Period AM Peak Hour No Build
PHF 0.90
Intersection US 42 & Interstate 75 SB R Analysis Year 2040 Analysis Period 1> 7:00
File Name 5 AM US 42 & I75 SB Ramps.xus
Project Description Mall Rd Interchange AM
Demand Information EB WB NB SB
Approach Movement L T R L T R L T R L T R
Demand (v), veh/h 1870 130 170 680 830 320
Signal Information
GreenYellowRed
19.5 80.8 42.0 0.0 0.0 0.03.5 4.1 3.5 0.0 0.0 0.03.0 1.6 2.0 0.0 0.0 0.0
1 2 3 4
5 6 7 8
Cycle, s 160.0 Reference Phase 2
Offset, s 0 Reference Point End
Uncoordinated No Simult. Gap E/W Off
Force Mode Fixed Simult. Gap N/S Off
Timer Results EBL EBT WBL WBT NBL NBT SBL SBT
Assigned Phase 5 2 1 6 0 4 4
Case Number 0.0 3.0 2.0 4.0 0.0 9.0 9.0
Phase Duration, s 0.0 134.0 26.0 160.0 0.0 47.5 47.5
Change Period, (Y+Rc), s 5.0 5.7 6.5 5.7 0.0 5.5 5.5
Max Allow Headway (MAH), s 0.0 0.0 4.6 0.0 0.0 4.6 4.6
Queue Clearance Time (gs), s 20.0 44.0 44.0
Green Extension Time (ge), s 0.0 0.0 0.0 0.0 0.0 0.0 0.0
Phase Call Probability 1.00 1.00 1.00
Max Out Probability 1.00 1.00 1.00
Movement Group Results EB WB NB SB
Approach Movement L T R L T R L T R L T R
Assigned Movement 5 2 12 1 6 16 3 8 18 7 4 14
Adjusted Flow Rate (v), veh/h 0 2078 144 189 756 0 0 922 0 356
Adjusted Saturation Flow Rate (s), veh/h/ln 0 1630 1477 1660 1630 0 0 1597 0 1464
Queue Service time (gs ), s 0.0 80.8 8.6 18.0 5.9 0.0 0.0 42.0 42.0 37.9
Cycle Queue Clearance Time (gc), s 0.0 80.8 8.6 18.0 5.9 0.0 0.0 42.0 42.0 37.9
Capacity (c), veh/h 1646 746 202 2175 839 0 384
Volume-to-Capacity Ratio (X) 0.000 1.262 0.194 0.934 0.347 0.000 0.000 1.100 0.000 0.925
Available Capacity (ca), veh/h 1646 746 202 2175 839 0 384
Back of Queue (Q), veh/ln 53.5 3.1 10.1 1.7 24.0 16.8
Overflow Queue (Q3), veh/ln 0.0 0.0 0.0 0.0 0.0 0.0 0.0 0.0
Queue Storage Ratio (RQ) 0.0 0.0 0.0 0.0 0.0 0.0 0.0 0.0 0.0 0.0
Uniform Delay (d1), s/veh 26.1 21.7 69.6 3.3 59.0 0.0 57.5
Incremental Delay (d2), s/veh 0.0 123.1 0.6 45.0 0.4 0.0 0.0 62.0 0.0 28.1
Initial Queue Delay (d3), s/veh 0.0 0.0 0.0 0.0 0.0 0.0 0.0 0.0
Control Delay (d), s/veh 149.3 22.3 114.6 3.7 121.0 0.0 85.6
Level of Service (LOS) F C F A F F
Approach Delay, s/veh / LOS 141.0 F 25.9 C 0.0 111.2 F
Intersection Delay s/veh / LOS 108.0 F
MultiModal Results EB WB NB SB
Pedestrian LOS Score / LOS 0.7 A 1.9 A 2.9 C 2.9 C
Bicycle LOS Score / LOS 2.3 B 1.3 A F
Copyright © 2010 University of Florida, All Rights Reserved HCS 2010™ Version 6.1 Generated: 12/20/2012 8:57:58 AM

2010 HCS Signalized Intersection Results Summary
General Information Intersection Information
Agency Qk4 Duration, h 0.25
Analyst JJL Analysis Date Aug 27, 2012 Area Type Other
Jurisdiction KYTC Time Period PM Peak Hour No Build
PHF 0.97
Intersection US 42 & Interstate 75 SB R Analysis Year 2040 Analysis Period 1> 7:00
File Name 5 PM US 42 & I75 SB Ramps.xus
Project Description Mall Rd Interchange PM
Demand Information EB WB NB SB
Approach Movement L T R L T R L T R L T R
Demand (v), veh/h 1400 400 500 1300 500 900
Signal Information
GreenYellowRed
14.5 82.8 45.0 0.0 0.0 0.03.5 4.1 3.5 0.0 0.0 0.03.0 1.6 2.0 0.0 0.0 0.0
1 2 3 4
5 6 7 8
Cycle, s 160.0 Reference Phase 2
Offset, s 0 Reference Point End
Uncoordinated No Simult. Gap E/W Off
Force Mode Fixed Simult. Gap N/S Off
Timer Results EBL EBT WBL WBT NBL NBT SBL SBT
Assigned Phase 5 2 1 6 0 4 4
Case Number 0.0 3.0 2.0 4.0 0.0 9.0 9.0
Phase Duration, s 0.0 139.0 21.0 160.0 0.0 50.5 50.5
Change Period, (Y+Rc), s 5.0 5.7 6.5 5.7 0.0 5.5 5.5
Max Allow Headway (MAH), s 0.0 0.0 4.6 0.0 0.0 4.7 4.7
Queue Clearance Time (gs), s 16.5 47.0 47.0
Green Extension Time (ge), s 0.0 0.0 0.0 0.0 0.0 0.0 0.0
Phase Call Probability 1.00 1.00 1.00
Max Out Probability 1.00 1.00 1.00
Movement Group Results EB WB NB SB
Approach Movement L T R L T R L T R L T R
Assigned Movement 5 2 12 1 6 16 3 8 18 7 4 14
Adjusted Flow Rate (v), veh/h 0 1443 412 515 1340 0 0 515 0 928
Adjusted Saturation Flow Rate (s), veh/h/ln 0 1630 1563 1757 1630 0 0 1689 0 1548
Queue Service time (gs ), s 0.0 53.6 27.7 14.5 19.7 0.0 0.0 20.7 45.0 45.0
Cycle Queue Clearance Time (gc), s 0.0 53.6 27.7 14.5 19.7 0.0 0.0 20.7 45.0 45.0
Capacity (c), veh/h 1687 809 159 2114 950 0 435
Volume-to-Capacity Ratio (X) 0.000 0.856 0.510 3.238 0.634 0.000 0.000 0.542 0.000 2.131
Available Capacity (ca), veh/h 1687 809 159 2114 950 0 435
Back of Queue (Q), veh/ln 17.8 10.7 51.7 4.2 8.8 79.8
Overflow Queue (Q3), veh/ln 0.0 0.0 0.0 0.0 0.0 0.0 0.0 0.0
Queue Storage Ratio (RQ) 0.0 0.0 0.0 0.0 0.0 0.0 0.0 0.0 0.0 0.0
Uniform Delay (d1), s/veh 20.3 25.3 72.8 5.1 48.8 0.0 57.5
Incremental Delay (d2), s/veh 0.0 5.8 2.3 1023.0
1.5 0.0 0.0 0.7 0.0 516.5
Initial Queue Delay (d3), s/veh 0.0 0.0 0.0 0.0 0.0 0.0 0.0 0.0
Control Delay (d), s/veh 26.1 27.6 1095.8
6.6 49.5 0.0 574.0
Level of Service (LOS) C C F A D F
Approach Delay, s/veh / LOS 26.4 C 309.1 F 0.0 386.7 F
Intersection Delay s/veh / LOS 229.1 F
MultiModal Results EB WB NB SB
Pedestrian LOS Score / LOS 0.7 A 1.9 A 2.9 C 2.9 C
Bicycle LOS Score / LOS 2.0 B 2.0 B F
Copyright © 2010 University of Florida, All Rights Reserved HCS 2010™ Version 6.1 Generated: 12/20/2012 9:15:20 AM

2010 HCS Signalized Intersection Results Summary
General Information Intersection Information
Agency Qk4 Duration, h 0.25
Analyst JJL Analysis Date Aug 27, 2012 Area Type Other
Jurisdiction KYTC Time Period AM Peak Hour No Build
PHF 0.84
Intersection US 42 & Mall Rd Analysis Year 2040 Analysis Period 1> 7:00
File Name 6 AM US 42 & Mall Rd with added turn lane.xus
Project Description Mall Rd Interchange AM
Demand Information EB WB NB SB
Approach Movement L T R L T R L T R L T R
Demand (v), veh/h 350 1750 10 10 740 250 10 30 50 200 30 140
Signal Information
GreenYellowRed
5.0 13.9 70.3 26.6 12.0 0.03.5 3.5 4.2 3.5 3.5 0.03.0 3.0 2.0 3.0 3.0 0.0
1 2 3 4
5 6 7
Cycle, s 160.0 Reference Phase 2
Offset, s 0 Reference Point End
Uncoordinated No Simult. Gap E/W Off
Force Mode Fixed Simult. Gap N/S Off
Timer Results EBL EBT WBL WBT NBL NBT SBL SBT
Assigned Phase 5 2 1 6 8 8 4 4
Case Number 2.0 4.0 2.0 3.0 12.0 12.0 9.0 9.0
Phase Duration, s 31.9 130.0 11.5 109.6 18.5 18.5 33.1 33.1
Change Period, (Y+Rc), s 6.5 6.2 6.5 6.2 6.5 6.5 6.5 6.5
Max Allow Headway (MAH), s 4.6 0.0 4.6 0.0 4.7 4.7 4.7 4.7
Queue Clearance Time (gs), s 23.0 3.0 11.8 11.8 25.5 25.5
Green Extension Time (ge), s 2.3 0.0 0.0 0.0 0.2 0.2 1.1 1.1
Phase Call Probability 1.00 1.00 1.00 1.00 1.00 1.00
Max Out Probability 0.00 0.00 0.07 0.07 0.63 0.63
Movement Group Results EB WB NB SB
Approach Movement L T R L T R L T R L T R
Assigned Movement 5 2 12 1 6 16 3 8 18 7 4 14
Adjusted Flow Rate (v), veh/h 417 1048 1048 12 881 298 107 0 0 238 36 167
Adjusted Saturation Flow Rate (s), veh/h/ln 1541 1712 1708 1810 1712 1412 1719 0 0 1587 1900 1412
Queue Service time (gs ), s 21.0 90.7 90.7 1.0 26.0 23.9 9.8 0.0 0.0 23.5 2.6 17.8
Cycle Queue Clearance Time (gc), s 21.0 90.7 90.7 1.0 26.0 23.9 9.8 0.0 0.0 23.5 2.6 17.8
Capacity (c), veh/h 489 970 968 57 1504 621 129 264 316 235
Volume-to-Capacity Ratio (X) 0.853 1.080 1.082 0.211 0.586 0.480 0.828 0.000 0.000 0.902 0.113 0.710
Available Capacity (ca), veh/h 1355 970 968 208 1504 621 214 313 374 278
Back of Queue (Q), veh/ln 8.6 39.8 40.1 0.5 9.7 8.6 4.8 11.3 1.2 6.8
Overflow Queue (Q3), veh/ln 0.0 0.0 0.0 0.0 0.0 0.0 0.0 0.0 0.0 0.0 0.0 0.0
Queue Storage Ratio (RQ) 0.0 0.0 0.0 0.0 0.0 0.0 0.0 0.0 0.0 0.0 0.0 0.0
Uniform Delay (d1), s/veh 65.5 19.6 19.7 75.6 24.0 31.9 73.0 65.4 56.7 63.1
Incremental Delay (d2), s/veh 5.2 53.1 53.9 2.2 1.7 2.6 14.8 0.0 0.0 25.7 0.2 7.2
Initial Queue Delay (d3), s/veh 0.0 0.0 0.0 0.0 0.0 0.0 0.0 0.0 0.0 0.0 0.0 0.0
Control Delay (d), s/veh 70.7 72.6 73.6 77.8 25.6 34.5 87.8 91.2 56.9 70.3
Level of Service (LOS) E F F E C C F F E E
Approach Delay, s/veh / LOS 72.7 E 28.4 C 87.8 F 80.5 F
Intersection Delay s/veh / LOS 61.5 E
MultiModal Results EB WB NB SB
Pedestrian LOS Score / LOS 2.1 B 2.4 B 3.0 C 3.0 C
Bicycle LOS Score / LOS 2.6 B 1.5 A 0.7 A 1.2 A
Copyright © 2010 University of Florida, All Rights Reserved HCS 2010™ Version 6.1 Generated: 12/31/2012 9:29:51 AM

2010 HCS Signalized Intersection Results Summary
General Information Intersection Information
Agency Qk4 Duration, h 0.25
Analyst JJL Analysis Date Aug 27, 2012 Area Type Other
Jurisdiction KYTC Time Period AM Peak Hour No Build
PHF 0.84
Intersection US 42 & Mall Rd Analysis Year 2040 Analysis Period 1> 7:00
File Name 6 AM US 42 & Mall Rd.xus
Project Description Mall Rd Interchange AM
Demand Information EB WB NB SB
Approach Movement L T R L T R L T R L T R
Demand (v), veh/h 350 1750 10 10 740 250 10 30 50 200 30 140
Signal Information
GreenYellowRed
5.0 33.5 50.7 26.6 12.0 0.03.5 3.5 4.2 3.5 3.5 0.03.0 3.0 2.0 3.0 3.0 0.0
1 2 3 4
5 6 7
Cycle, s 160.0 Reference Phase 2
Offset, s 0 Reference Point End
Uncoordinated No Simult. Gap E/W Off
Force Mode Fixed Simult. Gap N/S Off
Timer Results EBL EBT WBL WBT NBL NBT SBL SBT
Assigned Phase 5 2 1 6 8 8 4 4
Case Number 2.0 4.0 2.0 3.0 12.0 12.0 9.0 9.0
Phase Duration, s 51.5 130.0 11.5 90.0 18.5 18.5 33.1 33.1
Change Period, (Y+Rc), s 6.5 6.2 6.5 6.2 6.5 6.5 6.5 6.5
Max Allow Headway (MAH), s 4.6 0.0 4.6 0.0 4.7 4.7 4.7 4.7
Queue Clearance Time (gs), s 42.9 3.0 11.8 11.8 25.5 25.5
Green Extension Time (ge), s 2.0 0.0 0.0 0.0 0.2 0.2 1.1 1.1
Phase Call Probability 1.00 1.00 1.00 1.00 1.00 1.00
Max Out Probability 0.00 0.00 0.07 0.07 0.63 0.63
Movement Group Results EB WB NB SB
Approach Movement L T R L T R L T R L T R
Assigned Movement 5 2 12 1 6 16 3 8 18 7 4 14
Adjusted Flow Rate (v), veh/h 417 1048 1048 12 881 298 107 0 0 238 36 167
Adjusted Saturation Flow Rate (s), veh/h/ln 1587 1712 1708 1810 1712 1412 1719 0 0 1587 1900 1412
Queue Service time (gs ), s 40.9 90.7 90.7 1.0 36.2 29.2 9.8 0.0 0.0 23.5 2.6 17.8
Cycle Queue Clearance Time (gc), s 40.9 90.7 90.7 1.0 36.2 29.2 9.8 0.0 0.0 23.5 2.6 17.8
Capacity (c), veh/h 446 970 968 57 1085 447 129 264 316 235
Volume-to-Capacity Ratio (X) 0.934 1.080 1.082 0.211 0.812 0.665 0.828 0.000 0.000 0.902 0.113 0.710
Available Capacity (ca), veh/h 698 970 968 208 1085 447 214 313 374 278
Back of Queue (Q), veh/ln 18.1 39.8 40.1 0.5 15.2 11.1 4.8 11.3 1.2 6.8
Overflow Queue (Q3), veh/ln 0.0 0.0 0.0 0.0 0.0 0.0 0.0 0.0 0.0 0.0 0.0 0.0
Queue Storage Ratio (RQ) 0.0 0.0 0.0 0.0 0.0 0.0 0.0 0.0 0.0 0.0 0.0 0.0
Uniform Delay (d1), s/veh 56.1 19.6 19.7 75.6 42.0 47.3 73.0 65.4 56.7 63.1
Incremental Delay (d2), s/veh 15.3 53.1 53.9 2.2 6.7 7.6 14.8 0.0 0.0 25.7 0.2 7.2
Initial Queue Delay (d3), s/veh 0.0 0.0 0.0 0.0 0.0 0.0 0.0 0.0 0.0 0.0 0.0 0.0
Control Delay (d), s/veh 71.3 72.6 73.6 77.8 48.7 54.9 87.8 91.2 56.9 70.3
Level of Service (LOS) E F F E D D F F E E
Approach Delay, s/veh / LOS 72.8 E 50.5 D 87.8 F 80.5 F
Intersection Delay s/veh / LOS 67.8 E
MultiModal Results EB WB NB SB
Pedestrian LOS Score / LOS 2.1 B 2.5 B 3.0 C 2.9 C
Bicycle LOS Score / LOS 2.6 B 1.5 A 0.7 A 1.2 A
Copyright © 2010 University of Florida, All Rights Reserved HCS 2010™ Version 6.1 Generated: 12/20/2012 9:15:39 AM

2010 HCS Signalized Intersection Results Summary
General Information Intersection Information
Agency Qk4 Duration, h 0.25
Analyst JJL Analysis Date Aug 27, 2012 Area Type Other
Jurisdiction KYTC Time Period PM Peak Hour No Build
PHF 0.98
Intersection US 42 & Mall Rd Analysis Year 2040 Analysis Period 1> 7:00
File Name 6 PM US 42 & Mall Rd with added turn lane.xus
Project Description Mall Rd Interchange PM
Demand Information EB WB NB SB
Approach Movement L T R L T R L T R L T R
Demand (v), veh/h 440 1190 30 50 1700 450 40 50 30 580 30 850
Signal Information
GreenYellowRed
6.6 13.5 63.3 31.5 12.9 0.03.5 3.5 4.2 3.5 3.5 0.03.0 3.0 2.0 3.0 3.0 0.0
1 2 3 4
5 6 7
Cycle, s 160.0 Reference Phase 2
Offset, s 0 Reference Point End
Uncoordinated No Simult. Gap E/W Off
Force Mode Fixed Simult. Gap N/S Off
Timer Results EBL EBT WBL WBT NBL NBT SBL SBT
Assigned Phase 5 2 1 6 8 8 4 4
Case Number 2.0 4.0 2.0 3.0 12.0 12.0 9.0 9.0
Phase Duration, s 33.1 127.5 13.1 107.5 19.4 19.4 38.0 38.0
Change Period, (Y+Rc), s 6.5 6.2 6.5 6.2 6.5 6.5 6.5 6.5
Max Allow Headway (MAH), s 4.6 0.0 4.6 0.0 4.6 4.6 4.7 4.7
Queue Clearance Time (gs), s 25.2 6.5 12.8 12.8 33.5 33.5
Green Extension Time (ge), s 1.4 0.0 0.1 0.0 0.1 0.1 0.0 0.0
Phase Call Probability 1.00 1.00 1.00 1.00 1.00 1.00
Max Out Probability 0.34 0.00 1.00 1.00 1.00 1.00
Movement Group Results EB WB NB SB
Approach Movement L T R L T R L T R L T R
Assigned Movement 5 2 12 1 6 16 3 8 18 7 4 14
Adjusted Flow Rate (v), veh/h 449 625 620 51 1735 459 122 0 0 592 31 867
Adjusted Saturation Flow Rate (s), veh/h/ln 1515 1712 1697 1810 1712 1388 1790 0 0 1560 1900 1388
Queue Service time (gs ), s 23.2 34.8 35.4 4.5 63.3 47.8 10.8 0.0 0.0 31.5 2.1 31.5
Cycle Queue Clearance Time (gc), s 23.2 34.8 35.4 4.5 63.3 47.8 10.8 0.0 0.0 31.5 2.1 31.5
Capacity (c), veh/h 504 892 884 74 1355 549 144 307 374 273
Volume-to-Capacity Ratio (X) 0.892 0.701 0.702 0.685 1.280 0.836 0.850 0.000 0.000 1.927 0.082 3.174
Available Capacity (ca), veh/h 618 892 884 312 1355 549 168 307 374 273
Back of Queue (Q), veh/ln 9.8 12.3 12.6 2.3 48.6 18.3 6.1 49.0 1.0 86.0
Overflow Queue (Q3), veh/ln 0.0 0.0 0.0 0.0 0.0 0.0 0.0 0.0 0.0 0.0 0.0 0.0
Queue Storage Ratio (RQ) 0.0 0.0 0.0 0.0 0.0 0.0 0.0 0.0 0.0 0.0 0.0 0.0
Uniform Delay (d1), s/veh 65.3 17.0 17.6 75.7 37.8 43.6 72.6 64.3 52.4 64.3
Incremental Delay (d2), s/veh 13.7 4.6 4.6 12.6 132.0 14.0 29.5 0.0 0.0 429.0 0.1 987.8
Initial Queue Delay (d3), s/veh 0.0 0.0 0.0 0.0 0.0 0.0 0.0 0.0 0.0 0.0 0.0 0.0
Control Delay (d), s/veh 79.0 21.6 22.2 88.3 169.8 57.7 102.1 493.3 52.6 1052.0
Level of Service (LOS) E C C F F E F F D F
Approach Delay, s/veh / LOS 37.0 D 145.0 F 102.1 F 809.5 F
Intersection Delay s/veh / LOS 289.5 F
MultiModal Results EB WB NB SB
Pedestrian LOS Score / LOS 2.1 B 2.4 B 3.0 C 3.0 C
Bicycle LOS Score / LOS 1.9 A 2.3 B 0.7 A 2.9 C
Copyright © 2010 University of Florida, All Rights Reserved HCS 2010™ Version 6.1 Generated: 12/31/2012 9:30:42 AM

2010 HCS Signalized Intersection Results Summary
General Information Intersection Information
Agency Qk4 Duration, h 0.25
Analyst JJL Analysis Date Aug 27, 2012 Area Type Other
Jurisdiction KYTC Time Period PM Peak Hour No Build
PHF 0.98
Intersection US 42 & Mall Rd Analysis Year 2040 Analysis Period 1> 7:00
File Name 6 PM US 42 & Mall Rd.xus
Project Description Mall Rd Interchange PM
Demand Information EB WB NB SB
Approach Movement L T R L T R L T R L T R
Demand (v), veh/h 440 1190 30 50 1700 450 40 50 30 580 30 850
Signal Information
GreenYellowRed
6.6 19.5 57.3 31.5 12.9 0.03.5 3.5 4.2 3.5 3.5 0.03.0 3.0 2.0 3.0 3.0 0.0
1 2 3 4
5 6 7
Cycle, s 160.0 Reference Phase 2
Offset, s 0 Reference Point End
Uncoordinated No Simult. Gap E/W Off
Force Mode Fixed Simult. Gap N/S Off
Timer Results EBL EBT WBL WBT NBL NBT SBL SBT
Assigned Phase 5 2 1 6 8 8 4 4
Case Number 2.0 4.0 2.0 3.0 12.0 12.0 9.0 9.0
Phase Duration, s 39.1 127.5 13.1 101.5 19.4 19.4 38.0 38.0
Change Period, (Y+Rc), s 6.5 6.2 6.5 6.2 6.5 6.5 6.5 6.5
Max Allow Headway (MAH), s 4.6 0.0 4.6 0.0 4.6 4.6 4.7 4.7
Queue Clearance Time (gs), s 34.6 6.5 12.8 12.8 33.5 33.5
Green Extension Time (ge), s 0.0 0.0 0.1 0.0 0.1 0.1 0.0 0.0
Phase Call Probability 1.00 1.00 1.00 1.00 1.00 1.00
Max Out Probability 1.00 0.00 1.00 1.00 1.00 1.00
Movement Group Results EB WB NB SB
Approach Movement L T R L T R L T R L T R
Assigned Movement 5 2 12 1 6 16 3 8 18 7 4 14
Adjusted Flow Rate (v), veh/h 449 625 620 51 1735 459 122 0 0 592 31 867
Adjusted Saturation Flow Rate (s), veh/h/ln 1560 1712 1697 1810 1712 1388 1790 0 0 1560 1900 1388
Queue Service time (gs ), s 32.6 34.8 35.4 4.5 57.3 50.8 10.8 0.0 0.0 31.5 2.1 31.5
Cycle Queue Clearance Time (gc), s 32.6 34.8 35.4 4.5 57.3 50.8 10.8 0.0 0.0 31.5 2.1 31.5
Capacity (c), veh/h 318 892 884 74 1226 497 144 307 374 273
Volume-to-Capacity Ratio (X) 1.412 0.701 0.702 0.685 1.415 0.924 0.850 0.000 0.000 1.927 0.082 3.174
Available Capacity (ca), veh/h 318 892 884 312 1226 497 168 307 374 273
Back of Queue (Q), veh/ln 30.7 12.3 12.6 2.3 54.6 20.8 6.1 49.0 1.0 86.0
Overflow Queue (Q3), veh/ln 0.0 0.0 0.0 0.0 0.0 0.0 0.0 0.0 0.0 0.0 0.0 0.0
Queue Storage Ratio (RQ) 0.0 0.0 0.0 0.0 0.0 0.0 0.0 0.0 0.0 0.0 0.0 0.0
Uniform Delay (d1), s/veh 63.7 17.0 17.6 75.7 41.8 49.3 72.6 64.3 52.4 64.3
Incremental Delay (d2), s/veh 203.1 4.6 4.6 12.6 191.6 25.3 29.5 0.0 0.0 429.0 0.1 987.8
Initial Queue Delay (d3), s/veh 0.0 0.0 0.0 0.0 0.0 0.0 0.0 0.0 0.0 0.0 0.0 0.0
Control Delay (d), s/veh 266.8 21.6 22.2 88.3 233.4 74.5 102.1 493.3 52.6 1052.0
Level of Service (LOS) F C C F F E F F D F
Approach Delay, s/veh / LOS 86.8 F 197.6 F 102.1 F 809.5 F
Intersection Delay s/veh / LOS 325.9 F
MultiModal Results EB WB NB SB
Pedestrian LOS Score / LOS 2.1 B 2.5 B 3.0 C 2.9 C
Bicycle LOS Score / LOS 1.9 A 2.3 B 0.7 A 2.9 C
Copyright © 2010 University of Florida, All Rights Reserved HCS 2010™ Version 6.1 Generated: 12/20/2012 9:16:07 AM

2010 HCS Signalized Intersection Results Summary
General Information Intersection Information
Agency Qk4 Duration, h 0.25
Analyst JJL Analysis Date Aug 24, 2012 Area Type Other
Jurisdiction KYTC Time Period AM Peak Hour No Build
PHF 0.84
Intersection Mall Rd & I 75 Ramps Analysis Year 2040 Analysis Period 1> 7:00
File Name 7 AM Mall Rd & I-75 Ramps.xus
Project Description Mall Rd Interchange Existing AM
Demand Information EB WB NB SB
Approach Movement L T R L T R L T R L T R
Demand (v), veh/h 110 70 160 20 340 350 160 230 10
Signal Information
GreenYellowRed
6.0 3.4 69.7 22.3 0.0 0.03.5 0.0 4.4 4.0 0.0 0.03.0 0.0 1.8 1.9 0.0 0.0
1 3 4
6 7 8
Cycle, s 120.0 Reference Phase 2
Offset, s 0 Reference Point End
Uncoordinated No Simult. Gap E/W On
Force Mode Fixed Simult. Gap N/S On
Timer Results EBL EBT WBL WBT NBL NBT SBL SBT
Assigned Phase 7 8 8 5 2 1 6
Case Number 0.0 9.0 9.0 2.0 3.0 2.0 4.0
Phase Duration, s 0.0 28.2 28.2 12.5 104.1 15.9 107.5
Change Period, (Y+Rc), s 5.0 5.9 5.9 6.5 6.2 6.5 6.2
Max Allow Headway (MAH), s 0.0 6.2 6.2 4.1 0.0 4.1 0.0
Queue Clearance Time (gs), s 19.1 19.1 3.7 8.7
Green Extension Time (ge), s 0.0 3.2 3.2 0.1 0.0 0.7 0.0
Phase Call Probability 1.00 1.00 1.00 1.00
Max Out Probability 0.03 0.03 0.00 0.00
Movement Group Results EB WB NB SB
Approach Movement L T R L T R L T R L T R
Assigned Movement 7 4 14 3 8 18 5 2 12 1 6 16
Adjusted Flow Rate (v), veh/h 0 131 83 190 24 405 417 190 143 142
Adjusted Saturation Flow Rate (s), veh/h/ln 0 1436 1508 1278 1587 1587 1533 1673 1667 1642
Queue Service time (gs ), s 0.0 9.8 2.8 17.1 1.7 4.2 18.8 6.7 2.2 2.4
Cycle Queue Clearance Time (gc), s 0.0 9.8 2.8 17.1 1.7 4.2 18.8 6.7 2.2 2.4
Capacity (c), veh/h 267 562 238 79 1843 890 262 1015 1000
Volume-to-Capacity Ratio (X) 0.000 0.490 0.148 0.800 0.300 0.220 0.468 0.728 0.141 0.142
Available Capacity (ca), veh/h 479 1005 426 685 1843 890 858 1015 1000
Back of Queue (Q), veh/ln 3.7 1.0 6.2 0.7 1.3 6.7 2.9 0.8 0.9
Overflow Queue (Q3), veh/ln 0.0 0.0 0.0 0.0 0.0 0.0 0.0 0.0 0.0
Queue Storage Ratio (RQ) 0.0 0.0 0.0 0.0 0.0 0.0 0.0 0.0 0.0 0.0
Uniform Delay (d1), s/veh 43.7 40.9 46.7 55.0 6.2 14.5 54.1 4.6 5.1
Incremental Delay (d2), s/veh 0.0 2.9 0.3 12.3 2.1 0.3 1.8 3.9 0.3 0.3
Initial Queue Delay (d3), s/veh 0.0 0.0 0.0 0.0 0.0 0.0 0.0 0.0 0.0
Control Delay (d), s/veh 46.7 41.1 59.0 57.1 6.4 16.3 57.9 4.9 5.4
Level of Service (LOS) D D E E A B E A A
Approach Delay, s/veh / LOS 0.0 51.3 D 12.7 B 26.3 C
Intersection Delay s/veh / LOS 25.5 C
MultiModal Results EB WB NB SB
Pedestrian LOS Score / LOS 3.0 C 3.0 C 2.1 B 2.4 B
Bicycle LOS Score / LOS 0.8 A 1.2 A 0.9 A
Copyright © 2010 University of Florida, All Rights Reserved HCS 2010™ Version 6.1 Generated: 12/20/2012 9:16:26 AM

2010 HCS Signalized Intersection Results Summary
General Information Intersection Information
Agency Qk4 Duration, h 0.25
Analyst JJL Analysis Date Aug 24, 2012 Area Type Other
Jurisdiction KYTC Time Period PM Peak Hour No Build
PHF 0.97
Intersection Mall Rd & I 75 Ramps Analysis Year 2040 Analysis Period 1> 7:00
File Name 7 PM Mall Rd & I-75 Ramps.xus
Project Description Mall Rd Interchange Existing PM
Demand Information EB WB NB SB
Approach Movement L T R L T R L T R L T R
Demand (v), veh/h 350 150 600 50 650 100 250 650 50
Signal Information
GreenYellowRed
7.0 0.0 82.9 35.0 0.0 0.03.5 3.5 4.4 4.0 0.0 0.03.0 3.0 1.8 1.9 0.0 0.0
1 3 4
6 7 8
Cycle, s 150.0 Reference Phase 2
Offset, s 0 Reference Point End
Uncoordinated No Simult. Gap E/W On
Force Mode Fixed Simult. Gap N/S On
Timer Results EBL EBT WBL WBT NBL NBT SBL SBT
Assigned Phase 7 8 8 5 2 1 6
Case Number 0.0 9.0 9.0 2.0 3.0 2.0 4.0
Phase Duration, s 0.0 40.9 40.9 13.5 130.0 20.0 136.5
Change Period, (Y+Rc), s 5.0 5.9 5.9 6.5 6.2 6.5 6.2
Max Allow Headway (MAH), s 0.0 6.2 6.2 4.1 0.0 4.1 0.0
Queue Clearance Time (gs), s 37.0 37.0 6.9 13.0
Green Extension Time (ge), s 0.0 0.0 0.0 0.1 0.0 0.5 0.0
Phase Call Probability 1.00 1.00 1.00 1.00
Max Out Probability 1.00 1.00 0.00 0.27
Movement Group Results EB WB NB SB
Approach Movement L T R L T R L T R L T R
Assigned Movement 7 4 14 3 8 18 5 2 12 1 6 16
Adjusted Flow Rate (v), veh/h 0 361 155 619 52 670 103 258 365 356
Adjusted Saturation Flow Rate (s), veh/h/ln 0 1331 1397 1184 1560 1559 1579 1723 1638 1596
Queue Service time (gs ), s 0.0 35.0 6.7 35.0 4.9 11.9 4.7 11.0 9.8 11.0
Cycle Queue Clearance Time (gc), s 0.0 35.0 6.7 35.0 4.9 11.9 4.7 11.0 9.8 11.0
Capacity (c), veh/h 310 652 276 73 1723 872 311 976 951
Volume-to-Capacity Ratio (X) 0.000 1.162 0.237 2.239 0.706 0.389 0.118 0.829 0.374 0.375
Available Capacity (ca), veh/h 310 652 276 407 1723 872 439 976 951
Back of Queue (Q), veh/ln 20.5 2.4 54.1 2.2 3.7 1.8 5.2 3.2 3.6
Overflow Queue (Q3), veh/ln 0.0 0.0 0.0 0.0 0.0 0.0 0.0 0.0 0.0
Queue Storage Ratio (RQ) 0.0 0.0 0.0 0.0 0.0 0.0 0.0 0.0 0.0 0.0
Uniform Delay (d1), s/veh 57.5 46.7 57.5 70.5 10.4 16.1 67.1 7.2 8.4
Incremental Delay (d2), s/veh 0.0 102.6 0.4 569.1 11.7 0.7 0.3 8.9 1.1 1.1
Initial Queue Delay (d3), s/veh 0.0 0.0 0.0 0.0 0.0 0.0 0.0 0.0 0.0
Control Delay (d), s/veh 160.1 47.1 626.6 82.2 11.1 16.4 75.9 8.3 9.5
Level of Service (LOS) F D F F B B E A A
Approach Delay, s/veh / LOS 0.0 399.1 F 16.2 B 26.6 C
Intersection Delay s/veh / LOS 167.5 F
MultiModal Results EB WB NB SB
Pedestrian LOS Score / LOS 3.0 C 3.0 C 2.1 B 2.4 B
Bicycle LOS Score / LOS 1.4 A 1.2 A 1.3 A
Copyright © 2010 University of Florida, All Rights Reserved HCS 2010™ Version 6.1 Generated: 12/20/2012 9:16:56 AM