Embed Size (px)
Citation preview

Nutrient Efficient Fertilizers and Practices Relating to Food Security
and Sustainability
2010 FERTILIZER AND TECHNOLOGY CONFERENCE
SAVANNAH, GEORGIA November 18, 2010

There are 6.7 billionpeople on Earth.
Food Security and Sustainability

There will be more than 9 billion people living in the world by 2050.
Global Population Growth
Source: United Nations Estimates

FOOD DEMAND = 11.5 BILLION
By 2050 dietary shifts will result in the consumption equivalent of about 11.5 billion people at 2009 diet levels.
Food Demand
Source: United Nations Estimates
POPULATION = 9 BILLION

Demand Growth
Source: UN Environment Program Estimates
0
1000
2000
3000
4000
5000
6000
1989 2025 2050 1989 2025 2050 1989 2025 2050
Cereals Other Crops Animal Products
millions of ton
s
Developing
Developed

1 billion peoplesuffer from hunger.
Source: State of Food Insecurity in the World, 2008 FAO."Food Security Statistics"
That’s approximately the same number of people who live in the United States, Canada and the
European Union combined.
Hunger

To meet demand and prevent hunger and malnutrition global food production must increase by at least 70% and possibly double by 2050, using less land and water resources while decreasing environmental pollution.
Challenge

Well-documented and predictable trends.
Available freshwater is in decline.
Arable land area is shrinking.
Marine harvests are dwindling.
Poor efficiency in plant uptake of nutrients applied.
Agricultural research is in decline worldwide.
Factors limiting food production

Soil Degradation
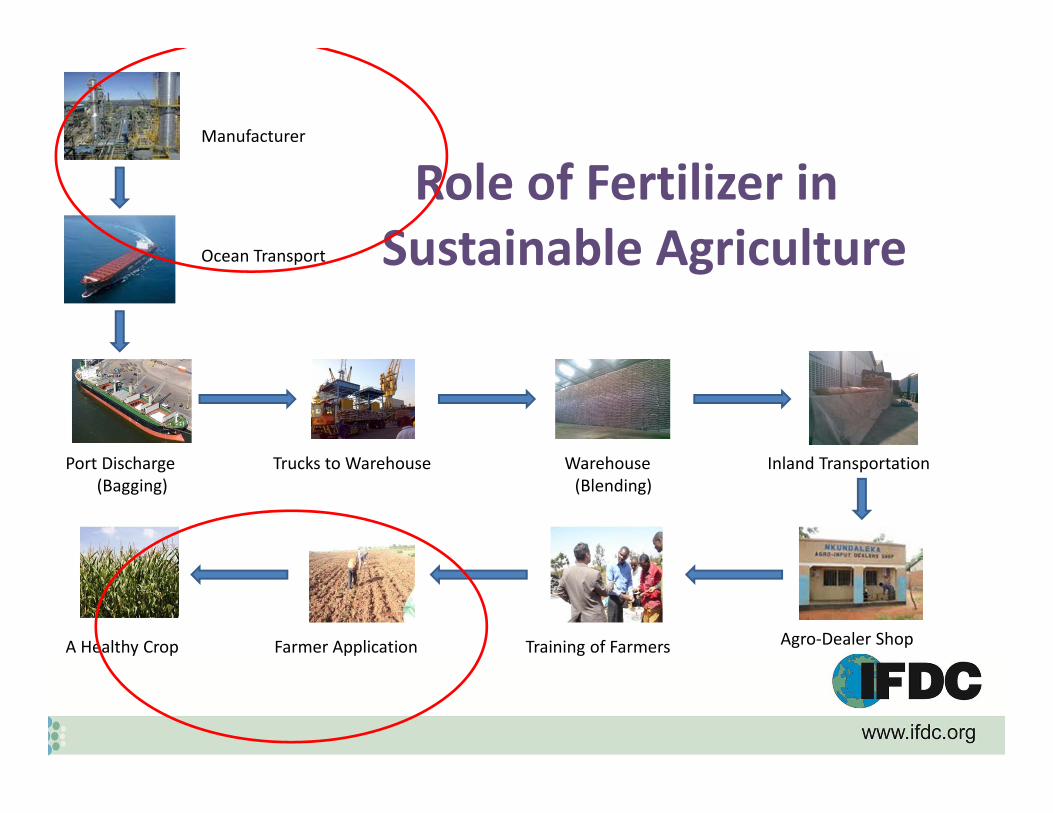
Role of Fertilizer in Sustainable Agriculture
Manufacturer
Ocean Transport
Port Discharge(Bagging)
Trucks to Warehouse Warehouse(Blending)
Inland Transportation
Training of FarmersFarmer ApplicationA Healthy Crop Agro‐Dealer Shop
Sustainability
Sustainable agriculture is underpinned
by the principle of:
• Optimizing production
• Improving quality (nutrition)
• Minimizing off-site and on-site resource
degradation

0.0
0.5
1.0
1.5
2.0
2.5
3.0
0
5,000
10,000
15,000
20,000
25,000
30,000
1961 1971 1981 1991 2001 2008
mt / ha'0
00 m
tIndia: Evolution of Fertilizer
Consumption and Cereal Yields
N P2O5 K2O Cereal Yields

0.0
0.2
0.4
0.6
0.8
1.0
1.2
1.4
0
200
400
600
800
1,000
1,200
1,400
1,600
1961 1971 1981 1991 2001 2008
mt / ha'0
00 m
tSSA: Evolution of Fertilizer
Consumption and Cereal Yields
N P2O5 K2O Cereal Yields

Fertilizer ProblemHigh-Users• Overuse and highly inefficient use
(e.g. China, elsewhere in high value crops).
• Nutrient imbalance• Extreme eutrophication 1.7 million
tonnes N lost. Low-Users• Average of 8 kg nutrients/ha• Relatively poor use efficiency due
to poor fertilizer management• Lack of improved germplasm use

Why Improve Efficiency? Growth in World’s Demand for Fertilizer1.2 billion metric tons fertilizer‐N consumption over the next decade.
Low Efficiency‐ 30%‐40% of N applied to cereals in developing countries is used by crops.
‐ 10-25% for initial P application

Year
1970 1975 1980 1985 1990 1995 2000 2005 2010
N F
ertil
izer
Use
in C
erea
ls
(mill
ion
tonn
es p
er y
ear)
0
2
4
6
8
10
Part
ial F
ertil
izer
Pro
duct
ivity
(kg
grai
n pe
r kg
N a
pplie
d)
20
30
40
50
60
70
80
90
(Sources: Fertilizer Statistics 2007‐8, FAI; http://dacnet.nic.in/eands/At_Glance_2008/pcrops_new.html)
Changes in Partial Fertilizer Productivity of N for Grain Production and Fertilizer N Consumption
for Grains in India

• Loss of productivity or utility of soils• Losses such as:
‐ agricultural productivity relative to land use/culture
‐ biomass, nutrient, and water retention GHG, H2O
‐ biodiversity
Soil Degradation Costs
“We know more about the movement of celestial bodies than about the soil underfoot”–Leonardo da Vinci

Soil Rehabilitation
0
500
1000
1500
2000
2500
3000
3500
0 10 20 30 40N fertilizer applied (kg N/ha)
Mai
ze g
rain
yie
ld (k
g/ha
)
Homestead field - year 1Outfield - year 1Homestead field - year 3Outfield - year 3

Urea production requires fossil fuels.
Urea = 46% Nitrogen
equivalent
Improve Efficiency: Energy Saving
4-barrel energy equivalency

Nutrient
Soil and Water
WeatherCrop
Socioeconomic and Policy
Nutrient Management
Increasing Nutrient Use Efficiency
Synchrony of Nutrient Supply with Crop Nutrient Demand
Balanced Fertilization Integrated Crop Management Nutrient Efficient Genotypes

Improving N Use Efficiency: SupplyNH3
UREASE INHIBITORWORKS HERE
Runoff
NitrateUrea
Ammonia
NH3
Ammonium
NH4+ NO3
‐ N2
N2ONO
Leaching
DEEPPLACEMENTWORKS HERE
NITRIFICATION INHIBITOR
WORKS HERE

Improving N Use Efficiency: Demand (Uptake Profile of Maize)
0
20
40
60
80
100
0 25 50 75 100 125
Days after planting
% T
otal
DM
Y o
r N
Upt
ake
DRY MATTER
N
SILKING
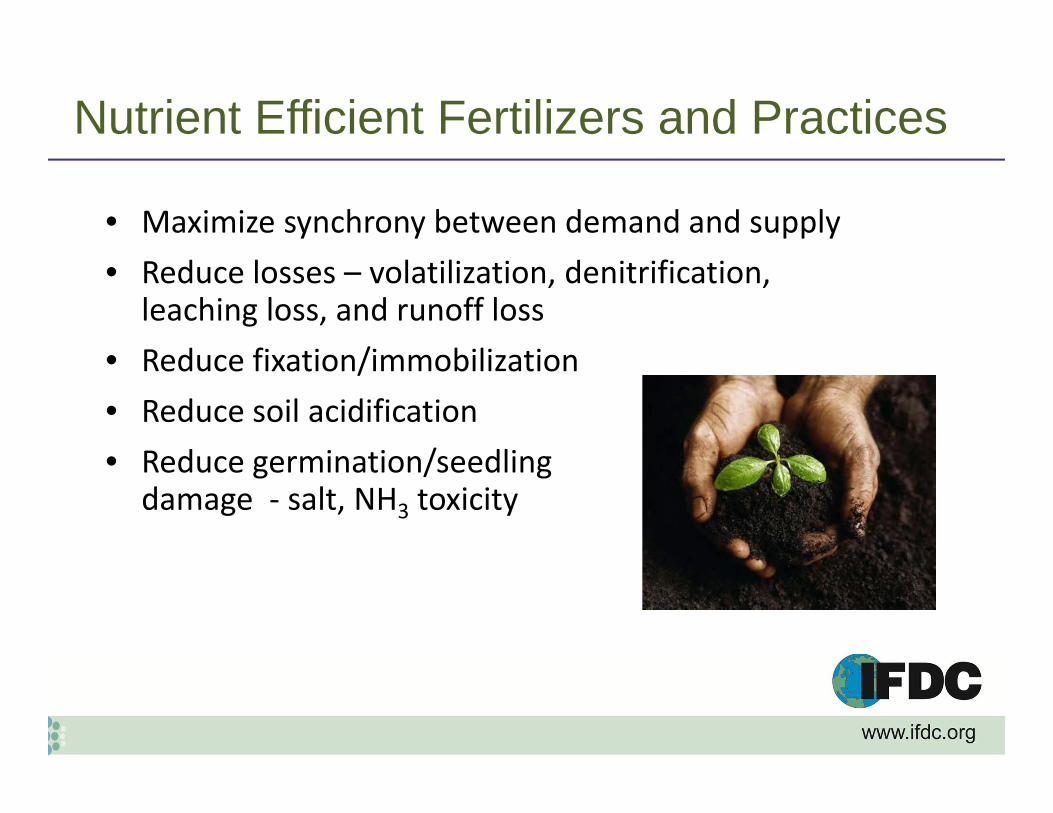
Nutrient Efficient Fertilizers and Practices
• Maximize synchrony between demand and supply• Reduce losses – volatilization, denitrification,
leaching loss, and runoff loss• Reduce fixation/immobilization• Reduce soil acidification• Reduce germination/seedling
damage ‐ salt, NH3 toxicity
Improve Efficiency - Practice
• Knifed into the soil• Dribbled (banded) on the soil surface• Banded at planting• Side‐dressed or top‐dressed during the growing season• Fertigation• Foliar spray• Deep placement (urea, NPK briquettes)

Improve Efficiency -Product Modification and Amendments
Slow and controlled release sources• Low water solubility – urea formaldehydes, phosphate rocks
• Coated: S, rubber, polyurethane, polyolefins, etc.
• Reacted layer technology
• Inhibitors: PPDA, NBTPT, Boric acid, DCD, DMPP, nitrapyrine
• Protectants/Solubilizers: natural, synthetic
Surface application (no till farming), Single application (labor and energy savings)

Summary of Research Trials
on UDP Conducted
in Bangladesh
Days After Fertilizer Application
0 2 4 6 8 10 12
Floo
dwat
er N
Con
tent
(g m
-2)
0.00
0.02
0.04
0.06
0.08
0.10
0.12
0.14 Zero N78(:14:25) Prilled Urea 78(:14:25) Urea Briquette 78:14:25 NPK Briq.
LSD = 0.015
Cumulative Ammonia Volatilization Loss from Guthrie Soil
Days
0 2 4 6 8 10 12 14 16 18
NH
3-N
Los
s (%
N A
pplie
d)
0
5
10
15
20
25
30
35
40
45
Urea AgrotainUDP
Effect of Deep Placement on Floodwater N Content

Comparison of Rice Grain Yield with Urea Briquette Deep Placement andBroadcast Split Urea Application from 2009-2010 Demonstration Plots
Grain Yield with Broadcast Urea (t ha-1)
2 3 4 5 6 7 8 9 10 11
Gra
in Y
ield
with
Dee
p P
lace
men
t (t h
a-1)
2
3
4
5
6
7
8
9
10
11
Aus 2009T. Aman 2009Boro 2010Boro 2009
1:1 Line
Y = 0.975 + 1.04 x (r2 = 0.83, N = 315)

Comparison of Partial Factor Productivity (Grain Yield with Soil N and Fertilizer N per kg Applied N)
for 2009-2010 Demonstration Plots
Grain Yield (kg) per kg N Applied using Prilled Urea
20 30 40 50 60 70 80 90 100 110 120 130 140
Gra
in Y
ield
(kg)
per
kg
N a
pplie
d us
ing
UD
P
20
30
40
50
60
70
80
90
100
110
120
130
140
Aus 2009T. Aman 2009Boro 2010Boro 2009
Y = 49.1 + 0.925 x (r2 = 0.38, N = 315)
1:1 Line

Comparison of Volatilization Loss from Conventional and Modified N Fertilizers on Upland Canyon Soil
Days After N Application
0 2 4 6 8 10 12 14 16 18
Am
mon
ia-N
Vol
atili
zatio
n Lo
ss (%
of A
pplie
d N
)
0
2
4
6
8
10
12
14
16
18
20
22Urea Urease InhibitorUAN Sulfur Coated Urea Controlled-Release UreaUrea-PolymerUrea+Boric acid .5%

Nitr
ate-
N (m
g N
)Effect of Nitrification Inhibitors on Nitrate-N Supply
Weeks of Incubation
0 1 2 3 4 5 6 7 8 9 10 110
1
2
3
4
5
6
7
8
9
10
11
12
UREA UREA + DCDUREA + DMPP
LSD(.05) = 0.72
Nitrate release now is more closely matched with crop N demand

Stable P(soil‐bound)
Soil P Solution
Labile P (weakly held)
Active P (moderately held)
Fertilizer P Added
P in Plant
Erosion LossesLeachingLosses

Human Nutrition Issue • Address mineral deficiencies
BoronZinc
Bangladesh

BiosolidsSludge from municipal sewage waste processed to reduce
environmental impact
85% water15% solids
Conditioned Biosolids
Sulfuric Acid
Ammonia
Pipe Cross Reactor
Granulator
BiosolidFertilizer
BiosolidFertilizer
Recycled water High nutrient content

Summarizing Nutrient Use Efficiency Synchrony of Nutrient Supply with Crop Demand
‐ fertilizer type ‐ amount ‐method of application ‐ timing of application
Balanced Fertilization‐ other essential nutrients
Integrated Crop Management‐ best management of biotic and abiotic factors
Enhanced Efficiency Fertilizers‐ reduce losses further by controlled or slow release‐minimize risk

Policy Implications
• Promotion of BMP’s– Cropping system, species, & varieties
• Protection of Environment– Improved NUE to lower impact
• Cooperative effort between molecular biology (chemical & seed) and fertilizer industries

Concluding RemarkImproving the efficiency of land and resource-use are critical for agriculture to feed the ever-increasing population and yet remain sustainable for future generations.
Efficiency = Food Security
and Sustainability