Embed Size (px)
Citation preview

2010-2011 National Survey on Drug Use and Health:
Model-Based Prevalence Estimates (50 States and the District of Columbia) Revised Mental Illness Estimates: The Substance Abuse and Mental Health Services
Administration (SAMHSA) has been publishing State estimates of the prevalence (both percentages and estimated counts) of past year serious mental illness (SMI) and any mental illness (AMI) among adults aged 18 or older since the release of the 2008-2009 State small area estimation (SAE) report. Estimates were based on a model developed in 2008. In 2013, SAMHSA developed a more accurate model for the 2012 data. This revised model incorporates the NSDUH respondent's age and indicators of past year suicide thoughts and depression, along with the variables that were specified in the 2008 model (Kessler-6 [K6] questions on psychological distress and an abbreviated set of questions on impairment in carrying out activities from the World Health Organization Disability Assessment Schedule [WHODAS]), leading to more accurate estimates of SMI and AMI. The SMI and AMI tables in this document include estimates that have been revised based on the new model. Additionally, note that the 2010-2011 small area estimates for these two measures were produced using an updated 2010 sample weight (i.e., one that used 2010 population counts based on the 2010 census rather than the 2000 census in the poststratification adjustment) and updated SAE model predictors for both 2010 and 2011. Other mental health measures in these tables, such as major depressive episode (MDE) and serious thoughts of suicide, were not affected. For further information on the revised model, see the NSDUH short report titled Revised Estimates of Mental Illness from the National Survey on Drug Use and Health at http://samhsa.gov/data/default.aspx. For the further details on the revised weight and predictors used for these 2010-2011 SMI and AMI small area estimates, see the "2010-2011 NSDUH: Guide to State Tables and Summary of Small Area Estimation Methodology" at http://www.samhsa.gov/data/NSDUH/2k11State/NSDUHsae2011/Index.aspx.

2
120911
Table 1 Illicit Drug Use in the Past Month, by Age Group and State: Percentages, Annual Averages Based on 2010 and 2011 NSDUHs
State 12+
(Estimate)
12+ (95% Confidence
Interval) 12-17
(Estimate)
12-17 (95% Confidence
Interval) 18-25
(Estimate)
18-25 (95% Confidence
Interval) 26+
(Estimate)
26+ (95% Confidence
Interval) Total U.S. 8.82 (8.56 - 9.09) 10.12 (9.73 - 10.52) 21.49 (20.91 - 22.09) 6.46 (6.16 - 6.77) Northeast 9.28 (8.79 - 9.80) 10.47 (9.81 - 11.18) 23.56 (22.32 - 24.86) 6.75 (6.18 - 7.37) Midwest 8.41 (8.04 - 8.80) 9.54 (9.05 - 10.06) 20.86 (19.87 - 21.90) 6.11 (5.67 - 6.58) South 7.70 (7.37 - 8.05) 9.19 (8.70 - 9.71) 19.22 (18.22 - 20.25) 5.53 (5.13 - 5.95) West 10.62 (10.06 - 11.21) 11.81 (11.03 - 12.64) 24.02 (22.70 - 25.39) 8.05 (7.38 - 8.77) Alabama 7.59 (6.34 - 9.06) 9.15 (7.58 - 11.01) 17.27 (14.44 - 20.51) 5.70 (4.40 - 7.36) Alaska 13.65 (11.61 - 15.97) 11.09 (9.18 - 13.34) 26.04 (22.41 - 30.04) 11.59 (9.25 - 14.44) Arizona 9.52 (7.93 - 11.39) 11.34 (9.33 - 13.72) 19.94 (16.72 - 23.60) 7.51 (5.81 - 9.65) Arkansas 7.61 (6.31 - 9.15) 9.28 (7.67 - 11.20) 17.90 (15.07 - 21.14) 5.66 (4.31 - 7.39) California 10.47 (9.61 - 11.39) 12.14 (10.98 - 13.41) 24.09 (22.19 - 26.10) 7.70 (6.72 - 8.82) Colorado 13.39 (11.51 - 15.53) 13.24 (11.09 - 15.74) 30.50 (26.89 - 34.37) 10.45 (8.37 - 12.96) Connecticut 9.10 (7.67 - 10.76) 10.33 (8.54 - 12.43) 24.37 (20.86 - 28.24) 6.48 (5.01 - 8.34) Delaware 8.99 (7.58 - 10.65) 11.25 (9.29 - 13.55) 24.26 (20.75 - 28.16) 6.18 (4.71 - 8.07) District of Columbia 13.56 (11.56 - 15.85) 14.52 (12.12 - 17.31) 25.51 (21.88 - 29.51) 10.78 (8.48 - 13.61) Florida 8.32 (7.57 - 9.15) 9.10 (8.11 - 10.19) 21.00 (19.19 - 22.93) 6.31 (5.45 - 7.30) Georgia 6.51 (5.40 - 7.83) 8.74 (7.23 - 10.52) 16.85 (14.03 - 20.11) 4.37 (3.29 - 5.79) Hawaii 8.76 (7.29 - 10.49) 10.95 (9.01 - 13.24) 20.12 (16.94 - 23.73) 6.76 (5.21 - 8.72) Idaho 9.36 (7.85 - 11.11) 10.17 (8.40 - 12.26) 19.25 (16.20 - 22.71) 7.42 (5.79 - 9.45) Illinois 8.55 (7.81 - 9.36) 9.69 (8.66 - 10.84) 22.32 (20.53 - 24.22) 6.00 (5.17 - 6.96) Indiana 8.98 (7.55 - 10.65) 9.13 (7.54 - 11.01) 21.95 (18.79 - 25.48) 6.66 (5.15 - 8.58) Iowa 6.38 (5.34 - 7.61) 8.58 (7.04 - 10.42) 17.50 (14.69 - 20.72) 4.11 (3.09 - 5.45) Kansas 6.71 (5.52 - 8.14) 8.41 (6.86 - 10.27) 16.91 (13.94 - 20.35) 4.58 (3.42 - 6.10) Kentucky 6.94 (5.76 - 8.35) 8.53 (6.99 - 10.37) 17.74 (14.84 - 21.06) 4.97 (3.78 - 6.50) Louisiana 6.80 (5.73 - 8.04) 8.14 (6.76 - 9.78) 16.91 (14.44 - 19.70) 4.72 (3.63 - 6.13) Maine 9.60 (8.14 - 11.30) 10.48 (8.74 - 12.52) 26.31 (22.87 - 30.07) 7.09 (5.56 - 9.00) Maryland 7.40 (6.18 - 8.83) 8.91 (7.28 - 10.86) 20.26 (17.11 - 23.82) 5.07 (3.87 - 6.61) Massachusetts 11.55 (9.96 - 13.36) 12.94 (10.99 - 15.18) 30.23 (26.65 - 34.07) 8.11 (6.40 - 10.21) Michigan 10.71 (9.81 - 11.68) 10.95 (9.89 - 12.11) 23.30 (21.58 - 25.12) 8.51 (7.44 - 9.71) Minnesota 8.20 (6.89 - 9.73) 9.30 (7.72 - 11.17) 21.36 (18.28 - 24.80) 5.84 (4.50 - 7.54) Mississippi 8.15 (6.88 - 9.64) 9.59 (7.98 - 11.49) 18.62 (15.76 - 21.88) 6.00 (4.67 - 7.69) Missouri 7.30 (6.12 - 8.69) 9.20 (7.62 - 11.06) 20.61 (17.57 - 24.02) 4.79 (3.62 - 6.32) Montana 12.04 (10.43 - 13.86) 12.66 (10.66 - 14.97) 27.39 (24.04 - 31.02) 9.32 (7.56 - 11.45)
(continued)

3
120911
Table 1 Illicit Drug Use in the Past Month, by Age Group and State: Percentages, Annual Averages Based on 2010 and 2011 NSDUHs (continued)
State 12+
(Estimate)
12+ (95% Confidence
Interval) 12-17
(Estimate)
12-17 (95% Confidence
Interval) 18-25
(Estimate)
18-25 (95% Confidence
Interval) 26+
(Estimate)
26+ (95% Confidence
Interval) Nebraska 6.66 (5.49 - 8.05) 7.83 (6.36 - 9.59) 16.19 (13.46 - 19.36) 4.74 (3.56 - 6.29) Nevada 9.93 (8.23 - 11.93) 11.61 (9.47 - 14.15) 22.69 (19.22 - 26.57) 7.68 (5.87 - 9.99) New Hampshire 10.95 (9.31 - 12.84) 12.83 (10.76 - 15.22) 30.77 (27.27 - 34.52) 7.57 (5.84 - 9.77) New Jersey 7.98 (6.70 - 9.47) 9.99 (8.25 - 12.05) 21.92 (18.54 - 25.71) 5.62 (4.35 - 7.23) New Mexico 10.59 (8.98 - 12.44) 12.13 (10.09 - 14.53) 24.83 (21.41 - 28.60) 7.85 (6.13 - 10.02) New York 9.29 (8.43 - 10.23) 10.22 (9.08 - 11.48) 22.04 (20.18 - 24.02) 6.96 (5.99 - 8.08) North Carolina 8.86 (7.52 - 10.42) 10.33 (8.66 - 12.27) 24.05 (20.75 - 27.69) 6.15 (4.77 - 7.89) North Dakota 5.53 (4.51 - 6.75) 6.98 (5.58 - 8.69) 13.04 (10.74 - 15.74) 3.68 (2.65 - 5.09) Ohio 8.50 (7.74 - 9.32) 9.77 (8.77 - 10.86) 21.23 (19.57 - 23.00) 6.25 (5.38 - 7.25) Oklahoma 9.02 (7.57 - 10.72) 10.11 (8.34 - 12.20) 19.36 (16.22 - 22.95) 6.99 (5.44 - 8.93) Oregon 13.10 (11.19 - 15.27) 12.69 (10.70 - 14.98) 28.43 (24.93 - 32.20) 10.66 (8.55 - 13.22) Pennsylvania 8.07 (7.33 - 8.89) 9.27 (8.19 - 10.47) 20.52 (18.67 - 22.51) 5.86 (5.03 - 6.82) Rhode Island 14.52 (12.50 - 16.81) 13.39 (11.27 - 15.85) 34.15 (30.45 - 38.06) 10.91 (8.64 - 13.68) South Carolina 7.41 (6.19 - 8.84) 8.83 (7.31 - 10.64) 17.98 (15.17 - 21.19) 5.45 (4.20 - 7.06) South Dakota 5.95 (4.80 - 7.36) 8.12 (6.56 - 10.01) 14.20 (11.36 - 17.61) 4.20 (3.05 - 5.76) Tennessee 7.62 (6.33 - 9.14) 8.92 (7.38 - 10.74) 18.75 (15.85 - 22.05) 5.65 (4.32 - 7.37) Texas 7.15 (6.49 - 7.86) 9.06 (8.05 - 10.18) 17.40 (15.75 - 19.17) 4.92 (4.19 - 5.77) Utah 4.96 (4.03 - 6.09) 5.94 (4.62 - 7.61) 10.51 (8.21 - 13.35) 3.49 (2.58 - 4.70) Vermont 15.29 (13.31 - 17.50) 15.45 (13.12 - 18.10) 35.02 (31.19 - 39.04) 11.80 (9.60 - 14.41) Virginia 7.98 (6.72 - 9.46) 9.45 (7.87 - 11.31) 21.02 (17.88 - 24.56) 5.53 (4.26 - 7.16) Washington 11.92 (10.24 - 13.82) 12.53 (10.58 - 14.79) 29.01 (25.45 - 32.85) 9.01 (7.18 - 11.23) West Virginia 8.04 (6.71 - 9.61) 10.08 (8.35 - 12.13) 22.08 (19.06 - 25.43) 5.67 (4.31 - 7.41) Wisconsin 7.77 (6.44 - 9.35) 9.34 (7.69 - 11.30) 18.85 (15.89 - 22.22) 5.67 (4.31 - 7.42) Wyoming 7.13 (5.93 - 8.55) 8.46 (6.86 - 10.38) 16.31 (13.39 - 19.73) 5.31 (4.05 - 6.94) NOTE: Illicit Drugs include marijuana/hashish, cocaine (including crack), heroin, hallucinogens, inhalants, or prescription-type psychotherapeutics used nonmedically, including data from
original methamphetamine questions but not including new methamphetamine items added in 2005 and 2006. See Section B.4.8 in Appendix B of the Results from the 2008 National Survey on Drug Use and Health: National Findings.
NOTE: State and census region estimates, along with the 95 percent Bayesian confidence (credible) intervals, are based on a survey-weighted hierarchical Bayes estimation approach and generated by Markov Chain Monte Carlo techniques. For the "Total U.S." row, design-based (direct) estimates and corresponding 95 percent confidence intervals are given.
Source: SAMHSA, Center for Behavioral Health Statistics and Quality, National Survey on Drug Use and Health, 2010 and 2011 (2010 Data – Revised March 2012).

4
120911
Table 2 Marijuana Use in the Past Year, by Age Group and State: Percentages, Annual Averages Based on 2010 and 2011 NSDUHs
State 12+
(Estimate)
12+ (95% Confidence
Interval) 12-17
(Estimate)
12-17 (95% Confidence
Interval) 18-25
(Estimate)
18-25 (95% Confidence
Interval) 26+
(Estimate)
26+ (95% Confidence
Interval) Total U.S. 11.55 (11.25 - 11.86) 14.13 (13.66 - 14.60) 30.38 (29.67 - 31.09) 7.95 (7.62 - 8.30) Northeast 12.55 (12.01 - 13.11) 14.77 (13.96 - 15.62) 34.06 (32.77 - 35.37) 8.68 (8.07 - 9.34) Midwest 11.00 (10.60 - 11.41) 13.00 (12.38 - 13.64) 30.05 (29.00 - 31.12) 7.44 (6.98 - 7.94) South 9.97 (9.60 - 10.35) 12.79 (12.22 - 13.39) 26.95 (25.94 - 27.99) 6.68 (6.25 - 7.14) West 13.79 (13.14 - 14.46) 16.75 (15.80 - 17.74) 33.17 (31.75 - 34.62) 9.90 (9.13 - 10.72) Alabama 9.03 (7.74 - 10.50) 11.36 (9.60 - 13.40) 22.69 (19.56 - 26.16) 6.34 (5.03 - 7.97) Alaska 17.65 (15.46 - 20.08) 17.26 (14.78 - 20.06) 37.79 (33.78 - 41.98) 13.78 (11.27 - 16.75) Arizona 11.58 (9.86 - 13.56) 15.77 (13.36 - 18.51) 27.74 (24.15 - 31.64) 8.29 (6.45 - 10.59) Arkansas 9.27 (7.86 - 10.89) 11.70 (9.81 - 13.89) 24.25 (21.10 - 27.70) 6.43 (4.95 - 8.31) California 14.03 (13.01 - 15.11) 16.93 (15.48 - 18.48) 33.11 (30.97 - 35.31) 10.07 (8.88 - 11.41) Colorado 16.23 (14.26 - 18.41) 19.11 (16.38 - 22.16) 41.29 (37.37 - 45.32) 11.54 (9.39 - 14.10) Connecticut 13.39 (11.62 - 15.38) 16.25 (13.82 - 19.01) 36.94 (32.97 - 41.11) 9.23 (7.35 - 11.54) Delaware 13.25 (11.56 - 15.15) 16.48 (14.10 - 19.18) 36.95 (33.07 - 41.01) 8.91 (7.13 - 11.08) District of Columbia 18.48 (16.29 - 20.88) 18.23 (15.68 - 21.08) 36.90 (33.20 - 40.77) 14.33 (11.86 - 17.21) Florida 10.99 (10.14 - 11.90) 13.80 (12.59 - 15.10) 31.19 (29.17 - 33.28) 7.61 (6.66 - 8.69) Georgia 9.48 (8.17 - 10.97) 12.62 (10.68 - 14.84) 24.80 (21.59 - 28.32) 6.32 (4.97 - 8.00) Hawaii 11.86 (10.20 - 13.74) 14.95 (12.54 - 17.73) 29.53 (25.87 - 33.47) 8.79 (7.00 - 10.97) Idaho 11.50 (9.83 - 13.42) 14.06 (11.95 - 16.47) 25.92 (22.58 - 29.56) 8.48 (6.64 - 10.76) Illinois 11.40 (10.57 - 12.29) 13.08 (11.83 - 14.44) 31.68 (29.67 - 33.75) 7.64 (6.70 - 8.69) Indiana 10.29 (8.84 - 11.95) 11.30 (9.50 - 13.40) 28.63 (25.21 - 32.31) 6.90 (5.37 - 8.82) Iowa 9.89 (8.56 - 11.41) 12.91 (10.95 - 15.17) 27.87 (24.37 - 31.65) 6.29 (4.93 - 7.98) Kansas 9.56 (8.15 - 11.19) 13.20 (11.06 - 15.68) 26.63 (23.14 - 30.44) 5.87 (4.47 - 7.66) Kentucky 8.80 (7.51 - 10.28) 12.16 (10.20 - 14.43) 23.64 (20.45 - 27.15) 5.94 (4.64 - 7.58) Louisiana 8.58 (7.34 - 10.01) 10.85 (9.20 - 12.76) 21.98 (19.23 - 25.00) 5.77 (4.46 - 7.43) Maine 14.13 (12.34 - 16.14) 15.87 (13.56 - 18.48) 37.55 (33.82 - 41.44) 10.57 (8.64 - 12.86) Maryland 9.96 (8.53 - 11.61) 13.15 (11.06 - 15.57) 31.36 (27.63 - 35.35) 6.01 (4.57 - 7.87) Massachusetts 15.89 (14.03 - 17.96) 18.31 (15.92 - 20.97) 42.33 (38.40 - 46.36) 10.98 (8.96 - 13.38) Michigan 13.20 (12.27 - 14.19) 14.29 (13.04 - 15.64) 33.35 (31.50 - 35.25) 9.58 (8.48 - 10.81) Minnesota 10.93 (9.45 - 12.62) 13.19 (11.15 - 15.53) 32.04 (28.31 - 36.01) 7.09 (5.57 - 8.99) Mississippi 9.76 (8.41 - 11.29) 11.94 (10.03 - 14.15) 24.09 (21.01 - 27.47) 6.78 (5.35 - 8.55) Missouri 10.09 (8.67 - 11.71) 13.07 (11.09 - 15.34) 27.65 (24.30 - 31.28) 6.71 (5.24 - 8.56) Montana 16.35 (14.51 - 18.37) 20.12 (17.56 - 22.95) 38.73 (34.88 - 42.73) 12.07 (10.03 - 14.46)
(continued)

5
120911
Table 2 Marijuana Use in the Past Year, by Age Group and State: Percentages, Annual Averages Based on 2010 and 2011 NSDUHs (continued)
State 12+
(Estimate)
12+ (95% Confidence
Interval) 12-17
(Estimate)
12-17 (95% Confidence
Interval) 18-25
(Estimate)
18-25 (95% Confidence
Interval) 26+
(Estimate)
26+ (95% Confidence
Interval) Nebraska 9.20 (7.85 - 10.75) 11.13 (9.29 - 13.29) 25.00 (21.71 - 28.61) 6.01 (4.64 - 7.75) Nevada 12.75 (10.90 - 14.87) 17.16 (14.39 - 20.33) 31.87 (27.68 - 36.39) 9.15 (7.19 - 11.57) New Hampshire 14.07 (12.31 - 16.03) 18.51 (15.90 - 21.45) 41.35 (37.74 - 45.05) 9.20 (7.30 - 11.54) New Jersey 10.73 (9.31 - 12.35) 14.40 (12.29 - 16.82) 31.79 (28.16 - 35.66) 7.10 (5.62 - 8.92) New Mexico 13.29 (11.56 - 15.23) 18.66 (16.08 - 21.54) 33.94 (30.05 - 38.07) 8.92 (7.08 - 11.18) New York 12.47 (11.51 - 13.49) 13.95 (12.62 - 15.39) 31.68 (29.71 - 33.72) 8.95 (7.86 - 10.17) North Carolina 11.15 (9.67 - 12.84) 14.33 (12.21 - 16.73) 32.69 (29.01 - 36.61) 7.17 (5.63 - 9.10) North Dakota 8.91 (7.69 - 10.31) 11.05 (9.10 - 13.36) 24.50 (21.49 - 27.79) 5.17 (3.94 - 6.75) Ohio 11.50 (10.63 - 12.42) 13.48 (12.26 - 14.81) 31.40 (29.54 - 33.32) 7.99 (7.00 - 9.10) Oklahoma 10.15 (8.66 - 11.85) 13.60 (11.43 - 16.10) 24.71 (21.29 - 28.47) 7.03 (5.48 - 8.98) Oregon 16.01 (14.05 - 18.20) 18.63 (16.21 - 21.32) 39.19 (35.26 - 43.27) 11.96 (9.82 - 14.50) Pennsylvania 10.82 (9.94 - 11.77) 12.94 (11.67 - 14.34) 31.16 (29.00 - 33.41) 7.19 (6.22 - 8.29) Rhode Island 17.85 (15.79 - 20.11) 18.49 (15.83 - 21.48) 44.77 (40.74 - 48.87) 12.64 (10.34 - 15.36) South Carolina 10.66 (9.18 - 12.34) 13.59 (11.53 - 15.95) 27.57 (24.34 - 31.07) 7.45 (5.90 - 9.37) South Dakota 8.32 (6.99 - 9.87) 11.53 (9.50 - 13.92) 23.75 (20.27 - 27.61) 5.15 (3.88 - 6.82) Tennessee 9.36 (7.93 - 11.02) 11.47 (9.62 - 13.62) 24.70 (21.46 - 28.26) 6.62 (5.14 - 8.48) Texas 9.28 (8.54 - 10.08) 12.33 (11.13 - 13.63) 24.21 (22.47 - 26.03) 6.00 (5.16 - 6.96) Utah 7.06 (5.95 - 8.36) 9.56 (7.72 - 11.78) 18.25 (15.26 - 21.68) 3.97 (2.92 - 5.38) Vermont 18.76 (16.63 - 21.10) 20.82 (18.10 - 23.84) 46.82 (42.84 - 50.85) 13.60 (11.19 - 16.42) Virginia 9.98 (8.59 - 11.56) 12.88 (10.89 - 15.18) 28.92 (25.48 - 32.62) 6.33 (4.94 - 8.08) Washington 15.10 (13.26 - 17.15) 17.48 (14.98 - 20.28) 38.71 (35.03 - 42.53) 10.90 (8.89 - 13.31) West Virginia 10.37 (8.91 - 12.02) 13.61 (11.54 - 15.99) 28.79 (25.53 - 32.28) 7.20 (5.65 - 9.14) Wisconsin 9.57 (8.19 - 11.15) 12.18 (10.26 - 14.40) 26.81 (23.33 - 30.61) 6.27 (4.86 - 8.04) Wyoming 9.64 (8.31 - 11.15) 13.11 (11.06 - 15.47) 26.31 (22.98 - 29.94) 6.21 (4.83 - 7.95) NOTE: State and census region estimates, along with the 95 percent Bayesian confidence (credible) intervals, are based on a survey-weighted hierarchical Bayes estimation approach and
generated by Markov Chain Monte Carlo techniques. For the "Total U.S." row, design-based (direct) estimates and corresponding 95 percent confidence intervals are given. Source: SAMHSA, Center for Behavioral Health Statistics and Quality, National Survey on Drug Use and Health, 2010 and 2011 (2010 Data – Revised March 2012).

6
120911
Table 3 Marijuana Use in the Past Month, by Age Group and State: Percentages, Annual Averages Based on 2010 and 2011 NSDUHs
State 12+
(Estimate)
12+ (95% Confidence
Interval) 12-17
(Estimate)
12-17 (95% Confidence
Interval) 18-25
(Estimate)
18-25 (95% Confidence
Interval) 26+
(Estimate)
26+ (95% Confidence
Interval) Total U.S. 6.94 (6.71 - 7.17) 7.64 (7.30 - 8.00) 18.78 (18.22 - 19.35) 4.80 (4.54 - 5.07) Northeast 7.45 (7.03 - 7.89) 8.49 (7.89 - 9.14) 21.33 (20.17 - 22.54) 5.00 (4.54 - 5.51) Midwest 6.62 (6.30 - 6.94) 7.10 (6.65 - 7.58) 18.14 (17.22 - 19.09) 4.55 (4.20 - 4.94) South 5.83 (5.53 - 6.13) 6.63 (6.20 - 7.09) 16.40 (15.52 - 17.33) 3.90 (3.56 - 4.27) West 8.61 (8.11 - 9.14) 9.09 (8.36 - 9.86) 21.09 (19.87 - 22.36) 6.30 (5.71 - 6.94) Alabama 5.20 (4.26 - 6.32) 6.29 (4.97 - 7.92) 13.87 (11.53 - 16.60) 3.54 (2.62 - 4.77) Alaska 11.43 (9.64 - 13.50) 8.82 (7.03 - 11.02) 24.31 (20.86 - 28.12) 9.29 (7.26 - 11.81) Arizona 7.02 (5.69 - 8.63) 8.23 (6.45 - 10.44) 17.03 (14.14 - 20.37) 5.15 (3.80 - 6.95) Arkansas 5.09 (4.09 - 6.32) 6.07 (4.68 - 7.83) 13.82 (11.42 - 16.62) 3.49 (2.52 - 4.83) California 8.61 (7.85 - 9.43) 9.43 (8.32 - 10.68) 21.25 (19.45 - 23.17) 6.14 (5.27 - 7.14) Colorado 10.98 (9.34 - 12.87) 10.72 (8.70 - 13.13) 27.26 (23.70 - 31.13) 8.19 (6.43 - 10.38) Connecticut 7.25 (6.02 - 8.70) 8.59 (6.84 - 10.74) 21.92 (18.58 - 25.67) 4.71 (3.52 - 6.28) Delaware 7.01 (5.89 - 8.33) 8.28 (6.54 - 10.42) 21.43 (18.25 - 25.00) 4.45 (3.37 - 5.85) District of Columbia 11.15 (9.43 - 13.14) 10.60 (8.50 - 13.13) 23.08 (19.59 - 26.98) 8.50 (6.58 - 10.91) Florida 6.36 (5.70 - 7.10) 6.81 (5.95 - 7.79) 18.78 (17.07 - 20.62) 4.43 (3.71 - 5.27) Georgia 4.97 (4.04 - 6.11) 6.51 (5.16 - 8.19) 14.19 (11.65 - 17.18) 3.12 (2.25 - 4.30) Hawaii 6.93 (5.67 - 8.44) 8.29 (6.54 - 10.46) 17.58 (14.65 - 20.95) 5.13 (3.86 - 6.80) Idaho 7.13 (5.87 - 8.65) 7.47 (5.93 - 9.37) 15.67 (12.98 - 18.78) 5.51 (4.16 - 7.26) Illinois 6.87 (6.22 - 7.57) 7.61 (6.66 - 8.67) 19.56 (17.92 - 21.32) 4.55 (3.85 - 5.38) Indiana 6.52 (5.38 - 7.88) 6.51 (5.11 - 8.25) 18.22 (15.42 - 21.41) 4.44 (3.31 - 5.94) Iowa 5.18 (4.23 - 6.32) 6.08 (4.83 - 7.62) 15.51 (12.89 - 18.54) 3.21 (2.33 - 4.39) Kansas 5.44 (4.40 - 6.71) 6.31 (4.95 - 8.02) 14.42 (11.93 - 17.33) 3.64 (2.64 - 4.98) Kentucky 5.08 (4.15 - 6.21) 6.36 (4.99 - 8.08) 15.08 (12.55 - 18.03) 3.27 (2.40 - 4.45) Louisiana 4.84 (3.97 - 5.90) 5.48 (4.32 - 6.92) 13.49 (11.23 - 16.12) 3.14 (2.29 - 4.29) Maine 8.05 (6.76 - 9.55) 9.14 (7.37 - 11.27) 23.75 (20.65 - 27.15) 5.66 (4.34 - 7.35) Maryland 5.55 (4.55 - 6.75) 6.12 (4.72 - 7.89) 17.77 (14.88 - 21.09) 3.44 (2.52 - 4.68) Massachusetts 9.96 (8.52 - 11.62) 11.32 (9.38 - 13.60) 28.42 (24.95 - 32.16) 6.56 (5.07 - 8.46) Michigan 8.67 (7.89 - 9.52) 8.21 (7.27 - 9.25) 20.94 (19.31 - 22.67) 6.62 (5.71 - 7.65) Minnesota 6.44 (5.36 - 7.72) 6.83 (5.46 - 8.51) 18.73 (15.88 - 21.97) 4.32 (3.27 - 5.68) Mississippi 5.91 (4.87 - 7.16) 6.27 (4.98 - 7.88) 15.06 (12.58 - 17.93) 4.16 (3.12 - 5.53) Missouri 6.04 (4.99 - 7.30) 7.28 (5.80 - 9.11) 18.31 (15.47 - 21.53) 3.79 (2.77 - 5.16) Montana 10.32 (8.86 - 11.99) 10.40 (8.59 - 12.55) 24.66 (21.54 - 28.07) 7.84 (6.25 - 9.80)
(continued)

7
120911
Table 3 Marijuana Use in the Past Month, by Age Group and State: Percentages, Annual Averages Based on 2010 and 2011 NSDUHs (continued)
State 12+
(Estimate)
12+ (95% Confidence
Interval) 12-17
(Estimate)
12-17 (95% Confidence
Interval) 18-25
(Estimate)
18-25 (95% Confidence
Interval) 26+
(Estimate)
26+ (95% Confidence
Interval) Nebraska 5.57 (4.53 - 6.83) 6.16 (4.82 - 7.84) 13.81 (11.44 - 16.57) 3.96 (2.94 - 5.33) Nevada 7.64 (6.16 - 9.45) 8.53 (6.68 - 10.83) 19.68 (16.49 - 23.32) 5.61 (4.12 - 7.58) New Hampshire 8.66 (7.34 - 10.19) 11.35 (9.26 - 13.85) 27.03 (23.74 - 30.60) 5.42 (4.06 - 7.19) New Jersey 6.40 (5.36 - 7.63) 8.01 (6.39 - 9.99) 19.54 (16.49 - 22.99) 4.22 (3.21 - 5.52) New Mexico 8.29 (6.95 - 9.86) 9.27 (7.43 - 11.52) 21.27 (18.18 - 24.73) 5.85 (4.45 - 7.66) New York 7.40 (6.72 - 8.14) 8.08 (7.11 - 9.17) 19.85 (18.21 - 21.60) 5.15 (4.39 - 6.03) North Carolina 7.34 (6.11 - 8.81) 8.03 (6.48 - 9.90) 21.65 (18.49 - 25.18) 4.87 (3.66 - 6.47) North Dakota 4.54 (3.65 - 5.64) 4.78 (3.60 - 6.32) 11.30 (9.21 - 13.80) 3.00 (2.14 - 4.19) Ohio 6.47 (5.84 - 7.16) 7.10 (6.22 - 8.09) 18.30 (16.80 - 19.90) 4.45 (3.75 - 5.27) Oklahoma 6.58 (5.35 - 8.06) 7.20 (5.68 - 9.10) 15.15 (12.42 - 18.36) 4.92 (3.66 - 6.60) Oregon 10.98 (9.31 - 12.90) 10.26 (8.45 - 12.40) 25.35 (22.14 - 28.87) 8.73 (6.88 - 11.00) Pennsylvania 6.12 (5.51 - 6.80) 7.17 (6.26 - 8.21) 18.28 (16.56 - 20.14) 3.98 (3.33 - 4.74) Rhode Island 11.93 (10.25 - 13.85) 11.07 (9.03 - 13.49) 32.05 (28.35 - 35.99) 8.20 (6.41 - 10.42) South Carolina 5.94 (4.90 - 7.18) 6.37 (5.02 - 8.06) 16.02 (13.48 - 18.92) 4.18 (3.16 - 5.51) South Dakota 5.05 (4.00 - 6.35) 5.76 (4.40 - 7.50) 12.96 (10.25 - 16.25) 3.54 (2.55 - 4.90) Tennessee 5.44 (4.44 - 6.64) 6.24 (4.93 - 7.87) 14.98 (12.30 - 18.12) 3.79 (2.83 - 5.06) Texas 5.47 (4.90 - 6.11) 6.32 (5.46 - 7.30) 14.70 (13.24 - 16.29) 3.59 (2.96 - 4.34) Utah 3.56 (2.78 - 4.54) 3.72 (2.72 - 5.07) 8.31 (6.38 - 10.75) 2.41 (1.66 - 3.47) Vermont 13.12 (11.36 - 15.11) 14.04 (11.69 - 16.78) 33.18 (29.36 - 37.24) 9.48 (7.59 - 11.78) Virginia 5.93 (4.89 - 7.17) 7.22 (5.80 - 8.97) 17.87 (15.01 - 21.15) 3.69 (2.72 - 5.00) Washington 9.88 (8.44 - 11.55) 9.59 (7.86 - 11.65) 25.56 (22.40 - 29.00) 7.32 (5.77 - 9.25) West Virginia 5.98 (4.94 - 7.23) 7.33 (5.77 - 9.26) 19.69 (16.83 - 22.91) 3.74 (2.74 - 5.09) Wisconsin 5.76 (4.65 - 7.13) 6.36 (4.96 - 8.12) 15.57 (12.83 - 18.78) 3.99 (2.93 - 5.42) Wyoming 5.13 (4.13 - 6.36) 5.29 (4.08 - 6.83) 14.14 (11.48 - 17.30) 3.48 (2.52 - 4.79) NOTE: State and census region estimates, along with the 95 percent Bayesian confidence (credible) intervals, are based on a survey-weighted hierarchical Bayes estimation approach and
generated by Markov Chain Monte Carlo techniques. For the "Total U.S." row, design-based (direct) estimates and corresponding 95 percent confidence intervals are given. Source: SAMHSA, Center for Behavioral Health Statistics and Quality, National Survey on Drug Use and Health, 2010 and 2011 (2010 Data – Revised March 2012).

8
120911
Table 4 Perceptions of Great Risk of Smoking Marijuana Once a Month, by Age Group and State: Percentages, Annual Averages Based on 2010 and 2011 NSDUHs
State 12+
(Estimate)
12+ (95% Confidence
Interval) 12-17
(Estimate)
12-17 (95% Confidence
Interval) 18-25
(Estimate)
18-25 (95% Confidence
Interval) 26+
(Estimate)
26+ (95% Confidence
Interval) Total U.S. 32.32 (31.77 - 32.87) 28.58 (28.01 - 29.16) 18.29 (17.75 - 18.85) 35.23 (34.54 - 35.92) Northeast 30.60 (29.60 - 31.63) 25.25 (24.14 - 26.39) 15.80 (14.90 - 16.74) 33.71 (32.47 - 34.98) Midwest 31.10 (30.36 - 31.85) 29.30 (28.41 - 30.22) 17.02 (16.29 - 17.77) 33.77 (32.85 - 34.70) South 36.08 (35.31 - 36.85) 31.64 (30.73 - 32.57) 21.05 (20.27 - 21.85) 39.23 (38.27 - 40.19) West 28.86 (27.82 - 29.92) 25.60 (24.41 - 26.83) 17.09 (16.06 - 18.16) 31.42 (30.10 - 32.76) Alabama 38.38 (35.30 - 41.56) 38.29 (34.73 - 41.99) 24.56 (21.47 - 27.95) 40.81 (37.02 - 44.71) Alaska 22.26 (19.53 - 25.24) 24.82 (21.31 - 28.69) 12.46 (10.10 - 15.28) 23.81 (20.40 - 27.60) Arizona 29.94 (26.83 - 33.25) 25.92 (22.29 - 29.91) 17.74 (14.96 - 20.91) 32.54 (28.77 - 36.56) Arkansas 34.93 (31.86 - 38.14) 32.94 (29.16 - 36.95) 20.15 (17.37 - 23.24) 37.68 (33.94 - 41.57) California 30.53 (28.89 - 32.22) 24.65 (22.84 - 26.56) 18.45 (16.88 - 20.14) 33.58 (31.50 - 35.73) Colorado 21.00 (18.58 - 23.65) 21.09 (17.89 - 24.71) 10.90 (8.92 - 13.25) 22.75 (19.82 - 25.96) Connecticut 29.08 (25.98 - 32.37) 20.79 (17.40 - 24.64) 13.26 (10.96 - 15.95) 32.65 (28.89 - 36.65) Delaware 29.77 (26.94 - 32.76) 26.33 (22.85 - 30.14) 15.18 (12.80 - 17.92) 32.61 (29.16 - 36.25) District of Columbia 25.47 (22.53 - 28.65) 22.21 (18.95 - 25.85) 13.32 (11.04 - 15.98) 28.49 (24.89 - 32.40) Florida 38.60 (36.92 - 40.31) 30.66 (28.86 - 32.52) 20.27 (18.64 - 21.99) 42.24 (40.17 - 44.34) Georgia 34.79 (31.78 - 37.94) 32.29 (28.63 - 36.18) 22.13 (19.06 - 25.55) 37.39 (33.70 - 41.23) Hawaii 30.73 (27.69 - 33.94) 24.74 (21.23 - 28.61) 15.80 (13.32 - 18.63) 33.69 (30.03 - 37.56) Idaho 30.75 (27.87 - 33.79) 29.98 (26.53 - 33.67) 19.00 (16.25 - 22.09) 33.03 (29.44 - 36.83) Illinois 31.99 (30.40 - 33.63) 28.64 (26.80 - 30.55) 17.83 (16.35 - 19.41) 34.90 (32.90 - 36.96) Indiana 32.09 (29.11 - 35.22) 31.46 (27.85 - 35.31) 18.17 (15.57 - 21.09) 34.64 (30.98 - 38.49) Iowa 34.48 (31.42 - 37.66) 33.43 (29.88 - 37.18) 19.00 (16.27 - 22.07) 37.39 (33.65 - 41.29) Kansas 31.57 (28.70 - 34.60) 29.60 (26.03 - 33.43) 17.20 (14.70 - 20.03) 34.54 (31.00 - 38.27) Kentucky 37.56 (34.30 - 40.93) 38.56 (34.56 - 42.72) 24.79 (21.63 - 28.25) 39.55 (35.59 - 43.65) Louisiana 40.97 (38.01 - 44.00) 35.23 (31.83 - 38.78) 25.19 (22.39 - 28.21) 44.69 (40.96 - 48.48) Maine 24.07 (21.33 - 27.03) 24.40 (21.07 - 28.06) 12.34 (10.25 - 14.78) 25.72 (22.46 - 29.28) Maryland 32.53 (29.45 - 35.77) 26.08 (22.72 - 29.75) 16.90 (14.32 - 19.84) 35.92 (32.18 - 39.85) Massachusetts 24.19 (21.45 - 27.16) 20.49 (17.71 - 23.59) 12.26 (10.14 - 14.75) 26.71 (23.36 - 30.35) Michigan 28.52 (27.02 - 30.08) 26.11 (24.34 - 27.95) 15.07 (13.74 - 16.50) 31.16 (29.27 - 33.10) Minnesota 28.68 (25.99 - 31.53) 29.08 (25.67 - 32.74) 14.84 (12.51 - 17.51) 30.97 (27.69 - 34.45) Mississippi 41.82 (38.80 - 44.91) 40.70 (36.77 - 44.75) 27.26 (24.02 - 30.77) 44.70 (40.99 - 48.46) Missouri 32.74 (29.81 - 35.81) 27.46 (24.10 - 31.10) 19.14 (16.38 - 22.24) 35.72 (32.18 - 39.42) Montana 24.32 (21.87 - 26.95) 23.20 (20.12 - 26.59) 12.35 (10.27 - 14.78) 26.51 (23.53 - 29.72)
(continued)

9
120911
Table 4 Perceptions of Great Risk of Smoking Marijuana Once a Month, by Age Group and State: Percentages, Annual Averages Based on 2010 and 2011 NSDUHs (continued)
State 12+
(Estimate)
12+ (95% Confidence
Interval) 12-17
(Estimate)
12-17 (95% Confidence
Interval) 18-25
(Estimate)
18-25 (95% Confidence
Interval) 26+
(Estimate)
26+ (95% Confidence
Interval) Nebraska 32.23 (29.26 - 35.35) 33.52 (29.89 - 37.36) 18.05 (15.52 - 20.90) 34.71 (31.05 - 38.56) Nevada 28.11 (25.09 - 31.36) 25.34 (21.33 - 29.83) 15.43 (12.83 - 18.45) 30.49 (26.87 - 34.36) New Hampshire 23.25 (20.51 - 26.23) 20.82 (17.75 - 24.27) 9.93 (8.10 - 12.12) 25.65 (22.32 - 29.29) New Jersey 32.84 (29.80 - 36.04) 25.87 (22.55 - 29.49) 15.31 (12.78 - 18.25) 36.35 (32.64 - 40.21) New Mexico 33.40 (30.36 - 36.57) 25.23 (21.83 - 28.95) 17.11 (14.61 - 19.93) 37.35 (33.60 - 41.26) New York 32.57 (30.86 - 34.32) 26.37 (24.45 - 28.38) 17.85 (16.31 - 19.50) 35.86 (33.75 - 38.03) North Carolina 31.67 (28.68 - 34.81) 27.34 (23.90 - 31.07) 17.60 (15.03 - 20.50) 34.54 (30.93 - 38.34) North Dakota 34.12 (31.24 - 37.12) 36.34 (32.52 - 40.34) 20.00 (17.27 - 23.05) 37.04 (33.44 - 40.79) Ohio 31.44 (29.86 - 33.06) 29.39 (27.54 - 31.31) 16.53 (15.24 - 17.91) 34.14 (32.17 - 36.17) Oklahoma 35.30 (32.24 - 38.48) 32.08 (28.28 - 36.13) 20.35 (17.37 - 23.69) 38.45 (34.71 - 42.33) Oregon 21.23 (18.68 - 24.03) 23.15 (20.10 - 26.51) 11.64 (9.62 - 14.02) 22.57 (19.49 - 25.97) Pennsylvania 32.05 (30.41 - 33.73) 27.70 (25.73 - 29.75) 17.05 (15.49 - 18.73) 35.05 (33.03 - 37.13) Rhode Island 26.07 (23.18 - 29.19) 21.56 (18.42 - 25.07) 11.38 (9.37 - 13.74) 29.40 (25.80 - 33.27) South Carolina 37.37 (34.38 - 40.46) 29.96 (26.53 - 33.62) 20.53 (17.80 - 23.57) 41.09 (37.44 - 44.84) South Dakota 33.34 (30.35 - 36.47) 33.31 (29.56 - 37.27) 19.50 (16.42 - 22.99) 35.83 (32.23 - 39.60) Tennessee 34.32 (31.30 - 37.47) 30.88 (27.32 - 34.68) 19.19 (16.47 - 22.24) 37.19 (33.54 - 40.98) Texas 37.31 (35.63 - 39.02) 32.87 (30.92 - 34.88) 22.46 (20.79 - 24.24) 40.79 (38.63 - 42.98) Utah 39.38 (36.42 - 42.43) 44.34 (40.10 - 48.66) 27.31 (23.94 - 30.95) 41.44 (37.61 - 45.38) Vermont 23.79 (21.16 - 26.64) 25.11 (21.74 - 28.81) 11.22 (9.24 - 13.55) 25.87 (22.64 - 29.37) Virginia 31.31 (28.32 - 34.46) 25.82 (22.73 - 29.16) 18.70 (16.01 - 21.73) 34.16 (30.53 - 37.99) Washington 24.11 (21.38 - 27.06) 25.11 (21.92 - 28.60) 12.44 (10.35 - 14.87) 25.92 (22.63 - 29.51) West Virginia 37.09 (33.95 - 40.35) 32.65 (29.04 - 36.48) 20.35 (17.58 - 23.43) 40.12 (36.37 - 44.00) Wisconsin 29.28 (26.36 - 32.38) 31.14 (27.48 - 35.04) 15.68 (13.31 - 18.38) 31.41 (27.86 - 35.20) Wyoming 32.33 (29.39 - 35.41) 36.54 (32.71 - 40.54) 18.10 (15.25 - 21.34) 34.41 (30.79 - 38.21) NOTE: State and census region estimates, along with the 95 percent Bayesian confidence (credible) intervals, are based on a survey-weighted hierarchical Bayes estimation approach and
generated by Markov Chain Monte Carlo techniques. For the "Total U.S." row, design-based (direct) estimates and corresponding 95 percent confidence intervals are given. Source: SAMHSA, Center for Behavioral Health Statistics and Quality, National Survey on Drug Use and Health, 2010 and 2011 (2010 Data – Revised March 2012).

10
120911
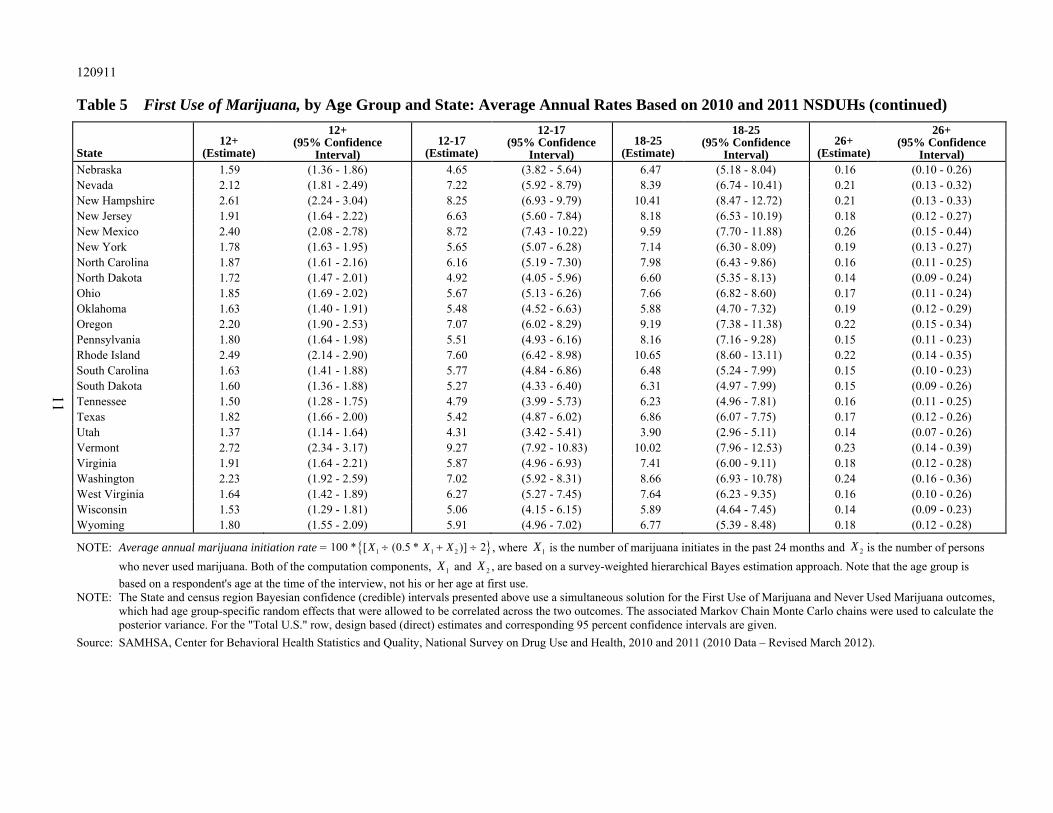
Table 5 First Use of Marijuana, by Age Group and State: Average Annual Rates Based on 2010 and 2011 NSDUHs
State 12+
(Estimate)
12+ (95% Confidence
Interval) 12-17
(Estimate)
12-17 (95% Confidence
Interval) 18-25
(Estimate)
18-25 (95% Confidence
Interval) 26+
(Estimate)
26+ (95% Confidence
Interval) Total U.S. 1.87 (1.80 - 1.94) 6.06 (5.83 - 6.31) 7.34 (6.96 - 7.74) 0.18 (0.14 - 0.23) Northeast 1.95 (1.83 - 2.06) 6.28 (5.90 - 6.69) 8.12 (7.52 - 8.76) 0.18 (0.13 - 0.25) Midwest 1.81 (1.71 - 1.91) 5.66 (5.37 - 5.95) 7.18 (6.74 - 7.64) 0.16 (0.12 - 0.23) South 1.67 (1.59 - 1.76) 5.50 (5.23 - 5.78) 6.60 (6.21 - 7.02) 0.17 (0.12 - 0.23) West 2.21 (2.07 - 2.35) 7.19 (6.73 - 7.69) 8.16 (7.49 - 8.88) 0.23 (0.16 - 0.32) Alabama 1.39 (1.19 - 1.63) 4.48 (3.74 - 5.36) 5.55 (4.45 - 6.91) 0.15 (0.09 - 0.24) Alaska 2.88 (2.46 - 3.37) 7.58 (6.40 - 8.96) 8.87 (7.04 - 11.13) 0.33 (0.20 - 0.54) Arizona 1.97 (1.69 - 2.29) 6.55 (5.43 - 7.87) 7.21 (5.84 - 8.89) 0.20 (0.13 - 0.31) Arkansas 1.51 (1.29 - 1.76) 4.82 (3.99 - 5.82) 5.92 (4.76 - 7.34) 0.16 (0.11 - 0.25) California 2.25 (2.06 - 2.46) 7.31 (6.61 - 8.07) 8.31 (7.32 - 9.42) 0.23 (0.16 - 0.35) Colorado 2.75 (2.36 - 3.21) 9.20 (7.77 - 10.86) 10.32 (8.17 - 12.97) 0.25 (0.16 - 0.39) Connecticut 2.04 (1.76 - 2.37) 6.62 (5.54 - 7.89) 9.04 (7.27 - 11.18) 0.17 (0.11 - 0.26) Delaware 2.29 (1.97 - 2.65) 7.29 (6.10 - 8.68) 9.93 (8.04 - 12.21) 0.21 (0.13 - 0.32) District of Columbia 2.98 (2.52 - 3.51) 8.28 (7.00 - 9.77) 11.25 (9.14 - 13.78) 0.33 (0.20 - 0.54) Florida 1.50 (1.37 - 1.65) 5.44 (4.90 - 6.04) 7.04 (6.21 - 7.97) 0.15 (0.10 - 0.23) Georgia 1.76 (1.52 - 2.05) 6.06 (5.08 - 7.21) 5.57 (4.42 - 6.99) 0.18 (0.12 - 0.27) Hawaii 2.01 (1.68 - 2.39) 7.39 (6.05 - 9.00) 8.43 (6.72 - 10.54) 0.29 (0.14 - 0.57) Idaho 1.93 (1.66 - 2.24) 5.68 (4.76 - 6.76) 6.79 (5.47 - 8.39) 0.18 (0.12 - 0.28) Illinois 1.85 (1.69 - 2.03) 5.80 (5.22 - 6.44) 7.56 (6.66 - 8.57) 0.18 (0.12 - 0.26) Indiana 1.73 (1.50 - 1.99) 5.20 (4.36 - 6.19) 7.28 (5.92 - 8.93) 0.15 (0.09 - 0.23) Iowa 1.75 (1.50 - 2.05) 5.60 (4.69 - 6.67) 7.20 (5.77 - 8.96) 0.15 (0.10 - 0.23) Kansas 1.85 (1.59 - 2.15) 6.09 (5.07 - 7.31) 6.59 (5.26 - 8.24) 0.17 (0.11 - 0.26) Kentucky 1.52 (1.31 - 1.77) 5.47 (4.57 - 6.54) 5.71 (4.60 - 7.06) 0.16 (0.10 - 0.25) Louisiana 1.42 (1.22 - 1.65) 4.55 (3.79 - 5.45) 5.32 (4.34 - 6.52) 0.15 (0.09 - 0.26) Maine 2.02 (1.74 - 2.35) 6.47 (5.44 - 7.68) 9.18 (7.44 - 11.28) 0.19 (0.12 - 0.30) Maryland 1.71 (1.46 - 1.99) 5.76 (4.78 - 6.93) 6.61 (5.25 - 8.28) 0.16 (0.10 - 0.25) Massachusetts 2.50 (2.16 - 2.90) 8.21 (7.00 - 9.60) 9.81 (7.89 - 12.13) 0.23 (0.15 - 0.37) Michigan 2.14 (1.96 - 2.34) 6.05 (5.47 - 6.69) 8.48 (7.57 - 9.49) 0.18 (0.12 - 0.26) Minnesota 1.83 (1.58 - 2.12) 5.90 (4.98 - 6.98) 7.12 (5.72 - 8.82) 0.17 (0.11 - 0.26) Mississippi 1.46 (1.25 - 1.70) 4.87 (4.02 - 5.89) 5.02 (3.97 - 6.31) 0.16 (0.09 - 0.27) Missouri 1.58 (1.36 - 1.84) 5.76 (4.84 - 6.83) 5.52 (4.36 - 6.96) 0.16 (0.10 - 0.25) Montana 2.80 (2.44 - 3.21) 9.20 (7.92 - 10.67) 11.48 (9.34 - 14.02) 0.24 (0.15 - 0.39)
(continued)
11
120911
Table 5 First Use of Marijuana, by Age Group and State: Average Annual Rates Based on 2010 and 2011 NSDUHs (continued)
State 12+
(Estimate)
12+ (95% Confidence
Interval) 12-17
(Estimate)
12-17 (95% Confidence
Interval) 18-25
(Estimate)
18-25 (95% Confidence
Interval) 26+
(Estimate)
26+ (95% Confidence
Interval) Nebraska 1.59 (1.36 - 1.86) 4.65 (3.82 - 5.64) 6.47 (5.18 - 8.04) 0.16 (0.10 - 0.26) Nevada 2.12 (1.81 - 2.49) 7.22 (5.92 - 8.79) 8.39 (6.74 - 10.41) 0.21 (0.13 - 0.32) New Hampshire 2.61 (2.24 - 3.04) 8.25 (6.93 - 9.79) 10.41 (8.47 - 12.72) 0.21 (0.13 - 0.33) New Jersey 1.91 (1.64 - 2.22) 6.63 (5.60 - 7.84) 8.18 (6.53 - 10.19) 0.18 (0.12 - 0.27) New Mexico 2.40 (2.08 - 2.78) 8.72 (7.43 - 10.22) 9.59 (7.70 - 11.88) 0.26 (0.15 - 0.44) New York 1.78 (1.63 - 1.95) 5.65 (5.07 - 6.28) 7.14 (6.30 - 8.09) 0.19 (0.13 - 0.27) North Carolina 1.87 (1.61 - 2.16) 6.16 (5.19 - 7.30) 7.98 (6.43 - 9.86) 0.16 (0.11 - 0.25) North Dakota 1.72 (1.47 - 2.01) 4.92 (4.05 - 5.96) 6.60 (5.35 - 8.13) 0.14 (0.09 - 0.24) Ohio 1.85 (1.69 - 2.02) 5.67 (5.13 - 6.26) 7.66 (6.82 - 8.60) 0.17 (0.11 - 0.24) Oklahoma 1.63 (1.40 - 1.91) 5.48 (4.52 - 6.63) 5.88 (4.70 - 7.32) 0.19 (0.12 - 0.29) Oregon 2.20 (1.90 - 2.53) 7.07 (6.02 - 8.29) 9.19 (7.38 - 11.38) 0.22 (0.15 - 0.34) Pennsylvania 1.80 (1.64 - 1.98) 5.51 (4.93 - 6.16) 8.16 (7.16 - 9.28) 0.15 (0.11 - 0.23) Rhode Island 2.49 (2.14 - 2.90) 7.60 (6.42 - 8.98) 10.65 (8.60 - 13.11) 0.22 (0.14 - 0.35) South Carolina 1.63 (1.41 - 1.88) 5.77 (4.84 - 6.86) 6.48 (5.24 - 7.99) 0.15 (0.10 - 0.23) South Dakota 1.60 (1.36 - 1.88) 5.27 (4.33 - 6.40) 6.31 (4.97 - 7.99) 0.15 (0.09 - 0.26) Tennessee 1.50 (1.28 - 1.75) 4.79 (3.99 - 5.73) 6.23 (4.96 - 7.81) 0.16 (0.11 - 0.25) Texas 1.82 (1.66 - 2.00) 5.42 (4.87 - 6.02) 6.86 (6.07 - 7.75) 0.17 (0.12 - 0.26) Utah 1.37 (1.14 - 1.64) 4.31 (3.42 - 5.41) 3.90 (2.96 - 5.11) 0.14 (0.07 - 0.26) Vermont 2.72 (2.34 - 3.17) 9.27 (7.92 - 10.83) 10.02 (7.96 - 12.53) 0.23 (0.14 - 0.39) Virginia 1.91 (1.64 - 2.21) 5.87 (4.96 - 6.93) 7.41 (6.00 - 9.11) 0.18 (0.12 - 0.28) Washington 2.23 (1.92 - 2.59) 7.02 (5.92 - 8.31) 8.66 (6.93 - 10.78) 0.24 (0.16 - 0.36) West Virginia 1.64 (1.42 - 1.89) 6.27 (5.27 - 7.45) 7.64 (6.23 - 9.35) 0.16 (0.10 - 0.26) Wisconsin 1.53 (1.29 - 1.81) 5.06 (4.15 - 6.15) 5.89 (4.64 - 7.45) 0.14 (0.09 - 0.23) Wyoming 1.80 (1.55 - 2.09) 5.91 (4.96 - 7.02) 6.77 (5.39 - 8.48) 0.18 (0.12 - 0.28)
NOTE: Average annual marijuana initiation rate = { }1 1 2100 * [ (0.5 * )] 2÷ + ÷X X X , where 1X is the number of marijuana initiates in the past 24 months and 2X is the number of persons who never used marijuana. Both of the computation components, 1X and 2X , are based on a survey-weighted hierarchical Bayes estimation approach. Note that the age group is based on a respondent's age at the time of the interview, not his or her age at first use.
NOTE: The State and census region Bayesian confidence (credible) intervals presented above use a simultaneous solution for the First Use of Marijuana and Never Used Marijuana outcomes, which had age group-specific random effects that were allowed to be correlated across the two outcomes. The associated Markov Chain Monte Carlo chains were used to calculate the posterior variance. For the "Total U.S." row, design based (direct) estimates and corresponding 95 percent confidence intervals are given.
Source: SAMHSA, Center for Behavioral Health Statistics and Quality, National Survey on Drug Use and Health, 2010 and 2011 (2010 Data – Revised March 2012).

12
120911
Table 6 Illicit Drug Use Other Than Marijuana in the Past Month, by Age Group and State: Percentages, Annual Averages Based on 2010 and 2011 NSDUHs
State 12+
(Estimate)
12+ (95% Confidence
Interval) 12-17
(Estimate)
12-17 (95% Confidence
Interval) 18-25
(Estimate)
18-25 (95% Confidence
Interval) 26+
(Estimate)
26+ (95% Confidence
Interval) Total U.S. 3.33 (3.19 - 3.49) 4.29 (4.06 - 4.55) 7.45 (7.11 - 7.81) 2.50 (2.32 - 2.68) Northeast 3.34 (3.07 - 3.64) 3.85 (3.49 - 4.24) 7.55 (6.94 - 8.21) 2.57 (2.27 - 2.92) Midwest 3.24 (3.03 - 3.47) 4.16 (3.85 - 4.50) 7.56 (7.07 - 8.09) 2.38 (2.13 - 2.65) South 3.18 (2.98 - 3.40) 4.21 (3.90 - 4.53) 6.95 (6.51 - 7.42) 2.40 (2.17 - 2.66) West 3.65 (3.33 - 3.99) 4.87 (4.36 - 5.44) 8.03 (7.33 - 8.80) 2.69 (2.34 - 3.09) Alabama 3.19 (2.50 - 4.07) 4.55 (3.60 - 5.73) 6.68 (5.13 - 8.65) 2.41 (1.70 - 3.40) Alaska 3.62 (2.79 - 4.68) 3.87 (2.99 - 4.99) 7.23 (5.51 - 9.44) 2.88 (2.01 - 4.11) Arizona 3.68 (2.84 - 4.77) 5.13 (4.02 - 6.54) 7.69 (5.86 - 10.04) 2.81 (1.95 - 4.04) Arkansas 3.93 (3.09 - 4.97) 5.17 (4.07 - 6.53) 8.52 (6.75 - 10.69) 3.00 (2.13 - 4.19) California 3.53 (3.06 - 4.07) 5.07 (4.32 - 5.95) 7.76 (6.72 - 8.95) 2.53 (2.02 - 3.17) Colorado 3.95 (3.16 - 4.92) 4.38 (3.42 - 5.60) 9.60 (7.70 - 11.91) 2.92 (2.11 - 4.01) Connecticut 3.48 (2.69 - 4.48) 3.70 (2.86 - 4.78) 7.75 (6.01 - 9.94) 2.76 (1.94 - 3.90) Delaware 3.98 (3.11 - 5.08) 4.31 (3.33 - 5.56) 9.70 (7.71 - 12.15) 2.98 (2.09 - 4.24) District of Columbia 4.29 (3.29 - 5.57) 4.00 (3.09 - 5.17) 6.94 (5.36 - 8.95) 3.72 (2.62 - 5.25) Florida 3.09 (2.66 - 3.58) 4.09 (3.51 - 4.76) 6.50 (5.59 - 7.55) 2.46 (1.99 - 3.04) Georgia 2.70 (2.08 - 3.48) 3.64 (2.82 - 4.69) 5.95 (4.53 - 7.78) 1.99 (1.37 - 2.87) Hawaii 3.07 (2.34 - 4.01) 4.29 (3.22 - 5.68) 6.71 (5.12 - 8.76) 2.37 (1.63 - 3.43) Idaho 3.71 (2.94 - 4.66) 4.52 (3.55 - 5.75) 7.83 (6.14 - 9.95) 2.83 (2.03 - 3.92) Illinois 3.06 (2.65 - 3.54) 4.08 (3.47 - 4.79) 7.43 (6.46 - 8.54) 2.17 (1.72 - 2.73) Indiana 3.66 (2.87 - 4.65) 4.26 (3.36 - 5.40) 8.64 (6.84 - 10.85) 2.70 (1.87 - 3.86) Iowa 2.61 (2.01 - 3.38) 4.26 (3.33 - 5.44) 6.33 (4.80 - 8.32) 1.74 (1.17 - 2.58) Kansas 3.14 (2.49 - 3.96) 4.21 (3.28 - 5.39) 6.88 (5.31 - 8.87) 2.30 (1.65 - 3.19) Kentucky 3.00 (2.34 - 3.83) 4.28 (3.35 - 5.46) 7.22 (5.55 - 9.35) 2.14 (1.50 - 3.06) Louisiana 3.44 (2.76 - 4.27) 4.39 (3.49 - 5.52) 7.70 (6.20 - 9.52) 2.51 (1.80 - 3.49) Maine 3.24 (2.58 - 4.06) 3.75 (2.92 - 4.80) 9.45 (7.61 - 11.69) 2.29 (1.64 - 3.19) Maryland 2.89 (2.23 - 3.72) 3.69 (2.86 - 4.74) 6.07 (4.67 - 7.87) 2.26 (1.57 - 3.22) Massachusetts 3.38 (2.65 - 4.29) 4.00 (3.15 - 5.08) 8.54 (6.74 - 10.77) 2.40 (1.68 - 3.41) Michigan 3.60 (3.13 - 4.15) 4.40 (3.77 - 5.14) 7.64 (6.66 - 8.75) 2.80 (2.26 - 3.47) Minnesota 3.15 (2.50 - 3.97) 3.76 (2.96 - 4.78) 7.59 (5.98 - 9.58) 2.33 (1.66 - 3.25) Mississippi 3.29 (2.62 - 4.11) 4.53 (3.56 - 5.76) 6.94 (5.41 - 8.87) 2.43 (1.76 - 3.37) Missouri 2.80 (2.21 - 3.54) 3.94 (3.08 - 5.02) 7.09 (5.52 - 9.06) 1.92 (1.34 - 2.76) Montana 3.12 (2.47 - 3.94) 4.63 (3.62 - 5.89) 7.13 (5.59 - 9.05) 2.26 (1.61 - 3.17)
(continued)

13
120911
Table 6 Illicit Drug Use Other Than Marijuana in the Past Month, by Age Group and State: Percentages, Annual Averages Based on 2010 and 2011 NSDUHs (continued)
State 12+
(Estimate)
12+ (95% Confidence
Interval) 12-17
(Estimate)
12-17 (95% Confidence
Interval) 18-25
(Estimate)
18-25 (95% Confidence
Interval) 26+
(Estimate)
26+ (95% Confidence
Interval) Nebraska 2.93 (2.28 - 3.76) 3.63 (2.81 - 4.69) 6.49 (5.02 - 8.36) 2.18 (1.52 - 3.10) Nevada 3.54 (2.73 - 4.59) 4.87 (3.73 - 6.34) 7.52 (5.75 - 9.78) 2.74 (1.91 - 3.93) New Hampshire 4.04 (3.23 - 5.05) 4.23 (3.29 - 5.44) 10.62 (8.65 - 12.97) 2.97 (2.12 - 4.14) New Jersey 3.29 (2.57 - 4.20) 3.86 (3.03 - 4.91) 7.77 (5.99 - 10.02) 2.54 (1.81 - 3.57) New Mexico 3.86 (3.05 - 4.87) 5.32 (4.16 - 6.77) 8.17 (6.41 - 10.37) 2.91 (2.07 - 4.07) New York 3.23 (2.74 - 3.81) 3.62 (3.03 - 4.31) 6.57 (5.61 - 7.68) 2.60 (2.05 - 3.30) North Carolina 3.04 (2.37 - 3.90) 4.06 (3.19 - 5.16) 7.14 (5.50 - 9.22) 2.23 (1.57 - 3.17) North Dakota 2.28 (1.71 - 3.04) 3.46 (2.58 - 4.64) 4.77 (3.56 - 6.35) 1.59 (1.02 - 2.47) Ohio 3.37 (2.94 - 3.86) 4.31 (3.70 - 5.02) 7.88 (6.92 - 8.98) 2.52 (2.05 - 3.09) Oklahoma 4.06 (3.16 - 5.18) 4.49 (3.50 - 5.75) 8.59 (6.73 - 10.91) 3.17 (2.24 - 4.46) Oregon 4.16 (3.30 - 5.23) 4.84 (3.83 - 6.09) 9.55 (7.64 - 11.87) 3.20 (2.30 - 4.45) Pennsylvania 3.24 (2.80 - 3.75) 4.09 (3.46 - 4.83) 7.46 (6.42 - 8.66) 2.44 (1.97 - 3.03) Rhode Island 4.78 (3.74 - 6.09) 4.16 (3.22 - 5.36) 9.95 (7.99 - 12.32) 3.87 (2.74 - 5.44) South Carolina 3.06 (2.40 - 3.90) 3.86 (3.03 - 4.89) 6.47 (5.04 - 8.27) 2.39 (1.70 - 3.36) South Dakota 2.61 (1.99 - 3.43) 3.95 (3.00 - 5.19) 5.89 (4.33 - 7.97) 1.86 (1.26 - 2.75) Tennessee 3.66 (2.88 - 4.64) 4.74 (3.74 - 6.00) 8.98 (7.04 - 11.40) 2.67 (1.89 - 3.75) Texas 3.09 (2.68 - 3.56) 4.38 (3.75 - 5.12) 6.30 (5.43 - 7.30) 2.29 (1.83 - 2.85) Utah 2.91 (2.25 - 3.75) 3.46 (2.66 - 4.49) 5.84 (4.40 - 7.72) 2.11 (1.45 - 3.08) Vermont 4.45 (3.56 - 5.54) 4.47 (3.50 - 5.70) 11.35 (9.16 - 13.97) 3.23 (2.33 - 4.45) Virginia 3.34 (2.63 - 4.25) 3.82 (3.00 - 4.85) 7.87 (6.21 - 9.93) 2.50 (1.76 - 3.54) Washington 4.23 (3.37 - 5.30) 4.74 (3.69 - 6.06) 9.90 (7.96 - 12.26) 3.23 (2.35 - 4.43) West Virginia 3.48 (2.78 - 4.34) 4.58 (3.60 - 5.81) 9.12 (7.31 - 11.33) 2.50 (1.80 - 3.44) Wisconsin 3.55 (2.81 - 4.47) 4.28 (3.37 - 5.42) 8.40 (6.60 - 10.62) 2.62 (1.88 - 3.64) Wyoming 2.86 (2.21 - 3.69) 4.15 (3.22 - 5.33) 5.81 (4.35 - 7.71) 2.18 (1.52 - 3.11) NOTE: Illicit Drugs Other Than Marijuana include cocaine (including crack), heroin, hallucinogens, inhalants, or prescription-type psychotherapeutics used nonmedically, including data
from original methamphetamine questions but not including new methamphetamine items added in 2005 and 2006. See Section B.4.8 in Appendix B of the Results from the 2008 National Survey on Drug Use and Health: National Findings.
NOTE: State and census region estimates, along with the 95 percent Bayesian confidence (credible) intervals, are based on a survey-weighted hierarchical Bayes estimation approach and generated by Markov Chain Monte Carlo techniques. For the "Total U.S." row, design-based (direct) estimates and corresponding 95 percent confidence intervals are given.
Source: SAMHSA, Center for Behavioral Health Statistics and Quality, National Survey on Drug Use and Health, 2010 and 2011 (2010 Data – Revised March 2012).

14
120911
Table 7 Cocaine Use in the Past Year, by Age Group and State: Percentages, Annual Averages Based on 2010 and 2011 NSDUHs
State 12+
(Estimate)
12+ (95% Confidence
Interval) 12-17
(Estimate)
12-17 (95% Confidence
Interval) 18-25
(Estimate)
18-25 (95% Confidence
Interval) 26+
(Estimate)
26+ (95% Confidence
Interval) Total U.S. 1.64 (1.54 - 1.74) 0.95 (0.84 - 1.07) 4.62 (4.34 - 4.91) 1.21 (1.10 - 1.33) Northeast 1.92 (1.71 - 2.15) 0.93 (0.78 - 1.11) 5.27 (4.73 - 5.88) 1.47 (1.23 - 1.75) Midwest 1.43 (1.28 - 1.59) 0.84 (0.71 - 0.98) 3.99 (3.59 - 4.45) 1.06 (0.89 - 1.26) South 1.43 (1.29 - 1.59) 0.86 (0.73 - 1.00) 3.87 (3.48 - 4.30) 1.08 (0.92 - 1.28) West 1.95 (1.73 - 2.20) 1.21 (0.99 - 1.48) 5.84 (5.20 - 6.56) 1.35 (1.11 - 1.64) Alabama 0.91 (0.59 - 1.39) 0.57 (0.35 - 0.92) 2.31 (1.45 - 3.66) 0.70 (0.41 - 1.20) Alaska 1.87 (1.34 - 2.61) 0.88 (0.58 - 1.33) 4.93 (3.48 - 6.93) 1.41 (0.88 - 2.27) Arizona 1.73 (1.22 - 2.43) 1.05 (0.69 - 1.59) 5.13 (3.64 - 7.18) 1.24 (0.79 - 1.93) Arkansas 1.07 (0.74 - 1.56) 0.77 (0.51 - 1.18) 2.94 (2.00 - 4.30) 0.79 (0.48 - 1.30) California 2.03 (1.69 - 2.43) 1.32 (0.99 - 1.75) 5.83 (4.87 - 6.96) 1.42 (1.07 - 1.88) Colorado 2.51 (1.91 - 3.29) 1.30 (0.89 - 1.91) 8.87 (6.76 - 11.55) 1.55 (1.03 - 2.33) Connecticut 1.91 (1.38 - 2.64) 1.05 (0.71 - 1.56) 5.70 (4.10 - 7.88) 1.41 (0.91 - 2.16) Delaware 1.83 (1.32 - 2.54) 0.87 (0.58 - 1.31) 4.85 (3.48 - 6.73) 1.44 (0.95 - 2.17) District of Columbia 3.04 (2.16 - 4.26) 0.36 (0.22 - 0.57) 3.97 (2.84 - 5.53) 3.05 (2.03 - 4.56) Florida 1.61 (1.32 - 1.96) 0.88 (0.67 - 1.15) 4.89 (4.04 - 5.92) 1.19 (0.89 - 1.58) Georgia 1.13 (0.77 - 1.66) 0.59 (0.38 - 0.92) 2.66 (1.75 - 4.02) 0.93 (0.59 - 1.49) Hawaii 1.60 (1.11 - 2.31) 0.84 (0.51 - 1.38) 4.00 (2.75 - 5.76) 1.31 (0.82 - 2.08) Idaho 0.94 (0.63 - 1.38) 0.73 (0.44 - 1.19) 3.04 (2.01 - 4.57) 0.58 (0.33 - 1.00) Illinois 1.81 (1.50 - 2.19) 0.94 (0.71 - 1.24) 4.60 (3.78 - 5.59) 1.43 (1.10 - 1.87) Indiana 1.01 (0.68 - 1.50) 0.68 (0.43 - 1.08) 3.07 (2.04 - 4.58) 0.69 (0.40 - 1.17) Iowa 1.00 (0.67 - 1.49) 0.79 (0.49 - 1.25) 2.99 (2.00 - 4.44) 0.67 (0.38 - 1.16) Kansas 1.41 (1.00 - 1.97) 0.99 (0.66 - 1.48) 4.16 (2.94 - 5.86) 0.95 (0.60 - 1.50) Kentucky 1.24 (0.87 - 1.76) 0.86 (0.57 - 1.31) 3.76 (2.61 - 5.39) 0.86 (0.54 - 1.38) Louisiana 1.35 (0.95 - 1.91) 0.58 (0.38 - 0.88) 3.03 (2.15 - 4.26) 1.13 (0.72 - 1.77) Maine 1.76 (1.30 - 2.38) 1.01 (0.67 - 1.50) 5.81 (4.26 - 7.87) 1.25 (0.84 - 1.87) Maryland 1.52 (1.06 - 2.18) 0.67 (0.44 - 1.01) 3.76 (2.57 - 5.47) 1.25 (0.80 - 1.95) Massachusetts 2.12 (1.57 - 2.87) 1.08 (0.76 - 1.54) 5.84 (4.33 - 7.84) 1.59 (1.06 - 2.36) Michigan 1.47 (1.20 - 1.79) 0.87 (0.66 - 1.15) 4.18 (3.46 - 5.04) 1.08 (0.80 - 1.45) Minnesota 1.26 (0.87 - 1.83) 0.77 (0.50 - 1.19) 3.59 (2.43 - 5.26) 0.93 (0.57 - 1.51) Mississippi 1.42 (0.98 - 2.04) 0.63 (0.41 - 0.98) 2.95 (1.99 - 4.37) 1.24 (0.80 - 1.92) Missouri 1.40 (0.99 - 1.97) 0.83 (0.56 - 1.23) 4.06 (2.86 - 5.72) 1.01 (0.64 - 1.60) Montana 1.40 (1.02 - 1.93) 1.02 (0.68 - 1.53) 4.44 (3.19 - 6.14) 0.92 (0.60 - 1.43)
(continued)

15
120911
Table 7 Cocaine Use in the Past Year, by Age Group and State: Percentages, Annual Averages Based on 2010 and 2011 NSDUHs (continued)
State 12+
(Estimate)
12+ (95% Confidence
Interval) 12-17
(Estimate)
12-17 (95% Confidence
Interval) 18-25
(Estimate)
18-25 (95% Confidence
Interval) 26+
(Estimate)
26+ (95% Confidence
Interval) Nebraska 1.40 (1.00 - 1.96) 0.95 (0.65 - 1.40) 4.11 (2.92 - 5.75) 0.96 (0.61 - 1.50) Nevada 1.86 (1.34 - 2.58) 1.16 (0.75 - 1.77) 5.76 (4.10 - 8.01) 1.33 (0.87 - 2.03) New Hampshire 2.19 (1.64 - 2.92) 1.19 (0.81 - 1.73) 7.49 (5.70 - 9.79) 1.46 (0.97 - 2.20) New Jersey 2.07 (1.51 - 2.84) 1.00 (0.67 - 1.48) 5.80 (4.22 - 7.91) 1.64 (1.09 - 2.45) New Mexico 2.04 (1.51 - 2.76) 1.44 (0.96 - 2.16) 5.99 (4.43 - 8.05) 1.42 (0.93 - 2.15) New York 1.85 (1.52 - 2.24) 0.85 (0.64 - 1.13) 4.79 (3.98 - 5.75) 1.45 (1.10 - 1.91) North Carolina 1.64 (1.16 - 2.30) 0.90 (0.60 - 1.35) 4.42 (3.14 - 6.18) 1.26 (0.82 - 1.95) North Dakota 0.89 (0.58 - 1.38) 0.64 (0.37 - 1.09) 2.37 (1.54 - 3.64) 0.60 (0.32 - 1.11) Ohio 1.46 (1.18 - 1.80) 0.78 (0.59 - 1.04) 4.01 (3.31 - 4.85) 1.12 (0.83 - 1.52) Oklahoma 1.25 (0.87 - 1.78) 0.84 (0.55 - 1.29) 3.65 (2.49 - 5.33) 0.86 (0.54 - 1.36) Oregon 2.11 (1.60 - 2.77) 1.26 (0.88 - 1.81) 7.12 (5.46 - 9.24) 1.39 (0.94 - 2.05) Pennsylvania 1.71 (1.38 - 2.11) 0.82 (0.61 - 1.11) 4.63 (3.78 - 5.67) 1.32 (0.99 - 1.77) Rhode Island 2.58 (1.92 - 3.47) 1.10 (0.75 - 1.62) 7.10 (5.39 - 9.29) 1.89 (1.26 - 2.84) South Carolina 1.37 (0.95 - 1.97) 0.65 (0.43 - 0.99) 3.13 (2.15 - 4.54) 1.16 (0.75 - 1.79) South Dakota 0.96 (0.63 - 1.46) 0.69 (0.41 - 1.14) 2.74 (1.75 - 4.28) 0.68 (0.40 - 1.16) Tennessee 1.22 (0.84 - 1.78) 0.76 (0.50 - 1.15) 3.19 (2.13 - 4.75) 0.96 (0.60 - 1.52) Texas 1.52 (1.24 - 1.85) 1.16 (0.89 - 1.52) 4.25 (3.48 - 5.18) 1.05 (0.77 - 1.43) Utah 1.38 (0.98 - 1.96) 0.87 (0.56 - 1.34) 3.78 (2.63 - 5.39) 0.91 (0.56 - 1.47) Vermont 2.69 (2.08 - 3.48) 1.43 (0.97 - 2.12) 9.04 (7.02 - 11.57) 1.71 (1.16 - 2.52) Virginia 1.53 (1.11 - 2.10) 0.80 (0.54 - 1.19) 4.23 (3.08 - 5.79) 1.15 (0.75 - 1.74) Washington 1.93 (1.45 - 2.57) 1.04 (0.71 - 1.52) 6.10 (4.54 - 8.14) 1.35 (0.92 - 1.99) West Virginia 1.39 (1.00 - 1.92) 1.01 (0.66 - 1.52) 4.71 (3.45 - 6.40) 0.92 (0.58 - 1.45) Wisconsin 1.48 (1.06 - 2.07) 0.86 (0.58 - 1.27) 4.52 (3.20 - 6.34) 1.04 (0.66 - 1.61) Wyoming 1.16 (0.77 - 1.73) 0.76 (0.48 - 1.21) 3.55 (2.41 - 5.21) 0.77 (0.42 - 1.43) NOTE: State and census region estimates, along with the 95 percent Bayesian confidence (credible) intervals, are based on a survey-weighted hierarchical Bayes estimation approach and
generated by Markov Chain Monte Carlo techniques. For the "Total U.S." row, design-based (direct) estimates and corresponding 95 percent confidence intervals are given. Source: SAMHSA, Center for Behavioral Health Statistics and Quality, National Survey on Drug Use and Health, 2010 and 2011 (2010 Data – Revised March 2012).

16
120911
Table 8 Nonmedical Use of Pain Relievers in the Past Year, by Age Group and State: Percentages, Annual Averages Based on 2010 and 2011 NSDUHs
State 12+
(Estimate)
12+ (95% Confidence
Interval) 12-17
(Estimate)
12-17 (95% Confidence
Interval) 18-25
(Estimate)
18-25 (95% Confidence
Interval) 26+
(Estimate)
26+ (95% Confidence
Interval) Total U.S. 4.57 (4.41 - 4.75) 6.09 (5.81 - 6.39) 10.43 (10.04 - 10.84) 3.37 (3.17 - 3.58) Northeast 4.17 (3.88 - 4.49) 5.18 (4.73 - 5.67) 10.22 (9.52 - 10.96) 3.04 (2.72 - 3.40) Midwest 4.68 (4.43 - 4.95) 6.24 (5.84 - 6.65) 11.23 (10.65 - 11.83) 3.35 (3.06 - 3.67) South 4.37 (4.13 - 4.62) 6.06 (5.68 - 6.46) 9.92 (9.39 - 10.47) 3.20 (2.93 - 3.49) West 5.12 (4.73 - 5.53) 6.68 (6.09 - 7.32) 10.66 (9.88 - 11.50) 3.91 (3.46 - 4.42) Alabama 4.43 (3.64 - 5.39) 6.56 (5.31 - 8.08) 10.09 (8.14 - 12.44) 3.18 (2.38 - 4.22) Alaska 5.32 (4.41 - 6.42) 6.89 (5.47 - 8.64) 10.69 (8.59 - 13.23) 4.06 (3.09 - 5.32) Arizona 5.66 (4.60 - 6.94) 8.04 (6.44 - 10.00) 11.49 (9.26 - 14.16) 4.36 (3.25 - 5.82) Arkansas 5.55 (4.60 - 6.68) 7.81 (6.34 - 9.59) 12.89 (10.69 - 15.46) 4.02 (3.05 - 5.29) California 4.68 (4.13 - 5.30) 6.06 (5.27 - 6.97) 9.35 (8.19 - 10.65) 3.62 (3.00 - 4.36) Colorado 6.00 (4.96 - 7.24) 7.40 (5.85 - 9.31) 14.01 (11.63 - 16.79) 4.44 (3.35 - 5.87) Connecticut 4.38 (3.52 - 5.45) 4.70 (3.68 - 5.99) 10.73 (8.67 - 13.20) 3.32 (2.45 - 4.48) Delaware 5.61 (4.61 - 6.82) 5.95 (4.69 - 7.52) 14.26 (11.71 - 17.26) 4.13 (3.11 - 5.48) District of Columbia 4.68 (3.79 - 5.76) 4.23 (3.23 - 5.51) 8.35 (6.68 - 10.38) 3.88 (2.92 - 5.13) Florida 4.05 (3.57 - 4.59) 5.50 (4.77 - 6.34) 8.59 (7.46 - 9.86) 3.21 (2.67 - 3.85) Georgia 3.79 (3.10 - 4.64) 5.37 (4.27 - 6.74) 8.76 (6.93 - 11.03) 2.70 (2.01 - 3.60) Hawaii 3.90 (3.09 - 4.90) 5.69 (4.35 - 7.42) 8.19 (6.39 - 10.44) 3.04 (2.22 - 4.15) Idaho 5.73 (4.74 - 6.91) 7.15 (5.77 - 8.83) 11.98 (9.77 - 14.61) 4.37 (3.33 - 5.71) Illinois 4.07 (3.58 - 4.62) 5.16 (4.45 - 5.98) 10.19 (9.01 - 11.50) 2.86 (2.34 - 3.49) Indiana 5.68 (4.68 - 6.89) 6.97 (5.59 - 8.66) 14.41 (11.90 - 17.34) 3.97 (2.95 - 5.31) Iowa 3.62 (2.92 - 4.49) 5.81 (4.64 - 7.24) 9.12 (7.26 - 11.39) 2.37 (1.70 - 3.30) Kansas 4.56 (3.77 - 5.50) 6.23 (5.03 - 7.69) 10.25 (8.33 - 12.55) 3.26 (2.47 - 4.30) Kentucky 4.48 (3.70 - 5.41) 6.67 (5.42 - 8.19) 10.82 (8.77 - 13.30) 3.17 (2.40 - 4.17) Louisiana 4.87 (4.09 - 5.80) 6.46 (5.28 - 7.87) 11.60 (9.66 - 13.87) 3.40 (2.60 - 4.44) Maine 4.15 (3.37 - 5.11) 5.72 (4.54 - 7.19) 11.29 (9.23 - 13.75) 2.96 (2.18 - 4.00) Maryland 3.89 (3.14 - 4.81) 4.63 (3.65 - 5.86) 9.13 (7.29 - 11.38) 2.93 (2.19 - 3.91) Massachusetts 4.27 (3.51 - 5.19) 4.94 (3.93 - 6.20) 10.65 (8.64 - 13.05) 3.07 (2.32 - 4.06) Michigan 5.11 (4.57 - 5.72) 6.35 (5.55 - 7.25) 11.74 (10.61 - 12.98) 3.81 (3.19 - 4.55) Minnesota 4.57 (3.79 - 5.49) 6.20 (4.97 - 7.72) 11.34 (9.24 - 13.85) 3.23 (2.45 - 4.24) Mississippi 4.45 (3.67 - 5.39) 6.86 (5.55 - 8.45) 9.59 (7.74 - 11.83) 3.16 (2.39 - 4.17) Missouri 4.83 (4.03 - 5.78) 6.77 (5.50 - 8.31) 11.74 (9.65 - 14.21) 3.41 (2.61 - 4.45) Montana 4.84 (4.02 - 5.80) 7.62 (6.17 - 9.39) 10.68 (8.70 - 13.06) 3.51 (2.68 - 4.59)
(continued)

17
120911
Table 8 Nonmedical Use of Pain Relievers in the Past Year, by Age Group and State: Percentages, Annual Averages Based on 2010 and 2011 NSDUHs (continued)
State 12+
(Estimate)
12+ (95% Confidence
Interval) 12-17
(Estimate)
12-17 (95% Confidence
Interval) 18-25
(Estimate)
18-25 (95% Confidence
Interval) 26+
(Estimate)
26+ (95% Confidence
Interval) Nebraska 4.18 (3.42 - 5.10) 5.11 (4.05 - 6.42) 9.24 (7.39 - 11.49) 3.12 (2.36 - 4.12) Nevada 5.62 (4.57 - 6.89) 7.79 (6.14 - 9.83) 11.94 (9.60 - 14.76) 4.34 (3.24 - 5.79) New Hampshire 4.57 (3.77 - 5.53) 6.11 (4.92 - 7.57) 12.31 (10.24 - 14.72) 3.16 (2.36 - 4.22) New Jersey 4.14 (3.39 - 5.06) 5.14 (4.04 - 6.50) 11.00 (8.95 - 13.45) 2.98 (2.25 - 3.96) New Mexico 5.45 (4.47 - 6.64) 8.60 (6.87 - 10.71) 11.22 (9.01 - 13.89) 4.02 (2.99 - 5.39) New York 3.98 (3.48 - 4.56) 4.70 (4.01 - 5.50) 8.90 (7.77 - 10.17) 3.04 (2.47 - 3.72) North Carolina 4.00 (3.23 - 4.93) 6.28 (5.09 - 7.72) 8.96 (7.11 - 11.24) 2.89 (2.13 - 3.91) North Dakota 3.84 (3.11 - 4.73) 5.54 (4.34 - 7.04) 7.84 (6.20 - 9.87) 2.74 (2.02 - 3.72) Ohio 5.00 (4.49 - 5.56) 7.12 (6.27 - 8.07) 11.84 (10.67 - 13.12) 3.61 (3.05 - 4.28) Oklahoma 5.19 (4.26 - 6.30) 7.04 (5.66 - 8.71) 11.11 (9.03 - 13.60) 3.86 (2.91 - 5.10) Oregon 6.37 (5.25 - 7.71) 7.36 (5.93 - 9.10) 15.00 (12.51 - 17.89) 4.86 (3.68 - 6.39) Pennsylvania 4.20 (3.72 - 4.74) 6.00 (5.19 - 6.92) 10.80 (9.48 - 12.26) 2.90 (2.40 - 3.50) Rhode Island 5.18 (4.26 - 6.27) 5.33 (4.25 - 6.67) 12.30 (10.11 - 14.88) 3.80 (2.86 - 5.03) South Carolina 4.62 (3.81 - 5.59) 5.94 (4.75 - 7.40) 10.67 (8.72 - 13.00) 3.44 (2.61 - 4.53) South Dakota 3.69 (2.92 - 4.65) 5.55 (4.36 - 7.03) 7.78 (5.94 - 10.12) 2.72 (1.97 - 3.75) Tennessee 5.00 (4.14 - 6.02) 6.94 (5.62 - 8.55) 13.07 (10.74 - 15.81) 3.46 (2.63 - 4.54) Texas 4.33 (3.84 - 4.89) 6.03 (5.22 - 6.96) 9.21 (8.12 - 10.42) 3.16 (2.60 - 3.83) Utah 4.33 (3.55 - 5.27) 5.62 (4.35 - 7.22) 8.23 (6.48 - 10.40) 3.18 (2.39 - 4.21) Vermont 5.13 (4.24 - 6.19) 6.47 (5.26 - 7.93) 13.00 (10.75 - 15.63) 3.59 (2.71 - 4.75) Virginia 4.60 (3.79 - 5.58) 5.95 (4.79 - 7.37) 11.39 (9.29 - 13.90) 3.25 (2.45 - 4.31) Washington 5.75 (4.76 - 6.92) 7.44 (6.02 - 9.15) 13.40 (11.09 - 16.11) 4.28 (3.24 - 5.63) West Virginia 4.79 (3.97 - 5.75) 7.21 (5.82 - 8.90) 12.35 (10.23 - 14.82) 3.38 (2.57 - 4.42) Wisconsin 4.51 (3.68 - 5.52) 6.09 (4.84 - 7.64) 10.55 (8.51 - 13.01) 3.27 (2.45 - 4.37) Wyoming 4.68 (3.85 - 5.68) 6.60 (5.31 - 8.18) 9.89 (7.88 - 12.34) 3.51 (2.67 - 4.62) NOTE: State and census region estimates, along with the 95 percent Bayesian confidence (credible) intervals, are based on a survey-weighted hierarchical Bayes estimation approach and
generated by Markov Chain Monte Carlo techniques. For the "Total U.S." row, design-based (direct) estimates and corresponding 95 percent confidence intervals are given. Source: SAMHSA, Center for Behavioral Health Statistics and Quality, National Survey on Drug Use and Health, 2010 and 2011 (2010 Data – Revised March 2012).

18
120911
Table 9 Alcohol Use in the Past Month, by Age Group and State: Percentages, Annual Averages Based on 2010 and 2011 NSDUHs
State 12+
(Estimate)
12+ (95% Confidence
Interval) 12-17
(Estimate)
12-17 (95% Confidence
Interval) 18-25
(Estimate)
18-25 (95% Confidence
Interval) 26+
(Estimate)
26+ (95% Confidence
Interval) Total U.S. 51.79 (51.23 - 52.35) 13.47 (13.03 - 13.93) 61.03 (60.26 - 61.81) 54.99 (54.29 - 55.68) Northeast 56.93 (55.75 - 58.11) 15.89 (14.99 - 16.83) 66.64 (65.07 - 68.16) 60.12 (58.69 - 61.53) Midwest 54.34 (53.32 - 55.35) 13.41 (12.80 - 14.03) 64.26 (62.92 - 65.59) 57.78 (56.56 - 58.99) South 48.26 (47.28 - 49.24) 12.44 (11.87 - 13.03) 57.80 (56.45 - 59.13) 51.11 (49.95 - 52.28) West 50.96 (49.75 - 52.16) 13.39 (12.54 - 14.29) 58.89 (57.23 - 60.52) 54.43 (52.96 - 55.89) Alabama 43.11 (39.96 - 46.32) 11.65 (9.78 - 13.82) 51.29 (47.46 - 55.10) 45.64 (41.75 - 49.58) Alaska 53.78 (50.31 - 57.22) 12.42 (10.29 - 14.92) 60.76 (56.41 - 64.94) 58.22 (53.92 - 62.40) Arizona 48.68 (45.04 - 52.33) 12.72 (10.54 - 15.26) 55.42 (51.14 - 59.62) 52.21 (47.76 - 56.62) Arkansas 40.83 (37.52 - 44.22) 12.98 (10.85 - 15.46) 50.06 (46.17 - 53.96) 42.80 (38.77 - 46.92) California 49.80 (47.99 - 51.60) 13.67 (12.33 - 15.12) 59.28 (56.98 - 61.53) 52.90 (50.64 - 55.15) Colorado 61.45 (58.23 - 64.56) 15.48 (12.94 - 18.41) 70.39 (66.50 - 74.00) 65.42 (61.48 - 69.16) Connecticut 61.34 (58.08 - 64.51) 16.80 (14.24 - 19.71) 70.93 (67.01 - 74.56) 65.31 (61.36 - 69.06) Delaware 54.73 (51.35 - 58.07) 14.60 (12.28 - 17.27) 66.67 (62.91 - 70.23) 57.45 (53.32 - 61.48) District of Columbia 62.93 (59.49 - 66.25) 14.16 (11.80 - 16.90) 74.76 (71.29 - 77.94) 64.26 (60.02 - 68.29) Florida 50.92 (49.11 - 52.73) 12.62 (11.44 - 13.90) 57.64 (55.37 - 59.88) 54.03 (51.83 - 56.21) Georgia 46.48 (43.36 - 49.64) 11.71 (9.74 - 14.02) 53.86 (49.96 - 57.71) 49.89 (46.00 - 53.79) Hawaii 48.16 (44.75 - 51.59) 14.22 (11.62 - 17.29) 61.85 (57.75 - 65.79) 49.76 (45.66 - 53.87) Idaho 49.05 (45.76 - 52.35) 12.14 (10.11 - 14.51) 50.66 (46.62 - 54.68) 53.97 (49.83 - 58.06) Illinois 55.04 (53.21 - 56.86) 13.33 (12.01 - 14.77) 65.05 (62.88 - 67.16) 58.70 (56.42 - 60.93) Indiana 50.95 (47.66 - 54.24) 11.56 (9.59 - 13.87) 61.05 (57.07 - 64.88) 54.31 (50.18 - 58.38) Iowa 54.06 (50.78 - 57.30) 15.79 (13.51 - 18.36) 66.73 (62.85 - 70.40) 56.43 (52.40 - 60.38) Kansas 51.62 (48.34 - 54.89) 13.26 (11.06 - 15.82) 61.83 (57.86 - 65.66) 54.76 (50.73 - 58.73) Kentucky 40.63 (37.38 - 43.95) 12.80 (10.61 - 15.35) 51.03 (46.88 - 55.16) 42.24 (38.31 - 46.27) Louisiana 47.23 (44.25 - 50.24) 14.10 (12.05 - 16.43) 58.21 (54.55 - 61.78) 49.51 (45.78 - 53.25) Maine 54.68 (51.25 - 58.06) 12.42 (10.34 - 14.86) 62.68 (58.82 - 66.39) 58.01 (53.88 - 62.03) Maryland 54.93 (51.50 - 58.31) 12.59 (10.53 - 14.99) 64.12 (60.04 - 68.01) 58.57 (54.40 - 62.63) Massachusetts 63.01 (59.89 - 66.02) 15.80 (13.50 - 18.40) 70.56 (66.71 - 74.14) 67.06 (63.26 - 70.65) Michigan 53.55 (51.81 - 55.28) 12.73 (11.53 - 14.04) 62.98 (60.87 - 65.04) 57.15 (54.97 - 59.31) Minnesota 59.48 (56.29 - 62.59) 13.14 (11.00 - 15.62) 67.52 (63.61 - 71.20) 63.75 (59.87 - 67.45) Mississippi 40.41 (37.43 - 43.45) 11.86 (9.95 - 14.09) 51.80 (47.86 - 55.73) 42.20 (38.52 - 45.96) Missouri 49.90 (46.69 - 53.11) 14.96 (12.74 - 17.48) 60.80 (57.05 - 64.43) 52.36 (48.46 - 56.23) Montana 60.15 (57.04 - 63.18) 17.17 (14.74 - 19.90) 68.38 (64.83 - 71.74) 63.63 (59.83 - 67.27)
(continued)

19
120911
Table 9 Alcohol Use in the Past Month, by Age Group and State: Percentages, Annual Averages Based on 2010 and 2011 NSDUHs (continued)
State 12+
(Estimate)
12+ (95% Confidence
Interval) 12-17
(Estimate)
12-17 (95% Confidence
Interval) 18-25
(Estimate)
18-25 (95% Confidence
Interval) 26+
(Estimate)
26+ (95% Confidence
Interval) Nebraska 53.32 (50.03 - 56.59) 12.84 (10.79 - 15.20) 64.11 (60.39 - 67.67) 56.44 (52.34 - 60.44) Nevada 53.92 (50.24 - 57.55) 13.08 (10.70 - 15.89) 59.08 (54.71 - 63.32) 58.22 (53.74 - 62.56) New Hampshire 61.61 (58.21 - 64.90) 17.04 (14.46 - 19.98) 73.22 (69.72 - 76.45) 64.89 (60.73 - 68.84) New Jersey 56.77 (53.42 - 60.05) 16.84 (14.36 - 19.64) 64.72 (60.59 - 68.65) 60.44 (56.40 - 64.35) New Mexico 42.84 (39.52 - 46.23) 12.65 (10.55 - 15.10) 54.27 (50.17 - 58.32) 44.74 (40.65 - 48.89) New York 55.00 (53.16 - 56.82) 16.59 (15.06 - 18.25) 65.54 (63.38 - 67.64) 57.67 (55.39 - 59.93) North Carolina 49.19 (45.83 - 52.55) 12.91 (10.81 - 15.35) 61.70 (57.69 - 65.56) 51.50 (47.43 - 55.55) North Dakota 59.08 (55.82 - 62.25) 14.23 (11.98 - 16.82) 70.81 (67.01 - 74.33) 61.59 (57.49 - 65.53) Ohio 52.51 (50.77 - 54.24) 13.48 (12.23 - 14.83) 63.49 (61.41 - 65.52) 55.56 (53.43 - 57.68) Oklahoma 44.64 (41.42 - 47.90) 12.79 (10.61 - 15.35) 57.29 (53.18 - 61.31) 46.42 (42.48 - 50.40) Oregon 59.99 (56.80 - 63.10) 14.58 (12.37 - 17.11) 64.22 (60.43 - 67.84) 64.45 (60.52 - 68.19) Pennsylvania 54.76 (52.95 - 56.56) 14.08 (12.70 - 15.59) 65.08 (62.65 - 67.44) 57.74 (55.51 - 59.93) Rhode Island 61.68 (58.23 - 65.01) 15.01 (12.61 - 17.79) 71.94 (68.29 - 75.32) 65.08 (60.82 - 69.11) South Carolina 48.40 (45.07 - 51.75) 12.27 (10.24 - 14.63) 57.22 (53.51 - 60.85) 51.22 (47.16 - 55.27) South Dakota 55.90 (52.57 - 59.18) 16.36 (13.87 - 19.20) 67.78 (63.39 - 71.87) 58.60 (54.55 - 62.54) Tennessee 41.55 (38.27 - 44.91) 11.04 (9.22 - 13.16) 52.89 (48.87 - 56.87) 43.37 (39.42 - 47.40) Texas 49.61 (47.84 - 51.37) 12.15 (10.90 - 13.51) 58.45 (56.23 - 60.64) 53.36 (51.10 - 55.61) Utah 25.38 (22.52 - 28.46) 7.57 (5.71 - 9.97) 31.31 (27.29 - 35.63) 26.96 (23.22 - 31.05) Vermont 60.57 (57.30 - 63.74) 17.78 (15.15 - 20.75) 73.85 (70.20 - 77.20) 62.84 (58.83 - 66.68) Virginia 54.64 (51.26 - 57.99) 12.95 (10.91 - 15.31) 66.56 (62.75 - 70.16) 57.56 (53.40 - 61.61) Washington 57.01 (53.69 - 60.27) 13.22 (11.07 - 15.72) 63.44 (59.46 - 67.24) 61.15 (57.11 - 65.04) West Virginia 38.97 (35.76 - 42.28) 14.71 (12.29 - 17.50) 53.75 (49.97 - 57.49) 39.26 (35.43 - 43.22) Wisconsin 62.48 (59.15 - 65.69) 13.94 (11.61 - 16.64) 68.92 (65.13 - 72.46) 67.25 (63.11 - 71.13) Wyoming 50.56 (47.22 - 53.89) 13.96 (11.70 - 16.58) 57.80 (53.70 - 61.79) 53.58 (49.49 - 57.63) NOTE: State and census region estimates, along with the 95 percent Bayesian confidence (credible) intervals, are based on a survey-weighted hierarchical Bayes estimation approach and
generated by Markov Chain Monte Carlo techniques. For the "Total U.S." row, design-based (direct) estimates and corresponding 95 percent confidence intervals are given. Source: SAMHSA, Center for Behavioral Health Statistics and Quality, National Survey on Drug Use and Health, 2010 and 2011 (2010 Data – Revised March 2012).

20
120911
Table 10 Binge Alcohol Use in the Past Month, by Age Group and State: Percentages, Annual Averages Based on 2010 and 2011 NSDUHs
State 12+
(Estimate)
12+ (95% Confidence
Interval) 12-17
(Estimate)
12-17 (95% Confidence
Interval) 18-25
(Estimate)
18-25 (95% Confidence
Interval) 26+
(Estimate)
26+ (95% Confidence
Interval) Total U.S. 22.86 (22.46 - 23.27) 7.63 (7.29 - 7.97) 40.15 (39.38 - 40.92) 21.77 (21.27 - 22.27) Northeast 24.66 (23.87 - 25.46) 8.96 (8.29 - 9.67) 43.94 (42.61 - 45.27) 23.27 (22.32 - 24.25) Midwest 24.73 (24.11 - 25.37) 7.78 (7.31 - 8.27) 44.04 (43.00 - 45.08) 23.52 (22.74 - 24.31) South 21.27 (20.68 - 21.88) 6.83 (6.40 - 7.28) 37.01 (36.02 - 38.01) 20.37 (19.63 - 21.13) West 22.22 (21.43 - 23.04) 7.76 (7.07 - 8.52) 38.59 (37.20 - 40.00) 21.16 (20.17 - 22.18) Alabama 19.69 (17.48 - 22.10) 6.55 (5.27 - 8.11) 30.54 (26.89 - 34.44) 19.44 (16.83 - 22.35) Alaska 24.08 (21.64 - 26.69) 7.37 (5.81 - 9.31) 42.18 (38.02 - 46.44) 22.89 (19.98 - 26.10) Arizona 22.39 (19.87 - 25.14) 7.25 (5.74 - 9.11) 36.91 (32.95 - 41.05) 21.89 (18.89 - 25.21) Arkansas 18.97 (16.83 - 21.33) 7.28 (5.81 - 9.08) 31.16 (27.65 - 34.90) 18.40 (15.86 - 21.24) California 21.97 (20.73 - 23.26) 7.96 (6.92 - 9.15) 38.15 (36.01 - 40.33) 20.84 (19.29 - 22.47) Colorado 24.46 (22.12 - 26.97) 7.79 (6.27 - 9.64) 44.61 (40.58 - 48.71) 22.97 (20.23 - 25.97) Connecticut 26.33 (23.71 - 29.14) 10.17 (8.16 - 12.61) 48.01 (43.90 - 52.15) 24.83 (21.73 - 28.21) Delaware 23.31 (20.92 - 25.88) 8.54 (6.65 - 10.89) 42.86 (39.03 - 46.78) 21.78 (18.95 - 24.89) District of Columbia 32.20 (29.42 - 35.11) 7.23 (5.32 - 9.76) 50.36 (46.51 - 54.21) 30.12 (26.73 - 33.75) Florida 19.90 (18.63 - 21.24) 6.90 (6.07 - 7.84) 34.24 (32.18 - 36.37) 19.12 (17.60 - 20.73) Georgia 19.40 (17.30 - 21.70) 6.25 (4.97 - 7.85) 34.97 (31.17 - 38.97) 18.42 (15.95 - 21.18) Hawaii 23.07 (20.68 - 25.64) 8.32 (6.57 - 10.50) 42.21 (38.01 - 46.52) 21.72 (18.98 - 24.74) Idaho 21.64 (19.28 - 24.20) 7.17 (5.75 - 8.91) 34.15 (30.42 - 38.09) 21.37 (18.52 - 24.53) Illinois 25.34 (24.04 - 26.70) 7.95 (7.03 - 8.99) 44.84 (42.70 - 47.00) 24.19 (22.56 - 25.90) Indiana 22.70 (20.36 - 25.23) 6.63 (5.33 - 8.21) 41.84 (37.89 - 45.89) 21.40 (18.64 - 24.45) Iowa 26.57 (24.16 - 29.13) 9.52 (7.79 - 11.58) 50.01 (45.94 - 54.07) 24.42 (21.57 - 27.52) Kansas 23.37 (21.08 - 25.82) 7.94 (6.39 - 9.82) 42.45 (38.56 - 46.43) 21.81 (19.09 - 24.80) Kentucky 20.89 (18.69 - 23.27) 7.74 (6.19 - 9.64) 37.79 (34.06 - 41.66) 19.67 (17.07 - 22.55) Louisiana 22.78 (20.71 - 25.00) 6.92 (5.74 - 8.33) 37.36 (34.12 - 40.73) 22.13 (19.57 - 24.92) Maine 22.32 (19.98 - 24.85) 7.24 (5.81 - 8.98) 42.48 (38.54 - 46.52) 21.01 (18.29 - 24.02) Maryland 20.93 (18.73 - 23.32) 6.52 (5.19 - 8.17) 39.64 (35.70 - 43.72) 19.58 (16.99 - 22.45) Massachusetts 27.05 (24.60 - 29.65) 9.29 (7.68 - 11.20) 47.67 (43.83 - 51.53) 25.45 (22.53 - 28.60) Michigan 25.30 (23.99 - 26.66) 7.65 (6.72 - 8.71) 43.64 (41.73 - 45.57) 24.40 (22.75 - 26.12) Minnesota 26.19 (23.89 - 28.63) 8.32 (6.80 - 10.14) 47.69 (43.79 - 51.61) 24.73 (22.01 - 27.67) Mississippi 19.21 (17.04 - 21.58) 6.06 (4.81 - 7.61) 31.90 (28.39 - 35.62) 18.65 (16.07 - 21.53) Missouri 22.73 (20.51 - 25.12) 8.46 (6.87 - 10.38) 37.75 (33.98 - 41.68) 21.93 (19.30 - 24.81) Montana 27.96 (25.58 - 30.47) 10.22 (8.31 - 12.50) 50.21 (46.42 - 54.00) 26.15 (23.31 - 29.21)
(continued)

21
120911
Table 10 Binge Alcohol Use in the Past Month, by Age Group and State: Percentages, Annual Averages Based on 2010 and 2011 NSDUHs (continued)
State 12+
(Estimate)
12+ (95% Confidence
Interval) 12-17
(Estimate)
12-17 (95% Confidence
Interval) 18-25
(Estimate)
18-25 (95% Confidence
Interval) 26+
(Estimate)
26+ (95% Confidence
Interval) Nebraska 24.60 (22.16 - 27.21) 7.50 (6.03 - 9.29) 43.75 (39.75 - 47.83) 23.19 (20.32 - 26.34) Nevada 24.51 (21.86 - 27.38) 8.04 (6.12 - 10.51) 39.73 (35.44 - 44.18) 24.16 (21.04 - 27.57) New Hampshire 24.09 (21.74 - 26.61) 9.87 (8.02 - 12.10) 49.32 (45.45 - 53.20) 21.70 (18.93 - 24.75) New Jersey 24.49 (22.06 - 27.11) 10.10 (8.21 - 12.36) 44.74 (40.54 - 49.01) 23.19 (20.35 - 26.30) New Mexico 20.33 (18.10 - 22.77) 7.20 (5.72 - 9.02) 36.37 (32.62 - 40.29) 19.19 (16.53 - 22.17) New York 23.70 (22.34 - 25.12) 8.72 (7.64 - 9.93) 41.12 (39.00 - 43.27) 22.42 (20.75 - 24.18) North Carolina 19.47 (17.30 - 21.84) 6.71 (5.42 - 8.30) 35.64 (31.85 - 39.61) 18.32 (15.80 - 21.14) North Dakota 30.51 (27.87 - 33.29) 7.54 (5.81 - 9.72) 52.88 (49.10 - 56.63) 28.12 (24.88 - 31.60) Ohio 23.17 (21.93 - 24.47) 7.22 (6.34 - 8.21) 42.88 (40.97 - 44.81) 21.93 (20.39 - 23.55) Oklahoma 21.00 (18.77 - 23.41) 6.90 (5.44 - 8.72) 38.17 (34.14 - 42.38) 19.66 (17.04 - 22.58) Oregon 22.35 (20.07 - 24.80) 6.96 (5.64 - 8.57) 40.35 (36.47 - 44.35) 21.17 (18.54 - 24.07) Pennsylvania 24.53 (23.22 - 25.89) 8.03 (7.04 - 9.14) 43.49 (41.28 - 45.72) 23.27 (21.69 - 24.94) Rhode Island 27.87 (25.29 - 30.61) 8.72 (7.12 - 10.65) 49.28 (45.26 - 53.31) 25.99 (22.91 - 29.32) South Carolina 22.84 (20.43 - 25.44) 6.18 (4.92 - 7.74) 36.74 (33.09 - 40.55) 22.48 (19.61 - 25.63) South Dakota 27.50 (24.93 - 30.24) 9.82 (7.93 - 12.10) 49.25 (44.45 - 54.07) 25.76 (22.82 - 28.94) Tennessee 18.44 (16.22 - 20.88) 6.21 (4.93 - 7.80) 33.00 (29.15 - 37.10) 17.54 (14.96 - 20.44) Texas 24.05 (22.76 - 25.38) 6.87 (6.00 - 7.87) 39.50 (37.50 - 41.52) 23.60 (21.95 - 25.33) Utah 14.17 (12.30 - 16.27) 5.25 (3.82 - 7.18) 22.95 (19.66 - 26.61) 13.57 (11.29 - 16.23) Vermont 25.30 (22.98 - 27.78) 9.44 (7.71 - 11.52) 50.89 (47.09 - 54.67) 22.50 (19.76 - 25.50) Virginia 23.21 (20.87 - 25.73) 7.67 (6.21 - 9.43) 44.56 (40.50 - 48.70) 21.36 (18.64 - 24.35) Washington 23.43 (21.06 - 25.97) 8.48 (6.91 - 10.37) 43.59 (39.76 - 47.50) 21.86 (19.09 - 24.90) West Virginia 20.46 (18.26 - 22.86) 8.40 (6.77 - 10.38) 39.27 (35.49 - 43.17) 18.84 (16.31 - 21.67) Wisconsin 27.16 (24.52 - 29.96) 7.69 (6.20 - 9.49) 46.36 (42.40 - 50.36) 26.19 (23.04 - 29.61) Wyoming 22.40 (20.15 - 24.82) 8.84 (6.76 - 11.47) 40.15 (36.28 - 44.15) 20.79 (18.14 - 23.72) NOTE: Binge Alcohol Use is defined as drinking five or more drinks on the same occasion (i.e., at the same time or within a couple of hours of each other) on at least 1 day in the past 30
days. NOTE: State and census region estimates, along with the 95 percent Bayesian confidence (credible) intervals, are based on a survey-weighted hierarchical Bayes estimation approach and
generated by Markov Chain Monte Carlo techniques. For the "Total U.S." row, design-based (direct) estimates and corresponding 95 percent confidence intervals are given. Source: SAMHSA, Center for Behavioral Health Statistics and Quality, National Survey on Drug Use and Health, 2010 and 2011 (2010 Data – Revised March 2012).

22
120911
Table 11 Perceptions of Great Risk of Having Five or More Drinks of an Alcoholic Beverage Once or Twice a Week, by Age Group and State: Percentages, Annual Averages Based on 2010 and 2011 NSDUHs
State 12+
(Estimate)
12+ (95% Confidence
Interval) 12-17
(Estimate)
12-17 (95% Confidence
Interval) 18-25
(Estimate)
18-25 (95% Confidence
Interval) 26+
(Estimate)
26+ (95% Confidence
Interval) Total U.S. 42.57 (42.04 - 43.11) 40.58 (39.92 - 41.24) 34.13 (33.46 - 34.81) 44.29 (43.63 - 44.95) Northeast 41.00 (39.99 - 42.01) 38.95 (37.79 - 40.13) 31.40 (30.27 - 32.54) 42.84 (41.59 - 44.11) Midwest 38.70 (37.92 - 39.49) 38.03 (37.12 - 38.96) 29.96 (29.11 - 30.82) 40.30 (39.33 - 41.29) South 44.76 (43.99 - 45.52) 42.62 (41.68 - 43.56) 37.12 (36.22 - 38.03) 46.34 (45.39 - 47.30) West 43.96 (42.95 - 44.99) 40.93 (39.63 - 42.24) 35.38 (34.14 - 36.64) 45.91 (44.63 - 47.20) Alabama 44.45 (41.51 - 47.43) 44.13 (40.76 - 47.55) 39.40 (35.88 - 43.04) 45.37 (41.79 - 49.01) Alaska 40.37 (37.30 - 43.52) 39.72 (36.05 - 43.51) 32.14 (28.51 - 36.00) 42.07 (38.29 - 45.94) Arizona 43.53 (40.23 - 46.88) 42.87 (38.97 - 46.85) 35.75 (32.10 - 39.58) 44.94 (40.95 - 49.00) Arkansas 44.42 (41.25 - 47.64) 44.27 (40.60 - 48.01) 36.38 (33.04 - 39.87) 45.80 (41.94 - 49.70) California 46.41 (44.77 - 48.06) 41.72 (39.64 - 43.83) 37.99 (35.96 - 40.06) 48.61 (46.55 - 50.68) Colorado 37.36 (34.29 - 40.53) 36.42 (32.77 - 40.23) 27.65 (24.52 - 31.02) 39.15 (35.45 - 42.98) Connecticut 41.82 (38.80 - 44.91) 37.68 (34.10 - 41.39) 28.61 (25.31 - 32.16) 44.46 (40.82 - 48.17) Delaware 40.63 (37.55 - 43.78) 39.61 (35.98 - 43.36) 32.25 (28.87 - 35.82) 42.15 (38.42 - 45.96) District of Columbia 41.14 (38.06 - 44.29) 43.50 (39.62 - 47.46) 30.03 (26.39 - 33.94) 43.47 (39.65 - 47.36) Florida 47.58 (45.82 - 49.35) 41.84 (39.93 - 43.77) 39.94 (37.93 - 41.99) 49.36 (47.19 - 51.53) Georgia 43.85 (40.92 - 46.82) 43.15 (39.57 - 46.80) 36.72 (33.31 - 40.26) 45.22 (41.65 - 48.83) Hawaii 41.83 (38.66 - 45.06) 41.76 (37.87 - 45.76) 33.67 (30.03 - 37.51) 43.09 (39.31 - 46.96) Idaho 37.62 (34.77 - 40.55) 34.50 (31.22 - 37.93) 31.01 (27.77 - 34.45) 39.28 (35.77 - 42.90) Illinois 41.70 (40.07 - 43.34) 41.66 (39.63 - 43.71) 32.73 (30.88 - 34.64) 43.27 (41.24 - 45.32) Indiana 39.42 (36.48 - 42.43) 38.87 (35.50 - 42.34) 30.16 (27.02 - 33.51) 41.13 (37.53 - 44.83) Iowa 38.12 (35.10 - 41.23) 37.18 (33.87 - 40.62) 28.05 (24.81 - 31.53) 40.05 (36.37 - 43.85) Kansas 38.64 (35.63 - 41.73) 37.07 (33.57 - 40.72) 29.35 (26.22 - 32.70) 40.60 (36.92 - 44.38) Kentucky 42.46 (39.27 - 45.72) 43.40 (39.56 - 47.33) 36.84 (33.29 - 40.54) 43.28 (39.43 - 47.20) Louisiana 45.17 (42.38 - 47.98) 45.42 (42.14 - 48.75) 40.13 (36.95 - 43.40) 46.08 (42.63 - 49.56) Maine 37.89 (34.84 - 41.04) 35.05 (31.78 - 38.47) 28.57 (25.47 - 31.89) 39.53 (35.88 - 43.30) Maryland 44.46 (41.47 - 47.49) 43.93 (40.22 - 47.71) 35.62 (32.12 - 39.28) 46.00 (42.41 - 49.63) Massachusetts 40.22 (37.30 - 43.21) 35.98 (32.68 - 39.41) 29.07 (25.96 - 32.38) 42.66 (39.11 - 46.30) Michigan 38.79 (37.22 - 40.38) 37.52 (35.62 - 39.46) 31.82 (30.07 - 33.62) 40.16 (38.18 - 42.16) Minnesota 36.88 (34.04 - 39.81) 34.70 (31.40 - 38.15) 26.54 (23.54 - 29.77) 38.89 (35.45 - 42.44) Mississippi 47.27 (44.40 - 50.15) 49.02 (45.49 - 52.55) 41.57 (38.32 - 44.89) 48.09 (44.53 - 51.67) Missouri 36.51 (33.62 - 39.50) 36.90 (33.29 - 40.66) 30.08 (26.87 - 33.49) 37.56 (34.06 - 41.20) Montana 36.24 (33.52 - 39.05) 33.68 (30.42 - 37.11) 24.75 (21.94 - 27.80) 38.51 (35.21 - 41.91)
(continued)

23
120911
Table 11 Perceptions of Great Risk of Having Five or More Drinks of an Alcoholic Beverage Once or Twice a Week, by Age Group and State: Percentages, Annual Averages Based on 2010 and 2011 NSDUHs (continued)
State 12+
(Estimate)
12+ (95% Confidence
Interval) 12-17
(Estimate)
12-17 (95% Confidence
Interval) 18-25
(Estimate)
18-25 (95% Confidence
Interval) 26+
(Estimate)
26+ (95% Confidence
Interval) Nebraska 36.90 (33.93 - 39.97) 37.86 (34.34 - 41.51) 26.47 (23.39 - 29.80) 38.72 (35.10 - 42.47) Nevada 40.17 (36.88 - 43.56) 39.12 (34.80 - 43.61) 35.40 (31.41 - 39.60) 41.07 (37.17 - 45.08) New Hampshire 38.93 (36.03 - 41.91) 36.34 (32.78 - 40.06) 26.57 (23.74 - 29.61) 41.20 (37.66 - 44.82) New Jersey 42.69 (39.68 - 45.75) 39.10 (35.58 - 42.72) 33.40 (29.98 - 37.01) 44.53 (40.91 - 48.21) New Mexico 48.02 (44.85 - 51.20) 42.22 (38.53 - 46.00) 38.36 (34.96 - 41.88) 50.49 (46.60 - 54.37) New York 42.53 (40.77 - 44.31) 41.00 (39.00 - 43.03) 33.68 (31.80 - 35.61) 44.26 (42.06 - 46.48) North Carolina 43.95 (41.02 - 46.93) 39.45 (35.97 - 43.03) 33.82 (30.59 - 37.21) 46.19 (42.61 - 49.81) North Dakota 36.23 (33.50 - 39.04) 35.33 (31.82 - 39.01) 24.80 (21.98 - 27.84) 38.91 (35.50 - 42.42) Ohio 39.24 (37.67 - 40.83) 38.07 (36.23 - 39.95) 29.48 (27.83 - 31.18) 40.98 (39.03 - 42.96) Oklahoma 43.75 (40.73 - 46.82) 40.98 (37.20 - 44.88) 36.96 (33.37 - 40.70) 45.35 (41.68 - 49.08) Oregon 37.85 (34.93 - 40.86) 35.31 (31.97 - 38.80) 29.48 (26.32 - 32.86) 39.49 (35.98 - 43.11) Pennsylvania 38.58 (36.92 - 40.26) 38.65 (36.58 - 40.77) 29.89 (27.92 - 31.92) 40.02 (37.98 - 42.09) Rhode Island 38.39 (35.24 - 41.63) 37.42 (33.88 - 41.10) 29.44 (26.30 - 32.79) 40.21 (36.38 - 44.17) South Carolina 44.69 (41.70 - 47.71) 44.44 (40.86 - 48.09) 37.52 (34.26 - 40.89) 45.93 (42.29 - 49.61) South Dakota 35.54 (32.59 - 38.61) 33.82 (30.33 - 37.50) 26.90 (23.54 - 30.55) 37.31 (33.75 - 41.01) Tennessee 43.44 (40.32 - 46.61) 41.76 (38.21 - 45.40) 35.28 (31.86 - 38.86) 44.96 (41.19 - 48.80) Texas 45.39 (43.77 - 47.01) 42.90 (40.90 - 44.92) 37.66 (35.75 - 39.61) 47.23 (45.13 - 49.33) Utah 50.59 (47.50 - 53.68) 52.34 (48.07 - 56.58) 41.25 (37.17 - 45.45) 52.54 (48.57 - 56.48) Vermont 38.06 (35.07 - 41.15) 33.19 (29.94 - 36.61) 23.88 (20.95 - 27.07) 41.09 (37.42 - 44.86) Virginia 41.97 (39.02 - 44.97) 40.82 (37.23 - 44.52) 33.79 (30.43 - 37.31) 43.53 (39.94 - 47.19) Washington 41.09 (38.16 - 44.08) 38.16 (34.74 - 41.71) 28.82 (25.86 - 31.97) 43.47 (39.88 - 47.13) West Virginia 40.74 (37.83 - 43.71) 38.08 (34.47 - 41.83) 32.07 (28.82 - 35.51) 42.34 (38.87 - 45.89) Wisconsin 35.62 (32.71 - 38.64) 35.55 (32.06 - 39.21) 27.95 (24.85 - 31.28) 36.95 (33.41 - 40.65) Wyoming 37.20 (34.29 - 40.20) 38.25 (34.74 - 41.88) 27.77 (24.35 - 31.48) 38.78 (35.20 - 42.49) NOTE: State and census region estimates, along with the 95 percent Bayesian confidence (credible) intervals, are based on a survey-weighted hierarchical Bayes estimation approach and
generated by Markov Chain Monte Carlo techniques. For the "Total U.S." row, design-based (direct) estimates and corresponding 95 percent confidence intervals are given. Source: SAMHSA, Center for Behavioral Health Statistics and Quality, National Survey on Drug Use and Health, 2010 and 2011 (2010 Data – Revised March 2012).

24
120911
Table 12 Alcohol Use and Binge Alcohol Use in the Past Month among Persons Aged 12 to 20, by State: Percentages, Annual Averages Based on 2010 and 2011 NSDUHs
State
Alcohol Use in Past Month (Estimate)
Alcohol Use in Past Month (95% Confidence Interval)
Binge Alcohol Use in Past Month
(Estimate) Binge Alcohol Use in Past Month
(95% Confidence Interval) Total U.S. 25.61 (24.97 - 26.27) 16.34 (15.80 - 16.90) Northeast 29.73 (28.81 - 30.68) 18.92 (18.08 - 19.79) Midwest 26.21 (25.51 - 26.91) 17.48 (16.88 - 18.10) South 23.75 (23.07 - 24.45) 14.63 (14.06 - 15.21) West 24.90 (23.95 - 25.88) 16.05 (15.23 - 16.90) Alabama 20.59 (18.37 - 23.01) 12.46 (10.82 - 14.31) Alaska 24.85 (22.32 - 27.57) 17.57 (15.52 - 19.83) Arizona 22.64 (20.15 - 25.33) 14.24 (12.39 - 16.32) Arkansas 21.91 (19.64 - 24.36) 13.70 (11.91 - 15.71) California 25.48 (24.00 - 27.02) 16.48 (15.24 - 17.80) Colorado 27.71 (25.12 - 30.46) 16.25 (14.27 - 18.44) Connecticut 31.42 (28.66 - 34.32) 20.84 (18.52 - 23.37) Delaware 29.14 (26.37 - 32.07) 19.40 (17.03 - 22.02) District of Columbia 34.09 (30.61 - 37.74) 21.07 (17.93 - 24.59) Florida 24.17 (22.80 - 25.60) 14.49 (13.38 - 15.69) Georgia 21.04 (18.73 - 23.55) 12.41 (10.78 - 14.24) Hawaii 24.84 (22.19 - 27.69) 16.28 (14.11 - 18.72) Idaho 22.52 (20.13 - 25.11) 14.62 (12.75 - 16.70) Illinois 26.58 (25.25 - 27.96) 17.83 (16.63 - 19.09) Indiana 24.49 (22.02 - 27.14) 16.39 (14.50 - 18.48) Iowa 28.61 (26.03 - 31.34) 21.23 (18.99 - 23.65) Kansas 25.23 (22.78 - 27.84) 17.18 (15.20 - 19.36) Kentucky 22.12 (19.77 - 24.68) 14.91 (13.11 - 16.91) Louisiana 25.76 (23.48 - 28.19) 14.57 (12.91 - 16.39) Maine 25.25 (22.80 - 27.87) 16.81 (14.84 - 18.99) Maryland 25.06 (22.65 - 27.64) 14.58 (12.75 - 16.62) Massachusetts 30.03 (27.59 - 32.60) 19.50 (17.41 - 21.77) Michigan 25.46 (24.16 - 26.79) 16.93 (15.82 - 18.11) Minnesota 26.06 (23.65 - 28.62) 18.44 (16.42 - 20.64) Mississippi 21.41 (19.12 - 23.89) 12.04 (10.39 - 13.91) Missouri 24.94 (22.46 - 27.60) 15.01 (13.13 - 17.11) Montana 30.55 (27.89 - 33.34) 20.10 (17.87 - 22.54) (continued)

25
120911
Table 12 Alcohol Use and Binge Alcohol Use in the Past Month among Persons Aged 12 to 20, by State: Percentages, Annual Averages Based on 2010 and 2011 NSDUHs (continued)
State
Alcohol Use in Past Month (Estimate)
Alcohol Use in Past Month (95% Confidence Interval)
Binge Alcohol Use in Past Month
(Estimate) Binge Alcohol Use in Past Month
(95% Confidence Interval) Nebraska 25.46 (22.98 - 28.12) 17.59 (15.63 - 19.73) Nevada 26.23 (23.36 - 29.32) 17.76 (15.42 - 20.36) New Hampshire 33.52 (30.84 - 36.31) 21.56 (19.39 - 23.91) New Jersey 29.94 (27.21 - 32.82) 20.18 (17.91 - 22.66) New Mexico 23.05 (20.60 - 25.69) 14.36 (12.43 - 16.53) New York 29.94 (28.39 - 31.53) 18.29 (16.97 - 19.69) North Carolina 24.39 (21.92 - 27.04) 13.91 (12.17 - 15.84) North Dakota 31.63 (28.93 - 34.47) 22.62 (20.35 - 25.07) Ohio 26.67 (25.33 - 28.04) 17.42 (16.30 - 18.59) Oklahoma 23.00 (20.52 - 25.68) 13.41 (11.54 - 15.53) Oregon 27.03 (24.62 - 29.59) 15.49 (13.58 - 17.62) Pennsylvania 28.40 (26.83 - 30.04) 17.80 (16.44 - 19.25) Rhode Island 31.25 (28.66 - 33.97) 20.26 (17.98 - 22.75) South Carolina 22.74 (20.39 - 25.27) 13.69 (11.94 - 15.67) South Dakota 27.92 (25.30 - 30.70) 19.07 (16.86 - 21.49) Tennessee 21.13 (18.80 - 23.67) 13.72 (11.98 - 15.68) Texas 24.16 (22.79 - 25.60) 15.48 (14.36 - 16.66) Utah 15.28 (12.97 - 17.91) 11.77 (9.85 - 14.01) Vermont 33.10 (30.27 - 36.05) 22.10 (19.70 - 24.70) Virginia 27.53 (24.99 - 30.23) 18.40 (16.34 - 20.65) Washington 24.68 (22.25 - 27.29) 16.51 (14.56 - 18.65) West Virginia 26.45 (23.94 - 29.12) 18.04 (15.90 - 20.39) Wisconsin 27.84 (25.27 - 30.55) 18.09 (16.06 - 20.33) Wyoming 27.05 (24.22 - 30.07) 19.17 (16.74 - 21.86)
NOTE: Binge Alcohol Use is defined as drinking five or more drinks on the same occasion (i.e., at the same time or within a couple hours of each other) on at least 1 day in the past 30 days.
NOTE: State and census region estimates, along with the 95 percent Bayesian confidence (credible) intervals, are based on a survey-weighted hierarchical Bayes estimation approach and generated by Markov Chain Monte Carlo techniques. For the "Total U.S." row, design-based (direct) estimates and corresponding 95 percent confidence intervals are given.
Source: SAMHSA, Center for Behavioral Health Statistics and Quality, National Survey on Drug Use and Health, 2010 and 2011 (2010 Data – Revised March 2012).

26
120911
Table 13 Tobacco Product Use in the Past Month, by Age Group and State: Percentages, Annual Averages Based on 2010 and 2011 NSDUHs
State 12+
(Estimate)
12+ (95% Confidence
Interval) 12-17
(Estimate)
12-17 (95% Confidence
Interval) 18-25
(Estimate)
18-25 (95% Confidence
Interval) 26+
(Estimate)
26+ (95% Confidence
Interval) Total U.S. 26.97 (26.50 - 27.45) 10.34 (9.96 - 10.74) 40.17 (39.46 - 40.89) 26.76 (26.18 - 27.36) Northeast 25.91 (24.95 - 26.90) 10.38 (9.70 - 11.11) 39.68 (38.50 - 40.87) 25.43 (24.24 - 26.65) Midwest 29.55 (28.70 - 30.41) 11.42 (10.85 - 12.03) 44.74 (43.76 - 45.73) 29.20 (28.13 - 30.29) South 28.44 (27.63 - 29.26) 10.51 (9.97 - 11.09) 40.54 (39.61 - 41.47) 28.60 (27.58 - 29.64) West 23.07 (22.10 - 24.07) 9.07 (8.37 - 9.83) 35.82 (34.56 - 37.10) 22.60 (21.38 - 23.86) Alabama 32.43 (29.66 - 35.34) 11.38 (9.54 - 13.51) 44.84 (41.19 - 48.53) 32.91 (29.54 - 36.46) Alaska 32.88 (29.79 - 36.13) 12.39 (10.23 - 14.94) 46.47 (42.57 - 50.42) 33.12 (29.30 - 37.17) Arizona 26.85 (23.94 - 29.98) 10.78 (8.76 - 13.19) 37.07 (33.38 - 40.92) 27.20 (23.70 - 31.01) Arkansas 32.62 (29.75 - 35.63) 12.35 (10.28 - 14.76) 44.85 (41.30 - 48.44) 33.12 (29.67 - 36.76) California 19.97 (18.61 - 21.40) 7.53 (6.52 - 8.68) 32.44 (30.46 - 34.48) 19.32 (17.62 - 21.14) Colorado 27.44 (24.72 - 30.34) 12.05 (9.90 - 14.60) 43.40 (39.70 - 47.17) 26.52 (23.29 - 30.02) Connecticut 25.50 (22.80 - 28.41) 10.07 (8.24 - 12.25) 41.81 (38.08 - 45.63) 24.78 (21.58 - 28.29) Delaware 29.07 (26.37 - 31.92) 11.37 (9.37 - 13.73) 41.05 (37.22 - 45.00) 29.14 (25.90 - 32.61) District of Columbia 26.70 (23.93 - 29.66) 7.62 (6.03 - 9.58) 34.40 (30.99 - 37.98) 26.51 (23.17 - 30.15) Florida 25.98 (24.48 - 27.53) 8.68 (7.68 - 9.81) 36.44 (34.48 - 38.43) 26.25 (24.43 - 28.15) Georgia 26.04 (23.45 - 28.79) 11.57 (9.49 - 14.03) 38.07 (34.44 - 41.83) 25.86 (22.74 - 29.24) Hawaii 23.48 (20.83 - 26.36) 9.42 (7.45 - 11.84) 35.40 (31.70 - 39.29) 23.17 (20.03 - 26.64) Idaho 27.37 (24.61 - 30.30) 11.34 (9.35 - 13.69) 38.34 (34.80 - 42.01) 27.61 (24.27 - 31.22) Illinois 26.88 (25.42 - 28.40) 9.59 (8.51 - 10.80) 42.40 (40.44 - 44.38) 26.42 (24.61 - 28.31) Indiana 29.93 (27.21 - 32.79) 10.66 (8.88 - 12.74) 44.13 (40.43 - 47.89) 29.92 (26.64 - 33.43) Iowa 28.81 (26.16 - 31.62) 12.68 (10.61 - 15.09) 44.96 (41.16 - 48.81) 27.86 (24.68 - 31.29) Kansas 30.85 (28.10 - 33.74) 12.52 (10.41 - 14.98) 46.35 (42.46 - 50.28) 30.36 (27.02 - 33.92) Kentucky 37.37 (34.31 - 40.52) 14.85 (12.57 - 17.46) 50.43 (46.59 - 54.27) 37.90 (34.24 - 41.70) Louisiana 30.73 (28.22 - 33.36) 10.93 (9.23 - 12.90) 40.63 (37.43 - 43.91) 31.47 (28.35 - 34.76) Maine 29.05 (26.31 - 31.95) 11.53 (9.52 - 13.89) 45.31 (41.72 - 48.94) 28.55 (25.32 - 32.03) Maryland 23.23 (20.72 - 25.96) 7.64 (6.15 - 9.46) 35.90 (32.34 - 39.63) 23.03 (20.04 - 26.32) Massachusetts 22.93 (20.45 - 25.60) 11.00 (9.15 - 13.16) 38.70 (35.11 - 42.42) 21.51 (18.60 - 24.74) Michigan 30.56 (29.01 - 32.14) 11.12 (9.98 - 12.37) 45.88 (43.96 - 47.82) 30.40 (28.48 - 32.39) Minnesota 26.25 (23.74 - 28.93) 10.40 (8.57 - 12.56) 45.55 (41.98 - 49.17) 24.92 (21.91 - 28.18) Mississippi 34.49 (31.70 - 37.40) 13.07 (10.97 - 15.51) 46.70 (43.20 - 50.23) 35.16 (31.71 - 38.76) Missouri 33.75 (30.88 - 36.75) 15.12 (12.78 - 17.81) 46.93 (43.31 - 50.58) 33.80 (30.33 - 37.47) Montana 31.95 (29.20 - 34.83) 16.49 (13.95 - 19.39) 48.75 (45.18 - 52.32) 30.82 (27.53 - 34.32)
(continued)

27
120911
Table 13 Tobacco Product Use in the Past Month, by Age Group and State: Percentages, Annual Averages Based on 2010 and 2011 NSDUHs (continued)
State 12+
(Estimate)
12+ (95% Confidence
Interval) 12-17
(Estimate)
12-17 (95% Confidence
Interval) 18-25
(Estimate)
18-25 (95% Confidence
Interval) 26+
(Estimate)
26+ (95% Confidence
Interval) Nebraska 28.47 (25.72 - 31.41) 11.56 (9.60 - 13.87) 41.93 (38.38 - 45.57) 28.11 (24.79 - 31.69) Nevada 26.41 (23.41 - 29.65) 8.60 (6.65 - 11.04) 38.00 (34.10 - 42.06) 26.80 (23.22 - 30.70) New Hampshire 27.33 (24.56 - 30.28) 13.65 (11.27 - 16.45) 46.05 (42.41 - 49.74) 25.91 (22.66 - 29.46) New Jersey 26.24 (23.56 - 29.10) 10.30 (8.35 - 12.64) 41.41 (37.63 - 45.30) 25.89 (22.68 - 29.38) New Mexico 25.98 (23.32 - 28.84) 12.03 (9.93 - 14.49) 42.55 (38.93 - 46.25) 24.85 (21.65 - 28.36) New York 23.94 (22.46 - 25.49) 8.73 (7.66 - 9.93) 35.34 (33.36 - 37.38) 23.74 (21.92 - 25.66) North Carolina 28.62 (25.93 - 31.46) 11.37 (9.43 - 13.66) 42.54 (38.78 - 46.39) 28.38 (25.22 - 31.77) North Dakota 28.88 (26.22 - 31.70) 12.31 (10.14 - 14.88) 43.81 (40.43 - 47.25) 27.43 (24.18 - 30.94) Ohio 31.95 (30.42 - 33.52) 12.72 (11.50 - 14.05) 46.22 (44.34 - 48.11) 32.00 (30.11 - 33.97) Oklahoma 35.32 (32.21 - 38.56) 14.38 (11.99 - 17.15) 48.46 (44.44 - 52.50) 35.61 (31.85 - 39.56) Oregon 26.77 (24.24 - 29.46) 10.09 (8.38 - 12.11) 41.31 (37.70 - 45.01) 26.30 (23.29 - 29.55) Pennsylvania 29.63 (28.08 - 31.23) 12.12 (10.87 - 13.49) 43.69 (41.48 - 45.93) 29.30 (27.39 - 31.29) Rhode Island 28.06 (25.36 - 30.94) 10.75 (8.79 - 13.08) 43.18 (39.59 - 46.86) 27.17 (23.93 - 30.67) South Carolina 31.47 (28.53 - 34.56) 12.38 (10.36 - 14.71) 43.37 (39.79 - 47.02) 31.74 (28.19 - 35.50) South Dakota 31.54 (28.70 - 34.53) 14.21 (11.88 - 16.90) 46.64 (42.39 - 50.93) 30.95 (27.61 - 34.51) Tennessee 35.02 (32.01 - 38.15) 13.13 (11.01 - 15.58) 47.80 (44.01 - 51.63) 35.56 (31.97 - 39.33) Texas 25.52 (24.07 - 27.03) 8.81 (7.81 - 9.94) 37.47 (35.60 - 39.38) 25.68 (23.85 - 27.60) Utah 15.78 (13.64 - 18.19) 6.93 (5.23 - 9.13) 24.00 (20.63 - 27.73) 15.33 (12.68 - 18.41) Vermont 28.06 (25.39 - 30.89) 14.07 (11.72 - 16.81) 44.68 (41.03 - 48.39) 26.63 (23.45 - 30.06) Virginia 24.88 (22.40 - 27.54) 9.06 (7.43 - 11.00) 39.20 (35.71 - 42.81) 24.28 (21.37 - 27.45) Washington 27.58 (24.89 - 30.45) 11.61 (9.63 - 13.92) 44.30 (40.58 - 48.10) 26.71 (23.53 - 30.14) West Virginia 38.46 (35.48 - 41.53) 16.85 (14.37 - 19.66) 50.22 (46.73 - 53.70) 38.91 (35.32 - 42.62) Wisconsin 27.03 (24.26 - 29.99) 9.76 (8.01 - 11.84) 42.75 (38.95 - 46.64) 26.40 (23.10 - 29.99) Wyoming 31.89 (29.04 - 34.88) 14.91 (12.54 - 17.63) 47.18 (43.40 - 50.98) 31.13 (27.71 - 34.78) NOTE: Tobacco Products include cigarettes, smokeless tobacco (i.e., chewing tobacco or snuff), cigars, or pipe tobacco. NOTE: State and census region estimates, along with the 95 percent Bayesian confidence (credible) intervals, are based on a survey-weighted hierarchical Bayes estimation approach and
generated by Markov Chain Monte Carlo techniques. For the "Total U.S." row, design-based (direct) estimates and corresponding 95 percent confidence intervals are given. Source: SAMHSA, Center for Behavioral Health Statistics and Quality, National Survey on Drug Use and Health, 2010 and 2011 (2010 Data – Revised March 2012).

28
120911
Table 14 Cigarette Use in the Past Month, by Age Group and State: Percentages, Annual Averages Based on 2010 and 2011 NSDUHs
State 12+
(Estimate)
12+ (95% Confidence
Interval) 12-17
(Estimate)
12-17 (95% Confidence
Interval) 18-25
(Estimate)
18-25 (95% Confidence
Interval) 26+
(Estimate)
26+ (95% Confidence
Interval) Total U.S. 22.53 (22.09 - 22.97) 8.07 (7.73 - 8.42) 33.92 (33.23 - 34.61) 22.36 (21.83 - 22.90) Northeast 22.00 (21.11 - 22.92) 8.14 (7.55 - 8.78) 33.76 (32.49 - 35.06) 21.66 (20.51 - 22.84) Midwest 24.47 (23.70 - 25.26) 8.84 (8.34 - 9.37) 37.76 (36.73 - 38.81) 24.13 (23.13 - 25.17) South 23.67 (22.91 - 24.44) 8.19 (7.72 - 8.68) 33.95 (32.96 - 34.96) 23.83 (22.85 - 24.85) West 19.31 (18.43 - 20.22) 7.13 (6.48 - 7.84) 30.48 (29.22 - 31.77) 18.88 (17.74 - 20.08) Alabama 26.87 (24.29 - 29.62) 8.84 (7.23 - 10.78) 36.70 (33.19 - 40.37) 27.41 (24.26 - 30.81) Alaska 27.68 (24.69 - 30.88) 7.84 (6.18 - 9.89) 39.63 (35.53 - 43.88) 28.14 (24.44 - 32.16) Arizona 23.15 (20.35 - 26.22) 8.76 (6.93 - 11.01) 31.99 (28.37 - 35.84) 23.52 (20.12 - 27.30) Arkansas 27.11 (24.30 - 30.12) 9.35 (7.53 - 11.56) 37.39 (33.76 - 41.16) 27.63 (24.19 - 31.35) California 16.82 (15.58 - 18.14) 6.25 (5.33 - 7.31) 27.54 (25.68 - 29.49) 16.25 (14.68 - 17.97) Colorado 22.24 (19.75 - 24.95) 8.64 (6.90 - 10.75) 35.83 (32.24 - 39.59) 21.52 (18.53 - 24.84) Connecticut 21.53 (19.08 - 24.20) 8.02 (6.37 - 10.05) 35.99 (32.29 - 39.87) 20.87 (17.95 - 24.13) Delaware 24.39 (21.77 - 27.21) 8.16 (6.50 - 10.21) 35.37 (31.86 - 39.05) 24.46 (21.30 - 27.91) District of Columbia 23.24 (20.63 - 26.08) 5.99 (4.65 - 7.68) 28.18 (24.84 - 31.79) 23.55 (20.40 - 27.02) Florida 21.99 (20.53 - 23.52) 6.91 (6.01 - 7.93) 30.77 (28.80 - 32.81) 22.27 (20.48 - 24.17) Georgia 20.87 (18.41 - 23.57) 9.41 (7.56 - 11.67) 31.08 (27.60 - 34.79) 20.61 (17.65 - 23.93) Hawaii 20.13 (17.70 - 22.79) 6.68 (5.12 - 8.68) 31.59 (28.02 - 35.39) 19.82 (16.95 - 23.03) Idaho 22.65 (20.08 - 25.44) 8.57 (6.90 - 10.61) 32.64 (29.08 - 36.40) 22.80 (19.63 - 26.31) Illinois 22.23 (20.84 - 23.69) 7.28 (6.35 - 8.33) 36.43 (34.36 - 38.55) 21.69 (19.95 - 23.55) Indiana 25.33 (22.81 - 28.04) 8.06 (6.52 - 9.94) 37.73 (34.18 - 41.41) 25.39 (22.28 - 28.76) Iowa 23.87 (21.42 - 26.51) 10.80 (8.93 - 13.01) 37.90 (34.24 - 41.71) 22.94 (19.99 - 26.18) Kansas 23.94 (21.43 - 26.65) 9.62 (7.79 - 11.84) 37.19 (33.49 - 41.04) 23.35 (20.31 - 26.68) Kentucky 31.37 (28.39 - 34.51) 11.66 (9.59 - 14.11) 42.32 (38.51 - 46.22) 31.92 (28.33 - 35.74) Louisiana 26.99 (24.52 - 29.62) 9.14 (7.52 - 11.05) 35.41 (32.19 - 38.77) 27.76 (24.66 - 31.08) Maine 25.04 (22.37 - 27.91) 8.87 (7.13 - 10.97) 39.16 (35.58 - 42.87) 24.70 (21.54 - 28.15) Maryland 19.40 (17.14 - 21.89) 5.90 (4.60 - 7.54) 30.06 (26.53 - 33.85) 19.27 (16.57 - 22.30) Massachusetts 19.08 (16.85 - 21.52) 8.16 (6.62 - 10.02) 32.73 (29.27 - 36.39) 17.92 (15.28 - 20.90) Michigan 26.22 (24.78 - 27.71) 8.40 (7.40 - 9.52) 39.46 (37.56 - 41.38) 26.22 (24.40 - 28.12) Minnesota 22.11 (19.75 - 24.66) 8.70 (7.03 - 10.72) 39.70 (36.08 - 43.45) 20.76 (17.96 - 23.87) Mississippi 26.96 (24.37 - 29.71) 9.37 (7.63 - 11.44) 38.81 (35.26 - 42.48) 27.17 (23.96 - 30.63) Missouri 27.01 (24.44 - 29.75) 11.60 (9.55 - 14.03) 38.35 (34.67 - 42.17) 26.98 (23.83 - 30.37) Montana 24.44 (22.02 - 27.03) 11.73 (9.65 - 14.20) 37.83 (34.26 - 41.53) 23.58 (20.71 - 26.71)
(continued)

29
120911
Table 14 Cigarette Use in the Past Month, by Age Group and State: Percentages, Annual Averages Based on 2010 and 2011 NSDUHs (continued)
State 12+
(Estimate)
12+ (95% Confidence
Interval) 12-17
(Estimate)
12-17 (95% Confidence
Interval) 18-25
(Estimate)
18-25 (95% Confidence
Interval) 26+
(Estimate)
26+ (95% Confidence
Interval) Nebraska 23.26 (20.78 - 25.95) 8.87 (7.19 - 10.91) 36.99 (33.39 - 40.74) 22.53 (19.52 - 25.87) Nevada 22.72 (19.98 - 25.71) 6.95 (5.39 - 8.91) 32.79 (28.97 - 36.85) 23.09 (19.78 - 26.76) New Hampshire 22.13 (19.66 - 24.82) 10.70 (8.64 - 13.17) 38.09 (34.63 - 41.67) 20.90 (17.94 - 24.20) New Jersey 22.86 (20.22 - 25.74) 8.35 (6.69 - 10.38) 35.37 (31.61 - 39.32) 22.74 (19.55 - 26.27) New Mexico 21.14 (18.64 - 23.88) 9.08 (7.26 - 11.28) 35.56 (31.86 - 39.44) 20.15 (17.15 - 23.52) New York 20.86 (19.52 - 22.26) 6.83 (5.94 - 7.84) 30.28 (28.35 - 32.28) 20.86 (19.18 - 22.65) North Carolina 24.61 (21.97 - 27.45) 8.86 (7.19 - 10.86) 36.84 (33.07 - 40.77) 24.48 (21.34 - 27.91) North Dakota 22.69 (20.25 - 25.33) 9.64 (7.85 - 11.79) 35.96 (32.65 - 39.41) 21.22 (18.24 - 24.54) Ohio 26.56 (25.12 - 28.06) 9.62 (8.54 - 10.82) 38.24 (36.35 - 40.16) 26.75 (24.93 - 28.66) Oklahoma 28.98 (26.03 - 32.11) 10.21 (8.23 - 12.60) 41.00 (37.21 - 44.89) 29.19 (25.58 - 33.08) Oregon 22.29 (19.81 - 24.97) 7.45 (5.95 - 9.30) 36.27 (32.61 - 40.09) 21.70 (18.76 - 24.95) Pennsylvania 24.29 (22.86 - 25.78) 9.58 (8.45 - 10.83) 36.93 (34.72 - 39.20) 23.88 (22.12 - 25.75) Rhode Island 24.13 (21.60 - 26.86) 8.39 (6.75 - 10.38) 35.77 (32.40 - 39.29) 23.72 (20.62 - 27.12) South Carolina 27.01 (24.24 - 29.97) 9.70 (7.86 - 11.91) 37.26 (33.82 - 40.84) 27.34 (23.98 - 30.97) South Dakota 24.58 (21.95 - 27.41) 10.18 (8.25 - 12.49) 38.00 (34.01 - 42.16) 23.93 (20.79 - 27.38) Tennessee 27.62 (24.72 - 30.72) 9.18 (7.49 - 11.22) 37.95 (34.16 - 41.90) 28.14 (24.66 - 31.91) Texas 21.46 (20.09 - 22.90) 7.11 (6.16 - 8.19) 31.73 (29.88 - 33.64) 21.59 (19.84 - 23.46) Utah 13.67 (11.71 - 15.90) 5.13 (3.76 - 6.97) 22.66 (19.35 - 26.35) 12.99 (10.60 - 15.82) Vermont 22.69 (20.29 - 25.28) 10.48 (8.54 - 12.80) 37.97 (34.31 - 41.78) 21.31 (18.48 - 24.43) Virginia 20.07 (17.79 - 22.57) 6.99 (5.63 - 8.64) 31.41 (28.02 - 35.02) 19.67 (16.95 - 22.70) Washington 22.72 (20.28 - 25.35) 8.56 (6.95 - 10.49) 37.14 (33.58 - 40.85) 22.01 (19.11 - 25.21) West Virginia 30.45 (27.63 - 33.42) 11.80 (9.77 - 14.18) 41.95 (38.43 - 45.56) 30.62 (27.25 - 34.22) Wisconsin 21.93 (19.45 - 24.61) 8.10 (6.45 - 10.13) 35.25 (31.65 - 39.03) 21.30 (18.33 - 24.59) Wyoming 23.88 (21.23 - 26.74) 11.26 (9.26 - 13.62) 38.55 (34.96 - 42.27) 22.72 (19.52 - 26.28) NOTE: State and census region estimates, along with the 95 percent Bayesian confidence (credible) intervals, are based on a survey-weighted hierarchical Bayes estimation approach and
generated by Markov Chain Monte Carlo techniques. For the "Total U.S." row, design-based (direct) estimates and corresponding 95 percent confidence intervals are given. Source: SAMHSA, Center for Behavioral Health Statistics and Quality, National Survey on Drug Use and Health, 2010 and 2011 (2010 Data – Revised March 2012).

30
120911
Table 15 Perceptions of Great Risk of Smoking One or More Packs of Cigarettes Per Day, by Age Group and State: Percentages, Annual Averages Based on 2010 and 2011 NSDUHs
State 12+
(Estimate)
12+ (95% Confidence
Interval) 12-17
(Estimate)
12-17 (95% Confidence
Interval) 18-25
(Estimate)
18-25 (95% Confidence
Interval) 26+
(Estimate)
26+ (95% Confidence
Interval) Total U.S. 71.35 (70.89 - 71.80) 65.74 (65.14 - 66.34) 65.71 (65.09 - 66.33) 73.03 (72.45 - 73.59) Northeast 73.69 (72.79 - 74.57) 67.49 (66.36 - 68.61) 66.83 (65.58 - 68.05) 75.56 (74.47 - 76.62) Midwest 67.62 (66.80 - 68.43) 64.46 (63.50 - 65.40) 61.71 (60.62 - 62.80) 69.04 (68.04 - 70.03) South 70.88 (70.16 - 71.59) 64.83 (63.95 - 65.70) 65.45 (64.41 - 66.47) 72.58 (71.71 - 73.43) West 73.73 (72.76 - 74.68) 67.07 (65.81 - 68.30) 68.92 (67.55 - 70.26) 75.47 (74.28 - 76.63) Alabama 67.23 (64.35 - 69.99) 60.68 (57.25 - 64.00) 62.97 (59.48 - 66.33) 68.80 (65.24 - 72.16) Alaska 66.27 (63.10 - 69.31) 65.18 (61.56 - 68.63) 61.68 (57.91 - 65.32) 67.33 (63.35 - 71.07) Arizona 70.11 (66.92 - 73.11) 65.78 (62.00 - 69.37) 66.35 (62.59 - 69.92) 71.31 (67.37 - 74.96) Arkansas 70.52 (67.63 - 73.26) 63.54 (59.92 - 67.01) 62.61 (59.11 - 65.98) 72.74 (69.16 - 76.05) California 76.76 (75.25 - 78.20) 67.76 (65.73 - 69.72) 72.32 (70.29 - 74.27) 78.81 (76.91 - 80.59) Colorado 71.50 (68.63 - 74.20) 66.28 (62.58 - 69.80) 65.23 (61.86 - 68.45) 73.21 (69.70 - 76.45) Connecticut 74.20 (71.47 - 76.75) 67.75 (64.17 - 71.13) 66.38 (62.74 - 69.84) 76.25 (72.94 - 79.28) Delaware 74.43 (71.78 - 76.91) 65.84 (62.29 - 69.22) 67.78 (64.36 - 71.01) 76.55 (73.34 - 79.48) District of Columbia 75.49 (72.76 - 78.04) 63.08 (59.49 - 66.52) 69.96 (66.43 - 73.26) 77.78 (74.47 - 80.77) Florida 75.81 (74.32 - 77.23) 67.95 (66.07 - 69.76) 69.78 (67.73 - 71.75) 77.57 (75.75 - 79.28) Georgia 69.67 (66.80 - 72.39) 63.64 (60.02 - 67.11) 66.10 (62.67 - 69.37) 71.12 (67.63 - 74.38) Hawaii 69.84 (66.77 - 72.73) 64.60 (60.48 - 68.52) 66.34 (62.65 - 69.84) 70.95 (67.23 - 74.40) Idaho 67.76 (64.78 - 70.61) 67.35 (63.81 - 70.70) 62.64 (59.03 - 66.12) 68.77 (65.04 - 72.27) Illinois 70.49 (68.91 - 72.02) 65.53 (63.55 - 67.45) 63.92 (61.91 - 65.87) 72.28 (70.32 - 74.16) Indiana 67.53 (64.43 - 70.49) 65.62 (62.08 - 69.00) 61.99 (58.53 - 65.33) 68.77 (64.88 - 72.41) Iowa 67.49 (64.63 - 70.22) 62.73 (59.25 - 66.08) 61.94 (58.45 - 65.31) 69.07 (65.53 - 72.40) Kansas 65.02 (62.02 - 67.90) 60.11 (56.47 - 63.63) 60.52 (56.84 - 64.09) 66.52 (62.78 - 70.05) Kentucky 63.22 (60.08 - 66.24) 63.82 (60.07 - 67.41) 59.09 (55.49 - 62.59) 63.83 (60.01 - 67.48) Louisiana 71.49 (68.87 - 73.97) 64.11 (60.85 - 67.24) 66.03 (62.87 - 69.05) 73.48 (70.22 - 76.50) Maine 68.82 (65.88 - 71.61) 65.53 (62.04 - 68.85) 60.40 (56.98 - 63.71) 70.38 (66.83 - 73.70) Maryland 74.58 (71.86 - 77.12) 66.15 (62.66 - 69.48) 69.07 (65.60 - 72.35) 76.53 (73.23 - 79.53) Massachusetts 75.32 (72.60 - 77.85) 66.42 (63.16 - 69.53) 68.10 (64.80 - 71.23) 77.60 (74.26 - 80.61) Michigan 68.16 (66.57 - 69.70) 65.13 (63.24 - 66.98) 62.71 (60.77 - 64.60) 69.49 (67.51 - 71.39) Minnesota 67.79 (64.86 - 70.58) 67.66 (64.09 - 71.03) 59.71 (55.91 - 63.40) 69.17 (65.61 - 72.51) Mississippi 68.93 (66.23 - 71.50) 62.28 (58.77 - 65.66) 65.16 (62.00 - 68.19) 70.54 (67.15 - 73.73) Missouri 65.03 (62.05 - 67.90) 60.22 (56.71 - 63.62) 60.35 (56.88 - 63.72) 66.42 (62.76 - 69.90) Montana 67.95 (65.31 - 70.49) 64.78 (61.42 - 68.01) 62.89 (59.45 - 66.20) 69.19 (65.94 - 72.26)
(continued)

31
120911
Table 15 Perceptions of Great Risk of Smoking One or More Packs of Cigarettes Per Day, by Age Group and State: Percentages, Annual Averages Based on 2010 and 2011 NSDUHs (continued)
State 12+
(Estimate)
12+ (95% Confidence
Interval) 12-17
(Estimate)
12-17 (95% Confidence
Interval) 18-25
(Estimate)
18-25 (95% Confidence
Interval) 26+
(Estimate)
26+ (95% Confidence
Interval) Nebraska 68.51 (65.60 - 71.28) 63.04 (59.51 - 66.43) 63.37 (59.91 - 66.70) 70.16 (66.53 - 73.55) Nevada 70.41 (67.25 - 73.39) 66.46 (62.29 - 70.39) 66.79 (62.66 - 70.67) 71.49 (67.70 - 75.00) New Hampshire 71.16 (68.33 - 73.84) 64.17 (60.45 - 67.72) 63.78 (60.37 - 67.06) 73.15 (69.74 - 76.30) New Jersey 75.31 (72.54 - 77.89) 70.34 (66.95 - 73.52) 68.62 (64.92 - 72.09) 76.93 (73.55 - 80.00) New Mexico 72.31 (69.37 - 75.06) 64.96 (61.55 - 68.22) 65.90 (62.40 - 69.24) 74.40 (70.80 - 77.69) New York 76.73 (75.22 - 78.17) 69.57 (67.59 - 71.47) 70.11 (68.11 - 72.04) 78.72 (76.86 - 80.48) North Carolina 68.67 (65.93 - 71.29) 67.21 (63.80 - 70.46) 62.29 (58.72 - 65.72) 69.92 (66.54 - 73.09) North Dakota 68.39 (65.46 - 71.17) 67.03 (63.39 - 70.47) 61.58 (58.13 - 64.91) 70.08 (66.43 - 73.50) Ohio 65.03 (63.37 - 66.66) 63.61 (61.60 - 65.56) 60.25 (58.35 - 62.11) 65.99 (63.92 - 68.00) Oklahoma 67.51 (64.59 - 70.30) 59.43 (55.49 - 63.26) 61.70 (57.99 - 65.28) 69.61 (65.99 - 73.01) Oregon 69.16 (66.29 - 71.90) 66.17 (62.76 - 69.42) 63.39 (59.94 - 66.71) 70.43 (66.95 - 73.70) Pennsylvania 67.86 (66.28 - 69.39) 63.43 (61.37 - 65.44) 60.82 (58.63 - 62.96) 69.54 (67.59 - 71.42) Rhode Island 73.56 (70.72 - 76.21) 67.16 (63.60 - 70.53) 68.50 (65.31 - 71.52) 75.26 (71.72 - 78.49) South Carolina 68.44 (65.57 - 71.18) 61.87 (58.25 - 65.36) 62.98 (59.56 - 66.27) 70.15 (66.61 - 73.45) South Dakota 67.26 (64.13 - 70.24) 64.83 (61.20 - 68.30) 61.46 (57.68 - 65.11) 68.60 (64.80 - 72.17) Tennessee 65.79 (62.74 - 68.72) 62.54 (59.18 - 65.78) 59.49 (56.02 - 62.87) 67.20 (63.46 - 70.74) Texas 71.63 (70.12 - 73.09) 64.59 (62.66 - 66.47) 66.21 (64.21 - 68.15) 73.69 (71.77 - 75.52) Utah 73.65 (71.04 - 76.10) 74.12 (70.69 - 77.28) 67.31 (63.64 - 70.78) 75.09 (71.71 - 78.19) Vermont 70.75 (67.86 - 73.48) 63.77 (60.15 - 67.24) 63.76 (59.99 - 67.36) 72.73 (69.24 - 75.97) Virginia 72.01 (69.07 - 74.77) 68.17 (64.92 - 71.26) 67.63 (64.22 - 70.86) 73.23 (69.64 - 76.55) Washington 70.76 (67.88 - 73.49) 63.59 (60.11 - 66.94) 63.83 (60.34 - 67.18) 72.77 (69.24 - 76.03) West Virginia 67.92 (65.03 - 70.67) 63.36 (59.97 - 66.63) 60.23 (56.60 - 63.75) 69.57 (66.10 - 72.83) Wisconsin 69.12 (66.20 - 71.90) 65.85 (62.33 - 69.21) 60.80 (57.18 - 64.30) 70.96 (67.37 - 74.31) Wyoming 69.57 (66.74 - 72.26) 67.10 (63.71 - 70.32) 63.88 (60.33 - 67.28) 70.90 (67.40 - 74.17) NOTE: State and census region estimates, along with the 95 percent Bayesian confidence (credible) intervals, are based on a survey-weighted hierarchical Bayes estimation approach and
generated by Markov Chain Monte Carlo techniques. For the "Total U.S." row, design-based (direct) estimates and corresponding 95 percent confidence intervals are given. Source: SAMHSA, Center for Behavioral Health Statistics and Quality, National Survey on Drug Use and Health, 2010 and 2011 (2010 Data – Revised March 2012).

32
120911
Table 16 Alcohol Dependence or Abuse in the Past Year, by Age Group and State: Percentages, Annual Averages Based on 2010 and 2011 NSDUHs
State 12+
(Estimate)
12+ (95% Confidence
Interval) 12-17
(Estimate)
12-17 (95% Confidence
Interval) 18-25
(Estimate)
18-25 (95% Confidence
Interval) 26+
(Estimate)
26+ (95% Confidence
Interval) Total U.S. 6.78 (6.56 - 7.00) 4.17 (3.91 - 4.44) 15.03 (14.55 - 15.53) 5.67 (5.40 - 5.94) Northeast 7.00 (6.56 - 7.46) 4.24 (3.84 - 4.68) 15.74 (14.84 - 16.69) 5.86 (5.35 - 6.41) Midwest 7.02 (6.66 - 7.40) 4.03 (3.72 - 4.36) 15.86 (15.09 - 16.66) 5.86 (5.43 - 6.33) South 6.05 (5.73 - 6.39) 3.76 (3.46 - 4.09) 13.49 (12.79 - 14.22) 5.05 (4.66 - 5.47) West 7.52 (7.02 - 8.06) 4.88 (4.36 - 5.47) 16.11 (15.12 - 17.15) 6.32 (5.72 - 6.98) Alabama 5.38 (4.36 - 6.64) 3.60 (2.76 - 4.68) 12.27 (10.20 - 14.70) 4.40 (3.30 - 5.86) Alaska 7.86 (6.47 - 9.52) 4.59 (3.55 - 5.92) 15.34 (12.91 - 18.12) 6.86 (5.28 - 8.88) Arizona 8.17 (6.65 - 10.01) 4.67 (3.55 - 6.12) 16.19 (13.62 - 19.13) 7.26 (5.54 - 9.47) Arkansas 5.29 (4.20 - 6.64) 3.86 (2.95 - 5.04) 11.69 (9.67 - 14.07) 4.39 (3.20 - 5.98) California 7.41 (6.65 - 8.25) 5.23 (4.40 - 6.20) 16.00 (14.51 - 17.62) 6.10 (5.21 - 7.14) Colorado 8.54 (7.11 - 10.23) 4.68 (3.58 - 6.10) 19.09 (16.50 - 21.99) 7.17 (5.57 - 9.20) Connecticut 7.30 (5.98 - 8.89) 4.20 (3.25 - 5.42) 17.20 (14.73 - 19.99) 6.08 (4.62 - 7.97) Delaware 6.19 (5.01 - 7.63) 3.83 (2.96 - 4.96) 14.26 (11.92 - 16.98) 5.11 (3.84 - 6.78) District of Columbia 10.77 (8.99 - 12.86) 3.52 (2.63 - 4.70) 18.00 (15.47 - 20.85) 9.73 (7.68 - 12.26) Florida 5.90 (5.22 - 6.67) 3.86 (3.27 - 4.56) 13.32 (11.96 - 14.81) 4.99 (4.22 - 5.90) Georgia 5.62 (4.52 - 6.96) 3.84 (2.95 - 5.00) 12.70 (10.57 - 15.20) 4.60 (3.39 - 6.20) Hawaii 7.86 (6.38 - 9.66) 4.53 (3.37 - 6.07) 17.48 (14.70 - 20.65) 6.74 (5.09 - 8.86) Idaho 7.42 (6.06 - 9.05) 4.50 (3.49 - 5.79) 15.58 (13.18 - 18.34) 6.32 (4.80 - 8.28) Illinois 6.89 (6.18 - 7.69) 3.92 (3.29 - 4.66) 16.50 (15.08 - 18.04) 5.60 (4.76 - 6.58) Indiana 6.94 (5.64 - 8.52) 3.76 (2.88 - 4.89) 15.78 (13.28 - 18.65) 5.79 (4.35 - 7.66) Iowa 7.78 (6.49 - 9.30) 4.35 (3.37 - 5.60) 18.75 (16.00 - 21.83) 6.22 (4.81 - 8.01) Kansas 7.17 (5.91 - 8.68) 4.54 (3.52 - 5.84) 15.97 (13.51 - 18.78) 5.87 (4.49 - 7.64) Kentucky 4.79 (3.80 - 6.03) 3.64 (2.75 - 4.81) 11.27 (9.22 - 13.72) 3.86 (2.80 - 5.30) Louisiana 6.30 (5.20 - 7.62) 3.24 (2.48 - 4.22) 13.51 (11.56 - 15.72) 5.35 (4.10 - 6.96) Maine 5.37 (4.33 - 6.66) 3.71 (2.81 - 4.88) 14.63 (12.31 - 17.30) 4.21 (3.11 - 5.68) Maryland 5.14 (4.09 - 6.43) 3.03 (2.26 - 4.07) 12.66 (10.42 - 15.30) 4.14 (3.01 - 5.66) Massachusetts 8.40 (7.01 - 10.05) 4.90 (3.85 - 6.21) 19.05 (16.43 - 21.97) 6.93 (5.39 - 8.88) Michigan 7.15 (6.39 - 7.99) 4.02 (3.43 - 4.70) 14.87 (13.56 - 16.29) 6.22 (5.31 - 7.26) Minnesota 7.69 (6.37 - 9.26) 4.28 (3.33 - 5.50) 17.85 (15.26 - 20.77) 6.39 (4.93 - 8.24) Mississippi 5.57 (4.50 - 6.87) 3.50 (2.63 - 4.65) 11.83 (9.87 - 14.12) 4.69 (3.50 - 6.25) Missouri 5.56 (4.48 - 6.88) 4.21 (3.26 - 5.42) 13.65 (11.45 - 16.19) 4.34 (3.17 - 5.92) Montana 8.48 (7.11 - 10.08) 5.86 (4.62 - 7.41) 19.32 (16.60 - 22.36) 6.91 (5.42 - 8.78)
(continued)

33
120911
Table 16 Alcohol Dependence or Abuse in the Past Year, by Age Group and State: Percentages, Annual Averages Based on 2010 and 2011 NSDUHs (continued)
State 12+
(Estimate)
12+ (95% Confidence
Interval) 12-17
(Estimate)
12-17 (95% Confidence
Interval) 18-25
(Estimate)
18-25 (95% Confidence
Interval) 26+
(Estimate)
26+ (95% Confidence
Interval) Nebraska 6.33 (5.16 - 7.75) 3.78 (2.87 - 4.96) 15.48 (13.18 - 18.10) 4.95 (3.68 - 6.64) Nevada 8.95 (7.31 - 10.93) 4.67 (3.46 - 6.27) 17.65 (14.94 - 20.73) 8.10 (6.22 - 10.49) New Hampshire 6.73 (5.49 - 8.22) 4.72 (3.67 - 6.04) 16.99 (14.50 - 19.81) 5.32 (3.98 - 7.08) New Jersey 6.50 (5.30 - 7.95) 4.17 (3.22 - 5.39) 14.87 (12.44 - 17.67) 5.52 (4.22 - 7.18) New Mexico 6.99 (5.74 - 8.50) 4.61 (3.52 - 6.01) 15.83 (13.41 - 18.59) 5.73 (4.35 - 7.52) New York 6.65 (5.91 - 7.47) 4.10 (3.45 - 4.86) 14.46 (13.02 - 16.03) 5.59 (4.73 - 6.59) North Carolina 5.53 (4.45 - 6.85) 4.01 (3.08 - 5.20) 12.91 (10.69 - 15.52) 4.48 (3.32 - 6.02) North Dakota 8.83 (7.48 - 10.39) 4.25 (3.28 - 5.48) 20.70 (18.11 - 23.55) 6.69 (5.18 - 8.61) Ohio 7.26 (6.49 - 8.11) 3.97 (3.38 - 4.66) 15.42 (14.07 - 16.87) 6.33 (5.43 - 7.37) Oklahoma 7.17 (5.82 - 8.80) 3.80 (2.88 - 4.99) 14.01 (11.67 - 16.72) 6.35 (4.83 - 8.31) Oregon 7.77 (6.38 - 9.43) 4.11 (3.18 - 5.29) 15.91 (13.50 - 18.65) 6.86 (5.30 - 8.83) Pennsylvania 7.07 (6.33 - 7.89) 4.15 (3.51 - 4.91) 15.64 (14.08 - 17.33) 5.98 (5.12 - 6.98) Rhode Island 9.11 (7.57 - 10.92) 4.38 (3.39 - 5.64) 19.03 (16.26 - 22.14) 7.76 (6.04 - 9.91) South Carolina 6.53 (5.34 - 7.97) 3.91 (3.02 - 5.05) 12.97 (10.88 - 15.39) 5.76 (4.41 - 7.48) South Dakota 8.87 (7.41 - 10.58) 5.88 (4.49 - 7.67) 17.83 (15.02 - 21.03) 7.62 (6.02 - 9.62) Tennessee 6.12 (4.98 - 7.49) 3.71 (2.84 - 4.82) 13.52 (11.29 - 16.12) 5.20 (3.96 - 6.80) Texas 6.58 (5.87 - 7.37) 3.72 (3.12 - 4.43) 14.17 (12.80 - 15.66) 5.55 (4.70 - 6.55) Utah 4.59 (3.63 - 5.79) 3.72 (2.77 - 4.99) 10.13 (8.10 - 12.60) 3.42 (2.40 - 4.85) Vermont 7.22 (5.98 - 8.70) 4.77 (3.73 - 6.09) 18.45 (15.87 - 21.35) 5.51 (4.15 - 7.27) Virginia 6.92 (5.72 - 8.35) 4.24 (3.33 - 5.39) 16.27 (13.93 - 18.91) 5.61 (4.30 - 7.28) Washington 7.17 (5.92 - 8.64) 4.49 (3.48 - 5.79) 16.52 (14.18 - 19.16) 5.93 (4.57 - 7.67) West Virginia 5.32 (4.30 - 6.55) 3.91 (2.98 - 5.11) 14.66 (12.41 - 17.23) 4.03 (2.96 - 5.46) Wisconsin 6.83 (5.54 - 8.39) 3.67 (2.76 - 4.85) 15.01 (12.48 - 17.94) 5.80 (4.38 - 7.63) Wyoming 7.28 (6.02 - 8.77) 4.45 (3.46 - 5.70) 16.33 (13.89 - 19.11) 5.98 (4.59 - 7.75) NOTE: Dependence or abuse is based on definitions found in the 4th edition of the Diagnostic and Statistical Manual of Mental Disorders (DSM-IV). NOTE: State and census region estimates, along with the 95 percent Bayesian confidence (credible) intervals, are based on a survey-weighted hierarchical Bayes estimation approach and
generated by Markov Chain Monte Carlo techniques. For the "Total U.S." row, design-based (direct) estimates and corresponding 95 percent confidence intervals are given. Source: SAMHSA, Center for Behavioral Health Statistics and Quality, National Survey on Drug Use and Health, 2010 and 2011 (2010 Data – Revised March 2012).

34
120911
Table 17 Alcohol Dependence in the Past Year, by Age Group and State: Percentages, Annual Averages Based on 2010 and 2011 NSDUHs
State 12+
(Estimate)
12+ (95% Confidence
Interval) 12-17
(Estimate)
12-17 (95% Confidence
Interval) 18-25
(Estimate)
18-25 (95% Confidence
Interval) 26+
(Estimate)
26+ (95% Confidence
Interval) Total U.S. 3.15 (3.00 - 3.31) 1.55 (1.41 - 1.72) 6.26 (5.95 - 6.59) 2.81 (2.62 - 3.01) Northeast 3.18 (2.90 - 3.48) 1.53 (1.31 - 1.79) 6.18 (5.63 - 6.78) 2.87 (2.54 - 3.24) Midwest 3.23 (3.00 - 3.47) 1.54 (1.36 - 1.73) 6.66 (6.20 - 7.14) 2.84 (2.57 - 3.15) South 2.78 (2.56 - 3.02) 1.39 (1.21 - 1.59) 5.50 (5.08 - 5.96) 2.48 (2.22 - 2.77) West 3.64 (3.29 - 4.03) 1.84 (1.55 - 2.19) 7.12 (6.46 - 7.85) 3.24 (2.82 - 3.73) Alabama 2.64 (2.02 - 3.44) 1.30 (0.92 - 1.84) 5.12 (3.83 - 6.82) 2.38 (1.69 - 3.33) Alaska 3.65 (2.82 - 4.71) 1.58 (1.11 - 2.23) 6.83 (5.24 - 8.87) 3.32 (2.38 - 4.61) Arizona 3.85 (2.90 - 5.08) 1.72 (1.19 - 2.48) 7.12 (5.46 - 9.23) 3.56 (2.49 - 5.08) Arkansas 2.76 (2.10 - 3.63) 1.64 (1.14 - 2.36) 5.72 (4.32 - 7.54) 2.41 (1.69 - 3.41) California 3.68 (3.17 - 4.28) 1.95 (1.52 - 2.49) 7.16 (6.16 - 8.32) 3.27 (2.65 - 4.03) Colorado 4.06 (3.16 - 5.22) 1.89 (1.34 - 2.66) 8.38 (6.57 - 10.63) 3.58 (2.58 - 4.95) Connecticut 3.01 (2.30 - 3.93) 1.56 (1.08 - 2.25) 6.20 (4.71 - 8.13) 2.67 (1.88 - 3.77) Delaware 2.75 (2.07 - 3.64) 1.57 (1.10 - 2.24) 6.00 (4.54 - 7.88) 2.34 (1.60 - 3.41) District of Columbia 5.84 (4.57 - 7.44) 1.61 (1.05 - 2.45) 7.88 (6.16 - 10.04) 5.73 (4.23 - 7.71) Florida 2.84 (2.38 - 3.38) 1.46 (1.15 - 1.85) 5.40 (4.56 - 6.38) 2.59 (2.07 - 3.24) Georgia 2.65 (2.00 - 3.52) 1.36 (0.96 - 1.93) 4.92 (3.64 - 6.62) 2.43 (1.69 - 3.47) Hawaii 3.71 (2.82 - 4.88) 1.59 (1.07 - 2.36) 7.55 (5.79 - 9.78) 3.35 (2.36 - 4.74) Idaho 3.59 (2.76 - 4.67) 1.63 (1.16 - 2.30) 7.02 (5.43 - 9.05) 3.24 (2.29 - 4.56) Illinois 3.44 (2.96 - 3.99) 1.59 (1.26 - 2.02) 7.70 (6.68 - 8.86) 2.93 (2.37 - 3.63) Indiana 3.08 (2.41 - 3.94) 1.50 (1.07 - 2.09) 7.11 (5.57 - 9.05) 2.58 (1.84 - 3.60) Iowa 3.57 (2.82 - 4.52) 1.80 (1.29 - 2.51) 8.30 (6.49 - 10.56) 2.94 (2.14 - 4.03) Kansas 3.08 (2.40 - 3.96) 1.74 (1.25 - 2.41) 6.86 (5.31 - 8.83) 2.55 (1.81 - 3.58) Kentucky 2.42 (1.79 - 3.27) 1.37 (0.95 - 1.97) 4.97 (3.67 - 6.71) 2.12 (1.44 - 3.12) Louisiana 2.88 (2.25 - 3.69) 1.42 (1.02 - 1.98) 5.27 (4.10 - 6.74) 2.63 (1.89 - 3.64) Maine 2.54 (1.87 - 3.45) 1.33 (0.88 - 2.00) 5.27 (3.97 - 6.95) 2.27 (1.54 - 3.35) Maryland 2.40 (1.73 - 3.30) 1.14 (0.76 - 1.72) 4.98 (3.65 - 6.75) 2.12 (1.39 - 3.22) Massachusetts 3.81 (2.98 - 4.85) 1.84 (1.30 - 2.60) 8.35 (6.52 - 10.63) 3.23 (2.33 - 4.47) Michigan 3.61 (3.09 - 4.22) 1.49 (1.17 - 1.89) 6.04 (5.21 - 6.99) 3.46 (2.82 - 4.24) Minnesota 3.57 (2.76 - 4.61) 1.72 (1.23 - 2.40) 7.74 (6.05 - 9.86) 3.09 (2.20 - 4.32) Mississippi 2.78 (2.12 - 3.63) 1.29 (0.90 - 1.86) 5.48 (4.19 - 7.16) 2.48 (1.75 - 3.50) Missouri 2.64 (2.02 - 3.44) 1.55 (1.09 - 2.21) 5.65 (4.30 - 7.39) 2.26 (1.58 - 3.21) Montana 3.31 (2.60 - 4.22) 1.94 (1.40 - 2.67) 7.59 (5.96 - 9.61) 2.74 (1.95 - 3.82)
(continued)

35
120911
Table 17 Alcohol Dependence in the Past Year, by Age Group and State: Percentages, Annual Averages Based on 2010 and 2011 NSDUHs (continued)
State 12+
(Estimate)
12+ (95% Confidence
Interval) 12-17
(Estimate)
12-17 (95% Confidence
Interval) 18-25
(Estimate)
18-25 (95% Confidence
Interval) 26+
(Estimate)
26+ (95% Confidence
Interval) Nebraska 2.48 (1.84 - 3.33) 1.38 (0.95 - 2.01) 5.37 (4.06 - 7.05) 2.08 (1.38 - 3.11) Nevada 3.75 (2.84 - 4.93) 1.79 (1.21 - 2.63) 7.83 (5.98 - 10.17) 3.35 (2.35 - 4.74) New Hampshire 2.91 (2.22 - 3.81) 1.55 (1.09 - 2.21) 5.49 (4.17 - 7.20) 2.65 (1.88 - 3.73) New Jersey 2.85 (2.15 - 3.76) 1.52 (1.05 - 2.18) 5.28 (3.97 - 7.00) 2.64 (1.87 - 3.73) New Mexico 3.50 (2.74 - 4.46) 1.93 (1.36 - 2.72) 7.82 (6.12 - 9.93) 2.94 (2.10 - 4.10) New York 3.20 (2.72 - 3.78) 1.51 (1.18 - 1.92) 6.10 (5.18 - 7.16) 2.90 (2.33 - 3.61) North Carolina 2.36 (1.75 - 3.17) 1.31 (0.90 - 1.91) 4.63 (3.40 - 6.27) 2.10 (1.44 - 3.06) North Dakota 4.08 (3.24 - 5.14) 1.65 (1.18 - 2.32) 8.64 (6.89 - 10.78) 3.34 (2.40 - 4.63) Ohio 3.09 (2.65 - 3.61) 1.39 (1.10 - 1.75) 5.92 (5.09 - 6.87) 2.84 (2.32 - 3.48) Oklahoma 2.65 (2.01 - 3.48) 1.32 (0.91 - 1.91) 5.80 (4.38 - 7.63) 2.24 (1.55 - 3.22) Oregon 3.69 (2.86 - 4.75) 1.65 (1.18 - 2.32) 6.53 (5.01 - 8.48) 3.46 (2.53 - 4.73) Pennsylvania 3.15 (2.66 - 3.72) 1.40 (1.08 - 1.82) 5.73 (4.80 - 6.83) 2.92 (2.35 - 3.61) Rhode Island 3.53 (2.73 - 4.57) 1.68 (1.19 - 2.37) 7.12 (5.51 - 9.16) 3.06 (2.18 - 4.28) South Carolina 3.16 (2.39 - 4.18) 1.39 (0.97 - 2.01) 4.83 (3.61 - 6.44) 3.09 (2.20 - 4.33) South Dakota 3.68 (2.82 - 4.78) 2.13 (1.47 - 3.08) 7.23 (5.48 - 9.48) 3.23 (2.29 - 4.54) Tennessee 2.79 (2.10 - 3.69) 1.38 (0.98 - 1.96) 5.31 (3.98 - 7.04) 2.54 (1.77 - 3.65) Texas 2.91 (2.46 - 3.43) 1.39 (1.08 - 1.79) 5.95 (5.06 - 7.00) 2.55 (2.03 - 3.20) Utah 2.48 (1.89 - 3.26) 1.43 (0.97 - 2.09) 5.06 (3.73 - 6.84) 2.05 (1.39 - 3.00) Vermont 3.17 (2.45 - 4.08) 1.62 (1.13 - 2.31) 6.65 (5.16 - 8.54) 2.72 (1.93 - 3.81) Virginia 3.04 (2.35 - 3.93) 1.53 (1.09 - 2.13) 6.84 (5.34 - 8.71) 2.56 (1.80 - 3.63) Washington 3.37 (2.63 - 4.31) 1.76 (1.28 - 2.42) 6.78 (5.31 - 8.61) 3.00 (2.17 - 4.13) West Virginia 2.63 (1.99 - 3.47) 1.46 (1.02 - 2.09) 6.31 (4.88 - 8.13) 2.19 (1.51 - 3.16) Wisconsin 2.76 (2.05 - 3.71) 1.35 (0.93 - 1.94) 5.34 (3.99 - 7.12) 2.49 (1.70 - 3.62) Wyoming 3.30 (2.58 - 4.21) 1.67 (1.19 - 2.35) 6.60 (5.10 - 8.49) 2.90 (2.10 - 3.99) NOTE: Dependence is based on the definition found in the 4th edition of the Diagnostic and Statistical Manual of Mental Disorders (DSM-IV). NOTE: State and census region estimates, along with the 95 percent Bayesian confidence (credible) intervals, are based on a survey-weighted hierarchical Bayes estimation approach and
generated by Markov Chain Monte Carlo techniques. For the "Total U.S." row, design-based (direct) estimates and corresponding 95 percent confidence intervals are given. Source: SAMHSA, Center for Behavioral Health Statistics and Quality, National Survey on Drug Use and Health, 2010 and 2011 (2010 Data – Revised March 2012).

36
120911
Table 18 Illicit Drug Dependence or Abuse in the Past Year, by Age Group and State: Percentages, Annual Averages Based on 2010 and 2011 NSDUHs
State 12+
(Estimate)
12+ (95% Confidence
Interval) 12-17
(Estimate)
12-17 (95% Confidence
Interval) 18-25
(Estimate)
18-25 (95% Confidence
Interval) 26+
(Estimate)
26+ (95% Confidence
Interval) Total U.S. 2.67 (2.55 - 2.80) 4.69 (4.43 - 4.95) 7.68 (7.34 - 8.03) 1.55 (1.42 - 1.70) Northeast 2.68 (2.48 - 2.90) 4.59 (4.15 - 5.07) 8.05 (7.40 - 8.74) 1.56 (1.36 - 1.80) Midwest 2.55 (2.39 - 2.72) 4.39 (4.04 - 4.76) 7.27 (6.81 - 7.77) 1.50 (1.33 - 1.70) South 2.58 (2.41 - 2.75) 4.35 (4.01 - 4.72) 7.14 (6.66 - 7.65) 1.57 (1.39 - 1.77) West 2.94 (2.71 - 3.19) 5.54 (4.97 - 6.18) 8.60 (7.86 - 9.41) 1.58 (1.33 - 1.86) Alabama 2.39 (1.92 - 2.97) 4.03 (3.04 - 5.31) 6.53 (5.02 - 8.45) 1.46 (1.02 - 2.08) Alaska 2.71 (2.21 - 3.33) 5.45 (4.04 - 7.31) 7.04 (5.33 - 9.25) 1.49 (1.03 - 2.14) Arizona 3.09 (2.47 - 3.86) 6.05 (4.53 - 8.02) 8.10 (6.28 - 10.39) 1.85 (1.26 - 2.71) Arkansas 2.56 (2.07 - 3.15) 4.42 (3.34 - 5.83) 6.87 (5.32 - 8.83) 1.59 (1.13 - 2.24) California 3.02 (2.67 - 3.41) 5.76 (4.90 - 6.76) 8.91 (7.76 - 10.20) 1.55 (1.20 - 1.99) Colorado 2.98 (2.48 - 3.58) 5.45 (4.12 - 7.18) 10.11 (8.15 - 12.47) 1.45 (1.01 - 2.07) Connecticut 2.70 (2.17 - 3.36) 4.56 (3.37 - 6.15) 7.87 (6.10 - 10.09) 1.63 (1.14 - 2.34) Delaware 2.76 (2.25 - 3.39) 4.59 (3.44 - 6.08) 8.19 (6.43 - 10.37) 1.64 (1.16 - 2.33) District of Columbia 3.42 (2.71 - 4.32) 4.54 (3.36 - 6.11) 6.84 (5.25 - 8.86) 2.56 (1.80 - 3.62) Florida 2.59 (2.26 - 2.97) 4.34 (3.66 - 5.14) 8.13 (7.03 - 9.38) 1.57 (1.23 - 2.00) Georgia 2.39 (1.91 - 2.99) 4.08 (3.04 - 5.45) 6.32 (4.84 - 8.22) 1.46 (1.02 - 2.09) Hawaii 2.08 (1.65 - 2.62) 4.40 (3.24 - 5.95) 5.86 (4.40 - 7.77) 1.25 (0.84 - 1.84) Idaho 2.66 (2.17 - 3.25) 4.47 (3.36 - 5.92) 7.27 (5.64 - 9.33) 1.55 (1.10 - 2.16) Illinois 2.58 (2.25 - 2.94) 4.10 (3.40 - 4.95) 8.07 (7.02 - 9.25) 1.42 (1.10 - 1.83) Indiana 2.44 (1.95 - 3.05) 3.80 (2.80 - 5.14) 6.99 (5.40 - 9.00) 1.45 (1.00 - 2.11) Iowa 2.23 (1.79 - 2.77) 4.36 (3.30 - 5.74) 6.24 (4.71 - 8.23) 1.25 (0.86 - 1.80) Kansas 2.57 (2.10 - 3.13) 4.51 (3.38 - 5.99) 7.28 (5.69 - 9.26) 1.42 (1.00 - 2.02) Kentucky 2.53 (2.06 - 3.09) 4.75 (3.59 - 6.27) 7.10 (5.50 - 9.12) 1.51 (1.09 - 2.09) Louisiana 2.39 (1.94 - 2.95) 3.91 (2.98 - 5.11) 5.94 (4.62 - 7.60) 1.53 (1.08 - 2.16) Maine 2.22 (1.79 - 2.74) 3.71 (2.73 - 5.02) 8.47 (6.66 - 10.72) 1.16 (0.80 - 1.67) Maryland 2.61 (2.12 - 3.21) 4.19 (3.14 - 5.56) 8.00 (6.25 - 10.17) 1.52 (1.08 - 2.15) Massachusetts 2.76 (2.26 - 3.38) 6.15 (4.75 - 7.92) 7.95 (6.20 - 10.14) 1.47 (1.00 - 2.15) Michigan 2.51 (2.20 - 2.85) 4.81 (4.09 - 5.65) 6.97 (6.08 - 7.99) 1.44 (1.13 - 1.84) Minnesota 2.48 (2.03 - 3.02) 4.82 (3.66 - 6.33) 7.53 (5.89 - 9.57) 1.34 (0.95 - 1.89) Mississippi 2.77 (2.26 - 3.40) 3.83 (2.85 - 5.13) 7.38 (5.81 - 9.33) 1.77 (1.27 - 2.46) Missouri 2.80 (2.30 - 3.40) 4.67 (3.57 - 6.09) 8.53 (6.80 - 10.64) 1.59 (1.14 - 2.22) Montana 2.76 (2.29 - 3.33) 5.74 (4.43 - 7.42) 8.24 (6.58 - 10.26) 1.48 (1.05 - 2.09)
(continued)

37
120911
Table 18 Illicit Drug Dependence or Abuse in the Past Year, by Age Group and State: Percentages, Annual Averages Based on 2010 and 2011 NSDUHs (continued)
State 12+
(Estimate)
12+ (95% Confidence
Interval) 12-17
(Estimate)
12-17 (95% Confidence
Interval) 18-25
(Estimate)
18-25 (95% Confidence
Interval) 26+
(Estimate)
26+ (95% Confidence
Interval) Nebraska 2.28 (1.82 - 2.86) 3.89 (2.87 - 5.25) 5.63 (4.26 - 7.41) 1.46 (1.00 - 2.11) Nevada 2.66 (2.10 - 3.36) 4.70 (3.41 - 6.44) 6.95 (5.25 - 9.14) 1.72 (1.19 - 2.47) New Hampshire 2.89 (2.36 - 3.53) 6.36 (4.84 - 8.31) 9.14 (7.31 - 11.38) 1.49 (1.01 - 2.19) New Jersey 2.61 (2.13 - 3.21) 4.80 (3.62 - 6.34) 8.22 (6.38 - 10.53) 1.50 (1.07 - 2.10) New Mexico 3.11 (2.53 - 3.82) 7.07 (5.45 - 9.11) 8.89 (6.97 - 11.27) 1.57 (1.04 - 2.34) New York 2.68 (2.34 - 3.06) 4.09 (3.40 - 4.92) 8.01 (6.94 - 9.22) 1.58 (1.24 - 2.01) North Carolina 2.69 (2.19 - 3.30) 4.86 (3.70 - 6.36) 7.79 (6.13 - 9.84) 1.58 (1.11 - 2.23) North Dakota 2.03 (1.58 - 2.60) 3.87 (2.85 - 5.23) 4.97 (3.72 - 6.60) 1.16 (0.75 - 1.78) Ohio 2.78 (2.44 - 3.17) 4.42 (3.74 - 5.22) 7.49 (6.54 - 8.55) 1.81 (1.44 - 2.27) Oklahoma 2.52 (2.01 - 3.16) 4.13 (3.05 - 5.57) 6.47 (4.91 - 8.49) 1.59 (1.10 - 2.28) Oregon 3.05 (2.48 - 3.75) 5.65 (4.33 - 7.33) 9.24 (7.29 - 11.65) 1.75 (1.24 - 2.47) Pennsylvania 2.67 (2.34 - 3.05) 4.27 (3.54 - 5.14) 7.70 (6.59 - 8.98) 1.65 (1.30 - 2.09) Rhode Island 2.86 (2.33 - 3.51) 4.55 (3.37 - 6.12) 8.48 (6.70 - 10.67) 1.60 (1.12 - 2.29) South Carolina 2.62 (2.12 - 3.24) 4.73 (3.59 - 6.22) 7.12 (5.55 - 9.10) 1.61 (1.13 - 2.28) South Dakota 2.23 (1.77 - 2.82) 4.54 (3.37 - 6.08) 5.56 (4.00 - 7.69) 1.35 (0.93 - 1.95) Tennessee 2.90 (2.35 - 3.57) 4.65 (3.54 - 6.07) 8.66 (6.82 - 10.93) 1.76 (1.23 - 2.50) Texas 2.54 (2.21 - 2.92) 4.35 (3.63 - 5.19) 6.24 (5.29 - 7.34) 1.57 (1.22 - 2.02) Utah 2.78 (2.27 - 3.40) 4.51 (3.37 - 6.00) 6.32 (4.86 - 8.18) 1.64 (1.18 - 2.29) Vermont 3.35 (2.77 - 4.04) 5.31 (4.07 - 6.92) 11.86 (9.62 - 14.54) 1.64 (1.14 - 2.35) Virginia 2.54 (2.06 - 3.12) 4.45 (3.34 - 5.89) 7.33 (5.63 - 9.49) 1.47 (1.05 - 2.07) Washington 2.72 (2.24 - 3.31) 4.70 (3.58 - 6.14) 8.76 (6.97 - 10.96) 1.49 (1.05 - 2.10) West Virginia 2.63 (2.13 - 3.24) 3.70 (2.66 - 5.11) 9.25 (7.38 - 11.53) 1.50 (1.04 - 2.16) Wisconsin 2.40 (1.92 - 2.99) 4.36 (3.26 - 5.82) 6.12 (4.65 - 8.01) 1.51 (1.05 - 2.17) Wyoming 2.19 (1.75 - 2.73) 4.19 (3.14 - 5.59) 5.76 (4.40 - 7.52) 1.30 (0.90 - 1.87) NOTE: Illicit Drugs include marijuana/hashish, cocaine (including crack), heroin, hallucinogens, inhalants, or prescription-type psychotherapeutics used nonmedically, including data from
original methamphetamine questions but not including new methamphetamine items added in 2005 and 2006. See Section B.4.8 in Appendix B of the Results from the 2008 National Survey on Drug Use and Health: National Findings.
NOTE: Dependence or abuse is based on definitions found in the 4th edition of the Diagnostic and Statistical Manual of Mental Disorders (DSM-IV). NOTE: State and census region estimates, along with the 95 percent Bayesian confidence (credible) intervals, are based on a survey-weighted hierarchical Bayes estimation approach and
generated by Markov Chain Monte Carlo techniques. For the "Total U.S." row, design-based (direct) estimates and corresponding 95 percent confidence intervals are given. Source: SAMHSA, Center for Behavioral Health Statistics and Quality, National Survey on Drug Use and Health, 2010 and 2011 (2010 Data – Revised March 2012).

38
120911
Table 19 Illicit Drug Dependence in the Past Year, by Age Group and State: Percentages, Annual Averages Based on 2010 and 2011 NSDUHs
State 12+
(Estimate)
12+ (95% Confidence
Interval) 12-17
(Estimate)
12-17 (95% Confidence
Interval) 18-25
(Estimate)
18-25 (95% Confidence
Interval) 26+
(Estimate)
26+ (95% Confidence
Interval) Total U.S. 1.84 (1.74 - 1.95) 2.54 (2.35 - 2.74) 5.36 (5.07 - 5.66) 1.14 (1.03 - 1.27) Northeast 1.91 (1.73 - 2.10) 2.46 (2.17 - 2.78) 5.67 (5.14 - 6.26) 1.21 (1.02 - 1.43) Midwest 1.76 (1.62 - 1.91) 2.40 (2.16 - 2.66) 5.02 (4.63 - 5.44) 1.11 (0.95 - 1.29) South 1.74 (1.60 - 1.89) 2.37 (2.13 - 2.63) 4.93 (4.54 - 5.35) 1.11 (0.96 - 1.29) West 2.03 (1.82 - 2.27) 2.98 (2.57 - 3.45) 6.10 (5.46 - 6.79) 1.17 (0.95 - 1.45) Alabama 1.61 (1.24 - 2.08) 2.15 (1.57 - 2.94) 4.65 (3.45 - 6.22) 1.01 (0.67 - 1.53) Alaska 1.88 (1.45 - 2.43) 2.88 (2.09 - 3.97) 4.74 (3.44 - 6.49) 1.18 (0.79 - 1.76) Arizona 2.20 (1.67 - 2.89) 3.50 (2.53 - 4.82) 6.15 (4.57 - 8.24) 1.35 (0.87 - 2.09) Arkansas 1.77 (1.37 - 2.28) 2.48 (1.79 - 3.40) 4.60 (3.38 - 6.22) 1.20 (0.82 - 1.76) California 2.09 (1.78 - 2.45) 3.04 (2.46 - 3.75) 6.42 (5.45 - 7.54) 1.15 (0.84 - 1.58) Colorado 1.82 (1.42 - 2.34) 2.83 (2.04 - 3.90) 5.86 (4.43 - 7.70) 1.00 (0.67 - 1.51) Connecticut 1.98 (1.53 - 2.55) 2.55 (1.85 - 3.50) 5.66 (4.32 - 7.37) 1.31 (0.88 - 1.95) Delaware 2.02 (1.59 - 2.56) 2.65 (1.92 - 3.65) 6.33 (4.79 - 8.33) 1.22 (0.84 - 1.79) District of Columbia 2.54 (1.93 - 3.32) 2.73 (1.92 - 3.87) 4.74 (3.51 - 6.36) 2.02 (1.38 - 2.96) Florida 1.64 (1.39 - 1.93) 2.29 (1.86 - 2.83) 5.33 (4.46 - 6.36) 1.01 (0.76 - 1.33) Georgia 1.53 (1.16 - 2.01) 2.23 (1.62 - 3.05) 4.06 (2.93 - 5.59) 0.98 (0.63 - 1.53) Hawaii 1.39 (1.01 - 1.91) 2.40 (1.67 - 3.46) 3.95 (2.78 - 5.59) 0.88 (0.53 - 1.46) Idaho 1.83 (1.44 - 2.32) 2.61 (1.92 - 3.52) 5.00 (3.71 - 6.73) 1.13 (0.78 - 1.64) Illinois 1.80 (1.53 - 2.12) 2.44 (1.92 - 3.10) 5.58 (4.71 - 6.60) 1.06 (0.79 - 1.43) Indiana 1.67 (1.29 - 2.15) 2.24 (1.63 - 3.08) 4.69 (3.46 - 6.32) 1.06 (0.71 - 1.57) Iowa 1.50 (1.14 - 1.96) 2.36 (1.71 - 3.25) 4.45 (3.24 - 6.09) 0.86 (0.56 - 1.33) Kansas 1.68 (1.29 - 2.18) 2.49 (1.80 - 3.45) 4.66 (3.44 - 6.29) 1.01 (0.66 - 1.54) Kentucky 1.87 (1.46 - 2.39) 2.45 (1.80 - 3.33) 5.84 (4.40 - 7.70) 1.15 (0.79 - 1.67) Louisiana 1.69 (1.31 - 2.17) 2.25 (1.64 - 3.08) 4.48 (3.34 - 5.97) 1.09 (0.73 - 1.64) Maine 1.57 (1.22 - 2.02) 2.10 (1.54 - 2.87) 5.77 (4.37 - 7.59) 0.91 (0.60 - 1.36) Maryland 1.90 (1.48 - 2.43) 2.27 (1.65 - 3.12) 5.91 (4.44 - 7.83) 1.18 (0.80 - 1.74) Massachusetts 2.07 (1.64 - 2.62) 3.22 (2.40 - 4.32) 6.22 (4.73 - 8.13) 1.21 (0.82 - 1.79) Michigan 1.69 (1.45 - 1.98) 2.50 (2.04 - 3.05) 4.98 (4.25 - 5.83) 1.02 (0.78 - 1.34) Minnesota 1.54 (1.18 - 2.02) 2.50 (1.83 - 3.43) 4.47 (3.24 - 6.14) 0.93 (0.62 - 1.40) Mississippi 1.96 (1.54 - 2.49) 2.24 (1.64 - 3.05) 5.25 (3.93 - 6.98) 1.31 (0.90 - 1.89) Missouri 1.87 (1.48 - 2.37) 2.41 (1.77 - 3.28) 5.66 (4.29 - 7.44) 1.16 (0.80 - 1.68) Montana 2.00 (1.58 - 2.53) 2.91 (2.15 - 3.92) 6.04 (4.63 - 7.85) 1.20 (0.82 - 1.76)
(continued)

39
120911
Table 19 Illicit Drug Dependence in the Past Year, by Age Group and State: Percentages, Annual Averages Based on 2010 and 2011 NSDUHs (continued)
State 12+
(Estimate)
12+ (95% Confidence
Interval) 12-17
(Estimate)
12-17 (95% Confidence
Interval) 18-25
(Estimate)
18-25 (95% Confidence
Interval) 26+
(Estimate)
26+ (95% Confidence
Interval) Nebraska 1.60 (1.20 - 2.11) 2.01 (1.41 - 2.85) 3.95 (2.87 - 5.42) 1.11 (0.72 - 1.70) Nevada 1.99 (1.52 - 2.62) 2.79 (1.97 - 3.95) 5.45 (3.97 - 7.43) 1.34 (0.90 - 2.01) New Hampshire 1.95 (1.54 - 2.46) 3.09 (2.26 - 4.22) 6.48 (5.00 - 8.36) 1.10 (0.74 - 1.62) New Jersey 1.68 (1.30 - 2.15) 2.30 (1.67 - 3.16) 5.29 (3.95 - 7.07) 1.05 (0.71 - 1.56) New Mexico 1.97 (1.53 - 2.52) 3.56 (2.59 - 4.89) 6.11 (4.59 - 8.08) 1.02 (0.66 - 1.57) New York 1.99 (1.69 - 2.35) 2.27 (1.81 - 2.83) 5.68 (4.80 - 6.72) 1.32 (0.99 - 1.74) North Carolina 1.85 (1.45 - 2.36) 2.61 (1.93 - 3.52) 5.55 (4.17 - 7.36) 1.14 (0.78 - 1.66) North Dakota 1.43 (1.06 - 1.94) 2.01 (1.39 - 2.89) 3.78 (2.75 - 5.16) 0.84 (0.50 - 1.41) Ohio 2.01 (1.71 - 2.37) 2.47 (2.02 - 3.01) 5.50 (4.69 - 6.43) 1.39 (1.06 - 1.80) Oklahoma 1.77 (1.35 - 2.33) 2.19 (1.55 - 3.09) 4.68 (3.39 - 6.44) 1.19 (0.79 - 1.78) Oregon 2.22 (1.73 - 2.86) 2.87 (2.10 - 3.90) 6.72 (5.17 - 8.69) 1.42 (0.95 - 2.13) Pennsylvania 1.82 (1.52 - 2.16) 2.37 (1.89 - 2.98) 5.34 (4.47 - 6.37) 1.16 (0.87 - 1.56) Rhode Island 2.14 (1.65 - 2.77) 2.77 (2.03 - 3.77) 5.85 (4.41 - 7.73) 1.36 (0.90 - 2.03) South Carolina 1.62 (1.24 - 2.11) 2.24 (1.61 - 3.11) 4.29 (3.12 - 5.88) 1.09 (0.73 - 1.63) South Dakota 1.64 (1.24 - 2.17) 2.64 (1.91 - 3.63) 4.21 (3.03 - 5.81) 1.06 (0.69 - 1.61) Tennessee 2.13 (1.65 - 2.75) 2.48 (1.83 - 3.36) 6.51 (4.89 - 8.61) 1.38 (0.93 - 2.04) Texas 1.65 (1.39 - 1.97) 2.41 (1.94 - 2.99) 4.01 (3.30 - 4.86) 1.10 (0.81 - 1.48) Utah 1.81 (1.42 - 2.32) 2.33 (1.68 - 3.21) 4.34 (3.22 - 5.82) 1.13 (0.77 - 1.65) Vermont 2.29 (1.83 - 2.87) 2.85 (2.06 - 3.92) 8.24 (6.40 - 10.55) 1.18 (0.79 - 1.77) Virginia 1.77 (1.38 - 2.29) 2.52 (1.85 - 3.43) 5.17 (3.88 - 6.86) 1.09 (0.73 - 1.63) Washington 1.95 (1.52 - 2.49) 2.75 (2.02 - 3.73) 6.10 (4.61 - 8.03) 1.16 (0.79 - 1.72) West Virginia 2.09 (1.64 - 2.66) 2.45 (1.77 - 3.39) 7.73 (6.06 - 9.82) 1.18 (0.79 - 1.78) Wisconsin 1.71 (1.27 - 2.30) 2.15 (1.53 - 3.00) 4.25 (3.07 - 5.84) 1.22 (0.78 - 1.90) Wyoming 1.44 (1.07 - 1.93) 2.01 (1.41 - 2.87) 3.72 (2.61 - 5.29) 0.95 (0.61 - 1.50) NOTE: Illicit Drugs include marijuana/hashish, cocaine (including crack), heroin, hallucinogens, inhalants, or prescription-type psychotherapeutics used nonmedically, including data from
original methamphetamine questions but not including new methamphetamine items added in 2005 and 2006. See Section B.4.8 in Appendix B of the Results from the 2008 National Survey on Drug Use and Health: National Findings.
NOTE: Dependence is based on the definition found in the 4th edition of the Diagnostic and Statistical Manual of Mental Disorders (DSM-IV). NOTE: State and census region estimates, along with the 95 percent Bayesian confidence (credible) intervals, are based on a survey-weighted hierarchical Bayes estimation approach and
generated by Markov Chain Monte Carlo techniques. For the "Total U.S." row, design-based (direct) estimates and corresponding 95 percent confidence intervals are given. Source: SAMHSA, Center for Behavioral Health Statistics and Quality, National Survey on Drug Use and Health, 2010 and 2011 (2010 Data – Revised March 2012).

40
120911
Table 20 Dependence or Abuse of Illicit Drugs or Alcohol in the Past Year, by Age Group and State: Percentages, Annual Averages Based on 2010 and 2011 NSDUHs
State 12+
(Estimate)
12+ (95% Confidence
Interval) 12-17
(Estimate)
12-17 (95% Confidence
Interval) 18-25
(Estimate)
18-25 (95% Confidence
Interval) 26+
(Estimate)
26+ (95% Confidence
Interval) Total U.S. 8.38 (8.14 - 8.62) 7.11 (6.78 - 7.44) 19.26 (18.72 - 19.82) 6.64 (6.36 - 6.95) Northeast 8.76 (8.27 - 9.28) 7.31 (6.75 - 7.90) 20.06 (19.09 - 21.06) 7.04 (6.45 - 7.67) Midwest 8.51 (8.13 - 8.90) 6.76 (6.34 - 7.20) 19.70 (18.91 - 20.52) 6.79 (6.33 - 7.28) South 7.56 (7.20 - 7.92) 6.43 (6.01 - 6.87) 17.63 (16.84 - 18.44) 5.96 (5.53 - 6.42) West 9.26 (8.73 - 9.81) 8.32 (7.64 - 9.06) 20.79 (19.66 - 21.96) 7.30 (6.66 - 7.99) Alabama 6.67 (5.53 - 8.03) 5.95 (4.71 - 7.49) 15.87 (13.47 - 18.60) 5.15 (3.92 - 6.75) Alaska 9.26 (7.79 - 10.96) 7.70 (6.13 - 9.62) 19.18 (16.39 - 22.32) 7.55 (5.93 - 9.56) Arizona 10.33 (8.62 - 12.33) 8.52 (6.74 - 10.71) 21.28 (18.40 - 24.49) 8.70 (6.76 - 11.12) Arkansas 6.85 (5.63 - 8.30) 6.02 (4.72 - 7.66) 15.68 (13.29 - 18.41) 5.46 (4.16 - 7.14) California 9.17 (8.34 - 10.06) 8.79 (7.72 - 9.99) 20.92 (19.22 - 22.74) 7.02 (6.06 - 8.13) Colorado 9.92 (8.46 - 11.60) 8.14 (6.54 - 10.08) 23.60 (20.62 - 26.86) 7.76 (6.14 - 9.78) Connecticut 8.99 (7.53 - 10.69) 7.30 (5.78 - 9.19) 21.22 (18.34 - 24.43) 7.22 (5.61 - 9.24) Delaware 7.92 (6.62 - 9.44) 6.59 (5.20 - 8.32) 19.25 (16.61 - 22.18) 6.18 (4.76 - 7.98) District of Columbia 12.68 (10.77 - 14.87) 6.71 (5.27 - 8.51) 21.30 (18.52 - 24.37) 11.22 (8.99 - 13.91) Florida 7.54 (6.83 - 8.32) 6.63 (5.78 - 7.60) 17.73 (16.22 - 19.35) 6.08 (5.27 - 7.01) Georgia 6.90 (5.74 - 8.28) 6.33 (5.03 - 7.94) 17.06 (14.53 - 19.94) 5.17 (3.93 - 6.78) Hawaii 8.63 (7.16 - 10.38) 7.74 (6.08 - 9.80) 19.99 (17.15 - 23.17) 6.97 (5.36 - 9.03) Idaho 9.19 (7.76 - 10.85) 7.34 (5.90 - 9.09) 19.77 (17.07 - 22.78) 7.49 (5.89 - 9.50) Illinois 8.38 (7.63 - 9.19) 6.42 (5.58 - 7.37) 21.04 (19.42 - 22.77) 6.42 (5.54 - 7.42) Indiana 8.33 (6.98 - 9.90) 5.85 (4.65 - 7.34) 19.33 (16.68 - 22.29) 6.70 (5.20 - 8.59) Iowa 8.67 (7.40 - 10.15) 7.17 (5.75 - 8.90) 21.24 (18.45 - 24.33) 6.59 (5.20 - 8.33) Kansas 8.39 (7.13 - 9.84) 7.17 (5.74 - 8.91) 19.50 (16.88 - 22.42) 6.46 (5.08 - 8.18) Kentucky 6.45 (5.32 - 7.79) 6.22 (4.86 - 7.93) 15.52 (13.13 - 18.25) 4.98 (3.78 - 6.53) Louisiana 7.46 (6.26 - 8.86) 5.64 (4.52 - 7.01) 16.66 (14.47 - 19.11) 5.97 (4.62 - 7.68) Maine 6.78 (5.59 - 8.21) 5.93 (4.63 - 7.56) 18.38 (15.89 - 21.16) 5.20 (3.91 - 6.88) Maryland 6.78 (5.58 - 8.21) 5.62 (4.35 - 7.24) 17.53 (14.98 - 20.41) 5.12 (3.83 - 6.83) Massachusetts 10.22 (8.65 - 12.03) 9.01 (7.37 - 10.98) 23.38 (20.48 - 26.55) 8.05 (6.30 - 10.22) Michigan 8.60 (7.82 - 9.44) 7.15 (6.26 - 8.14) 18.50 (17.03 - 20.06) 7.08 (6.15 - 8.13) Minnesota 9.12 (7.74 - 10.72) 7.61 (6.09 - 9.48) 21.30 (18.60 - 24.28) 7.24 (5.72 - 9.13) Mississippi 7.10 (5.95 - 8.45) 5.74 (4.51 - 7.29) 16.38 (14.11 - 18.93) 5.56 (4.29 - 7.17) Missouri 7.33 (6.13 - 8.74) 6.99 (5.57 - 8.76) 18.25 (15.76 - 21.03) 5.50 (4.20 - 7.16) Montana 10.31 (8.86 - 11.98) 9.94 (8.11 - 12.14) 23.47 (20.57 - 26.64) 8.09 (6.47 - 10.08)
(continued)

41
120911
Table 20 Dependence or Abuse of Illicit Drugs or Alcohol in the Past Year, by Age Group and State: Percentages, Annual Averages Based on 2010 and 2011 NSDUHs (continued)
State 12+
(Estimate)
12+ (95% Confidence
Interval) 12-17
(Estimate)
12-17 (95% Confidence
Interval) 18-25
(Estimate)
18-25 (95% Confidence
Interval) 26+
(Estimate)
26+ (95% Confidence
Interval) Nebraska 8.04 (6.76 - 9.54) 6.23 (4.94 - 7.84) 19.23 (16.66 - 22.09) 6.19 (4.78 - 7.98) Nevada 10.49 (8.70 - 12.60) 7.82 (6.02 - 10.10) 20.89 (17.83 - 24.34) 9.16 (7.13 - 11.70) New Hampshire 8.70 (7.31 - 10.32) 8.94 (7.09 - 11.20) 21.26 (18.65 - 24.13) 6.67 (5.15 - 8.60) New Jersey 8.21 (6.85 - 9.81) 7.54 (6.02 - 9.39) 19.46 (16.82 - 22.40) 6.59 (5.09 - 8.49) New Mexico 9.17 (7.70 - 10.87) 9.33 (7.52 - 11.52) 20.85 (18.13 - 23.87) 7.07 (5.45 - 9.12) New York 8.39 (7.58 - 9.28) 6.77 (5.87 - 7.79) 18.95 (17.36 - 20.64) 6.74 (5.79 - 7.84) North Carolina 7.03 (5.84 - 8.43) 6.67 (5.31 - 8.34) 17.44 (15.04 - 20.12) 5.33 (4.05 - 6.99) North Dakota 9.44 (8.11 - 10.97) 6.78 (5.42 - 8.44) 22.30 (19.59 - 25.26) 6.87 (5.40 - 8.70) Ohio 8.86 (8.08 - 9.70) 6.71 (5.87 - 7.66) 19.70 (18.20 - 21.30) 7.34 (6.42 - 8.38) Oklahoma 8.89 (7.45 - 10.59) 6.49 (5.08 - 8.27) 17.96 (15.30 - 20.97) 7.54 (5.91 - 9.58) Oregon 9.77 (8.24 - 11.54) 8.02 (6.52 - 9.84) 20.56 (17.79 - 23.62) 8.22 (6.50 - 10.33) Pennsylvania 8.87 (8.03 - 9.79) 6.98 (6.08 - 8.02) 19.56 (17.87 - 21.36) 7.31 (6.34 - 8.42) Rhode Island 10.68 (9.03 - 12.60) 7.35 (5.83 - 9.23) 22.99 (20.19 - 26.04) 8.72 (6.84 - 11.05) South Carolina 8.06 (6.71 - 9.66) 6.82 (5.46 - 8.49) 17.41 (14.99 - 20.14) 6.63 (5.14 - 8.52) South Dakota 9.97 (8.43 - 11.75) 8.44 (6.72 - 10.56) 20.31 (17.36 - 23.62) 8.30 (6.57 - 10.43) Tennessee 8.21 (6.86 - 9.79) 6.84 (5.50 - 8.48) 19.06 (16.30 - 22.16) 6.61 (5.15 - 8.44) Texas 7.95 (7.21 - 8.76) 6.50 (5.62 - 7.50) 17.51 (16.07 - 19.06) 6.34 (5.45 - 7.37) Utah 6.28 (5.15 - 7.65) 5.63 (4.29 - 7.37) 14.24 (11.79 - 17.10) 4.50 (3.27 - 6.15) Vermont 9.96 (8.52 - 11.60) 9.00 (7.30 - 11.04) 25.24 (22.19 - 28.55) 7.37 (5.80 - 9.31) Virginia 8.20 (6.95 - 9.67) 6.96 (5.54 - 8.71) 20.61 (17.90 - 23.61) 6.19 (4.84 - 7.89) Washington 8.70 (7.33 - 10.29) 7.17 (5.76 - 8.89) 21.09 (18.33 - 24.15) 6.82 (5.35 - 8.67) West Virginia 7.12 (6.01 - 8.42) 6.09 (4.84 - 7.65) 19.30 (16.80 - 22.08) 5.36 (4.15 - 6.90) Wisconsin 8.61 (7.18 - 10.28) 6.48 (5.12 - 8.16) 18.13 (15.57 - 21.00) 7.22 (5.60 - 9.25) Wyoming 8.34 (7.04 - 9.85) 6.89 (5.52 - 8.55) 18.96 (16.42 - 21.79) 6.59 (5.15 - 8.39) NOTE: Illicit Drugs include marijuana/hashish, cocaine (including crack), heroin, hallucinogens, inhalants, or prescription-type psychotherapeutics used nonmedically, including data from
original methamphetamine questions but not including new methamphetamine items added in 2005 and 2006. See Section B.4.8 in Appendix B of the Results from the 2008 National Survey on Drug Use and Health: National Findings.
NOTE: Dependence or abuse is based on definitions found in the 4th edition of the Diagnostic and Statistical Manual of Mental Disorders (DSM-IV). NOTE: State and census region estimates, along with the 95 percent Bayesian confidence (credible) intervals, are based on a survey-weighted hierarchical Bayes estimation approach and
generated by Markov Chain Monte Carlo techniques. For the "Total U.S." row, design-based (direct) estimates and corresponding 95 percent confidence intervals are given. Source: SAMHSA, Center for Behavioral Health Statistics and Quality, National Survey on Drug Use and Health, 2010 and 2011 (2010 Data – Revised March 2012).

42
120911
Table 21 Needing But Not Receiving Treatment for Illicit Drug Use in the Past Year, by Age Group and State: Percentages, Annual Averages Based on 2010 and 2011 NSDUHs
State 12+
(Estimate)
12+ (95% Confidence
Interval) 12-17
(Estimate)
12-17 (95% Confidence
Interval) 18-25
(Estimate)
18-25 (95% Confidence
Interval) 26+
(Estimate)
26+ (95% Confidence
Interval) Total U.S. 2.40 (2.28 - 2.51) 4.34 (4.10 - 4.59) 7.05 (6.73 - 7.38) 1.34 (1.22 - 1.48) Northeast 2.37 (2.20 - 2.57) 4.22 (3.81 - 4.68) 7.33 (6.72 - 8.00) 1.33 (1.14 - 1.55) Midwest 2.24 (2.10 - 2.39) 4.02 (3.69 - 4.38) 6.64 (6.20 - 7.11) 1.25 (1.09 - 1.43) South 2.31 (2.17 - 2.47) 4.06 (3.73 - 4.42) 6.54 (6.09 - 7.03) 1.36 (1.20 - 1.55) West 2.69 (2.46 - 2.94) 5.14 (4.56 - 5.77) 7.98 (7.25 - 8.79) 1.42 (1.18 - 1.70) Alabama 2.14 (1.74 - 2.62) 3.74 (2.76 - 5.06) 6.34 (4.84 - 8.26) 1.20 (0.84 - 1.72) Alaska 2.78 (2.22 - 3.46) 5.22 (3.88 - 6.98) 6.62 (4.95 - 8.80) 1.69 (1.13 - 2.50) Arizona 2.78 (2.21 - 3.50) 5.70 (4.15 - 7.80) 7.50 (5.69 - 9.84) 1.60 (1.08 - 2.35) Arkansas 2.21 (1.80 - 2.71) 4.02 (2.99 - 5.39) 6.47 (5.03 - 8.30) 1.27 (0.89 - 1.81) California 2.79 (2.46 - 3.18) 5.31 (4.46 - 6.30) 8.34 (7.20 - 9.65) 1.42 (1.08 - 1.87) Colorado 2.58 (2.15 - 3.10) 5.05 (3.71 - 6.83) 9.26 (7.33 - 11.63) 1.13 (0.78 - 1.64) Connecticut 2.28 (1.84 - 2.82) 3.98 (2.94 - 5.36) 6.96 (5.31 - 9.07) 1.31 (0.91 - 1.89) Delaware 2.34 (1.90 - 2.87) 3.84 (2.81 - 5.21) 7.04 (5.39 - 9.14) 1.38 (0.94 - 2.01) District of Columbia 2.74 (2.17 - 3.45) 4.32 (3.14 - 5.90) 6.14 (4.61 - 8.13) 1.84 (1.27 - 2.66) Florida 2.39 (2.08 - 2.73) 4.16 (3.46 - 4.99) 7.48 (6.44 - 8.67) 1.42 (1.11 - 1.83) Georgia 2.14 (1.68 - 2.72) 3.76 (2.75 - 5.11) 5.31 (3.92 - 7.17) 1.35 (0.90 - 2.02) Hawaii 1.96 (1.54 - 2.50) 4.20 (3.03 - 5.79) 5.69 (4.24 - 7.59) 1.14 (0.74 - 1.75) Idaho 2.41 (1.98 - 2.94) 4.33 (3.23 - 5.76) 6.65 (5.12 - 8.60) 1.36 (0.95 - 1.93) Illinois 2.27 (1.99 - 2.59) 3.85 (3.20 - 4.64) 7.66 (6.66 - 8.80) 1.12 (0.85 - 1.48) Indiana 2.21 (1.78 - 2.74) 3.35 (2.42 - 4.61) 6.50 (4.96 - 8.48) 1.29 (0.88 - 1.91) Iowa 1.96 (1.57 - 2.45) 4.04 (2.99 - 5.46) 5.72 (4.31 - 7.55) 1.03 (0.69 - 1.55) Kansas 2.10 (1.71 - 2.58) 4.10 (3.07 - 5.46) 6.02 (4.57 - 7.88) 1.10 (0.75 - 1.61) Kentucky 2.25 (1.84 - 2.74) 4.41 (3.27 - 5.93) 6.60 (5.05 - 8.59) 1.27 (0.89 - 1.82) Louisiana 2.25 (1.81 - 2.81) 3.66 (2.75 - 4.86) 5.46 (4.20 - 7.06) 1.47 (1.01 - 2.13) Maine 2.06 (1.65 - 2.58) 3.25 (2.33 - 4.53) 7.88 (6.14 - 10.06) 1.10 (0.72 - 1.67) Maryland 2.29 (1.88 - 2.79) 3.96 (2.95 - 5.30) 7.33 (5.62 - 9.51) 1.24 (0.88 - 1.75) Massachusetts 2.44 (1.99 - 2.99) 5.80 (4.45 - 7.53) 7.18 (5.52 - 9.29) 1.23 (0.84 - 1.80) Michigan 2.15 (1.87 - 2.48) 4.28 (3.59 - 5.09) 6.17 (5.32 - 7.14) 1.19 (0.90 - 1.57) Minnesota 2.19 (1.80 - 2.67) 4.36 (3.29 - 5.75) 6.77 (5.21 - 8.76) 1.15 (0.80 - 1.65) Mississippi 2.59 (2.10 - 3.19) 3.58 (2.64 - 4.84) 6.91 (5.33 - 8.90) 1.65 (1.16 - 2.34) Missouri 2.54 (2.10 - 3.07) 4.22 (3.16 - 5.62) 7.71 (6.06 - 9.76) 1.44 (1.03 - 2.03) Montana 2.46 (2.03 - 2.98) 5.38 (4.05 - 7.12) 7.56 (5.88 - 9.68) 1.25 (0.87 - 1.78)
(continued)

43
120911
Table 21 Needing But Not Receiving Treatment for Illicit Drug Use in the Past Year, by Age Group and State: Percentages, Annual Averages Based on 2010 and 2011 NSDUHs (continued)
State 12+
(Estimate)
12+ (95% Confidence
Interval) 12-17
(Estimate)
12-17 (95% Confidence
Interval) 18-25
(Estimate)
18-25 (95% Confidence
Interval) 26+
(Estimate)
26+ (95% Confidence
Interval) Nebraska 2.01 (1.60 - 2.53) 3.63 (2.64 - 4.98) 5.07 (3.81 - 6.71) 1.24 (0.84 - 1.82) Nevada 2.43 (1.88 - 3.13) 4.31 (3.05 - 6.06) 5.85 (4.36 - 7.82) 1.65 (1.09 - 2.48) New Hampshire 2.45 (2.00 - 2.99) 6.00 (4.50 - 7.96) 8.29 (6.57 - 10.41) 1.11 (0.74 - 1.67) New Jersey 2.18 (1.78 - 2.66) 4.36 (3.23 - 5.86) 7.26 (5.50 - 9.52) 1.14 (0.80 - 1.63) New Mexico 2.83 (2.34 - 3.42) 6.68 (5.04 - 8.80) 8.19 (6.41 - 10.42) 1.38 (0.92 - 2.05) New York 2.50 (2.18 - 2.87) 3.78 (3.09 - 4.61) 7.60 (6.58 - 8.76) 1.47 (1.13 - 1.90) North Carolina 2.46 (2.02 - 3.00) 4.42 (3.34 - 5.82) 7.19 (5.56 - 9.26) 1.43 (1.01 - 2.04) North Dakota 1.80 (1.40 - 2.32) 3.52 (2.51 - 4.92) 4.58 (3.36 - 6.22) 0.98 (0.63 - 1.54) Ohio 2.39 (2.08 - 2.74) 4.11 (3.43 - 4.93) 6.80 (5.89 - 7.84) 1.45 (1.12 - 1.87) Oklahoma 2.26 (1.79 - 2.83) 3.75 (2.72 - 5.13) 5.86 (4.40 - 7.76) 1.40 (0.96 - 2.05) Oregon 2.79 (2.29 - 3.40) 5.37 (4.10 - 7.00) 8.81 (6.93 - 11.13) 1.53 (1.06 - 2.19) Pennsylvania 2.30 (1.99 - 2.65) 3.96 (3.23 - 4.83) 6.79 (5.73 - 8.03) 1.35 (1.04 - 1.77) Rhode Island 2.52 (2.03 - 3.12) 4.29 (3.15 - 5.82) 7.75 (6.05 - 9.86) 1.32 (0.87 - 2.00) South Carolina 2.33 (1.90 - 2.85) 4.54 (3.42 - 6.00) 6.58 (5.10 - 8.46) 1.35 (0.95 - 1.92) South Dakota 1.91 (1.50 - 2.44) 4.12 (3.00 - 5.64) 4.79 (3.45 - 6.62) 1.13 (0.75 - 1.69) Tennessee 2.62 (2.13 - 3.23) 4.15 (3.10 - 5.52) 7.67 (5.90 - 9.91) 1.62 (1.14 - 2.30) Texas 2.26 (1.97 - 2.60) 4.09 (3.39 - 4.92) 5.81 (4.94 - 6.82) 1.32 (1.01 - 1.72) Utah 2.50 (2.03 - 3.07) 4.26 (3.12 - 5.78) 5.56 (4.14 - 7.42) 1.47 (1.06 - 2.04) Vermont 2.77 (2.29 - 3.35) 4.75 (3.55 - 6.31) 10.34 (8.31 - 12.80) 1.23 (0.83 - 1.81) Virginia 2.18 (1.79 - 2.66) 4.25 (3.20 - 5.63) 6.74 (5.17 - 8.75) 1.14 (0.81 - 1.61) Washington 2.49 (2.07 - 3.00) 4.18 (3.14 - 5.53) 8.05 (6.36 - 10.15) 1.36 (0.97 - 1.91) West Virginia 2.32 (1.88 - 2.87) 3.32 (2.37 - 4.64) 8.53 (6.77 - 10.70) 1.27 (0.85 - 1.88) Wisconsin 2.17 (1.76 - 2.68) 4.15 (3.06 - 5.61) 5.72 (4.34 - 7.49) 1.32 (0.91 - 1.91) Wyoming 1.95 (1.55 - 2.47) 3.85 (2.80 - 5.26) 5.09 (3.76 - 6.86) 1.16 (0.78 - 1.72) NOTE: Needing But Not Receiving Treatment refers to respondents classified as needing treatment for illicit drugs, but not receiving treatment for an illicit drug problem at a specialty
facility (i.e., drug and alcohol rehabilitation facilities [inpatient or outpatient], hospitals [inpatient only], and mental health centers). Illicit Drugs include marijuana/hashish, cocaine (including crack), inhalants, hallucinogens, heroin, or prescription-type psychotherapeutics used nonmedically, including data from original methamphetamine questions but not including new methamphetamine items added in 2005 and 2006. See Section B.4.8 in Appendix B of the Results from the 2008 National Survey on Drug Use and Health: National Findings.
NOTE: State and census region estimates, along with the 95 percent Bayesian confidence (credible) intervals, are based on a survey-weighted hierarchical Bayes estimation approach and generated by Markov Chain Monte Carlo techniques. For the "Total U.S." row, design-based (direct) estimates and corresponding 95 percent confidence intervals are given.
Source: SAMHSA, Center for Behavioral Health Statistics and Quality, National Survey on Drug Use and Health, 2010 and 2011 (2010 Data – Revised March 2012).

44
120911
Table 22 Needing But Not Receiving Treatment for Alcohol Use in the Past Year, by Age Group and State: Percentages, Annual Averages Based on 2010 and 2011 NSDUHs
State 12+
(Estimate)
12+ (95% Confidence
Interval) 12-17
(Estimate)
12-17 (95% Confidence
Interval) 18-25
(Estimate)
18-25 (95% Confidence
Interval) 26+
(Estimate)
26+ (95% Confidence
Interval) Total U.S. 6.45 (6.24 - 6.66) 4.03 (3.78 - 4.30) 14.46 (13.98 - 14.96) 5.36 (5.10 - 5.62) Northeast 6.71 (6.28 - 7.17) 4.08 (3.71 - 4.50) 15.13 (14.32 - 15.98) 5.61 (5.10 - 6.16) Midwest 6.64 (6.29 - 7.01) 3.87 (3.56 - 4.20) 15.20 (14.54 - 15.90) 5.50 (5.08 - 5.95) South 5.74 (5.43 - 6.07) 3.66 (3.36 - 3.99) 12.89 (12.29 - 13.51) 4.77 (4.40 - 5.17) West 7.18 (6.69 - 7.71) 4.72 (4.22 - 5.27) 15.71 (14.74 - 16.72) 5.96 (5.38 - 6.61) Alabama 5.05 (4.04 - 6.28) 3.35 (2.55 - 4.38) 11.31 (9.41 - 13.55) 4.16 (3.08 - 5.61) Alaska 7.44 (6.05 - 9.13) 4.21 (3.24 - 5.46) 15.13 (12.63 - 18.02) 6.40 (4.83 - 8.43) Arizona 7.68 (6.18 - 9.50) 4.48 (3.43 - 5.83) 16.02 (13.49 - 18.91) 6.67 (5.01 - 8.85) Arkansas 4.94 (3.93 - 6.19) 3.77 (2.86 - 4.94) 11.03 (9.17 - 13.20) 4.06 (2.97 - 5.53) California 7.11 (6.36 - 7.94) 5.08 (4.29 - 6.02) 15.62 (14.13 - 17.23) 5.80 (4.92 - 6.82) Colorado 8.09 (6.72 - 9.70) 4.47 (3.43 - 5.82) 18.75 (16.20 - 21.61) 6.67 (5.15 - 8.60) Connecticut 6.97 (5.63 - 8.59) 4.06 (3.10 - 5.29) 16.54 (13.99 - 19.45) 5.78 (4.33 - 7.68) Delaware 5.89 (4.73 - 7.32) 3.55 (2.70 - 4.65) 13.82 (11.57 - 16.44) 4.84 (3.59 - 6.51) District of Columbia 10.59 (8.79 - 12.70) 2.91 (2.00 - 4.21) 17.67 (15.20 - 20.45) 9.61 (7.55 - 12.16) Florida 5.58 (4.94 - 6.29) 3.86 (3.27 - 4.55) 12.58 (11.32 - 13.95) 4.70 (3.98 - 5.54) Georgia 5.22 (4.21 - 6.46) 3.65 (2.81 - 4.73) 12.07 (10.06 - 14.41) 4.21 (3.12 - 5.66) Hawaii 7.62 (6.21 - 9.33) 4.45 (3.29 - 6.00) 17.60 (14.88 - 20.69) 6.43 (4.86 - 8.45) Idaho 6.96 (5.70 - 8.47) 4.24 (3.29 - 5.44) 15.13 (12.75 - 17.85) 5.83 (4.43 - 7.65) Illinois 6.57 (5.89 - 7.33) 3.73 (3.15 - 4.43) 15.94 (14.49 - 17.50) 5.30 (4.51 - 6.23) Indiana 6.44 (5.24 - 7.89) 3.51 (2.68 - 4.59) 15.03 (12.70 - 17.71) 5.29 (3.99 - 7.00) Iowa 7.50 (6.23 - 9.00) 4.19 (3.23 - 5.42) 17.95 (15.38 - 20.84) 6.01 (4.63 - 7.77) Kansas 6.60 (5.43 - 8.01) 4.34 (3.35 - 5.61) 15.17 (12.77 - 17.92) 5.29 (4.01 - 6.95) Kentucky 4.48 (3.53 - 5.68) 3.61 (2.70 - 4.82) 10.48 (8.53 - 12.83) 3.59 (2.58 - 4.97) Louisiana 5.97 (4.91 - 7.24) 3.06 (2.37 - 3.94) 12.98 (11.08 - 15.15) 5.03 (3.84 - 6.56) Maine 5.16 (4.14 - 6.41) 3.68 (2.83 - 4.77) 13.70 (11.45 - 16.31) 4.09 (3.01 - 5.52) Maryland 4.81 (3.78 - 6.11) 2.89 (2.16 - 3.86) 11.90 (9.68 - 14.53) 3.86 (2.79 - 5.33) Massachusetts 7.98 (6.64 - 9.56) 4.71 (3.70 - 5.99) 18.18 (15.63 - 21.03) 6.56 (5.09 - 8.42) Michigan 6.78 (6.07 - 7.58) 3.92 (3.32 - 4.63) 14.19 (12.94 - 15.55) 5.87 (5.02 - 6.86) Minnesota 7.22 (5.92 - 8.77) 4.19 (3.24 - 5.40) 17.09 (14.55 - 19.98) 5.92 (4.51 - 7.73) Mississippi 5.29 (4.28 - 6.51) 3.30 (2.50 - 4.35) 11.12 (9.23 - 13.34) 4.47 (3.36 - 5.93) Missouri 5.27 (4.24 - 6.52) 4.00 (3.11 - 5.13) 12.96 (10.90 - 15.34) 4.11 (3.01 - 5.58) Montana 8.02 (6.72 - 9.53) 5.47 (4.25 - 7.01) 17.98 (15.48 - 20.78) 6.59 (5.17 - 8.36)
(continued)

45
120911
Table 22 Needing But Not Receiving Treatment for Alcohol Use in the Past Year, by Age Group and State: Percentages, Annual Averages Based on 2010 and 2011 NSDUHs (continued)
State 12+
(Estimate)
12+ (95% Confidence
Interval) 12-17
(Estimate)
12-17 (95% Confidence
Interval) 18-25
(Estimate)
18-25 (95% Confidence
Interval) 26+
(Estimate)
26+ (95% Confidence
Interval) Nebraska 6.09 (4.94 - 7.48) 3.65 (2.79 - 4.77) 15.32 (12.97 - 18.00) 4.68 (3.46 - 6.31) Nevada 8.69 (7.02 - 10.72) 4.51 (3.35 - 6.04) 17.03 (14.32 - 20.13) 7.89 (6.01 - 10.30) New Hampshire 6.53 (5.33 - 7.98) 4.63 (3.60 - 5.93) 15.91 (13.53 - 18.63) 5.25 (3.96 - 6.94) New Jersey 6.19 (5.02 - 7.60) 4.11 (3.15 - 5.36) 14.29 (11.99 - 16.96) 5.22 (3.94 - 6.87) New Mexico 6.67 (5.47 - 8.12) 4.37 (3.41 - 5.58) 15.03 (12.71 - 17.69) 5.49 (4.16 - 7.21) New York 6.43 (5.68 - 7.27) 3.87 (3.25 - 4.61) 13.96 (12.62 - 15.42) 5.41 (4.54 - 6.44) North Carolina 5.18 (4.12 - 6.48) 3.93 (2.96 - 5.20) 12.16 (10.06 - 14.62) 4.16 (3.05 - 5.66) North Dakota 8.50 (7.15 - 10.07) 4.01 (3.05 - 5.24) 20.47 (17.97 - 23.21) 6.33 (4.84 - 8.23) Ohio 6.78 (6.08 - 7.56) 3.81 (3.22 - 4.51) 14.63 (13.39 - 15.97) 5.86 (5.03 - 6.83) Oklahoma 6.83 (5.48 - 8.49) 3.69 (2.77 - 4.90) 13.70 (11.40 - 16.38) 5.98 (4.47 - 7.95) Oregon 7.35 (6.00 - 8.98) 4.01 (3.10 - 5.18) 15.22 (12.90 - 17.87) 6.46 (4.94 - 8.40) Pennsylvania 6.75 (6.02 - 7.56) 4.01 (3.38 - 4.75) 15.08 (13.56 - 16.73) 5.68 (4.85 - 6.64) Rhode Island 8.95 (7.38 - 10.82) 4.30 (3.28 - 5.62) 18.66 (16.09 - 21.53) 7.64 (5.87 - 9.87) South Carolina 6.33 (5.15 - 7.75) 3.90 (3.03 - 5.00) 12.49 (10.49 - 14.80) 5.58 (4.26 - 7.27) South Dakota 8.40 (6.99 - 10.07) 5.50 (4.24 - 7.09) 17.31 (14.64 - 20.34) 7.16 (5.59 - 9.12) Tennessee 5.94 (4.76 - 7.41) 3.59 (2.72 - 4.74) 13.01 (10.85 - 15.53) 5.08 (3.78 - 6.79) Texas 6.36 (5.69 - 7.11) 3.65 (3.06 - 4.36) 13.89 (12.59 - 15.31) 5.32 (4.52 - 6.26) Utah 4.20 (3.32 - 5.31) 3.53 (2.51 - 4.93) 9.89 (7.98 - 12.20) 2.96 (2.03 - 4.30) Vermont 6.77 (5.53 - 8.26) 4.61 (3.57 - 5.94) 17.16 (14.72 - 19.92) 5.17 (3.84 - 6.92) Virginia 6.42 (5.27 - 7.80) 4.15 (3.23 - 5.30) 15.32 (13.06 - 17.89) 5.14 (3.88 - 6.78) Washington 6.86 (5.62 - 8.36) 4.28 (3.32 - 5.49) 16.10 (13.67 - 18.87) 5.64 (4.29 - 7.38) West Virginia 5.08 (4.10 - 6.28) 3.80 (2.91 - 4.95) 13.54 (11.53 - 15.83) 3.92 (2.87 - 5.33) Wisconsin 6.63 (5.41 - 8.11) 3.63 (2.76 - 4.76) 14.57 (12.30 - 17.18) 5.62 (4.28 - 7.36) Wyoming 6.71 (5.52 - 8.12) 4.24 (3.26 - 5.49) 15.46 (13.11 - 18.13) 5.42 (4.14 - 7.06) NOTE: Needing But Not Receiving Treatment refers to respondents classified as needing treatment for alcohol, but not receiving treatment for an alcohol problem at a specialty facility (i.e.,
drug and alcohol rehabilitation facilities [inpatient or outpatient], hospitals [inpatient only], and mental health centers). NOTE: State and census region estimates, along with the 95 percent Bayesian confidence (credible) intervals, are based on a survey-weighted hierarchical Bayes estimation approach and
generated by Markov Chain Monte Carlo techniques. For the "Total U.S." row, design-based (direct) estimates and corresponding 95 percent confidence intervals are given. Source: SAMHSA, Center for Behavioral Health Statistics and Quality, National Survey on Drug Use and Health, 2010 and 2011 (2010 Data – Revised March 2012).

46
130812
Table 23 Serious Mental Illness in the Past Year, by Age Group and State: Percentages, Annual Averages Based on 2010 and 2011 NSDUHs
State 18+
(Estimate)
18+ (95% Confidence
Interval) 18-25
(Estimate)
18-25 (95% Confidence
Interval) 26+
(Estimate)
26+ (95% Confidence
Interval) Total U.S. 3.95 (3.74 - 4.16) 3.86 (3.62 - 4.10) 3.96 (3.73 - 4.21) Northeast 3.68 (3.35 - 4.05) 3.87 (3.50 - 4.26) 3.65 (3.27 - 4.07) Midwest 4.27 (3.97 - 4.59) 3.99 (3.69 - 4.32) 4.32 (3.98 - 4.69) South 3.86 (3.58 - 4.17) 3.71 (3.40 - 4.04) 3.89 (3.56 - 4.24) West 3.99 (3.61 - 4.41) 3.95 (3.53 - 4.41) 4.00 (3.56 - 4.49) Alabama 5.73 (4.48 - 7.30) 3.95 (3.03 - 5.14) 6.04 (4.61 - 7.87) Alaska 4.12 (3.25 - 5.23) 3.87 (3.01 - 4.97) 4.17 (3.18 - 5.46) Arizona 4.94 (3.78 - 6.42) 4.36 (3.34 - 5.66) 5.04 (3.74 - 6.75) Arkansas 5.41 (4.21 - 6.93) 4.28 (3.34 - 5.47) 5.60 (4.24 - 7.38) California 3.32 (2.80 - 3.93) 3.72 (3.11 - 4.44) 3.24 (2.65 - 3.96) Colorado 4.22 (3.27 - 5.42) 4.40 (3.42 - 5.64) 4.19 (3.12 - 5.59) Connecticut 3.46 (2.67 - 4.48) 3.55 (2.73 - 4.60) 3.44 (2.56 - 4.61) Delaware 3.79 (2.97 - 4.81) 4.14 (3.23 - 5.28) 3.73 (2.81 - 4.92) District of Columbia 3.52 (2.72 - 4.54) 3.34 (2.57 - 4.34) 3.56 (2.62 - 4.82) Florida 3.41 (2.86 - 4.05) 3.54 (2.94 - 4.27) 3.39 (2.78 - 4.12) Georgia 3.54 (2.72 - 4.58) 3.66 (2.84 - 4.71) 3.51 (2.60 - 4.74) Hawaii 3.38 (2.53 - 4.51) 3.54 (2.65 - 4.72) 3.36 (2.42 - 4.65) Idaho 5.29 (4.14 - 6.74) 4.70 (3.65 - 6.04) 5.40 (4.10 - 7.08) Illinois 3.44 (2.91 - 4.08) 3.55 (2.99 - 4.21) 3.43 (2.82 - 4.16) Indiana 4.89 (3.82 - 6.25) 3.98 (3.11 - 5.09) 5.06 (3.84 - 6.63) Iowa 4.59 (3.62 - 5.81) 4.22 (3.27 - 5.44) 4.66 (3.57 - 6.06) Kansas 4.14 (3.22 - 5.31) 3.63 (2.77 - 4.75) 4.23 (3.19 - 5.59) Kentucky 4.62 (3.61 - 5.89) 4.12 (3.26 - 5.20) 4.70 (3.56 - 6.17) Louisiana 3.78 (2.93 - 4.86) 3.35 (2.59 - 4.33) 3.86 (2.89 - 5.13) Maine 4.40 (3.41 - 5.66) 4.17 (3.26 - 5.33) 4.43 (3.33 - 5.87) Maryland 3.17 (2.44 - 4.11) 3.55 (2.72 - 4.61) 3.10 (2.30 - 4.18) Massachusetts 3.93 (3.05 - 5.04) 3.92 (3.09 - 4.96) 3.93 (2.94 - 5.22) Michigan 4.28 (3.67 - 4.99) 4.24 (3.63 - 4.94) 4.29 (3.59 - 5.12) Minnesota 3.87 (3.02 - 4.95) 4.14 (3.25 - 5.27) 3.83 (2.88 - 5.08) Mississippi 4.86 (3.84 - 6.13) 3.64 (2.83 - 4.65) 5.08 (3.91 - 6.58) Missouri 4.73 (3.71 - 6.01) 3.66 (2.86 - 4.68) 4.91 (3.76 - 6.40) Montana 5.08 (4.07 - 6.32) 4.56 (3.61 - 5.75) 5.16 (4.04 - 6.58)
(continued)

47
130812
Table 23 Serious Mental Illness in the Past Year, by Age Group and State: Percentages, Annual Averages Based on 2010 and 2011 NSDUHs (continued)
State 18+
(Estimate)
18+ (95% Confidence
Interval)18-25
(Estimate)
18-25 (95% Confidence
Interval)26+
(Estimate)
26+ (95% Confidence
Interval)Nebraska 4.49 (3.53 - 5.69) 4.01 (3.16 - 5.08) 4.58 (3.49 - 5.98) Nevada 3.98 (3.07 - 5.16) 3.74 (2.88 - 4.84) 4.02 (3.01 - 5.36) New Hampshire 4.40 (3.39 - 5.69) 4.16 (3.25 - 5.31) 4.43 (3.31 - 5.92) New Jersey 3.07 (2.34 - 4.03) 3.80 (2.95 - 4.88) 2.96 (2.16 - 4.06) New Mexico 4.51 (3.53 - 5.74) 3.79 (2.93 - 4.88) 4.63 (3.52 - 6.06) New York 3.52 (2.96 - 4.18) 3.67 (3.08 - 4.37) 3.49 (2.86 - 4.25) North Carolina 3.51 (2.66 - 4.63) 3.37 (2.56 - 4.42) 3.54 (2.58 - 4.82) North Dakota 3.93 (3.06 - 5.04) 3.90 (3.05 - 4.97) 3.94 (2.93 - 5.27) Ohio 4.86 (4.19 - 5.63) 4.47 (3.84 - 5.19) 4.92 (4.16 - 5.81) Oklahoma 5.06 (3.97 - 6.42) 3.91 (3.01 - 5.08) 5.26 (4.03 - 6.84) Oregon 4.89 (3.86 - 6.18) 4.29 (3.37 - 5.45) 4.99 (3.84 - 6.46) Pennsylvania 4.06 (3.45 - 4.78) 4.20 (3.53 - 4.98) 4.04 (3.35 - 4.86) Rhode Island 3.90 (3.02 - 5.04) 4.00 (3.12 - 5.10) 3.89 (2.89 - 5.22) South Carolina 4.25 (3.29 - 5.49) 3.55 (2.74 - 4.59) 4.37 (3.29 - 5.80) South Dakota 4.17 (3.21 - 5.38) 3.94 (3.05 - 5.09) 4.20 (3.13 - 5.63) Tennessee 4.34 (3.34 - 5.62) 3.65 (2.80 - 4.75) 4.46 (3.34 - 5.93) Texas 3.33 (2.79 - 3.97) 3.75 (3.17 - 4.43) 3.25 (2.64 - 4.01) Utah 5.00 (3.99 - 6.24) 4.88 (3.79 - 6.26) 5.02 (3.86 - 6.51) Vermont 4.81 (3.79 - 6.10) 3.91 (3.03 - 5.03) 4.97 (3.80 - 6.47) Virginia 4.03 (3.15 - 5.14) 4.25 (3.31 - 5.45) 3.99 (3.02 - 5.27) Washington 5.17 (3.98 - 6.69) 3.85 (2.96 - 5.00) 5.39 (4.04 - 7.15) West Virginia 5.27 (4.15 - 6.67) 3.68 (2.85 - 4.74) 5.51 (4.25 - 7.12) Wisconsin 4.01 (3.13 - 5.11) 3.91 (3.06 - 4.99) 4.02 (3.04 - 5.30) Wyoming 4.27 (3.37 - 5.41) 3.75 (2.90 - 4.83) 4.37 (3.35 - 5.67)
NOTE: Serious mental illness (SMI) is defined as having a diagnosable mental, behavioral, or emotional disorder, other than a developmental or substance use disorder, that met the criteria found in the 4th edition of the Diagnostic and Statistical Manual of Mental Disorders (DSM-IV) and resulted in serious functional impairment. Estimates for SMI presented in this table may differ from previously published SMI estimates because of revised estimation procedures. For details, see the NSDUH short report titled Revised Estimates of Mental Illness from the National Survey on Drug Use and Health at http://samhsa.gov/data/default.aspx.
NOTE: State and census region estimates, along with the 95 percent Bayesian confidence (credible) intervals, are based on a survey-weighted hierarchical Bayes estimation approach and generated by Markov Chain Monte Carlo techniques. For the "Total U.S." row, design-based (direct) estimates and corresponding 95 percent confidence intervals are given.
Source: SAMHSA, Center for Behavioral Health Statistics and Quality, National Survey on Drug Use and Health, 2010 (Revised March 2012 and October 2013) and 2011 (Revised October 2013).

48
130812
Table 24 Any Mental Illness in the Past Year, by Age Group and State: Percentages, Annual Averages Based on 2010 and 2011 NSDUHs
State 18+
(Estimate)
18+ (95% Confidence
Interval) 18-25
(Estimate)
18-25 (95% Confidence
Interval) 26+
(Estimate)
26+ (95% Confidence
Interval) Total U.S. 17.90 (17.49 - 18.32) 18.33 (17.83 - 18.84) 17.83 (17.36 - 18.31) Northeast 17.75 (16.99 - 18.54) 18.37 (17.54 - 19.23) 17.65 (16.77 - 18.55) Midwest 18.44 (17.81 - 19.08) 18.99 (18.31 - 19.69) 18.34 (17.62 - 19.09) South 17.62 (17.01 - 18.26) 17.27 (16.60 - 17.96) 17.69 (16.98 - 18.41) West 17.97 (17.12 - 18.85) 19.34 (18.37 - 20.34) 17.72 (16.76 - 18.73) Alabama 21.72 (19.35 - 24.30) 19.26 (16.80 - 21.98) 22.15 (19.45 - 25.11) Alaska 19.23 (16.87 - 21.83) 21.75 (19.19 - 24.54) 18.77 (16.11 - 21.76) Arizona 19.76 (17.20 - 22.61) 21.50 (18.84 - 24.43) 19.46 (16.57 - 22.72) Arkansas 20.63 (18.06 - 23.44) 18.76 (16.53 - 21.21) 20.94 (18.03 - 24.19) California 16.34 (15.06 - 17.72) 18.20 (16.71 - 19.79) 15.99 (14.53 - 17.58) Colorado 17.58 (15.39 - 20.01) 20.87 (18.36 - 23.63) 17.02 (14.55 - 19.81) Connecticut 16.58 (14.38 - 19.06) 18.05 (15.69 - 20.67) 16.36 (13.90 - 19.16) Delaware 18.19 (15.95 - 20.66) 19.83 (17.30 - 22.63) 17.91 (15.40 - 20.73) District of Columbia 19.28 (17.00 - 21.79) 18.91 (16.62 - 21.45) 19.38 (16.69 - 22.39) Florida 16.15 (14.88 - 17.52) 17.48 (16.06 - 18.99) 15.95 (14.52 - 17.49) Georgia 17.10 (14.88 - 19.58) 17.20 (14.93 - 19.73) 17.09 (14.56 - 19.94) Hawaii 17.18 (14.99 - 19.62) 19.23 (16.79 - 21.93) 16.86 (14.42 - 19.63) Idaho 22.78 (20.13 - 25.67) 20.65 (18.13 - 23.42) 23.17 (20.15 - 26.49) Illinois 16.05 (14.78 - 17.41) 17.79 (16.43 - 19.24) 15.76 (14.31 - 17.31) Indiana 19.49 (17.05 - 22.18) 20.55 (18.02 - 23.33) 19.30 (16.54 - 22.39) Iowa 18.84 (16.65 - 21.24) 18.99 (16.62 - 21.60) 18.81 (16.34 - 21.56) Kansas 17.36 (15.22 - 19.72) 18.15 (15.93 - 20.61) 17.21 (14.78 - 19.95) Kentucky 19.52 (17.05 - 22.25) 17.55 (15.23 - 20.14) 19.84 (17.04 - 22.97) Louisiana 18.57 (16.34 - 21.02) 17.23 (15.16 - 19.53) 18.82 (16.25 - 21.68) Maine 17.01 (14.72 - 19.58) 20.37 (17.86 - 23.13) 16.54 (13.99 - 19.44) Maryland 17.51 (15.23 - 20.05) 18.09 (15.79 - 20.65) 17.41 (14.86 - 20.30) Massachusetts 17.86 (15.70 - 20.25) 18.90 (16.60 - 21.45) 17.68 (15.22 - 20.44) Michigan 19.73 (18.35 - 21.19) 19.46 (18.04 - 20.96) 19.78 (18.22 - 21.45) Minnesota 17.32 (15.22 - 19.64) 19.60 (17.23 - 22.20) 16.94 (14.58 - 19.60) Mississippi 19.52 (17.24 - 22.01) 17.14 (15.05 - 19.45) 19.95 (17.33 - 22.86) Missouri 19.38 (17.07 - 21.92) 18.55 (16.24 - 21.10) 19.52 (16.91 - 22.43) Montana 19.48 (17.30 - 21.87) 20.29 (17.86 - 22.96) 19.35 (16.90 - 22.06)
(continued)

49
130812
Table 24 Any Mental Illness in the Past Year, by Age Group and State: Percentages, Annual Averages Based on 2010 and 2011 NSDUHs (continued)
State 18+
(Estimate)
18+ (95% Confidence
Interval)18-25
(Estimate)
18-25 (95% Confidence
Interval)26+
(Estimate)
26+ (95% Confidence
Interval)Nebraska 17.69 (15.51 - 20.12) 18.65 (16.41 - 21.12) 17.53 (15.05 - 20.31) Nevada 16.48 (14.15 - 19.09) 17.06 (14.68 - 19.75) 16.38 (13.80 - 19.33) New Hampshire 19.19 (16.76 - 21.88) 19.16 (16.87 - 21.68) 19.19 (16.49 - 22.23) New Jersey 16.03 (13.86 - 18.47) 17.35 (15.12 - 19.83) 15.83 (13.42 - 18.58) New Mexico 18.44 (16.13 - 21.01) 19.33 (16.96 - 21.95) 18.29 (15.66 - 21.24) New York 18.72 (17.30 - 20.22) 18.74 (17.32 - 20.24) 18.71 (17.09 - 20.46) North Carolina 16.42 (14.21 - 18.91) 15.93 (13.75 - 18.39) 16.50 (14.02 - 19.33) North Dakota 16.83 (14.71 - 19.19) 19.08 (16.83 - 21.56) 16.37 (13.92 - 19.14) Ohio 20.25 (18.86 - 21.72) 19.64 (18.22 - 21.15) 20.35 (18.74 - 22.05) Oklahoma 20.26 (17.81 - 22.95) 18.50 (16.15 - 21.10) 20.58 (17.80 - 23.66) Oregon 20.61 (18.18 - 23.28) 20.77 (18.33 - 23.43) 20.59 (17.85 - 23.63) Pennsylvania 17.54 (16.24 - 18.91) 17.85 (16.31 - 19.50) 17.48 (16.01 - 19.06) Rhode Island 18.22 (15.90 - 20.78) 18.38 (16.05 - 20.95) 18.19 (15.52 - 21.20) South Carolina 18.43 (16.11 - 20.99) 16.24 (14.10 - 18.63) 18.80 (16.17 - 21.75) South Dakota 17.87 (15.64 - 20.34) 18.72 (16.19 - 21.54) 17.72 (15.21 - 20.54) Tennessee 21.40 (18.76 - 24.31) 17.15 (14.88 - 19.67) 22.09 (19.09 - 25.42) Texas 15.68 (14.42 - 17.02) 16.48 (15.14 - 17.91) 15.53 (14.08 - 17.10) Utah 22.02 (19.58 - 24.66) 22.42 (19.78 - 25.30) 21.93 (19.10 - 25.05) Vermont 19.11 (16.82 - 21.63) 20.15 (17.65 - 22.91) 18.93 (16.35 - 21.81) Virginia 17.80 (15.51 - 20.35) 18.12 (15.90 - 20.56) 17.75 (15.16 - 20.67) Washington 21.54 (18.88 - 24.46) 20.70 (18.19 - 23.45) 21.68 (18.70 - 25.00) West Virginia 20.52 (18.04 - 23.24) 17.80 (15.66 - 20.15) 20.92 (18.14 - 24.01) Wisconsin 17.53 (15.25 - 20.08) 18.20 (15.81 - 20.87) 17.42 (14.86 - 20.32) Wyoming 17.99 (15.84 - 20.37) 20.24 (17.80 - 22.93) 17.60 (15.19 - 20.30)
NOTE: Any mental illness (AMI) is defined as having a diagnosable mental, behavioral, or emotional disorder, other than a developmental or substance use disorder, that met the criteria found in the 4th edition of the Diagnostic and Statistical Manual of Mental Disorders (DSM-IV). Estimates for AMI presented in this table may differ from previously published AMI estimates because of revised estimation procedures. For details, see the NSDUH short report titled Revised Estimates of Mental Illness from the National Survey on Drug Use and Health at http://samhsa.gov/data/default.aspx.
NOTE: State and census region estimates, along with the 95 percent Bayesian confidence (credible) intervals, are based on a survey-weighted hierarchical Bayes estimation approach and generated by Markov Chain Monte Carlo techniques. For the "Total U.S." row, design-based (direct) estimates and corresponding 95 percent confidence intervals are given.
Source: SAMHSA, Center for Behavioral Health Statistics and Quality, National Survey on Drug Use and Health, 2010 (Revised March 2012 and October 2013) and 2011 (Revised October 2013).

50
120911
Table 25 Had Serious Thoughts of Suicide in the Past Year, by Age Group and State: Percentages, Annual Averages Based on 2010 and 2011 NSDUHs
State 18+
(Estimate)
18+ (95% Confidence
Interval) 18-25
(Estimate)
18-25 (95% Confidence
Interval) 26+
(Estimate)
26+ (95% Confidence
Interval) Total U.S. 3.75 (3.57 - 3.94) 6.74 (6.42 - 7.07) 3.23 (3.03 - 3.45) Northeast 3.82 (3.49 - 4.18) 6.81 (6.27 - 7.40) 3.32 (2.96 - 3.71) Midwest 3.99 (3.71 - 4.29) 6.97 (6.55 - 7.41) 3.47 (3.17 - 3.81) South 3.57 (3.31 - 3.85) 6.52 (6.10 - 6.97) 3.06 (2.78 - 3.37) West 3.76 (3.41 - 4.15) 6.81 (6.24 - 7.42) 3.21 (2.83 - 3.65) Alabama 4.16 (3.26 - 5.29) 7.87 (6.37 - 9.70) 3.51 (2.57 - 4.78) Alaska 4.46 (3.53 - 5.61) 7.36 (5.91 - 9.15) 3.89 (2.90 - 5.21) Arizona 4.13 (3.23 - 5.28) 7.50 (5.98 - 9.36) 3.56 (2.61 - 4.84) Arkansas 4.22 (3.31 - 5.35) 7.09 (5.76 - 8.71) 3.73 (2.76 - 5.03) California 3.49 (2.98 - 4.08) 6.56 (5.69 - 7.55) 2.91 (2.36 - 3.59) Colorado 3.59 (2.79 - 4.61) 6.73 (5.45 - 8.29) 3.04 (2.19 - 4.22) Connecticut 3.62 (2.81 - 4.66) 5.98 (4.70 - 7.58) 3.24 (2.39 - 4.39) Delaware 4.32 (3.42 - 5.44) 7.33 (5.92 - 9.05) 3.81 (2.84 - 5.09) District of Columbia 4.03 (3.19 - 5.08) 6.34 (5.10 - 7.84) 3.50 (2.57 - 4.75) Florida 3.36 (2.85 - 3.95) 6.49 (5.65 - 7.44) 2.88 (2.34 - 3.55) Georgia 3.40 (2.66 - 4.33) 6.26 (4.97 - 7.85) 2.89 (2.11 - 3.94) Hawaii 3.55 (2.76 - 4.56) 7.06 (5.60 - 8.87) 3.01 (2.17 - 4.15) Idaho 4.43 (3.50 - 5.60) 7.14 (5.76 - 8.82) 3.93 (2.93 - 5.26) Illinois 3.33 (2.85 - 3.88) 6.46 (5.63 - 7.40) 2.78 (2.26 - 3.42) Indiana 4.28 (3.38 - 5.41) 7.11 (5.80 - 8.69) 3.78 (2.80 - 5.08) Iowa 3.76 (3.02 - 4.66) 6.65 (5.35 - 8.24) 3.23 (2.45 - 4.25) Kansas 3.93 (3.09 - 4.98) 6.16 (4.91 - 7.70) 3.51 (2.61 - 4.71) Kentucky 4.13 (3.27 - 5.21) 6.45 (5.20 - 7.97) 3.75 (2.82 - 4.98) Louisiana 3.70 (2.95 - 4.64) 6.78 (5.57 - 8.22) 3.13 (2.32 - 4.20) Maine 4.02 (3.09 - 5.20) 6.32 (5.00 - 7.95) 3.68 (2.70 - 5.01) Maryland 3.60 (2.82 - 4.58) 6.43 (5.11 - 8.05) 3.13 (2.30 - 4.24) Massachusetts 3.95 (3.11 - 5.01) 6.45 (5.16 - 8.04) 3.51 (2.61 - 4.70) Michigan 4.49 (3.88 - 5.19) 7.54 (6.67 - 8.52) 3.96 (3.29 - 4.76) Minnesota 3.98 (3.17 - 4.98) 7.10 (5.74 - 8.74) 3.45 (2.58 - 4.59) Mississippi 3.88 (3.08 - 4.87) 6.25 (5.03 - 7.74) 3.44 (2.57 - 4.58) Missouri 4.13 (3.27 - 5.19) 6.54 (5.22 - 8.16) 3.72 (2.79 - 4.93) Montana 4.23 (3.41 - 5.23) 8.09 (6.61 - 9.87) 3.56 (2.69 - 4.71)
(continued)

51
120911
Table 25 Had Serious Thoughts of Suicide in the Past Year, by Age Group and State: Percentages, Annual Averages Based on 2010 and 2011 NSDUHs (continued)
State 18+
(Estimate)
18+ (95% Confidence
Interval) 18-25
(Estimate)
18-25 (95% Confidence
Interval) 26+
(Estimate)
26+ (95% Confidence
Interval) Nebraska 3.85 (3.04 - 4.87) 6.29 (5.06 - 7.80) 3.40 (2.53 - 4.56) Nevada 3.57 (2.76 - 4.60) 6.20 (4.94 - 7.76) 3.15 (2.29 - 4.32) New Hampshire 4.74 (3.71 - 6.05) 7.12 (5.83 - 8.68) 4.36 (3.24 - 5.85) New Jersey 3.44 (2.69 - 4.38) 6.66 (5.35 - 8.26) 2.95 (2.17 - 4.00) New Mexico 3.79 (2.96 - 4.83) 7.06 (5.67 - 8.75) 3.20 (2.33 - 4.39) New York 3.72 (3.19 - 4.34) 7.02 (6.12 - 8.05) 3.15 (2.57 - 3.85) North Carolina 3.63 (2.87 - 4.59) 6.33 (5.06 - 7.90) 3.18 (2.38 - 4.24) North Dakota 3.62 (2.86 - 4.57) 6.56 (5.27 - 8.14) 2.96 (2.15 - 4.05) Ohio 4.11 (3.57 - 4.74) 7.75 (6.89 - 8.71) 3.52 (2.92 - 4.23) Oklahoma 4.61 (3.66 - 5.81) 6.56 (5.24 - 8.17) 4.26 (3.20 - 5.63) Oregon 4.06 (3.20 - 5.12) 7.09 (5.77 - 8.69) 3.57 (2.66 - 4.77) Pennsylvania 4.00 (3.46 - 4.64) 7.00 (6.05 - 8.09) 3.51 (2.92 - 4.21) Rhode Island 4.13 (3.23 - 5.27) 6.61 (5.34 - 8.16) 3.65 (2.68 - 4.95) South Carolina 3.80 (2.99 - 4.82) 6.32 (5.08 - 7.84) 3.37 (2.50 - 4.53) South Dakota 4.15 (3.29 - 5.22) 6.42 (5.11 - 8.03) 3.74 (2.81 - 4.97) Tennessee 3.74 (2.92 - 4.76) 6.12 (4.86 - 7.67) 3.35 (2.47 - 4.52) Texas 2.94 (2.50 - 3.46) 6.29 (5.46 - 7.23) 2.30 (1.83 - 2.89) Utah 4.55 (3.64 - 5.68) 7.68 (6.21 - 9.48) 3.80 (2.82 - 5.12) Vermont 4.83 (3.76 - 6.18) 7.16 (5.74 - 8.89) 4.42 (3.27 - 5.96) Virginia 4.00 (3.18 - 5.01) 7.25 (5.87 - 8.91) 3.43 (2.57 - 4.56) Washington 4.37 (3.45 - 5.51) 6.93 (5.54 - 8.64) 3.94 (2.94 - 5.26) West Virginia 4.14 (3.27 - 5.23) 6.43 (5.24 - 7.86) 3.79 (2.85 - 5.03) Wisconsin 4.13 (3.24 - 5.24) 6.72 (5.39 - 8.35) 3.68 (2.72 - 4.95) Wyoming 3.88 (3.04 - 4.93) 6.01 (4.83 - 7.46) 3.49 (2.58 - 4.70)
NOTE: State and census region estimates, along with the 95 percent Bayesian confidence (credible) intervals, are based on a survey-weighted hierarchical Bayes estimation approach and generated by Markov Chain Monte Carlo techniques. For the "Total U.S." row, design-based (direct) estimates and corresponding 95 percent confidence intervals are given.
Source: SAMHSA, Center for Behavioral Health Statistics and Quality, National Survey on Drug Use and Health, 2010 and 2011 (2010 Data – Revised March 2012).

52
120911
Table 26 Had at Least One Major Depressive Episode in the Past Year, by Age Group and State: Percentages, Annual Averages Based on 2010 and 2011 NSDUHs
State 18+
(Estimate)
18+ (95% Confidence
Interval) 12-17
(Estimate)
12-17 (95% Confidence
Interval) 18-25
(Estimate)
18-25 (95% Confidence
Interval) 26+
(Estimate)
26+ (95% Confidence
Interval) Total U.S. 6.70 (6.45 - 6.95) 8.15 (7.82 - 8.49) 8.29 (7.96 - 8.63) 6.42 (6.13 - 6.72) Northeast 6.60 (6.16 - 7.07) 7.85 (7.29 - 8.46) 8.28 (7.71 - 8.89) 6.32 (5.82 - 6.87) Midwest 7.02 (6.64 - 7.43) 8.31 (7.86 - 8.79) 8.65 (8.19 - 9.12) 6.74 (6.30 - 7.22) South 6.58 (6.22 - 6.96) 8.03 (7.59 - 8.50) 7.91 (7.47 - 8.38) 6.35 (5.93 - 6.79) West 6.65 (6.18 - 7.17) 8.40 (7.75 - 9.08) 8.56 (7.93 - 9.24) 6.31 (5.76 - 6.91) Alabama 7.63 (6.29 - 9.23) 7.62 (6.26 - 9.25) 8.42 (6.98 - 10.14) 7.50 (5.98 - 9.36) Alaska 6.87 (5.64 - 8.35) 7.42 (6.02 - 9.11) 9.07 (7.41 - 11.05) 6.44 (5.04 - 8.21) Arizona 7.02 (5.68 - 8.64) 8.84 (7.18 - 10.83) 8.92 (7.32 - 10.82) 6.70 (5.19 - 8.60) Arkansas 7.71 (6.32 - 9.36) 8.50 (7.00 - 10.29) 8.73 (7.26 - 10.47) 7.53 (5.97 - 9.46) California 6.00 (5.29 - 6.81) 8.24 (7.27 - 9.33) 8.20 (7.24 - 9.27) 5.60 (4.78 - 6.54) Colorado 6.74 (5.59 - 8.11) 8.20 (6.68 - 10.03) 8.98 (7.44 - 10.80) 6.35 (5.06 - 7.96) Connecticut 6.42 (5.24 - 7.84) 7.78 (6.33 - 9.53) 7.93 (6.53 - 9.60) 6.17 (4.84 - 7.84) Delaware 6.79 (5.58 - 8.25) 9.35 (7.63 - 11.40) 9.31 (7.62 - 11.34) 6.37 (5.01 - 8.07) District of Columbia 7.03 (5.86 - 8.41) 6.46 (5.18 - 8.02) 8.24 (6.78 - 9.98) 6.75 (5.39 - 8.43) Florida 5.94 (5.23 - 6.74) 8.11 (7.18 - 9.14) 7.98 (7.03 - 9.04) 5.63 (4.84 - 6.54) Georgia 6.77 (5.61 - 8.15) 8.58 (7.02 - 10.46) 8.35 (6.92 - 10.05) 6.49 (5.18 - 8.11) Hawaii 5.61 (4.53 - 6.93) 7.99 (6.35 - 10.01) 7.98 (6.50 - 9.75) 5.25 (4.06 - 6.77) Idaho 8.19 (6.73 - 9.93) 8.37 (6.86 - 10.18) 9.35 (7.75 - 11.24) 7.98 (6.32 - 10.02) Illinois 6.40 (5.68 - 7.21) 8.19 (7.25 - 9.25) 8.46 (7.49 - 9.54) 6.04 (5.22 - 6.99) Indiana 7.55 (6.19 - 9.17) 7.14 (5.79 - 8.77) 8.67 (7.17 - 10.45) 7.35 (5.81 - 9.25) Iowa 7.73 (6.40 - 9.31) 7.58 (6.16 - 9.29) 8.41 (6.96 - 10.14) 7.61 (6.09 - 9.47) Kansas 6.88 (5.75 - 8.21) 8.50 (6.99 - 10.30) 8.38 (6.93 - 10.10) 6.60 (5.30 - 8.18) Kentucky 7.59 (6.21 - 9.24) 8.88 (7.31 - 10.74) 7.79 (6.37 - 9.48) 7.56 (6.00 - 9.48) Louisiana 6.39 (5.27 - 7.73) 7.21 (5.92 - 8.75) 7.48 (6.25 - 8.92) 6.18 (4.90 - 7.77) Maine 6.84 (5.61 - 8.31) 8.44 (6.98 - 10.17) 8.55 (7.16 - 10.17) 6.59 (5.22 - 8.30) Maryland 6.66 (5.47 - 8.10) 7.55 (6.19 - 9.18) 7.88 (6.46 - 9.57) 6.46 (5.11 - 8.14) Massachusetts 6.91 (5.74 - 8.28) 8.83 (7.30 - 10.64) 8.55 (7.14 - 10.22) 6.62 (5.30 - 8.23) Michigan 6.90 (6.10 - 7.79) 9.61 (8.59 - 10.74) 9.20 (8.24 - 10.26) 6.50 (5.59 - 7.55) Minnesota 6.16 (5.05 - 7.50) 8.85 (7.28 - 10.73) 8.64 (7.16 - 10.39) 5.74 (4.50 - 7.30) Mississippi 6.99 (5.77 - 8.45) 7.30 (5.94 - 8.94) 7.01 (5.75 - 8.52) 6.99 (5.58 - 8.72) Missouri 7.27 (6.00 - 8.77) 8.61 (7.11 - 10.40) 7.63 (6.29 - 9.22) 7.21 (5.77 - 8.97) Montana 7.07 (5.96 - 8.37) 7.97 (6.51 - 9.74) 9.79 (8.15 - 11.73) 6.60 (5.35 - 8.12)
(continued)

53
120911
Table 26 Had at Least One Major Depressive Episode in the Past Year, by Age Group and State: Percentages, Annual Averages Based on 2010 and 2011 NSDUHs (continued)
State 18+
(Estimate)
18+ (95% Confidence
Interval) 12-17
(Estimate)
12-17 (95% Confidence
Interval) 18-25
(Estimate)
18-25 (95% Confidence
Interval) 26+
(Estimate)
26+ (95% Confidence
Interval) Nebraska 7.13 (5.94 - 8.55) 8.50 (6.98 - 10.32) 8.31 (6.94 - 9.92) 6.92 (5.54 - 8.60) Nevada 6.30 (5.12 - 7.73) 8.61 (6.89 - 10.70) 7.68 (6.25 - 9.39) 6.08 (4.76 - 7.75) New Hampshire 7.15 (5.87 - 8.69) 9.49 (7.75 - 11.57) 9.39 (7.82 - 11.22) 6.80 (5.37 - 8.57) New Jersey 5.68 (4.61 - 6.98) 7.73 (6.31 - 9.44) 7.76 (6.36 - 9.43) 5.36 (4.17 - 6.87) New Mexico 6.70 (5.46 - 8.18) 8.99 (7.37 - 10.93) 7.72 (6.29 - 9.44) 6.51 (5.11 - 8.27) New York 6.58 (5.83 - 7.43) 7.22 (6.26 - 8.32) 7.81 (6.90 - 8.84) 6.37 (5.51 - 7.36) North Carolina 6.30 (5.12 - 7.72) 7.37 (5.98 - 9.04) 7.60 (6.20 - 9.28) 6.08 (4.76 - 7.74) North Dakota 6.33 (5.22 - 7.66) 7.40 (5.97 - 9.14) 8.15 (6.72 - 9.85) 5.92 (4.63 - 7.53) Ohio 7.85 (7.01 - 8.78) 8.12 (7.18 - 9.16) 9.04 (8.09 - 10.08) 7.65 (6.71 - 8.72) Oklahoma 7.35 (6.08 - 8.85) 8.17 (6.60 - 10.06) 8.50 (7.00 - 10.27) 7.14 (5.69 - 8.91) Oregon 7.47 (6.16 - 9.02) 8.63 (7.11 - 10.42) 9.76 (8.13 - 11.67) 7.10 (5.64 - 8.90) Pennsylvania 6.99 (6.21 - 7.85) 8.22 (7.23 - 9.33) 9.13 (8.00 - 10.40) 6.63 (5.76 - 7.63) Rhode Island 6.88 (5.62 - 8.41) 8.07 (6.51 - 9.96) 8.31 (6.84 - 10.06) 6.61 (5.16 - 8.43) South Carolina 7.46 (6.05 - 9.16) 8.13 (6.58 - 10.01) 7.75 (6.37 - 9.41) 7.41 (5.81 - 9.41) South Dakota 6.15 (5.02 - 7.50) 8.87 (7.24 - 10.84) 8.49 (6.90 - 10.42) 5.73 (4.46 - 7.32) Tennessee 7.11 (5.89 - 8.55) 8.27 (6.81 - 10.01) 7.78 (6.39 - 9.44) 7.00 (5.63 - 8.67) Texas 5.89 (5.19 - 6.68) 7.94 (7.00 - 8.98) 7.53 (6.62 - 8.55) 5.58 (4.78 - 6.50) Utah 8.34 (6.99 - 9.92) 8.36 (6.83 - 10.19) 9.64 (8.04 - 11.52) 8.03 (6.46 - 9.93) Vermont 7.58 (6.24 - 9.17) 7.47 (6.04 - 9.20) 8.69 (7.17 - 10.50) 7.38 (5.85 - 9.27) Virginia 6.94 (5.72 - 8.39) 8.55 (7.06 - 10.32) 8.70 (7.22 - 10.46) 6.63 (5.25 - 8.35) Washington 8.48 (7.00 - 10.23) 8.82 (7.27 - 10.66) 9.01 (7.48 - 10.82) 8.39 (6.72 - 10.43) West Virginia 7.84 (6.46 - 9.49) 8.39 (6.84 - 10.25) 7.66 (6.30 - 9.30) 7.87 (6.31 - 9.77) Wisconsin 6.80 (5.57 - 8.27) 7.49 (6.10 - 9.16) 8.86 (7.32 - 10.69) 6.44 (5.06 - 8.17) Wyoming 7.46 (6.20 - 8.96) 9.18 (7.55 - 11.11) 9.43 (7.83 - 11.32) 7.11 (5.67 - 8.87) NOTE: Major depressive episode (MDE) is defined as in the 4th edition of the Diagnostic and Statistical Manual of Mental Disorders (DSM-IV), which specifies a period of at least 2 weeks
when a person experienced a depressed mood or loss of interest or pleasure in daily activities and had a majority of specified depression symptoms. For details, see Section A.11 in Appendix A of the report on State Estimates of Substance Use and Mental Disorders from the 2009-2010 NSDUHs.
NOTE: There are minor wording differences in the questions in the adult and adolescent major depressive episode modules. Therefore, data from youths aged 12 to 17 were not combined with data from persons aged 18 or older to produce an estimate for those aged 12 or older.
NOTE: State and census region estimates, along with the 95 percent Bayesian confidence (credible) intervals, are based on a survey-weighted hierarchical Bayes estimation approach and generated by Markov Chain Monte Carlo techniques. For the "Total U.S." row, design-based (direct) estimates and corresponding 95 percent confidence intervals are given.
Source: SAMHSA, Center for Behavioral Health Statistics and Quality, National Survey on Drug Use and Health, 2010 and 2011 (2010 Data – Revised March 2012).

54