Embed Size (px)
Citation preview
SIKA Report
2009:1
Starting points for European transport policy after 2010
Revised version, October 2009


SIKA Rapport 2009:1
3
Preface
The European transport system and its functions is an important prerequisite for the performance of the European market and growth. This report is the final report of the commission to carry out an analysis of EU transport policy for the Swedish EU Presidency in 2009. The analysis contains proposals carried out and put forward to date for measures as a basis for the Swedish Presidency and forward-looking documentation for work with future EU transport policy for the period after 2010. An initial analysis of EU transport policy was reported in SIKA Memorandum PM 2008:5 Åtgärdsanalys av EU:s transportpolitik [Analysis of measures in EU transport policy, in Swedish]. A reference group consisting of representatives of Logistikforum has made valuable comments on the report. The reference group consisted of Maria Jobenius from Scania, Bo Hallams from Schenker and Jeanette Skjelmose from IKEA. However, the analyses and conclusions in the report are SIKA’s alone. The work of producing maps has taken place under the leadership of Désirée Nilsson. Magnus Johansson and Tore Lundström also participated in this group. Documentation for the analysis has consisted of existing reports on EU transport policy. SIKA has accordingly not had the opportunity of making any quantitative analyses of its own of the consequences of the policy applied. SIKA’s project manager was Backa Fredrik Brandt. Krister Sandberg also participated in the project group. This report was originally published in March 2009, but revised in October 2009 by including data on Lithuania, Slovenia and The Netherlands under section 3.2. Östersund, October 2009 Brita Saxton Director-General

SIKA Report 2009:1
4
Contents
SUMMARY ..................................................................................................................................... 5
1 INTRODUCTION ................................................................................................................. 9
2 IMPORTANCE OF TRANSPORTATION AND TRANSPORT DEVELOPMENT IN
THE EU ......................................................................................................................................... 13
2.1 The importance of transportation for Community development ................ 13
2.2 The development of transport within the EU ............................................. 16
3 CURRENT TRANSPORT POLICY IN THE EU IN A FUTURE PERSPECTIVE ..... 19
3.1 The direction of transport policy ................................................................ 20
3.2 The implementation of EU policy in the Member States ........................... 23
3.3 Strengths and weaknesses of EU transport policy ...................................... 33
4 A CHANGED EU IN A CHANGED WORLD .................................................................. 35
4.1 EU and the surrounding world ................................................................... 35
4.2 Transport flows and economic development in the Union ......................... 38
5 CURRENT DEVELOPMENTS IN EU TRANSPORT POLICY ................................... 49
5.1 Environment, energy supply and climate ................................................... 49
5.2 Transportation - a system perspective ........................................................ 57
5.3 Transportation – a perspective based on specific modes of transport ........ 69
5.4 The Trans-European Transport Network (TEN-T) .................................... 77
5.5 Pricing policy ............................................................................................. 83
6 EU TRANSPORT POLICY AFTER 2010 ........................................................................ 91
6.1 Opportunities and threats ............................................................................ 91
6.2 Transport policy for increased competitiveness and sustainable development .......................................................................................................... 93
7 SOURCES ............................................................................................................................ 99

SIKA Report 2009:1
5
Summary
SIKA has been commissioned to produce a broad analysis of EU policies in the transport sector for the Swedish EU Presidency in 2009. This analysis consists of two steps, firstly the measures implemented to date and those proposed as a basis for the work of the Swedish Presidency in the transport sector, and, secondly, to be forward-looking in order to serve as a foundation for Sweden’s conduct in respect of work with future EU transport policy for the period after 2010. The performance of the European transport system is an important prerequisite for a well-functioning European market and for growth. At the same time, increasing global trade makes ever greater and new demands for sustainable transport solutions. To make a correct assessment of the necessary political initiatives, in particular at the European level, an analysis is made of the threats and oppor-tunities in the current European transport system at the same time as an assessment is made of its strengths and weaknesses. This analysis has a clear business perspective.
A description of the transport flows and economic development in the EU and the importance of an efficient transport apparatus form the basis for SIKA’s analysis. To place EU transport policy in context, a retrospect is made of current long-term transport policy as formulated in the White Paper of 2001 and developed to date. In conjunction with this review, a number of perspectives are given from different Member States of the issues that are important for them, and how well EU policy has been implemented. This serves as the basis for the first part of the SWOT analysis, i.e. the strengths and weaknesses of transport policy. Together with the transport flows and the prospects for economic development, there is a basis for indicating some important areas to be dealt with in future EU transport policy. The main section of the report takes up this forward-looking part, which is concluded by the SWOT analysis’s opportunities and threats. The results are summarised in the form of some important directions for the Swedish Presidency and for long-term EU transport policy.

SIKA Report 2009:1
6
Strengths
• Fairer competition
• Deregulation
• Driving/inspiring
• TEN-T
• Fee policy
• Systematic method of work – goals-measure-follow-up-
improvements
Weaknesses
• Implementation of decision
• Lack of available sanctions
• Measures instead of goals – one size doesn´t fit all
• Focus on increased mobility
• The importance of special interests
Opportunities
• Integrate transport and climate policy with clear goals
• Further efficiency improvements
• Link land use and transport
• Great potential for trade and integration by evening out
differences between East and West
Threats
• The economic crisis
• Reduced payment capacity a threat to fee policy
• National interests take precedence over EU interests, TEN-T and the corridors may be affected
• One-sided focus on mobility a threat to life quality and environmental issues
SWOT analysis of EU transport policy
Mobility has been something of a lodestar for EU policy ever since the Rome Treaty. The goal of increased mobility has also permeated transport policy. While SIKA considers increased mobility in the form of migration to be beneficial, it is mistaken to regard transport policy as being limited by a goal of increased mobility. The goal of accessibility puts the focus instead on the purpose of travel – to obtain access to a function. For the individual, this might be access to work, service and leisure activities. For the business sector, it might concern access to labour, customers and raw materials. The goal of long-term European transport policy should therefore be to achieve a high level of accessibility. Mobility – the possibility of transportation – is, however, only a means to achieve the benefits of accessibility. Policy should, in other words, endeavour to reduce the negative consequences of traffic such as congestion and the impact on safety and the environment by increasing the efficiency of the transport system. However, it is not necessary or appropriate for the EU to regulate in detail how individual Member States should work on every issue. Regulation of this kind would be very ineffective since it would not be adapted to local conditions. However, the EU can disseminate good examples. As a main rule, implementation issues should be left to the individual Member States while cross-border issues should be dealt with by the EU. However, an efficient transport system will not become a reality unless the extent and pace of implementation of the various transport policy decisions can be

SIKA Report 2009:1
7
increased at the national level. A combination of stick in the form of inter-nalisation of external effects and carrot in the form of positive measures that offer choice is therefore preferable. The introduction of, for example, a congestion tax should thus be combined with an expansion of public transport or similar. Within the EU, there is a good tradition of systematic follow-ups of projects. The EU can develop this area further by working with key statistics and indicators to steer development in the right direction. From an EU and international per-spective, it is important to build up knowledge about cross-border transportation. The development of welfare depends on an efficient transport system both for passenger and freight transport. The development of the transport network was a purely national interest for a long time, which led to there being few cross-border links. The European transport system therefore suffers from there being “gaps” between the national networks which the individual Member States do not feel any responsibility for filling. The EU has therefore a self-evident task of creating an integrated European network both for passenger and freight traffic within the framework of TEN-T. This network should not have too many branches but serve as a trunk network. A more limited and prioritised network will expand more rapidly if there is a large proportion of grant finance from the Community. Financial carrots have previously been seen to be an effective means of speeding up planning and implementation. Cross-border transnational platforms can facilitate identification of such “gaps” and at the same time create acceptance among the countries concerned to plan and finance measures with the aim of achieving an integrated European transport system. An embryo for a transnational platform of this kind can be found in the so-called Östersjö strategy. Within the framework of TEN-T, special green corridors should also be designated. Within these corridors, several modes of transport should be represented to offer the business sector the opportunity to choose environmentally friendly transport. Even though the designation of corridors may be regarded as an expression of central control, the basic principle of transport policy should none the less be extensive decentralised decision-making. It is primarily individuals and the business sector that should steer the development of the transport system by their choices. An important piece of the jigsaw is that transport purchasers should also pay for the costs of transport in the form of, for example, congestion and environ-mental damage. Internalisation of these costs contributes to increasing the efficiency of the transport system. The EU has a particular responsibility for taking into account the systemic effects in the design of financial instruments in future freight corridors and TEN-T. The decisions made in the Member States must be compatible with transport policy at Community level. EU transport policy should therefore consist of harmonisation in a framework that contains clear rules which make possible competition on equal terms between different modes of transport, as well as technical, social and fiscal respects in the transport sector.

SIKA Report 2009:1
8
Fossil-based fuels will predominate until 2030 but will be successively replaced by several different types of energy sources. The EU should not designate any particular form of energy source or fuel but this will be dealt with by the market. However, the EU can help to phase in alternative fuels by setting ceilings for emissions and using powerful financial instruments. The EU can also support small-scale trial activities by, for example, developing the infrastructure for new fuels along the green corridors. Another area which the EU should promote is research for energy efficiency. A well-designed pricing policy is an important piece of the jigsaw to achieve an efficient transport system that is sustainable in the long term. Internalisation of these external effects should be based on marginal cost pricing. Correct pricing is a prerequisite for decentralised decision-making, i.e. it is the purchaser of tran-sport who is best suited to determine how transportation is to take place. The EU is responsible for taking into account the systemic effects of the design of financial instruments in future freight corridors and TEN-T.

SIKA Report 2009:1
9
1 Introduction
A well-functioning transport system is a prerequisite to retain welfare and develop the EU’s competitiveness. The shaping of transport policy is an important component to achieve an efficient transport system. This report is intended to indicate a number of important areas which need to be developed in the shaping of transport policy after 2010. There is no doubt that well-functioning transportation is essential to achieve the desired development of society. The basic function of the transport system is to overcome geographical barriers to make possible interaction between people, businesses or countries. This is also a natural step in the EU’s objective of making better use of the economic potential of all regions by a more balanced spatial structure, i.e. a more polycentric European population structure.1 This insight explains why transport policy in the EU and its Member States has to a great extent been focused on increasing mobility. The historical development of the transport sector has entailed continuously increasing opportunities to benefit from a growing offering of employment opportunities and trade. This is reflected in transport statistics by both freight and passenger traffic having continuously increased for a long time. This is shown in the transport statistics in the form of increased traffic perfor-mance relating to vehicle movements and is expressed in vehicle kilometres (vkm). It can also be expressed in transport performance which refers to movement of people or freight and is expressed in passenger kilometres (pkm) and tonne kilometres respectively (tkm). A measure of the efficiency of the transport system can be constructed by comparing traffic performance and transport performance. If, for example, transport performance is increasing while traffic performance is constant, the transport system has become more efficient. However, it is important to point out that there is no predetermined quantity of either traffic or transport performance that satisfies society’s needs. The amount of traffic performance (vehicle kilometres) depends on a quantity of different factors. It is possible to influence the total quantity of traffic according to how society is planned and the prerequisites provided by different modes of transport. New prerequisites in the traffic system can both create new traffic and reduce it. There is now increased awareness of the negative consequences in the form of, for example, congestion, emissions and traffic deaths ensuing from a policy, which is unilaterally focused on increasing mobility. This has increased awareness that the goal of transport policy should be better accessibility rather than increased mo-bility. With improved accessibility as a goal, the focus is on the actual purpose of
1 Commission of the European Communities (1999): European Spatial Development Perspective: Towards Balanced and Sustainable Development of the Territory of the EU, Luxembourg.

SIKA Report 2009:1
10
a journey – to obtain access to a function. For the individual, this may, for example, be access to work, service and leisure activities. For the business sector, it may be access to labour, customers and raw materials. Mobility will in this context then only be a means to achieve the benefit of accessibility. Other means are to use information technology or influence land use and location of different destination points. Some researchers claim that there is even a conflicting relation-ship between high mobility and high access.2 The establishment of external shopping centres constitutes an illustrative example where mobility increases at the same time as access deteriorates. Mobility, expressed in vehicle kilometres, increases with increased distance between the customer and the shop and a location that requires access to a car for the group with access to a car. Access, that is how easy it is to reach services offered reduces, however, overall, in particular, for groups without a car. A one-sided focus on increased mobility has therefore come to be regarded as outdated.3 The conclusion is that the starting point for the transport sector should be to increase accessibility with as little traffic performance as possible, that is that transport policy (and other policy areas) should be focused on improving the efficiency of the transport sector. EU transport policy has different time perspectives, the short-term perspective covering the period of the Swedish Presidency, the medium-term perspective that is reflected in the coming white paper and the longer perspective up to 2050. There are various possibilities of exerting influence based on which time per-spective is intended. There are also limits for the measures that it is possible to implement. To achieve a long-term sustainable transport system, both location and planning measures are needed, work to change conduct and attitudes as well as rules and restrictions. To achieve the best effect, it is also beneficial to carry out measures in combinations. The Swedish Road Administration’s climate strategy is reproduced below as an example (Table 1.1).4 Table 1.1: The potential of different measure strategies (expressed in %) for
reducing the carbon dioxide emissions of road transport. The table also shows the
assessed total potential (national) for the respective goal year.
Goal year Community planning,
infrastructure &
transport-offering
Regulation & financial instruments
New technology
Behaviours Total effect, national (million
tonne CO2)
2010 9 % 67 % 7 % 17 % -5,0
2020 22 % 50 % 16 % 13 % -9,4
2050 20 % 33 % 39 % 8 % -19,8
Source: Trivector’s (2008)5 processing based on the Swedish Road
Administration’s climate strategy (2004)
2 Ross, W. (2000): Mobility and accessibility: the yin and yang of planning; World transport policy and practice, vol 6, no. 2. 3 Banister, D. (2008): The sustainable mobility paradigm, Transport policy, vol 15, no. 2. 4 Swedish Road Administration (2004): Klimatstrategi för Vägtransportsektorn, Vägverket rapport 2004:102, Borlänge. 5 Trivector (2008): Överflyttningspotential för person- och godstransporter för att minska transportsektorns koldioxidutsläpp – åtgärder inom Mobility Management, effektivare kollektivtrafik och tätortslösningar. Trivector Rapport 2008:60, Lund.

SIKA Report 2009:1
11
The results indicate that community planning measures have limited importance in the short term although they increase in importance in the longer term. This is mainly due to an inherent inertia since changes in the structure and infrastructure of society take place gradually. It is therefore important to have a long-term per-spective on transport policy even if the result of the policy conducted does not have an immediate impact. In the short term, measures that affect behaviour and regulations/financial incentives are very important. These measures can be introduced rapidly and have a relatively short changeover effect. The strategy “new technology” has a relative low effect in the short term although it becomes more important in the course of time. In the above example, it is also the case that the respective planning strategy increases in importance even if its relative importance changes. The starting point for this analysis and the conclusions presented in the report is how to achieve increased efficiency, both for all modes of transports and in the perspective of particular modes of transport. The report starts with a survey description of transport flows and economic development in the EU and the importance of a well-functioning transport apparatus. Chapter 3 is devoted to a retrospect of the current long-term transport policy as formulated in the White Paper of 2001 and developed to date for the future. In conjunction with this review, there are a number of perspectives from different Member States of the issues that are important for them and how well EU policy has been implemented. The chapter concludes with a summary in the form of the first part of a SWOT analysis, the strengths and weaknesses of EU transport policy. Based on official EU documents, scientific publications and case studies, Chapter 2 and Chapter 3 serve as the basis for pointing out some important areas that must be dealt with in future EU transport policy. The remaining part of the report takes up the con-cluding part of the SWOT analysis, opportunities and threats, focusing on the future. This is summarised in the form of some important directions for the Swedish Presidency and for EU transport policy in the long term in Chapter 6.

SIKA Report 2009:1
12

SIKA Report 2009:1
13
2 Importance of transportation and transport
development in the EU
2.1 The importance of transportation for Community
development
In a historic retrospective, it is not particularly difficult to find examples where transportation meant a lot for the development of society. In the United States, for example, the construction of canals and railways made possible increased specialisation and division of labour which increased the efficiency of the economy.6 In a similar way, the railway contributed to making mining and steel production more efficient in Sweden by making it possible for activity to be concentrated.7 More generally, it is the case that an investment in transport infrastructure leads to lower transport costs, shorter transport times and greater reliability. Figure 2.1 summarises the economic effects of improved infrastructure.
Figure 2.1: Economic effects of improved infrastructure
Source: Anderson and Lakshmanan, 2002
These effects in turn affect the economy in various ways:8
• Lower transport costs and shorter transport times increase the market size and thus output and income. The market expansion applies both to purchase and sale of freight and services and leads to lower costs due to
6 North, D.(1966): The economic growth of the United States 1790-1860, New York. 7 Heckscher, E.F. (1907): Till belysning af järnvägarnas betydelse för Sveriges ekonomiska utveckling, Uppsala University, Stockholm. 8 Anderstig, C. and Johansson, J. (2006): Infrastrukturinvesteringar och regional utveckling; en sammanställning av ex-post studier, Inregia, Stockholm.
Improvements in the transport infrastructure
Shorter transport times Reduced congestion
Cheaper and more reliable transport
Logistical
improvements
Merger of
facilities
Localisation
effects

SIKA Report 2009:1
14
economies of scale. An expanded labour market moreover provides business with a greater choice of qualified labour. Matching is improved in the labour market.
• The reduced transport costs lead to increased competition which in turn
results in increased productivity.
• Reduced transport costs can also affect the localisation of businesses. Relocation can increase productivity by, for example, cluster formations.
Besides the above-mentioned effects, logistics improvements should also be mentioned. Cheaper and above all more reliable transport provides businesses with incentives to reduce their stock levels. This is the basis for the just-in-time-systems which reduce stock costs but also make higher demands on the transport system. It is difficult to make general predictions about the outcome of the economic growth of infrastructure investment since the outcome to a great extent depends on the other prerequisites for growth that are complied with in the economy at the same time. In regions with a growth-oriented business sector and a deficient transport infrastructure, transport investments have quite different effects than in regions with a mature competitive business sector and an infrastructure that is already good. The conclusion is that a good/improved infrastructure is a necessary but not sufficient condition to create a positive regional development. All modes of transport have different advantages and disadvantages. Competition between them in respect of distance and travel time is illustrated in Figure 2.2. The car has an almost non-existent terminal time and is therefore the fastest means of transport for shorter distances. The broken lines for cars and express coaches indicate the need for breaks. Fast trains (X2000) are above all com-petitive over distances of 100 to 300 kilometres. Investments which make it possible to increase speed would increase the interval slightly although air travel remains the most competitive alternative for longer distances. In this comparison, only travel time has been taken into consideration, and competition would, of course, have a very different appearance if cost, frequency of services, and other quality aspects of transport were also taken into consideration. A general conclusion is, however, that all modes of transport are needed since they have different functions in the transport system.

SIKA Report 2009:1
15
Figure 2.2: Competition between different modes of transport
Source: SOU 2003:14
Similar reasoning could be made about freight traffic, where the different modes of transport have different roles in the supply chain from producer to customer, often depending on which kind of good is transported. The Commodity Flow Survey (VFU) 2004/5, shows the distribution between unimodal and multimodal transport chains (Figure 2.3). In several commodity groups, road transport is predominant while rail or maritime transport is dominant for other categories of commodities. Few groups have an even distribution of transport solutions.
Figure 2.3 Distribution of commodity groups between transport chains.
Source: VTI 2008 and SIKA 20069
9 VTI (2008): Svensk godsstudie baserad på nationell och internationell litteratur. Internationell exposé – persontransporter, VTI report 629, Linköping. SIKA (2006): Varuflödesundersökningen 2004/2005, SIKA statistics 2006:12, Stockholm.
0%
10%
20%
30%
40%
50%
60%
70%
80%
90%
100%
Agriculture
Saw
n t
imber
Oth
er
wood
pro
ducts
Food
Cru
de o
il
Oil
pro
ducts
Iron o
re
Meta
l
pro
ducts
Paper
& p
ulp
Constr
uction
mate
rial
Chem
icals
Hig
h-v
alu
e
goods
Tota
l
Commodity groups
Pro
po
rti
on
(to
nn
es)
Lorry Railway Marine transport Railway as part of chain Marine transport as part of chain Air as part of chain Other
1
2
3
4
5
6
10 20 30 40 50 60
Plane
Express coach Car
Train
Fast train
(X2000)
Journey time (h)
Distance

SIKA Report 2009:1
16
The average transport agreement distance, according to VFU 2004/2005, was 450 km for rail transport, 380 km for transport chains which include rail transport and 230 km for maritime transport and 300 km for transport chains that include lorry transport and ferries. Approximately two-thirds of the transported quantity of freight and 20 per cent of the freight transport performance take place by lorry for distances below 100 km. Maritime transport predominates by a broad margin in international trade, over 80 per cent of the cross-border transport is conveyed wholly or partly by sea. Approximately 40 per cent of the quantity of freight transported is conveyed to or from Sweden. The ability to transport people and freight is also important from the perspective of cohesion. Being able to meet and exchange freight and services and make use of one another’s comparative advantages is a prerequisite for an efficient and well-functioning EU. Cohesion policy is moreover one of the EU’s bearing principles.10 It is also a natural step in the EU’s objective of being able to make use of the economic potential of all regions by a more balanced spatial structure, i.e. a more polycentric population structure.11 A balanced urban or polycentric urban development is also discussed as a possibility of reducing regional differences.12
2.2 The development of transport within the EU
Transport policy and the transport system must be designed in the light of the development of transport within the Community. Freight transport performance has increased by over 30 per cent during the period 1995 – 2005. Passenger transport performance increased by 18 per cent up to 2004. This growth in transport coincided with a growth of GDP by 25 per cent (Figure 2.4). It is worth noting that freight traffic increased more rapidly than economic growth while passenger traffic increased rather more slowly. The White Paper takes up the need of decoupling, i.e. that it is necessary to break the connection between economic growth and transport performance. It is possibly that the beginning of decoupling can be discerned as regards passenger traffic.
10 Commission of the European Communities (2001): Unity, Solidarity, Diversity for Europe, Its People and Territory; Second Report on Economic and Social Cohesion, Luxembourg. 11 Commission of the European Communities (1999) European Spatial Development Perspective: Towards Balanced and Sustainable Development of the Territory of the EU, Luxembourg. 12 EU Ministers Responsible for Spatial Planning and Development (2007) Territorial Agenda of the European Union – Towards a More Competitive and Sustainable Europe of Diverse Regions, Leipzig. http://www.cor.europa.eu/COR_cms/ui/ViewDocument.aspx?siteid=default&contentID=4c3c41dc-7d16-48fd-887f-a8317c0f3667 Meijers, E. and Sandberg, K. (2008): Reducing regional disparities by means of polycentric development: panacea or placebo?, Scienze Regionali, Vol 7 no. 2, p. 71-96.

SIKA Report 2009:1
17
Figure 2.4: The development of transport performance for passenger and freight
traffic in comparison with GDP (EU-25)
Source: Eurostat 2007a
Road traffic is by far and away the most important mode of transport for passenger traffic with just over 70 per cent of transport performance, followed by bus/coach (just over 8 per cent) and train (just under 6 per cent) (Figure 2.5). Road traffic is also predominant for freight traffic (just under 45 per cent), although maritime transport (just over 40 per cent) also accounts for approx-imately the same proportion of freight transport performance especially if inland waterway transport is included. Railway accounts for about 10 per cent of transport performance.
Figure 2.5: Distribution of transport performance for passenger traffic (2004) and
freight traffic (2005)
Source: Eurostat 2007a
There are a number of driving forces underlying this development. As regards freight traffic, this partly relates to how production and distribution are organised. The aim for reduced costs for warehousing and the subsequent “just-in-time”- strategy have increased demands for secure and reliable transportation. In the case of passenger transport, the endeavour to increase mobility mainly by investments in car traffic has led to more scattered built-up areas, which has further increased

SIKA Report 2009:1
18
the need for transport. The increase in transport performance may also be a result of increased prosperity.
Figure 2.6: Emissions of gases affecting the climate (1990 - 2002)
Source: European Environment Agency
It has already been mentioned that transport may have a positive impact on economic growth and regional development. Unfortunately, transport also causes a number of negative effects which must be checked to enable transport develop-ment to be confined within the framework of sustainable development. Despite great progress in the sphere of road safety, over 40,000 are involved in traffic accidents in the Union every year.13 The emissions of greenhouse gases and their effect on the climate is another problem which must be dealt with in future transport policy. Emissions of greenhouse gases moreover continue to increase in contrast with the trend in other sectors (Figure 2.6). The next chapter analyses how the current transport policy has affected development in the EU as a whole and in some specific Member States.
13 Eurostat (2007): Panorama of transport, Luxembourg.

SIKA Report 2009:1
19
3 Current transport policy in the EU in a
future perspective
Many components of current transport policy in the EU originate from the White Paper of 2001, which deals with transport policy up to 2010. Within the frame-work of the government commission, SIKA has carried out an analysis of the policy conducted and drawn some conclusions, which are presented below.14 The policy conducted to date has drawn to attention a number of problems that appear relevant and has also provided proposals as to how these can be dealt with. The deficiencies include traffic jams in cities, airports and certain major road routes but also the harmful effects of traffic on the environment and people’s health. One weakness of the policy conducted is that certain objectives focus on measures instead of their purpose. The clearest expression of this is the White Paper’s objective of restoring the balance between modes of transport. SIKA’s view is that transport policy objectives should to the greatest policy extent be of the nature of effect objectives and be technology-neutral, which means that it is in principle not of interest to state objectives as to which mode of transport is to be used. In the mid-term review of the White Paper, a desired shift has taken place in this direction by the stress on co-modality, i.e. an efficient use of different modes of transport separately and in combination with one another. A stress on co-modality accounts for the insight that a journey or transport “from door to door” often involves several modes of transport. It has also been concluded that the individual company or person is best suited to determine which transport arrange-ments are most adequate on the basi s of their particular conditions. This further underlines the inappropriateness of a central power setting objectives for how large a proportion of transport performance is to be performed by particular modes of transport. Another weakness is that work on internalisation of external effects has not made particularly much progress even if creditable initiatives have been taken within the framework of the package for greener transport.15 It is important that this work continues and is intensified in order for transport purchasers to encounter the correct price signals when they make their choice of transport. Developing mobility is an important goal for the EU. However, the strong focus on mobility in transport policy, with the focus on a narrow definition of traffic development, reduces the ability to achieve the most efficient solutions. If
14 SIKA (2008): Åtgärdsanalys av EU:s transportpolitik, SIKA PM 2008:5, Östersund. 15 Commission of the European Communities (2008): Greening transport, COM (2008) 433 final, Brussels.

SIKA Report 2009:1
20
mobility is replaced by accessibility, it will instead be possible to refocus on the underlying purpose of transport – to obtain access to a function. This may, for instance, be access to work, labour, service, raw materials or customers. This would entail that a broadening of perspective beyond the transport system to include, for example, localisation issues and information technology since these affect the need of movement from one place to another. The allocation of responsibility is unclear in the current European transport policy, not least as regards the funding and planning of the Trans-European Network for Transport (TEN-T). The delay in the expansion of TEN-T is explained by insufficient financial resources, insufficient planning documentation and that the cross-border projects are given less priority than the wishes of individual Member States. Due to these deficiencies, TEN-T has not been able to completely fulfil the intentions of European transport policy. It would seems as if there are not enough “carrots” at Community level to distribute in order for the Member States to give higher priority to important European projects over national projects. The allocation of responsibility between the Member States and the Community level therefore needs to be clarified. The decisions made within the Member States must be compatible with transport policy at Community level. EU transport policy should therefore consist of harmonisation within a framework which contains clear rules that make possible competition on equal terms between different modes of transport, as well as technological, social and fiscal aspects within the transport sector. Energy supply in the long term is an area that requires attention. The present transport system is based on, and is to a great extent wholly dependent on, good access to fossil fuels. In the future, it is reasonable to assume that there will be limited access to cheap oil. It is a weakness that the present transport policy has not taken the issue of energy supply seriously. Without a reliable and not too expensive energy supply, there is a risk of a considerable deterioration in accessibility in the future. From the starting point of the current transport policy, a review is presented in Chapter 3.1 of transport policy in a number of European countries. To start with an analysis is made of how the concepts mobility and accessibility, and central-isation and decentralisation have been taken into account to date. A more detailed picture broken down by country is given in Chapter 3.2.
3.1 The direction of transport policy
SIKA has commissioned Trivector Traffic AB to make an inventory of the types of measures implemented by a number of selected countries within the EU.16 This inventory has been made by representatives at the national level within the ministry responsible for transport policy. The commission also included indicating the strengths, weaknesses, threats and opportunities that the countries saw with EU transport policy. The following countries were included in the analysis:
16 SIKA (2009): Underlag till åtgärdsanalys av EU:s transportpolitik, SIKA PM 2009:6, Östersund. SIKA (2009): Evaluation of the implementation of the EU transport policy, SIKA PM 2009:7, Östersund.

SIKA Report 2009:1
21
• Sweden • Spain • France • Poland • Germany • Austria • United Kingdom • Lithuania • Slovenia • The Netherlands
The possibility of influencing transport demand
By tradition, the EU has a very positive view of mobility. A free flow of people, goods, work and services shall both generate growth and strengthen cohesion between the different parts of the EU. However, the EU White Paper of 2001 attempted to adopt a more balanced approach. There was an awareness of both the opportunities provided by transportation and its problems. The document mentioned, inter alia, decoupling and transport demand management as well as the need to reallocate road transport to other modes of transport that placed less of a burden on the environment. This direction can also been seen in Swedish transport policy in the 2001 infrastructure bill. Among the countries studied, the United Kingdom has been leading when it comes to attempting to influence demand for transport. An expression of this endeavour is the introduction of compulsory local transport plans where transport is viewed in a context with, for example, economic development and population development, but also how more effective use can be made of the existing infrastructure.17 France18 also works with similar instruments and Spain19 offers government assistance to the producers of such plans. In Germany and Austria, however, a cautious approach has been adopted in introducing demands at the local level, which may be due to these countries being federal states. Poland has attended to urban problems, but has given priority to other issues. In the mid-term review, the priorities of European transport policy system were adjusted. The review refers to the Lisbon agenda for jobs and growth and gives less emphasis to issues such as decoupling and transport demand management. Instead, co-modality and efficiency improvements with the aid of ITS are discussed. The urban traffic issue is a matter for the individual Member States to deal with. A contributory cause of this direction was the consultation that took place prior to the mid-term review. This consultation emphasised the key role of transport for economic growth, and the need to adapt measures to the new prerequisites in the form of, for example, an expanded EU and globalisation of the transport industry. This was welcome for the logistics country Germany. They
17 See, for example, Local Transport Plan: http://www.dft.gov.uk/pgr/regional/ltp/ 18 See, for example, Plan de Déplacements Urbain: http://www.pdu-casa.fr/ 19 Spain works with Urban mobility plans and Company transport plans. These are described in: Ministerio de industria, turismo y comercio (2007): Saving and energy efficiency strategy in Spain 2004-2012; action plan 2008-2012, Madrid

SIKA Report 2009:1
22
also greatly contributed to the production of The EU’s freight transport agenda20. Poland also saw an opportunity to strengthen its economy through freight transport. The transit country Austria has, however, maintained the approach of the White Paper and subsequently also adopted new guidelines within the sphere of the environment, for example, road charges have played an important role there. Germany also uses a number of financial instruments to steer traffic to more environmentally friendly modes of transport. At state and local level, discussions are also taking place on the need to avoid transport. In the case of freight, efficiency improvements through improved logistics and ITS have become more accepted, and avoiding transport then means, for example, unnecessary empty runs. This also applies to Austria, while Poland is lagging in the sphere of ITS. Otherwise, it has been difficult to assess how the mid-term review has been implemented in different countries. Poland states explicitly that they gave greater focus to TEN-T, ITS, intermodality and road charges as a consequence of the mid-term review. One tendency which has been clearly visible in connection with the expansion of TEN-T is the increased conflict between infrastructure and land use. This is due to EU requirements in other areas, requirements for environment impact assessments (EIA) and consultation, protection of biological diversity, etc. In the case of Poland, it has secured a development with MKB, since the EU makes demands on biological considerations for funding. In Germany, France and Austria, these demands have often led to delayed projects. All seven countries studied in this report are positive to the discussion on urban traffic issues that is taken up in the Green Paper. The U.K., France and Spain highlight urban traffic issues as key issues. Passenger and cycle-related issues which were conspicuously absent in earlier EU documents, have been particularly highlighted. All countries included in this study emphasise the principle of subsidiarity21, although they are positive to exchange of knowledge and experience. France can conceive of going longer and proposes that Sustainable Urban Transport Plans (SUTP) should be mandatory for European cities.
20 The European Commission (2007): The EU’s freight transport agenda: Boosting the efficiency, integration and sustainability of freight transport in Europe, COM (2007) 606 final, Brussels. 21
The principle of subsidiarity is intended to ensure that decisions are taken as closely as possible to the citizen and that constant checks are made as to whether action at Community level is justified in the light of the possibilities available at national, regional or local level. Specifically, it is the principle whereby the Union does not take action (except in the areas which fall within its exclusive competence) unless it is more effective than action taken at national, regional or local level. It is closely bound up with the principles of proportionality and necessity, which require that any action by the Union should not go beyond what is necessary to achieve the objectives of the Treaty.
http://europa.eu/scadplus/glossary/subsidiarity_en.htm

SIKA Report 2009:1
23
Centralisation or decentralisation
There is a continual tug of war in process as to which issues should be dealt with by the individual Member States and which should best be dealt with centrally by the EU. The following patterns could be discerned from Trivector’s inventory: • Implementation issues should be best left to individual countries. This may, for
instance, concern solutions of the noise problem of railways.
• Cross-border issues should be left to the EU. When problems arise as a result of local activities and only have a local effect, these should be left to the individual Member States to deal with at an appropriate level. This may, for example, concern urban traffic planning. If problems, however, arise due to the activities or lack of activity of other countries, the problems should be left to the EU. Sweden and Germany have, for example, pointed out the need for international adaptation of the railway sector. Interventions from the EU that entail deteriorations locally are, for easily understood reasons, sensitive. However, certain interventions seem to be acceptable if these relate to important common improvements, in, for instance, the climate issue. There is less acceptance when it is rather a matter of the economic benefit of other countries. Austria is, for example, concerned that the EU will relax the requirements on transit traffic and does not want to allow longer and heavier lorries. EU interventions must also take into consideration the capacity of countries. Poland, for example, is positive to the revised Eurovignette directive, although it considers that it is too innovative to be realistic in Poland. In other cases as well, Poland requires realistic timetables, a gradual introduction and possibilities of co-finance. Germany considers in the same spirit that it not meaningful to force through development of new technology and fuel, but considers that it is best developed in collaboration with industry. Austria, however, is in favour of forcing through, and considers that it can be achieved through financial incentives. Poland states that they would like the EU to contribute to evening out the differences between East and West, which other countries have also shown some interest in.
3.2 The implementation of EU policy in the Member States
Measures implemented in the Member States
An assessment of how far the individual countries have come on the basis of the 12 policy areas in the White Paper is shown below (Table 3.1). All countries have road safety programmes and have also achieved improvements in the field of road safety. After certain delays initially, work is now in full progress with the Trans-European Network for Transport in every country. A vitalisation of the rail sector with privatisation and deregulation has been started upon in every country and the quality of the transport sector is high in most countries. As regards the formulation of an effective pricing policy, the degree of implementation varies greatly. This may be due to the issue having been delayed at EU level. However, individual countries are continuing to work with the issue

SIKA Report 2009:1
24
nationally. The same thing applies to new technology and alternative fuels. The biofuel directive came relatively late and otherwise these issues have been slightly delayed at the EU level. The White Paper areas on air and maritime transport are difficult to assess. Not so much progress has made at EU level within maritime transport. However, a lot of work on maritime transport has been pursued within the International Maritime Organisation (IMO). In air traffic, all countries witness on a strong growth of air travel although few countries are working with environmental requirements for air traffic. However, the United Kingdom, Germany, Austria and France have attended to this issue. Table 3.1: Implementation of the 12 policy areas in the White Paper (Trivector’s
assessment 2009)
Source: SIKA PM 2009:7
Sweden
The impression is that Sweden has been good at implementing EU decisions within the set time frame. This is the case, for example, with the TEN-T-projects, the biofuel directive and not least work in the sphere of road safety. However, it is more uncertain what importance EU policy has had for the formulation of national policy. The projects which, for example, have been carried out within the framework of TEN-T are of great national interest and would probably have been carried out in any case. Sweden has pointed out that the need for international harmonisation is particularly great in the railway sector. The railway sector also wishes that adaptation could proceed at a faster rate.
WP Sweden Spain France Poland Germany Austria U.K. Slovenia Lithuania Netherlands
1 Raise quality in the road transport sector
2 Vitalise the railway sector
3 Combine growth of air traffic with high environmental requirements
4 Promote transport at sea and on inland waterways
5 Promote intermodality
6 Realise the trans-European transport network
7 Increase road safety
8 Formulate an efficient pricing policy
9 Travellers’ rights and obligations
10 Develop urban traffic
11 New technology and alternative fuels
12 Control the effects of globalisation
No information
Low
Medium
High
SIKA Report 2009:1
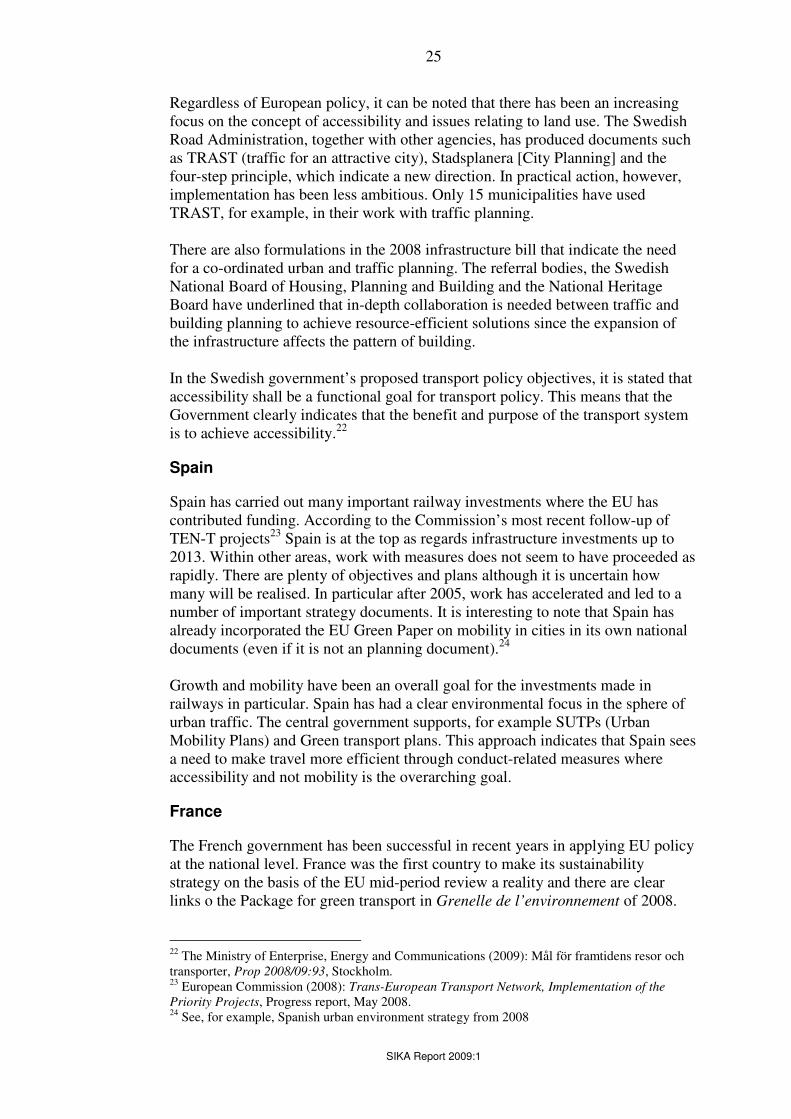
25
Regardless of European policy, it can be noted that there has been an increasing focus on the concept of accessibility and issues relating to land use. The Swedish Road Administration, together with other agencies, has produced documents such as TRAST (traffic for an attractive city), Stadsplanera [City Planning] and the four-step principle, which indicate a new direction. In practical action, however, implementation has been less ambitious. Only 15 municipalities have used TRAST, for example, in their work with traffic planning. There are also formulations in the 2008 infrastructure bill that indicate the need for a co-ordinated urban and traffic planning. The referral bodies, the Swedish National Board of Housing, Planning and Building and the National Heritage Board have underlined that in-depth collaboration is needed between traffic and building planning to achieve resource-efficient solutions since the expansion of the infrastructure affects the pattern of building. In the Swedish government’s proposed transport policy objectives, it is stated that accessibility shall be a functional goal for transport policy. This means that the Government clearly indicates that the benefit and purpose of the transport system is to achieve accessibility.22
Spain
Spain has carried out many important railway investments where the EU has contributed funding. According to the Commission’s most recent follow-up of TEN-T projects23 Spain is at the top as regards infrastructure investments up to 2013. Within other areas, work with measures does not seem to have proceeded as rapidly. There are plenty of objectives and plans although it is uncertain how many will be realised. In particular after 2005, work has accelerated and led to a number of important strategy documents. It is interesting to note that Spain has already incorporated the EU Green Paper on mobility in cities in its own national documents (even if it is not an planning document).24 Growth and mobility have been an overall goal for the investments made in railways in particular. Spain has had a clear environmental focus in the sphere of urban traffic. The central government supports, for example SUTPs (Urban Mobility Plans) and Green transport plans. This approach indicates that Spain sees a need to make travel more efficient through conduct-related measures where accessibility and not mobility is the overarching goal.
France
The French government has been successful in recent years in applying EU policy at the national level. France was the first country to make its sustainability strategy on the basis of the EU mid-period review a reality and there are clear links o the Package for green transport in Grenelle de l’environnement of 2008.
22 The Ministry of Enterprise, Energy and Communications (2009): Mål för framtidens resor och transporter, Prop 2008/09:93, Stockholm. 23 European Commission (2008): Trans-European Transport Network, Implementation of the Priority Projects, Progress report, May 2008. 24 See, for example, Spanish urban environment strategy from 2008

SIKA Report 2009:1
26
On the basis of the areas pointed out in the White Paper, France has been successful mainly in the areas of road transport and road safety. Since 2001, France has already achieved considerable reductions in the fatality rate in road traffic. In recent years, France has set up ambitious objectives in several areas where they had not made so much progress at the time of the follow up in 2006, for example, concerning pricing policy and to promote sustainable growth of air traffic. The climate issue seems to have increasingly come into focus in recent years in France. According to the official transport policy documents, the climate issue has the highest priority and the solutions entail strengthening public transport, improving the conditions for pedestrians and cyclists by financial instruments, among others. France also points out the need of better joint planning between the regional and overview planning and local plans with the intention of strengthening public transport, increasing density and reducing the spread of cities over agricultural land. There is also a proposal for a certain density of building. The approach aims to influence the demand for transport. The willingness to reduce the spread of cities is not new, however, but has been a key issue in France for a long time. One French authority has produced a futures study that can provide an indication of the approach of parts of transport policy.25 The potential for transferring car traffic, not least for short journeys, to other more environmentally friendly means of transport has been drawn attention to, although the conclusion is also that the car may be the predominant form of transport even after 2050. Priority areas for future transport policy may be research and development on vehicles and alternative fuels and fuel-efficient cars as well as strong regulation measures at EU level for energy consumption and carbon dioxide emissions of vehicles and fuels.
Poland
Poland considers that deficiencies in the infrastructure have been an obstacle for utilising the country’s resources and that competitiveness has therefore been reduced. The EU’s cohesion policy is regarded as an opportunity to reduce the difference between new and old Member States. When Poland joined the EU, difficulties in meeting the demand for transport were identified. The infrastructure for all modes of transport is considered to be deficient. Through major investments in the transport infrastructure, accessibility has increased, although this has also led to new problems. One of the problems is precisely reduced accessibility due to increased congestion and a spreading out of cities that increases the need for cars. Poland therefore designates deficient physical planning as a problem. Mobility as such is, however, most referred to in positive terms. The environmental problems mentioned in connection with transportation are primarily that the infrastructure threatens biological diversity. Emissions of greenhouse gases are, however, not regarded as a problem, which is
25 Conseil Général de Pont et Chaussées (2006): Long-range transportation plan horizon 2050, Strategic considerations, September 2006.

SIKA Report 2009:1
27
due to Poland having met its undertakings in the sphere of emission reductions in other sectors. Poland has a land border with, among other countries, Ukraine and Belarus, and is also a transit country between Western Europe and Central Asia, and wishes to benefit from its transit possibilities. The greatest obstacle indicates is the deficient infrastructure and congestion in Poland, no border problems have emerged.
Germany
Selected parts of EU transport policy have been incorporated by Germany. Implementation of measures specific to modes of transport has been completed, apart from deregulation of rail traffic. Germany has also come a long way in internalising costs and on research in the sphere of fuel and vehicles. Germany would like to see flexibility within the European frameworks, to enable an economically and ecologically correct traffic policy to be devised, which would prevent structural or regional distortion of competition and not affect particular places. Germany intends to develop the road toll system to increase incentives for sustainable transport. Germany has not invested in the infrastructure in TEN-T to the same extent as other countries and is therefore lagging behind in this area. In other areas, where responsibility is not completely at the national level, implementation depends on plans at state level. At the national level, mobility is a lodestar. They have responded to the mid-period overview of the White Paper and are speaking about keeping Germany moving. The focus is accordingly primarily on improving efficiency with different technical solutions. Germany has more financial instruments to steer traffic towards more environmental modes of transport. They also take up in their Freight and Logistics Masterplan26 that unnecessary transport can be avoided by improved logistics. Germany opposes excessive centralisation arguing that it risks becoming bureaucratic and thus inefficient. They obtain support from the mid-term review which instead recommends consultation with industry, building on existing structures and agreements. In particular, with regard to matters relating to public transport and urban development, Germany advocates that the principle of subsidiarity should apply. As regards the connection with countries outside the EU, Germany expects that external relations will be developed within the aviation industry. That a European security standard will be developed in all modes of transport against terrorist attacks and that the EU will ensure that this will also be accepted by countries outside the Union so that they do not constitute a barrier to international trade. Germany wishes to secure the EU’s competitiveness with the aid of the Agenda for freight transport. Germany and its space industry has been involved in Galileo
26 Federal Ministry of Transport, Building and Urban Affairs (2008): Freight transport and logistics master plan, Berlin.

SIKA Report 2009:1
28
for a long time and considers that it of key importance that the members of the Union can benefit from their contributions to this project.
Austria
Austria has worked a lot with restoring the balance between modes of transport and on eliminating bottlenecks. Austria considers that links both in a north-south and east-west direction are important. In the sphere of transport safety, Austria has completely incorporated the EU’s objectives and is moreover actively working to develop the policy. The same applies for work with inland waterways. As regards road charges, Austria is rather setting an example to inspire the rest of the EU. According to Transport Masterplan for Austria 2002, Austria does not advocate increased mobility but emphasises that unnecessary transportation shall be restricted, and that transport shall take placed to the greatest possible extent with environmentally-friendly means of transport. This is to be achieved through a well-designed pricing policy and a deliberate approach to physical planning. The actual development indicates, however, increased travel, due, among other things, to external business establishments, increasing long-distance commuting, increased land requirement for building and traffic facilities as well as increased costs for congestion. Austria has quite a lot of heavy transit traffic and is opposed to the EU changing the rules for lorry traffic (for example, permitting heavier lorries) which, in their view, would lead to more negative effects from traffic.
The United Kingdom
It is clear that the U.K. places the climate issue and urban traffic issues high up on the agenda. In these respects, the U.K. is ahead of the rest of Europe. In recent years, transport policy in the U.K. has focused on making the existing road network more efficient and developing the rail network and the infrastructure for public transport in cities. The transport strategy also takes up balancing the need for transport with climate and life quality issues.27 Mobility management, Local transport plans and Green transport plans for businesses have been important parts and complements to, for example, congestion tax in London. It is interesting to note that the U.K. has had a growth in traffic which is less than GDP, which indicates decoupling. The U.K. has been very active with regard to individual issues that they have had a particular interest in. This concerns, for example, the need for charges which they consider are necessary as a steering measure. The introduction of congestion tax and charges on flights are examples of incentives that have been carried out. The U.K. is at present investigating other types of incentives such as an individual carbon dioxide budget. The U.K. takes care to emphasise the subsidiarity principle; Objectives and frameworks in certain areas are good, although every country should be given considerable freedom in the design of concrete measures.
27 See for example the policy document Delivering a sustainable transport system: http://www.dft.gov.uk/about/strategy/transportstrategy/dasts/

SIKA Report 2009:1
29
Lithuania
Generally, Lithuania is doing well implementing the 12 policies of the White paper. The TEN-T priority project Rail Baltica is on schedule and the work is ongoing between Kaunas and Riga. However, the cross border section between Lithuania and Poland is a key section on which work has not started yet. Road safety has been improved, the number of road fatalities decreased by 33 % from 2007 to 2008. Though it might be to early to predict a trend as the number of road fatalities has been approximately 700 – 750 each year during the period 2000 to 2007. When it comes to means of transportation, Lithuania has got a great deal of passenger car traffic; 91 % in 2006. This can be compared with the average for the EU27 of 80 % the same year. The passenger car traffic’s market share has increased by 3 % since 2002 until 2006. During the same period, haulage on road has increased significantly more than haulage on railway. According to the Ministry of Transport and Communications, the most important issues are considered development of the TEN-T network (thus the Rail Baltica-axis), improving road safety and the promotion of environmentally friendly transports. The “Long-term Strategy (until 2025) of Lithuanian Transport System Development” emphasizes the importance of developing an intermodal transport system. Without improvements on this objective, the market shares of the passenger car will further increase at the expense of public transport. This may cause an increase in CO2 emissions, increase traffic congestions in cities and lead to other negative impacts on the environment. Lithuania has implemented the Eurovignette directive in their national legislation and a levy is taken on lorries and buses. A re-motorization programme has been introduced for railway transport and new vehicles have been purchased, which is in line with the objective reducing noise pollution from rail freight. The Lithuanian government has also initiated a study on external costs of transport impact in urbanised areas, though further investigation is needed on this subject.
Slovenia
Trivector consider that Slovenia has got a positive view of the European transport policy documents and that the country aims to deal with many of the policies of the White paper. Many issues are considered by the Ministry of Transport as of great importance for all Member States to handle. The Slovenian part of the TEN-T priority project No. 6 is on schedule. The quality in the road transport sector has been improved and will be further improved. According to Trivector’s assessment, those two policies of the White paper, No. 1 and No. 6, are the two policies which Slovenia has been most successful implementing followed by policy No. 4 “Promoting transport by sea and inland waterway”. Compared to the referred assessment until 2010, two policies has been less implemented than assessed; policy No. 5 “Turning intermodality into reality” and No. 9 “Recognizing the rights and obligations of users”. The lack of intermodality is noticed in the “Operational programme of environmental and

SIKA Report 2009:1
30
transport infrastructure development for the period 2007-2013” as a weakness of the transport network and is feared to contribute to a further decrease of the public transports market share. Rights and obligations of users are not mentioned in the national transport policy document. The Eurovignette directive has been implemented in Slovenia and a free flow electronic toll charging system is used on all motorways and expressways. Road safety has increased and since 2000 until 2008 the number of road fatalities has decreased from 313 fatalities to 214 fatalities; a decrease with 32 %. Still, quite many road fatalities occur per 10 billion pkm and per million inhabitants compared to other European countries. The car is the dominate means of individual transportation. In 2006 cars constituted 93 % of all person trips in person kilometres in Slovenia. Since 2002 person kilometres by car has increased by 8 % while person kilometres by buses and coaches has decreased by 18 % and trips on railways has increased by 14 %. This indicates in some way that Slovenia has had some problems with shifting the balance between modes of transportation. Slovenia needs to promote interm-odality, making it possible and interesting for people to use public transport in a greater extent. The railway needs modernization and different modes of public transport need to be coordinated with each other. Otherwise the passenger car will continue to increase its market share on the expense of public transport, which will have negative impact on the environment and surroundings. One of the main issues to deal with for Slovenia as well as other Member States, according to a spokesperson on the Slovenian Ministry of Transport, is the establishment of a link between the regulation of transport growth and the impacts of transport on the environment and human beings. This necessitates a change in behaviour patterns. Also, the development of new technologies that will enable a significant reduction of the dependence of fossil fuels, is stated as a main issue for all Member States by the Slovenian Ministry of Transport. In addition to previous stated issues, the Ministry of Transport declares the Slovenia needs to deal with modernization of the railway network, constantly increasing transit demand, development of a high quality urban transport system combined with regulation of traffic in the cities.
The Netherlands
All in all the Netherlands has done a lot to implement the European Transport policy. Despite the fact that the Netherlands already was a top ranked country in year 2000 regarding road safety, the country has improved road safety even more. The harbours have been improved, and as much as half of all the gods arriving to and departing from the Netherlands is distributed by sea. The urban transport system has also been developed and improved, resulting in already implemented, as well as planned, light rail services. There has been improved security on public transport stations due to the implementation of the public transport chip card and a continuous growth in market shares of the bicycle, etc.

SIKA Report 2009:1
31
As stated, road safety has been improved during the latest decade. The number of road fatalities has dropped from 1 080 road fatalities during 2000 to 700 road fatalities during year 2008. The Ministry of Transport, Public Works and Water Management has adopted the Strategic Road Safety Plan 2008-2020, in which is stated that the aim is to reduce the number of road fatalities to 500 until year 2020. CO2-emissions from transport have increased during 1990-2006 with 58 %; from 64.9 million tonnes to 102.8 million tonnes. During 2002-2006 the total amount of travelled pkm increased by 3 %. During this period the total amount of distributed haulage in tonkm increased by 6.5 %. This increase in transports can partly explain the recent increase of CO2-emissions from transports. The Netherlands has fulfilled their undertaking with Priority Project No 2, a high speed railway axis from Amsterdam to Brussels, further on to Köln, Paris respectively London, by completing the Dutch section in 2007. The whole project is estimated to be completed by 2015. Priority Project No 18, Waterway axis Rhine/Meuse-Main-Danube, is estimated to be completed in 2013. Construction work with the Dutch part started in 2007. Priority Project No 5, freight Betuwe railway line, was completed in 2007. Road pricing will be fully implemented by 2017, which means that car owners will pay tax for using the car, not for owning a car. The implementation will start at 2012 and will in the beginning only concern freight. Road pricing will replace the current fixed car taxes. The revenue from road pricing will finance investments in traffic and transport. The implementation of road pricing will hopefully lead to reduced usage of the car, greater density in persons per vehicle, but still allowing individuals the flexibility from owning a car. This will hopefully also lead to a reduction in CO2-emissions from passenger transports. However, there is an aim that pricing may not be used to make usage of roads more expensive, aiming to force a modal shift. All modes of transport must be treated equally, which is most fair and which is a prerequisite for the economy’s competitiveness in a global perspective.
Effects on road safety, traffic performance and carbon dioxide
emissions
In this section a brief comparing study is made of the nine countries on the basis of road safety, transport performance and CO2-emissions from transports. All countries excluding Lithuania have reduced their no. of road fatalities between 2000 and 2006. However, the no. of road fatalities in Lithuania remarkably dropped afterwards from 739 fatalities 2007 to 498 fatalities 2008. Lithuania is also the only of the studied countries which has lowered their CO2-emissions from transport during the period 1990-2006. Note that the amount of CO2-emissions per inhabitant is remarkably high in the Netherlands.

SIKA Report 2009:1
32
Table 3.2: Key statistics for the countries studied for road safety, transport
performance, allocation between modes of transport and carbon dioxide emissions
Sweden Spain France Poland Germany Austria U.K. Slovenia Lithuania Netherl
ands
Road safety
No. of fatalities per million inhabitants 2006
49 93 77 137 62 88 54 51 118 45
Change in no. of fatalities 2000-2006
-25 % -29 % -42 % -17 % -32 % - 25 % -8 % -16 % 18 % -33 %
Transport performance
Person km total per inhabitant
13.1 9.7 14.3 7.1 12.5 11.5 13.2 12.4 14.5 11.0
Change pkm 2002-2006 1 % 7 % 0 % 22 % 1 % 5 % 3 % 7 % 48 % 3 %
Change pkm by car 2002-2006
2 % 8 % -1 % 31 % 1 % 6 % 1 % 8 % 52 % 3 %
Distribution mode of transport
Share of pkm by car 83 % 81 % 84 % 81 % 84 % 76 % 87 % 93 % 91 % 84 %
CO2 emissions from transport
CO2 in tonnes per inhabitant 3.2 3.3 2.7 1.0 2.3 3.0 2.9 2.4 1.7 6.4
Change CO2 1990-2006 34 % 98 % 21 % 47 % 5 % 85 % 24 % 71 % -28 % 58 %
Source: Trivector’s processing of statistics from EC, Energy and Transport in
Figures 2007
Road safety
France has lowered it’s number of road fatalities the most with 42 % during 2000-2006. The Netherlands is still the country with least no. of road fatalities per million inhabitants, followed by Sweden and Slovenia. As shown in the table, Poland still has most no. of road fatalities per million inhabitants and therefore a lot of road safety work to deal with.
Transport performance
Most transport performance per inhabitant is done in Lithuania, slightly more than in France. Lithuania has also got the largest change in pkm during 2002-2006 with 48 %, while France has no change at all.
In Poland and Lithuania the passenger car has taken market share from buses, coaches and trains. In all the other studied countries, besides Slovenia who did not have any trams or metros in 2006, the metro and tram has had an increased market share. The passenger car is the dominant means of transportation in all the studied countries; in Slovenia the passenger car constitutes 93 % of pkm travelled.
Great Britain, Sweden and Germany all have had increasing market shares of the railway. In both Lithuania and Slovenia the railways market share has almost remained the same during 2002-2006.
CO2-emissions
Spain and Austria have both almost doubled their CO2-emissions during 1990-2006. Slovenia has increased its level of CO2-emissions during this period with totally 71 %. As shown in the table above Lithuania is the only country who has reduced its CO2-emissions.

SIKA Report 2009:1
33
3.3 Strengths and weaknesses of EU transport policy
The following analysis of strengths and weaknesses serve as the basis for the continued analysis of opportunities and threats in the following chapters.
Strengths
The strength of the policy conducted has been that it takes up important problems and has formulated effective views on how it should be. This concerns, for example, road safety where policy has been focused on placing the users at the centre. Many countries have, for example, incorporated the goal of a halving of the number fatalities in traffic, which has led to a positive development in many places. EU cooperation has contributed in a clear way to hastening the deregulation of railway traffic within the Community. While there remains quite a lot to do in this area, the work has none the less been given an additional push forward by the EU transport policy (see also in Chapter 5). Priorities within TEN projects have also entailed advantages for railway traffic through the network being extended and modernised. Measures in this sector have facilitated rail freight throughout the EU and have the potential to have a positive impact on the environment and con-gestion in the course of time. A further strength is the discussions initiated on correct pricing of modes of transport, which is not least an important prerequisite for deregulation to be fully implemented. Collaboration at the EU level is important for competition between modes of transport and between countries to be perceived as being fair. The above strengths concern the content of policy. There are also strengths that concern the process on how policy has been conducted. One example consists of consultation that has been used as a way of gaining a hearing for ideas, obtaining acceptance and increasing implementation by cooperation with the actors concerned. Another strength is the systematic approach to work with goal-measure-follow-up-improvement formulations. An example of this is the work with TEN-T where the problems noticed led to the appointment of coordinators which could coordinate the prioritised projects which is important for cross-border projects. This follow-up also included other possibilities for funding, which has probably been very important for hastening construction of the prioritised projects. It is also possible to identify strengths that benefit individuals and businesses. For individual citizens, the policy conducted has led to better road safety, developed urban transport, more environmentally-friendly vehicles and cheaper goods and transport due to the internal market. Attention given to the noise issue and establishment of air quality standards provides conditions for better life quality. For the business sector, the policy conducted has led to a better integrated network and fairer competition. As regards the actual effects of policy, it is important to underline that the situation differs between countries since it is the national parliaments that in most cases make the crucial decisions on implementation.

SIKA Report 2009:1
34
Weaknesses
One weakness of the policy conducted is that it has often had measures as objectives. This has had the effect that it is difficult to determine whether goal fulfilment has also meant that the desired development has been achieved. It has also the disadvantage that the countries have not been able to select themselves the measures that are most suitable on the basis of the country’s own conditions. The lack of indicators and operational objectives at the national level is another weakness which makes it difficult to study the effect of the policy conducted. The extent of policy, its rich quantity of areas and measures, entail that it is in the final analysis the national priorities that determine development. This can undermine the strength of all countries pulling in the same direction and mean in practice that EU transport policy will only be the sum total of the Member States’ individual policies. EU policy has, not least after the mid-term overview, had a great focus on growth and where mobility has been regarded as an important means of achieving growth. It is not incorrect that growth-related issues have come into focus, nor to develop mobility when there is a need, although this should not take place at the expense of life quality and environmental issues. Neither is the circumstance wholly clear that certain components of transport policy, after the mid-term review, for example, the directive on air quality and noise, also deal with important air quality issues. A weakness of current policy is therefore the focus on mobility and traffic development as key to economic growth instead of using the broader concept of accessibility. Mobility that centres on the need of movement means that many cost-effective measures are unfortunately disregarded and that both transport and life quality risk deteriorating as a result. One weakness of the political process is that politics have been too sensitive to strong interests as regards the formulation of policy. Consultation is good when it increases implementation but not good if there is too great a focus on some objectives for all voices to be heard to the same extent, for example, women, unprotected road users, the environmental movement, ethical groups. Deficient implementation of decisions at the national level can be partly explained by the EU lacking sanction possibilities and other control mechanisms. With regard to the biofuel directive, for example, several countries are today a long way away from the set objectives. Implementation of pricing policy has also been greatly delayed. Policy has thereby not either succeeded to a sufficient degree in complying with the objectives on the environment and congestion which were designated as problems in the White Paper.

SIKA Report 2009:1
35
4 A changed EU in a changed world
When a policy for the future is to be formulated, there is always some uncertainty related to the fact that no one can really predict the shape of the future. However, it is possible to make qualified statements by seeking support in current trends and extrapolating them into the future. This may, for example, concern developments in the economy or population in various parts within and outside the EU. Where is the strongest economic growth and how can it conceivably affect the need for transportation in the future? How is regional development affected by a reduced birth rate or an ageing population, and what impact should this have on transport policy? Describing the most important trends for a few areas of this kind can both serve as a starting point to identify important policy areas and also to place politics in a context.
4.1 EU and the surrounding world
In the light of globalisation and changed economic power relations, the connection of the transport system with the surrounding world is crucial. The EU must be able to cope with the challenge of increasing international competition, which in the transport sector, among other things, is about the competitiveness of freight transport. Trade has become an even increasing source of prosperity. Calculated from 1950 to date, trade in commodities has increased about 15 times at the same time as commodity production only increased five times.28 World trade is dominated by three poles in the form of the EU, the US and Eastern Asia (Figure 4.1). The fact is that the concentration of trade to this triad has rather increased than decreased over the years, even if the Asiatic pole includes an increasing number of countries apace with the spread of economic growth in more Asian countries. This trade is based on the international division of labour which started to take shape after the Second World War. Reduced profits among companies in the industrialised world led to an increased interest in investing in less developed countries to make use of their lower production costs. A prerequisite for this development has not least been the development in transport and communications technology, but also standardisation in production itself which makes it possible to make use of unqualified labour.29 Apace with increasing prosperity and educational level, it has been possible to move an increasing amount of advanced production to former developing countries.
28 Warwick E. M. (2006): Geographies of globalization, Routledge, New York. 29 Freobel, F., Henrichs, J. and Kreye, O. (1980): The new international division of labour; structural unemployment in industrial countries and industrialisation in developing countries, Cambridge University Press, Cambridge.

SIKA Report 2009:1
36
Figure 4.1: Main exporters and importers in world trade
Source: Eurostat 2007b
In the specific case of the EU’s trading relations, there are important partners both in North America and Asia (Figure 4.2). It is worth noting that export to Asia is also relatively extensive. There is also extensive trade with countries in Europe which are not EU Member States. This is an example of trade being as a rule greatest with countries in the vicinity, which indicates the importance of an efficient transport system both within the EU and in other countries in the vicinity.
Figure 4.2: Geographic distribution of EU‘s exports and imports (EUR billion)
Source: Eurostat 2007b
The world economy is at present in a deep crisis. The economic decline started in the United States and rapidly spread to other developed countries and then to the developing countries. This global synchronised decline is unique in the post-war period. Growth of world trade fell to 4.4 per cent at the beginning of 2008 in comparison with 6.3 per cent in 2007. Growth of trade is expected to decline further during 2009.30 No one knows today what long-term effects this crisis will have on world trade. Development before the crisis showed that the greatest economic growth is outside the traditional core areas of United States and the EU (Figure 4.3). It is possible that the crisis will strengthen this development and we will have a more multiple world with several economic centres, which will affect the flows of trade. However, no one can overview the long-term effects of the crisis with certainty.
30 United Nations (2009): Pre-release: World economic situation and prospects 2009; Global outlook 2009, New York.
Export
18%
12%
11%
8%5%
46%
Import
19%
23%
9% 7% 4%
38% EU-27 USA
China Japan
Canada Other

SIKA Report 2009:1
37
Figure 4.3: GDP and its distribution 1998-2007 in the G20 countries
Source: UN Statistics Division, National Accounts Estimates and IMF World
Economic Outlook
EU27
Japan
India
ChinaTurkey
Russia
Mexico
Canada
Brazil
Indonesia
Australia
Argentina
South Korea
South Africa
Saudi Arabia
United States
283
663
376
893
957
433
909
260
1 290
4 384
1 099
3 251
1 432
1 314
13 844
16 830
Growth 1998-2007
[ GDP 2007 (US dollar) ]
Expanding economic centres
Old economic centres
Other countries

SIKA Report 2009:1
38
The decline in world trade will lead to a slowdown in growth of traffic. In a way, this will provide a breathing space to remedy the deficiencies of the present transport system. A developed European transport policy can support the Lisbon strategy, the goal of which is to make Europe the world’s most competitive and dynamic knowledge-based economy with the ability to have sustainable economic growth with more and better employment opportunities and a higher degree of cohesion. In periods of crisis, there is a risk of increased protectionism and national egoism. This is a response to opinions that demand that domestic employment is safe-guarded and given first priority. Measures of this kind are a threat to world trade and the prosperity that it engenders. One consequence of increased protectionism is also that the G20 countries, contrary to their own recommendations, have introduced measures that restrict trade.31 Periods of crisis can also mean that it becomes more difficult to justify why a Member State should contribute to investments being made in other countries. It may also be more difficult to introduce, for example, kilometre tax which, although it is socio-economically justified, will lead to an increase in transport costs.
4.2 Transport flows and economic development in the
Union
As result of the EU expanding in a number of rounds, its geographical eastern boundary has been extended to the former Soviet republics of Ukraine and Belorussia, which means that the EU now includes the whole of Central Europe. In the north-eastern part of the Unions, the Baltic Republics now belong which, with the exception of some Russian areas, has made the Baltic Sea an internal sea within the EU. These expansions have meant that the EU is now considerably more heterogeneous both from an economic and a cultural respect. The countries that became members in 2004 and 2007 had a GDP which was below the average for the Union. However, it is also important to bear in mind that the variation of economic development is large between the countries that joined in the last two rounds. When Slovenia became a member, its GDP was 70 per cent of the average of EU-15, while the corresponding figure for Bulgaria was just over 20 per cent.32 Figure 4.4 shows aggregated GDP for the respective EU27 country. The height of the box indicates the country’s average GDP/capita while the area of the box indicates the size of the country’s population, which means that the volume of the box shows the country’s GDP. There are clear differences between countries in Europe as regards the shape of the boxes. The Nordic countries have a relatively small population although the inhabitants have a high average level of income. Germany, France, the U.K. and Italy have large population and at the same time a relatively high average level of income. Their boxes both have a considerable breadth and a fair height. Among the Eastern European countries, there are countries with a large population but where the general level of income is low. They therefore have a broad flat box. The large population indicates that there is
31 Newfarmer, R. and Gamberoni, E. (2009): Trade protection: Incipient but worrisome trends, Trade notes, International Trade Department, The World Bank, March 2 number 37. 32 Sweeney, S. (2005): Europe, the state and globalisation, Pearson Longman, Harlow.

SIKA Report 2009:1
39
potential for growth of a considerable market. There are moreover countries where the population is both small and has a low average standard.
Figure 4.4: Population and GDP per capita 2005 in EU27
Source: Eurostat
It is important to bear in mind that the differences in economic development (GDP/capita) within the Member States are considerable (Figure 4.5). In most countries, the area around the capital has the best economic development. There are exceptions from this rule in, for example, Italy and Germany where the economic centre is outside the area around the capital. The so-called “blue banana” can also been seen on the map with a high level of economic activity that extends from London over the Benelux countries and the Rhine-Ruhr area on towards Frankfurt, Munich and Milan. Areas with the lowest level of income can be found on the eastern border of the EU. Large contiguous areas with a relative low level of income can also be found in Greece, Italy, Spain and Portugal. The large differences in level of income
Malta
Italy
Spain
Sweden
Poland
Latvia
Greece
France
Cyprus
Romania
Ireland
Hungary
Finland
Estonia
Denmark
Germany
Belgium
Austria
Slovakia
Slovenia
Portugal
Bulgaria
Lithuania
Luxem-
bourg
Netherlands
United Kingdom
Czech Republic
10
90
Population (m)
GDP per capita (EUR)
70 000
35 000
17 500
0 500250 Kilometer §
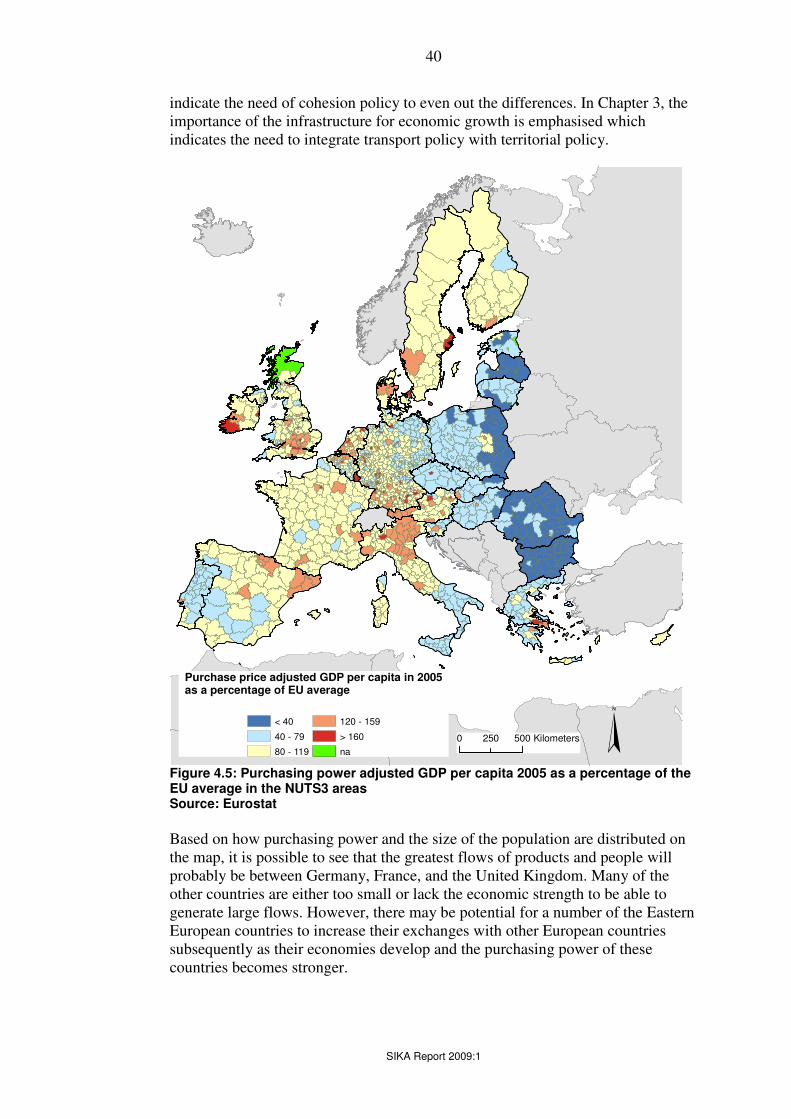
SIKA Report 2009:1
40
indicate the need of cohesion policy to even out the differences. In Chapter 3, the importance of the infrastructure for economic growth is emphasised which indicates the need to integrate transport policy with territorial policy.
Figure 4.5: Purchasing power adjusted GDP per capita 2005 as a percentage of the
EU average in the NUTS3 areas
Source: Eurostat
Based on how purchasing power and the size of the population are distributed on the map, it is possible to see that the greatest flows of products and people will probably be between Germany, France, and the United Kingdom. Many of the other countries are either too small or lack the economic strength to be able to generate large flows. However, there may be potential for a number of the Eastern European countries to increase their exchanges with other European countries subsequently as their economies develop and the purchasing power of these countries becomes stronger.
Purchase price adjusted GDP per capita in 2005
as a percentage of EU average
< 40
40 - 79
80 - 119
120 - 159
> 160
na §0 500250 Kilometers

SIKA Report 2009:1
41
Figure 4.6 shows the 20 largest export flows. As expected, the largest flows are between Germany, France and the United Kingdom. A large flow goes to the Netherlands with the port of Rotterdam. Large flows also go from Italy.
Figure 4.6: The 20 quantitatively largest export flows from EU27, 2007
33
Source: Eurostat
The above pattern will become even clearer if the analysis is limited to flows that exceed three million tonnes (Figure 4.7). These really heavy freight corridors run between Germany, The Netherlands, Belgium and the U.K. The largest flow is from the Netherlands to Germany amounting to around 110 million tonnes. Note that the import flow from Rotterdam is manifestly greater than the export flow. Figure 4.8 shows the flows in the segment 1-3 million tonnes. The above-mentioned countries also have several flows in this size class, although substantial flows have also come from Poland, Italy, Spain and Austria. Sweden enters the picture for the first time with both import and export flows.
33 There are not 20 flows on the map since certain flows run in both directions
Malta
Italy
Spain
Sweden
Poland
Latvia
Greece
France
Cyprus
Romania
Ireland
Hungary
Finland
Estonia
Denmark
Germany
Belgium
Austria
Slovakia
Slovenia
Portugal
Bulgaria
Lithuania
Luxem-
bourg
Netherlands
United Kingdom
Czech Republic
10
90
Population (m)
GDP per capita (EUR)
70 000
35 000
17 500
Export quantity (million tonnes)
10
50
100
Double-direction flow
USA
0 500250 Kilometer §

SIKA Report 2009:1
42
Figure 4.7: Export flows over 30 million tonnes in 2007
Source: Eurostat
Figure 4.8: Export flows in weight, between 10 and 30 million tonnes
34
Source: Eurostat
34 The thickness of the lines is proportional to the size of the flows
Million tonnes
30-40
40-50
72
76
110
§
0 280 560140 Kilometers
Million tonnes
20
§
0 420 840210 Kilometers
USA

SIKA Report 2009:1
43
Figure 4.9: Largest export flows in tonnes from Eastern Europe
Source: Eurostat
Figure 4.10: Export flows in tonnes between the Baltic Sea countries
Source: Eurostat
Million tonnes
3,0-5-5
5,5-6,5
6,5-8,0
10
23
§
0 280 560140 Kilometers
Million tonnes
1
5
10
§
0 280 560140 Kilometers

SIKA Report 2009:1
44
A closer inspection has been made of the freight flows in the Baltic Sea region (Figure 4.10) and from Eastern Europe (Figure 4.9). The flows between Germany and Poland predominate in both regions. For export flows from Eastern Europe, the Czech republic and Slovakia are also important. There are also small flows between the other countries in Eastern Europe and a flow that extends towards the candidate country Turkey. The relatively small flows reflect the low economic activity in the area. The potential for trade in the future is considerably greater than the current level. As regards trade between the Baltic countries, the heavy axis between Germany and Poland has already been mentioned. Large flows within the region also pass between Germany, Denmark, Sweden and Finland. However, only small flows go between the other countries in the Baltic Sea region. The exchange of trade with Russia is also surprisingly small. Russia can also play a key role in future trade exchanges with Asia. Partly by land via the TransSiberian railway but also through shipping and a warmer climate which makes it profitable to open a trade route north of Russia through the North-west Passage. There is thus a potential to develop trade further within the Baltic Sea region. The EU has an important role to play here by identifying the transport links that can contribute to integrate the region and develop contacts with the surrounding world. Here the EU plays a key role by creating an integrated European transport network that bridges the “gaps” in the transport system, which can result from the Member States’ optimising their national interests. Cross-border transnational platforms facilitate identification of these ”gaps” and at the same time create acceptance among the countries concerned for planning and funding measures intended to create an integrated European transport system.35 An embryo of a transport policy of this kind exists as the Baltic Sea strategy.36 Among other things, this strategy aims at making the Baltic Sea region more accessible and attractive. Within the framework of this strategy, for example, a survey of transport flows in the region is being made, which can serve as the basis for the design of the future transport system in the region. Initiatives for similar transnational platforms may with inspiration from Baltic Sea strategy in other parts of the EC. To date the transport flows have been described in terms of how many tonnes of freight have been transported. The picture appears rather different if the description is instead made of the transported value of the goods (Figure 4.11). The greatest difference is that the flows between Germany-Sweden and Germany-Russia seem to consist of higher-value goods. A comparison between the exported quantity (tonnes) and the value illustrate Sweden’s importance as an exporter of raw materials.
35 Sweco Eurofutures (2009): Vägar framåt; om EU-stödet i utvecklingen av svensk infrastruktur, Stockholm. 36 http://ec.europa.eu/regional_policy/cooperation/baltic/index_en.htm

SIKA Report 2009:1
45
Figure 4.11: Export flows in value between Baltic Sea countries
Source: Eurostat
EUR bn
1
5
10
§
0 270 540135 Kilometers

SIKA Report 2009:1
46
Figure 4.12: Transported quantity of freight in EU ports in 2006
Source: Eurostat
For the EU’s imports and exports, the ports are of key importance. The largest is Rotterdam, although there are a number of important ports in this part of Europe. The concentration of ports reflects the high level of economic activity in the area, but also these serve more centrally located areas on the European continent. Previous flow maps showed, for example, Germany. The ports shall be regarded as an integrated part of the transport system. An effective transport system also requires links to ports by road, railway or shipping.
Sines
Forth
Genova
London
Bilbao
Taranto
Ravenna
Augusta
Venezia
Trieste
Antwerp
Hamburg
Tallinn
Goteborg
Le Havre
Valencia
Constanta
Rotterdam
Amsterdam
Ventspils
Liverpool
Marseille
Dunkerque
Tarragona
Zeebrugge
Cartagena
Barcelona
Algeciras
Porto Foxi
Gioia Tauro
Southampton
Brem
er-
haven
Milford Haven
Wilh
elm
s-
haven
Tees &
Hartlepool
Grimsby &
Immingham
Nantes Saint-Nazaire
Freight quantity (million tonnes)
( 10 000
( 50 000
( 100 000
�) Incoming
�) Outbound §0 500250 Kilometers

SIKA Report 2009:1
47
Figure 4.13: Passengers arriving at hotels in 2007
Source: Eurostat
The same applies in principle for passenger traffic. A “whole-journey” perspective is needed from home to the destination. Figure 4.13 shows the largest flows of travellers who stay overnight at hotels. It is not possible to distinguish between business travellers and “ordinary” tourists in the statistics, neither which means of transport have been used. Spain is one of the absolutely most important destinations reflecting its importance as a tourist destination. The United States is the only country outside the EU from which flows are sufficiently large to be visible in this rough presentation. These travellers are a mix of business and leisure travellers. In the future, the tourist industry will be increasingly important for growth and employment in Europe. To some extent, this is due to an increase in the proportion of relatively well-off pensioners in Europe. In addition, an increasing flow of travellers is expected from the growing middle class from the Asian growth economies. The majority of the long-distance travellers can be expected to arrive by plane. Like the ports, the airports are important gateways for the EU or at least to a particular Member State (Figure 4.14). The link between the airport and the rest of the transport system is of key importance for an efficient transport system.
USA
§
0 320 640160 Kilometers
Million
2-3
3-4
4-5
5-6
6-7
7-8

SIKA Report 2009:1
48
* Figure 4.14: Number of air passengers in 2007
Source: Eurostat
Conclusions
• World trade is dominated by three poles: The EU, the United States and East Asia
• Although trade take place globally, a large proportion takes place with adjacent countries
• It is difficult to overview the long-term effects of the economic crisis, although an incipient protectionism and national egoism are a threat to world trade and collaboration within the EU
• There are a number of very heavily used freight corridors in Western Europe
• There is a potential to develop trade within the Baltic Sea region and Eastern Europe
• The EU has a special responsibility to develop an integrated transport system within the EU which is not merely the total of the 27 Member States’ national systems
Dublin
Munich
GatwickStansted
Heathrow
Barcelona
Rome-Fiumicino
Frankfurt /Main
Madrid/Barajas
Palma De Mallorca
Amsterdam
/Schiphol
Paris Charles
De Gaulle
Passengers (m)
10 - 19
20 - 29
30 - 39
40 - 55
0 340 680 170 Kilometres
§

SIKA Report 2009:1
49
5 Current developments in EU transport
policy
5.1 Environment, energy supply and climate
The transport sector is dependent on access to a secure and environmentally acceptable energy supply. Transport policy should therefore also include a strategy for how the transport sector can meet its energy requirements in the long term. The current transport system is based on a good access to fossil fuels and is at present almost wholly dependent on petroleum-based fuels. In future, it is reasonable to assume that there will be limited access to cheap oil. Demand from growing economies, in particular in Asia, is increasing at the same time as there is limited access to conventional oil resources. Non-conventional oil resources may increase in importance although with negative environmental effects and increased costs as a consequence.37
However, the extent to which the transport sector is to reduce emissions and when these reductions are to start is not self-evident. The allocation of emission reductions between different sectors may depend on existing technical solutions and their respective cost effectiveness, but also on how technical solutions can be pursued through targeted measures within different sectors. There is an inherent inertia in the energy and transport systems, which is a reason for initiating a changeover now, even if a clear effect will only be visible at some time in the future. The inertia in the systems depends, on among things, on there being a lot of capital tied up in the existing infrastructures, which are supported by existing institutions.
It is clear that there is no single solution to cope with the future energy supply in Europe, but that solutions for sustainable energy supply must be found in several places. The solutions for the transport sector probably consist of a combination of measures within the fields of energy-efficient technology, increased supply of non-fossil energy and impact on the implementation and extent of transportation, by, among other things, improved logistics and transport-efficient urban structures. In addition, carbon capture and sequestration (CCS) may play an important role.
EU energy and climate policy
The starting point for EU climate policy is the goal that the global average temp-erature shall not increase by more than 2°C compared with the pre-industrial level. The European Climate Change Programme, ECCP, was launched in 2000.
37 Johansson and Jonsson (2009): Transportsektorns energiförsörjning; en utbilck med ett europeiskt perspektiv, FOI, Stockholm.

SIKA Report 2009:1
50
In a second phase of this programme, decisions were made on a number of central directives. These include the directive on a Community greenhouse gas emission allowance trading scheme and the directive on increased use of biofuels. During the spring of 2007, the EU Heads of State and Government agreed on a Community goal to reduce emissions of greenhouse gases by 20 per cent by 2020 in comparison with the level in 1990. In 2008, the Commission launched an energy and climate package with three main directive proposals:
• Burden-sharing of the EU’s emission undertakings among Member States for sectors that are not included in the EU emission allowance trading scheme. Possibilities exist for using emission units from the project-based mechanisms38 to achieve this goal.
• An amendment of the existing EU directive on the emission allowance
trading scheme. Important changes were that the total emission scope should be determined centrally and a considerably smaller share of emission allowances distributed free of charge than is the case at present. A separate decision was moreover taken that the aviation sector should be included in the EU system for emission allowance trading starting in 2012.
• A directive on renewable energy that, among other things, includes an
allocation of the 20 per cent goal between the Member States and a regulatory framework for the 10 per cent share of renewable energy decided upon in the transport sector. Among other things, a set of sustainability criteria was proposed as a condition for fuel being deducted against the goal.
• Proposals for how to create incentives for carbon capture and sequestration
(CCS) and to ensure the environmental integrity of this technology.
In parallel with the introduction of the three directives in the energy and climate package, a process has been underway to produce a directive regulating use of energy in new vehicles. This instrument may be very important for energy consumption in the transport sector and emissions of greenhouse gases.39
Energy supply in the transport sector
There are a number of different scenarios on energy supply in the transport sector. The Swedish Defence Research Agency (FOI) has made a summary of a number of such scenarios in response to a commission by SIKA.40 One example of a
38 The project-based mechanisms entail investment in projects that reduce emissions of greenhouse gases in some form. This can take place, for example, either directly through more efficient energy use or by replacement of electricity based on fossil fuel by electricity based on biofuel. In addition to reduced emissions, the project-based mechanisms contribute to important transfer of technology and capacity build-up among the recipient countries. These inputs are expected to contribute to modernisation and improved efficiency of industry and the energy sector in the host country. 39 The Swedish Environmental Protection Agency (2008): Index över nya bilars klimatpåverkan 2007; I riket länen och kommunerna, Report 5820, Stockholm. 40 Johansson and Jonsson (2009): Transportsektorns energiförsörjning; en utbilck med ett europeiskt perspektiv, FOI, Stockholm.

SIKA Report 2009:1
51
scenario of this kind is provided annually by the International Energy Agency (IEA). According to this forecast, energy consumption in the EU is expected to increase slightly between 2006 and 2030, although at a considerably lower rate than previously (Figure 5.1). In this reference scenario, the instruments and measures undertaken up to mid-2008 have been taken into consideration. For the EU, this means that the Commission’s energy and climate action plan has been included in the scenario.
Figure 5.1: Energy use in the climate sector in the EU in the reference scenario in
WEO 2008.
Source: IEA (2008)
Although the starting point and methods differ in the scenarios studied, it is possible to draw some general conclusions. In the “business-as-usual-type” scenarios studied41, energy consumption in the transport sector increases in the coming decades, although the increase in the EU/Europe varies between the scenarios between 5 and 30 per cent. The difference in the results may be assumed to depend both on the different models adopted and on the large differences in assumptions about oil prices in the different scenarios. Where it is possible to separate aviation, its share of energy consumption in the transport sector and emissions of carbon dioxide increases. In these scenarios, the share of biofuels is considered to increase in the range of 7-10 per cent of the total energy requirement in the transport sector. In policy scenarios intended to reduce emissions and increase use of renewable energy42, the share of biofuels increases to 10-20 per cent of fuel consumption. Of the total consumption of bioenergy, the larger part is expected to take place in stationary facilities. In most of the scenarios that aim at reducing emissions of greenhouse gases, a smaller part of the reduction takes place in the transport sector and a larger part in stationary facilities. Emissions in the aviation sector
41 Capros, P. et al (2008): European energy and transport trends to 2030 – update 2007, European Commission, Brussels. IEA (2008): World energy outlook, Paris. Swedish Energy Agency (2007): Långtidsprognos 2006 – enligt det nationella systemet för klimatrapportering, ER 2007:2, Eskilstuna. 42 See, for example, IEA (2008): World energy outlook, Paris
0
50
100
150
200
250
300
350
400
450
1990 2006 2015 2020 2025 2030
Other fuelsBiofuelsOil products
Mtoe

SIKA Report 2009:1
52
increase in the transport sector considerably also in certain scenarios where total emissions decrease.43 Oil products will be wholly predominant in most of the scenarios studied for the energy supply to the transport sector up to 2030. Only towards 2050 and subsequently will alternative fuels become dominant. The scenarios differ as to which fuel or fuels it will be (alcohols, hydrogen, electricity). These differences depend, among other things, on the assumptions made about technological development for the different technologies, access to different renewable energy resources, use of nuclear power and demand for bioenergy in other sectors than the transport sector. Differences between different scenarios may also be due to the view taken on decision-making. For example, certain scenarios are based on how price changes have historically affected the energy system, others on actors selecting the economically most optimal solutions with full knowledge about the future while still other studies are based on the possibility of preferences changing over time. The approach selected affects the results obtained in the scenarios. A prerequisite for biofuels to become predominant in the transport sector at the same time as there is a sharp reduction in total emissions is both extensive efficiency improve-ments in energy consumption in society as a whole and increased supply of carbon-dioxide neutral energy in stationary facilities.
Possible development paths for the energy supply of the transport
sector
In this section, four different development paths for energy supply to the transport sector are discussed. These are continued use of fossil fuels, biofuels, hydrogen and electricity. The different development paths do not exclude one another but can at least partly develop in parallel.
Fossil fuels
In the forecasts presented above on the transport sector, as a rule, fossil fuels dominate energy supply for the coming 20 years. This applies not only to the business-as-usual scenarios but also to several scenarios with an environmental approach. The explanation is that oil products are particularly suitable for use in the transport sector since liquid fuels which area easy to transport and store can be produced from crude oil with relatively little loss of energy. In a longer perspective, however, a continued petroleum-based energy supply is not compatible with ambitious long-term climate objectives.
Biofuels
An expansion of biofuels is a possible route for reducing emissions of greenhouse gases from the transport sector. Without powerful financial instruments, it is not probable that biofuels will able to compete with fossil fuels for the foreseeable
43 See, for example, IEA (2008): Energy technology perspectives 2008; scenarios and strategies to 2050, Paris.

SIKA Report 2009:1
53
future. There are a large number of possible production paths to produce biofuels (Figure 5.2).
Figure 5.2: A selection of fuel chains for biomass biomass-based fuels
Source: Johansson and Jonsson 2009
A considerable advantage with biofuels is that the same type of vehicle and distribution systems can be used as for petrol and diesel with less adaptation. From a life cycle perspective, however, several of the present alternatives based on conventional agricultural crops only lead to limited reductions in greenhouse gases. The picture is more optimistic with regard to the second generation of fuels which have the potential to lead to considerably greater reductions of greenhouse gases. It is possible to increase use of biofuels although access is despite this limited and a competition situation can arise between demand for food, fibres and energy.
Hydrogen
At present, hydrogen is produced mostly from natural gas, although there are many other production possibilities (Figure 5.3). One possible alternative is gasification of both fossil fuels and biofuels. Another production track for hydrogen is electrolysis where electricity can be converted into hydrogen either in large-scale central facilities or locally close to the consumer. Carbon dioxide emissions are determined by the electricity which is used for production.44 Certain of the alternatives, for example, production of sun-based hydrogen have a very great potential although they have problems with comparatively high production costs.
44 See, for example, Östensson et al (2009): Energi och säkerhet; framtidsinriktade omvärldsanalyser för Försvarsmakten, FOI-R-2637-SE, FOI, Stockholm.
Conventional crops
Wheat, maize, sugar,Potato, grassland
Hydro-
lysis
(Otto/Diesel)
FAME incl RME Methane Ethanol
MethanolDMESynthetic diesel/Petrol/methane
V ätgas/el se fig 4 och 5
Organic waste
Agricultural/house- hold
Vegetable oils/
fat Forest raw
material,
Energy
forest
,
Esterfication Digestion Fermentation
Gasification,
Synthetic
gas
Vehicles with combustion engines
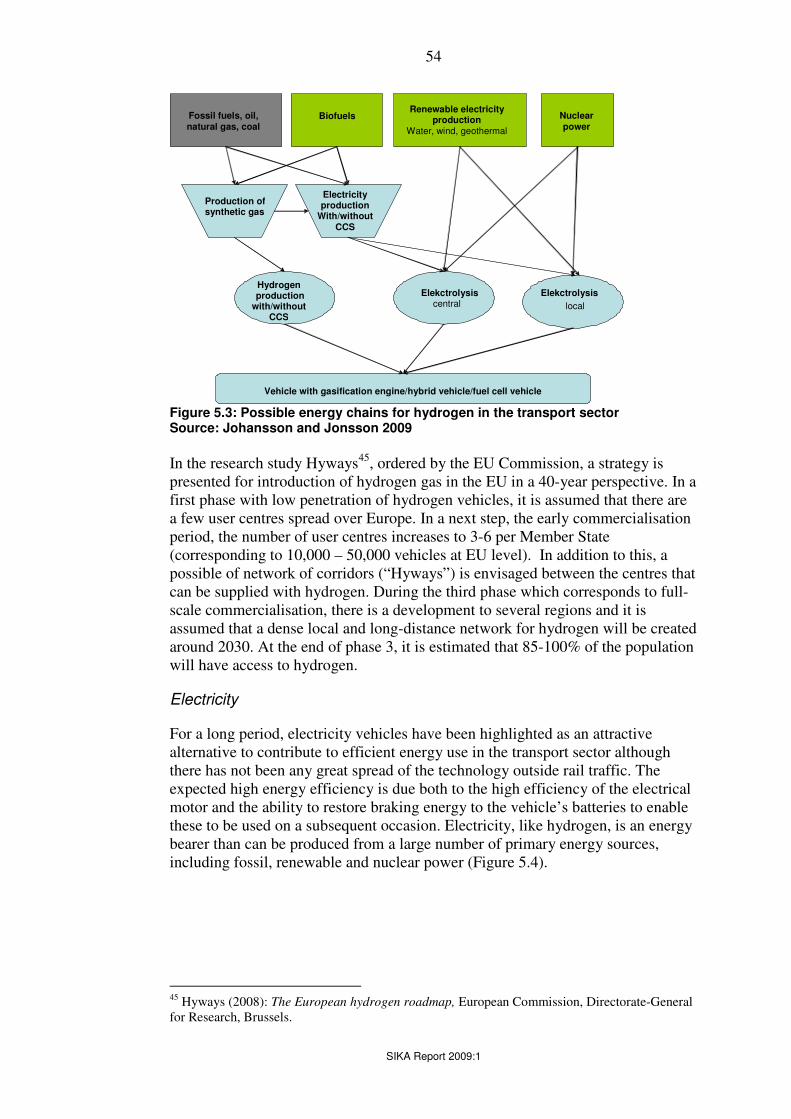
SIKA Report 2009:1
54
Figure 5.3: Possible energy chains for hydrogen in the transport sector
Source: Johansson and Jonsson 2009
In the research study Hyways45, ordered by the EU Commission, a strategy is presented for introduction of hydrogen gas in the EU in a 40-year perspective. In a first phase with low penetration of hydrogen vehicles, it is assumed that there are a few user centres spread over Europe. In a next step, the early commercialisation period, the number of user centres increases to 3-6 per Member State (corresponding to 10,000 – 50,000 vehicles at EU level). In addition to this, a possible of network of corridors (“Hyways”) is envisaged between the centres that can be supplied with hydrogen. During the third phase which corresponds to full-scale commercialisation, there is a development to several regions and it is assumed that a dense local and long-distance network for hydrogen will be created around 2030. At the end of phase 3, it is estimated that 85-100% of the population will have access to hydrogen.
Electricity
For a long period, electricity vehicles have been highlighted as an attractive alternative to contribute to efficient energy use in the transport sector although there has not been any great spread of the technology outside rail traffic. The expected high energy efficiency is due both to the high efficiency of the electrical motor and the ability to restore braking energy to the vehicle’s batteries to enable these to be used on a subsequent occasion. Electricity, like hydrogen, is an energy bearer than can be produced from a large number of primary energy sources, including fossil, renewable and nuclear power (Figure 5.4).
45 Hyways (2008): The European hydrogen roadmap, European Commission, Directorate-General for Research, Brussels.
central
Renewable electricity
production
Water, wind, geothermal
local
Fossil fuels, oil,
natural gas, coal
Biofuels Nuclear
power
Production of
synthetic gas Electricity
production
With/without
CCS
Hydrogen
production
with/without
CCS
Elekctrolysis Elekctrolysis
Vehicle with gasification engine/hybrid vehicle/fuel cell vehicle
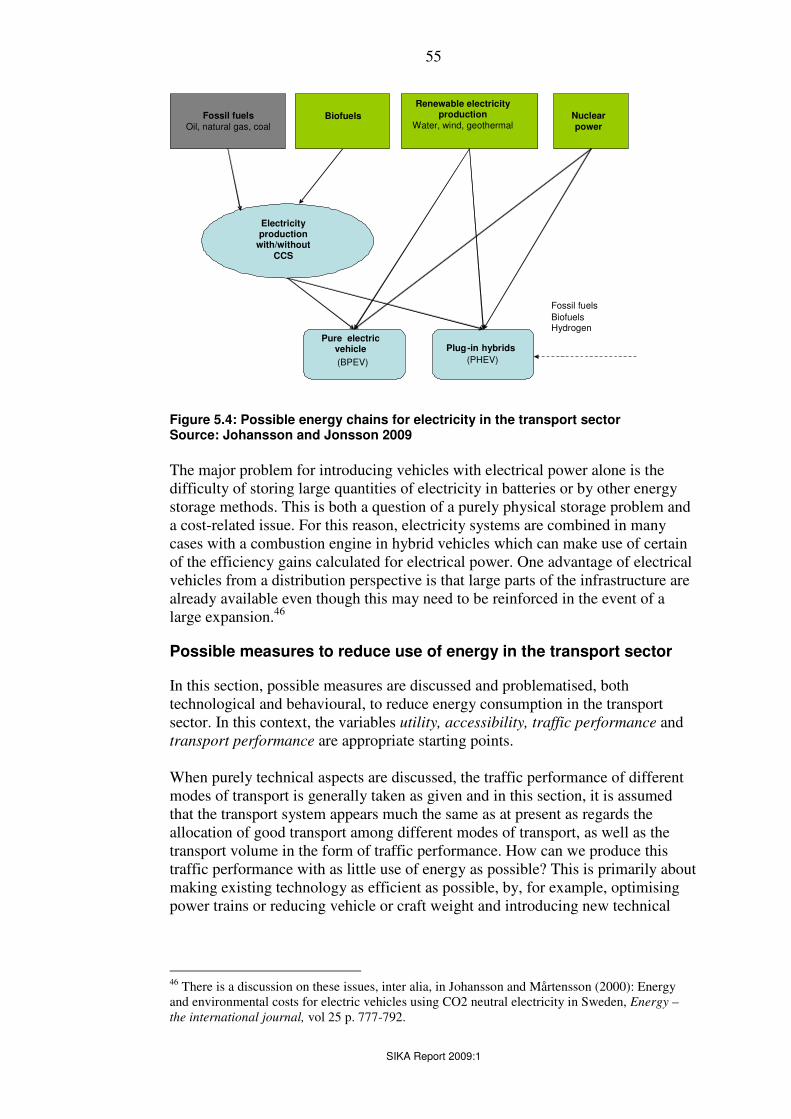
SIKA Report 2009:1
55
Figure 5.4: Possible energy chains for electricity in the transport sector
Source: Johansson and Jonsson 2009
The major problem for introducing vehicles with electrical power alone is the difficulty of storing large quantities of electricity in batteries or by other energy storage methods. This is both a question of a purely physical storage problem and a cost-related issue. For this reason, electricity systems are combined in many cases with a combustion engine in hybrid vehicles which can make use of certain of the efficiency gains calculated for electrical power. One advantage of electrical vehicles from a distribution perspective is that large parts of the infrastructure are already available even though this may need to be reinforced in the event of a large expansion.46
Possible measures to reduce use of energy in the transport sector
In this section, possible measures are discussed and problematised, both technological and behavioural, to reduce energy consumption in the transport sector. In this context, the variables utility, accessibility, traffic performance and transport performance are appropriate starting points. When purely technical aspects are discussed, the traffic performance of different modes of transport is generally taken as given and in this section, it is assumed that the transport system appears much the same as at present as regards the allocation of good transport among different modes of transport, as well as the transport volume in the form of traffic performance. How can we produce this traffic performance with as little use of energy as possible? This is primarily about making existing technology as efficient as possible, by, for example, optimising power trains or reducing vehicle or craft weight and introducing new technical
46 There is a discussion on these issues, inter alia, in Johansson and Mårtensson (2000): Energy and environmental costs for electric vehicles using CO2 neutral electricity in Sweden, Energy – the international journal, vol 25 p. 777-792.
Pure electric
vehicle
(BPEV) Plug - in hybrids
(PHEV)
Fossil fuels
Biofuels Hydrogen
Fossil fuels
Oil, natural gas, coal Biofuels
Renewable electricity
production
Water, wind, geothermal Nuclear
power
Electricity
production
with/without
CCS

SIKA Report 2009:1
56
solutions such as fuel cells or composite material. Many research studies47 and studies produced by the vehicle industry have shown great potential for efficiency improvements. In the supporting documentation for IPCC’s latest report, for example, it is estimated that the specific energy consumption in new vehicles in Europe could be reduced by 40-70% by 2030.48 Technical improvements have, however, only had a little impact in reduced specific energy use. Technological development for cars has instead been mainly used to improve acceleration, top speed, and to be able to provide service attributes such as air conditioning and more space for passengers.49 In this section, we assume that transport performance in terms of passenger or tonne kilometres is maintained while traffic performance (vehicle kilometres) reduces. In this way, total energy consumption is reduced. In the case of goods transport, this may be regarded as a first step as a simple optimisation problem. It is about increasing the load factor for lorry, freight trains, air and maritime transport and avoiding “empty runs”. The next logical step is to transfer freight from less energy efficient (kWh/tonne km) modes of transport to more efficient. Here too financial instruments can also contribute but also infrastructure investments which can contribute, for example, with denser networks, increased speed, dual-mode solutions to stimulate transfer. The picture is more complex for passenger transport since it is not only finance that is relevant but also behavioural changes (which are not just governed by financial considerations). Reduced transport performance leads to reduced use of energy although for this alternative to be attractive or at least regarded as acceptable, the limits of the transport system should be expanded to make opportunities visible. The focus is appropriately placed on factors such as accessibility and utility. Measuring utility in the measure of transport performance may be limited. Retaining utility with reduced passenger transport will require changes in urban and building structures as well as how homes, workplaces and various service functions are planned and located. The role of community and infrastructure planning is central in this context as well as how people organise their everyday lives – both in time and space. When we discuss reduced transport volume with retained utility, we are fully aware that “utility” is not an absolute concept. The utility of a journey or transport
47
For example, Michaelis and Davidson (1996): Michaelis L. and Davidson O. GHG mitigation in the transportation sector. Energy Policy, vol 24, 969-984. Johansson, B. (1998): Will new technology be sufficient to solve the problem of air pollution caused by Swedish transport. Transportation Policy, vol 5, 213-222. 48 Kahn-Ribero et al (2007): Kahn Transport and its infrastructure. In Climate Change 2007: Mitigation. Contribution of Working Group III to the Fourth Assessment Report of the Intergovernmental Panel on Climate Change [B. Metz, O. R. Davidson et al (eds)], Cambridge University Press, Cambridge, United Kingdom and New York, NY, USA. 49 Sprei, F. et al. (2008): Better performance or lower fuel consumption: Technological development in the Swedish new car fleet 1975-2002, Transportation Research – D, vol 13, p. 75-85.

SIKA Report 2009:1
57
is, of course, a subjective experience. An instrument such as fuel taxes may entail changes at all levels – but can give different effects for different people, companies and other organisations. Some may acquire a more fuel-efficient car (energy use is reduced while retaining traffic performance). Another may decide to travel more frequently by public transport (traffic performance reduces while transport performance is retained) while others opt to do more distance work or to walk more (transport and traffic performance are reduced while utility and access are maintained). For some, this will mean sacrifices in the form, for example, of fewer desired leisure journeys while others will use more money for transport, money that could otherwise have been used for other consumption.
Conclusions
• Fossil-based fuels will be predominant, at least until 2030 • Fossil-based fuels will be replaced by several different types of energy
sources • The EU should not designate any single source of energy or fuel • The EU can, however, exercise an influence by setting a ceiling for
emissions and using powerful financial instruments • The EU can support research activities and develop infrastructure on a
small scale in, for example, green corridors • The EU shall support research for energy efficiency • The need for central government or supranational assistance when
introducing radically new systems
5.2 Transportation - a system perspective
In the mid-term review50 of the 2001 White Paper, freight transport performance (tonne km) is anticipated to increase by 50 per cent between 2000 and 2020 in EU-25. This makes demands for solutions to reduce congestion, achieve environmental objectives, reduce emissions and noise levels, increase road and freight safety, as well as providing the logistics industry with access to highly qualified labour. However, the EU and EU policy also entail great possibilities to improve transport for the business sector. A number of the world’s leading logistics companies are European and by working for a development of logistics both through the development of technology and by learning “Best Practices” from one another, Europe can continue to be world-leading in this field. Expanded trade with countries outside the EU is in the EU’s interests and it should be possible to increase this integration by facilitating this trade. Technological development has contributed to European competitiveness for a long time. The EU can continue on its chosen path through increased use of information and communication technology (ICT).
50 Commission of the European Communities (2006): Keep Europe moving – Sustainable mobility for our continent; Mid-term review of the EU Commission’s 2001 White Paper on Community Transport Policy, COM (2006) 314 final, Brussels.

SIKA Report 2009:1
58
The agenda for freight transport51 of 2007 presents a number of action plans.52 Together, they provide the bases for achieving efficient and sustainable freight transport in the EU. This initiative is based on the Community concepts characterised by a focus on freight corridors and transport chains, to and from neighbouring countries and at sea. By making use of economies of scale, these corridors can offer unique technical and financial possibilities which make them attractive to use for several modes of transport, not just in collaboration with one another. In order for corridors and transport chains to work optimally, well-designed terminals should be used to enable freight to pass simply, safely and cost-effectively from one mode of transport to another. To make transport more efficient and increase quality, the Commission wishes to work for making freight transport more sustainable by minimising energy use, emissions of substances hazardous to health and noise resulting from freight transport. Trial special freight corridors are referred to as “Green Freight Corridors”. These corridors are characterised as having a low negative impact on the environment. Rail and maritime transport are pointed out as especially important modes of transport in this context. One way of increasing the efficiency of transportation is to promote innovative solutions and “best practices”. This applies both to infrastructure, vehicles, load carriers and logistics. Already today there are IT-based systems to improve traffic management and to increase freight transport. For the railway, there are ERTMS and TAF; for maritime transport RIS, SafeSeaNet, VTMIS, AIS and LRIT, while the situation is not so good for road traffic. It is for this reason among others that the Commission wishes to see a continued development of Intelligent Transport Systems (ITS)53 in particular with regard to roads to facilitate interoperability between modes of transport. The development of the European navigation systems such as EGNOS and Galileo is linked to this. Another way of increasing efficiency is to support measures that lead to simplification of administrative routines that facilitate use of transport chains, for
51 Commission of the European Communities (2007): The EU’s freight transport agenda: Boosting the efficiency, integration and sustainability of freight transport in Europe, COM (2007) 606 final, Brussels 52 Commission of the European Communities (2007): The EU’s freight transport agenda: Boosting the efficiency, integration and sustainability of freight transport in Europe, COM (2007) 606 final, Brussels. Commission of the European Communities (2007): Towards a rail network giving priority to freight, COM (2007) 608 final, Brussels. Commission of the European Communities (2007): Communication on a European ports policy, COM (2007) 616 final, Brussels. Commission of the European Communities (2007) The Commission’s staff working paper; Towards a European maritime transport without barriers, SEC (2007) 1351, Brussels. Commission of the European Communities (2007): 1367 The staff working paper on Motorways of the Sea, SEC (2007) 1367, Brussels. 53 See also: Commission of the European Communities (2008): Action plan for the development of intelligent transport systems in Europe, COM (2008) 886 final, Brussels. Commission of the European Communities (2008): Directive of the European Parliament and of the Council laying down the framework for the deployment of Intelligent Transport Systems in the field of road transport and for interfaces with other transport modes, COM (2008) 887 final, Brussels.

SIKA Report 2009:1
59
example, common consignment notes for different modes of transport. A harmonisation of rules along rail corridors should be introduced to facilitate crossing of borders between countries and removal of other physical barriers. Then administrative burden for local maritime transport is particularly burden-some since a ship that transport cargo between two European ports is now automatically classified as international transport. This entails customs clearance and other administrative routines that make maritime transport less competitive. With the aforesaid action plans, the Commission addresses the measures that should be implemented at EU level; measures to benefit transport corridors, to strengthen traffic and freight logistics, simplifications and a focus on quality which is considered to be particularly important when it concerns the international aspect of transport corridors, the increased share of international transport and development of trade with the surrounding world. The Commission also sees that market fragmentation may make it more difficult to introduce new technical solutions unless the EU takes the initiative. Environmental aspects in freight transport are important and require Community undertaking.
Freight logistics and intermodality/co-modality
The party which wishes to move products should be at the centre. In other words, the total goods flows must be placed in a logical context. Logistics should function free of disturbance – from raw material via manufacture and ware-housing to the finished product at the customer. The EU has an important role to create prerequisites to be responsible in an open market for frameworks and rules of play in the form, inter alia, of competition legislation and regulatory frame-works for the individual modes of transport. The Swedish National Committee for Freight Transport54 put forward the following generally prioritised areas in 2004 which should be pursued in the international arena:
• Intermodal transport • Infrastructure • Competition • Environment and safety
There has been great political interest in supporting intermodal transport. The actual development of intermodal transport with detachable load carriers has, however, not lived to these expectations. The reason can be found in a number of obstacles, mainly of an administrative and financial nature. Among the barriers may be mentioned standardisation issues, allocation of capacity on the rail network and issues relating to liability and security. The lack of provisions that cover a number of modes of transport and different regulatory frameworks between modes of transport entail efficiency losses in the form of time-consuming checks along the intermodal chain. This also applies to deficiencies in a harmonised international regulatory framework.
54 Swedish National Committee for Freight Transport (2003): Godstransporter i samverkan; tekniska hinder forskning och utbildning, SOU 2003:39, Stockholm. Swedish National Committee for Freight Transport (2004): Godstransporter; noder och länkar i samspel, SOU 2004:76, Stockholm.

SIKA Report 2009:1
60
As regards the issue of standardisation, it is important that future technological development is based on existing standards for the most common load carriers in Europe, that is 7.82 metre swap bodies, 13.6 metre semi-trailers and 20- and 40-foot containers. A continued development of such load carriers provides the conditions for better capacity use and possibilities for outbound and return journeys of standard modules. Increased use in Europe of modular vehicles with many axles and low medium axle weights, would entail increased opportunities for unit-loaded freight. Freight logistics concerns planning, organisation, handling, inspection and carrying out freight transport in a supply chain. Freight logistics is thus one of the driving forces underlying the EU’s competitiveness and thus an important contributory factor to the new launch of the Lisbon agenda on growth and employment. According to estimates, the logistics industry’s share of GDP amounts to almost 14 per cent.55 In the mid-term review56 of the 2001 White Paper on Community Transport Policy, emphasis is placed on the central importance of freight logistics to guarantee sustainable and competitive mobility in Europe and to contribute to fulfilment of other objectives such as a cleaner environment, secure energy supply and transport security. In June 2006, the European Commission presented a Communication on freight logistics in Europe.57 The subsequent action plan for freight logistics58 is one of a number of political initiatives introduced by the Commission to increase the efficiency and sustainability of EU freight transport.59 A number of measures are presented in the action plan in the short and medium term that are presented below.
e-transport60 and intelligent transport systems (ITS)
Advanced information and communication technologies can contribute towards co-modality by improving infrastructure, traffic and fleet management, facilitating a better tracking and tracing of goods across the transport networks and better connecting businesses and administrations. It shall be possible to track and trace freight regardless of the mode of transport by which it is conveyed. A necessary condition for this is that standard interfaces within the various transport modes are put in place and their interoperability across modes is ensured. Through the
55 Commission of the European Communities (2007): Freight Transport Logistics Action Plan, COM (2007) 607 final, Brussels. 56 Commission of the European Communities (2006): Keep Europe moving- Sustainable mobility for our continent; Mid-term review of the European Commission’s 2001 White Paper on common transport policy, COM (2006) 314 final, Brussels. 57 Commission of the European Communities (2006): Freight Transport Logistics in Europe – the key to sustainable mobility, COM (2006) 336 final, Brussels. 58 The European Commission (2007): Freight Transport Logistics Action Plan, COM (2007) 607 final, Brussels. 59 Commission of the European Communities (2007): The EU’s freight transport agenda: Boosting the efficiency, integration and sustainability of freight transport in Europe, COM (2007) 606 final, Brussels. 60 A vision of a paperless electronic flow of information that combines the flow of freight in a paperless track created through ITS.

SIKA Report 2009:1
61
Commission’s action plan for ITS61, the link to freight logistics is strengthened and facilitated through handling the most important applications for freight logistics there.
Sustainable quality and efficiency in transport chains
During 2006, the Commission urged business sector actors to identify operational, infrastructure-related and administrative bottlenecks, of which almost 500 were noted.62 The Commission intends to continue this survey and attempts to find solutions. Result indicators for freight logistics chains are useful instruments to promote the quality of services. These indicators may also be used to measure the environmental and social consequences. There are already indicators for combined transportation by rail, air and local maritime transport. However, they are deficient in not being part of a common system. The Commission therefore proposes a set of overall indicators that make possible the best possible measure-ment and registration of the situation for freight logistics chains (for example, sustainability and efficiency). A transition to more efficient and cleaner modes of transport can then be promoted and generally improve the logistics procedure. Multimodal goods transport is still rather underused. This may be due to insufficient knowledge about the benefits of alternative modes of transport, on low integration between modes of transport or on additional costs for tran-shipment. However, there may be other reasons for this which are instead related to different groups’ influence on costs and benefits, as well as different preferences.63 The Commission considers that these problems can be handled through an extensive initiative for exchange of good practices and for practical support by use of networks with logistics institutions and through an extended range for “Shortsea Promotion Centres” to include inland transport logistics. The link to efficiency of intermodal terminals, including ports and airports, is, of course, great and crucial for how well logistics can be implemented. The Commission therefore wishes together with industry, to work out a set of benchmarks for terminals, multimode inland terminals as a first step, and to incorporate these in a code of best practice or a recommendation and spread of information on these benchmarks.
Simplification and harmonisation
A simplification and decentralisation of the exchange of freight-related information can considerably reduce the cost of statutory requirements, in particular through use of information and communication technology. This work
61 Commission of the European Communities (2008): Action plan for the development of intelligent transport systems in Europe, COM (2008) 886 final, Brussels. 62 Commission of the European Communities (2007) Commission staff working document. Accompanying document to the Communication from the Commission Freight Transport Logistic Action Plan. Impact Assessment, SEC 1320, Brussels. 63 Banister, D. et al (2007): Making Sustainable Transport Politically and Publicly Acceptable: Lessons from the EU; I Rietveld, P. and Stough, R. (eds): Institutions and sustainable transport, Edward Elgar, Cheltenham. Deakin, E. (2007) Equity and Environmental Justice in Sustainable Transportation: Towards a Research Agenda, I Rietveld, P. and Stough, R. (eds): Institutions and sustainable transport, Edward Elgar, Cheltenham.

SIKA Report 2009:1
62
should further develop the initiatives undertaken as a result of the Commission’s proposed decisions on a paperless environment for the customs and trade.64 The Commission will continue to work on a “European area for maritime transport without barriers” where both the route of the ship and the cargo can be traced in a reliable way. This would make it possible for local maritime transport to make full use of the internal market. Freight transport must now be accompanied by a transport document. Such transport documents are normally specific for the different modes of transport. Multi-modal transport documents exist but are seldom used. The Commission therefore wishes to make a survey of the prerequisites for and added value of introducing a transport document for all freight transportation regardless of mode of transport. The Commission will therefore consider introducing a suitable legislative proposal. The lack of uniform liability provisions for all modes of transport affects the efficiency of multimodal transport negatively. Measures to create a multimodal structure of rules for liability obligation are in process at a global level in the UN Commission for International Trade Law (UNCITRAL). The EU Commission intends to pursue this matter further if no fast progress is made as an alternative for Europe. Closely related are issues concerning protection against and prevention of crime, criminality and intentional criminal actions such as terrorism. Since security has increasingly become an inherent part of the quality of logistics and competitiveness, the Commission wishes to draw up European standards in accordance with existing legislation, international conventions and standards, to facilitate the integration of modes of transport in the logistics chain and to introduce simplified requirements for port access within the framework of work on guidelines and minimum norms for maritime transport and minimum standards for maritime transport and port safety issues. Today, EU legislation contains general limitations on vehicle dimensions and weight in international road transport. There is some freedom of action for dimensions in national traffic. This creates inconsistency for the operators. At the same time, the technical development and changed transport requirements mean that they present rules are called into question (see further in the section of Road Transport below). An adjustment of the rules must, however, take into account the consequences any change of the existing limits may have with regard to road safety, energy efficiency, carbon dioxide emissions, hazardous emissions, the road infrastructure and intermodal transportation, including combined transport. The possible need for stricter criteria for vehicles, vehicle equipment and drivers, and restrictions concerning choice of route should also be evaluated.
64 Commission of the European Communities (2005): Proposal for a decision of the European Parliament and Council on a paperless environment for customs and trade, COM (2005) 609 final, Brussels.

SIKA Report 2009:1
63
Corridors and networks for freight transport within and outside the
EU
Freight corridors, ports and combi terminals
The proposal on a European network for competitive freight transport65 concerns the important issue of achieving an efficient and competitive international rail network which links to the adjustment of TEN-T. This is particularly important since the infrastructure for rail traffic has traditionally been very nationally oriented with a large number of national standards. The proposal to designate special freight corridors and to define a network with strategic terminals is associated with the infrastructure tradition applied by Sweden with development of trunk roads and main railway lines.66 There are a number of conceivable solutions for the designation of the strategic terminals. The first Swedish National Committee for Freight Transport considered that the state has a number of roles in relation to the freight network terminal. Through its role as keeper of the infrastructure for connections to and from the terminals, it was necessary to prioritise the most central hubs of the Swedish freight transport network. It was proposed that the basic infrastructure at a limited number of terminals should be provided in a neutral way by the state while the terminal operation should be taken care of by terminal companies.67 The Railway Commission anticipated a development where the insufficient profitability of small terminals would automatically lead to a concentration to a smaller number of larger terminals.68 This conclusion indicates that, in the right conditions, market conditions can achieve the terminal structure desired by the Commission. However, since the freedom of action of market forces differs among the EU’s Member States, SIKA considers that the market solution recommended by the Railway Commission will not function in a European perspective. SIKA therefore takes a cautiously positive attitude to a more active role for the EU in designation of freight corridors with strategic terminals. SIKA proposes in accordance with the Swedish National Committee for Freight Transport69 that the EU should set up rules for the working of a combi terminal. The terminal principals will then have to decide whether they want to participate in the strategic combi terminal network and comply with the conditions attached. SIKA considers that it is appropriate for a prioritisation of the designated freight corridors if this takes place in the form of, for example, investments in increased
65 Commission of the European Communities (2008): Proposal to the European Parliament and Council for a regulation concerning a European rail network for competitive freight, COM (2008) 852 final, Brussels. 66 Kaijser, A. (1994): I fädrens spår; den Swedish infrastrukturens historiska utveckling och framtida utmaningar, Stockholm. 67 Swedish National Committee for Freight Transport (2001): Godstransporter för tillväxt; en hållbar strategi; SOU 2001:61, Stockholm. 68 Järnvägsutredningen (2003): Järnväg för resenärer och gods, SOU 2003:104, Stockholm. 69 Swedish National Committee for Freight Transport (2003): Godstransporter i samverkan; tekniska hinder forskning och utbildning, SOU 2003:39, Stockholm. Swedish National Committee for Freight Transport (2004): Godstransporter; noder och länkar i samspel, SOU 2004:76, Stockholm.
SIKA Report 2009:1
64
carrying capacity and operation and maintenance in order to increase capacity. However, as regards prioritisation of train paths, SIKA is more doubtful about the proposal. SIKA considers that this priority should be made in accordance with a socio-economic assessment of the usefulness of transportation. The socio-economic evaluation should be similar within international freight corridors. International transport should, however, be given a higher value than national with the justification of safeguarding the international trade and competitiveness of business. It is important that the EU adopts a systemic perspective when designating freight corridors for an efficient transport system. Given the current proposal, there is a risk that the individual Member States will in the first place give priority to nationally important corridors, which can lead to sub-optimisation from a European perspective. Through a European system perspective, the national business sector also benefits since the single market will become more competitive.
Green corridors
Efficient freight transport is a necessary prerequisite for growth and welfare. At the same time, the negative effects on transport on health, the climate and the environment must be reduced. This challenge has contributed to freight transport and logistics being high up on the socio-political agenda and increased taking of responsibility by the transport sector for efficient transport solutions. A good example of this in Sweden is the work pursued in Logistikforum, where the business sector, research and politics meet and together tackle common challenges. At the European level, a greener transport policy is now being developed which is contained both in the Freight Action Plan, the ITS Action Plan and the Commission’s Green Paper on TEN-T. These advocate the concept of Green Corridors. The concept of green freight corridors is a further development of the corridor concept but with an explicit goal of integrating environmental, safety and security issues in the design, operation and maintenance of the TEN network. Green transport corridors will reflect an integrated transport concept in which local maritime transport, rail transport, transport on inland waterways and road transport complement one another to make it possible to choose environmentally friendly transport. These corridors will be equipped with suitable transhipment facilities at strategic locations (for example, coastal ports, inland ports, marshalling yards and other relevant logistics terminals and facilities) and with distribution depots, to start with for biofuels and subsequently for other forms of green fuels. The Commission conceives of a reinforcement of the green corridors within TEN-T and within the framework of the Marco-Polo priorities, develop-ment of a freight-oriented railway network, maritime motorways and implement-ation of the Naiades project for transport on inland waterways.70 A fair and non-discriminatory access to corridors and transhipment facilities is a requirement for co-modality and must be ensured.
70 Commission of the European Communities (2007): Freight Transport Logistics Action Plan, COM (2007) 607 final, Brussels.

SIKA Report 2009:1
65
In the Nordic countries, high-class logistics take place including the issue of sustainability. On this basis, Logistikforum has taken an initiative to make possible Green Corridors in which industry and politics work together with the following objectives:
• Demonstrate efficient transport solutions by joint efforts to upgrade freight transport investments in process
• Promote the development of Green Corridors in EU transport policy • Establish international partnerships that can lead to Green Corridors to and
from the Nordic countries.
The initiative works with the concept of Green Corridors and the requirements
that a corridor of this kind should meet. A green transport corridor is characterised
by: • sustainable logistics solutions, i.e. solutions with documented reduced
environmental and climate effect, high security, high quality and efficiency
• integrated logistics arrangements with an optimal use of modes of transport
• harmonised regulatory frameworks open to all actors • concentration of national and international freight traffic on relatively
long transport routes • Efficient and strategically located reloading points and adapted, supportive
and sustainable infrastructure • platform for development and demonstration of innovative logistics
solutions (information systems, collaboration models and technology)
Strategic ports (port regions) and combi terminals
Well functioning ports and combi terminals are essential to be able to make full use of the potential of corridors, green freight corridors and the possibilities of intermodality and co-modality. In order to achieve a reasonable use of a large capacity for generously dimensioned parking and loading and unloading, frequent traffic is required, which can only be maintained if the freight flows are sufficiently large. However, it is not self-evident that potential economies of scale in different transport links can really be made full use of in all parts of the EU. As shown in Chapter 4, the flows in large parts of the EU are relatively limited in a broader European perspective. Concentrating the flows means at the same time some sacrifices, for example, in the form of longer feeder transportation by land and sea, waiting time for the freight pending access to large transport units, the frequency of which must be adapted to the flow of freight, costs for reloading and probably also some loss of flexibility in the freight flow. The Commission presented in the communication on European ports policy71 an action plan with a view to creating an efficient EU ports system. Unfortunately, the action plan is limited as regards specific designation of ports but contains largely guidelines and declarations of intent. It is instead left to the respective country to take responsibility for the strategically important ports at the national
71 Commission of the European Communities (2007): Communication on a European ports policy, COM (2007) 616 final, Brussels.

SIKA Report 2009:1
66
and regional level. SIKA considers that this is in direct contradiction to the extensive packages of measures and declarations of intent presented for, for example, the railway system. It would therefore have been advantageous with a more active policy for a system of ports so as to create good prerequisites for maritime transport as an active part of the intermodal transport chains.
The Green Paper on mobility in cities
The Green Paper was decided on in September 2007. There has been extensive public consultation both before and after the decision with the general public and the actors in the transport sector. The Green Paper72 deals with urban transport and takes up, among other things, the cities’ current and expected future transport problems, general development needs and the role of the EU in this context. The Green Paper is divided into five thematic areas (challenges):
• Towards cities in which traffic moves freely • Towards greener cities • Towards smarter urban transport • Towards accessible urban transport • Towards safe urban transport
Alternative solutions are discussed for each of these thematic areas. The Green Paper also includes proposals on improved knowledge build-up, exchange of information, common EU statistics and data collection. The Green Paper shall be accompanied by a more concrete action plan. The latest official decision is that “An Action Plan on urban mobility will follow and concrete actions will be launched from 2009 onwards”.73 An indication of what the action plan may possibly contain is included in a recently published document including a collection of examples from the whole of the EU area. These examples have been chosen to be able to show “the future potential benefits of the Green Paper in practice”.74 These examples are reported per country, and, for Sweden it is reported how the City of Stockholm works on increasing the proportion of environmental cars in its activities. A reflection of the Green Paper has been published in the European Journal of Transport and Infrastructure Research, by researcher Dominic Stead75. He considers that the Green Paper is not particularly clear about the issue of the future role of the EU for urban transport. Stead has studied referral responses to the Green Paper and provides the following description: The importance of complying with the “principle of subsidiarity” is taken up by many parties, including the Swedish Riksdag’s committee on transport and communications. They consider that it is very important that this is applied and
72 Commission of the European Communities (2007): Green Paper; Towards a new culture for urban mobility, COM (2007) 551 final, Brussels. 73 http://ec.europa.eu/transport/urban/urban_mobility/urban_mobility_en.htm,19 December 2008 74http://ec.europa.eu/transport/urban/urban_mobility/green_paper/doc/urban_mobility_2007_country_sheets_eu27.pdf 75 Stead, D. (2007): The European Green Paper on Urban Mobility, EJTIR, 7, no. 4 p. 353-358. Can be downloaded at http://www.ejtir.tbm.tudelft.nl/issues/2007_04/pdf/2007_04_06.pdf

SIKA Report 2009:1
67
that legislation at EU level is not necessary in this area. Instead, it is in the first place the local and regional actors (for example, Swedish municipalities) which should in the first place have the right of decision on municipal transport. The transport and communications committee considers that the role of the EU should primarily be to stimulate the spread of knowledge and experience, research, networks among countries and actors. Stead also calls into question the potential of “good examples” and means that differences in systems of rules, organisation etc. are generally underestimated (or even disregarded). It is important to understand these differences in context to be able to transfer knowledge and examples between countries and regions. Just “copying” good examples does not work well. It is particularly difficult with policy transfer from west European countries to Central or Eastern European countries76. The psychological dimension is important then. The recipient country must set the agenda and flexibility is crucial. This works best on a small scale in work with practical objectives. If this is correct, it is an important criticism where a large part of the Green Paper’s concrete “expressions” can be expected to consist of activities for spreading knowledge, experiences and good examples. Figure 5.5 shows how large volumes of passenger transport performance that takes place in different parts of Sweden are allocated to different modes of transport and average journey distance. Only a smaller part of passenger transport performance is done by residents in sparsely populated areas, while the length of journey per day by car is longest here (35.1 km). The big city regions account for a considerable volume, with relatively long journey lengths by public transport. The aggregate volume is, however, less than transport performance performed by residents of the H-region Major cities. The large passenger performance carried out in the cities is one reason for the EU to become involved in urban transport. Problems with congestion, noise and other environmental problems are largest in metropolitan areas although there is also a great potential to find solutions which the EU can support through an action plan in this sphere.
76 Stead, D. et al (2008): Urban Transport Policy Transfer in Central and Eastern Europe, disP 172, 1/2008, p. 62-73.

SIKA Report 2009:1
68
Figure 5.5: Average number of kilometres with different modes of transport per
person and day (Monday-Sunday) excluding air in different H-regions
(categorisation used by Statistics Sweden, among others).
NDPA: Northern densely populated area
NSPA: Northern sparsely populated area
Source: SIKA report 2008:10
Conclusions
• An efficient transport system requires a systemic perspective. • The EU should designate specially prioritised freight corridors, ports and
terminals and define their status. • Green corridors provide possibilities to work together on efficient and
sustainable transport in a structured way • The EU should make decisions on an overarching framework on urban
transport issues, although decisions on measures should be made at the local level in accordance with the principle of subsidiarity.
NSPA
4.51.5
35.1
481
481
NDPA
6.41.7
29.4
447
928
Southern middle area
5.61.8
32.9
1403
2331
Large municipalities
5.7
2.0
30.8
2986
5317
Malmö
8.1
2.2
22.7
481
5798
Gothen- burg
6.81.8
25.6
759
6557
Stockholm
9.2
2.0
22.1
1662
8219
0
10 km
20 km
30 km
40 km
50 km
Population 6-84 år, (thousand)
Car Walking/cykling
Public transport
Other means of transport

SIKA Report 2009:1
69
5.3 Transportation – a perspective based on specific
modes of transport
Railway
The European rail policy in recent decades has been characterised by attempts to introduce competition in the rail market by separating infrastructure and operation through a gradual opening of the market to new operators, introduction of rules for allocation of train paths and pricing of use of the infrastructure under the supervision of an independent body. Through its communication of 1989,77 the Commission presented a policy based on a separation of the infrastructure from operation and an attempt to attract new operators to compete in the railway market. This was followed by a White Paper in 199678. The separation of the infra-structure and operations was to be carried out in separate companies, open access for all freight and international passenger traffic and creation of “freight motor-ways” with “a one stop shop” to increase access to the track infrastructure. Through a supplement to Directive 91/440, access to the infrastructure increased for national traffic which was a step towards opening of the freight transport market. The freight transport market was formally opened in 2007, even if it is only in theory in many Member States to date. The opening of the market is closely linked with pricing policy. The Commission has wanted for a long time that pricing policy should lead to efficiency, which assumes marginal cost pricing.79 Despite this, pricing is deficient according to these principles. This problem does not only apply to the rail market, however, but also for other modes of transport. An introduction of the Eurovignette directive would, for example, mean that average cost pricing was used instead of marginal cost pricing in use of the infrastructure for heavy road traffic. Freight transport increased by 2.8 per cent per year between 1995 and 2005, which was an increase that exceeded the increase in GDP during the same period. The market share of rail transport compared with other modes of transport has, however, decreased continuously and has stayed at around 10 per cent since 2005 (EU-25 in tkm).80 The challenges for the railway in the future concern primarily operational safety, available capacity, information management, average speed and flexibility. After opening up for competition for freight transport on the
77 Commission of the European Communities (1989): Communication on a Community Railway Policy, COM (89) 564 Final, Brussels. 78 Commission of the European Communities (1996): White paper; a strategy for revitalising the Community´s railways, COM (96) 421 Final, Brussels. 79 Commission of the European Communities (1995): Green Paper; Towards Fair and Efficient Pricing in Transport, COM (1995) 691 final, Brussels. Commission of the European Communities (1998): Fair Payment for Infrastructure Use: A Phased Approach to a Common Transport Infrastructure Charging Framework in the EU, COM (1998) 466 final, Brussels. Commission of the European Communities (2001): White Paper; European transport policy for 2010, COM (2001) 370 final, Brussels. 80 Commission of the European Communities (2007): Towards a rail network giving priority to freight, COM (2007) 608 final, Brussels.

SIKA Report 2009:1
70
railway in 2007, the railway has developed positively. This is explained not primarily due to the railway having become markedly more efficient but as a result of increased trade, congestion on the road system, the high oil price, environmental problems and the railway’s natural comparative advantages for container and long-distance transport, which is continuing to increase.81 The establishment of a railway network within the framework of TEN-T is good. The TEN-T funds have granted funding to a number of projects and the Commission promotes the expansion of the European Railway Traffic Management System ERTMS82 which will eventually replace the existing national systems. The Community also contributes a considerable financial support to the rail sector through cohesion policy and in the process of implement-ation of the internal market, in accordance with the treaty, and in the objectives for economic growth and employment. Despite opening of the market and the above- mentioned initiatives, the rail market is still characterised by deficiencies. The Member States must complete the implementation of the European railway legislation. Progress in the matter of operating compatibility is slow and problems remain when crossing borders. Consequently, some important problems also remain as regards the quality of rail transport. The designation and implementation of the railway network assumes that measures are undertaken, both on the part of the infrastructure managers, in the Member States and within the Community. The Commission’s concept is that every corridor should have a structure/organisation with responsibility for, among other things, management, control of infrastructure capacity, co-ordinated management of infrastructure capacity which favours freight transport to a greater extent than at present, principal prioritisation of freight transport in the event of disruptions, improved access to supplementary railway services (in particular, terminals and marshalling yards). The Commission considers that the current infrastructure management is too fragmented, too nationally controlled and that the national investment decisions do not take international traffic into consider-ation to a sufficient extent. The concept of corridor structures on the part of the Commission is therefore, under the supervision of the Member States and the infrastructure managers, to make it possible to co-ordinate the operational infra-structure management in a much more far reaching way than at present, as regards, among other things, pricing, train traffic and determination of investment needs. More specifically, the Commission intends to propose a legal definition of a freight-oriented corridor structure which will, above all, cover the foremost provisions for this type of corridor. Every Member State and the infrastructure managers are urged to establish freight transport corridors. Every Member State must participate in at least one corridor structure at the latest by 2012. Moreover, financing possibilities within existing programmes must be reviewed in order, if possible, to provide funding for the activities in the corridor structures. The complementary rail services, in particular terminals and marshalling yards, are essential. It is therefore appropriate to complete the measures for co-ordination and improvement of use of the freight transport corridors with the aid of
81 Ibid 82 European Rail Traffic Management System. A common system for control, command signalling.

SIKA Report 2009:1
71
initiatives that promote development of the capacity of the terminals and marshalling yards. This requires increased investments in the capacity of the terminals and marshalling yards and better and more convenient insight and access for rail operators that use the corridors.
Aviation
The aviation market has also been opened up for competition. The first package was approved in 1987 and was mainly focused on increasing flexibility in already existing bilateral air agreements. The second package was approved in 1990, entailing further deregulation. A certain portion of capacity was to be shared and checks introduced for market access. The state’s role as price-setter for inter-national flights within the EU was largely abolished. The year after third package was initiated which led in 1997 to the adoption of a regulatory framework similar to that in the United States. Discrimination against other airlines was prohibited and the capacity sharing system removed for flights between Member States and a possibility for cabotage introduced for flights between Member States. In recent years, the Commission has focused on relations with third countries. In 1996, the Commission was given the right to negotiate for all Member States in certain aviation-related issues and through the Member States’ adoption of the bilateral agreement on Open Skies with the United States, the Commission strengthened its ability to negotiated with the United States on behalf of the Member States on a common aviation market over the Atlantic. Air traffic management is still a national concern even if it is co-ordinated under EUROCONTROL. Different technical solutions exist as well as a large number of air traffic management centres. With “EU’s Single European Sky”, capacity shall increase and congestion decrease. The expansion of the EU has created additional challenges for the EU. The new Member States generally have smaller airlines, small main airports and are far away from the EU’s financial centres. Their airline companies have also been protected from competition, in some cases the state is still involved. One problem which these airline companies are confronted by is the limited access to slot times to the rest of Europe’s large hub airports. On the other hand, there is relatively good spare capacity at these airports. The distribution and allocation of infra-structure such as flight management and slot times naturally affects the ability of the airline companies to pursue their operations. The traditional method of allocating slot times has historically been administrative and the final distribution has taken place on a second-hand market. This method has been criticised for being protectionist and favouring large, already established airline companies. An alternative distribution would be to define ownership rights or permit full trading with slots.
Maritime transport
In the Communications on an integrated maritime transport policy83 and the Communication on Strategic goals and recommendations for the EU’s maritime
83 Commission of the European Communities (2007): An integrated maritime transport policy for the European Union, COM (2007) 575 final, Brussels.

SIKA Report 2009:1
72
transport policy until 201884, the Commission sets the agenda for the EU’s future maritime transport policy. To improve the efficiency of maritime transport in Europe and ensure the long-term competitiveness of maritime transport, the Commission proposes a European maritime transport area without barriers through a number of legal provisions, an overarching maritime transport strategy to 2018, a port policy that takes into consideration the different functions of the ports and the European logistics situation as a whole, a proposal to reduce air pollution from ships in ports by ensuring that the electricity supply from the land is not disadvantaged taxwise, and issuing guidelines for application of parts of the Community environmental legislation which are important for the development of the ports. The Commission will also encourage the formation of sector-overarching clusters and a regional competence centres for maritime issues as well as promoting a European network of maritime clusters. It is also proposed that there should be a higher degree of sea supervision through intensified cooperation between and within the coastguard services of the Member States and other concerned authorities. The Commission envisions an integrated network of tracking systems for ships and e-navigation in European coastal waters and the open sea, which includes satellite monitoring and long-range identi-fication and tracking of ships (LRIT). Measures to ensure operational compati-bility are necessary. Even if there is cause for concern for air pollution and carbon dioxide emissions from maritime transport, it is still more energy efficient than road traffic. The Commission therefore considers that an integrated maritime transport policy which is strongly focused on promoting safe maritime transport is motivated. This would also reduce congestion on the roads. The current EU programmes (TEN-T and Marco Polo) will therefore continue to support the creation of Motorways of the Sea and local maritime transport networks. In this context, it may be appropriate for Sweden to emphasise that funding should also be available for non-cross-border projects where this can be justified. EU’s action plan on the future ports policy85 includes some guidelines and statements of intent. However, it mostly concerns it is not desired to see a co-ordinated initiative or designation at the European level but wishes to leave the introduction and implementation to the national and regional level, since the Commission considers that it is there that the situation of the ports is best known. This attitude is somewhat contrary to the Commission’s position with regard to the organisation of the railways and goods corridors in a systemic perspective for a whole and common freight transport network. For an integrated and efficient network to function well, it is probable that it cannot be left to each individual country to take responsibility for its port or ports. There is an evident risk of suboptimisation of the Community’s overall resources.
84 Commission of the European Communities (2009): Strategic goals and recommendations for the EU’s maritime transport policy until 2018, COM (2009) 8 final, Brussels. 85 Commission of the European Communities (2007): Communication on a European ports policy, COM (2007) 616 final, Brussels.
SIKA Report 2009:1
73
Europe has over 1,200 trading ports spread out along 100,000 km of coast. There are moreover a large number of ports along the 36,000 km of inland waterways in Europe. The ports are key points in the transport network and handle 90 per cent of the EU’s international trade. 40 per cent of the freight transport performance passes through these ports.86 However, trade is limited to a few larger ports. Around 30 per cent of the traffic in Europe in 2005 passed through the ports of Rotterdam, Antwerp and Hamburg. The Commission sees challenges for the future. One important change, which is shown by the development of container transport, is that the ports have become more efficient, faster, safer and cleaner. Great adaptability is required of the ports and the cities where they are located as regards acquisition and management of land and technological and social issues. The necessary use of IT and navigation and communications technology requires, however, adaptation and training for continued good future prospects for productivity and new employment oppor-tunities. The development and management of the ports must be characterised by openness and competition. To ensure increased demand for port capacity, the efficiency and productivity of the ports should be improved as regards production or movements per hectare of existing terminal space and over the whole access routes. It is considered that a number of problems could be solved by new port equipment and timetabled arrival at the terminals of lorries, trains and barges as well as an integrated management of the transport chain. Moreover, alternative transport routes should be investigated as a way of achieving a more intensive use of existing ports, and in this way to take the load off certain ports where there is a high degree of congestion at present. Port services can be developed and greater freedom for self-handling should be permitted. Even if it cannot be said that there is competition between the ports on every conceivable occasion, competition between some of them – and competition within the ports – may be considerable. The rules of play must therefore be the same for everybody. In this respect, the issue of public financing of ports must be resolved. Furthermore, information about public funds to ports should be reported openly and apply to all trade ports regardless of annual turnover. Port charges are unclearly set at present. The Commission considers that there must be more clarity on the different items that compose port dues and that there must be more transparency about relevant costs. Under EU legislation, the customs shall monitor maritime transport between the Member States, since the departure and arrival ports situated in the EU are external borders where both transport from third countries and Community-declared transport arrive. Shipping remains at a disadvantage compared to other means of transport since a vessel travelling between two EU ports is subject to more complex and time-consuming procedure than a lorry. This may be because a real internal market for maritime transport in Europe does not yet exist. Efficiency gains can be created by making the administrative procedures as simple and
86 Commission of the European Communities (2006): Keep Europe moving – Sustainable mobility for our continent; Mid-term review of the EU Commission’s White Paper of 2001 on Common Transport Policy, COM (2006) 314 final, Brussels.

SIKA Report 2009:1
74
uniform as possible. The Commission has therefore proposed that paperless procedures should be created for customs and trade, with a “single window” for the submission of data.
Road transport
The kilometre tax and the Eurovignette for road transport are dealt with in more detail in section 5.5. However, there are some other proposals for road transport on the agenda to be discussed, such as vehicle dimensions, vehicle weight and modular vehicles. At present, EU legislation contains general limitations on vehicle dimensions and weight in international road traffic. There is some freedom of action in national traffic. This creates inconsistency for the operators. At the same time, the development of technology and changed transport requirements have led the existing rules to be called into question. An adjustment of the rules must, however, take into account the consequences of any change of the existing limits with regard to road safety, energy efficiency, carbon dioxide efficiency, hazardous emissions, road infrastructure and intermodal transport, including combined transport. On Sweden’s entry into the EU in 1995, it was decided that Sweden could continue to use vehicles that were larger than the maximum length of EU vehicles (18.75 metres) and the maximum total weight (40 tonnes) in Sweden. Larger vehicles with a maximum of 25.25 metres and 60 tonnes are used in national traffic. At the same time, it is possible for hauliers from other countries to use modular systems87. With the aid of the modular system, it is possible to create vehicles of 18.75 metres and 25.25 metres. The corresponding exemptions apply to Finland. When EU Directive 96/53 was adopted, it was feared that there would be competition-distorting effects if certain hauliers were able to use larger vehicles. A statement was therefore included in the Council of Ministers minutes that means that all of the existing Member States except Sweden and Finland undertake not to introduce or expand modular systems “generally” within their territory before the Commission has produced a report concerning the implications of the exemption and with an assessment of whether it would be justified to introduce this system in other Member States besides Sweden and Finland. The Commission has not yet produced any such report. However, the system has spread in the form of trial activity in, among others, the Netherlands, Germany, Denmark and Norway. In some countries, 44-tonne lorries have been permitted generally or in connection with combi traffic.
87 Vehicles consisting of the load carriers, “modules”, which are used in most other EU Member States. Two Swedish modular vehicles can then be connected to three shorter vehicle combinations including a 7.82 metre lorry with a 7.82m long trailer and two towing vehicles each with a semi-trailer of 13.6 metres.

SIKA Report 2009:1
75
In a report from VTI88, it is investigated which effects the long lorries have for the transport system in Sweden. A large part of the freight transport in Sweden is performed with vehicles that exceed the EU norm. Statistics show that 64 per cent of the tonnage (tonnes) and 74 per cent of the transport performance (tonne kilometres) takes place with vehicles that weigh over 40 tonne and/or have seven axles or more. If the same freight quantity were to be transported by shorter and lighter lorries, this would mean that transport performance per lorry would decrease while the number of lorries needed would increase. The cost per lorry is expected to decrease by 5 to 12 per cent within the different studied product groups and the number of lorries increases by 35 to 50 per cent. On average, it is assumed that 1.37 lorries of the maximum EU size would be required to replace a lorry of the maximum Swedish size. The cost of lorry transport is expected to rise by 24 per cent. The results from two scenarios, B) where no transfer to railway is possible and C) where a transfer is possible (Table 5.1), shows that it is not socio-economically profitable to use shorter and lighter vehicles in Sweden. However, there are individual positive items, for example, the effect on carbon dioxide emissions and other emissions is positive in scenario C where a transfer to the railway is possible. Table 5.1 Socio-economic costs and benefits (2001 prices). Minus signs indicate a
deterioration and plus signs an improvement for society.
Scenario B SEKm/year
Scenario C SEKm/year
Transport cost - 7 525 - 3 147
Of which changed tax + 211 - 304
Road wear + 140 + 201
Railway wear 0 - 83
Road safety - 491 - 291
Time lag - 50 - 34
Carbon dioxide - 363 + 159
Other substances - 220 + 69
Noise (road) - 690 - 390
Noise (railway) 0 - 30
Tax effects + 63 - 91 Total - 8 925 - 3 941
Source: VTI report 605 (2008)
At the European level, there may, based on these results, be reason to expand the length and weight of lorries according to the Swedish model. However, it is not certain that the Swedish findings can be automatically applied to other countries or the whole of Europe. There may be concern that an increase would put the European railways at a competitive disadvantage. The areas of competition between different modes of transport should then be included in the picture. The question of cabotage89 is important and both benefits and disadvantages are presented. The main argument for cabotage is increased competition and
88 VTI (2008): Långa och tunga lastbilars effekter på transportsystemet. Redovisning av ett regeringsuppdrag, VTI rapport 605, Linköping. 89 Based on Article 71.1 of the EU treaty, the EC regulations provide the following definition of cabotage: Any road haulage carrier for hire or reward who is a holder of the Community

SIKA Report 2009:1
76
efficiency. Disadvantages are that abuse can lead to competition being distorted. The problem concerns to a great extent the definition of “temporary”. A clearer definition of the term “temporary” may have different effects from point of view of competition on different market segments in the Member States. A narrower interpretation of the concept “temporary” in connection with cabotage can mean that, from the point of view of the transport purchasers, we do not have competition in the market segments where more competition would be desirable, in order to have more efficient transport at a lower price. High transport costs mean higher prices through the whole chain of value which in the final analysis would also mean higher prices for the end consumer and less competitiveness for Swedish companies for their products in the world market A narrow interpretation can also entail that transport companies from other Member States do not take cabotage commissions and thus unnecessarily drive long distances on national roads without a load. This is bad from an environmental, corporate and thus socio-economic point of view.90 In May 2007, the Commission presented a proposal on access to the freight transport market.91 Article 8 deals with the issue of cabotage and it is proposed that transport undertakings may perform up to three cabotage transport commissions after an international transport as soon as the freight transported on the outbound journey has been delivered. The final cabotage transport shall take place within seven days. Opinions vary within the industry92 on the Commission’s proposal, both as regards application and whether the proposal is compatible with Article 50.3 of the Treaty of Rome on free provision of services and on the definition of ”temporary”. The Commission writes in its interpretative communication “Obviously a clear distinction needs to be drawn between an activity associated with the freedom to provide a service, because it is exercised on a temporary basis, and an activity associated with the right of establishment, when it is exercised on a permanent basis. Under the provisions of the Treaty on freedom to provide services and on the right of establishment, economic operators must respect one of these two basic freedoms under Community law; one begins where the other leaves off. Consequently, national regulations which limit, in one way or another, the provision of a service oblige the operator to take up residence at the
authorisation provided for in Regulation 881/927EEC, shall be entitled to operate on a temporary basis national road haulage services in another Member State without having a registered office or other establishment therein. 90 Vägverket (2005): Förslag till svensk tillämpning av begreppet ”Tillfällig” vid vägcabotage, PM version 2.0, 2005-09-30 91 Commission of the European Communities (2007): Proposal to the European Parliament and the Council on common rules for access to the international road haulage market (recast), COM (2007) 265 final, Brussels. 92 See, for example, International Road Transport Unions (IRU) IRU position 31 September 2007 http://www.iru.org/index/cms-filesystem-action?file=en_Resolutions_Market%20access%20Access%20to%20the%20profession/07_IRU_position_regulationMarket.E.pdf and the Swedish Association of Road Haulage Companies and the Swedish Transport Workers Union’s joint submission to the Ministry of Enterprise, Energy and Communications on 12 June 2007t http://www.akeri.se/files/bilder/sa/filer/SA-TRSPbrev_20070612.pdf

SIKA Report 2009:1
77
end of the limited period, thereby interfering with the basic right of freedom to provide services. 93 In practice, it is not so easy to clearly state from which moment an activity ceases to be temporary and becomes permanent. However, this is necessary, since the economic actors are entitled to know how much time they have to perform cabotage commissions and the Member States have a right to protect their market against service-providers who engage in permanent activity under the appearance of temporary activity, but without being subject to the host country’s legislation on establishment. SIKA shares the Swedish Road Administration’s view94 of the problem with cabotage. Rules in other countries can control vehicles and drives who are active in another country by national regulatory frameworks from their home country, with regard, for example, to the drivers’ authorisation and the good conduct of companies. In this way, different conditions are created for national and foreign companies. A further problem is that supervision and control are hindered. This then concerns the conditions under which and the time during which it is permitted to drive according to parts of the driver’s own regulatory framework in another country’s domestic transport. It should be the highest priority for the Swedish Presidency to achieve an agreement with the European Parliament, taking into account such considerations, on access to the market for international road transport.
Conclusions
• EU’s deregulation decisions of the rail market should be implemented nationally.
• Harmonisation of technical standards (load carriers, vehicle lengths etc,), rules and taxes should be improved.
• Work to improve efficiency by development and use of ITS and rule changes to strengthen the role of logistics for co-modality should be improved.
• The financial instruments to increase the efficiency of the transport system should be developed.
5.4 The Trans-European Transport Network (TEN-T)
It has been noted in this report that good accessibility is a necessary but not sufficient condition to create good regional development and economic growth. A transport system that is fit for its purpose is one of the pieces of the jigsaw to achieve good accessibility. The TransEuropean Transport Network (TEN-T) is the EU’s clearest contribution to this transport system, even though the major part of
93 Commission of the European Communities (2004): On the temporary nature of road cabotage in the movement of freight, COM (2004) XXX, Brussels. 94 Swedish Road Administration (2005) Förslag till svensk tillämpning av begreppet ”Tillfällig” vid vägcabotage. PM version 2.0, 30 September 2005.

SIKA Report 2009:1
78
the responsibility for both construction and funding is borne by the individual Member States.
Towards a European network
The Trans-European network should be used to give prominence to the European perspective above the national, which is something more than a simple aggregation of the transport plans of the individual Member States. This is partly about removing the traces from the period when expansion of the transport networks was a manifestation of the attempts by the national state to obtain control over its territory. The expansion of the railway network is the clearest example of this. The cross-border railway links have been few and awkward to use since different states have used different technical standards. It is also about infrastructure planning in the individual Member States giving priority in the first place to national interests. In, for example, Sweden investments are optimised on the basis of what is socio-economically efficient. The investments that are profitable depend, however, to large extent on the territory on which calculations are made. The outcome would be different if, for example, optimisation was made within the Nordic countries instead of only within separate Nordic countries. It would probably be the case that fewer roads would be built in Norway since construction costs are high there due to the topography with high mountains and deep fjords. Traffic between northern and southern Norway would instead take place on roads through Sweden. In a similar way, the transport systems would look different depending on whether they are optimised on the basis of a EU level or on the basis of individual Member States. The consequence is that the EU must safeguard and take responsibility for the European perspective since the Union otherwise risks having 27 national transport systems which are weakly linked with one another. There is a risk that no one takes responsibility for the whole of the European transport system. It is from this perspective that TEN-T has an important role to play together with other initiatives from the EU. Chapter 4 deals with the exports of the Baltic Sea countries (Figure 4.10) and it was evident how relatively small the flows were to Russia but also between other countries with the exception of Germany and Poland. There is a great potential here to develop trade and prosperity in the area provided that the EU can contribute with initiatives to develop this “gap”. Maritime transport plays a key role but also other modes of transport to and from ports and further out into the EU and the surrounding world are important. All transportation cannot take place via TEN-T, but the Member States must be responsible for linking the European network to the national networks. In this context, the work of producing a Baltic Sea strategy can contribute jigsaw puzzle pieces that lead to a more integrated Baltic Sea Region. This type of co-operation can also spread to the rest of the EU. One advantage of this type of cooperation is that the more limited geographical area makes it possible to benefit from more local knowledge. Another advantage is the possibility of integrating transport policy with other policy areas such as environmental and territorial development.

SIKA Report 2009:1
79
The deficiency of, inter alia, statistics on cross-border flows of people and freight constitute a difficulty in planning cross-border projects. Improving this type of supporting material is primarily an issue for the responsible national statistical authorities and Eurostat. Inspiration and good examples of how such cross-border supporting material for planning can be formed can be obtained from Interreg projects carried out.
Funding and extent of TEN
Insufficient funding of the TEN projects by the EU is pointed out as one of the foremost explanations for the low rate of expansion.95 The Member States which are expected to take the greatest responsibility for funding TEN-T chose in many cases to prioritise nationally important projects. Work on realising TEN-T has been accelerated, however, by a mustering of strength among 30 prioritised TEN projects which also received financial assistance from the EU (Figure 5.6). The Commission has produced a Green Paper on the future guidelines for TEN. This relates to the central question of the direction and extent of TEN-T. The Commission considers that there are three structural choices in the design of TEN-T.96
1. The current structure with two levels; an overarching network and prioritised projects
2. Only one level with prioritised projects 3. Two levels; an overarching network and a “trunk network” which consists
of a geographical pillar which geographically defines the network but also a term-based pillar which serves as the basis for implementation of projects.
According to the Commission, the advantage of the first alternative is that the overarching network with overview plans and traffic management systems according to the current TEN-T guidelines is an important tool for implementation of different transport policy objectives such as safety and operating compatibility. Another advantage is that the prioritised projects are a visible part with measurable results and clear effects for the inner market, cohesion and sustainable transport. The disadvantage is that there is no opportunity at the Community level to ensure that projects in the overarching part are performed fully and within the specified time. Responsibility for funding and planning of these projects rests with the individual Member States. The disadvantage of indicating a number of prioritised projects is that the Union will not obtain an integrated network which is optimised on the basis of the needs of the EU. The benefits of only focusing on a number of prioritised projects in accordance with the second proposal are, according to the Commission, that community instruments can be concentrated on the highest priority areas which increases the possibilities of the prioritised projects being completed within the stipulated time.
95 Spiekermann, K. and Wegener, M. (2007): Ex ante evaluation of the TEN-T multi-annual programme 2007-2013, Ecorys, Rotterdam. 96 Commission of the European Communities (2009): The Trans-European Transport Network (TEN-T): A policy review. Towards a better integrated Transeuropean Transport Network at the service of the common transport policy, COM (2009) 44 final, Brussels.
SIKA Report 2009:1
80
This entails that Community policy will be very visible and credible. One example of projects approaching completion is the high speed trains that link Paris, Brussels, Cologne/Frankfurt, Amsterdam and London. This project entails a breakthrough for international train traffic that provides citizens and business travellers with opportunities to see the benefits of free mobility in Europe. The disadvantage is that there will not be any integrated network throughout the Union but only specific measures on particular routes.

SIKA Report 2009:1
81
Figure 5.6: Prioritised TEN-T projects and how far they have come
Source: TEN-T. Implementation of the Priority Project. Progress Report. 2008.

SIKA Report 2009:1
82
The advantages and disadvantages of the overarching network according to the third proposal are the same as for the first proposal. The disadvantage of a “trunk network” are that it adds uncertain factors to the TEN-T planning, which can only be defined through objectives and criteria rather than through concrete projects. This applies, for example, to the concept-based pillar which is about setting clear objectives and high priorities in the transport sector and in other EU strategies and letting these form the core of the EU’s measures for the TEN-T strategy. The advantages of a “trunk network” are that there is a greater potential for achieving network effects. A network solution would entail that nodes were to be included in a more systematic way as entry points to the network as well as the largest co-modal connection points which serve as the basis for extensive network integration. A network of this kind is to be built on the basis of an agreement with clear common objectives and an open objective planning method. According to the Commission, the following factors should be particularly taken into account:
• Large traffic flows both within the EU and to other parts of the world • Cohesion objectives (through links between regions at different levels of
development and different regional distinctive features) • Links with centres for economic development • Benefit from previous investments within TEN-T • Environmental objectives • Competition objectives • More efficient use of the infrastructure • The range between the situation of individual Member States • Shared planning responsibility at EU and national level
It is important to note that a “trunk network” accordingly should not only consist of a network of really heavy transport flows, which, above all, exist in parts of Western Europe. SIKA recommends the third alternative with two levels; an overarching network and a “trunk network” consisting of a geographical pillar which geographically defines the network and also a concept-based pillar that serves as the basis for more exact definition of projects. It is attractive that the prioritised projects are replaced by an integrated network. Within the framework of the concept-based pillar, there is also scope for working with making existing systems more efficient. This may involve measures within ITS or measures that facilitate transfer from one mode of transport to another.
Conclusions
• The EU must safeguard the European perspective above the national • TEN-T should be an integrated network • TEN-T should have a more limited extent than the present overarching
network • The designation of TEN-T should take into account current and potential
trade flows and links to third countries should be specially taken into consideration

SIKA Report 2009:1
83
5.5 Pricing policy
Internalisation of external costs is a component of a package of measures which is to make the transport sector more sustainable in the long term.97 The Commission states that the costs for use of the transport infrastructure are only partly paid by – and are unfairly apportioned between – the transport users. The foremost financial instruments to internalise the external costs are taxation, road charges/road tolls and emission allowance trading.
The marginal cost principle
The maintenance of the single internal market is one of the EU’s basic principles. Prices (taxes) must not therefore be set at such a high level as to be a barrier to free mobility or – through the effects of transit traffic – harming other regions. The principles of internalisation must therefore be determined at a European level so that the market is not fragmented through local taxation. At the same time, it must be acknowledged that certain external costs have a local character, and it is therefore important to find the right balance between the Community’s (a global solution) and local solutions. The correct signals to transport users are given through the prices (taxes) that do not lead to overuse of the resources, and which do not punish the transport sector and the economy. The balance struck is correct when the prices correspond to the socio-economic marginal costs, which is proposed as the main principle for internalisation. Accordingly, transport prices should correspond to the additional short-term cost caused by additional traffic. Prices which correspond to the socio-economic marginal costs entail an efficient use of the existing infrastructure. The principle of marginal costs can unfortunately not be used in every situation. When necessary, it may be necessary to take supplementary measures to ensure that the infrastructure is funded in accordance with the “user pays” principle and the external costs are internalised according to the “polluter pays” principle. In such cases, a pragmatic approach based on average cost may be more feasible.98 The directive from 1999 on charges on heavy good vehicles99 does not permit that calculation of road charges includes external costs. This directive was amended in 2006 to enable charges to be adapted to the vehicle’s environmental characteristics although this was conditional on the solution with road charges not
97
Commission of the European Communities (2008): Greening transport, COM (2008) 433 final, Brussels. Commission of the European Communities (2008): Proposal for a directive of the European Parliament and Council amending Directive 1999/62/EC on the charging of heavy good vehicles for the use of certain infrastructures, COM (2008) 436 final, Brussels. Commission of the European Communities (2008): Communication from the Commission to the European Parliament, the Council, the Economic and Social Committee and the Committee of the Regions; Strategy for the internalisation of external costs, COM (2008) 435 final, Brussels. 98 Commission of the European Communities (2008): Communication from the Commission to the European Parliament, the Council, the Economic and Social Committee and the Committee of the Regions; Strategy for the internalisation of external costs, COM (2008) 435 final, Brussels. 99 Directive 1999/62/EC

SIKA Report 2009:1
84
being more expensive than the infrastructure costs. The Commission therefore proposes100 that it shall be possible to include external costs for air pollution, noise and traffic congestion, that mechanisms be established for coordination at EU level and a common method and a ceiling for fees, as well as income to be allocated to the transport sector. It is proposed that road charges be differentiated according to vehicle type, road type and time period and be debited via electronic payment systems. The marginal cost principle has for a long time been one of the cornerstones of Swedish transport policy. At EU level, the principle is to date far from being implemented. The Commission hereby moves forward the position by explicitly stating the goal is to implement the principle for all modes of transport. In the case of roads, this is about increasing possibilities to introduce a differentiated kilometre tax for lorries by amendments to the Eurovignette directive. Differentiated distance-based charges in road transport have shown great potential as instruments to internalise the external costs of traffic’s external effects, for example, congestion and environmental effects.101 The importance of charges in transport policy must, however, be viewed in relation to the other instruments applied. For example, the fee uptake for the external effects of air pollution in the proposal is linked to the exhaust requirements which the vehicle complies with. The possibility of charges of leading towards socio-economic efficiency will thus depend on the extent to which requirement levels have been based on socio-economic analyses. The amendment of the directive on infrastructure fees for heavy goods vehicles (Eurovignette Directive) was not ready during the French Presidency. The Czech Republic will continue work on the matter with the intention of a general approach or a political agreement at the latest by the Council meeting in June. In this case, there is a lot to indicate that Sweden will continue the work on this legal provision.
Difficulties in internalising the external costs in a transport network
Transport economists often state that the correct tax levels should be set in such a way that the external effects that arise as a result of transport are wholly intern-alised. When various decision-making bodies (at the EU and the national level) don’t comply with this advice, this is usually blamed on excessively strong lobby groups, lack of knowledge or lack of courage on the part of politicians. A study by De Borger and Proost (2007)102 shows that the existence of local traffic and transit traffic, when there is more than one taxation level, is sufficient to explain many of
100 Commission of the European Communities (2008): Proposal for a directive of the European Parliament and Council amending Directive 1999/62/EC on the charging of heavy good vehicles for the use of certain infrastructuresr, COM (2008) 436 final, Brussels. 101 SIKA (2007) Kilometerskatt för lastbilar – Effekter på näringar och regioner. Report 2007:2, Stockholm. SIKA (2007) Kilometerskatt för lastbilar – Kompletterande analyser. Rapport 2007:5, Stockholm. 102 De Borger, B. and Proost, S. (2007) Transport Pricing when Several Governments Compete for Transport Tax Revenue, I Rietveld, P. and Stough, R. (eds), Institutions and Sustainable Transport, Edward Elgar, Cheltenham.

SIKA Report 2009:1
85
the inefficiencies in the transport system that can be observed in reality. They show that these problems neither relate to poor knowledge nor lack of courage among our decision-makers. These problems exist despite governments having perfect knowledge and being interested in maximising prosperity in their area. There are two simple reasons why the above description is not accurate:
• in reality, the transport network is used by a large number of different users and both modes of transport also often consist of both local traffic and long-distance transit traffic.
• Furthermore, most transportation is taxed/subject to charges by more than one decision-making controlling body, for example, fuel taxes (state) and parking charges (municipal). The fact that every level sets taxation on the basis of its own voters’ preferences and not necessarily on the basis of the preferences of the state or region as a whole is there another factor that makes taxation and pricing in the transport sector difficult. This leads to fiscal externalities, i.e. tax policy at a decision-making body affects the objectives and/or tax revenue of other decision-making bodies without this being compensated for.
This is even more complicated in the transport sector since the fiscal externality at the same time leads to congestion and emissions being moved over to other states. In the section below, an account is given of two types of fiscal externalities, horizontal and vertical, and the welfare effects that can arise when one attempts to solve these. The section concludes with a summing-up and conclusions for the EU’s transport networks.
Horizontal fiscal externalities
Horizontal externalities are about tax exports (a county which has a very large transit traffic can then choose to set a high tax on transit traffic to favour local users of the transport infrastructure), and about competition for a mobile tax base (tax competition is, for example, when fuel tax is one country is set deliberately low to make use of high price sensitivity for fuel and which thus generates extra tax revenue). Serial competition occurs when transportation sequentially requires use of two or more parts of a network, which is a complement and which belongs to different states. An example is a transport that has to pass through two countries, where each country applies its own tax policy, and where there may be both local traffic and transit traffic. The consequence will then be that the same transit transport (from Start to Finish) may be taxed differently in the two countries (A and B). This is, for example, very important for use of the Trans-European Network (TEN). Competition between different sections of a serial network is called serial tax competition.

SIKA Report 2009:1
86
Figure 5.7: Serial links
De Borger and Proost (2007)103 show that regardless of whether taxation of local traffic and transit traffic are differentiated between local and transit, uniform or if only local traffic is taxed, all reaction curves104 have a negative slope. This means that the measure carried out in B affects what A carries out. In the case with differentiated tax, a tax increase on transit in country B means that the optimal reaction in country A is to reduce the tax charged both on transit and local traffic since transit demand has decreased. If the local taxation level is raised in B, this means that A should increase tax both on local and transit traffic. This is because the local tax increase in B has reduced congestion in B and thus attracted more transit traffic, which increases congestion in A if nothing is done. An increase of tax in B in the case with uniform taxation will lead to reduced demand for transit transport and thus reduced congestion in A. This means that country A will reduce its uniform tax. If only local traffic is taxed, the increased local tax in B will lead to reduced local demand for transport but increased demand for transit transport through A and B. The increased congestion in A will then affect local demand for transport negatively. Country A will then reduce its local tax level. The intuition underlying this is that A will then increase local traffic as the only solution to increase congestion and in this way reduce transit traffic. To study the welfare effects following on from serial tax competition, Nash equilibrium characteristics are used105. The outcome of tax competition is not global (that is the aggregate effect for countries A and B) in terms of optimising welfare for both countries. The result will be non-negligible inefficiencies. The outcome will be even worse when investments are included in the analysis. For example, when only local taxes are permitted, there is not sufficient incentive for the individual country to invest in infrastructure since transit traffic does not contribute to the local economy. This result is very important not least in
103 De Borger, B. and Proost, S. (2007) Transport Pricing when Several Governments Compete for Transport Tax Revenue, I Rietveld, P and Stough, R. (eds), Institutions and Sustainable Transport, Edward Elgar, Cheltenham. 104 A reaction curve is a function that shows the optimal choice for country A as a reaction to country B’s choice (and vice versa). 105 Nash equilibrium. A game theory strategy combination: no player has anything to gain by changing strategy; none of the players involved would have any reason to change their decision if they had known about the other players’ decisions in advance.
Origin
Desti-nation
A B
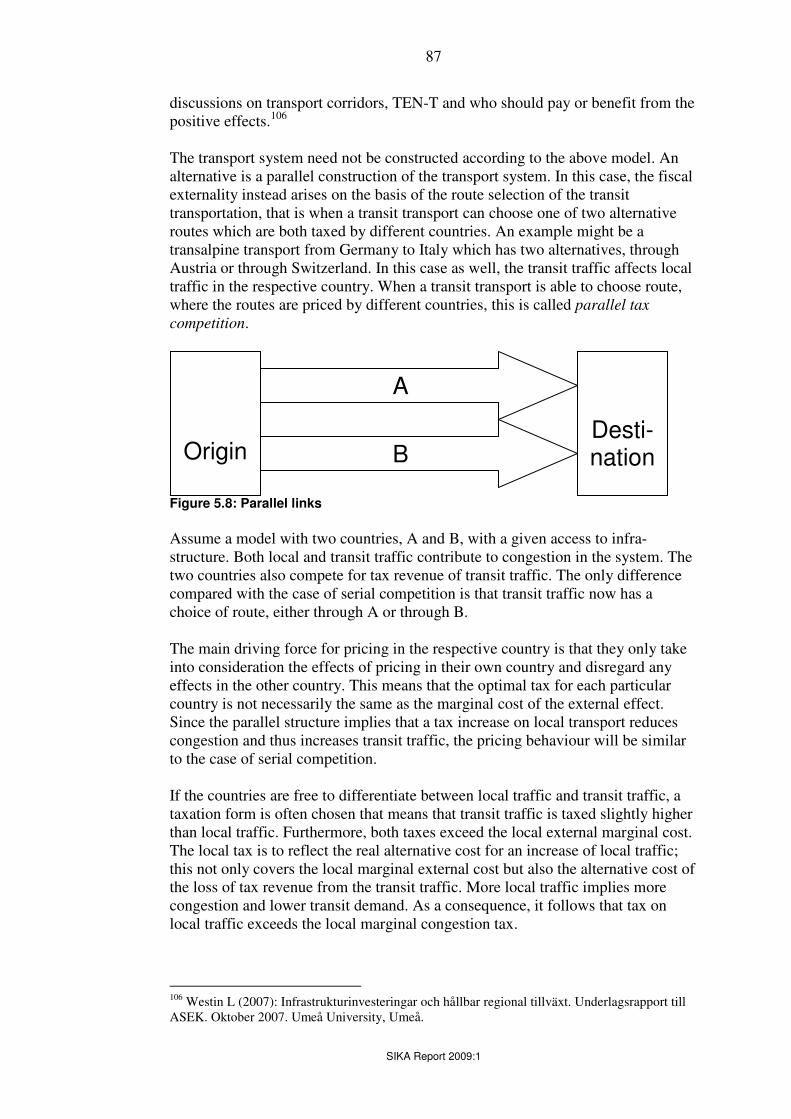
SIKA Report 2009:1
87
discussions on transport corridors, TEN-T and who should pay or benefit from the positive effects.106 The transport system need not be constructed according to the above model. An alternative is a parallel construction of the transport system. In this case, the fiscal externality instead arises on the basis of the route selection of the transit transportation, that is when a transit transport can choose one of two alternative routes which are both taxed by different countries. An example might be a transalpine transport from Germany to Italy which has two alternatives, through Austria or through Switzerland. In this case as well, the transit traffic affects local traffic in the respective country. When a transit transport is able to choose route, where the routes are priced by different countries, this is called parallel tax competition.
Figure 5.8: Parallel links
Assume a model with two countries, A and B, with a given access to infra-structure. Both local and transit traffic contribute to congestion in the system. The two countries also compete for tax revenue of transit traffic. The only difference compared with the case of serial competition is that transit traffic now has a choice of route, either through A or through B. The main driving force for pricing in the respective country is that they only take into consideration the effects of pricing in their own country and disregard any effects in the other country. This means that the optimal tax for each particular country is not necessarily the same as the marginal cost of the external effect. Since the parallel structure implies that a tax increase on local transport reduces congestion and thus increases transit traffic, the pricing behaviour will be similar to the case of serial competition. If the countries are free to differentiate between local traffic and transit traffic, a taxation form is often chosen that means that transit traffic is taxed slightly higher than local traffic. Furthermore, both taxes exceed the local external marginal cost. The local tax is to reflect the real alternative cost for an increase of local traffic; this not only covers the local marginal external cost but also the alternative cost of the loss of tax revenue from the transit traffic. More local traffic implies more congestion and lower transit demand. As a consequence, it follows that tax on local traffic exceeds the local marginal congestion tax.
106 Westin L (2007): Infrastrukturinvesteringar och hållbar regional tillväxt. Underlagsrapport till ASEK. Oktober 2007. Umeå University, Umeå.
Origin
Desti-nation
A
B

SIKA Report 2009:1
88
If the countries instead have a uniform tax, the optimal uniform tax will also exceed the local direct marginal external cost, and it increases with transit. Intuitively, the tax corrects the imbalance in the local transport market and tax revenue opportunities from transit traffic. If a large part of traffic is transit traffic, this will be reflected in the uniform tax also being high. Finally, when only the local traffic can be taxed, the optimal tax level will be lower than the local marginal external cost. The intuition underlying this is that a local tax reduces local transport demand and attracts more transit traffic with the result of lower local welfare. This means that the local tax will be set lower than the local marginal costs in order in this way to avoid too much transit traffic. However, the implications of this type of system are diametrically opposite to serial competition, which has been shown by De Borger, Proost and Van Dender (2005)107. They show that, in a parallel network, a tax increase abroad will lead to a tax increase in one’s own country. In the case of differentiated taxes, an increase in transit tax in country B will lead to transit traffic moving over to A where congestion will then increase. The answer will then be to increase tax on transit traffic in A as well. What will happen to welfare in a system with parallel links? It is shown that welfare is not affected particularly much. By introducing differentiated taxes (on local traffic and transit traffic), in the case of a centralised tax policy for the intended network, a large part of the possible welfare gain is maximised. However, even if policy is not coordinated, the welfare gain is good in comparison with a case without taxation of transit traffic in a parallel transport network. Neither does an introduction of a uniform tax affect welfare to a particularly great extent. However, it can affect the local tax level considerably. The consequence will be that local welfare will decrease due to the tax increase on the local traffic which this entails. This welfare loss is, however, counterbalanced largely by the tax revenue that follows from taxation of transit traffic. The most important lesson in this case is that it has large negative consequences to avoid taxation of transit traffic. The welfare cost that not being able to tax transit traffic entails is greater than the welfare loss that follows from any tax competition between countries.
Vertical fiscal externalities
Vertical externalities consist large of overlapping tax bases, for example, when a higher level (EU) and a lower level (a Member State) tax the same tax base, for example, vehicle fuel. The problem with vertical tax externalities in the transport sector is complicated for two reasons. Different levels of the decision-making bodies use different tax instruments but affect one another’s tax bases. Moreover, different well-meaning decision-making bodies may be interested in mastering the same transport externality without taking into consideration the effects and other measures that have already been carried out by someone else.
107 De Borger, Proost and Van Dender (2005), Congestion and Tax Competition on a Parallel Network, European Economic Review, 49, 2013-40.

SIKA Report 2009:1
89
To illustrate this, we can conceive that the EU were to set fuel tax levels, the level of kilometre tax, etc. The individual Member State may, for example, be responsible for the introduction and level of local congestion taxes etc.. The two governments may have different motives and it is also probable that they will take into account different externalities. De Borger et al. (1998)108 and Proost and Sen (2003)109 identify four causes for why the above tax system will not be optimal. 1) The national decision-making body will focus on tax export since it will be less concerned about long-distance travel than the welfare of its own citizens, i.e. the tax level for transit traffic will be higher than optimal in a global welfare perspective. 2) The national decision-making body is only concerned about the externalities that affect its own country and the national tax level will therefore be too low in a global perspective. 3) An increase in global tax reduces the demand for transport, including national demand. This naturally affects the national tax revenue. However, this is not observed by the national decision-making body but it retains its tax level, which entails that the global tax will be too high in a global welfare perspective. 4) The two decision-making bodies have moreover different but at the same time blunt policy instruments, which are available to correct externalities.
Conclusions
• Depending on the design of the system and problems that are to be dealt with, different demands are placed on a good pricing policy. The welfare effects of a particular pricing policy may vary greatly compared with a different policy
• A correct pricing is a prerequisite for decentralised decision-making, i.e. that it is the purchaser of transport which is best suited to determine how the transport is to take place
• The EU is responsible for the system effects in the design of financial instruments in future freight corridors and TEN-T being taken into account
• Internalisation of external effects should be based on marginal cost pricing
108 De Borger, B. et al (1998) Regional and Federal Interests in Transport and Environment Policymaking: the Case of Belgium, I Proost, S. and Braden, J (eds), Climate Change, Transport and Environmental Policy, Edward Elgar, Cheltenham, pp. 221-43. 109 Proost, S. and Sen, A. (2003) Transport Pricing Reform with Several Levels of Government – A Case Study. Center for Economic Studies, Catholic University Leuven, Discussion Paper ETE.

SIKA Report 2009:1
90

SIKA Report 2009:1
91
6 EU transport policy after 2010
The first part of the SWOT analysis of EU transport policy was presented in section 3.3. This was followed up by an analysis of opportunities and threats in Chapters 4 and 5 which is summarised below. The remaining part of this chapter is devoted to proposing suitable initiatives at Community level for a long-term sustainable transport policy. A well-functioning transport system is very important for the EU’s competitiveness.
6.1 Opportunities and threats
Opportunities
One opportunity for future policy is to integrate transport and climate policy with limit values with clear objectives. Powerful regulatory measures at Community level for limit values for energy consumption and carbon dioxide emissions for vehicles will provide great opportunities to comply with the climate objectives at national and international level. The economic crisis and its consequences for the vehicle industry can also entail larger grants for research on renewable fuels and fuel-efficient vehicles. Continued and intensified work on efficiency in the transport sector. This can take place by steering development in the right direction by smart indicators and key ratios such as the load factor for freight traffic, emissions per inhabitant and in relation to the size of the economy. By prioritising implementation of pricing policy, there will be an opportunity to tackle environmental and congestion problems. Increased harmonisation of prices and rules that favours efficient logistics, impact and widespread use of intelligent transport systems (ITS) and combi transportation, to contribute thereby to more efficient use of the transport network. Link land use and transport more clearly by letting access issues come into focus. Production of action programmes for urban traffic in accordance with the Green Paper can provide knowledge and experiences that can contribute to this. Working towards produced benchmarks at EU level may be one opportunity to get countries to prioritise these issues. Through an active policy and the endeavour to even out differences between east and west, there is a great potential for increased trade and integration of the Member States. This can take place by development of the infrastructure within the framework of TEN-T, but it can also take place, for example, by research collaboration which aims to implement ITS in the east.
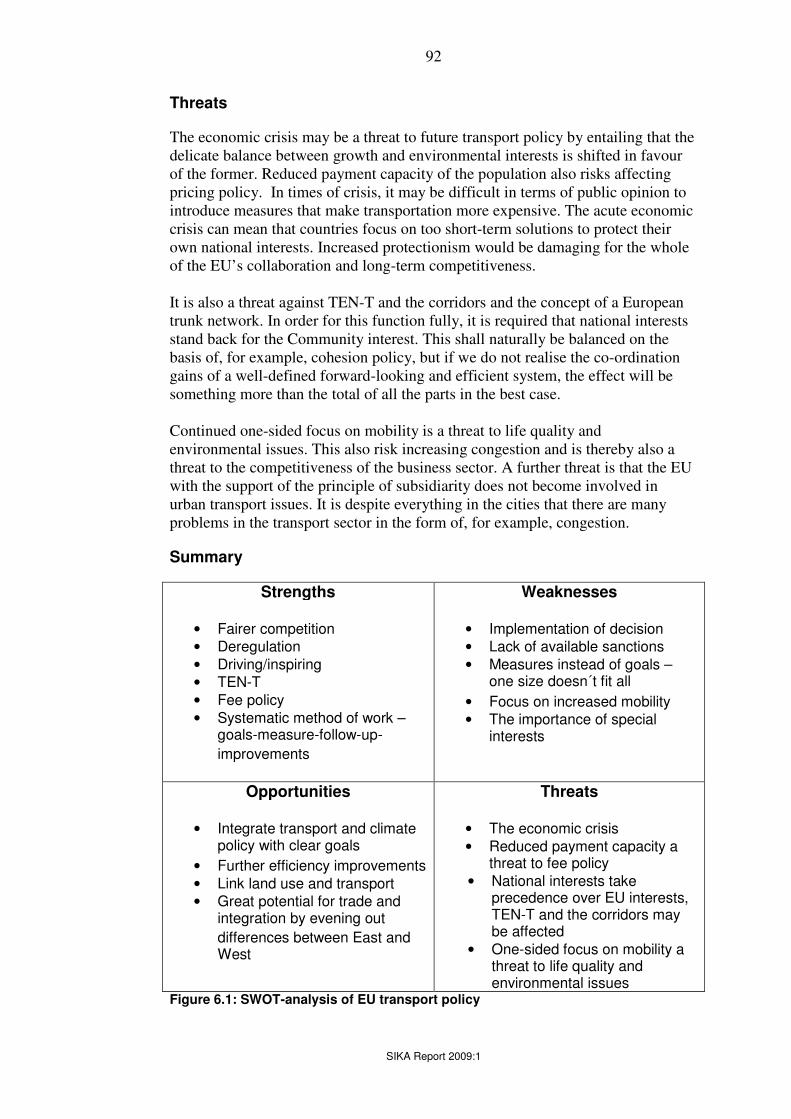
SIKA Report 2009:1
92
Threats
The economic crisis may be a threat to future transport policy by entailing that the delicate balance between growth and environmental interests is shifted in favour of the former. Reduced payment capacity of the population also risks affecting pricing policy. In times of crisis, it may be difficult in terms of public opinion to introduce measures that make transportation more expensive. The acute economic crisis can mean that countries focus on too short-term solutions to protect their own national interests. Increased protectionism would be damaging for the whole of the EU’s collaboration and long-term competitiveness. It is also a threat against TEN-T and the corridors and the concept of a European trunk network. In order for this function fully, it is required that national interests stand back for the Community interest. This shall naturally be balanced on the basis of, for example, cohesion policy, but if we do not realise the co-ordination gains of a well-defined forward-looking and efficient system, the effect will be something more than the total of all the parts in the best case. Continued one-sided focus on mobility is a threat to life quality and environmental issues. This also risk increasing congestion and is thereby also a threat to the competitiveness of the business sector. A further threat is that the EU with the support of the principle of subsidiarity does not become involved in urban transport issues. It is despite everything in the cities that there are many problems in the transport sector in the form of, for example, congestion.
Summary
Strengths
• Fairer competition
• Deregulation
• Driving/inspiring
• TEN-T
• Fee policy
• Systematic method of work – goals-measure-follow-up-
improvements
Weaknesses
• Implementation of decision
• Lack of available sanctions
• Measures instead of goals – one size doesn´t fit all
• Focus on increased mobility
• The importance of special interests
Opportunities
• Integrate transport and climate policy with clear goals
• Further efficiency improvements
• Link land use and transport
• Great potential for trade and integration by evening out
differences between East and West
Threats
• The economic crisis
• Reduced payment capacity a threat to fee policy
• National interests take precedence over EU interests, TEN-T and the corridors may be affected
• One-sided focus on mobility a threat to life quality and environmental issues
Figure 6.1: SWOT-analysis of EU transport policy

SIKA Report 2009:1
93
6.2 Transport policy for increased competitiveness and
sustainable development
How do the results from the SWOT analysis relate to the transport policy presently applied within the EU and which approach would it need to take during the Swedish Presidency and in the longer term? In the figure below, the problems confronting the transport sector in the form of negative external effects are shown in the two outer boxes. The central box shows examples of measures which have been identified as being able to solve one or more of the specified problems. For example, an investment in green freight corridors can lead to remedying capacity shortages at the same time as environmental and congestion problems will decrease or completely disappear. By correct pricing of use, congestion and other external effects can be reduced as well as solving problems with capacity shortages. The Freight Delegation pointed out that congestion may arise due to underpricing of use of the infrastructure and does not need to be a sign of increased need for capacity110.
Figure 6.2: Problem and solutions
SIKA considers that future transport policy shall contain the following points:
• Accessibility • Resolution • Implementation of decisions • Indicators and follow-up • A system perspective on transport • Prioritisation of freight transport • Harmonisation issues • Energy • Pricing policy
110 Swedish National Committee for Freight Transport (2004): Godstransporter; noder och länkar i samspel, SOU 2004:76, Stockholm.
• Increased regional gaps
• Agglomeration disadvantages
• Environment (Noise, climate effect, emissions, intrusion etc)
• Congestion
• Traffic injuries
• Accessibility
• TEN-T
• Corridors
• Green corridors
• Relief of bottlenecks
• Deregulation
• Harmonisation
• Common emission requirements
• Definitions
• Research
• Instruments
• ITS
• Improved efficiency
• Lack of competition
• Capacity shortage
• National systems
• Insufficient funding
• Energy supply
Problems in the transport
sector Solutions Negative external effects

SIKA Report 2009:1
94
Accessibility
Ever since the Rome Treaty of 1957, accessibility has been something of a lodestar for EU policy. A free flow of people, goods and services would be facilitated by, for example, removing internal boundaries to create an internal market. Transport policy has also been imbued by the objective of increased mobility. SIKA considers that it is positive to increase mobility in the form of migration, but that it is an incorrect approach to transport policy to be restricted by the objective of increased mobility. With accessibility as an objective, the focus is placed on the actual purpose of a journey – to obtain access to a function. For the individual citizen, this may be access to work service and leisure activities. For the business sector, it may entail access to labour, customers and raw materials. The objective for long-term European transport policy should therefore be to achieve high accessibility. Mobility – the possibility of transport – is, however, a means to achieve the benefit of accessibility. An endeavour to reduce traffic and to test the opportunities of accessibility without physical mobility is not the same as not developing mobility where it is justified. In other words, it is an endeavour to achieve increased efficiency in the transport system to reduce the negative consequences of transport in the form of congestion, while retaining accessibility, safety and the environment. Even if one does not include measures outside the transport system (physical planning and IT communications) an objective of this kind would point to the need for more efficiency in the transport system such as improved load factors and an increased share for public transport.
Power of decision
The survey of the different Member States in Chapter 3.2 indicated that opinions differed with regard to the division of responsibility between the Community level and the national level. There seems to be some consensus, however, around the following principles:
• Implementation issues should be left to individual countries. This may, for example, concern how the railways’ noise problems can be solved
• Cross-border issues should be left to the EU From this, it follows that problems that arise as a result of local activities and which also have local effects should be dealt with by the individual Member States at an appropriate level. If problems, however, arise as a result of other nations’ activities, the problem should be dealt with by the EU. It was shown in Chapter 5.5 that this question did not in practice have a single answer. This applies, for example, to the creation of the internal market. Important issues in this area are, for example, to tackle bottlenecks in the transport system or incompatibility between different technical systems. Interventions from the EU which entail deteriorations locally can, however, be sensitive. For example, countries with a lot of transit traffic are sensitive to EU decisions that may a further increase in environmentally disruptive traffic.

SIKA Report 2009:1
95
The power of decision on the aspects of accessibility which concern location and land use issues usually lies with a municipality or city. It is not appropriate for the EU to describe in detail how individual Member States are to work with accessibility. Control of this kind would be very inefficient through not being adapted to local conditions. However, the EU can spread good examples of how, for example, different cities work with accessibility issues. In the U.K., for example, accessibility issues have been addressed within the framework of local transport plans.
Implementation of decisions
A well-functioning transport system will not materialise unless the extent and pace of implementation of the different transport policy decisions can be increased at the national level. Financial instruments have, for instance, a swift and great potential to reduce emissions from the transport sector. The introduction of such instruments should, however, to have a great impact and to increase legitimacy, be combined with measures that offer alternatives. In order for the effects of any regulations of fuel use (for example, in the form of increased prices) and other financial instruments should not lead to a deterioration in accessibility between society’s functions, it is required that there are alternatives to change to. A combination of the stick in the form of internalisation of external effects and a carrot in the form of positive measures that offer freedom of choice are therefore preferable. The introduction of, for example, a congestion tax should be combined with expanded public transport or similar.
Indicators and follow-up
There is a good tradition within the EU of systematic follow-ups of projects. The EU could develop this area further by working with key ratios and indicators to steer development in the right direction. For example, indicators for load factors for freight traffic and emissions per inhabitant can support a development towards more efficient transport systems. SIKA has in the proposal on a new goal structure111 suggested that a system be designed so that it can serve as planning support for policy and planning measures at national, regional and local level. The purpose of the indicators is that they should in a comprehensive way quantify the state and show possible development paths. From an EU and international perspective, it is important that knowledge is developed which concerns cross-border transport. For example, it is mentioned in the action plan for freight logistics that result indicators for freight logistics chains are useful instruments to promote the quality of the services and that they can be used to measure the environmental and social consequences. The Commission also states that there is to date no common system of result indicators of different modes of transport or for freight logistics 112. Statistics within the EU are still
111 SIKA (2008): Förslag till ny transportpolitisk målstruktur, del 2 Förslag till reviderade mål, SIKA Rapport 2008:3, Östersund 112 Commission of the European Communities (2007): Freight Transport Logistics, COM (2007) 607 final, Brussels.

SIKA Report 2009:1
96
largely based on NUTS 2 or 3 and aggregated at the national level. Cross-border statistics, for example, for a transport chain or link, as well as between two countries are poorly developed. Only in maritime transport is there statistics for cross-border transport. Proposed improvements of international statistics must be regarded in the light of all concerned countries reaching agreement. Development is therefore taking place slowly in small steps.113 In the work of analysis and planning, the effect of financial instruments on traffic development has an important role. However, there is a clear need of methods and model systems which can describe effects of different types of changes on different modes of transport, for example, with regard to the introduction of different types of regulations and instruments, changed fuel prices, changed evaluations, new technology and different types of infrastructural changes. Changes in traffic and transport performance serve as the basis for calculations of, for example, emissions and other factors that have an impact on socio-economic efficiency. It is therefore of key importance to be able to asses expected changes in traffic and transport performance as well as possible, independent of mode of transport.
A system perspective on transport
The development of welfare depends on a well-functioning system for both passenger and freight transport. The development of the transport networks was for along time a purely national interest, which results in the cross-border links being few. The European transport system therefore suffers from there being gaps between the national networks which the individual Member States to not feel any responsibility for filling. The EU therefore has a given task to create an integrated European network for both passenger and freight traffic within the framework of TEN-T. SIKA considers that this network should not have too many branches but should serve as a trunk network. A more limited and prioritised network will grow more quickly if the grant proportion from the Community is large. Financial carrots have previously proven to be an effective means of hastening planning and implementation. Cross-border transnational platforms can facilitate identification of such gaps and at the same time create acceptance among the countries concerned to plan and fund measures with the intention of creating an integrated European transport system. There is an embryo of a transnational platform of this kind in the Baltic Sea strategy.114 This network should capture the major traffic flows identified in Chapter 4 and offer links with different centres for economic development. However, consideration should also be taken to cohesion policy, flows of products and future flows which can look dramatic different from the current situation. Links between regions at different development levels can contribute to meeting the objectives of cohesion policy. The potential of the new Member States in Eastern
113 SIKA (2008) Regleringsbrevsuppdrag, Analysunderlag avseende development och tendenser i länderna i Östersjöregionen. SIKA Dnr: 264-200-08 114 http://ec.europa.eu/regional_policy/cooperation/baltic/index_en.htm

SIKA Report 2009:1
97
Europe shall be particularly attend to, as well as transport links to countries outside the EU. Within the framework of TEN-T, special green corridors should also be designated. Within these corridors, a number of modes of transport should be represented to offer the business sector the opportunity of choosing environmentally friendly transport. It is of key importance that the corridors are equipped with suitable transhipment facilities at strategic places (for example, coastal ports, inland ports, marshalling yards and other relevant logistics terminals and facilities), and with distribution depots, to start with for biofuels and subsequently for other forms of green fuel. The green corridors can thus serve as something of an experimental workshop where different kinds of energy can be tested and evaluated on a small scale.
Prioritisation of freight transport
Large investments have been made in rail traffic, inter alia, within the framework of TEN. Special freight corridors should be designated to strengthen the competitiveness of rail transport as a freight carrier. Within these prioritised corridors, special investments should be made on increased carrying capacity and operation and maintenance. Prioritisation of train paths should be made on the basis of the usefulness of the transport. Within international freight corridors, the socio-economic valuation should be similar. International transport should be given a higher value than national in order to safeguard the business sector’s international trade and competitiveness. Even though the designation of corridors can be regarded as an expression of central control, the basic principle for transport policy should none the less be far-reaching decentralised decision-making. It is mainly the individual citizens and business sector which should govern the development of the transport system through their choices. An important jigsaw piece is that transport purchasers shall also pay for the cost in the form, for example, of congestion and environmental damage which transport causes. An internalisation of these costs contributes to increasing efficiency within the transport system. The EU has a particular responsibility for systemic effects in the design of financial instruments in future freight corridors and TEN-T being taken into consideration.
Harmonisation issues
The decision made within the Member States must be compatible with transport policy at EU level. EU transport policy should therefore consist of harmonisation in a framework containing clear rules which enable competition on equal terms between different modes of transport, as well technical, social and fiscal respects in the transport sector. By supporting measures that lead to simplification of administrative procedures which facilitate use of different modes of transport in transport chains, for example, common consignment notes for different modes of transport, is a way of increasing the efficiency of the transport system. Harmonisation of rules along railway corridors should also be implemented to facilitate crossing borders and removal of other physical barriers. The administrative burden for local maritime

SIKA Report 2009:1
98
transport is particularly heavy since a ship that carries goods between two European ports is automatically classified as international transport today. This involves customs declarations and other administrative procedures that make maritime transport less competitive. Harmonisation of technical standards (load carriers, vehicle lengths, etc), rules and taxes should be improved.
Energy
Fossil-based fuels will predominate at least until 2030 but will be successively replaced by a number of different types of energy sources. The EU should not designate any particular source of energy or fuel but this should be dealt with by the market. The EU can, however, assist in phasing in alternative fuels by setting a ceiling for emissions and using powerful financial instruments. The EU can also support research activity ion a small scale by, for example, developing the infrastructure for new fuels along the green corridors. Another area which the EU should promote is research on energy efficiency improvement.
Pricing policy
A well-designed pricing policy is an important jigsaw piece to achieve efficient long-term sustainable transport system. The internalisation of the external effects should be based on marginal cost pricing. Correct pricing is a prerequisite for decentralised decision-making, i.e. the purchaser of transport is the best suite to determine how the transport is to take place. The EU has a responsibility for the systemic effects in the design of financial instruments in future freight corridors and TEN-T being taken into account.

SIKA Report 2009:1
99
7 Sources
Anderson, W.P. and Laksmanan, T.R. (2002): Transportation infrastructure; freight services sector and economic growth, The US Department of Transportation, Federal Highway Administration. Anderstig, C. and Johansson, J. (2006): Infrastrukturinvesteringar och regional utveckling; en sammanställning av ex-post studier, Inregia, Stockholm. Banister, D. et al (2007): Making Sustainable Transport Politically and Publicly Acceptable: Lessons from the EU; In Rietveld, P. and Stough, R. (eds): Institutions and sustainable transport, Edward Elgar, Cheltenham. Capros, P. et al (2008): European energy and transport trends to 2030 – update 2007, Commission of the European Communities, Brussels. Commission of the European Communities (1999): European Spatial Development Perspective: Towards Balanced and Sustainable Development of the Territory of the EU, Luxembourg. Commission of the European Communities (2001): Unity, Solidarity, Diversity for Europe, Its People and Territory; Second Report on Economic and Social Cohesion, Luxembourg. Commission of the European Communities (2007) Commission staff working document. Accompanying document to the Communication from the Commission Freight Transport Logistic Action Plan. Impact Assessment, SEC 1320, Brussels. Conseil Général de Pont et Chaussées (2006): Long-range transportation plan- horizon 2050, Strategic considerations, September 2006. Deakin, E. (2007) Equity and Environmental Justice in Sustainable Transportation: Towards a Research Agenda, I Rietveld, P. and Stough, R. (eds): Institutions and sustainable transport, Edward Elgar, Cheltenham. De Borger, B. et al (1998) Regional and Federal Interests in Transport and Environment Policymaking: the Case of Belgium, I Proost, S. and Braden, J (eds), Climate Change, Transport and Environmental Policy, Edgar Elgar, Cheltenham, pp. 221-43. De Borger, B. et al (2005): Congestion and Tax Competition on a Parallel Network, European Economic Review, 49, 2013-40.
SIKA Report 2009:1
100
De Borger, B. and Proost, S. (2007): Transport Pricing when Several Governments Compete for Transport Tax Revenue, in Rietveld, P and Stough, R. (eds), Institutions and Sustainable Transport, Edward Elgar, Cheltenham. EU Ministers Responsible for Spatial Planning and Development (2007): Territorial Agenda of the European Union – Towards a More Competitive and Sustainable Europe of Diverse Regions, Leipzig. Swedish Energy Agency (2007): Långtidsprognos 2006 – enligt det nationella systemet för klimatrapportering, ER 2007:2, Eskilstuna. European Commission (2008): Trans-European Transport Network, Implementation of the Priority Projects, Progress report, May 2008. Commission of the European Communities (1989): Communication on a Community Railway Policy, COM (89) 564 Final, Brussels. Commission of the European Communities (1995): Green Paper; Towards Fair and Efficient Pricing in Transport, COM (1995) 691 final, Brussels. Commission of the European Communities (1996): White paper; a strategy for revitalising the Community’s railways, COM (96) 421 Final, Brussels. Commission of the European Communities (1998): Fair Payment for Infrastructure Use: A Phased Approach to a Common Transport Infrastructure Charging Framework in the EU, COM (1998) 466 final, Brussels. Commission of the European Communities (2001): White Paper. European transport policy for 2010, COM (2001) 370 final, Brussels. Commission of the European Communities (2004): Commission of the European Communities (2004): On the temporary nature of road cabotage in the movement of freight, COM (2004) XXX, Brussels. Commission of the European Communities (2005): Proposal for a decision of the European Parliament and Council on a paperless environment for customs and trade, COM (2005) 609 final, Brussels. Commission of the European Communities (2006): Keep Europe moving – Sustainable mobility for our continent; Mid-term review of the EU Commission’s 2001 White Paper on Community Transport Policy, COM (2006) 314 final, Brussels. Commission of the European Communities (2006): Freight Transport Logistics in Europe – the key to sustainable mobility, COM (2006) 336 final, Brussels Commission of the European Communities (2007): The Commission’s staff working paper; Towards a European maritime transport without barriers, SEC (2007) 1351, Brussels.

SIKA Report 2009:1
101
Commission of the European Communities (2007): 1367 The staff working paper on Motorways of the Sea, SEC (2007) 1367, Brussels. Commission of the European Communities (2007): Proposal to the European Parliament and the Council on common rules for access to the international road haulage market (recast), COM (2007) 265 final, Brussels. Commission of the European Communities (2007): The EU’s freight transport agenda: Boosting the efficiency, integration and sustainability of freight transport in Europe, COM (2007) 606 final, Brussels. Commission of the European Communities (2007): Green Paper; Towards a new culture for urban mobility, COM (2007) 551 final, Brussels. Commission of the European Communities (2007): An integrated maritime transport policy for the European Union, COM (2007) 575 final, Brussels. Commission of the European Communities (2007): The EU’s freight transport agenda: Boosting the efficiency, integration and sustainability of freight transport in Europe, COM (2007) 606 final, Brussels. Commission of the European Communities (2007): Freight Transport Logistics Action Plan, COM (2007) 607 final, Brussels. Commission of the European Communities (2007): Towards a rail network giving priority to freight, COM (2007) 608 final, Brussels. Commission of the European Communities (2007): Communication on a European ports policy, COM (2007) 616 final, Brussels. Commission of the European Communities (2008): Greening transport, COM (2008) 433 final, Brussels. Commission of the European Communities (2008): Communication from the Commission to the European Parliament, the Council, the Economic and Social Committee and the Committee of the Regions; Strategy for the internalisation of external costs, COM (2008) 435 final, Brussels.
Commission of the European Communities (2008): Proposal for a directive of the European Parliament and Council amending Directive 1999/62/EC on the charging of heavy good vehicles for the use of certain infrastructures, COM (2008) 436 final Commission of the European Communities (2008): Proposal to the European Parliament and Council for a regulation concerning a European rail network for competitive freight, COM (2008) 852 final, Brussels. Commission of the European Communities (2008): Action plan for the development of intelligent transport systems in Europe, COM (2008) 886 final, Brussels.
SIKA Report 2009:1
102
Commission of the European Communities (2008): Directive of the European Parliament and Council laying down the framework for the deployment of Intelligent Transport Systems in the field of road transport and for interfaces with other transport modes, COM (2008) 887 final, Brussels. Commission of the European Communities (2009): Strategic goals and recommendations for the EU’s maritime transport policy until 2018, COM (2009) 8 final, Brussels. Commission of the European Communities (2009): The Trans-European Transport Network (TEN-T): A policy review. Towards a better integrated Trans-European Transport Network at the service of the common transport policy, COM (2009) 44 final, Brussels. Eurostat (2007a): Panorama of transport, Edition 2007, Luxembourg. Eurostat (2007b): Panorama of European Union Trade; data 1999-2006, Luxembourg. Federal Ministry of Transport, Building and Urban Affairs (2008): Freight transport and logistics master plan, Berlin. Freobel, F., Henrichs, J. and Kreye, O. (1980): The new international division of labour; structural unemployment in industrial countries and industrialisation in developing countries, Cambridge University Press, Cambridge. Swedish National Committee for Freight Transport (2001): Godstransporter för tillväxt; en hållbar strategi; SOU 2001:61, Stockholm. Swedish National Committee for Freight Transport (2003): Godstransporter i samverkan; tekniska hinder forskning och utbildning, SOU 2003:39, Stockholm. Swedish National Committee for Freight Transport (2004): Godstransporter; noder och länkar i samspel, SOU 2004:76, Stockholm. Heckscher, E.F. (1907): Till belysning af järnvägarnas betydelse för Sveriges ekonomiska development, Uppsala University, Stockholm. Hyways (2008): The European hydrogen roadmap, European Commission, Direction general for research, Brussels. IEA (2008): Energy technology perspectives 2008; scenarios and strategies to 2050, Paris. IEA (2008): World energy outlook, Paris. Johansson, B. (1998): Will new technology be sufficient to solve the problem of air pollution caused by Swedish transport. Transportation Policy, vol 5, 213-222.

SIKA Report 2009:1
103
Johansson and Jonsson (2009): Transportsektorns energiförsörjning; en utblick med ett europeiskt perspektiv, FOI, Stockholm. Johansson and Mårtensson (2000): Energy and environmental costs for electric vehicles using CO2 neutral electricity in Sweden, Energy – the international journal, vol 25 p. 777-792. Järnvägsutredningen (2003): Järnväg för resenärer och gods, SOU 2003:104, Stockholm. Kahn-Ribero et al (2007): Kahn Transport and its infrastructure. In Climate Change 2007: Mitigation. Contribution of Working Group III to the Fourth Assessment Report of the Intergovernmental Panel on Climate Change [B. Metz, O. R. Davidson et al (eds)], Cambridge University Press, Cambridge, United Kingdom and New York, NY, USA. Kaijser, A. (1994): I fädrens spår; den svenska infrastrukturens historiska utveckling och framtida utmaningar, Stockholm. Meijers, E. and Sandberg, K. (2008): Reducing regional disparities by means of polycentric development: panacea or placebo?, Scienze Regionali, Vol 7 no. 2, p. 71-96. Michaelis and Davidson (1996): Michaelis L and Davidson O. GHG mitigation in the transportation sector. Energy Policy, vol 24, 969-984. Ministerio de industria, turismo y comercio (2007): Saving and energy efficiency strategy in Spain 2004-2012; action plan 2008-2012, Madrid. Swedish Environmental Protection Agency (2008): Index över nya bilars klimatpåverkan 2007; I riket länen och kommunerna, Report 5820, Stockholm. Newfarmer, R. and Gamberoni, E. (2009): Trade protection: Incipient but worrisome trends, Trade notes, International trade department, The World Bank, March 2 number 37. North, D.(1966): The economic growth of the United States 1790-1860, New York. Ministry of Enterprise, Energy and Communications (2009): Mål för framtidens resor och transporter, Government Bill 2008/09:93, Stockholm. Proost, S. and Sen, A. (2003): Transport Pricing Reform with Several Levels of Government – A Case Study. Center for Economic Studies, Catholic University Leuven, Discussion Paper ETE. SIKA (2006): Varuflödesundersökningen 2004/2005, SIKA statistics 2006:12, Stockholm.

SIKA Report 2009:1
104
SIKA (2007): RES 2005-2006; den nationella resvaneundersökningen, SIKA statistics 2007:19, Östersund. SIKA (2007): Kilometerskatt för lastbilar – Effekter på näringar och regioner. Report 2007:2, Stockholm. SIKA (2007): Kilometerskatt för lastbilar – Kompletterande analyser. Report 2007:5, Stockholm. SIKA (2008): Åtgärdsanalys av EU:s transportpolitik, SIKA PM 2008:5, Östersund. SIKA (2009): Underlag till åtgärdsanalys av EU:s transportpolitik, SIKA PM 2009:6, Östersund SIKA (2009): Evaluation of the implementation of the EU transport policy, SIKA PM 2009:7, Östersund Spiekermann, K. and Wegener, M. (2007): Ex ante evaluation of the TEN-T multi annual programme 2007-2013, Ecorys, Rotterdam. Sprei, F et al. (2008): Better performance or lower fuel consumption: Technological development in the Swedish new car fleet 1975-2002, Transportation Research – D, vol 13, p. 75-85. Stead, D. (2007): The European Green Paper on Urban Mobility, EJTIR, 7, no. 4 p. 353-358. Stead, D. et al (2008): Urban Transport Policy Transfer in Central and Eastern Europe, disP 172, 1/2008, p. 62-73. Sweco Eurofutures (2009): Vägar framåt; om EU-stödet i utvecklingen av svensk infrastruktur, Stockholm. Sweeney, S. (2005): Europe, the state and globalisation, Pearson Longman, Harlow. United Nations (2009): Pre-release: World economic situation and prospects 2009; Global outlook 2009, New York. VTI (2008): Långa och tunga lastbilars effekter på transportsystemet. Redovisning av ett regeringsuppdrag, VTI report 605, Linköping. VTI (2008): Svensk godsstudie baserad på nationell och internationell litteratur. Internationell exposé – persontransporter, VTI report 629, Linköping. Vägverket (2005): Förslag till svensk tillämpning av begreppet ”Tillfällig” vid vägcabotage, PM version 2.0, 30 September 2005. Warwick E. M. (2006): Geographies of globalization, Routledge, New York.

SIKA Report 2009:1
105
Westin, L. (2007): Infrastrukturinvesteringar och hållbar regional tillväxt. Underlagsrapport till ASEK. October 2007. Umeå University, Umeå. Östensson et al (2009): Energi och säkerhet; framtidsinriktade omvärldsanalyser för Försvarsmakten, FOI-R-2637-SE, FOI, Stockholm.
Websites:
Delivering a sustainable transport system: http://www.dft.gov.uk/about/strategy/transportstrategy/dasts European Environment Agency: http://www.eea.europa.eu/ Green paper: Towards a new culture for urban mobility http://ec.europa.eu/transport/urban/urban_mobility/green_paper/doc/urban_mobility_2007_country_sheets_eu27.pdf IRU position on the Commission of the European Communities proposal for a regulation on access to the road haulage market: http://www.iru.org/index/cms-filesystem-action?file=en_Resolutions_Market%20access%20Access%20to%20the%20profession/07_IRU_position_regulationMarket.E.pdf Local Transport Plan: http://www.dft.gov.uk/pgr/regional/ltp/
Plan de Déplacements Urbain: http://www.pdu-casa.fr/ Swedish Association of Road Haulage Companies: Svensk ståndpunkt beträffande kommissionens förslag till definition av vägcabotage: http://www.akeri.se/files/bilder/sa/filer/SA-TRSPbrev_20070612.pdf Territorial Agenda of the European Union: http://www.cor.europa.eu/COR_cms/ui/ViewDocument.aspx?siteid=default&contentID=4c3c41dc-7d16-48fd-887f-a8317c0f3667 Urban mobility: http://ec.europa.eu/transport/urban/urban_mobility/urban_mobility_en.htm Baltic Sea Strategy: http://ec.europa.eu/regional_policy/cooperation/baltic/index_en.htm

SIKA is an agency working in the transport and communications sector. Our main tasks are to make analyses, descriptions of the current situation and other reports for the Government, to develop forecast and planning methods and to be responsible for the official statistics. The reports are published in the series SIKA Rapport and SIKA PM. The statistics are published in the series SIKA Statistik. All publications are available on SIKA’s website www.sika–institute.se
Swedish Institute for Transport and Communications Analysis Akademigatan 2, SE-831 40 Östersund Phone +46 63-14 00 00 Fax +46 63-14 00 10 e-mail [email protected] www.sika-institute.se