Embed Size (px)
Citation preview
Chapter 6 Research Program
2009 Makua and Oahu Implementation Plan Status Report 521
6.6 RAT – KAHANAHAIKI: LARGE SCALE TRAPPING GRID 6.6.1 Introduction In May 2009, a large scale kill trapping grid for rat (Rattus sp.) control was initiated over an area of 65 acres (26 ha) at the Kahanahaiki MU (see figure below). The control grid follows the New Zealand Department of Conservation’s current best practices for kill trapping rats (see Appendix 6-2). OANRP purchased wooden snap trap boxes and tracking tunnel monitoring equipment that is only available from New Zealand to facilitate this method of control (photos on next page). The trap out grid was established as a pilot study with a goal of reducing rat activity in the MU to < 10%, as well as to determine the efficacy of this method of rat control and to determine labor requirements and costs. The grid encompasses 11 endangered plant species, both wild and reintroduced populations, and a large population of endangered Achatinella mustelina. The focal endangered taxa to be monitored closely are Cyanea superba subsp. superba and Achatinella mustelina. Beyond monitoring the focal taxa, OANRP will in addition monitor seedlings, seed fall, and arthropod composition and abundance. Slug and Euglandina rosea populations were monitored closely to determine if rats have had a suppressing affect on these introduced species. The Pahole Natural Area Reserve (NAR) will be used as a control site to determine what impacts rats are having (seedlings, arthropods, C. superba subsp. superba, slugs, and E. rosea).
Kahanahaiki MU: Rat control area and monitoring locations.
Chapter 6 Research Program
2009 Makua and Oahu Implementation Plan Status Report 522
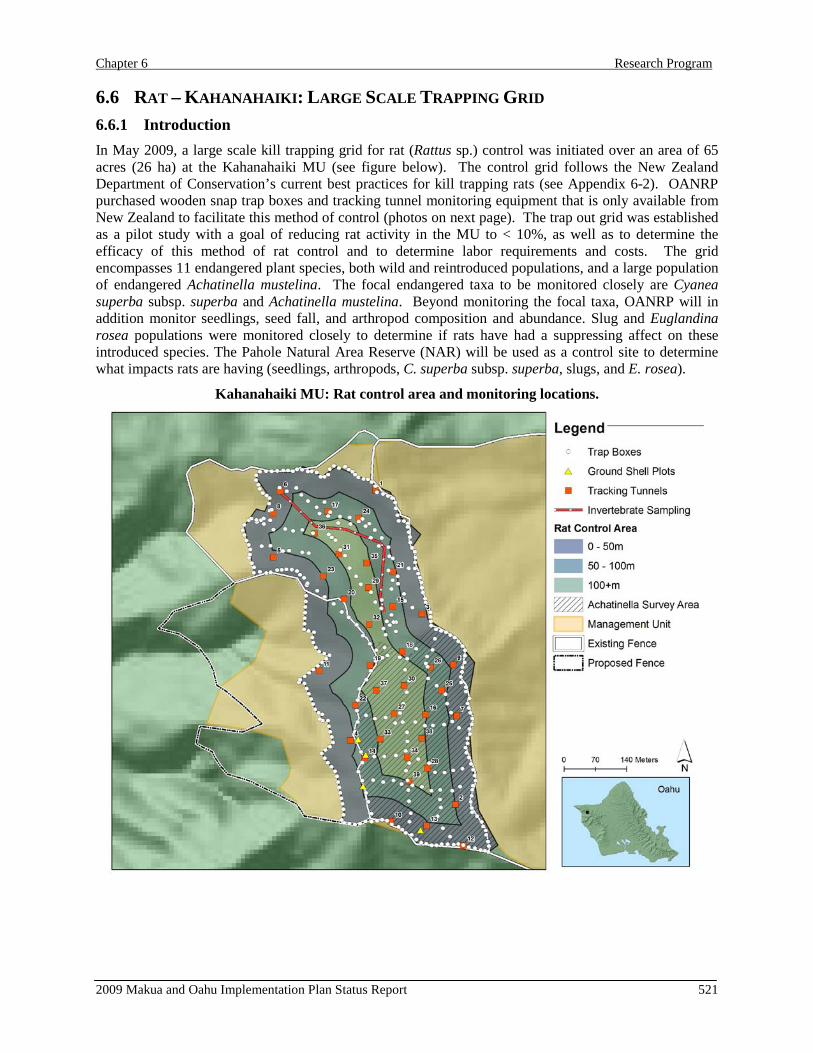
(A) Wooden snap trap box with Victor snap trap. (B) Wooden snap trap box deployed. (C) Plastic tracking tunnel with inked tracking card. (D) Tracking card with mouse tracks.
6.6.2 Data Collection/Methods 6.6.2.1 Rat Control (Kahanahaiki MU only) The trap out grid was established with a total of 402 traps (figure above, on previous page). The perimeter consists of 234 traps spaced at 12.5m apart. The interior contains 168 traps established on transects and existing trails (9 trap lines) at a spacing of 25m between traps. Traps were initially set and baited on May 4, 2009. Traps were checked daily for approximately the first two weeks, then on a weekly basis for eight weeks, then two three week intervals, with the current checking interval bi-weekly. Traps will continue to be checked every other week, unless determined through monitoring a change in interval length is needed. Baits that have been used include: peanut butter, macadamia nut halves, coconut chucks, scented surf wax, and Ferafeed (non-toxic bait from New Zealand).
6.6.2.2 Tracking Tunnels (Kahanahaiki MU & Pahole NAR) Kahanahaiki MU – Tracking tunnel locations (39) were randomly generated with ArcGIS into three buffer zones (0-50m, 50-100m, +100m), with each zone containing 13 tunnels (Figure 10.7.1). The minimum distance allowable between tunnels was set at 50m. The first running of tracking tunnels was on 30 April to 01 May (4 days) prior to baiting the trap out grid. The seconded running occurred two weeks later on 18 to 19 May. Each subsequent check will be monthly.
Pahole NAR- Tracking tunnels (30) were located within the two main drainages at 50 m intervals. Tracking tunnels will be run once a quarter with the initial running occurring on 17-18 August 2009.
A B
C D
Chapter 6 Research Program
2009 Makua and Oahu Implementation Plan Status Report 523
6.6.2.3 Slug Abundance Monitoring (Kahanahaiki MU & Pahole NAR) Relative slug density and species composition was determined through the use of beer baits left out for one week at each site. Two 8 ounce glass jars were deployed at 25 m intervals along a 475 m transect. A total of 40 jars were deployed and baited with 5 oz. of beer. The number and species identity of slugs captured in this manner were recorded at four month intervals.
6.6.2.4 Euglandina rosea Abundance Monitoring (Kahanahaiki MU & Pahole NAR) Euglandina rosea density was determined through timed searches along the same 475 m transect being use for slug sampling at each site. Ten plots (3 x 25 m) were searched for one person hour. Each plot was separated from its closet neighbor by an interval of 25 m. Live E. rosea were measured and their prescience noted, but left onsite recorded. Empty E. rosea shells were removed from plots and scored for rat damage (categories: intact, damage rat, damage other). Monitoring occurred at four month intervals.
6.6.2.5 Arthropod Composition & Abundance Sampling (Kahanahaiki MU & Pahole NAR) Two types of arthropod sampling were conducted: pitfall trapping and vegetation beating. Sixteen pitfall traps, spaced at 25 m intervals along the same 475 m transect (used for both slug and Euglandina monitoring), were established at each site. These 16 traps consisted of 10 ounce plastic cups sunk in the ground, and were operated for one week. In addition, four shrub or tree species were sampled for arthropods (Psidium cattleianum, Pipturus albidus, Pisonia umbelifera and Charpenteria tomentosa). Eight individuals of each of the four plant species were sampled. These were selected randomly along the 475 m transect. Each individual shrub/tree was sampled once per sampling event, which involves tapping low branches five times while holding a square sheet beneath the branches. All arthropods dislodged in this way were collected. Samples were collected at six month intervals.
6.6.2.6 Seedling Monitoring (Kahanahaiki MU & Pahole NAR) Eighty and sixty-five seedling plots were established within the gulch area of the Kahanahaiki MU and Pahole NAR respectively. Within each seedling plot (1 x 2 m), all woody plants ≥ 10 cm height (but less than 1 m height; henceforth seedlings) were identified, measured for height, measured for stem diameter above the root crown, and marked with an aluminum tag. Any woody plants < 10 cm height were identified but not measured or marked. Within each seedling plot, percent cover of dead wood and leaf litter, total vegetation cover (including grasses, herbs, and woody plants), and litter depth (at four standardized points in each of the corners of the seedling subplots) were measured. Seedling plots will be read once a year.
6.6.2.7 Seed Monitoring (Kahanahaiki MU only) Rodent-chewed seeds were monitored using seed buckets placed on the ground (bucket height and diameter each ca. 30 cm), with a cotton cloth attached to the bottom of the bucket, in Kahanahaiki forest. Forty-eight seed buckets were partitioned equally among 12 plots (each 15 x 15 m) that were previously established in Kahanahaiki gulch. The four buckets per plot were placed without regard to the canopy tree species, therefore allowing for a representative sample the natural seed rain of species that comprise the forest. An additional 10 buckets were placed below lama trees (Diospyros hillebrandia), which is an indigenous species to Hawaii that has seeds previously determined as highly vulnerable to R. rattus (A. Shiels, unpublished data). Because lama has a patchy distribution in Kahanahaiki, the 10 seed buckets were split evenly between two patches (each patch contained at least eight lama trees either overhanging buckets or within 3 m of a bucket). In addition to lama, the other indicator species that was assessed for seed damage among the 48 buckets was strawberry guava (Psidium cattleianum). Strawberry guava also has seeds that are highly vulnerable to rats (A. Shiels, unpublished data); it is also one of the most invasive trees in Hawaiian forests, and is the dominant tree species in Kahanahaiki gulch. Seed buckets will be monitored every two weeks.
Chapter 6 Research Program
2009 Makua and Oahu Implementation Plan Status Report 524
6.6.2.8 Achatinella mustelina Monitoring (Kahanahaiki MU only) An Achatinella census was conducted across the southern area of the Kahanahaiki MU in August 2009 (Figure 10.7.1). This area will have censuses conducted at three year intervals.
6.6.2.9 Cyanea superba subsp. superba Monitoring (Kahanahaiki MU & Pahole NAR) All mature fruiting C. superba subsp. superba will be monitored closely at both the Kahanahaiki MU and Pahole NAR from mid December through the first week of January (4 weeks) each year. The total number of fruit on each infructescence will be counted at each visitation. The following will be recorded (as a percentage of the total number of fruits present), 1) natural fruit fall (fruits will be counted on the ground where they occur), 2) fruits that have been damaged or eaten by rodents, 3) fruits which have been wholly or partially eaten by birds, 4) fruits which have rotten on the plant.
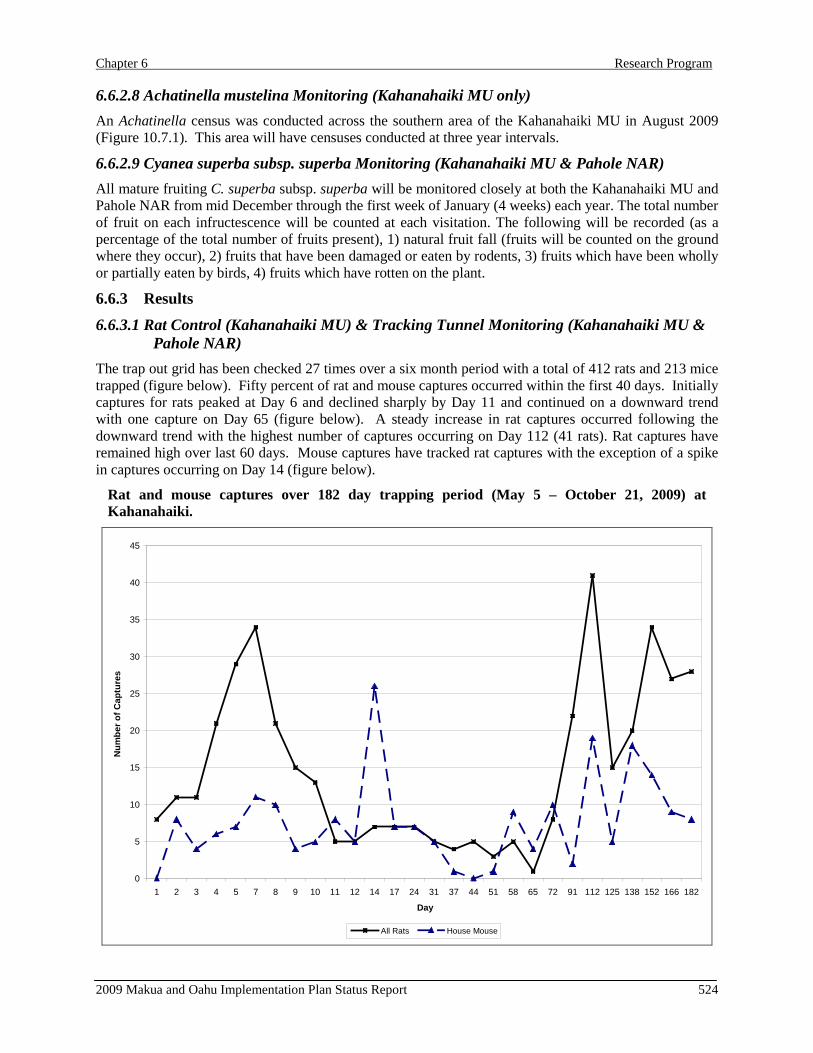
6.6.3 Results 6.6.3.1 Rat Control (Kahanahaiki MU) & Tracking Tunnel Monitoring (Kahanahaiki MU &
Pahole NAR) The trap out grid has been checked 27 times over a six month period with a total of 412 rats and 213 mice trapped (figure below). Fifty percent of rat and mouse captures occurred within the first 40 days. Initially captures for rats peaked at Day 6 and declined sharply by Day 11 and continued on a downward trend with one capture on Day 65 (figure below). A steady increase in rat captures occurred following the downward trend with the highest number of captures occurring on Day 112 (41 rats). Rat captures have remained high over last 60 days. Mouse captures have tracked rat captures with the exception of a spike in captures occurring on Day 14 (figure below).
Rat and mouse captures over 182 day trapping period (May 5 – October 21, 2009) at Kahanahaiki.
0
5
10
15
20
25
30
35
40
45
1 2 3 4 5 7 8 9 10 11 12 14 17 24 31 37 44 51 58 65 72 91 112 125 138 152 166 182
Day
Num
ber o
f Cap
ture
s
All Rats House Mouse
Chapter 6 Research Program
2009 Makua and Oahu Implementation Plan Status Report 525
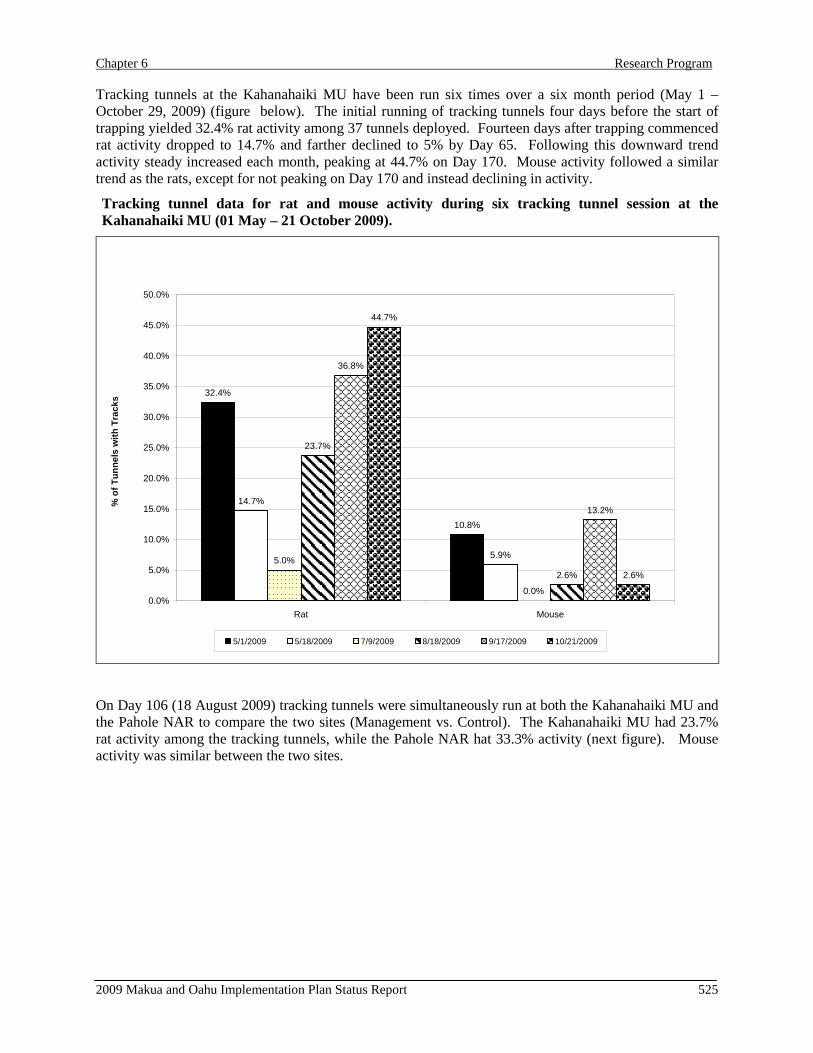
Tracking tunnels at the Kahanahaiki MU have been run six times over a six month period (May 1 –October 29, 2009) (figure below). The initial running of tracking tunnels four days before the start of trapping yielded 32.4% rat activity among 37 tunnels deployed. Fourteen days after trapping commenced rat activity dropped to 14.7% and farther declined to 5% by Day 65. Following this downward trend activity steady increased each month, peaking at 44.7% on Day 170. Mouse activity followed a similar trend as the rats, except for not peaking on Day 170 and instead declining in activity.
Tracking tunnel data for rat and mouse activity during six tracking tunnel session at the Kahanahaiki MU (01 May – 21 October 2009).
32.4%
10.8%
14.7%
5.9%5.0%
0.0%
23.7%
2.6%
36.8%
13.2%
44.7%
2.6%
0.0%
5.0%
10.0%
15.0%
20.0%
25.0%
30.0%
35.0%
40.0%
45.0%
50.0%
Rat Mouse
% o
f Tun
nels
with
Tra
cks
5/1/2009 5/18/2009 7/9/2009 8/18/2009 9/17/2009 10/21/2009
On Day 106 (18 August 2009) tracking tunnels were simultaneously run at both the Kahanahaiki MU and the Pahole NAR to compare the two sites (Management vs. Control). The Kahanahaiki MU had 23.7% rat activity among the tracking tunnels, while the Pahole NAR hat 33.3% activity (next figure). Mouse activity was similar between the two sites.
Chapter 6 Research Program
2009 Makua and Oahu Implementation Plan Status Report 526
Tracking tunnels in Kahanahaiki and Pahole (17-18 August 2009).
23.7%
2.6%
33.3%
3.3%
0.0%
5.0%
10.0%
15.0%
20.0%
25.0%
30.0%
35.0%
Rat Mouse
% o
f Tun
nels
with
Tra
cks
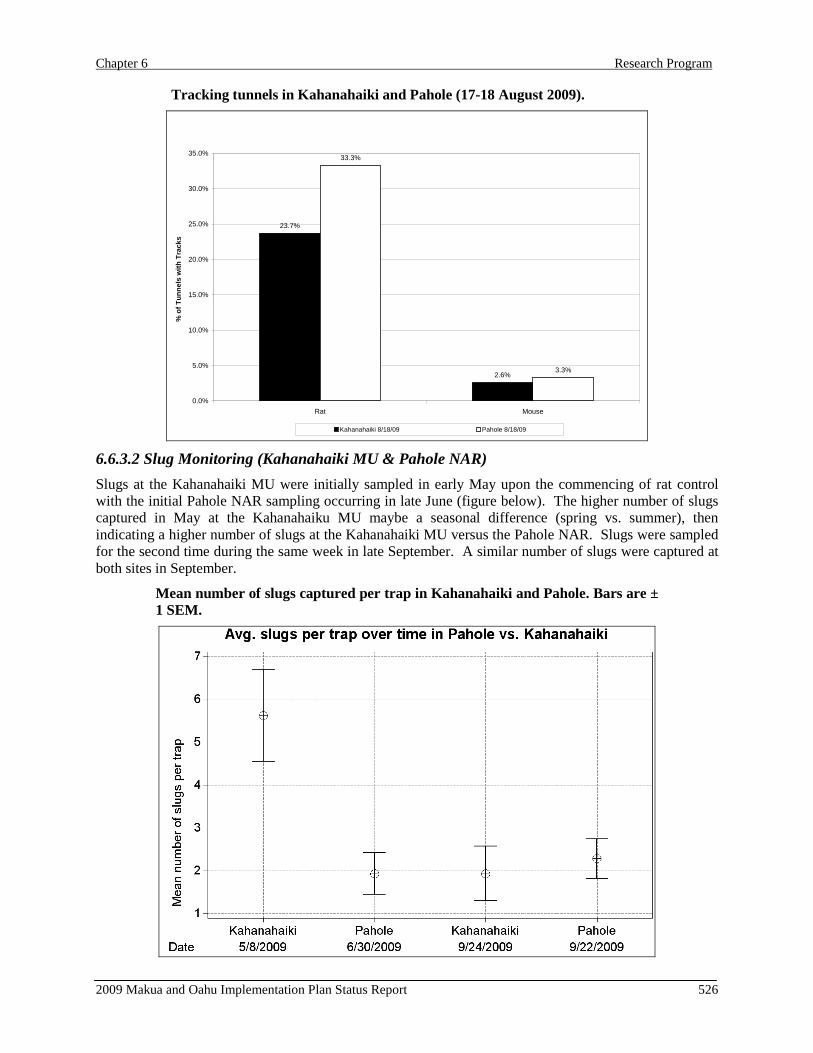
Kahanahaiki 8/18/09 Pahole 8/18/09 6.6.3.2 Slug Monitoring (Kahanahaiki MU & Pahole NAR) Slugs at the Kahanahaiki MU were initially sampled in early May upon the commencing of rat control with the initial Pahole NAR sampling occurring in late June (figure below). The higher number of slugs captured in May at the Kahanahaiku MU maybe a seasonal difference (spring vs. summer), then indicating a higher number of slugs at the Kahanahaiki MU versus the Pahole NAR. Slugs were sampled for the second time during the same week in late September. A similar number of slugs were captured at both sites in September.
Mean number of slugs captured per trap in Kahanahaiki and Pahole. Bars are ± 1 SEM.
Chapter 6 Research Program
2009 Makua and Oahu Implementation Plan Status Report 527
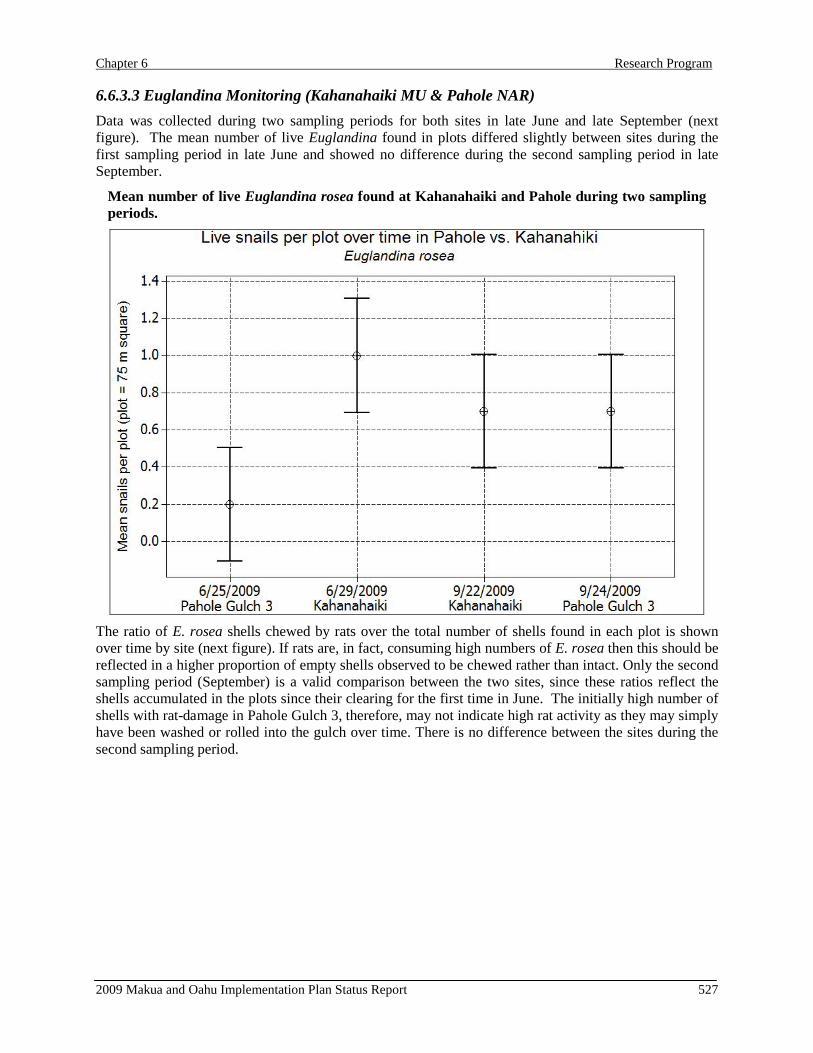
6.6.3.3 Euglandina Monitoring (Kahanahaiki MU & Pahole NAR) Data was collected during two sampling periods for both sites in late June and late September (next figure). The mean number of live Euglandina found in plots differed slightly between sites during the first sampling period in late June and showed no difference during the second sampling period in late September.
Mean number of live Euglandina rosea found at Kahanahaiki and Pahole during two sampling periods.
The ratio of E. rosea shells chewed by rats over the total number of shells found in each plot is shown over time by site (next figure). If rats are, in fact, consuming high numbers of E. rosea then this should be reflected in a higher proportion of empty shells observed to be chewed rather than intact. Only the second sampling period (September) is a valid comparison between the two sites, since these ratios reflect the shells accumulated in the plots since their clearing for the first time in June. The initially high number of shells with rat-damage in Pahole Gulch 3, therefore, may not indicate high rat activity as they may simply have been washed or rolled into the gulch over time. There is no difference between the sites during the second sampling period.

Chapter 6 Research Program
2009 Makua and Oahu Implementation Plan Status Report 528
Proportion of rat damaged Euglandina rosea shells from Kahanahaiki and Pahole (Each site has 10 plots that are each 75m2).
6.6.3.4 Arthropod Composition and Abundance Sampling (Kahanahaiki MU & Pahole NAR) Initial arthropod sampling was conducted in June 2009 for both the Kahanahaiki MU and Pahole NAR. Sixteen pitfall samples and 32 vegetation beating samples (eight each from four plant species) were collected. The second sampling period will be conducted in December 2009. June samples are currently being processed.
6.6.3.5 Seedling Monitoring (Kahanahaiki MU & Pahole NAR) From the initial (year 2009) seedling census, there were 313 individual seedlings marked within the 80 seedling plots established at Kahanahaiki. The majority of seedlings were Psidium cattleianum and Clidemia hirta and a total of seven non-indiginous species were represented. There were several (12) indigenous seedling species represented in the census, yet there were relatively few individuals of each indigenous species. Maile (Alyxia stellata, formerly A. oliviformis) was the most frequent indigenous seedling measured.
At Pahole, there were 140 seedlings marked within the 65 seedling plots. Interestingly, there tends to be slightly more individuals that are indigenous than non-indigenous. Maile was the most common indigenous seedling, out of 10 total indigenous species tagged, but lama (P. hillebrandii) also had relatively high representation in the seedling plots. Strawberry guava and Rubus rosifolius (thimbleberry) were the two most common non-indigenous species out of the seven total non-indigenous species tagged at Pahole.
Chapter 6 Research Program
2009 Makua and Oahu Implementation Plan Status Report 529
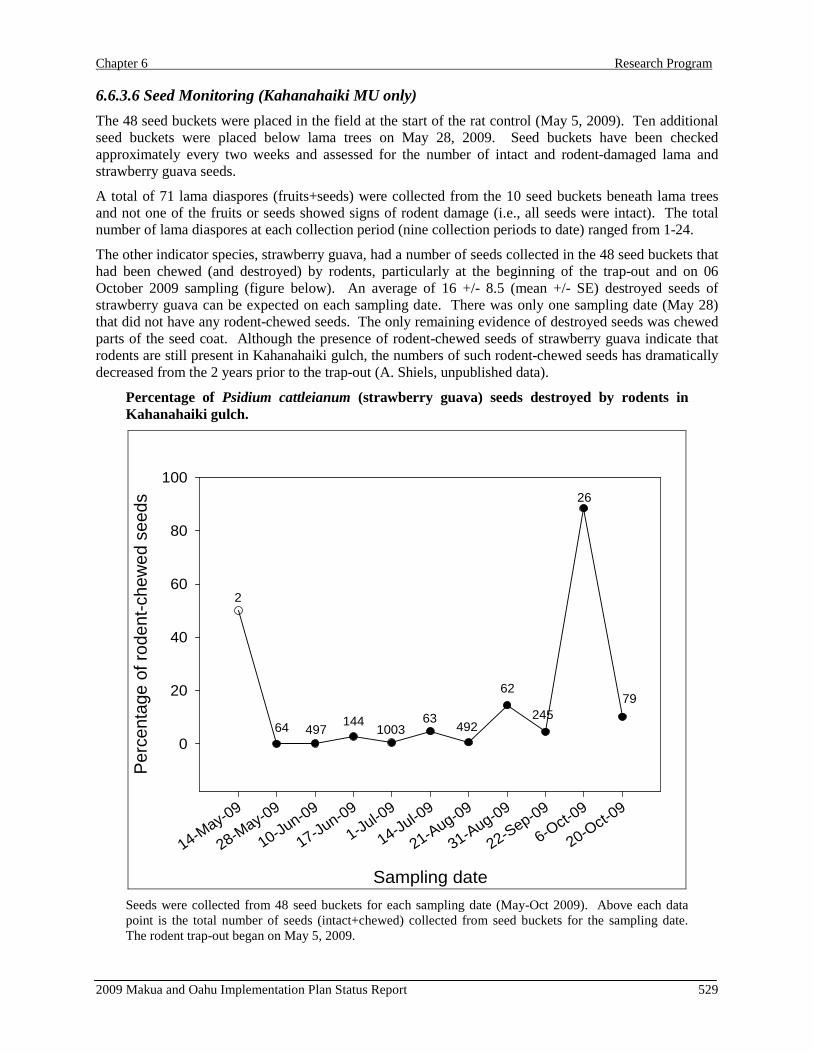
6.6.3.6 Seed Monitoring (Kahanahaiki MU only) The 48 seed buckets were placed in the field at the start of the rat control (May 5, 2009). Ten additional seed buckets were placed below lama trees on May 28, 2009. Seed buckets have been checked approximately every two weeks and assessed for the number of intact and rodent-damaged lama and strawberry guava seeds.
A total of 71 lama diaspores (fruits+seeds) were collected from the 10 seed buckets beneath lama trees and not one of the fruits or seeds showed signs of rodent damage (i.e., all seeds were intact). The total number of lama diaspores at each collection period (nine collection periods to date) ranged from 1-24.
The other indicator species, strawberry guava, had a number of seeds collected in the 48 seed buckets that had been chewed (and destroyed) by rodents, particularly at the beginning of the trap-out and on 06 October 2009 sampling (figure below). An average of 16 +/- 8.5 (mean +/- SE) destroyed seeds of strawberry guava can be expected on each sampling date. There was only one sampling date (May 28) that did not have any rodent-chewed seeds. The only remaining evidence of destroyed seeds was chewed parts of the seed coat. Although the presence of rodent-chewed seeds of strawberry guava indicate that rodents are still present in Kahanahaiki gulch, the numbers of such rodent-chewed seeds has dramatically decreased from the 2 years prior to the trap-out (A. Shiels, unpublished data).
Percentage of Psidium cattleianum (strawberry guava) seeds destroyed by rodents in Kahanahaiki gulch.
Sampling date
14-May-09
28-May-09
10-Jun-09
17-Jun-09
1-Jul-09
14-Jul-09
21-Aug-09
31-Aug-09
22-Sep-09
6-Oct-09
20-Oct-09
Perc
enta
ge o
f rod
ent-c
hew
ed s
eeds
0
20
40
60
80
100
2
64 497144
100363
492
62
245
26
79
Seeds were collected from 48 seed buckets for each sampling date (May-Oct 2009). Above each data point is the total number of seeds (intact+chewed) collected from seed buckets for the sampling date. The rodent trap-out began on May 5, 2009.
Chapter 6 Research Program
2009 Makua and Oahu Implementation Plan Status Report 530
6.6.3.7 Achatinella mustelina Monitoring (Kahanahaiki MU only) A total of 212 Achatinella mustelina were counted during the August 2009 census of the Maile Flats area of the Kahanahaiki MU (for more information see MIP 2009 Snail section). A census of this area will be conducted every three years. If necessary this interval will be reduced to annually.
6.6.3.8 Cyanea superba subsp. superba Monitoring (Kahanahaiki MU & Pahole NAR) Monitoring will be initiated in December 2009 and into January 2010.
6.6.4 Discussion This large scale trap out grid is the first of its kind to be implemented in Hawaii for conservation purposes. In New Zealand the Department of Conservation has had tremendous success in controlling rats for the benefit of endangered forest birds using large scale trap out grids. Among New Zealand standards the Kahanahaiki MU grid would be considered very small for landscape scale control. OANRP is viewing the Kahanahaiki MU trap out grid as a pilot study to determine this methods effectiveness, as well as looking at cost comparisons among other available methods of control.
The goal of this control work is to reduce rat activity to < 10 percent within the Kahanahaiki MU, as well as reduce or eliminate rat predation on Cyanea superba subsp. superba fruits during the fruiting producing period (October through early January) and to reduce rat predation on tree snails. An additional goal is to see a positive change in general forest health through the increase recruitment of native plant species. Over time the OANRP should be able to determine a threshold of rat activity which negatively or positively influences desired focal species conservation. It will take months or even years to make these sorts of determinations as knowledge is slowly gained through continual and close monitoring of rat activity and resource responses to control.
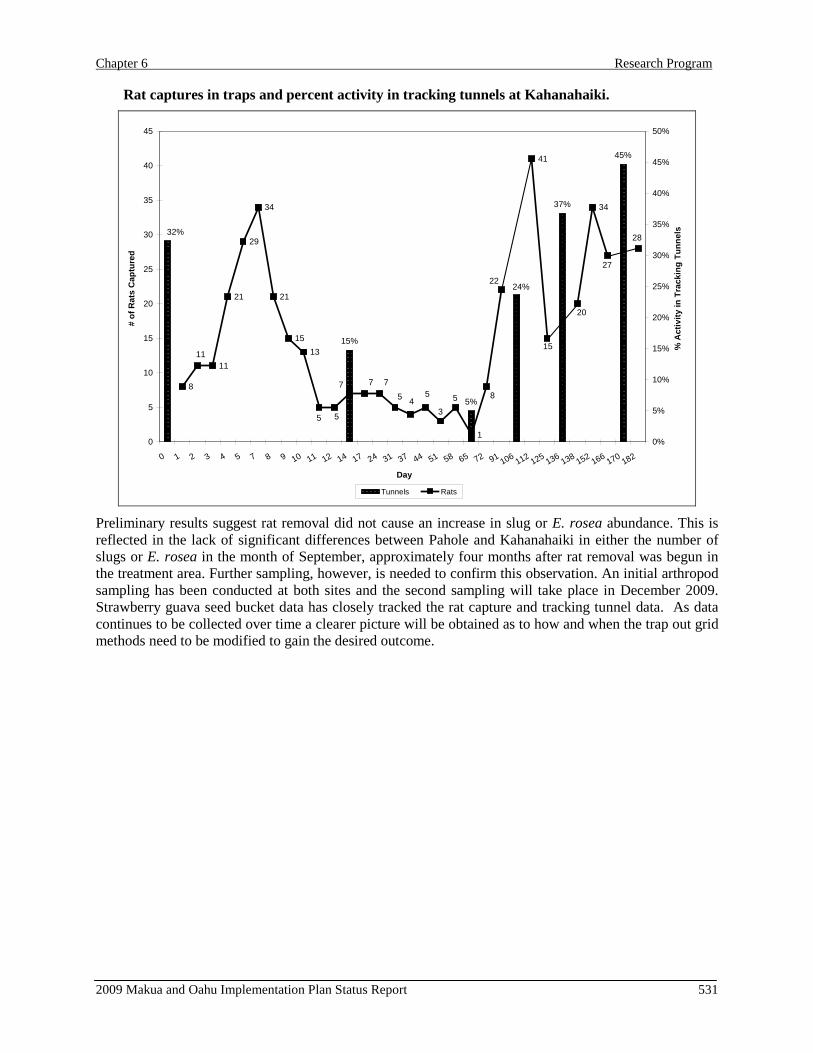
Capture and tracking tunnel data showed an initial peak in captures within the first week (10 May) followed by a decline in both number of captures and tracking tunnel activity by Day 65 (08 July). By Day 91 (03 August), an upward trend in captures and tracking tunnel activity ensued, with the number of captures peaking on Day 112 (24 August) at 41 rat and tracking tunnels on Day 170 (21 October) at 45 percent (next figure). This increased number of rat captures and rat activity in tracking tunnels may possibly be attributed to the natural rat population cycle. A. Shiels (unpublished data) found rat activity (trapping) to be at their highest during the period between August and December at Kahanahaiki. It appears that the resident population of rats was reduced very quickly at the start of the trapping, but increased with the influx of rats from outside the trapping grid. This assumption will only be confirmed with continued trapping and monitoring over time.
Chapter 6 Research Program
2009 Makua and Oahu Implementation Plan Status Report 531
Rat captures in traps and percent activity in tracking tunnels at Kahanahaiki.
15%
5%
37%
45%
24%
32%
8
11
21
29
34
21
1513
1
41
34
3
5
5
15
20
22
8554
777
5
11
28
27
0
5
10
15
20
25
30
35
40
45
0 1 2 3 4 5 7 8 9 10 11 12 14 17 24 31 37 44 51 58 65 72 91 106 112 125 136 138 152 166 170 182
Day
# of
Rat
s C
aptu
red
0%
5%
10%
15%
20%
25%
30%
35%
40%
45%
50%
% A
ctiv
ity in
Tra
ckin
g Tu
nnel
s
Tunnels Rats
Preliminary results suggest rat removal did not cause an increase in slug or E. rosea abundance. This is reflected in the lack of significant differences between Pahole and Kahanahaiki in either the number of slugs or E. rosea in the month of September, approximately four months after rat removal was begun in the treatment area. Further sampling, however, is needed to confirm this observation. An initial arthropod sampling has been conducted at both sites and the second sampling will take place in December 2009. Strawberry guava seed bucket data has closely tracked the rat capture and tracking tunnel data. As data continues to be collected over time a clearer picture will be obtained as to how and when the trap out grid methods need to be modified to gain the desired outcome.

Chapter 6 Research Program
2009 Makua and Oahu Implementation Plan Status Report 532