Embed Size (px)
Citation preview

PerspectiVe
NMR-Based Metabolic Profiling and Metabonomic Approaches toProblems in Molecular Toxicology
Muireann Coen,* Elaine Holmes, John C. Lindon, and Jeremy K. Nicholson*
Department of Biomolecular Medicine, Sir Alexander Fleming Building, Surgery, Oncology, ReproductiVeBiology and Anesthetics DiVision, Faculty of Medicine, Imperial College London, London SW7 2AZ, United Kingdom
ReceiVed September 13, 2007
We have reviewed the main contributions to the development of NMR-based metabonomic and metabolicprofiling approaches for toxicological assessment, biomarker discovery, and studies on toxic mechanisms.The metabonomic approach, (defined as the quantitative measurement of the multiparametric metabolicresponse of living systems to pathophysiological stimuli or genetic modification) was originally developedto assist interpretation in NMR-based toxicological studies. However, in recent years there has beenextensive fusion with metabolomic and other metabolic profiling approaches developed in plant biology,and there is much wider coverage of the biomedical and environmental fields. Specifically, metabonomicsinvolves the use of spectroscopic techniques with statistical and mathematical tools to elucidate dominantpatterns and trends directly correlated with time-related metabolic fluctuations within spectral data setsusually derived from biofluids or tissue samples. Temporal multivariate metabolic signatures can be usedto discover biomarkers of toxic effect, as general toxicity screening aids, or to provide novel mechanisticinformation. This approach is complementary to proteomics and genomics and is applicable to a widerange of problems, including disease diagnosis, evaluation of xenobiotic toxicity, functional genomics,and nutritional studies. The use of biological fluids as a source of whole organism metabolic informationenhances the use of this approach in minimally invasive longitudinal studies.
Contents1. Introduction to Metabolic Profiling 9
2. Background: The Early Days of Metabolic NMRspectroscopy
10
3. Pattern Recognition for Sample Classificationand Biomarker Discovery
10
4. Metabonomic and Integrated MetabonomicApplications in Toxicology
13
5. Metabolic Information from Intact Tissues:Magic Angle Spinning (MAS) NMR
14
6. Ultrahigh Field NMR Spectroscopy of BiologicalSamples
15
7. Improved Analytical Technologies for MetaboliteIdentification: Solid-Phase ExtractionChromatography, Liquid Chromatography, andMass Spectrometry
16
8. Statistical Spectroscopy and BiomarkerDiscovery
17
9. Recent Consortium Projects Using NMR/MSDriven Metabonomics and Top-Down SystemsBiology in Toxicology
18
10. Clinical Metabonomics 19
11. Molecular Epidemiology 19
12. Integrated -Omic Applications 20
13. Pharmacometabonomics and Implications of theExtended Genome
20
14. Concluding Remarks 21
1. Introduction to Metabolic Profiling
Broad spectrum metabolic profiling is now recognized as apowerful top-down systems biology tool that can provide a realworld link to other omics sciences (1–4). The terms metabolomics(5–7) and metabonomics (8) are widely applied to these types ofstudies, and the terminology is often used interchangeably. Meta-bonomics provides a whole-organism biological description of time-related multivariate metabolic response to a treatment. It facilitatesthe study of the metabolic products and interactions of hundredsof cellular metabolomes (metabolic complements) and fluidcompartments, which are unique to each cell type in the body butare coordinated in space and time, and this concept of the interactingmetabolomes has been termed the metabonome (9). A variety ofanalytical technologies have been applied to metabolic profilingin toxicology, but most approaches utilize NMR spectroscopy ormass spectrometry as these instrumentalities can capture informa-tion on hundreds or even thousands of metabolites in a sample ina single analytical run. To date, there have been more publicationsreflecting the application of NMR spectroscopy in metabolictoxicology (excluding drug metabolism applications), but modernLC-MS methods are now being successfully utilized in this area(10–12), and the balance will change although we consider thatthere will always be a role for NMR in rapid multivariate metabolicprofiling and in metabolic structural elucidation. As NMR spec-troscopy (in its own right) comprises a wide range of analyticaltechniques (and can be applied to biofluids as well as intact tissues),
* To whom correspondence should addressed.
Chem. Res. Toxicol. 2008, 21, 9–27 9
10.1021/tx700335d CCC: $40.75 2008 American Chemical SocietyPublished on Web 01/03/2008

we have concentrated our review on the role of NMR spectroscopyin the development of toxicological metabonomics, but we havealso considered cognate biomedical applications as they will be ofincreasing importance in the future.
2. Background: The Early Days of Metabolic NMRspectroscopy
The development of Fourier transform NMR spectroscopyin the late 1960s, the introduction of superconducting magnetsin the 1970s, and the consequent sensitivity increases resultedin the first applications of NMR spectroscopy for the metabolicprofiling of biofluids and cells. Since then, numerous studieshave concentrated on the use of 1H NMR spectroscopy tocharacterize toxic response to drugs, as reflected in biofluidspectral signatures, and many novel metabolic markers of organ-specific toxicity have been discovered (13). The role ofmetabonomics in particular and magnetic resonance in generalin the toxicological evaluation of drugs has developed exten-sively (14). 1H NMR spectroscopy is well suited to the studyof toxic events, as a biofluid fingerprint that reflects toxicresponse can be rapidly achieved without bias imposed byexpectations of the type of toxin-induced metabolic changes.Moreover, many of the NMR-detectable metabolites are presentat moderate to high concentrations and represent the productsand intermediates of many important or hub pathways that areaffected by many toxic or disease processes. Early applicationsof NMR spectroscopy found that quantitative changes inmetabolite patterns gave information on the location and severityof toxic lesions, together with insights into the underlyingmolecular mechanisms of toxicity (13, 15–17).
Examples of early NMR studies of toxins include the effectsof exposure to cadmium and mercury salts, which are bothpotent nephrotoxins (18), with acute cadmium exposure alsocausing profound testicular toxicity. NMR methods were appliedsuccessfully to analyze urine for novel metabolites caused byexposure of rats to acute cadmium and mercury dosing indose-response studies. In the case of mercury, classical patternsof acquired Fanconi syndrome were observed, with markers ofproximal tubular injury, including marked amino and organicaciduria, coupled with differential responses of citric acid cycleintermediate excretion (e.g., low citrate with high succinate)consistent with selective inhibition of mitochondrial enzymessuch as succinate dehydrogenase and malate dehydrogenase (15).These studies showed for the first time that it was possible tocapture site-specific severity and mechanistic informationsimultaneously. Studies by Gartland et al. (19) further demon-strated the value of such screening in determining the region-specific toxicity using a variety of experimental nephrotoxins.Many other proximal tubular toxins were studied around thistime showing spectroscopic commonalities of time response andrecovery from injury (20–23). The proximal tubular toxicity ofpara-amino phenol was extensively studied (24, 25) togetherwith the protective effects of buthionine sulfoximine treatmentand biliary cannulation (26), which showed that this compoundworked effectively via a toxic thiol mechanism involving initialglutathione conjugation followed by further metabolism and thegeneration of a toxic thiol adduct that was transported to thekidney. In addition, the utility of the NMR approach in clinicaltoxicology was highlighted in a case study involving cutaneousexposure to phenol causing renal failure, the progression andrecovery from which was followed by NMR spectroscopy (27).This study predates the metabolic trajectory analysis approaches(see below) for studying the development of lesions in experi-mental toxicology studies that were to become important later
in the 1990s. In the case of cadmium toxicity, a similar approachwas employed to show that urinary creatine was a highlysensitive early reporter of acute testicular injury with urinarycreatine being elevated many hours before lesions becamedetectable by histopathology (28, 29). In later studies byTimbrell and co-workers (30, 31), it was found that creatinuriacould also indicate liver damage, but this was only reallyindicative in the presence of concomitant taurinuria. Taurinuriawas first demonstrated by NMR as a useful urinary marker forliver injury (32, 33), and a wide variety of hepatotoxins arenow known to cause taurinuria, although this can be veryvariable depending on dietary sources (34). Other interestingsubtoxic, but toxicologically significant metabolic effects ofdrugs could also be observed using this approach such as sugaracidurias caused by aldose reductase inhibitors (35). Ghauri etal. showed that chronic acetaminophen ingestion caused 5-oxo-prolinuria in rats and that this could be completely eliminatedusing dietary methionine supplements indicating that oral drugdosing could deplete sulfur-containing amino acids and disruptthe glutathione cycle (36). It was later shown that even attherapeutic doses in humans, fractional 5-oxoprolinuria couldbe detected after acetaminophen treatment (37).
3. Pattern Recognition for Sample Classification andBiomarker Discovery
The use of chemometric methods to analyze complex spectraldata sets was perhaps the single most important developmentin the practical application of metabonomics and has definedthe development and progression of the field ever since. Thefirst studies that used PR to classify biofluid samples used asimple scoring system to describe the fluctuating levels of 18major endogenous metabolites in urine from rats that either werein a control group or had received a specific organ toxin thataffected the liver, the testes, the renal cortex, or the renal medulla(38, 39). These studies showed that samples corresponding todifferent organ toxins mapped into distinctly different regionsof the pattern recognition diagrams indicating that site-specificand severity information could be captured directly from themetabolic profile. Various refinements in data analysis wereinvestigated, including taking scored data at three time pointsafter toxin exposure for the nephrotoxins only as well as usinga simple dual scoring system (the time and magnitude of thegreatest change from control). The maps derived from the fulltime course information provided the best discriminationbetween toxin classes, emphasizing the importance of capturingdynamic information in the characterization of toxic lesions.This study was further extended (40) to incorporate actualmetabolite NMR resonance intensities rather than simple scores.This was carried out for the nephrotoxins in the earlier groupplus additional nephrotoxic compounds. A good separation ofrenal medullary and renal cortical toxins was achieved. Inaddition, it was possible to differentiate cortical toxins accordingto the region of the proximal tubule (S1, S2, and S3), whichwas affected, and also by the biochemical mechanism of thetoxic effect. However, it was noted that absolute quantificationof metabolites did not necessarily improve PR classification oftoxicity over simple scoring systems.
The time course of metabolic urinary changes induced bytwo renal toxins was first investigated in detail by metabonomicsusing Fisher 344 rats administered a single acute dose of therenal cortical toxin, mercury II chloride, and the renal papillarytoxin, 2-bromoethanamine (41, 42). Rat urine was collected forup to 9 days after dosing, and samples were analyzed usinghigh resolution 1H NMR spectroscopy. The onset, progression,
10 Chem. Res. Toxicol., Vol. 21, No. 1, 2008 Coen et al.

and recovery of the lesions were also followed using histopa-thology to provide a definitive classification of the toxic staterelating to each urine sample, and the geometry of the trajectorygenerated information relating to the mechanism and sequentialtargets of the toxin. The concentrations of 20 endogenous urinarymetabolites were measured at 8 time points after dosing andmapping methods were used to reduce the data dimensionality.These showed that the points on the plot could be related tothe development of, and recovery from, the lesions.
Early pattern recognition studies on NMR data employed areductionist approach of preselecting metabolite signals ofinterest. However, the NMR spectral results generated in ametabonomic study yield a unique metabolic fingerprint for eachbiofluid sample consisting of thousands of overlapping reso-nances, and measurement of a small set of signals will not reflectthe full potential of the spectral profile. If the status of a givenorganism changes, such as in a diseased state or followingexposure to a drug, the unique metabolic fingerprint or signaturereflects this change (2, 13). Multivariate statistical methodsprovide an expert means of analyzing and maximizing informa-tion recovery from complex NMR spectral data sets. Detailedinspection of NMR spectra and integration of individual peakscan give valuable information on dominant biochemical changes;however, subtle variation in spectra may be overlooked, and itis difficult to envisage general effects as a function of both doseand time in a large cohort of samples with biological variability.Pattern recognition methods can be used to map the NMRspectra into a representative low dimensional space such thatany clustering of the samples based on similarities of biochemi-cal profiles can be determined and the biochemical basis of thepattern elucidated.
The initial objective in metabonomics is to classify a spectrumbased on identification of its inherent patterns of peaks and,second, to identify those spectral features responsible for theclassification (according to physiological or pathological status),which can be achieved via both supervised and unsupervisedpattern recognition techniques. The NMR spectral data ispreprocessed, which typically involves Fourier transformation,calibration of the chemical shift scale using an internal referencestandard, and phase and polynomial baseline correction. Toprepare the NMR data for multivariate modeling, the spectraare often divided into regions (along the chemical shift axis)whose areas are summed to provide an integral so that theintensities of peaks in such defined spectral regions are extracted,a process known as binning. This results in a data matrix (Figure1a) consisting of rows that reflect observations/samples andcolumns that represent variables, for example, the spectralintegrals of defined bins across the whole spectral width (43).Recent advances in chemometric approaches involve the utiliza-tion of full resolution NMR data, where each data point in anacquired spectrum is extracted as a variable for modeling. Thisapproach has many advantages, for example, the spectralstructure is retained, which enables the NMR user to identifymetabolites with ease, and it also avoids searching within binspost data modeling to determine metabolites of discriminatoryimportance. The use of full resolution NMR data in chemometricmodeling will be discussed in greater detail in a later sectionthat encompasses orthogonal-projection on latent structures-discriminant analysis (O-PLS-DA).
Following the above preprocessing steps and the output of adata matrix consisting of samples and their associated variables,normalization is often applied to the rows (spectra). This adjustsspectral intensities so that concentration differences betweensamples are accounted for such that the samples are more
directly and reliably comparable. A commonly applied normal-ization method known as normalization to total area or constantsum sets the total spectral area of each spectrum to unity;therefore, the intensities of all data points are expressed relativeto this. However, many other approaches are routinely used,and metabonomic studies that have investigated the effects ofnormalization routines on data modeling have been reported inthe literature (44, 45). Scaling is the final preprocessing steptypically applied to NMR spectral data prior to chemometricmodeling and is a column operation that aims to reduce thenoise in the data and hence improve model interpretability, forexample, each column in a matrix can be set to have unitvariance or a mean of zero (44, 46).
Principal components analysis (47) has been widely used inmetabonomic studies and is an unsupervised approach in thatit allows inherent clustering behavior of samples to be ascer-tained with no a priori knowledge of sample class membership.PCA reduces the dimensionality of a data set as it allowsmultidimensional data vectors to be projected onto a hyper-plane of lower dimensions (typically 2 or 3), with this projectionexplaining as much of the variation as possible within the data.As previously introduced, the NMR data consists of a matrixof N observations (spectra) and K variables (spectral regions)(Figure 1a) so that a variable space of K dimensions is created.Each variable represents a numerical value on one coordinateaxis, and each observation is placed in K-dimensional space.This situation is depicted in Figure 1b for the simple case ofthree variables in which all observations are added to the onecoordinate system (Figure 1c), and then the first principalcomponent (PC) is calculated by a standard method. The firstPC (PC1) is a linear combination of the original input variables,and it describes the largest variation in the data set (Figure 1c).The second PC (PC2) is then calculated, and this is orthogonalto PC1 and describes the next highest degree of variation in
Figure 1. Principal components analysis. (a) Stylized data matrixconsisting of N observations (spectra, N ) 4) and K variables (spectralregions, K ) 3). (b) Representation of the three variables placed in a3D Cartesian coordinate system. (c) All observations in the data matrixare placed in 3D space, and the computed principal components areshown as vector arrows. Key: Obs, Observation; Var, Variable.(Reprinted with permission from Coen, M., and Kuchel, P.W. (2004)Metabonomics based on NMR spectroscopy. Chem. Aust. 6, 13–17.Copyright 2004 The Royal Australian Chemical Institute Inc.)
PerspectiVe Chem. Res. Toxicol., Vol. 21, No. 1, 2008 11

the data set. When two PCs have been defined, they constitutea plane; hence, projection of the observation vectors (in3-dimensions in Figure 1) in the multidimensional space ontothis plane enables the data to be visualized in a two-dimensional(2D) map known as a scores plot. This plot reveals any inherentclustering of groups of data, based purely on the closeness orsimilarity of their input coordinates. Thus, the analysis providesa convenient and objective means of reducing the complexityof the original data and of visualizing groups and classifyingthem. A loadings plot is used to interpret the scores plot as itillustrates the spectral variables that contribute to the positioningof the samples on the scores plot and hence the variables whichinfluence any observed separation in the data set. In addition,there are many other visualization (or unsupervised) methods,such as nonlinear mapping and hierarchical cluster analysis (38).
Alternatively, in what are known as supervised methods, datasets can be modeled so that the class of separate samples (avalidation set) can be predicted on the basis of a series ofmathematical models derived from the original data or trainingset. One widely used supervised method is partial least squaresor projection to latent structures (PLS (48)), which relates adata matrix containing independent variables from samples, suchas spectral intensity values (an X matrix), to a matrix containingdependent variables (e.g., measurements of response, such astoxicity scores) for those samples (a Y matrix). PLS-discriminantanalysis (PLS-DA) uses a Y matrix that contains sample classmembership information and hence is widely used for sampleclassification. PLS-DA has also been combined with a prepro-cessing filter called orthogonal signal correction (OSC), whichremoves structured class independent variation in data that mayarise from analytical variation over the spectral acquisition timeor from innate physiological variation (49, 50). The use of theseand related technologies in metabonomics has recently beenreviewed by Trygg et al. (51).
O-PLS-DA (51–53) is a relatively new approach that extendsthe traditional supervised algorithm of PLS by prefilteringclassification-irrelevant orthogonal variation from data. Thisprefiltered, structured noise in the data set is modeled separatelyfrom the class variation and can also be further interpreted viathe loading matrices. The application of O-PLS-DA improvesthe interpretability of spectral variation between classes and hasbeen shown to successfully discriminate metabolic profiles ina wide range of studies, for example, the metabolic profiles ofdiets encompassing high-meat, low-meat, and vegetarian content(54).
A recent significant advance in chemometric modeling wasthe use of full-resolution NMR data sets that represented eachdata point in the spectrum rather than binned NMR data thatrepresented summed segments of a spectrum. The use of full-resolution (all computer points in spectrum) NMR data allowsthe spectral structure to be retained, and this together withO-PLS-DA models that incorporate the correlation weight ofthe variables enabled loadings plots that are color coded andeasily interpretable by the spectroscopist to be obtained (55).O-PLS-DA modeling together with this back-scaling step hasbeen successfully applied to determine the metabolic conse-quences in multiple biofluid compartments of administration ofthe hepatotoxins, galactosamine and allyl formate (56, 57), andto characterize a model of irritable bowel syndrome togetherwith the effects of the coadministration of probiotic bacteria(58). An example of such a back-scaled O-PLS loadings plotthat differentiates between urine from control and galactosamine-treated animals is given in Figure 2. The increased and decreasedlevels of metabolites that discriminate between classes canclearly be identified as the spectral structure is retained, andthe metabolites are color coded with respect to discriminatorysignificance. The application of O-PLS-DA to model fullresolution 1H NMR data sets also provides a means of dealing
Figure 2. O-PLS-DA pair-wise modeling of urinary 600 MHz 1H NMR spectra (acquired using the standard one-dimensional solvent suppressionpulse sequence) from controls and galactosamine-treated classes to aid in identification of latent biomarkers within complex NMR data sets. (a)Model statistics, (b) cross-validated scores, and (c) O-PLS-DA coefficient loadings of full-resolution urinary NMR data revealing metabolitesresponsible for discrimination between controls and galN-treated samples. The color scale represents correlation (r2) to the discriminant variable.The upper section of the loadings plots represents metabolites increased in the treated class, whereas the lower part represents metabolites decreasedin intensity. (Reprinted with permission from ref 56. Copyright 2007 American Chemical Society.)
12 Chem. Res. Toxicol., Vol. 21, No. 1, 2008 Coen et al.

with peak position variation and spectral misalignment issuesas reliable models that are easily interpretable are produced (55).Peak positional variation is mainly caused by pH variation in agroup of biological samples and a number of approaches toresolve the problem in urine NMR spectra have been published.These include the application of PCA to determine the misalign-ment for a given peak in a serial set of data (59), generalizedfuzzy Hough transform (60), genetic algorithms and segment-wise peak alignment (61), and fuzzy warping (62). Reliablestatistical modeling and peak alignment of LC-MS data ispotentially a far greater problem, and efforts have also begunin this field to deal with these preprocessing problems (63–65).
Apart from the methods described above that use linearcombinations of parameters for dimension reduction or clas-sification, other nonlinear methods are widely used for multi-variate data modeling such as neural networks (66, 67). Othernovel data mining approaches include Bayesian modeling (68)and kernel-based partial least squares (69). A comprehensivereview of the chemometric tools commonly applied to meta-bonomic data is provided in Trygg et al. and Eriksson et al.(51, 53).
As chromatographic and linked mass spectrometric toolsincreasingly find application in metabonomic and metabolomicstudies, data mining methods that can deal with the highinformation content of these data are under investigation. Atypical UPLC-MS spectrum will contain tens of thousands ofpeaks, which presents a new challenge in terms of extractingthe relevant biomarker information. O-PLS-DA modeling hasbeen applied to binned UPLC-MS data from a study ofhydrazine toxicity to reduce the data to a number of candidatebiomarker peaks, that is, those that are most significant in termsof class differentiation, these peaks then being further analyzedand structurally characterized (70). Further studies have utilizedautomatic peak detection, alignment, and data compressionalgorithms combined with PLS-DA for LC-MS data (63) anddeconvolution approaches for GC-MS data sets (71).
4. Metabonomic and Integrated MetabonomicApplications in Toxicology
A wide range of toxins have now been investigated viametabonomic methods, including the kidney cortical toxinsmercury II chloride (15, 21, 41), p-aminophenol (24, 25, 72),uranyl nitrate (22, 23), the anticancer drug ifosfamide (73–75),cephaloridine (20, 76, 77), the kidney medullary and papillarytoxin, propylene imine (19, 78), and the renal papillary toxin2-bromoethanamine hydrochloride (19, 21, 46, 79–82). A hostof liver toxins have been studied using NMR-based metabo-nomics, including hydrazine (33, 83–85), allyl alcohol (32, 46),thioacetamide (86), 1-naphthylisothiocyanate (87–89), allylformate (57), galactosamine (56, 90–92), bromobenzene (93, 94),acetaminophen (95–100), and carbon tetrachloride (32).
A recent publication (101) presents the results of an NMR-based metabonomic study, which investigated urinary profilesfrom rats dosed with two bisphosphonates, ibandronate andzoledronate, that are known to cause renal impairment in theclinical setting. This study was performed under fully blindedconditions and interestingly found diverse toxic responses forthese compounds, which correlated with clinical chemistry andhistopathology findings. Zoledronate was found to induce bothnephrotoxicity and hepatotoxicity, and a previously unknownbiomarker, namely, N-acetylfelinine was also discovered, thismolecule previously being thought to only occur in felinespecies. N-acetylfelinine is directly reflective of the mode ofaction of bisphosphonates, which involves inhibition of farnesyl
diphosphate synthase and hence can be used to monitor the inViVo inhibition activity of the drug. This study highlights thepower of a nontargeted metabonomic approach in elucidatingnovel biomarkers of toxic response and in furthering theunderstanding of the mode of action of drugs.
Metabonomic evaluation of CI-1018, a selective type 4phosphodiesterase inhibitor associated with vasculitis in rats,has also been undertaken and NMR spectral urinary profilesdiscriminated between rats with vascular lesions and thosewithout (102). Vasculitis is encountered with several classes ofdrugs and the metabonomic approach has great potential fordeveloping a rapid, noninvasive means of diagnosis.
The increasing application of NMR-based metabonomics forthe diagnosis of environmental toxicology and in ecotoxicologyassessment is evident in the published literature. An early studyinvestigated the effects of multiple, low-level exposure tocadmium chloride (103), which is a chronic nephrotoxin as wellas being an acute testicular toxin and revealed increasedexcretion of citrate and creatine. High-resolution 1H magic anglespinning (MAS) NMR spectroscopy was used to profile kidneytissue and revealed altered lipid content in animals exposed toCd2+. This study also showed that unlike acute exposure, notesticular damage was evident following chronic subacutedosing. Exposure to metal contamination in earthworms has alsobeen investigated by NMR (104), and a host of metabolicchanges were determined, which included increased levels ofmaltose, a novel and potential biomarker for ecotoxicologyassessment. This study has been further extended to encompassacquiring NMR spectra of tissue extracts of earthworms exposedto seven sites with diverse levels of metal contamination andsoil type (105). Pattern recognition analysis of the data showedthat the NMR spectral profiles of earthworm extracts fromindividual sites could be differentiated and that zinc was themajor contaminant implicated in the differences in metabolicprofiles. This study highlights the successful application ofNMR-based metabonomics in ecotoxicological research inpolluted field soils. 1H NMR metabolomics has also beenapplied to determine the metabolic consequences of exposureof rainbow trout to the synthetic contraceptive estrogen ethi-nylestradiol (EE2) reflected in blood plasma and plasma lipidextracts (106). This study found that metabolites such asvitellogenin, alanine, phosphatidylcholine, phosphtidylethanol-amine, polyunsaturated fatty acids, and cholesterol were alteredin response to EE2 exposure, and these responses could becorrelated with previous findings on the effects of estrogen infish. Environmental metabonomics has been further extendedto profile human urine in a control population and in thoseexposed to a high-selenium environment in China (107). Theoccurrence of renal and liver lesions related to overexposure toselenium correlated with increased urinary excretion of formate,lactate, acetate, hippurate, and alanine, and decreased excretionof citrate, creatine, and TMAO excretion when compared withthat of the healthy human population. It is clear from thesestudies that the application of metabonomics in the field ofenvironmental toxicology will continue to diversify and expand.
The development of integrative metabonomics where multiplebiofluids and/or tissues are profiled simultaneously to try andcapture multilevel or compartmental information is a powerfultool to determine a global systems response to a given toxin.This approach provides information on biological changes withindifferent biological matrices, information that when consideredas a whole at the biological pathway level often providesenhanced insight on a systems response, as changes in onecompartment may be reflected in another or may highlight
PerspectiVe Chem. Res. Toxicol., Vol. 21, No. 1, 2008 13

mechanistic linkages. Spectroscopic data from multiple biofluidsmay also be statistically integrated at a data level via statisticalcorrelation spectroscopy (section 8), which results in thecomputation of correlation maps that highlight correlation oranticorrelation of metabolite levels in biochemical pathways.This statistical spectroscopic approach provides a means ofidentifying biochemical linkages between compartments in asystem and hence is key for isolating candidate biomarkers. Themanual or statistical integration of multiple spectroscopic datathat is reflective of a systems response to a pathophysiologicalstimulus allows isolation of the mechanistically relevant meta-bolic information within complex metabonomic data sets andwill lead to new insights into mechanisms of toxicity. Recentexamples of integrative metabonomics include the investigationof liver, plasma, and urinary biochemical changes followingadministration of 1-naphthylisothiocyanate (ANIT), a potenthepatotoxin (89). The ANIT-induced biochemical manifestationsincluded a hepatic lipidosis associated with hyperlipidaemia,hyperglycaemia and glycosuria, increased urinary excretion oftaurine and creatine, a shift in energy metabolism characterizedby increased plasma ketone bodies with reduced urinaryexcretion of tricarboxylic acid cycle intermediates, and system-atically raised hepatic bile acids leading to bileaciduria. Thus,the integration of metabolic data from several biological matricesprovided a holistic approach to determine the toxic response ofan intact system and enabled the characterization of keymetabolic effects during the development and recovery from atoxic lesion.
Integrated metabonomics was also applied to elucidate themetabolic consequences of treatment with bromobenzene, acentrilobular hepatotoxin (93). Conventional solution-state NMRtogether with magic angle spinning NMR were used to obtainmetabolic profiles of urine, plasma, and intact liver, whichpresented a broad systemic view of the effects of bromobenzene-induced hepatic toxicity. In addition, a number of putativeprotein targets of bromobenzene and its metabolites wereidentified including those enzymes of the glutathione cycle,exemplified by the presence of a novel biomarker, 5-oxoproline,in liver, plasma, and urine. This work highlighted the importanceof metabonomics in novel biomarker discovery and in providingnew insights into the mechanistic complexity of drug toxicity.
This integrated approach was also applied to determine themetabolic effects in urine, plasma, kidney, and liver of the well-known hepato and nephrotoxin, thioacetamide (86). The meta-bolic effects elucidated included renal and hepatic lipidosis andincreased urinary levels of taurine and creatine together withelevated creatine in liver, kidney, and plasma. There was alsoevidence for a shift in energy metabolism as depleted levels ofhepatic glucose and glycogen were apparent together withreduced urinary excretion of tricarboxylic acid cycle intermedi-ates and ketosis. Furthermore, elevated levels of amino acidswere seen in liver samples and blood plasma, which suggestedprotein degradation as a result of renal dysfunction, whereaselevated hepatic and urinary bile acids indicated secondarydamage to the biliary system. This work showed the potentialof metabolic profiling in differentiating the time-related systemicresponses in a multiorgan toxicity model and, in addition,provided novel biochemical information on primary and second-ary toxic responses. Multiple organ failure is a common lifethreatening complication of sepsis in man, and this studysuggests a wider role of metabonomics in understandingsystemic metabolic failure in critically ill patients.
A similar approach was also applied to a compound indevelopment (MrkA) that had been shown to induce hepato-
toxicity in several animal species (108). 1H NMR spectra wereacquired on urine and liver tissue samples, and pattern recogni-tion analysis of the data enabled the metabolic effects ofadministration of MrkA to be determined; these included aurinary depletion in tricarboxylic acid cycle intermediates andthe appearance of medium chain dicarboxylic acids. MAS NMRdata revealed elevated triglyceride levels that were correlatedwith dicarboxylic acid uria and suggested the defective me-tabolism of fatty acids. This metabonomic result was confirmedby subsequent in Vitro experiments that showed that MrkAimpaired fatty acid metabolism, which highlighted the potentialof an integrated metabonomics approach in defining an unknownmechanism of drug-induced toxicity. This study is an exampleof the successful testing and validation of a metabonomicgenerated hypothesis to determine a mechanism of toxicity andhighlights the potential of metabonomics in the field ofpharmaceutical research and development.
Integrative metabonomics was also utilized for the determi-nation of time-related metabolic events in rat liver, plasma, andurine following hepatotoxic insult with allyl formate (57). Themetabonomic results were compared with conventional clinicalchemistry and histopathology analyses. The metabolic changesthat were induced included hepatic lipidosis, decreased liverglycogen and glucose, decreased plasma lipids, increased plasmacreatine and tyrosine, increased urinary taurine and creatine,and decreased urinary tricarboxylic acid cycle intermediates.These findings suggested mitochondrial impairment and con-sequential depletion of hepatic ATP with increases in plasmatyrosine, suggesting impaired protein synthesis, a knownconsequence of ATP depletion. This integrative approach wasfurther extended by using partial least-squares modeling tocorrelate the metabolic profiles of liver and plasma, and theincreased hepatic lipids were found to correlate with the reducedplasma lipids, which suggested disruption in lipid transport fromthe liver to plasma, which may have been caused by impairedapolipoprotein synthesis. This study highlighted the benefits ofcorrelation of metabolic profiles from different biologicalsamples such as liver and plasma, which added anotherdimension to biochemical information recovery at a systemslevel.
5. Metabolic Information from Intact Tissues: MagicAngle Spinning (MAS) NMR
MAS NMR is increasingly being utilized for the determina-tion of metabolic profiles of intact tissue samples and forinvestigation of the dynamics and physicochemical propertiesof tissue. It provides a nondestructive analytical tool that requiressmall amounts of tissue (ca. 10 mg) that can be further analyzedby complementary technologies post spectral acquisition. Thetechnique is based on spinning a tissue sample at the magicangle (54.7° relative to the magnetic field), which reducesanisotropic line-broadening effects and hence produces highlyresolved spectra.
The technique opens up many diagnostic possibilities sinceinformation on a variety of metabolites in different cellularenvironments can be rapidly obtained, and specialized NMRexperiments, such as those developed to measure moleculardiffusion coefficients or longitudinal/transverse relaxation times,can be used to probe compartmentation. Confirmation ofbiochemical composition can be obtained using standard high-resolution NMR of both aqueous (protein-free) and methanolicextracts. This produces a comprehensive set of metabolicinformation that can be used in integrated metabonomics studies.Animal tissues can be examined after exposure to model organ-
14 Chem. Res. Toxicol., Vol. 21, No. 1, 2008 Coen et al.
specific toxins and drugs using MAS NMR and standard NMRmethods, allowing investigation of the time-related changes inbiochemical profiles. MAS NMR data, like biofluid NMRspectra, can also be subjected to computer pattern recognitionmethods in order to classify toxicity type (target organ andbiochemical mechanism) and to map time-related biochemicaltrajectories associated with drug-induced biochemical changes(2, 8). The ability to compare biofluid and tissue NMR spectraprovides further insight into mechanisms of toxicity and targetorgan identification (section 4.0).
MAS NMR was first applied to profile cells and tissues(109–116). More recently, this approach has been successfullyapplied to metabolically profile the brain (117, 118), intestinaltissue (58), prostate (119, 120), kidney (79, 84, 86, 121), liverspheroids (92), liver (56, 88, 89, 93, 95, 122), whole-cell bacteria(123), hepatocellular carcinoma (124), and parasitic protozoa(125). In addition, the application of 31P MAS NMR to studytissue has been reviewed (126). Recent advances in MAS NMRtechnologies include the use of pulse sequences, such as totalsideband suppression (TOSS 119, 127), phase-altered spinningsideband (PASS 119, 127), and phase-corrected magic angleturning (PHORMAT (128), that enable high-resolution spectrato be generated at low spin rates so as to minimize sampledegradation during spectral acquisition.
6. Ultrahigh Field NMR Spectroscopy of BiologicalSamples
As the role of NMR in metabonomics has evolved, an ever-increasing range of applications have opened, enabled by thedeveloping technology. The advent of high-field NMR impactedsignificantly on the biological application areas as the muchgreater sensitivity that this afforded has significantly extendedthe NMR boundaries of detection and enabled a wider metabolicpool to be profiled. The availability of a 1 GHz magnet is
imminent from manufacturers such as Bruker and Varian with800, 900, and 950 MHz magnets now being widely availablewith cryoprobe platform capabilities. The improvement in NMR-based technologies has resulted in enhanced biological informa-tion recovery from metabonomic studies, which further extendsthe scope and ability of the platform.
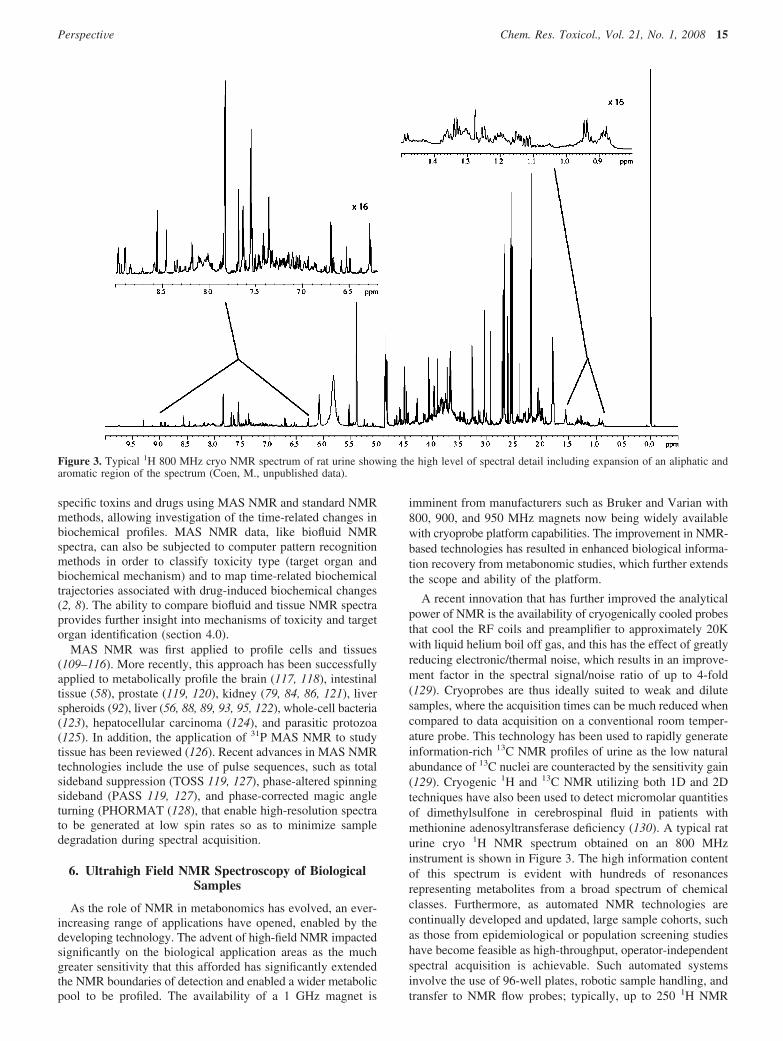
A recent innovation that has further improved the analyticalpower of NMR is the availability of cryogenically cooled probesthat cool the RF coils and preamplifier to approximately 20Kwith liquid helium boil off gas, and this has the effect of greatlyreducing electronic/thermal noise, which results in an improve-ment factor in the spectral signal/noise ratio of up to 4-fold(129). Cryoprobes are thus ideally suited to weak and dilutesamples, where the acquisition times can be much reduced whencompared to data acquisition on a conventional room temper-ature probe. This technology has been used to rapidly generateinformation-rich 13C NMR profiles of urine as the low naturalabundance of 13C nuclei are counteracted by the sensitivity gain(129). Cryogenic 1H and 13C NMR utilizing both 1D and 2Dtechniques have also been used to detect micromolar quantitiesof dimethylsulfone in cerebrospinal fluid in patients withmethionine adenosyltransferase deficiency (130). A typical raturine cryo 1H NMR spectrum obtained on an 800 MHzinstrument is shown in Figure 3. The high information contentof this spectrum is evident with hundreds of resonancesrepresenting metabolites from a broad spectrum of chemicalclasses. Furthermore, as automated NMR technologies arecontinually developed and updated, large sample cohorts, suchas those from epidemiological or population screening studieshave become feasible as high-throughput, operator-independentspectral acquisition is achievable. Such automated systemsinvolve the use of 96-well plates, robotic sample handling, andtransfer to NMR flow probes; typically, up to 250 1H NMR
Figure 3. Typical 1H 800 MHz cryo NMR spectrum of rat urine showing the high level of spectral detail including expansion of an aliphatic andaromatic region of the spectrum (Coen, M., unpublished data).
PerspectiVe Chem. Res. Toxicol., Vol. 21, No. 1, 2008 15
metabolic profiles can be acquired per day, but there is potentialfor running at much higher rates.
7. Improved Analytical Technologies for MetaboliteIdentification: Solid-Phase Extraction
Chromatography, Liquid Chromatography, and MassSpectrometry
A wide range of analytical platforms is increasingly beingutilized either alone or in conjunction with NMR spectroscopyto detect and characterize a wider range of metabolites. Suchplatforms include capillary electrophoresis and high-performanceand ultraperformance liquid chromatography (11, 12), whichare coupled with mass spectrometry (MS). Chemical derivati-zation methods followed by gas chromatography and MS havebeen widely used to successfully generate metabolic profilesfor a host of plant and microbial extracts (5, 131–134).
The development of directly coupled LC and NMR providedthe ability to simplify complex biofluid spectra by use of achromatographic separation step. This has proved particularlyadvantageous for structural elucidation of drug metabolites(135–138). An alternative sample extraction step that is oftenused that facilitates identification of potential biomarkers is solid-phase extraction chromatography (SPEC), which enables rapidextraction/fractionation/purification of a given analyte of interestfrom a complex matrix such as a biofluid sample (139, 140).The SPEC fraction can be profiled via NMR methods and theresonances of interest are less confounded by interfering,overlapped resonances, hence facilitating structural identifica-tion. Chromatographic methods can be also used to furtherextract the SPE fraction, and MS can also be used forcomplementary identification of the analyte(s) of interest. SPEfollowed by NMR has been successfully applied to assignm-(hydroxyphenyl)-propionic acid in rat urine (141), and LC-MS together with NMR spectroscopy has been utilized to assignphenotypic differences differentiated by urinary levels ofdihydro-quinolinone glucuronide (142). Furthermore, the cou-pling of LC and NMR has been extended by using HPLCchromatography to fractionate a sample that is then simulta-neously sent to a MS and NMR spectrometer for profiling. Thisroutine has enabled a fully automated and more comprehensiveanalysis of biofluids than either platform used in isolation(137, 143).
MS is generally much more sensitive than NMR spectroscopyin terms of the inherent detection limit; however, this must bebalanced with problems that are commonly encountered withreproducibility, matrix effects, and ion suppression. Furthermore,it is often necessary to target chromatographic methods to agiven class of chemical. However, recent developments in theapplications of MS coupled with liquid chromatographicmethods to metabonomic data sets have resulted in thetechnologies providing complementary metabolic informationto NMR-based analyses, and MS is rapidly gaining acceptanceas a valuable biofluid metabolic profiling tool (144–148).
HPLC is typically performed on reversed-phase gradientchromatographic columns with HPLC using solvent gradients,and chromatography is often combined with electrosprayionization (ESI). MS is typically performed in both positive andnegative modes for each sample to capture the most compre-hensive metabolic information. Ultra performance liquid chro-matography (UPLC) is a recently developed method (12, 149–151),which provides greatly improved chromatographic ability andhence a reduction in ion suppression problems. UPLC utilizessmall particle sizes (1.7 µm) and high column pressures (>800bar) for greater separation abilities and speed of data acquisition;
typically, a 10-fold increase in speed and a 3- to 5-fold increasein sensitivity are seen compared to a conventional stationaryphase. The main advantage of UPLC is in the reduction of ion-suppression in MS as the chromatographic separation is muchimproved. This technology coupled to mass spectrometryenables thousands of metabolites to be detected in a givensample in very short periods of time, hence realizing high-throughput data acquisition and has been applied to profile urinein a number of rodent studies (12). UPLC-MS has recently beenapplied to separate and identify amphetamine-type substances(152), rapidly quantify organic acid metabolites during microbialfermentation (153), detect lipophilic marine toxins (154), anddetermine troglitazone in mouse plasma (155) and oral contra-ceptives in human plasma (156). In metabonomic studies,UPLC-MS has successfully enabled the separation of Zuckerrats on the basis of phenotypic differences (149, 151) and thesera from patients with intestinal fistulae from controls (157).UPLC-MS has also been successfully applied to differentiatemetabolic profiles of urine from different strains of Zucker rats,namely, Zucker (fa/fa) obese, Zucker lean, and the lean/(fa)obese cross, and it was also possible to separate age-relatedeffects in these animals (158). Metabolic profiles of plasma fromthe above strains of Zucker rat have previously been separatedby UPLC-MS methods (146, 151), and taurocholate was foundto significantly differentiate between the obese and lean strains,which provided further support for an involvement of taurinemetabolism in diabetes. The creation of comprehensive massspectral libraries (133) will be key to the continued expansionof these technologies in the field of metabonomics. A recentstudy (159) has used a multiplatform approach: both UPLC-MS and NMR to profile the hepatotoxic effects of pravastatinvia metabolic profiling of urine. The two analytical platformsprovided complementary information, and candidate biomarkersfor pravastatin toxicity were identified such as elevated levelsof taurine, creatine, and bile acids. The power of this approachwas further exemplified in a study of the biochemical effectsof mercury II chloride in the rat using 1H NMR and HPLC-TOF/MS, which identified a host of biomarkers of toxicity byboth NMR and MS (160). 1H NMR revealed increased levelsof lactate, alanine, acetate, succinate, trimethylamine, andglucose together with reduced levels of citrate and alpha-ketoglutarate postdosing. These findings were consistent withthose previously reported in the literature and indicate proximaltubule nephrotoxicity (19, 41, 42, 161). The complementary useof HPLC-TOF/MS revealed decreases in kynurenic acid, xan-thurenic acid, pantothenic acid, and 7-methylguanine postdosing,which provided further metabolic information on the toxicresponse to mercury II chloride.
The value of a combined NMR and MS metabolic profilingapproach to monitor idiosyncratic hepatic response to ranitidine(RAN), a histamine-2 receptor antagonist, has been demonstrated(162). It is believed that environmental factors such as inflam-mation initiated by bacterial lipopolysaccharide (LPS) may playa role in idiosyncratic response, and hence, this metabonomicstudy involved the cotreatment of rats with RAN and LPS, inaddition to treatment with RAN and LPS alone. Patternrecognition analysis of both NMR and MS data revealed theability to differentiate metabolic profiles of the cotreated groupfrom all others, which suggests the future potential of metabo-nomics in identification of drug candidates with the potentialto cause idiosyncratic toxicity.
16 Chem. Res. Toxicol., Vol. 21, No. 1, 2008 Coen et al.

8. Statistical Spectroscopy and Biomarker Discovery
Recently developed statistical methods such as statisticalcorrelation spectroscopy (STOCSY, (163)) have significantlyenhanced information recovery from complex metabonomic datasets. STOCSY encompasses the computation of correlationstatistics between the intensities of all computer points in a setof complex mixture spectra, thus generating connectivitiesbetween signals from molecules that vary in concentrationbetween samples. This statistical method allows latent spectro-scopic information of interest to be extracted from complex,highly overlapped spectra. STOCSY can be combined withsupervised chemometric methods to provide linked informationon those spectral features that best separate sample classes(55, 163).
STOCSY has been used to derive the assignment of bio-marker metabolite NMR resonances in nephrotoxic states as aresult of exposure to mercury chloride and provided an unbiased,sensitive approach to biomarker extraction and identification,and showed the potential for generating potential novel pathwayconnectivities (164). STOCSY has also been utilized forpopulation-based identification of drug metabolites in humanurine samples (165). 1H NMR spectra were acquired for twogroups of urine samples, and the application of STOCSY tothe data enabled rapid identification of the major and minordrug metabolites in common use in the population, in particular,those from acetaminophen and ibuprofen. The work showedthat statistical connectivities between drug metabolites could
be established in routine high-throughput NMR screening ofhuman samples from participants who had randomly self-administered drugs. Hence, the STOCSY approach provides apowerful tool in considering interpopulation patterns of drugmetabolism in epidemiological and pharmacogenetic studies.An example of a STOCSY correlation plot driven from theN-acetyl resonance of acetaminophen glucuronide (AG) is givenin Figure 4, where correlations to the other AG resonances areclearly seen. This plot also illustrates the information obtainedon pathway connectivity relationships as weaker correlationsare seen to the parent drug, acetaminophen, and to acetami-nophen sulfate. Furthermore, STOCSY has recently been appliedto enhance information recovery from LC-NMR data sets (135)and diffusion-edited NMR data sets (166) arising from complexbiological mixtures. The STOCSY approach is generic and canbe applied in both 1D and 2D forms and to homo orheteronuclear data to aid structural elucidation and determinepathway relationships in a given spectral sample set. Het-erospectroscopic-STOCSY (HET-STOCSY) encompasses thestatistical correlation of two different types of experimental data,for example, from heteronuclear experiments or any givenparallel combination of experimental data. The successfulapplication of HET-STOCSY to aid metabolic biomarkerassignment in a metabonomic study of galactosamine-inducedhepatotoxicity has recently been demonstrated for 1H- 31P MASNMR spectra of intact liver (167).
Figure 4. STOCSY involves computation of a correlation matrix between a chosen spectral data point (the maximum of a given peak) and all theother data points of the spectra. STOCSY is performed across a series of 1D NMR spectra and identifies correlated spectral resonances from thesame molecule and also from molecules linked via metabolic pathways. The STOCSY approach facilitates molecular structural assignment andbiomarker recovery. Color-coding is used to present the strength of the correlation (r2). The upper section of the STOCSY plot represents metabolitespositively correlated with the driver peak, and the lower part represents metabolites that are negatively correlated. STOCSY plot derived from thecorrelation matrix calculated between the data point at the peak maxima of the N-acetyl proton signal of AG resonance (δ 2.17) and all other datapoints, as indicated by the arrow, showing strong correlation (red/orange data points) with resonances at 3.62, 3.89, 5.1, 7.13, and 7.36 ppm.Slightly weaker correlations are shown with A and AS. (B) Expansion for the aromatic region showing signals for acetaminophen and its relatedmetabolites. (C) Expansions for the δ 2.17 N-acetyl resonance of acetaminophen metabolites. (Reprinted with permission from ref 164. Copyright2006 American Chemical Society.)
PerspectiVe Chem. Res. Toxicol., Vol. 21, No. 1, 2008 17

Furthermore, the recent development of statistical heterospec-troscopy (SHY) shows the power of computation of covariancematrices for successful interrogation of multispectroscopic datasets collected in series or parallel such as those from NMR andultraperformance liquid chromatography–mass spectrometry(UPLC-MS) platforms. The potential of SHY has been dem-onstrated for a metabonomic data set representing hydrazinetoxicity (168), where direct cross-correlation of chemical shifts(NMR) and m/z data (MS) has provided structural and metabolicpathway activity information. The application of SHY to MSand NMR data sets allows improved molecular biomarkeridentification capabilities as not only structural information butalso higher level biological information on metabolic pathwayactivity and connectivities is obtained. This information is foundwithin different levels of the NMR to MS correlation andanticorrelation matrices, and it should be noted that the SHYapproach is equally applicable to any two independent spec-troscopic data sets.
Related statistical cross-projection methods have also beenapplied to link proteomic with metabonomic data (169) on dataarising from a human tumor xenograft mouse model of prostatetumor. Blood plasma from mice implanted with prostate tumorwas profiled using both NMR spectroscopy and 2D-DIGEtechnologies. The data was integrated using OPLS modelingalgorithms, and multiple correlations between metabolites andproteins were found, including associations between serotrans-ferrin precursor and both tyrosine and D-3-hydroxybutyrate, andreduced levels of tyrosine were correlated with increased levelsof gelsolin.
Furthermore, a recent publication highlights the successfulintegration of genome-phenotype data with metabonomic data(170) from a rat type II diabetes model. Plasma metabolicfingerprints derived from NMR spectroscopic profiling wereused to map quantitative trait loci (QTL) in a cross betweendiabetic and control rats. Candidate metabolites were proposedfor the most significant QTLs, one of which includes a gutmicrobial metabolite (benzoate) that can be explained bydeletion of a uridine diphosphate glucuronosyltransferase. Thesetrans-omic data projection methods allow systems biologyintegration of information for deeper mechanistic understandingof in ViVo model systems and enhanced combination candidatemetabolic biomarker recovery (9, 171).
9. Recent Consortium Projects Using NMR/MSDriven Metabonomics and Top-Down Systems Biology
in Toxicology
The development of major new paradigms for drug screeningrequires the engagement and resources of the pharmaceuticalindustry coupled to academic research groups. Such initiativesinvolve experimental studies, database construction, and math-ematical modeling. The utility of metabonomics in the evalu-ation of xenobiotic toxicity was comprehensively assessed bythe Consortium for Metabonomic Toxicology (172–174), whichwas formed between five major pharmaceutical companies andImperial College London, U.K. and ran between 2000 and 2004.The main objectives of COMET were to assess and developmethodologies to generate a metabonomic database using 1Hnuclear magnetic resonance (NMR) spectroscopy of rodent urineand blood serum for preclinical toxicological screening ofcandidate drugs and to build a predictive expert system for targetorgan toxicity. The analytical and biological variation that mightarise through the use of metabonomics was evaluated at an earlystage and a high degree of robustness demonstrated. The chosenCOMET target compounds represented an extensive range of
metabolic space; hence, structures and activities were diverse,but there was an emphasis on analysis of hepato and nephro-toxins. With the completion of 147, 7-day, low- and high-dosetoxicological and physiological studies, the chief deliverablesof a curated database of rodent biofluid NMR spectra andcomputer-based expert systems for the prediction of kidney orliver toxicity in rat and mouse on the basis of the spectral datahave been generated and delivered to the sponsoring companies.The project, with its relatively modest resources by consortiumstandards, has exceeded all of its targets and was judged asuccess by the sponsoring companies who are, in some cases,already enhancing and making use of the spectral data in theirin-house studies.
One of the modeling approaches using probabilistic temporalmodeling (developed as part of the COMET project) wasrecently published (174). The COMET database was used todevelop an expert system for prediction and classification ofdrug toxicity, which enabled collections of metabolic trajectoriesrepresenting diverse responses to nephro and hepatotoxins tobe compared (174) and the likely type of toxicity from newtreatments to be predicted, thereby assisting in the elucidationof toxic mechanisms. A subset of the COMET databaserepresenting 80 hepato and nephrotoxins was used to build amodeling system that was capable of differentiating NMRurinary metabolic profiles from controls and treated animals.The CLOUDS approach (94) was then applied to determinesimilarities between treatments, which enabled the separationof kidney and liver toxins on the basis of their urinary metabolicprofiles. This similarity matrix could then be used to predictthe toxic outcomes of unknown treatments. The sensitivity andspecificity of the expert system for liver toxins was 67 and 77%and for kidney toxins, 41% and 100%, respectively, whereasthe predictive ability of the system had an error rate of 8%.This expert system uses the systems wide window provided bymetabonomic data to successfully characterize toxic failure. Theoverall toxic response is driven by specific mechanisms andsites of action, but the metabolic fingerprint may be derivedfrom multiple biological sources. This approach has providedthe largest validation to date of the value of metabonomics inpreclinical toxicology assessment and confirmed that themethodology offers practical utility for rapid in ViVo drugtoxicity screening.
Many novel modeling strategies, such as a method to testfor homothetic geometry called scaled-to-maximum, aligned,and reduced trajectories (SMART) analysis, were developed aspart of the COMET research effort (94). This method facilitatesscaling of the differences between metabolic starting positionsand hence enables multivariate response similarities to bevisualized from two or more sets of metabonomic measurements.Metabolic principal component trajectories and SMART analysiswere successfully applied to determine the interspecies variationbetween rats and mice exposed to hydrazine (85). This approachfacilitated the comparison of the response geometries betweenthe rat and mouse. A greater magnitude of metabolic effectswere observed in the rat post hydrazine dosing, which wassupported by the more pronounced effect on liver pathology inthe rat than in the mouse. In addition, the COMET consortiumsuccessfully applied a host of spectral editing methods to profileintact liver tissue and combined this with PCA to elucidate theeffects of hydrazine toxicity on rat liver biochemistry (175).
A further novel modeling method developed to classify largeCOMET data sets utilizes a density superposition approach,CLOUDS, which is a non-neural implementation of a clas-sification technique developed from probabilistic neural net-
18 Chem. Res. Toxicol., Vol. 21, No. 1, 2008 Coen et al.

works (176). This approach was initially applied to NMR spectraof urine from rats from 19 different treatment groups, and thedata were modeled according to organ of effect with >90% ofthe test samples classified as belonging to the correct group.These metabonomic data representing 19 toxins were alsomodeled using PCA, hierarchical cluster analysis (HCA), andk-nearest-neighbor (kNN) classification to reveal dose- and time-related effects (177). PCA and HCA provided valuable over-views of the data, highlighting characteristic metabolic pertur-bations representative of the organ of effect, and kNN analysisof the multivariate data successfully predicted all the differenttoxin classes with >85% success rate (training/test).
COMET also successfully assessed the analytical reproduc-ibility of metabonomic protocols, which involved performingsample preparation and NMR data acquisition at two sites (oneusing a 500 MHz and the other using a 600 MHz system) usingtwo identical (split) sets of urine samples from an 8-day acutestudy of hydrazine toxicity in the rat (129). Despite thedifference in spectrometer operating frequency, both data setswere found to be extremely similar when analyzed using PCAand gave near-identical descriptions of the metabolic responsesto hydrazine treatment. COMET also utilized an integratedmetabonomic approach to establish the systemic metabolicresponse to liver regeneration, using the partial hepatectomy(PH) model in the rat (179). Male Sprague–Dawley rats weresubjected to surgical removal of ∼two-thirds of the liver, shamoperated surgery, or no treatment, and urine, liver, and serumcollected over a 7-day period were analyzed by NMR-basedmetabonomics. Several urinary perturbations, such as changesin 1-carbon and lipid metabolism, were observed, which wereindicative of hepatocellular regeneration.
The follow-up second Consortium on Metabonomic Toxicol-ogy (COMET 2) is now underway, and it extends this linkageamong pharmaceutical companies, a major instrument manu-facturer, and academia and aims to utilize metabonomics as atop-down systems biology driver to direct research and experi-ments in the determination of mechanisms of toxicity and theassessment of risk factors (1, 4, 171). Hence, COMET 2 aimsto significantly enhance the knowledge gained from COMETby detailed testing of metabonomic hypotheses using NMR, LC-MS, and appropriate in Vitro and in ViVo labeling studies andvalidation of results via follow-on biochemical studies with theultimate aim of determination of mechanisms of action of a widerange of drugs. The initial efforts have concentrated onunderstanding model systems, for example, galactosaminehepatotoxicity, which despite being put forward as a model forviral hepatitis for many years still has many enigmatic featuresof its metabolism and elicits hyper-variable responses. A recentlypublished study investigated the protective ability of glycine ina galactosamine-induced hepatotoxic model (56). This workdemonstrated the utility of the new technologies in uncoveringnew metabolic facets of the mechanisms of supposedly wellunderstood toxins.
Another ongoing COMET 2 problem relates to bromoeth-anamine (BEA) and understanding the development of renalpapillary necrosis (RPN) using chemical models. Nonsteroidalanti-inflammatory drugs (NSAIDs) are the most widely recog-nized class of compounds known to cause this toxicity in rodentsand in humans. However, it is difficult to study renal medullaryfunction with noninvasive methods, and hence, there are nosensitive and selective biomarkers for evaluating RPN. Fur-thermore, it is planned that clinical samples of RPN will be
analyzed so that biomarkers relevant to the clinical setting canbe differentiated from those of relevance to general physiologicalfunction.
10. Clinical Metabonomics
Many of the earliest clinical studies that involved theapplication of NMR spectroscopy to profile urine and plasmahave been reviewed previously, and concentration on the fieldof inborn errors of metabolism was evident (180–182). A recentand renewed surge has taken place in the application of NMR-based metabolic profiling together with multivariate statisticalanalysis to aid human disease diagnosis, which coincides withthe more sensitive analytical platforms available and theenhanced statistical tools for biomarker discovery. An early andsignificant example of the application of NMR-based metabo-nomics in disease diagnosis was the study of human serumsamples to ultimately develop a diagnostic method for coronaryartery disease (49).
Recent clinical metabonomic studies include the investigationof type 1 diabetic nephropathy using plasma (183) and HPLC-MS methods to profile plasma phospholipid signatures in typeII diabetes (184).
The application of NMR-based metabonomics in neurologicaldisorders has been extensively reviewed (118), and recent studieshave investigated neurological conditions, such as Alzheimer’sdisease, Huntington’s disease, muscular dystrophy, cerebellarataxia, meningitis (185), and schizophrenia (a detailed list ofreferences is to be found in ref 118).
One area of disease where progress is being made usingNMR-based metabonomics studies of biofluids is cancer. Magicangle spinning NMR and multivariate data analysis methodshave been used to successfully differentiate human hepatocel-lular carcinoma tumors from controls (124). A study thatinvolved the diagnosis of epithelial ovarian cancer based onanalysis of serum has also been published (186) together withthe use of HPLC fingerprints to profile biofluids in patients withliver cancer (187).
Furthermore, a recent study has applied NMR-based meta-bonomic technologies to characterize inflammatory boweldiseases such as Crohn’s disease and ulcerative colitis, and thepublished results show rapid and clear differentiation of fecalextracts between patients and controls (188). UPLC-MS methodshave been used to profile sera from patients with intestinal fistula(157). An important study has been published that evaluatesthe effects of both sample preparation and storage on metabo-nomic profiles of human urine samples, and this leads the waytoward standardized metabonomic practices for disease diagnosis(189).
The renal toxicity of aminoglycoside and glycopeptideantibiotics in a cohort of patients in an intensive care unit hasalso been studied using NMR-based metabonomic techniques(190). Urine from patients receiving an aminoglycoside and/ora glycopeptide and presenting with renal dysfunction weremetabolically profiled, and a range of metabolite levels relativeto creatinine were extracted. Dimethylamine was found to behighly correlated with clinical markers of renal dysfunction, andthis suggested that nephrotoxicity from these antibiotics mayinvolve both proximal tubular and medullary (loop of Henleand collecting duct) toxicity.
11. Molecular Epidemiology
The application of modern analytical and omics technologiesto study large-scale population-based biological samples has
PerspectiVe Chem. Res. Toxicol., Vol. 21, No. 1, 2008 19

offered new opportunities to investigate many aspects of humanbiology and population phenotyping.
The International Study of Macro/Micronutrients and BloodPressure (INTERMAP) was launched in 1996 to investigate therelationship of multiple dietary variables to blood pressure(191, 192). Urine samples (n ) 4680) representing adult menand women (aged 40–59) from populations in Japan, thePeople’s Republic of China, the United Kingdom, and the UnitedStates were analyzed using NMR-based metabonomic technolo-gies. The robustness of the analytical platform together withsample handling/collection protocols was studied, and it wasfound that the reproducibility of the NMR screening platformwas >98% (194). Furthermore, differences in urinary metabo-lites between populations were determined, which relate togenetic, dietary, and gut microbial factors. The U.S. humanpopulation 1H NMR urinary data was also analyzed using arange of chemometric tools, such as PCA, STOCSY, andO-PLS-DA to characterize structural pathway connectivities ofthe metabolites of commonly used drugs (165). The concept ofthe xenometabolome was defined in this study as the “multi-variate description of the xenobiotic (foreign compound)metabolic profile of an individual or sample from an individualthat has been exposed through any route (either deliberately oraccidentally) to drugs, environmental pollutants or dietarycomponents, that cannot be completely catabolized by endog-enous metabolic enzyme systems”. Hence, the xenometabolomeof an individual can be envisaged as the exogenous part of themetabolic phenotype that defines external, nongenomic, andenvironmental interaction, and this approach will clearly proveof importance in considering interpopulation patterns of drugmetabolism in epidemiological and pharmacogenetic studies.Furthermore, the metabonomic urinary NMR data can be usedto assess self-reported meta-data, which many epidemiologicalstudies are based on, although these are often limited inreliability (publication in preparation). This work shows that itis possible to perform population pharmacology in molecularepidemiology studies, and capturing the xenometabolome as anenvironmental health factor represents a new metric to helpunderstand population disease risk factors.
12. Integrated -Omic Applications
Metabonomics offers a complementary approach to alternativeomics platforms such as genomics, transcriptomics, and pro-teomics, which involve the study of genetic complement, geneexpression, and protein synthesis, respectively. Although tran-scriptomic/genomic and proteomic measurements can elucidatethe response to the administration of toxic agents, it is difficultto relate findings to classical toxicological end points, whereasmetabonomics can capture information on whole-organismfunctional integrity over time following pathophysiologicalstimuli. Multivariate temporal modeling of target biofluids andtissues provide information on characteristic changes in thepattern of concentrations of xenobiotic and endogenous me-tabolites that relate to the site and mechanism of toxicity.Metabonomics provides a useful connection between the omicsplatforms and actual tissue histology as real-world end pointsare observed and studied. There remains a strong imperative tobe able to integrate information at the transcriptomic, proteomic,and metabonomic levels despite these different levels ofbiological control showing very different timescales of change.This is because some events can be rapid such as on/off geneswitching, and other transcriptional and translational processeswork on longer timescales, for example, protein synthesis andturnover, or, in the case of metabolic changes, can encompass
enormous ranges of timescales (171). Counterintuitively, bio-chemical changes do not always occur in the order transcrip-tomic, proteomic, and metabolic because, for example, phar-macological or toxicological effects at the metabolic level caninduce subsequent adaptation effects at the proteomic ortranscriptomic levels (2). One important potential role for high-throughput and highly automated metabonomic methods, there-fore, could be to direct the timing of more expensive or labor-intensive proteomic and transcriptomic analyses to maximizethe probability of observing meaningful and relevant biochemi-cal changes using those techniques.
Metabonomics will become increasingly important in con-necting molecular events at the gene and protein level to thoseoccurring at the macrosystem level including pathological endpoints, and recent multiomic studies include the analysis ofmethapyrilene- (193) and acetaminophen-induced (96) hepato-toxicity in the rat. In addition, integrated metabonomic andtranscriptomic methods have been applied to elucidate themetabolic and genetic basis of insulin resistance and nonalco-holic fatty liver disease (170, 195) and to statistically integrateproteomic and metabonomic data representing a human tumorxenograft mouse model of prostate cancer (169).
An integrated metabonomic approach was also utilized tostudy the effects of peroxisome proliferator-activated receptor(PPAR) ligands on urine and plasma NMR and HPLC-basedfingerprints, and two potential biomarkers of peroxisomeproliferation in the rat were described, N-methylnicotinamideand N-methyl-4-pyridone-3-carboxamide, both endproducts ofthe tryptophan-nicotinamide adenine dinucleotide (NAD+)pathway (196), suggesting the alteration of this pathway as aresult of peroxisome proliferation. This study was extended tointegrate metabonomic findings with genomic data, and themetabonomic derived mechanistic hypothesis was confirmed asthe relevant genes encoding two key enzymes in the NAD+
pathway, aminocarboxymuconate-semialdehyde decarboxylase(EC 4.1.1.45) and quinolinate phosphoribosyltransferase (EC2.4.2.19), which were found to be significantly down-regulated(197, 198).
13. Pharmacometabonomics and Implications of theExtended Genome
For personalized healthcare, an individual’s drug treatmentsmust be tailored so as to achieve maximal efficacy and avoidadverse drug reactions. One of the approaches has been tounderstand the genetic makeup of different individuals (phar-macogenomics) and to relate these to their varying abilities tohandle pharmaceuticals both for their beneficial effects and foridentifying adverse effects. Recently, an alternative approachto understanding such intersubject variability has been developedusing metabonomics to predict the metabolism and toxicity ofa dosed substance, based solely on the analysis and modelingof a predose metabolic profile (97). Unlike pharmacogenomics,this approach, which has been termed pharmacometabonomics,is sensitive to both the genetic and modifying environmentalinfluences that determine the metabolic fingerprint of anindividual. This new approach has been illustrated with studiesof the toxicity and metabolism of compounds with very differentmodes of action (allyl alcohol, galactosamine, and acetami-nophen) administered to rats. The pharmacometabonomicprinciple has been illustrated in (97), where predose urinaryprofiles are used to predict the extent of liver damage sustainedafter acetaminophen administration as shown in Figure 5, wherevariation in the PCA scores of predose urinary data are
20 Chem. Res. Toxicol., Vol. 21, No. 1, 2008 Coen et al.

correlated with the postdose histopathology scores to reveal thediscriminatory metabolites.
A further pharmacometabonomic study demonstrates a GC-MS-based approach to study two classical experimental models,the Streptozotocin-induced diabetic model in Wistar rats andthe high-energy, diet-induced obesity model of Sprague–Dawleyrats (199). Pre and postdose urine was collected together withserum clinical chemistry parameters and body weights so thatanimals could be classified via outcome as obesity-prone orobesity-resistant and diabetes-prone or diabetes-resistant. Thevariation in the predose/baseline urinary profiles of obesity-proneand obesity-resistant rats was found to correlate with outcome,and the discriminatory metabolites for both classes were relatedto gut microbial metabolism and energy metabolism. This worksuggests that the pre-existing variation in the metabolic phe-notype may provide a systems wide window to probe themetabolic basis for interanimal variation in response to xeno-biotics, dietary intervention, or external stressors and mayprovide insight into varied metabolic phenotypes and theassociated pathological outcomes. These pharmacometabonomicstudies confirm that metabolic profiling methods are highlyeffective in understanding disease processes and drug responsesin humans and model organisms and that they can be used topredict the effects of drug interventions.
As the metabolic phenotype both predicts and influences drugmetabolism and toxic outcome (97, 171), we need to considerthe response to drug intervention in the context of fundamentalphenotype. The phenotype is modified by a wide range of factorsthat include subject genetics, diet, previous drug exposure,related enzyme induction, and the activities of the gut microflora(200). Indeed, the gut microbiotal activities may generatebiochemically active substrates that can be absorbed by the host,and this may lead to induction of host enzymes that competefor metabolic substrates. Hence, the outcome of a drug interven-tion may be dependent on conditional probabilistic interactionsbetween gut microbial metabolism and host metabolism, andsuch interactions may be in-part responsible for some idiosyn-
cratic toxicological reactions (9, 171, 200). Given the enormousdiversity of poorly understood microbial species in man, thismay become an important area for study in future personalizedhealthcare scenarios. The variation in rodent metabolic pheno-types seen in some laboratories can be attributed to variationin animal microbiomes (142, 201, 202) and as such may be animportant and previously unsuspected source of inter-laboratoryand inter-study biological variation in toxic responses andmetabolic fate.
14. Concluding Remarks
It is clear that the combined use of NMR spectroscopy andchemometric tools to generate and model information-richmetabolic profiles has resulted in the rapid development of amultifaceted field of metabonomics and new routes to biomarkerdiscovery. Instrumental advances will continue to improve thesensitivity of the NMR platform, which will extend the detectionlimits and enable other metabolic pathways to be explored. Theincreased application of MS-based analytical platforms in thefield of metabonomics will also widen the range of detectablemetabolites and will prove particularly useful for targetedanalyses aimed at specific groups of metabolites. Metabolicbiomarkers provide real biological end points that have a highdegree of commonality across many species and enable a globalsystems interpretation of biological effects. From the rapid risein publication rates, it is clear that metabonomics can now beused for the validation of animal models of disease, preclinicalevaluation of candidate drugs in safety studies, assessment ofsafety in humans in clinical trials, improved mechanisticunderstanding of idiosyncratic toxicity as well as pharmacome-tabonomics.
NMR-based metabonomics provides a robust and stableanalytical platform with excellent analytical and biologicalreproducibility, whereas LC-MS based methods provide sig-nificant advantages in terms of increased sensitivity and greaterdynamic range. The data sets generated are complex andchallenging to reliably model and interpret, yet advances instatistical approaches to data mining continue to be made. Thenontargeted and minimally invasive nature of whole-systemmetabonomic studies are ideal for biochemical and mechanistichypothesis generation, although increased testing and validationof these hypotheses will be needed for even greater long-termimpact of the field.
The information obtained from a typical NMR-based meta-bonomic study can be envisaged in terms of an analogy withan airline network or route map; the major hubs or cities arethe major metabolic players and are vital for all biologicalactivity. The absence or regulation of these major metabolitesand pathways is critical to the health of the organism. It is thesemajor hubs that are most easily followed with NMR spectros-copy, and it is the interactions, time-courses, and overall patternof changes in these metabolites that has proven to be specificto a given toxin or disease state. However, MS methods can beenvisaged as a potential means of studying all hubs (both minorand major) as the sensitivity of the analytical platform is higher,but major and minor hubs are not so easily differentiated asthey are in NMR spectroscopy, and this potentially complicatesthe biological interpretation. This analogy clearly highlights thechallenge in the interpretation of MS data, which is to identifyand distinguish the variation of metabolic significance andspecificity from the confounding multitude of metabolic infor-mation in the data. However, we envisage that the challenge
Figure 5. Predose discrimination of the degree of liver damage obtainedin acetaminophen-dosed rats. (a) A scores plot from PCA of the predoseNMR data. Each point represents a single rat and is color-coded by itshistology class (with increasing severity of damage, class 1 is green,class 2 is blue, and class 3 is red). (b) Plot of mean histology score(MHS) vs the PC2 score obtained from the PCA. (c) A scores plotfrom PCA of the predose NMR data for rats in histology classes 1 and3. Each point represents a single rat, with color-coding as describedbefore. (d) A loadings plot corresponding to c, showing the variablesmaking the largest contributions to PC2, and the direction of eachcontribution. Key: Tau, taurine; Citr, citrate; Oxog, 2-oxoglutarate;TMAO, trimethylamine-N-oxide; Bet, betaine. Reprinted by permissionfrom Macmillan Publishers Ltd: Nature (http://www.nature.com), (ref97), Copyright (2006).
PerspectiVe Chem. Res. Toxicol., Vol. 21, No. 1, 2008 21

will be met in the near future and will further enhance thecomplementarities of NMR and MS platforms for biomarkerdiscovery.
In summary, it is clear that metabonomics and its associatedtechnologies will continue to develop in both sensitivity and inapplications in as of yet under-explored areas and that meta-bonomics will form a fundamental part of all multiomicsapproaches where integrative systems biomarkers are sought.
Note Added after ASAP Publication. There were errorsin refs 13, 52, 54, 176, and 177 in the version published ASAPJanuary 3, 2008; the corrected version was published January21, 2008.
References
(1) Nicholson, J. K. (2006) Global systems biology, personalizedmedicine and molecular epidemiology. Mol. Syst. Biol. 2, 52.
(2) Nicholson, J. K., Connelly, J., Lindon, J. C., and Holmes, E. (2002)Metabonomics: a platform for studying drug toxicity and genefunction. Nat. ReV. Drug DiscoVery 1 (2), 153–161.
(3) Lindon, J. C., Holmes, E., Bollard, M. E., Stanley, E. G., andNicholson, J. K. (2004) Metabonomics technologies and theirapplications in physiological monitoring, drug safety assessment anddisease diagnosis. Biomarkers 9 (1), 1–31.
(4) Lindon, J. C., Holmes, E., and Nicholson, J. K. (2004) Metabonomics:systems biology in pharmaceutical research and development. Curr.Opin. Mol. Ther. 6 (3), 265–272.
(5) Fiehn, O. (2002) Metabolomics--the link between genotypes andphenotypes. Plant Mol. Biol. 48 (1–2), 155–171.
(6) Taylor, J., King, R. D., Altmann, T., and Fiehn, O. (2002) Applicationof metabolomics to plant genotype discrimination using statistics andmachine learning. Bioinformatics. 18 (2), S241–S248.
(7) Jenkins, H., Hardy, N., Beckmann, M., Draper, J., Smith, A. R.,Taylor, J., Fiehn, O., Goodacre, R., Bino, R. J., Hall, R., Kopka, J.,Lane, G. A., Lange, B. M., Liu, J. R., Mendes, P., Nikolau, B. J.,Oliver, S. G., Paton, N. W., Rhee, S., Roessner-Tunali, U., Saito,K., Smedsgaard, J., Sumner, L. W., Wang, T., Walsh, S., Wurtele,E. S., and Kell, D. B. (2004) A proposed framework for thedescription of plant metabolomics experiments and their results. Nat.Biotechnol. 22 (12), 1601–1606.
(8) Nicholson, J. K., Lindon, J. C., and Holmes, E. (1999) ‘Metabo-nomics’: understanding the metabolic responses of living systems topathophysiological stimuli via multivariate statistical analysis ofbiological NMR spectroscopic data. Xenobiotica 29 (11), 1181–1189.
(9) Nicholson, J. K., and Wilson, I. D. (2003) Opinion: understanding‘global’ systems biology: metabonomics and the continuum ofmetabolism. Nat. ReV. Drug DiscoV. 2 (8), 668–676.
(10) Lenz, E. M., and Wilson, I. D. (2007) Analytical strategies inmetabonomics. J. Proteome Res. 6 (2), 443–458.
(11) Wilson, I. D., Plumb, R., Granger, J., Major, H., Williams, R., andLenz, E. M. (2005) HPLC-MS-based methods for the study ofmetabonomics. J. Chromatogr., B 817 (1), 67–76.
(12) Wilson, I. D., Nicholson, J. K., Castro-Perez, J., Granger, J. H.,Johnson, K. A., Smith, B. W., and Plumb, R. S. (2005) Highresolution ”ultra performance” liquid chromatography coupled to oa-TOF mass spectrometry as a tool for differential metabolic pathwayprofiling in functional genomic studies. J. Proteome Res. 4 (2), 591–598.
(13) Nicholson, J. K., and Wilson, I. D. (1989) High resolution protonmagnetic resonance spectroscopy of biological fluids. Prog. Nucl.Magn. Reson. Spectrosc. 21, 449–501.
(14) Lindon, J. C., Holmes, E., and Nicholson, J. K. (2007) Metabonomicsin pharmaceutical R&D. FEBS J. 274 (5), 1140–1151.
(15) Nicholson, J. K., Timbrell, J. A., and Sadler, P. J. (1985) ProtonNMR spectra of urine as indicators of renal damage. Mercury-inducednephrotoxicity in rats. Mol. Pharmacol. 27 (6), 644–651.
(16) Nicholson, J. K., Timbrell, J. A., Bales, J. R., and Sadler, P. J. (1985)A high resolution proton nuclear magnetic resonance approach tothe study of hepatocyte and drug metabolism. Application toacetaminophen. Mol. Pharmacol. 27 (6), 634–643.
(17) Nicholson, J. K., and Wilson, I. D. (1987) High resolution nuclearmagnetic resonance spectroscopy of biological samples as an aid todrug development. Prog. Drug Res. 31, 427–479.
(18) Nicholson, J. K., Kendall, M. D., and Osborn, D. (1983) Cadmiumand mercury nephrotoxicity. Nature 304 (5927), 633–635.
(19) Gartland, K. P., Bonner, F. W., and Nicholson, J. K. (1989)Investigations into the biochemical effects of region-specific neph-rotoxins. Mol. Pharmacol. 35 (2), 242–250.
(20) Anthony, M. L., Gartland, K. P., Beddell, C. R., Lindon, J. C., andNicholson, J. K. (1992) Cephaloridine-induced nephrotoxicity in theFischer 344 rat: proton NMR spectroscopic studies of urine andplasma in relation to conventional clinical chemical and histopatho-logical assessments of nephronal damage. Arch. Toxicol. 66 (8), 525–537.
(21) Holmes, E., Bonner, F. W., Gartland, K. P., and Nicholson, J. K.(1990) Proton NMR monitoring of the onset and recovery ofexperimental renal damage. J. Pharm. Biomed. Anal. 8 (8–12), 959–962.
(22) Gartland, K. P., Anthony, M. L., Beddell, C. R., Lindon, J. C., andNicholson, J. K. (1990) Proton NMR studies on the effects of uranylnitrate on the biochemical composition of rat urine and plasma.J. Pharm. Biomed. Anal. 8 (8–12), 951–954.
(23) Anthony, M. L., Gartland, K. P., Beddell, C. R., Lindon, J. C., andNicholson, J. K. (1994) Studies of the biochemical toxicology ofuranyl nitrate in the rat. Arch. Toxicol. 68 (1), 43–53.
(24) Gartland, K. P., Bonner, F. W., Timbrell, J. A., and Nicholson, J. K.(1989) Biochemical characterisation of para-aminophenol-inducednephrotoxic lesions in the F344 rat. Arch. Toxicol. 63 (2), 97–106.
(25) Gartland, K. P., Eason, C. T., Wade, K. E., Bonner, F. W., andNicholson, J. K. (1989) Proton NMR spectroscopy of bile formonitoring the excretion of endogenous and xenobiotic metabolites:application to para-aminophenol. J. Pharm. Biomed. Anal. 7 (6), 699–707.
(26) Gartland, K. P., Eason, C. T., Bonner, F. W., and Nicholson, J. K.(1990) Effects of biliary cannulation and buthionine sulphoximinepretreatment on the nephrotoxicity of para-aminophenol in the Fischer344 rat. Arch. Toxicol. 64 (1), 14–25.
(27) Foxall, P. J., Bending, M. R., Gartland, K. P., and Nicholson, J. K.(1989) Acute renal failure following accidental cutaneous absorptionof phenol: application of NMR urinalysis to monitor the diseaseprocess. Hum. Toxicol. 8 (6), 491–496.
(28) Nicholson, J. K., Higham, D. P., Timbrell, J. A., and Sadler, P. J.(1989) Quantitative high resolution 1H NMR urinalysis studies onthe biochemical effects of cadmium in the rat. Mol. Pharmacol. 36(3), 398–404.
(29) Gray, J., Nicholson, J. K., Creasy, D. M., and Timbrell, J. A. (1990)Studies on the relationship between acute testicular damage andurinary and plasma creatine concentration. Arch. Toxicol. 64 (6), 443–450.
(30) Timbrell, J. A. (1998) Biomarkers in toxicology. Toxicology 129 (1),1–12.
(31) Waterfield, C. J., Turton, J. A., Scales, M. D., and Timbrell, J. A.(1993) Investigations into the effects of various hepatotoxic com-pounds on urinary and liver taurine levels in rats. Arch. Toxicol. 67(4), 244–254.
(32) Sanins, S. M., Nicholson, J. K., Elcombe, C., and Timbrell, J. A.(1990) Hepatotoxin-induced hypertaurinuria: a proton NMR study.Arch. Toxicol. 64 (5), 407–411.
(33) Sanins, S. M., Timbrell, J. A., Elcombe, C., and Nicholson, J. K.(1992) Proton NMR spectroscopic studies on the metabolism andbiochemical effects of hydrazine in vivo. Arch. Toxicol. 66 (7), 489–495.
(34) Timbrell, J. A., and Waterfield, C. J. (1996) Changes in taurine asan indicator of hepatic dysfunction and biochemical perturbations.Studies in vivo and in vitro. AdV. Exp. Med. Biol. 403, 125–134.
(35) Hoyle, V. R., Gilbert, P. J., Troke, J. A., Vose, C. W., and Nicholson,J. K. (1992) Studies on the biochemical effects of the aldose reductaseinhibitor 2,7-difluorospirofluorene-9,5′-imidazolidine-2′,4′-dione (Al1576, HOE 843). Detection of D-glucaric and D-glucuronic acidexcretion by high resolution 1H and 13C NMR spectroscopy. Biochem.Pharmacol. 44 (2), 231–241.
(36) Ghauri, F. Y., McLean, A. E., Beales, D., Wilson, I. D., andNicholson, J. K. (1993) Induction of 5-oxoprolinuria in the ratfollowing chronic feeding with N-acetyl 4-aminophenol (paraceta-mol). Biochem. Pharmacol. 46 (5), 953–957.
(37) Pitt, J. J., and Hauser, S. (1998) Transient 5-oxoprolinuria and highanion gap metabolic acidosis: clinical and biochemical findings ineleven subjects. Clin. Chem. 44 (7), 1497–1503.
(38) Gartland, K. P., Sanins, S. M., Nicholson, J. K., Sweatman, B. C.,Beddell, C. R., and Lindon, J. C. (1990) Pattern recognition analysisof high resolution 1H NMR spectra of urine. A nonlinear mappingapproach to the classification of toxicological data. NMR Biomed. 3(4), 166–172.
(39) Gartland, K. P., Beddell, C. R., Lindon, J. C., and Nicholson, J. K.(1991) Application of pattern recognition methods to the analysisand classification of toxicological data derived from proton nuclearmagnetic resonance spectroscopy of urine. Mol. Pharmacol. 39 (5),629–642.
(40) Anthony, M. L., Sweatman, B. C., Beddell, C. R., Lindon, J. C., andNicholson, J. K. (1994) Pattern recognition classification of the site
22 Chem. Res. Toxicol., Vol. 21, No. 1, 2008 Coen et al.
of nephrotoxicity based on metabolic data derived from proton nuclearmagnetic resonance spectra of urine. Mol. Pharmacol. 46 (1), 199–211.
(41) Holmes, E., Bonner, F. W., Sweatman, B. C., Lindon, J. C., Beddell,C. R., Rahr, E., and Nicholson, J. K. (1992) Nuclear magneticresonance spectroscopy and pattern recognition analysis of thebiochemical processes associated with the progression of and recoveryfrom nephrotoxic lesions in the rat induced by mercury(II) chlorideand 2-bromoethanamine. Mol. Pharmacol. 42 (5), 922–930.
(42) Holmes, E., Nicholson, J. K., Bonner, F. W., Sweatman, B. C.,Beddell, C. R., Lindon, J. C., and Rahr, E. (1992) Mapping thebiochemical trajectory of nephrotoxicity by pattern recognition ofNMR urinanalysis. NMR Biomed. 5 (6), 368–372.
(43) Holmes, E., Foxall, P. J., Nicholson, J. K., Neild, G. H., Brown,S. M., Beddell, C. R., Sweatman, B. C., Rahr, E., Lindon, J. C., andSpraul, M. (1994) Automatic data reduction and pattern recognitionmethods for analysis of 1H nuclear magnetic resonance spectra ofhuman urine from normal and pathological states. Anal. Biochem.220 (2), 284–296.
(44) Craig, A., Cloarec, O., Holmes, E., Nicholson, J. K., and Lindon,J. C. (2006) Scaling and normalization effects in NMR spectroscopicmetabonomic data sets. Anal. Chem. 78 (7), 2262–2267.
(45) Dieterle, F., Ross, A., Schlotterbeck, G., and Senn, H. (2006)Probabilistic quotient normalization as robust method to account fordilution of complex biological mixtures. Application in 1H NMRmetabonomics. Anal. Chem. 78 (13), 4281–4290.
(46) Holmes, E., Nicholls, A. W., Lindon, J. C., Ramos, S., Spraul, M.,Neidig, P., Connor, S. C., Connelly, J., Damment, S. J., Haselden,J., and Nicholson, J. K. (1998) Development of a model forclassification of toxin-induced lesions using 1H NMR spectroscopyof urine combined with pattern recognition. NMR Biomed. 11 (4–5),235–244.
(47) Jackson, J. E. A. (1991) A Users Guide to Principal Components,Wiley, New York.
(48) Wold, H. (1985) Partial Least Squares. In Encyclopedia of StatisticalSciences (Kotz S., and Johnson N. L., Eds.) pp 581–591, Wiley, NewYork.
(49) Brindle, J. T., Antti, H., Holmes, E., Tranter, G., Nicholson, J. K.,Bethell, H. W., Clarke, S., Schofield, P. M., McKilligin, E., Mosedale,D. E., and Grainger, D. J. (2002) Rapid and noninvasive diagnosisof the presence and severity of coronary heart disease using 1H-NMR-based metabonomics. Nat. Med. 8 (12), 1439–1444.
(50) Gavaghan, C. L., Wilson, I. D., and Nicholson, J. K. (2002)Physiological variation in metabolic phenotyping and functionalgenomic studies: use of orthogonal signal correction and PLS-DA.FEBS Lett. 530 (1–3), 191–196.
(51) Trygg, J., Holmes, E., and Lundstedt, T. (2007) Chemometrics inmetabonomics. J. Proteome Res. 6 (2), 469–479.
(52) Trygg, J., and Wold, S. (2003) O2-PLS, a two-block (X-Y) latentvariable regression (LVR) method with an integral OSC filter.J. Chemom. 17 (1), 53–64.
(53) Eriksson, L., Antti, H., Gottfries, J., Holmes, E., Johansson, E.,Lindgren, F., Long, I., Lundstedt, T., Trygg, J., and Wold, S. (2004)Using chemometrics for navigating in the large data sets of genomics,proteomics, and metabonomics (gpm). Anal. Bioanal. Chem. 380 (3),419–429.
(54) Stella, C., Beckwith-Hall, B., Cloarec, O., Holmes, E., Lindon, J. C.,Powell, J., van der Ouderaa, F., Bingham, S., Cross, A. J., andNicholson, J. K. (2006) Susceptibility of human metabolic phenotypesto dietary modulation. J. Proteome Res. 5 (10), 2780–2788.
(55) Cloarec, O., Dumas, M. E., Trygg, J., Craig, A., Barton, R. H.,Lindon, J. C., Nicholson, J. K., and Holmes, E. (2005) Evaluationof the orthogonal projection on latent structure model limitationscaused by chemical shift variability and improved visualization ofbiomarker changes in 1H NMR spectroscopic metabonomic studies.Anal. Chem. 77 (2), 517–526.
(56) Coen, M., Hong, Y. S., Clayton, T. A., Rohde, C. M., Pearce, J. T.,Reily, M. D., Robertson, D. G., Holmes, E., Lindon, J. C., andNicholson, J. K. (2007) The mechanism of galactosamine toxicityrevisited; a metabonomic study. J. Proteome Res. 6 (7), 2711–2719.
(57) Yap, I. K., Clayton, T. A., Tang, H., Everett, J. R., Hanton, G.,Provost, J. P., Le Net, J. L., Charuel, C., Lindon, J. C., and Nicholson,J. K. (2006) An integrated metabonomic approach to describetemporal metabolic disregulation induced in the rat by the modelhepatotoxin allyl formate. J. Proteome Res. 5 (10), 2675–2684.
(58) Martin, F. P., Wang, Y., Sprenger, N., Holmes, E., Lindon, J. C.,Kochhar, S., and Nicholson, J. K. (2007) Effects of probioticLactobacillus paracasei treatment on the host gut tissue metabolicprofiles probed via magic-angle-spinning NMR spectroscopy. J.Proteome Res. 6 (4), 1471–1481.
(59) Stoyanova, R., Nicholls, A. W., Nicholson, J. K., Lindon, J. C., andBrown, T. R. (2004) Automatic alignment of individual peaks in largehigh-resolution spectral data sets. J. Magn. Reson. 170 (2), 329–335.
(60) Csenki, L., Alm, E., Torgrip, R. J., Aberg, K. M., Nord, L. I.,Schuppe-Koistinen, I., and Lindberg, J. (2007) Proof of principle ofa generalized fuzzy Hough transform approach to peak alignment ofone-dimensional (1)H NMR data. Anal. Bioanal. Chem. 389 (3), 875–885.
(61) Forshed, J., Torgrip, R. J., Aberg, K. M., Karlberg, B., Lindberg, J.,and Jacobsson, S. P. (2005) A comparison of methods for alignmentof NMR peaks in the context of cluster analysis. J. Pharm. Biomed.Anal. 38 (5), 824–832.
(62) Wu, W., Daszykowski, M., Walczak, B., Sweatman, B. C., Connor,S. C., Haselden, J. N., Crowther, D. J., Gill, R. W., and Lutz, M. W.(2006) Peak alignment of urine NMR spectra using fuzzy warping.J. Chem. Inf. Model. 46 (2), 863–875.
(63) Jonsson, P., Bruce, S. J., Moritz, T., Trygg, J., Sjostrom, M., Plumb,R., Granger, J., Maibaum, E., Nicholson, J. K., Holmes, E., and Antti,H. (2005) Extraction, interpretation and validation of informationfor comparing samples in metabolic LC/MS data sets. Analyst 130(5), 701–707.
(64) Katajamaa, M., and Oresic, M. (2007) Data processing for massspectrometry-based metabolomics. J. Chromatogr., A 1158 (1–2),318–328.
(65) Smith, C. A., Want, E. J., O’Maille, G., Abagyan, R., and Siuzdak,G. (2006) XCMS: processing mass spectrometry data for metaboliteprofiling using nonlinear peak alignment, matching, and identification.Anal. Chem. 78 (3), 779–787.
(66) Holmes, E., Nicholson, J. K., and Tranter, G. (2001) Metabonomiccharacterization of genetic variations in toxicological and metabolicresponses using probabilistic neural networks. Chem. Res. Toxicol.14 (2), 182–191.
(67) Ott, K. H., Aranibar, N., Singh, B., and Stockton, G. W. (2003)Metabonomics classifies pathways affected by bioactive compounds.Artificial neural network classification of NMR spectra of plantextracts. Phytochemistry 62 (6), 971–985.
(68) Vehtari, A., Makinen, V. P., Soininen, P., Ingman, P., Makela, S. M.,Savolainen, M. J., Hannuksela, M. L., Kaski, K., and Ala-Korpela,M. (2007) A novel Bayesian approach to quantify clinical variablesand to determine their spectroscopic counterparts in 1H NMRmetabonomic data. BMC Bioinf. 8 (2), S8.
(69) Embrechts, M. J., and Ekins, S. (2007) Classification of metaboliteswith kernel-partial least squares (K-PLS). Drug Metab. Dispos. 35(3), 325–327.
(70) Crockford, D. J., Lindon, J. C., Cloarec, O., Plumb, R. S., Bruce,S. J., Zirah, S., Rainville, P., Stumpf, C. L., Johnson, K., Holmes,E., and Nicholson, J. K. (2006) Statistical search space reductionand two-dimensional data display approaches for UPLC-MS inbiomarker discovery and pathway analysis. Anal. Chem. 78 (13),4398–4408.
(71) Jonsson, P., Johansson, A. I., Gullberg, J., Trygg, J., A. J., Grung,B., Marklund, S., Sjostrom, M., Antti, H., and Moritz, T. (2005) High-throughput data analysis for detecting and identifying differencesbetween samples in GC/MS-based metabolomic analyses. Anal.Chem. 77 (17), 5635–5642.
(72) Robertson, D. G., Reily, M. D., Sigler, R. E., Wells, D. F., Paterson,D. A., and Braden, T. K. (2000) Metabonomics: evaluation of nuclearmagnetic resonance (NMR) and pattern recognition technology forrapid in vivo screening of liver and kidney toxicants. Toxicol. Sci.57 (2), 326–337.
(73) Foxall, P. J., Singer, J. M., Hartley, J. M., Neild, G. H., Lapsley,M., Nicholson, J. K., and Souhami, R. L. (1997) Urinary protonmagnetic resonance studies of early ifosfamide-induced nephrotox-icity and encephalopathy. Clin. Cancer Res. 3 (9), 1507–1518.
(74) Foxall, P. J., Lenz, E. M., Lindon, J. C., Neild, G. H., Wilson, I. D.,and Nicholson, J. K. (1996) Nuclear magnetic resonance and high-performance liquid chromatography-nuclear magnetic resonancestudies on the toxicity and metabolism of ifosfamide. Ther. DrugMonit. 18 (4), 498–505.
(75) Vilasi, A., Cutillas, P. R., Maher, A. D., Zirah, S. F., Capasso, G.,Norden, A. W., Holmes, E., Nicholson, J. K., and Unwin, R. J. (2007)Combined proteomic and metabonomic studies in three genetic formsof the renal Fanconi syndrome. Am. J. Physiol. Renal Physiol. 293(2), F456–F467.
(76) Murgatroyd, L. B., Pickford, R. J., Smith, I. K., Wilson, I. D., andMiddleton, B. J. (1992) 1H-NMR spectroscopy as a means ofmonitoring nephrotoxicity as exemplified by studies with cephalo-ridine. Hum. Exp. Toxicol. 11 (1), 35–41.
(77) Halligan, S., Byard, S. J., Spencer, A. J., Gray, T. J., Harpur, E. S.,and Bonner, F. W. (1995) A study of the nephrotoxicity of threecephalosporins in rabbits using 1H NMR spectroscopy. Toxicol. Lett.81 (1), 15–21.
PerspectiVe Chem. Res. Toxicol., Vol. 21, No. 1, 2008 23

(78) Holmes, E., Bonner, F. W., and Nicholson, J. K. (1997) 1H NMRspectroscopic and histopathological studies on propyleneimine-induced renal papillary necrosis in the rat and the multimammatedesert mouse (Mastomys natalensis). Comp. Biochem. Physiol C 116(2), 125–134.
(79) Garrod, S., Humpher, E., Connor, S. C., Connelly, J. C., Spraul, M.,Nicholson, J. K., and Holmes, E. (2001) High-resolution (1)H NMRand magic angle spinning NMR spectroscopic investigation of thebiochemical effects of 2-bromoethanamine in intact renal and hepatictissue. Magn. Reson. Med. 45 (5), 781–790.
(80) Holmes, E., Caddick, S., Lindon, J. C., Wilson, I. D., Kryvawych,S., and Nicholson, J. K. (1995) 1H and 2H NMR spectroscopic studieson the metabolism and biochemical effects of 2-bromoethanaminein the rat. Biochem. Pharmacol. 49 (10), 1349–1359.
(81) Holmes, E., Bonner, F. W., and Nicholson, J. K. (1995) Comparativestudies on the nephrotoxicity of 2-bromoethanamine hydrobromidein the Fischer 344 rat and the multimammate desert mouse (Mastomysnatalensis). Arch. Toxicol. 70 (2), 89–95.
(82) Anthony, M. L., Holmes, E., McDowell, P. C., Gray, T. J., Blackmore,M., and Nicholson, J. K. (1995) 1H NMR spectroscopic studies onthe reactions of haloalkylamines with bicarbonate ions: formationof N-carbamates and 2-oxazolidones in cell culture media and bloodplasma. Chem. Res. Toxicol. 8 (8), 1046–1053.
(83) Nicholls, A. W., Holmes, E., Lindon, J. C., Shockcor, J. P., Farrant,R. D., Haselden, J. N., Damment, S. J., Waterfield, C. J., andNicholson, J. K. (2001) Metabonomic investigations into hydrazinetoxicity in the rat. Chem. Res. Toxicol. 14 (8), 975–987.
(84) Garrod, S., Bollard, M. E., Nicholls, A. W., Connor, S. C., Connelly,J., Nicholson, J. K., and Holmes, E. (2005) Integrated metabonomicanalysis of the multiorgan effects of hydrazine toxicity in the rat.Chem. Res. Toxicol. 18 (2), 115–122.
(85) Bollard, M. E., Keun, H. C., Beckonert, O., Ebbels, T. M., Antti,H., Nicholls, A. W., Shockcor, J. P., Cantor, G. H., Stevens, G.,Lindon, J. C., Holmes, E., and Nicholson, J. K. (2005) Comparativemetabonomics of differential hydrazine toxicity in the rat and mouse.Toxicol. Appl. Pharmacol. 204 (2), 135–151.
(86) Waters, N. J., Waterfield, C. J., Farrant, R. D., Holmes, E., andNicholson, J. K. (2005) Metabonomic deconvolution of embeddedtoxicity: application to thioacetamide hepato- and nephrotoxicity.Chem. Res. Toxicol. 18 (4), 639–654.
(87) Azmi, J., Griffin, J. L., Shore, R. F., Holmes, E., and Nicholson,J. K. (2005) Chemometric analysis of biofluids following toxicantinduced hepatotoxicity: a metabonomic approach to distinguish theeffects of 1-naphthylisothiocyanate from its products. Xenobiotica35 (8), 839–852.
(88) Waters, N. J., Holmes, E., Waterfield, C. J., Farrant, R. D., andNicholson, J. K. (2002) NMR and pattern recognition studies on liverextracts and intact livers from rats treated with alpha-naphthylisothio-cyanate. Biochem. Pharmacol. 64 (1), 67–77.
(89) Waters, N. J., Holmes, E., Williams, A., Waterfield, C. J., Farrant,R. D., and Nicholson, J. K. (2001) NMR and pattern recognitionstudies on the time-related metabolic effects of alpha-naphthylisothio-cyanate on liver, urine, and plasma in the rat: an integrativemetabonomic approach. Chem. Res. Toxicol. 14 (10), 1401–1412.
(90) Clayton, T. A., Lindon, J. C., Everett, J. R., Charuel, C., Hanton,G., Le Net, J. L., Provost, J. P., and Nicholson, J. K. (2007)Hepatotoxin-induced hypertyrosinemia and its toxicological signifi-cance. Arch. Toxicol. 81 (3), 201–210.
(91) Beckwith-Hall, B. M., Nicholson, J. K., Nicholls, A. W., Foxall, P. J.,Lindon, J. C., Connor, S. C., Abdi, M., Connelly, J., and Holmes, E.(1998) Nuclear magnetic resonance spectroscopic and principalcomponents analysis investigations into biochemical effects of threemodel hepatotoxins. Chem. Res. Toxicol. 11 (4), 260–272.
(92) Bollard, M. E., Xu, J., Purcell, W., Griffin, J. L., Quirk, C., Holmes,E., and Nicholson, J. K. (2002) Metabolic profiling of the effects ofD-galactosamine in liver spheroids using (1)H NMR and MAS-NMRspectroscopy. Chem. Res. Toxicol. 15 (11), 1351–1359.
(93) Waters, N. J., Waterfield, C. J., Farrant, R. D., Holmes, E., andNicholson, J. K. (2006) Integrated metabonomic analysis of bro-mobenzene-induced hepatotoxicity: novel induction of 5-oxoproli-nosis. J. Proteome Res. 5 (6), 1448–1459.
(94) Keun, H. C., Ebbels, T. M., Bollard, M. E., Beckonert, O., Antti,H., Holmes, E., Lindon, J. C., and Nicholson, J. K. (2004) Geometrictrajectory analysis of metabolic responses to toxicity can definetreatment specific profiles. Chem. Res. Toxicol. 17 (5), 579–587.
(95) Coen, M., Lenz, E. M., Nicholson, J. K., Wilson, I. D., Pognan, F.,and Lindon, J. C. (2003) An integrated metabonomic investigationof acetaminophen toxicity in the mouse using NMR spectroscopy.Chem. Res. Toxicol. 16 (3), 295–303.
(96) Coen, M., Ruepp, S. U., Lindon, J. C., Nicholson, J. K., Pognan, F.,Lenz, E. M., and Wilson, I. D. (2004) Integrated application of
transcriptomics and metabonomics yields new insight into the toxicitydue to paracetamol in the mouse. J. Pharm. Biomed. Anal. 35 (1),93–105.
(97) Clayton, T. A., Lindon, J. C., Cloarec, O., Antti, H., Charuel, C.,Hanton, G., Provost, J. P., Le Net, J. L., Baker, D., Walley, R. J.,Everett, J. R., and Nicholson, J. K. (2006) Pharmaco-metabonomicphenotyping and personalized drug treatment. Nature 440 (7087),1073–1077.
(98) Bales, J. R., Nicholson, J. K., and Sadler, P. J. (1985) Two-dimensional proton nuclear magnetic resonance ”maps” of acetami-nophen metabolites in human urine. Clin. Chem. 31 (5), 757–762.
(99) Bales, J. R., Sadler, P. J., Nicholson, J. K., and Timbrell, J. A. (1984)Urinary excretion of acetaminophen and its metabolites as studiedby proton NMR spectroscopy. Clin. Chem. 30 (10), 1631–1636.
(100) Nicholls, A. W., Caddick, S., Wilson, I. D., Farrant, R. D., Lindon,J. C., and Nicholson, J. K. (1995) High resolution NMR spectroscopicstudies on the metabolism and futile deacetylation of 4-hydroxyac-etanilide (paracetamol) in the rat. Biochem. Pharmacol. 49 (8), 1155–1164.
(101) Dieterle, F., Schlotterbeck, G., Binder, M., Ross, A., Suter, L., andSenn, H. (2007) Application of metabonomics in a comparativeprofiling study reveals N-acetylfelinine excretion as a biomarker forinhibition of the farnesyl pathway by bisphosphonates. Chem. Res.Toxicol. 20 (9), 1291–1299.
(102) Robertson, D. G., Reily, M. D., Albassam, M., and Dethloff, L. A.(2001) Metabonomic assessment of vasculitis in rats. CardioVasc.Toxicol. 1 (1), 7–19.
(103) Griffin, J. L., Walker, L. A., Shore, R. F., and Nicholson, J. K. (2001)Metabolic profiling of chronic cadmium exposure in the rat. Chem.Res. Toxicol. 14 (10), 1428–1434.
(104) Bundy, J. G., Spurgeon, D. J., Svendsen, C., Hankard, P. K., Weeks,J. M., Osborn, D., Lindon, J. C., and Nicholson, J. K. (2004)Environmental metabonomics: applying combination biomarkeranalysis in earthworms at a metal contaminated site. Ecotoxicology13 (8), 797–806.
(105) Bundy, J. G., Keun, H. C., Sidhu, J. K., Spurgeon, D. J., Svendsen,C., Kille, P., and Morgan, A. J. (2007) Metabolic profile biomarkersof metal contamination in a sentinel terrestrial species are applicableacross multiple sites. EnViron. Sci. Technol. 41 (12), 4458–4464.
(106) Samuelsson, L. M., Forlin, L., Karlsson, G., dolfsson-Erici, M., andLarsson, D. G. (2006) Using NMR metabolomics to identifyresponses of an environmental estrogen in blood plasma of fish.Aquat. Toxicol. 78 (4), 341–349.
(107) Zhu, Y. S., Xu, H. B., Huang, K. X., Hu, W. H., and Liu, M. L.(2002) A study on human urine in a high-selenium area of Chinaby 1H-NMR spectroscopy. Biol. Trace Elem. Res. 89 (2), 155–163.
(108) Mortishire-Smith, R. J., Skiles, G. L., Lawrence, J. W., Spence, S.,Nicholls, A. W., Johnson, B. A., and Nicholson, J. K. (2004) Use ofmetabonomics to identify impaired fatty acid metabolism as themechanism of a drug-induced toxicity. Chem. Res. Toxicol. 17 (2),165–173.
(109) Cheng, L. L., Lean, C. L., Bogdanova, A., Wright, S. C., Jr.,Ackerman, J. L., Brady, T. J., and Garrido, L. (1996) Enhancedresolution of proton NMR spectra of malignant lymph nodes usingmagic-angle spinning. Magn Reson. Med. 36 (5), 653–658.
(110) Cheng, L. L., Ma, M. J., Becerra, L., Ptak, T., Tracey, I., Lackner,A., and Gonzalez, R. G. (1997) Quantitative neuropathology by highresolution magic angle spinning proton magnetic resonance spec-troscopy. Proc. Natl. Acad. Sci. U.S.A. 94 (12), 6408–6413.
(111) Cheng, L. L., Chang, I. W., Smith, B. L., and Gonzalez, R. G. (1998)Evaluating human breast ductal carcinomas with high-resolutionmagic-angle spinning proton magnetic resonance spectroscopy. J.Magn. Reson. 135 (1), 194–202.
(112) Cheng, L. L., Chang, I. W., Louis, D. N., and Gonzalez, R. G. (1998)Correlation of high-resolution magic angle spinning proton magneticresonance spectroscopy with histopathology of intact human braintumor specimens. Cancer Res. 58 (9), 1825–1832.
(113) Millis, K. K., Maas, W. E., Cory, D. G., and Singer, S. (1997)Gradient, high-resolution, magic-angle spinning nuclear magneticresonance spectroscopy of human adipocyte tissue. Magn. Reson.Med. 38 (3), 399–403.
(114) Moka, D., Vorreuther, R., Schicha, H., Spraul, M., Humpfer, E.,Lipinski, M., Foxall, P. J., Nicholson, J. K., and Lindon, J. C. (1998)Biochemical classification of kidney carcinoma biopsy samples usingmagic-angle-spinning 1H nuclear magnetic resonance spectroscopy.J. Pharm. Biomed. Anal. 17 (1), 125–132.
(115) Tomlins, A. M., Foxall, P. J., Lynch, M. J., Parkinson, J., Everett,J. R., and Nicholson, J. K. (1998) High resolution 1H NMRspectroscopic studies on dynamic biochemical processes in incubatedhuman seminal fluid samples. Biochim. Biophys. Acta 1379 (3), 367–380.
(116) Weybright, P., Millis, K., Campbell, N., Cory, D. G., and Singer, S.(1998) Gradient, high-resolution, magic angle spinning 1H nuclear
24 Chem. Res. Toxicol., Vol. 21, No. 1, 2008 Coen et al.

magnetic resonance spectroscopy of intact cells. Magn. Reson. Med.39 (3), 337–345.
(117) Mao, H., Toufexis, D., Wang, X., Lacreuse, A., and Wu, S. (2007)Changes of metabolite profile in kainic acid induced hippocampalinjury in rats measured by HRMAS NMR. Exp. Brain Res. 183 (4),477–485.
(118) Holmes, E., Tsang, T. M., and Tabrizi, S. J. (2006) The applicationof NMR-based metabonomics in neurological disorders. NeuroRx. 3(3), 358–372.
(119) Taylor, J. L., Wu, C. L., Cory, D., Gonzalez, R. G., Bielecki, A.,and Cheng, L. L. (2003) High-resolution magic angle spinning protonNMR analysis of human prostate tissue with slow spinning rates.Magn. Reson. Med. 50 (3), 627–632.
(120) Swanson, M. G., Zektzer, A. S., Tabatabai, Z. L., Simko, J., Jarso,S., Keshari, K. R., Schmitt, L., Carroll, P. R., Shinohara, K.,Vigneron, D. B., and Kurhanewicz, J. (2006) Quantitative analysisof prostate metabolites using 1H HR-MAS spectroscopy. Magn.Reson. Med. 55 (6), 1257–1264.
(121) Garrod, S., Humpfer, E., Spraul, M., Connor, S. C., Polley, S.,Connelly, J., Lindon, J. C., Nicholson, J. K., and Holmes, E. (1999)High-resolution magic angle spinning 1H NMR spectroscopic studieson intact rat renal cortex and medulla. Magn. Reson. Med. 41 (6),1108–1118.
(122) Bollard, M. E., Garrod, S., Holmes, E., Lindon, J. C., Humpfer, E.,Spraul, M., and Nicholson, J. K. (2000) High-resolution (1)H and(1)H-(13)C magic angle spinning NMR spectroscopy of rat liver.Magn. Reson. Med. 44 (2), 201–207.
(123) Li, W., Lee, R. E., Lee, R. E., and Li, J. (2005) Methods foracquisition and assignment of multidimensional high-resolution magicangle spinning NMR of whole cell bacteria. Anal. Chem. 77 (18),5785–5792.
(124) Yang, Y., Li, C., Nie, X., Feng, X., Chen, W., Yue, Y., Tang, H.,and Deng, F. (2007) Metabonomic studies of human hepatocellularcarcinoma using high-resolution magic-angle spinning (1)H NMRspectroscopy in conjunction with multivariate data analysis. J.Proteome Res. 6 (7), 2605–2614.
(125) Moreno, B., Rodrigues, C. O., Bailey, B. N., Urbina, J. A., Moreno,S. N., Docampo, R., and Oldfield, E. (2002) Magic-angle spinning(31)P NMR spectroscopy of condensed phosphates in parasiticprotozoa: visualizing the invisible. FEBS Lett. 523 (1–3), 207–212.
(126) Payne, G. S., Troy, H., Vaidya, S. J., Griffiths, J. R., Leach, M. O.,and Chung, Y. L. (2006) Evaluation of 31P high-resolution magicangle spinning of intact tissue samples. NMR Biomed. 19 (5), 593–598.
(127) Hu, J. Z., Wind, R. A., and Rommereim, D. N. (2006) (1)H relaxationtimes of metabolites in biological samples obtained with nondestruc-tive ex-vivo slow-MAS NMR. Magn. Reson. Chem. 44 (3), 269–275.
(128) Wind, R. A., Hu, J. Z., and Majors, P. D. (2006) Localized in vivoisotropic-anisotropic correlation 1H NMR spectroscopy using ul-traslow magic angle spinning. Magn. Reson. Med. 55 (1), 41–49.
(129) Keun, H. C., Beckonert, O., Griffin, J. L., Richter, C., Moskau, D.,Lindon, J. C., and Nicholson, J. K. (2002) Cryogenic probe 13C NMRspectroscopy of urine for metabonomic studies. Anal. Chem. 74 (17),4588–4593.
(130) Engelke, U. F., Tangerman, A., Willemsen, M. A., Moskau, D., Loss,S., Mudd, S. H., and Wevers, R. A. (2005) Dimethyl sulfone inhuman cerebrospinal fluid and blood plasma confirmed by one-dimensional (1)H and two-dimensional (1)H-(13)C NMR. NMRBiomed. 18 (5), 331–336.
(131) Fiehn, O., and Kind, T. (2007) Metabolite profiling in blood plasma.Methods Mol. Biol. 358, 3–17.
(132) Fiehn, O., Kopka, J., Dormann, P., Altmann, T., Trethewey, R. N.,and Willmitzer, L. (2000) Metabolite profiling for plant functionalgenomics. Nat. Biotechnol. 18 (11), 1157–1161.
(133) Halket, J. M., Waterman, D., Przyborowska, A. M., Patel, R. K.,Fraser, P. D., and Bramley, P. M. (2005) Chemical derivatizationand mass spectral libraries in metabolic profiling by GC/MS and LC/MS/MS. J. Exp. Bot. 56 (410), 219–243.
(134) Mashego, M. R., Rumbold, K., De, M. M., Vandamme, E., Soetaert,W., and Heijnen, J. J. (2007) Microbial metabolomics: past, presentand future methodologies. Biotechnol. Lett. 29 (1), 1–16.
(135) Cloarec, O., Campbell, A., Tseng, L. H., Braumann, U., Spraul, M.,Scarfe, G., Weaver, R., and Nicholson, J. K. (2007) Virtualchromatographic resolution enhancement in cryoflow LC-NMRexperiments via statistical total correlation spectroscopy. Anal. Chem.79 (9), 3304–3311.
(136) Nicholls, A. W., Lindon, J. C., Farrant, R. D., Shockcor, J. P., Wilson,I. D., and Nicholson, J. K. (1999) Directly-coupled HPLC-NMRspectroscopic studies of metabolism and futile deacetylation ofphenacetin in the rat. J. Pharm. Biomed. Anal. 20 (6), 865–873.
(137) Sidelmann, U. G., Bjornsdottir, I., Shockcor, J. P., Hansen, S. H.,Lindon, J. C., and Nicholson, J. K. (2001) Directly coupled HPLC-
NMR and HPLC-MS approaches for the rapid characterisation ofdrug metabolites in urine: application to the human metabolism ofnaproxen. J. Pharm. Biomed. Anal. 24 (4), 569–579.
(138) Spraul, M., Hofmann, M., Lindon, J. C., Farrant, R. D., Seddon, M. J.,Nicholson, J. K., and Wilson, I. D. (1994) Evaluation of liquidchromatography coupled with high-field 1H NMR spectroscopy fordrug metabolite detection and characterization: the identification ofparacetamol metabolites in urine and bile. NMR Biomed. 7 (7), 295–303.
(139) Wilson, I. D., and Nicholson, J. K. (1987) Solid-phase extractionchromatography and nuclear magnetic resonance spectrometry forthe identification and isolation of drug metabolites in urine. Anal.Chem. 59 (23), 2830–2832.
(140) Wilson, I. D., and Nicholson, J. K. (1988) Solid phase extractionchromatography and NMR spectroscopy (SPEC-NMR) for the rapididentification of drug metabolites in urine. J. Pharm. Biomed. Anal.6 (2), 151–165.
(141) Phipps, A. N., Stewart, J., Wright, B., and Wilson, I. D. (1998) Effectof diet on the urinary excretion of hippuric acid and other dietary-derived aromatics in rat. A complex interaction between diet, gutmicroflora and substrate specificity. Xenobiotica 28 (5), 527–537.
(142) Robosky, L. C., Wells, D. F., Egnash, L. A., Manning, M. L., Reily,M. D., and Robertson, D. G. (2005) Metabonomic identification oftwo distinct phenotypes in Sprague-Dawley (Crl:CD(SD)) rats.Toxicol. Sci. 87 (1), 277–284.
(143) Shockcor, J. P., Unger, S. E., Wilson, I. D., Foxall, P. J., Nicholson,J. K., and Lindon, J. C. (1996) Combined HPLC, NMR spectroscopy,and ion-trap mass spectrometry with application to the detection andcharacterization of xenobiotic and endogenous metabolites in humanurine. Anal. Chem. 68 (24), 4431–4435.
(144) Lenz, E. M., Bright, J., Knight, R., Westwood, F. R., Davies, D.,Major, H., and Wilson, I. D. (2005) Metabonomics with 1H-NMRspectroscopy and liquid chromatography-mass spectrometry appliedto the investigation of metabolic changes caused by gentamicin-induced nephrotoxicity in the rat. Biomarkers 10 (2–3), 173–187.
(145) Want, E. J., Nordstrom, A., Morita, H., and Siuzdak, G. (2007) Fromexogenous to endogenous: the inevitable imprint of mass spectrometryin metabolomics. J. Proteome Res. 6 (2), 459–468.
(146) Williams, R., Lenz, E. M., Wilson, A. J., Granger, J., Wilson, I. D.,Major, H., Stumpf, C., and Plumb, R. (2006) A multi-analyticalplatform approach to the metabonomic analysis of plasma fromnormal and Zucker (fa/fa) obese rats. Mol. Biosyst. 2 (3–4), 174–183.
(147) Williams, R. E., Major, H., Lock, E. A., Lenz, E. M., and Wilson,I. D. (2005) D-Serine-induced nephrotoxicity: a HPLC-TOF/MS-based metabonomics approach. Toxicology 207 (2), 179–190.
(148) Williams, R. E., Lenz, E. M., Lowden, J. S., Rantalainen, M., andWilson, I. D. (2005) The metabonomics of aging and developmentin the rat: an investigation into the effect of age on the profile ofendogenous metabolites in the urine of male rats using 1H NMR andHPLC-TOF MS. Mol. Biosyst. 1 (2), 166–175.
(149) Plumb, R. S., Granger, J. H., Stumpf, C. L., Johnson, K. A., Smith,B. W., Gaulitz, S., Wilson, I. D., and Castro-Perez, J. (2005) A rapidscreening approach to metabonomics using UPLC and oa-TOF massspectrometry: application to age, gender and diurnal variation innormal/Zucker obese rats and black, white and nude mice. Analyst130 (6), 844–849.
(150) Plumb, R. S., Johnson, K. A., Rainville, P., Smith, B. W., Wilson,I. D., Castro-Perez, J. M., and Nicholson, J. K. (2006) UPLC/MS(E);a new approach for generating molecular fragment information forbiomarker structure elucidation. Rapid Commun. Mass Spectrom. 20(13), 1989–1994.
(151) Plumb, R. S., Johnson, K. A., Rainville, P., Shockcor, J. P., Williams,R., Granger, J. H., and Wilson, I. D. (2006) The detection ofphenotypic differences in the metabolic plasma profile of three strainsof Zucker rats at 20 weeks of age using ultra-performance liquidchromatography/orthogonal acceleration time-of-flight mass spec-trometry. Rapid Commun. Mass Spectrom. 20 (19), 2800–2806.
(152) Apollonio, L. G., Pianca, D. J., Whittall, I. R., Maher, W. A., andKyd, J. M. (2006) A demonstration of the use of ultra-performanceliquid chromatography-mass spectrometry UPLC/MS in the deter-mination of amphetamine-type substances and ketamine for forensicand toxicological analysis. J. Chromatogr., B 836 (1–2), 111–115.
(153) Ross, K. L., Tu, T. T., Smith, S., and Dalluge, J. J. (2007) Profilingof organic acids during fermentation by ultraperformance liquidchromatography-tandem mass spectrometry. Anal. Chem. 79 (13),4840–4844.
(154) Fux, E., McMillan, D., Bire, R., and Hess, P. (2007) Developmentof an ultra-performance liquid chromatography-mass spectrometrymethod for the detection of lipophilic marine toxins. J. Chromatogr.,A. 1157 (1), 273–280.
(155) New, L. S., Saha, S., Ong, M. M., Boelsterli, U. A., and Chan, E. C.(2007) Pharmacokinetic study of intraperitoneally administered
PerspectiVe Chem. Res. Toxicol., Vol. 21, No. 1, 2008 25

troglitazone in mice using ultra-performance liquid chromatography/tandem mass spectrometry. Rapid Commun. Mass Spectrom. 21 (6),982–988.
(156) Licea-Perez, H., Wang, S., Bowen, C. L., and Yang, E. (2007) Asemi-automated 96-well plate method for the simultaneous determi-nation of oral contraceptives concentrations in human plasma usingultra performance liquid chromatography coupled with tandem massspectrometry. J. Chromatogr., B 852 (1–2), 69–76.
(157) Yin, P., Zhao, X., Li, Q., Wang, J., Li, J., and Xu, G. (2006)Metabonomics study of intestinal fistulas based on ultraperformanceliquid chromatography coupled with Q-TOF mass spectrometry(UPLC/Q-TOF MS). J. Proteome Res. 5 (9), 2135–2143.
(158) Granger, J. H., Williams, R., Lenz, E. M., Plumb, R. S., Stumpf,C. L., and Wilson, I. D. (2007) A metabonomic study of strain- andage-related differences in the Zucker rat. Rapid Commun. MassSpectrom. 21 (13), 2039–2045.
(159) Lenz, E. M., Williams, R. E., Sidaway, J., Smith, B. W., Plumb,R. S., Johnson, K. A., Rainville, P., Shockcor, J., Stumpf, C. L.,Granger, J. H., and Wilson, I. D. (2007) The application of microboreUPLC/oa-TOF-MS and (1)H NMR spectroscopy to the metabonomicanalysis of rat urine following the intravenous administration ofpravastatin. J. Pharm. Biomed. Anal. 44 (4), 845–852.
(160) Lenz, E. M., Bright, J., Knight, R., Wilson, I. D., and Major, H.(2004) A metabonomic investigation of the biochemical effects ofmercuric chloride in the rat using 1H NMR and HPLC-TOF/MS: timedependent changes in the urinary profile of endogenous metabolitesas a result of nephrotoxicity. Analyst 129 (6), 535–541.
(161) Holmes, E., Nicholls, A. W., Lindon, J. C., Connor, S. C., Connelly,J. C., Haselden, J. N., Damment, S. J., Spraul, M., Neidig, P., andNicholson, J. K. (2000) Chemometric models for toxicity classifica-tion based on NMR spectra of biofluids. Chem. Res. Toxicol. 13 (6),471–478.
(162) Maddox, J. F., Luyendyk, J. P., Cosma, G. N., Breau, A. P., Bible,R. H., Jr., Harrigan, G. G., Goodacre, R., Ganey, P. E., Cantor, G. H.,Cockerell, G. L., and Roth, R. A. (2006) Metabonomic evaluationof idiosyncrasy-like liver injury in rats cotreated with ranitidine andlipopolysaccharide. Toxicol. Appl. Pharmacol. 212 (1), 35–44.
(163) Cloarec, O., Dumas, M. E., Craig, A., Barton, R. H., Trygg, J.,Hudson, J., Blancher, C., Gauguier, D., Lindon, J. C., Holmes, E.,and Nicholson, J. (2005) Statistical total correlation spectroscopy:an exploratory approach for latent biomarker identification frommetabolic 1H NMR data sets. Anal. Chem. 77 (5), 1282–1289.
(164) Holmes, E., Cloarec, O., and Nicholson, J. K. (2006) Probing latentbiomarker signatures and in vivo pathway activity in experimentaldisease states via statistical total correlation spectroscopy (STOCSY)of biofluids: application to HgCl2 toxicity. J. Proteome Res. 5 (6),1313–1320.
(165) Holmes, E., Loo, R. L., Cloarec, O., Coen, M., Tang, H., Maibaum,E., Bruce, S., Chan, Q., Elliott, P., Stamler, J., Wilson, I. D., Lindon,J. C., and Nicholson, J. K. (2007) Detection of urinary drug metabolite(xenometabolome) signatures in molecular epidemiology studies viastatistical total correlation (NMR) spectroscopy. Anal. Chem. 79 (7),2629–2640.
(166) Smith, L. M., Maher, A. D., Cloarec, O., Rantalainen, M., Tang, H.,Elliott, P., Stamler, J., Lindon, J. C., Holmes, E., and Nicholson,J. K. (2007) Statistical correlation and projection methods forimproved information recovery from diffusion-edited NMR spectraof biological samples. Anal. Chem. 79 (15), 5682–5689.
(167) Coen, M., Hong, Y. S., Cloarec, O., Rohde, C. M., Reily, M. D.,Robertson, D. G., Holmes, E., Lindon, J. C., and Nicholson, J. K.(2007) Heteronuclear 1H - 31P Statistical Ttal Correlation NMRSpectroscopY (HET-STOCSY) of intact liver for metabolic biomarkerassignment: Application to galactosamine-induced hepatotoxicity.Anal. Chem. 79 (23), 8956–8966.
(168) Crockford, D. J., Holmes, E., Lindon, J. C., Plumb, R. S., Zirah, S.,Bruce, S. J., Rainville, P., Stumpf, C. L., and Nicholson, J. K. (2006)Statistical heterospectroscopy, an approach to the integrated analysisof NMR and UPLC-MS data sets: application in metabonomictoxicology studies. Anal. Chem. 78 (2), 363–371.
(169) Rantalainen, M., Cloarec, O., Beckonert, O., Wilson, I. D., Jackson,D., Tonge, R., Rowlinson, R., Rayner, S., Nickson, J., Wilkinson,R. W., Mills, J. D., Trygg, J., Nicholson, J. K., and Holmes, E. (2006)Statistically integrated metabonomic-proteomic studies on a humanprostate cancer xenograft model in mice. J. Proteome Res. 5 (10),2642–2655.
(170) Dumas, M. E., Wilder, S. P., Bihoreau, M. T., Barton, R. H.,Fearnside, J. F., Argoud, K., D’Amato, L., Wallis, R. H., Blancher,C., Keun, H. C., Baunsgaard, D., Scott, J., Sidelmann, U. G.,Nicholson, J. K., and Gauguier, D. (2007) Direct quantitative traitlocus mapping of mammalian metabolic phenotypes in diabetic andnormoglycemic rat models. Nat. Genet. 39 (5), 666–672.
(171) Nicholson, J. K., Holmes, E., Lindon, J. C., and Wilson, I. D. (2004)The challenges of modeling mammalian biocomplexity. Nat. Bio-technol. 22 (10), 1268–1274.
(172) Lindon, J. C., Keun, H. C., Ebbels, T. M., Pearce, J. M., Holmes,E., and Nicholson, J. K. (2005) The Consortium for MetabonomicToxicology (COMET): aims, activities and achievements. Pharma-cogenomics. 6 (7), 691–699.
(173) Lindon, J. C., Nicholson, J. K., Holmes, E., Antti, H., Bollard, M. E.,Keun, H., Beckonert, O., Ebbels, T. M., Reily, M. D., Robertson,D., Stevens, G. J., Luke, P., Breau, A. P., Cantor, G. H., Bible, R. H.,Niederhauser, U., Senn, H., Schlotterbeck, G., Sidelmann, U. G.,Laursen, S. M., Tymiak, A., Car, B. D., Lehman-McKeeman, L.,Colet, J. M., Loukaci, A., and Thomas, C. (2003) Contemporaryissues in toxicology the role of metabonomics in toxicology and itsevaluation by the COMET project. Toxicol. Appl. Pharmacol. 187(3), 137–146.
(174) Ebbels, T. M., Keun, H. C., Beckonert, O. P., Bollard, M. E., Lindon,J. C., Holmes, E., and Nicholson, J. K. (2007) Prediction andclassification of drug toxicity using probabilistic modeling of temporalmetabolic data: the consortium on metabonomic toxicology screeningapproach. J. Proteome Res. 6 (11), 4407–4422.
(175) Wang, Y., Bollard, M. E., Keun, H., Antti, H., Beckonert, O., Ebbels,T. M., Lindon, J. C., Holmes, E., Tang, H., and Nicholson, J. K.(2003) Spectral editing and pattern recognition methods applied tohigh-resolution magic-angle spinning 1H nuclear magnetic resonancespectroscopy of liver tissues. Anal. Biochem. 323 (1), 26–32.
(176) Ebbels, T. M. D., Keun, H. C., Beckonert, O. P., Antti, H., Bollard,M. E., Lindon, J. C., Holmes, E. C., and Nicholson, J. K. (2003)Toxicity classification from metabonomic data usinga density su-perposition approach: ‘CLOUDS’. Anal. Chim. Acta 490, 109–122.
(177) Beckonert, O. P., Bollard, M. E., Ebbels, T. M. D., Keun, H. C.,Antti, H., Lindon, J. C., Holmes, E. C., and Nicholson, J. K. (2003)NMR-based metabonomic toxicity classification: hierarchical clusteranalysis and k-nearest-neighbour approaches. Anal. Chim. Acta 490,3–15.
(178) Keun, H. C., Ebbels, T. M., Antti, H., Bollard, M. E., Beckonert,O., Schlotterbeck, G., Senn, H., Niederhauser, U., Holmes, E., Lindon,J. C., and Nicholson, J. K. (2002) Analytical reproducibility in (1)HNMR-based metabonomic urinalysis. Chem. Res. Toxicol. 15 (11),1380–1386.
(179) Bollard, M. E., Contel, N. R., Ebbels T. M. D., Smith L., BeckonertO., Cantor G. H., Lehman-McKeeman L. D., Holmes E. H., LindonJ. C., Nicholson J. K., and Keun, H. C. (2007) NMR-based metabolicprofiling reveals biomarkers of liver regeneration following partialhepatectomy in the rat. J. Proteome Res., submitted for publication.
(180) Lindon, J. C., Nicholson, J. K., and Everett, J. R. (1999) NMRspectroscopy of biofluids. In Annual Reports on NMR Spectroscopy(Webb, G. A., Ed.) p 1Y88, Academic Press, Oxford, U.K.
(181) Moolenaar, S. H., Engelke, U. F., and Wevers, R. A. (2003) Protonnuclear magnetic resonance spectroscopy of body fluids in the fieldof inborn errors of metabolism. Ann. Clin. Biochem. 40 (Pt 1), 16–24.
(182) Vangala, S., and Tonelli, A. (2007) Biomarkers, metabonomics, anddrug development: can inborn errors of metabolism help in under-standing drug toxicity? AAPS. J. 9 (3), E284–E297.
(183) Makinen, V. P., Soininen, P., Forsblom, C., Parkkonen, M., Ingman,P., Kaski, K., Groop, P. H., and la-Korpela, M. (2006) Diagnosingdiabetic nephropathy by 1H NMR metabonomics of serum. MAGMA.19 (6), 281–296.
(184) Wang, C., Kong, H., Guan, Y., Yang, J., Gu, J., Yang, S., and Xu,G. (2005) Plasma phospholipid metabolic profiling and biomarkersof type 2 diabetes mellitus based on high-performance liquidchromatography/electrospray mass spectrometry and multivariatestatistical analysis. Anal. Chem. 77 (13), 4108–4116.
(185) Coen, M., O’Sullivan, M., Bubb, W. A., Kuchel, P. W., and Sorrell,T. (2005) Proton nuclear magnetic resonance-based metabonomicsfor rapid diagnosis of meningitis and ventriculitis. Clin. Infect. Dis.41 (11), 1582–1590.
(186) Odunsi, K., Wollman, R. M., Ambrosone, C. B., Hutson, A., McCann,S. E., Tammela, J., Geisler, J. P., Miller, G., Sellers, T., Cliby, W.,Qian, F., Keitz, B., Intengan, M., Lele, S., and Alderfer, J. L. (2005)Detection of epithelial ovarian cancer using 1H-NMR-based meta-bonomics. Int. J. Cancer 113 (5), 782–788.
(187) Yang, J., Xu, G., Zheng, Y., Kong, H., Pang, T., Lv, S., and Yang,Q. (2004) Diagnosis of liver cancer using HPLC-based metabonomicsavoiding false-positive result from hepatitis and hepatocirrhosisdiseases. J. Chromatogr., B 813 (1–2), 59–65.
(188) Marchesi, J. R., Holmes, E., Khan, F., Kochhar, S., Scanlan, P.,Shanahan, F., Wilson, I. D., and Wang, Y. (2007) Rapid andnoninvasive metabonomic characterization of inflammatory boweldisease. J. Proteome Res. 6 (2), 546–551.
(189) Lauridsen, M., Hansen, S. H., Jaroszewski, J. W., and Cornett, C.(2007) Human urine as test material in 1H NMR-based metabonom-
26 Chem. Res. Toxicol., Vol. 21, No. 1, 2008 Coen et al.

ics: recommendations for sample preparation and storage. Anal.Chem. 79 (3), 1181–1186.
(190) Le, M. L., Racine, S., Le, T. P., Adnet, F., Larue, V., Cohen, Y.,Leroux, Y., Cupa, M., and Hantz, E. (2002) Aminoglycoside andglycopeptide renal toxicity in intensive care patients studied by protonmagnetic resonance spectroscopy of urine. Crit. Care Med. 30 (6),1242–1245.
(191) Stamler, J., Elliott, P., Appel, L., Chan, Q., Buzzard, M., Dennis,B., Dyer, A. R., Elmer, P., Greenland, P., Jones, D., Kesteloot, H.,Kuller, L., Labarthe, D., Liu, K., Moag-Stahlberg, A., Nichaman,M., Okayama, A., Okuda, N., Robertson, C., Rodriguez, B., Stevens,M., Ueshima, H., Horn, L. V., and Zhou, B. (2003) Higher bloodpressure in middle-aged American adults with less education-role ofmultiple dietary factors: the INTERMAP study. J. Hum. Hypertens.17 (9), 655–775.
(192) Dennis, B., Stamler, J., Buzzard, M., Conway, R., Elliott, P., Moag-Stahlberg, A., Okayama, A., Okuda, N., Robertson, C., Robinson,F., Schakel, S., Stevens, M., Van Heel, N., Zhao, L., and Zhou, B. F.(2003) INTERMAP: the dietary data: process and quality control. J.Hum. Hypertens. 17 (9), 609–622.
(193) Craig, A., Sidaway, J., Holmes, E., Orton, T., Jackson, D., Rowlinson,R., Nickson, J., Tonge, R., Wilson, I., and Nicholson, J. (2006)Systems toxicology: integrated genomic, proteomic and metabonomicanalysis of methapyrilene induced hepatotoxicity in the rat. J.Proteome Res. 5 (7), 1586–1601.
(194) Dumas, M. E., Maibaum, E. C., Teague, C., Ueshima, H., Zhou, B.,Lindon, J. C., Nicholson, J. K., Stamler, J., Elliott, P., Chan, Q., andHolmes, E. (2006) Assessment of analytical reproducibility of 1HNMR spectroscopy based metabonomics for large-scale epidemio-logical research: the INTERMAP Study. Anal. Chem. 78 (7), 2199–2208.
(195) Toye, A. A., Dumas, M. E., Blancher, C., Rothwell, A. R., Fearnside,J. F., Wilder, S. P., Bihoreau, M. T., Cloarec, O., Azzouzi, I., Young,S., Barton, R. H., Holmes, E., McCarthy, M. I., Tatoud, R., Nicholson,J. K., Scott, J., and Gauguier, D. (2007) Subtle metabolic and livergene transcriptional changes underlie diet-induced fatty liver sus-ceptibility in insulin-resistant mice. Diabetologia. 50 (9), 1867–1879.
(196) Ringeissen, S., Connor, S. C., Brown, H. R., Sweatman, B. C.,Hodson, M. P., Kenny, S. P., Haworth, R. I., McGill, P., Price, M. A.,Aylott, M. C., Nunez, D. J., Haselden, J. N., and Waterfield, C. J.(2003) Potential urinary and plasma biomarkers of peroxisomeproliferation in the rat: identification of N-methylnicotinamide andN-methyl-4-pyridone-3-carboxamide by 1H nuclear magnetic reso-nance and high performance liquid chromatography. Biomarkers 8(3–4), 240–271.
(197) Connor, S. C., Hodson, M. P., Ringeissen, S., Sweatman, B. C.,McGill, P. J., Waterfield, C. J., and Haselden, J. N. (2004)Development of a multivariate statistical model to predict peroxisomeproliferation in the rat, based on urinary 1H-NMR spectral patterns.Biomarkers 9 (4–5), 364–385.
(198) Delaney, J., Hodson, M. P., Thakkar, H., Connor, S. C., Sweatman,B. C., Kenny, S. P., McGill, P. J., Holder, J. C., Hutton, K. A.,Haselden, J. N., and Waterfield, C. J. (2005) Tryptophan-NAD+pathway metabolites as putative biomarkers and predictors ofperoxisome proliferation. Arch. Toxicol. 79 (4), 208–223.
(199) Li, H., Ni, Y., Su, M., Qiu, Y., Zhou, M., Qiu, M., Zhao, A., Zhao,L., and Jia, W. (2007) Pharmacometabonomic phenotyping revealsdifferent responses to xenobiotic intervention in rats. J. ProteomeRes. 6 (4), 1364–1370.
(200) Nicholson, J. K., Holmes, E., and Wilson, I. D. (2005) Gutmicroorganisms, mammalian metabolism and personalized healthcare. Nat. ReV. Microbiol. 3, 431–438.
(201) Holmes, E., and Nicholson, J. K. (2005) Variation in gut microbiotastrongly influences individual rodent phenotypes. J. Toxicol. Sci. 87,1–2.
(202) Rohde, C. M., Wells, D. F., Robosky, L. C., Manning, M. L., Clifford,C. B., Reily, M. D., and Robertson, D. G. (2007) Metabonomicevaluation of Schaedler altered microflora rats. Chem. Res. Toxicol.20, 1388–1392. .
TX700335D
PerspectiVe Chem. Res. Toxicol., Vol. 21, No. 1, 2008 27


