Embed Size (px)
Citation preview

Annual Report 2008
Focused on Sustainable Business
Annual Report 2008
www.transpacific.com.au
Focused on Sustainable Business Transpacifi
c Annual R
eport 20
08
For
per
sona
l use
onl
y

ABN 74 101 155 220
DirectorsTerry Peabody (Executive Chairman and Director)
Trevor Coonan (Chief Executive Officer and Executive Director)
Bruce Brown (Deputy Chairman and Non-Executive Director)
Graham Mulligan (Non-Executive Director)
Bruce Allan (Non-Executive Director)
Harold Grundell (Executive Director)
Company SecretaryKellie Smith
Registered OfficeLevel 1, Caroma Building 159 Coronation Drive Milton QLD 4064
AuditorsBentleys Brisbane Partnership Level 26, AMP Place 10 Eagle Street Brisbane QLD 4000
// Corporate Information
Growth Actual Actual Actual on 2007 $m $m $m
Revenue 70% 2196.7 1,295.0 649.5EBITDA 79% 540.5 302.8 106.9Depreciation -119.1 –70.1 –24.8EBIT 81% 421.4 232.7 82.1Interest (net) 179.9 –88.5 –16.0NPBT, associates and unusuals 67% 241.5 144.2 66.1Associates NPAT 2.6 4.2 1.8NPBT and unusuals 64% 244.1 148.4 67.9One-off costs – – –1.0Profits on acquisitions 3.3 2.9 1.7Options expense -3.5 –3.2 –1.4Amortisation of convertible -4.0NPBT 62% 239.9 148.1 67.2Tax expense -44.3 –33.8 –19.1NPAT 71% 195.6 114.3 48.1Minority interests -2.3 –0.9 –0.6NPAT Transpacificpre distribution 193.3 113.4 47.5Hybrid distribution -18.0 -10.3 –NPAT Transpacific 70% 175.3 103.1 47.5
Scorecard. 2008. 2007. 2006.
contents//Chairman’s Letter 1 // Focused on sustainable business 2 // Chief Executive Officer’s Review 8 // Board of Directors 16 // Corporate Governance Statement 18 // Financial Report 23
Des
igne
d an
d pr
oduc
ed b
y w
alte
rwak
efiel
d.co
m.a
uTh
is re
port
is p
rinte
d on
Mon
za S
atin
, an
FSC
cer
tified
mix
ed s
ourc
epap
er.
By b
uyin
g pr
oduc
ts w
ith th
e FS
C la
bel y
ou
are
supp
ortin
g th
e gr
owth
of r
espo
nsib
le
fore
st m
anag
emen
t wor
ldw
ide.
For
per
sona
l use
onl
y
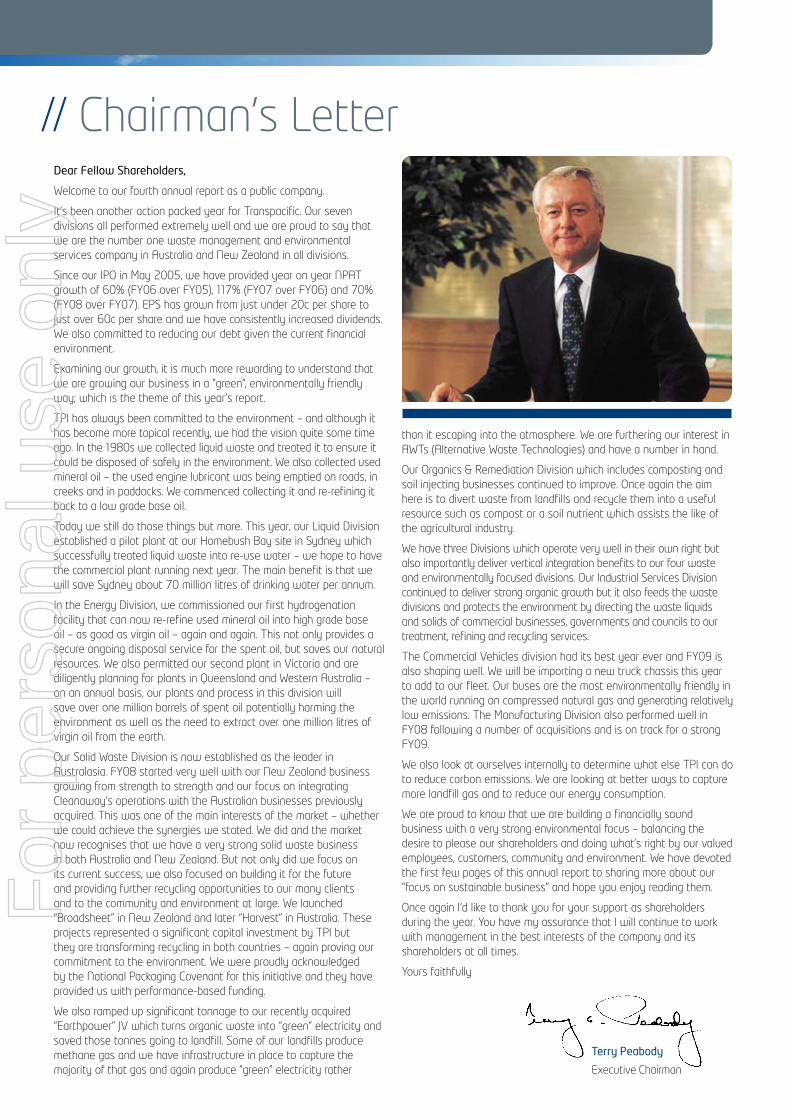
Dear Fellow Shareholders,
Welcome to our fourth annual report as a public company.
It’s been another action packed year for Transpacific. Our seven divisions all performed extremely well and we are proud to say that we are the number one waste management and environmental services company in Australia and New Zealand in all divisions.
Since our IPO in May 2005, we have provided year on year NPAT growth of 60% (FY06 over FY05), 117% (FY07 over FY06) and 70% (FY08 over FY07). EPS has grown from just under 20c per share to just over 60c per share and we have consistently increased dividends. We also committed to reducing our debt given the current financial environment.
Examining our growth, it is much more rewarding to understand that we are growing our business in a “green”, environmentally friendly way; which is the theme of this year’s report.
TPI has always been committed to the environment – and although it has become more topical recently, we had the vision quite some time ago. In the 1980s we collected liquid waste and treated it to ensure it could be disposed of safely in the environment. We also collected used mineral oil – the used engine lubricant was being emptied on roads, in creeks and in paddocks. We commenced collecting it and re‑refining it back to a low grade base oil.
Today we still do those things but more. This year, our Liquid Division established a pilot plant at our Homebush Bay site in Sydney which successfully treated liquid waste into re‑use water – we hope to have the commercial plant running next year. The main benefit is that we will save Sydney about 70 million litres of drinking water per annum.
In the Energy Division, we commissioned our first hydrogenation facility that can now re‑refine used mineral oil into high grade base oil – as good as virgin oil – again and again. This not only provides a secure ongoing disposal service for the spent oil, but saves our natural resources. We also permitted our second plant in Victoria and are diligently planning for plants in Queensland and Western Australia – on an annual basis, our plants and process in this division will save over one million barrels of spent oil potentially harming the environment as well as the need to extract over one million litres of virgin oil from the earth.
Our Solid Waste Division is now established as the leader in Australasia. FY08 started very well with our New Zealand business growing from strength to strength and our focus on integrating Cleanaway’s operations with the Australian businesses previously acquired. This was one of the main interests of the market – whether we could achieve the synergies we stated. We did and the market now recognises that we have a very strong solid waste business in both Australia and New Zealand. But not only did we focus on its current success, we also focused on building it for the future and providing further recycling opportunities to our many clients and to the community and environment at large. We launched “Broadsheet” in New Zealand and later “Harvest” in Australia. These projects represented a significant capital investment by TPI but they are transforming recycling in both countries – again proving our commitment to the environment. We were proudly acknowledged by the National Packaging Covenant for this initiative and they have provided us with performance‑based funding.
We also ramped up significant tonnage to our recently acquired “Earthpower” JV which turns organic waste into “green” electricity and saved those tonnes going to landfill. Some of our landfills produce methane gas and we have infrastructure in place to capture the majority of that gas and again produce “green” electricity rather
than it escaping into the atmosphere. We are furthering our interest in AWTs (Alternative Waste Technologies) and have a number in hand.
Our Organics & Remediation Division which includes composting and soil injecting businesses continued to improve. Once again the aim here is to divert waste from landfills and recycle them into a useful resource such as compost or a soil nutrient which assists the like of the agricultural industry.
We have three Divisions which operate very well in their own right but also importantly deliver vertical integration benefits to our four waste and environmentally focused divisions. Our Industrial Services Division continued to deliver strong organic growth but it also feeds the waste divisions and protects the environment by directing the waste liquids and solids of commercial businesses, governments and councils to our treatment, refining and recycling services.
The Commercial Vehicles division had its best year ever and FY09 is also shaping well. We will be importing a new truck chassis this year to add to our fleet. Our buses are the most environmentally friendly in the world running on compressed natural gas and generating relatively low emissions. The Manufacturing Division also performed well in FY08 following a number of acquisitions and is on track for a strong FY09.
We also look at ourselves internally to determine what else TPI can do to reduce carbon emissions. We are looking at better ways to capture more landfill gas and to reduce our energy consumption.
We are proud to know that we are building a financially sound business with a very strong environmental focus – balancing the desire to please our shareholders and doing what’s right by our valued employees, customers, community and environment. We have devoted the first few pages of this annual report to sharing more about our “focus on sustainable business” and hope you enjoy reading them.
Once again I’d like to thank you for your support as shareholders during the year. You have my assurance that I will continue to work with management in the best interests of the company and its shareholders at all times.
Yours faithfully
Terry Peabody
Executive Chairman
// Chairman’s Letter
For
per
sona
l use
onl
y
Transpacific Annual Report 2008 || PAGE 2
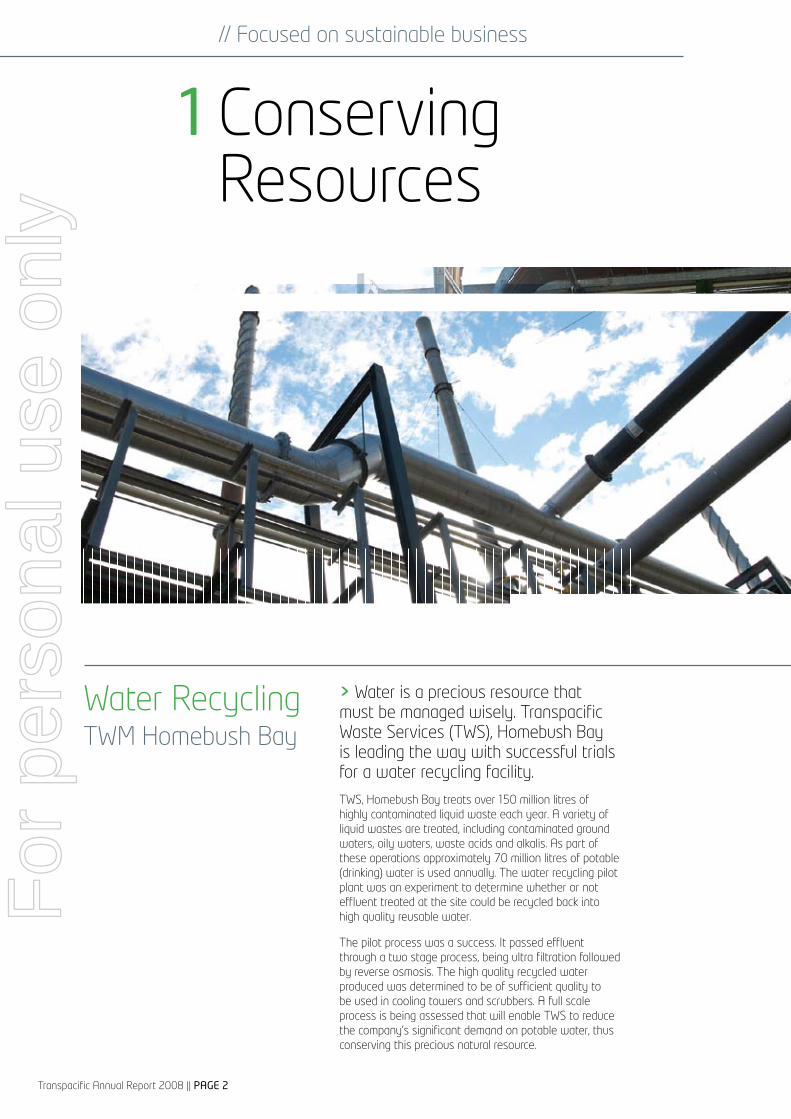
Water Recycling TWM Homebush Bay
Conserving Resources
1
> Water is a precious resource that must be managed wisely. Transpacific Waste Services (TWS), Homebush Bay is leading the way with successful trials for a water recycling facility.
TWS, Homebush Bay treats over 150 million litres of highly contaminated liquid waste each year. A variety of liquid wastes are treated, including contaminated ground waters, oily waters, waste acids and alkalis. As part of these operations approximately 70 million litres of potable (drinking) water is used annually. The water recycling pilot plant was an experiment to determine whether or not effluent treated at the site could be recycled back into high quality reusable water.
The pilot process was a success. It passed effluent through a two stage process, being ultra filtration followed by reverse osmosis. The high quality recycled water produced was determined to be of sufficient quality to be used in cooling towers and scrubbers. A full scale process is being assessed that will enable TWS to reduce the company’s significant demand on potable water, thus conserving this precious natural resource.
// Focused on sustainable businessF
or p
erso
nal u
se o
nly

PAGE 3 ||Transpacific Annual Report 2008
The conservation of resources is fundamental to sustainable development. Throughout our operations we seek to operate efficiently and conserve natural environments, whilst recovering potential resources through waste recycling and reuse. This is achieved through continual improvement in our environmental management processes and the services offered to our customers.
HarvestA New Recycling Initiative> Transpacific launched “Harvest”, a new recycling service for the commercial and industrial sector of Australia, in August 2008 and New Zealand in March 2008. With the tag line “recycling reaps rewards”, this recycling service increases the collection of recyclables, diverting these valuable resources from landfill.
Research conducted indicated that a limited number of businesses have a recycling service and that it was generally limited to cardboard and paper only. Harvest has been developed to capture the significant amount of recyclables that have been going to landfill. Throughout 2008 Transpacific established new processing facilities whilst also developing secure end markets for the commodities with export parity pricing. Harvest also received support from the National Packaging Covenant, a government and industry initiative to reduce the effects of packaging on the environment, including performance based funding of more than $2 million over 18 months.
Recycling has many environmental benefits. Greenhouse gas emissions are reduced as resources are diverted from landfill where they would have decomposed and generated greenhouse gases. Less energy and water is required to process recycled materials in comparison to virgin raw materials. Harvest will increase the amount of recyclables recovered, reducing the demand on natural resources and raw materials improving the carbon footprint of Transpacific and our customers. Harvest will enable all businesses to be able to participate in recycling in a cost effective and transparent way.
HarvestRecycling Reaps Rewards
Conserving Resources
For
per
sona
l use
onl
y

Transpacific Annual Report 2008 || PAGE 4
Minimising Waste, Maximising Reuse
2
Hydrogenation Recovering Non‑Renewable Resources> Transpacific’s first hydrogenation facility, in Rutherford, New South Wales, began commercial operations in 2008 and is now successfully producing a high standard refined base oil from collected used oil.
The hydrogenation facility processes pretreated used lubricating oil. Using elevated temperatures and pressures to remove contaminants such as oxygen, nitrogen, sulphur and heavy metal compounds, the facility is able to produce an industry‑accepted high quality base oil. Modifications and improvements were made throughout the year to ensure the quality of the base oil, which is comparable to virgin products produced by refineries throughout the world. The core product produced by the facility is base oil SN150, which is sold to lubricant oil blenders where it is used in the production of high grade engine oils, hydraulic fluids, low viscosity gear oil products, chain and bar oils, and various other industrial applications.
In FY08 10.5 million litres of base oil were manufactured from used oil that otherwise could have gone to waste or other non‑recoverable uses. The hydrogenation facility maximises heat recovery and minimises the waste produced, making it possible for the base oil to be recovered, recycled and reused again and again. Furthermore, through this process, reliance on virgin products for the production of base oils is reduced, lessening the dependence on natural resources and offsetting imports.> Clean oil after re‑refining
// Focused on sustainable businessF
or p
erso
nal u
se o
nly
PAGE 5 ||Transpacific Annual Report 2008
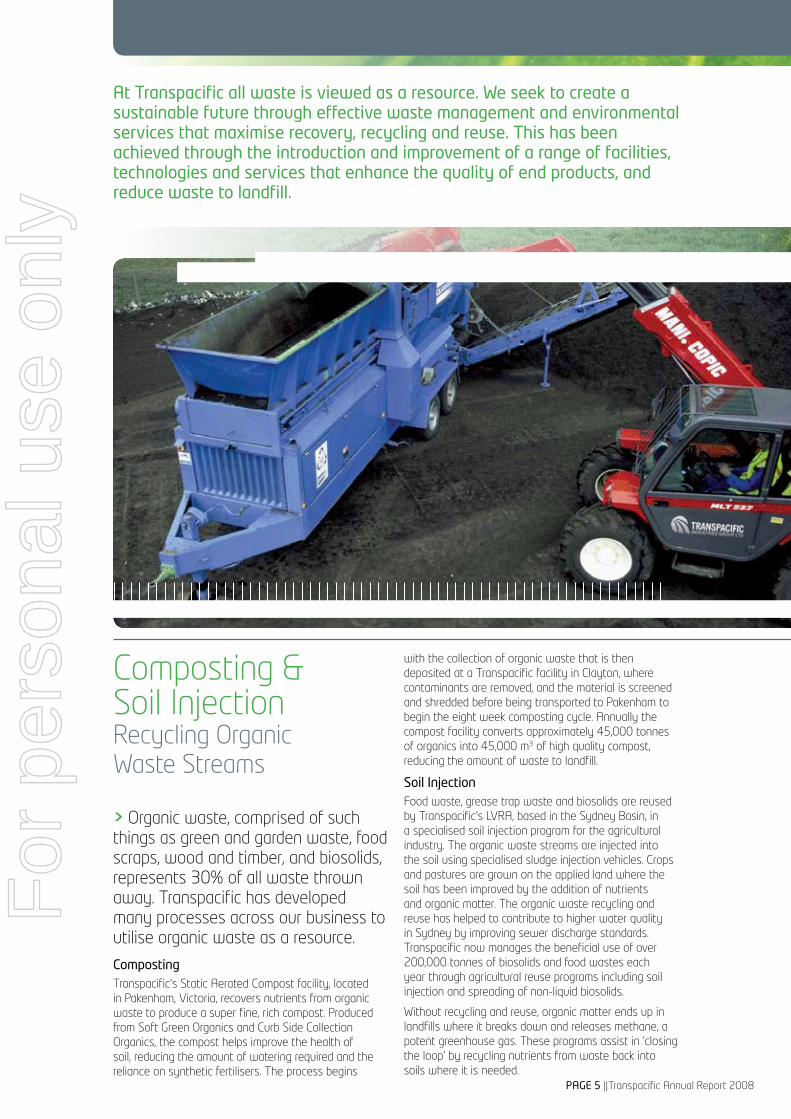
At Transpacific all waste is viewed as a resource. We seek to create a sustainable future through effective waste management and environmental services that maximise recovery, recycling and reuse. This has been achieved through the introduction and improvement of a range of facilities, technologies and services that enhance the quality of end products, and reduce waste to landfill.
> Organic waste, comprised of such things as green and garden waste, food scraps, wood and timber, and biosolids, represents 30% of all waste thrown away. Transpacific has developed many processes across our business to utilise organic waste as a resource.
CompostingTranspacific’s Static Aerated Compost facility, located in Pakenham, Victoria, recovers nutrients from organic waste to produce a super fine, rich compost. Produced from Soft Green Organics and Curb Side Collection Organics, the compost helps improve the health of soil, reducing the amount of watering required and the reliance on synthetic fertilisers. The process begins
with the collection of organic waste that is then deposited at a Transpacific facility in Clayton, where contaminants are removed, and the material is screened and shredded before being transported to Pakenham to begin the eight week composting cycle. Annually the compost facility converts approximately 45,000 tonnes of organics into 45,000 m3 of high quality compost, reducing the amount of waste to landfill.
Soil InjectionFood waste, grease trap waste and biosolids are reused by Transpacific’s LVRA, based in the Sydney Basin, in a specialised soil injection program for the agricultural industry. The organic waste streams are injected into the soil using specialised sludge injection vehicles. Crops and pastures are grown on the applied land where the soil has been improved by the addition of nutrients and organic matter. The organic waste recycling and reuse has helped to contribute to higher water quality in Sydney by improving sewer discharge standards. Transpacific now manages the beneficial use of over 200,000 tonnes of biosolids and food wastes each year through agricultural reuse programs including soil injection and spreading of non‑liquid biosolids.
Without recycling and reuse, organic matter ends up in landfills where it breaks down and releases methane, a potent greenhouse gas. These programs assist in ‘closing the loop’ by recycling nutrients from waste back into soils where it is needed.
Composting & Soil Injection Recycling Organic Waste Streams
Minimising Waste, Maximising Reuse
For
per
sona
l use
onl
y

Transpacific Annual Report 2008 || PAGE 6
Combating Climate Change
3
>Transpacific is reducing greenhouse emissions through the recovery of energy and generation of green electricity from waste disposed at landfills.
Transpacific endeavours to recycle and reuse wherever financially viable. Landfills are however needed for the disposal of residual waste that cannot be recovered. Waste decomposing in landfill conditions produces a mixture of gases including methane, a greenhouse gas with 21 times the global warming potential of carbon dioxide. The quantity of methane produced is dependent upon many factors including the composition of the waste, the amount of waste, the time it has been in the landfill, and the landfill conditions. At our landfills where significant amounts of landfill gas are produced, the gas is captured and used in generators to produce electricity.
The use of landfill gas as a renewable energy source reduces greenhouse gas emissions by reducing the amount of methane escaping to the atmosphere, and lessening the demand on fossil fuels for electricity generation. Over the last financial year Transpacific landfills, in Australia and New Zealand, generated approximately 140,000 megawatt hours of electricity or the average household energy use of 24,000 Australians and New Zealanders. Transpacific is currently assessing the viability of further electricity generation infrastructure at additional landfills to mitigate potential emissions, and recover the embodied energy of waste disposed at these sites.
Green ElectricityGenerating Energy from Landfill Gas
// Focused on sustainable businessF
or p
erso
nal u
se o
nly
PAGE 7 ||Transpacific Annual Report 2008
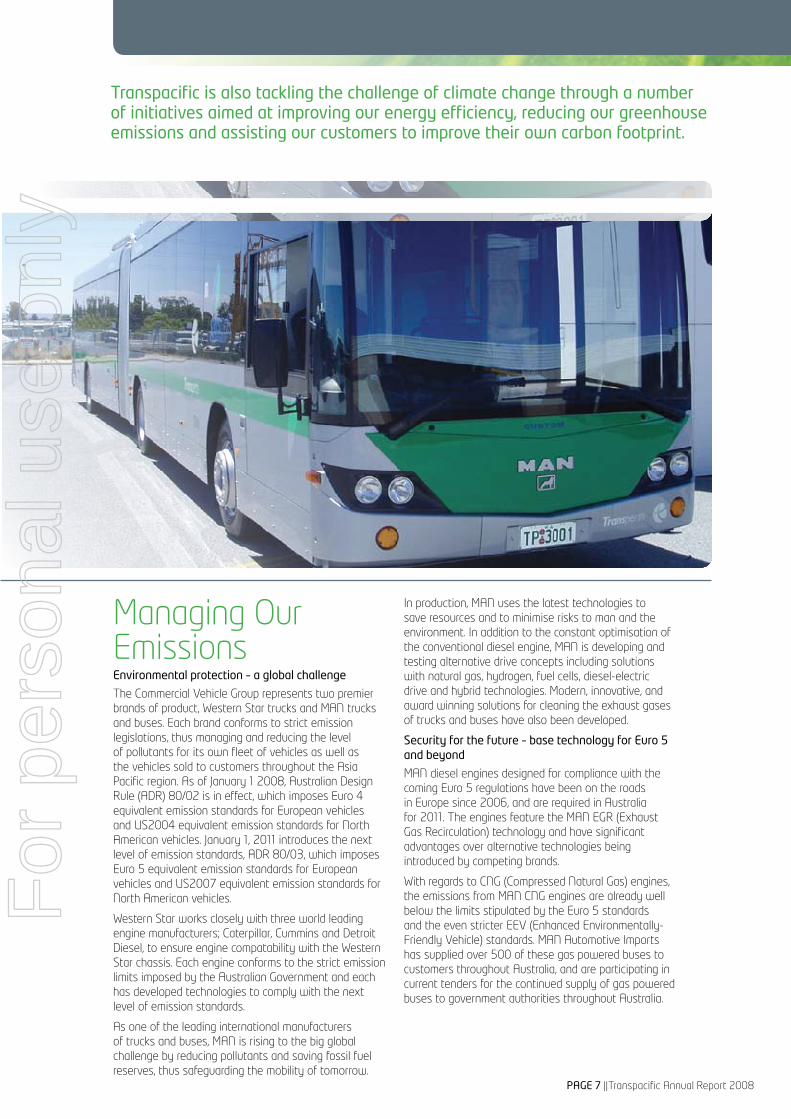
Transpacific is also tackling the challenge of climate change through a number of initiatives aimed at improving our energy efficiency, reducing our greenhouse emissions and assisting our customers to improve their own carbon footprint.
Managing Our EmissionsEnvironmental protection – a global challenge
The Commercial Vehicle Group represents two premier brands of product, Western Star trucks and MAN trucks and buses. Each brand conforms to strict emission legislations, thus managing and reducing the level of pollutants for its own fleet of vehicles as well as the vehicles sold to customers throughout the Asia Pacific region. As of January 1 2008, Australian Design Rule (ADR) 80/02 is in effect, which imposes Euro 4 equivalent emission standards for European vehicles and US2004 equivalent emission standards for North American vehicles. January 1, 2011 introduces the next level of emission standards, ADR 80/03, which imposes Euro 5 equivalent emission standards for European vehicles and US2007 equivalent emission standards for North American vehicles.
Western Star works closely with three world leading engine manufacturers; Caterpillar, Cummins and Detroit Diesel, to ensure engine compatability with the Western Star chassis. Each engine conforms to the strict emission limits imposed by the Australian Government and each has developed technologies to comply with the next level of emission standards.
As one of the leading international manufacturers of trucks and buses, MAN is rising to the big global challenge by reducing pollutants and saving fossil fuel reserves, thus safeguarding the mobility of tomorrow.
In production, MAN uses the latest technologies to save resources and to minimise risks to man and the environment. In addition to the constant optimisation of the conventional diesel engine, MAN is developing and testing alternative drive concepts including solutions with natural gas, hydrogen, fuel cells, diesel‑electric drive and hybrid technologies. Modern, innovative, and award winning solutions for cleaning the exhaust gases of trucks and buses have also been developed.
Security for the future – base technology for Euro 5 and beyond
MAN diesel engines designed for compliance with the coming Euro 5 regulations have been on the roads in Europe since 2006, and are required in Australia for 2011. The engines feature the MAN EGR (Exhaust Gas Recirculation) technology and have significant advantages over alternative technologies being introduced by competing brands.
With regards to CNG (Compressed Natural Gas) engines, the emissions from MAN CNG engines are already well below the limits stipulated by the Euro 5 standards and the even stricter EEV (Enhanced Environmentally‑Friendly Vehicle) standards. MAN Automotive Imports has supplied over 500 of these gas powered buses to customers throughout Australia, and are participating in current tenders for the continued supply of gas powered buses to government authorities throughout Australia.
Combating Climate Change
For
per
sona
l use
onl
y

Since becoming a public company in May 2005, TPI has been building a foundation for future success in the waste and environmental services arena. We have built national and New Zealand footprints in liquid and solid waste, and further developed all other areas of our business. You will have read the earlier pages about TPI’s focus on the environment, sustainable business and how we go about achieving the goals we set – by recycling and re‑refining as much as possible – all waste is a resource.I have pleasure in providing you with an overview of each division showing management involved, the FY08 financials and key developments including the new recycling programs and what is planned for the future.
Trevor Coonan Chief Executive Officer
// Chief Executive Officer’s Review
Transpacific Annual Report 2008 || PAGE 8
For
per
sona
l use
onl
y

PAGE 9 ||Transpacific Annual Report 2008
EBITDA
Sales
EBIT
0 50 100 150 200 250 300
0 5 10 15 20 25 300 5 10 15 20 25 30
0 10 20 30 40 50 600 10 20 30 40 50 60
0 200 400 600 800 1000 1200
0 200 400 600 800 1000 1200
EBITDA
Sales $m
EBIT
0 100 200 300 400 500
0 30 60 90 120 150
0 30 60 90 120 150
0 50 100 150 2000 50 100 150 200
EBITDA
Sales $m
EBIT
473.9
240.6
28.0
33.2
338.5
32.2
270.6
23.6
52.6
31.9
43.9
43.0
EBITDA
Sales $m
EBIT
200820072006
200820072006
200820072006
200820072006
200820072006
200820072006
200820072006
200820072006
200820072006
200820072006
200820072006
200820072006
35.0
29.2
130.3
34.0
35.039.8
17.2
EBITDA
Sales $m
EBIT
20082007
2008
2008
2007
2007
131.2
95.1
367.9
335.7
256.3
1011.0
EBITDA
Sales $m
EBIT
20082007
20082007
20082007
3.3
3.0
7.5
58.7
17.3
8.6
EBITDA
Sales $m
EBIT
20082007
20082007
20082007
3.24.7
2.43.7
23.028.3
23.0
$m
55.2
45.0
180.7
44.3
20.1
22.2
284.7
32.9
81.7106.4
178.3107.6
182.3
52.628.2
42.821.8
178.3
Sales include PSO levy
AustrAliA – solid wAste
Transpacific has now positioned itself as the leading integrated market provider of logistics services, responsible waste management, recycling and disposal services within the Australian waste management industry.
FY08 was a rewarding year focused on the successful integration of Cleanaway (purchased May 2007), the listed landfill company Baxter Group Ltd, the landfill businesses of the Twigg Group, together with a number of other small bolt on acquisitions.
As a consequence of these acquisitions our geographic footprint and service capability has expanded immensely and we are now in the enviable position of being able to offer our customers a full compliment of solid waste services being advisory services, collection, treatment, recycling, reporting and ultimately final disposal of their waste streams.
Transpacific enjoys strong mutually beneficial relationships with Municipal councils and Commercial Industrial customers across most regions of Australia. The trend continues of further outsourcing of waste management, tightening environmental requirements and the growth in demand for recycling has emerged as the new frontier, which we are well poised to take advantage of, through our experienced committed staff and new services such as our Harvest recycling program.
The FY09 Financial year is full of promise and opportunity for growth across Australia and New Zealand. We have total confidence in our staff to continue to meet the emerging requirements of our customers, regulators and stakeholders. This is an exciting and changing period for the waste management sector – one that we are embracing and that will provide benefits to our customers, staff and group as a whole.
New ZeAlANd – All divisioNs
Our operations in New Zealand have had a successful year. Through organic growth and selective bolt on acquisitions, the New Zealand businesses of Transpacific have achieved strong growth and we continue to consolidate our position as New Zealand’s leading business in solid and liquid waste resources, recycling and specialist industrial services. We hold the leading market position in all key sectors of our operations.
Highlights of our year include:
• Winning the Christchurch City Council 15 year collection contract for general waste, recyclables and organics, commencing in February 2009
• Successful integration of Canterbury Waste Services (previously 50% owned) and various Envirowaste assets in the South Island, including collections, landfills and recycling plants
• Commencement of the industrial services contract for New Zealand Steel (Bluescope) at New Zealand’s largest single industrial site at Glenbrook, south of Auckland
• Launching the industry transformational new co‑mingled recyclable services for the Commercial and Industrial markets, branded the Commercial Combo
• Attractive pricing for primary recycled products, including paper/cardboard, plastics, metals, tallow and oils
Looking forward, we will continue our strategic direction, building on the good progress to date, consistently growing and improving returns through organic growth opportunities, optimising the integrated supply chain, new product/service development and synergistic acquisitions. This will be supported by retaining, attracting and developing high performing people, continuing to improve our health, safety and environmental performance and promoting the full range of services to our customer base.
We aim to be our customers’ preferred choice, providing complete confidence in the quality, reliability and value of our services.
the Future: The focus continues to expand the Group’s solid waste presence through strategic acquisitions and recycling.
Greg Campbell Chief Executive Officer Solid Waste and New Zealand
the Future: We intend to leverage off the strong base we now have in NZ by communicating our full service offerings to our customers.
Tom Nickels Managing Director New Zealand
Solid Waste and New Zealand
Solid Waste
For
per
sona
l use
onl
y

Transpacific Annual Report 2008 || PAGE 10
EBITDA
Sales
EBIT
0 50 100 150 200 250 300
0 5 10 15 20 25 300 5 10 15 20 25 30
0 10 20 30 40 50 600 10 20 30 40 50 60
0 200 400 600 800 1000 1200
0 200 400 600 800 1000 1200
EBITDA
Sales $m
EBIT
0 100 200 300 400 500
0 30 60 90 120 150
0 30 60 90 120 150
0 50 100 150 2000 50 100 150 200
EBITDA
Sales $m
EBIT
473.9
240.6
28.0
33.2
338.5
32.2
270.6
23.6
52.6
31.9
43.9
43.0
EBITDA
Sales $m
EBIT
200820072006
200820072006
200820072006
200820072006
200820072006
200820072006
200820072006
200820072006
200820072006
200820072006
200820072006
200820072006
35.0
29.2
130.3
34.0
35.039.8
17.2
EBITDA
Sales $m
EBIT
20082007
2008
2008
2007
2007
131.2
95.1
367.9
335.7
256.3
1011.0
EBITDA
Sales $m
EBIT
20082007
20082007
20082007
3.3
3.0
7.5
58.7
17.3
8.6
EBITDA
Sales $m
EBIT
20082007
20082007
20082007
3.24.7
2.43.7
23.028.3
23.0
$m
55.2
45.0
180.7
44.3
20.1
22.2
284.7
32.9
81.7106.4
178.3107.6
182.3
52.628.2
42.821.8
178.3
Sales include PSO levy
EBITDA
Sales
EBIT
0 50 100 150 200 250 300
0 5 10 15 20 25 300 5 10 15 20 25 30
0 10 20 30 40 50 600 10 20 30 40 50 60
0 200 400 600 800 1000 1200
0 200 400 600 800 1000 1200
EBITDA
Sales $m
EBIT
0 100 200 300 400 500
0 30 60 90 120 150
0 30 60 90 120 150
0 50 100 150 2000 50 100 150 200
EBITDA
Sales $m
EBIT
473.9
240.6
28.0
33.2
338.5
32.2
270.6
23.6
52.6
31.9
43.9
43.0
EBITDA
Sales $m
EBIT
200820072006
200820072006
200820072006
200820072006
200820072006
200820072006
200820072006
200820072006
200820072006
200820072006
200820072006
200820072006
35.0
29.2
130.3
34.0
35.039.8
17.2
EBITDA
Sales $m
EBIT
20082007
2008
2008
2007
2007
131.2
95.1
367.9
335.7
256.3
1011.0
EBITDA
Sales $m
EBIT
20082007
20082007
20082007
3.3
3.0
7.5
58.7
17.3
8.6
EBITDA
Sales $m
EBIT
20082007
20082007
20082007
3.24.7
2.43.7
23.028.3
23.0
$m
55.2
45.0
180.7
44.3
20.1
22.2
284.7
32.9
81.7106.4
178.3107.6
182.3
52.628.2
42.821.8
178.3
Sales include PSO levy
Liquid and Hazardous Waste
A strong performance from this Division was a result of good organic growth.
Highlights of the performance include a major clean up and demolition project after a significant fire event in Sydney, the resultant outcome being shared by a number of the group’s divisions. We also completed a large soil remediation project in Melbourne that impacted positively on the treatment business and the Tullamarine landfill.
Widespread flooding also provided opportunities in the first half of the year.
Effluent recycling trials at Homebush proved to be very successful with the final product proving to exceed the required levels for industrial reuse. Evaluations being carried out now will determine the timing for the construction of a full scale recycling plant. It is intended that after completion the recycling initiative taken with treated effluent will expand into the other states.
The solvent recycling business based in Albury improved its profitability through a more focused management approach and also achieved a significant stock (liability) reduction. Further improvements will be made across this business and the successful solvent recycling business in Adelaide that will see greater synergies being achieved across an integrated business model.
The organic growth experienced across the Division was further enhanced by very strong performances in Melbourne, Sydney and Adelaide. It was pleasing to see the benefit derived from many national contracts that are now serviced by several of the Divisions and where the “cross selling” of all services is realising a positive impact.
Organics / Remediation
A much improved FY08 for this Division with many tenders being won and projects awarded.
A tank cleaning and solids drying project was successfully completed at a large refinery despite many weeks of weather interruptions. This was complemented by a number of smaller dredging projects across the eastern states throughout the year.
A slow start for the remediation business – Quantum Environmental, however the second half showed an uplift in projects being won which will roll over into a successful FY09.
Two major projects throughout the year for government departments were completed with a third in Queensland likely to carry over into FY09.
The tender activity in the remediation sector is growing as is work in the petroleum industry. Growth in the second half has necessitated the employment of additional project managers and has seen the business grow from its Sydney base with the opening of a Melbourne Quantum office.
The final result is ultimately due to what is now a dedicated and experienced management team.
Organics / Remediation
Liquid and Hazardous Waste
The Future: Continued focus on the investigation of opportunities around waste water treatment and for recycling of our liquid waste into reusable product. Further focus on the recovery of heavy metals and other reusable components from the waste stream.
Tony Roderick Managing Director Liquid and Hazardous Waste and Organics/Remediation
// Chief Executive Officer’s Review
For
per
sona
l use
onl
y

PAGE 11 ||Transpacific Annual Report 2008
High oil and commodity prices have assisted the Energy Division to post strong performances in FY08. Strong collections of used mineral oil, cooking oil and tallow have resulted in increased sales of recycled products. With the continued strong demand for recycled products generally, combined with contributions from the recently commissioned hydrogenation plant, the Energy Division is expected to perform well throughout FY09.
The Hydrogenation facility in Rutherford has now been fully commissioned and following some protracted teething problems is now performing in line with expectations. Sales for hydrogenated products are particularly strong with both domestic and overseas sales exceeding our expectations. EPA approval was received for a second Hydrogenation facility in Victoria. We are also progressing approvals for two additional hydrogenation plants in Queensland and Western Australia.
Collections of both used lubricating oil and cooking oil were again strong in FY08 with total collections for Australia and New Zealand totalling 170 million litres. The collected oil once processed is made available for sale as recycled alternatives to virgin fuels and lubricants which are well received by both domestic and overseas markets. TPI is forecasting used oil collections to be in excess of 170 million litres in FY09 and will be well placed to take advantage of increased oil and commodity pricing.
Transpacific Bituminous Products continues to perform well with many opportunities uncovered during FY08, one of which included paint manufacture for TPI Group requirements. There are several opportunities that will be progressed during FY09 with a view to growing the business including the value add of waste bottoms from the re‑refining of used oil.
Transpacific continues to maintain a watching brief on the Biofuels industry with a view to participation in the event that government policy, feed stock prices and market acceptance prove more favourable.
EBITDA
Sales
EBIT
0 50 100 150 200 250 300
0 5 10 15 20 25 300 5 10 15 20 25 30
0 10 20 30 40 50 600 10 20 30 40 50 60
0 200 400 600 800 1000 1200
0 200 400 600 800 1000 1200
EBITDA
Sales $m
EBIT
0 100 200 300 400 500
0 30 60 90 120 150
0 30 60 90 120 150
0 50 100 150 2000 50 100 150 200
EBITDA
Sales $m
EBIT
473.9
240.6
28.0
33.2
338.5
32.2
270.6
23.6
52.6
31.9
43.9
43.0
EBITDA
Sales $m
EBIT
200820072006
200820072006
200820072006
200820072006
200820072006
200820072006
200820072006
200820072006
200820072006
200820072006
200820072006
200820072006
35.0
29.2
130.3
34.0
35.039.8
17.2
EBITDA
Sales $m
EBIT
20082007
2008
2008
2007
2007
131.2
95.1
367.9
335.7
256.3
1011.0
EBITDA
Sales $m
EBIT
20082007
20082007
20082007
3.3
3.0
7.5
58.7
17.3
8.6
EBITDA
Sales $m
EBIT
20082007
20082007
20082007
3.24.7
2.43.7
23.028.3
23.0
$m
55.2
45.0
180.7
44.3
20.1
22.2
284.7
32.9
81.7106.4
178.3107.6
182.3
52.628.2
42.821.8
178.3
Sales include PSO levy
EnergyThe Future: Hydrogenation will continue to drive growth. We have permitted our second facility in Victoria while others are planned for Western Australia and Queensland.
Harold Grundell Chief Executive Officer – Transpacific Industries Executive Director
For
per
sona
l use
onl
y
Transpacific Annual Report 2008 || PAGE 12
Industrial Solutions
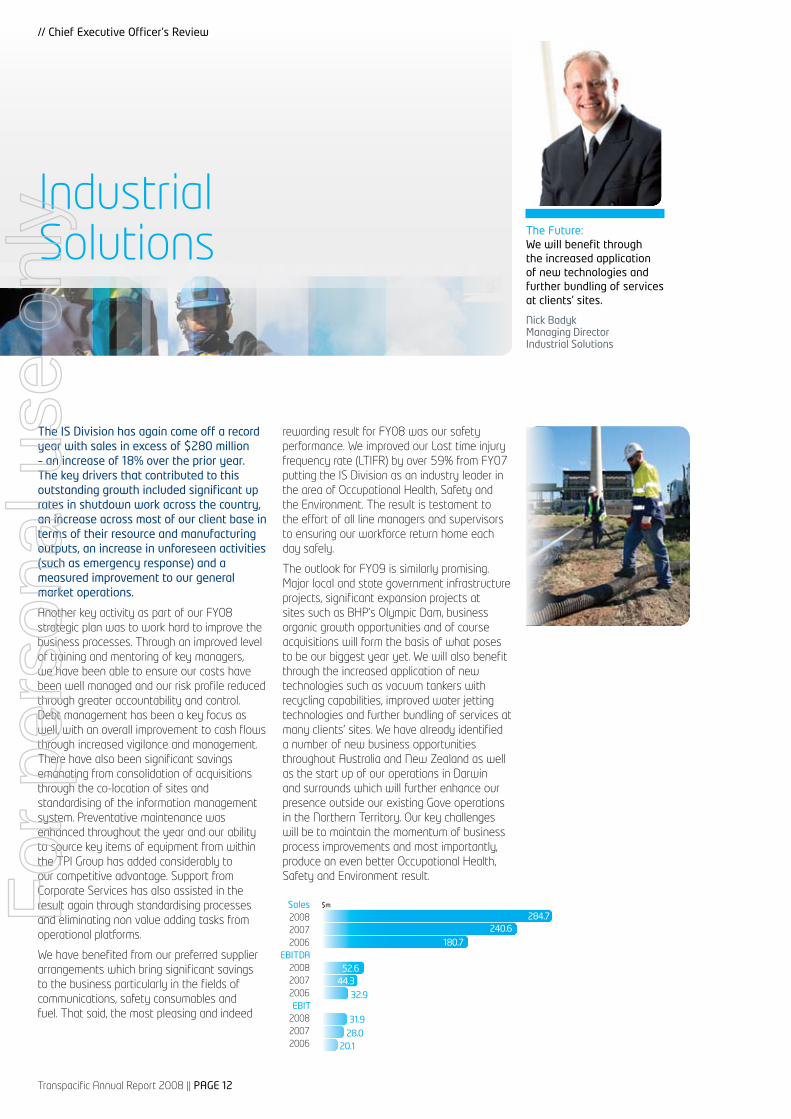
The IS Division has again come off a record year with sales in excess of $280 million – an increase of 18% over the prior year. The key drivers that contributed to this outstanding growth included significant up rates in shutdown work across the country, an increase across most of our client base in terms of their resource and manufacturing outputs, an increase in unforeseen activities (such as emergency response) and a measured improvement to our general market operations.
Another key activity as part of our FY08 strategic plan was to work hard to improve the business processes. Through an improved level of training and mentoring of key managers, we have been able to ensure our costs have been well managed and our risk profile reduced through greater accountability and control. Debt management has been a key focus as well, with an overall improvement to cash flows through increased vigilance and management. There have also been significant savings emanating from consolidation of acquisitions through the co‑location of sites and standardising of the information management system. Preventative maintenance was enhanced throughout the year and our ability to source key items of equipment from within the TPI Group has added considerably to our competitive advantage. Support from Corporate Services has also assisted in the result again through standardising processes and eliminating non value adding tasks from operational platforms.
We have benefited from our preferred supplier arrangements which bring significant savings to the business particularly in the fields of communications, safety consumables and fuel. That said, the most pleasing and indeed
rewarding result for FY08 was our safety performance. We improved our Lost time injury frequency rate (LTIFR) by over 59% from FY07 putting the IS Division as an industry leader in the area of Occupational Health, Safety and the Environment. The result is testament to the effort of all line managers and supervisors to ensuring our workforce return home each day safely.
The outlook for FY09 is similarly promising. Major local and state government infrastructure projects, significant expansion projects at sites such as BHP’s Olympic Dam, business organic growth opportunities and of course acquisitions will form the basis of what poses to be our biggest year yet. We will also benefit through the increased application of new technologies such as vacuum tankers with recycling capabilities, improved water jetting technologies and further bundling of services at many clients’ sites. We have already identified a number of new business opportunities throughout Australia and New Zealand as well as the start up of our operations in Darwin and surrounds which will further enhance our presence outside our existing Gove operations in the Northern Territory. Our key challenges will be to maintain the momentum of business process improvements and most importantly, produce an even better Occupational Health, Safety and Environment result.
EBITDA
Sales
EBIT
0 50 100 150 200 250 300
0 5 10 15 20 25 300 5 10 15 20 25 30
0 10 20 30 40 50 600 10 20 30 40 50 60
0 200 400 600 800 1000 1200
0 200 400 600 800 1000 1200
EBITDA
Sales $m
EBIT
0 100 200 300 400 500
0 30 60 90 120 150
0 30 60 90 120 150
0 50 100 150 2000 50 100 150 200
EBITDA
Sales $m
EBIT
473.9
240.6
28.0
33.2
338.5
32.2
270.6
23.6
52.6
31.9
43.9
43.0
EBITDA
Sales $m
EBIT
200820072006
200820072006
200820072006
200820072006
200820072006
200820072006
200820072006
200820072006
200820072006
200820072006
200820072006
200820072006
35.0
29.2
130.3
34.0
35.039.8
17.2
EBITDA
Sales $m
EBIT
20082007
2008
2008
2007
2007
131.2
95.1
367.9
335.7
256.3
1011.0
EBITDA
Sales $m
EBIT
20082007
20082007
20082007
3.3
3.0
7.5
58.7
17.3
8.6
EBITDA
Sales $m
EBIT
20082007
20082007
20082007
3.24.7
2.43.7
23.028.3
23.0
$m
55.2
45.0
180.7
44.3
20.1
22.2
284.7
32.9
81.7106.4
178.3107.6
182.3
52.628.2
42.821.8
178.3
Sales include PSO levy
The Future: We will benefit through the increased application of new technologies and further bundling of services at clients’ sites.
Nick Badyk Managing Director Industrial Solutions
// Chief Executive Officer’s Review
For
per
sona
l use
onl
y

PAGE 13 ||Transpacific Annual Report 2008
The Commercial Vehicle Group (CVG) has delivered constant growth over the last five years and for FY08 delivered record results in terms of Revenue, EBT and market share.
The Heavy Duty Truck market in Australia also recorded a record year for CY07 in terms of volumes. Combined with the strongest heavy duty market ever seen in Australia, Western Star in tandem grew its market share from CY07 7.6% to CY08 9.3%. The increase in both market share and also the overall market size saw a 34% increase in volume for FY08. Market share for the MAN truck product remained static but again the increased overall Heavy Duty market size saw an increased volume output of 12% in FY08. The MAN Bus business continued to grow with a 41% volume growth for FY08. Combined with the truck and bus success the Parts business grew by 27%.
FY09 represents a year of consolidation for CVG. Western Star continues to grow market share and at July 2008 (seven months Jan‑July 08) held a market share of 10.3%. This growth was achieved on securing some major fleet business and offers further opportunity for growth in the future. The MAN truck business remains solid and the introduction of new heavy duty models at the end of 2008 will advance this position. The MAN bus business
also remains strong on the back of various major supply contracts that will extend through FY09. CVG continues to develop and strengthen the Dealer Network with several new appointments expected in FY09.
In September 2008 CVG will officially open its new Aftermarket Support Centre which features a 13,000 sqm Parts Distribution Centre (2.5 times current capacity) and a National Service Training Centre. This facility will service the growing number of Western Star and MAN vehicles on the road and enhance CVG’s position as an industry leader in Aftermarket Support.
CVG as a market leader continues to develop an optimum product designed for the waste industry. It is expected that this product will be released during FY09 and has the potential to add another 1 to 2% market share growth.
EBITDA
Sales
EBIT
0 50 100 150 200 250 300
0 5 10 15 20 25 300 5 10 15 20 25 30
0 10 20 30 40 50 600 10 20 30 40 50 60
0 200 400 600 800 1000 1200
0 200 400 600 800 1000 1200
EBITDA
Sales $m
EBIT
0 100 200 300 400 500
0 30 60 90 120 150
0 30 60 90 120 150
0 50 100 150 2000 50 100 150 200
EBITDA
Sales $m
EBIT
473.9
240.6
28.0
33.2
338.5
32.2
270.6
23.6
52.6
31.9
43.9
43.0
EBITDA
Sales $m
EBIT
200820072006
200820072006
200820072006
200820072006
200820072006
200820072006
200820072006
200820072006
200820072006
200820072006
200820072006
200820072006
35.0
29.2
130.3
34.0
35.039.8
17.2
EBITDA
Sales $m
EBIT
20082007
2008
2008
2007
2007
131.2
95.1
367.9
335.7
256.3
1011.0
EBITDA
Sales $m
EBIT
20082007
20082007
20082007
3.3
3.0
7.5
58.7
17.3
8.6
EBITDA
Sales $m
EBIT
20082007
20082007
20082007
3.24.7
2.43.7
23.028.3
23.0
$m
55.2
45.0
180.7
44.3
20.1
22.2
284.7
32.9
81.7106.4
178.3107.6
182.3
52.628.2
42.821.8
178.3
Sales include PSO levy
CommercialVehiclesthe Future:
We will further strengthen our dealer network, and enhance our position as an industry leader in aftermarket support.
Paul Glavac Managing Director Commercial Vehicles
For
per
sona
l use
onl
y

Transpacific Annual Report 2008 || PAGE 14
EBITDA
Sales
EBIT
0 50 100 150 200 250 300
0 5 10 15 20 25 300 5 10 15 20 25 30
0 10 20 30 40 50 600 10 20 30 40 50 60
0 200 400 600 800 1000 1200
0 200 400 600 800 1000 1200
EBITDA
Sales $m
EBIT
0 100 200 300 400 500
0 30 60 90 120 150
0 30 60 90 120 150
0 50 100 150 2000 50 100 150 200
EBITDA
Sales $m
EBIT
473.9
240.6
28.0
33.2
338.5
32.2
270.6
23.6
52.6
31.9
43.9
43.0
EBITDA
Sales $m
EBIT
200820072006
200820072006
200820072006
200820072006
200820072006
200820072006
200820072006
200820072006
200820072006
200820072006
200820072006
200820072006
35.0
29.2
130.3
34.0
35.039.8
17.2
EBITDA
Sales $m
EBIT
20082007
2008
2008
2007
2007
131.2
95.1
367.9
335.7
256.3
1011.0
EBITDA
Sales $m
EBIT
20082007
20082007
20082007
3.3
3.0
7.5
58.7
17.3
8.6
EBITDA
Sales $m
EBIT
20082007
20082007
20082007
3.24.7
2.43.7
23.028.3
23.0
$m
55.2
45.0
180.7
44.3
20.1
22.2
284.7
32.9
81.7106.4
178.3107.6
182.3
52.628.2
42.821.8
178.3
Sales include PSO levy
It has been an exciting year for the manufacturing division in its first full year of operations, with strong growth in all segments of the division. The focus for the year has been on acquisitions and integrating these to enable us to take advantage of synergies. With 11 sites across Australia and New Zealand Transpacific is the largest Australian waste equipment manufacturer, with the most extensive range of products and services available, all under the Superior Pak brand.
We are now strategically well positioned on a national basis to build even further with organic and strategic acquisition growth opportunities coming through from our strong brand and market positioning.
Product consolidation and development will be the way forward in the waste equipment industry and we believe that we are now at the forefront of this with our national engineering development group based in Brisbane. The group has been brought together over the past six months to not only consolidate our current extensive range of products, but to develop the future with leading edge technology. Three major projects for the coming year will be to develop, build and market a new vacuum tanker and hook lift range of products and to consolidate and progress the steel bin market offering. These are all high growth areas for the division and show we are developing our future.
During the year several new products were added to the already extensive product range we offer, one of which was plastic bins,
through the acquisition of One Stop Garbage Shop. They were relatively small in the market and focused predominantly within Victoria, yet have the potential under the TPI group to be a major player in the industry. Over the next 12 months we will role out a strategy that sees us well positioned across all states in Australia and New Zealand.
Along with winning some major product contracts this year with all the major players in the waste industry, we have also secured significant growth in the service area of the division, which in turn has flowed through into spare parts growth. We see continued growth in this area and have an aggressive expansion plan for the next 12 months, which will see us significantly increase our personnel, facilities and service vans. This will be driven by a new national team and supported by new state based structures.
We have had an incredibly exciting and successful first full year of operation. We have elevated to become the premier waste equipment provider in our market. The next 12 months will prove to be no different with more new products being added to our range and continued growth across all market segments.
the Future: Expansion of existing facilities has commenced to assist with demand (for waste vehicle bodies, bins and skips) from both within and outside the Group. Our various products are being consolidated and new products are being developed.
Gary Silversides General Manager Manufacturing
Manufacturing
// Chief Executive Officer’s Review
For
per
sona
l use
onl
y
PAGE 15 ||Transpacific Annual Report 2008
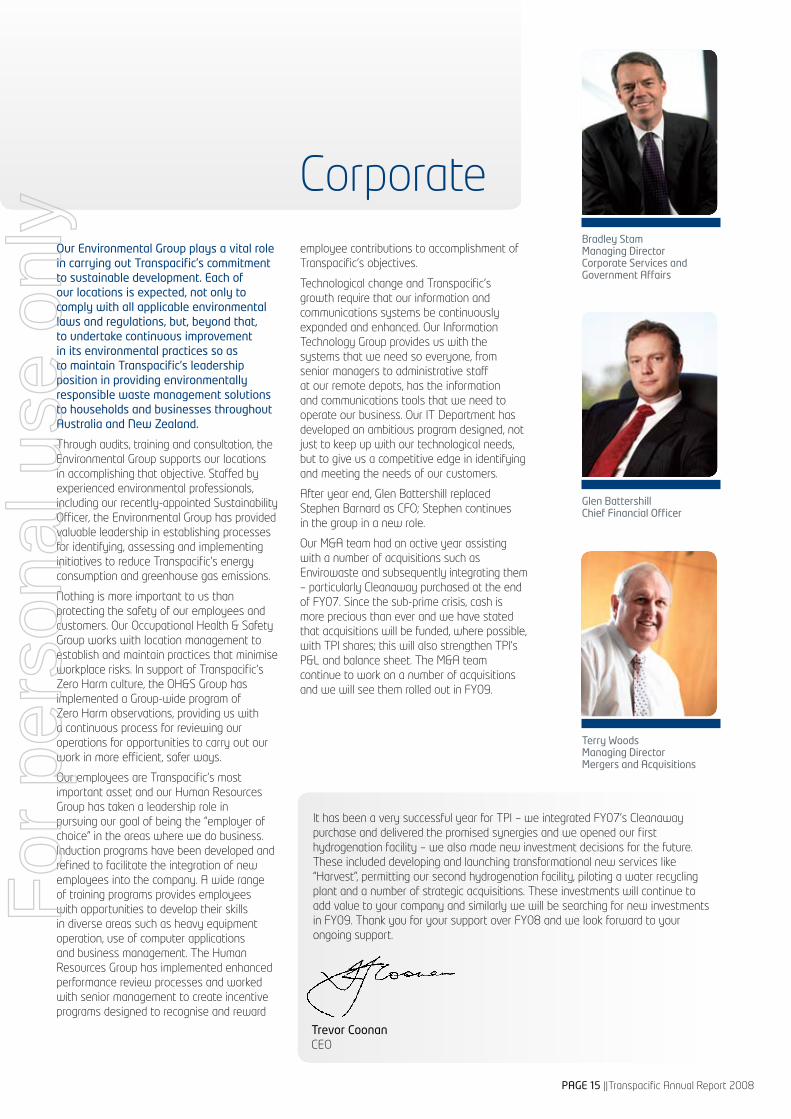
Our Environmental Group plays a vital role in carrying out Transpacific’s commitment to sustainable development. Each of our locations is expected, not only to comply with all applicable environmental laws and regulations, but, beyond that, to undertake continuous improvement in its environmental practices so as to maintain Transpacific’s leadership position in providing environmentally responsible waste management solutions to households and businesses throughout Australia and New Zealand.
Through audits, training and consultation, the Environmental Group supports our locations in accomplishing that objective. Staffed by experienced environmental professionals, including our recently‑appointed Sustainability Officer, the Environmental Group has provided valuable leadership in establishing processes for identifying, assessing and implementing initiatives to reduce Transpacific’s energy consumption and greenhouse gas emissions.
Nothing is more important to us than protecting the safety of our employees and customers. Our Occupational Health & Safety Group works with location management to establish and maintain practices that minimise workplace risks. In support of Transpacific’s Zero Harm culture, the OH&S Group has implemented a Group‑wide program of Zero Harm observations, providing us with a continuous process for reviewing our operations for opportunities to carry out our work in more efficient, safer ways.
Our employees are Transpacific’s most important asset and our Human Resources Group has taken a leadership role in pursuing our goal of being the “employer of choice” in the areas where we do business. Induction programs have been developed and refined to facilitate the integration of new employees into the company. A wide range of training programs provides employees with opportunities to develop their skills in diverse areas such as heavy equipment operation, use of computer applications and business management. The Human Resources Group has implemented enhanced performance review processes and worked with senior management to create incentive programs designed to recognise and reward
employee contributions to accomplishment of Transpacific’s objectives.
Technological change and Transpacific’s growth require that our information and communications systems be continuously expanded and enhanced. Our Information Technology Group provides us with the systems that we need so everyone, from senior managers to administrative staff at our remote depots, has the information and communications tools that we need to operate our business. Our IT Department has developed an ambitious program designed, not just to keep up with our technological needs, but to give us a competitive edge in identifying and meeting the needs of our customers.
After year end, Glen Battershill replaced Stephen Barnard as CFO; Stephen continues in the group in a new role.
Our M&A team had an active year assisting with a number of acquisitions such as Envirowaste and subsequently integrating them – particularly Cleanaway purchased at the end of FY07. Since the sub‑prime crisis, cash is more precious than ever and we have stated that acquisitions will be funded, where possible, with TPI shares; this will also strengthen TPI’s P&L and balance sheet. The M&A team continue to work on a number of acquisitions and we will see them rolled out in FY09.
Corporate
It has been a very successful year for TPI – we integrated FY07’s Cleanaway purchase and delivered the promised synergies and we opened our first hydrogenation facility – we also made new investment decisions for the future. These included developing and launching transformational new services like “Harvest”, permitting our second hydrogenation facility, piloting a water recycling plant and a number of strategic acquisitions. These investments will continue to add value to your company and similarly we will be searching for new investments in FY09. Thank you for your support over FY08 and we look forward to your ongoing support.
Trevor Coonan CEO
Bradley Stam Managing Director Corporate Services and Government Affairs
Glen Battershill Chief Financial Officer
Terry Woods Managing Director Mergers and Acquisitions
For
per
sona
l use
onl
y

Transpacific Annual Report 2008 || PAGE 16
Terry Peabody Executive Chairman
Terry Peabody has been involved in the importation and distribution of Western Star trucks into Australia since 1983. The waste management operations of Transpacific were formed in 1987 by Mr Peabody, following the successful public float of Pozzolanic Industries, listed on the ASX by Mr Peabody and his family in 1985.
In 1991, business interests associated with Mr Peabody acquired the North American parent company of Western Star, successfully listing the company on the Toronto Stock Exchange in 1994. In 2000, the North American company was purchased by Freightliner LLC (a Daimler group company) with the Australian operations retained by business interests associated with Mr Peabody, and now forming part of Transpacific. Mr Peabody has had extensive international success in building waste management, transportation and manufacturing companies. He has held the position of Executive Chairman of Transpacific since its incorporation in 1987.
Bruce Allan Non-Executive Director
Bruce Allan is a mining engineer who has some 45 years’ experience working in the Australian resources industry. Mr Allan is Managing Director of Bruce Allan Corporate Services, a specialist services consultant to the mining industry. He is currently Chairman of the Queensland Mines Rescue Service, a private industry organisation providing specialist services to the Queensland coal industry. Mr Allan is a Director of the Illawarra Retirement Trust, a large retirement organisation based in New South Wales and a non‑executive director of Centennial Coal Limited, an ASX listed company.
Mr Allan has held senior industry management positions with major organisations such as Rio Tinto and BHP Billiton, retiring from BHPB – Illawarra Coal as Vice President Operations in 2004, to form his own consulting business.
He has served as Chairman of the New South Wales Minerals Council underground research committee, advising industry and government on direction and expenditure for coal research. He has travelled extensively overseas in both technical and marketing roles for both the mining industry and government.
Mr Allan brings to the Board an in‑depth knowledge of the Australian resources industry.
Graham Mulligan Non-Executive Director
Graham Mulligan has had extensive experience in senior management positions in Australia and New Zealand. He is the managing director of International Infrastructure Ventures Pty Ltd which specialises in providing management services to major projects in the infrastructure and oil exploration and production industries. Recently he has managed the CrossCity Motorway Group of companies in Sydney, held the position of Chief Executive Officer of the Port of Brisbane Corporation, and prior to that was the Managing Director of Port Wellington Ltd in New Zealand. Mr Mulligan has also held senior management and publicly listed company director positions in the petroleum exploration and production industries in Australia and New Zealand.
// Board of Directors
For
per
sona
l use
onl
y

PAGE 17 ||Transpacific Annual Report 2008
Trevor Coonan Chief Executive Officer Executive Director
Trevor joined Transpacific as Chief Financial Officer in 2004 prior to its listing on the ASX. Since that time Trevor has overseen and been actively involved in Transpacific strategy and acquisitions and in conveying the acquisitions and expectations to shareholders and the market. On 1 July 2007, Trevor was appointed CEO. Prior to joining the company he was a director with PriceWaterhouseCoopers. Trevor holds a Bachelor of Commerce degree and is a Chartered Accountant.
Bruce Brown Non-Executive Director
Bruce Brown is currently a non‑executive director of Campbell Brothers Limited, an ASX listed company with diversified operations including the manufacture and distribution of chemicals and the provision of analytical laboratory services. Mr Brown had held finance and senior management positions with that company since 1976.
In 1990, Mr Brown was appointed Chief Financial Officer of Campbell Brothers Limited and three years later became its Chief Executive Officer and Managing Director. He resigned as Chief Executive Officer in 2005. Mr Brown has been integral to that company’s significant growth and ongoing success in a broad range of industries.
Mr Brown was for a period of time a director and Chairman of Flight Centre Ltd. He is also Chairman of Mastermyne Pty Ltd, a mining services company based in North Queensland.
Harold Grundell Chief Executive Officer – Transpacific Industries Executive Director
Harold Grundell joined Transpacific in 1990 in an operations role and has since held several senior management positions throughout Australia with the Transpacific Group. Mr Grundell was appointed to the role of Chief Executive Officer for Nationwide Oil in June 2001 before being appointed to the position of Managing Director in February 2004. Mr Grundell is a director of the Australian Oil Recyclers Association and sits on the Oil Stewardship Advisory Committee, which advises the Federal Minister for the Environment in relation to matters concerning used oil collection and recycling. Mr Grundell is also a director of several Transpacific companies.
Kellie Smith Company Secretary
Kellie joined Transpacific as Group Corporate Accountant in 2004 prior to its listing on the ASX. Prior to this Kellie specialised in manufacturing and service companies in her role as Client Services Manager in the Corporate Advisory Services Division for a chartered accounting firm. Kellie holds a Bachelor of Commerce (Honours) degree and is a Chartered Accountant.
For
per
sona
l use
onl
y

Transpacific Annual Report 2008 || PAGE 18
// Corporate Governance
Transpacific Industries Group Ltd (Transpacific or the Company) and its Board of Directors are highly committed to appropriate levels of corporate governance. The Company’s corporate governance practices are continually reassessed and updated in the light of experience (within the Company and other organisations) and best practice guidelines.
The Board confirms that the current corporate governance practices of the Company meet the revised Principles of Good Corporate Governance and Best Practice Recommendations released by the Australian Stock Exchange Corporate Governance Council (ASXCGC) which became effective for financial years beginning on or after 1 January 2008, with the exception of Recommendation 2.1 and 2.2. Explanations for these departures are set out in Section 2 below.
A description of the Company’s main corporate governance practices is set out in this statement. For further details please visit the investor section of our website at www.transpacific.com.au.
1. The Role of the BoardThe Board operates under a Charter which sets out the role, powers and responsibilities of the Board. The Charter is regularly reviewed to ensure it remains consistent with the Board’s objectives and responsibilities. A full copy can be viewed on the Transpacific website.
The Transpacific Board is responsible for providing strategic guidance to the Company and effective oversight of its executive and senior management on behalf of shareholders.
To achieve this, the Board is engaged in the following activities:
• Input into and final approval of senior management’s corporate strategy and performance objectives;
• Monitoring of executive and senior management performance, including the implementation of corporate strategies, and ensuring appropriate resources are available;
• Appointing and reviewing the performance of the Chief Executive Officer;
• Ensuring that the Company has appropriate systems of risk management and internal compliance and control;
• Approving and monitoring the progress of major capital expenditure, capital management, and acquisitions and divestments;
• Other matters required to be dealt with from time to time depending on the circumstances of the Company.
2. Composition of the BoardThe Company’s Constitution calls for at least three but not more than 10 Directors. The Board is presently comprised of three executive directors and three non‑executive directors. Profiles of each director, outlining their skills, experience and expertise, are set out on pages [XX] and [XX] of the Annual Report. The Board has a broad range of relevant operational, regulatory, risk management, financial and other skills and expertise to meet its objectives and effectively govern the Company.
ASXCGC Best Practice Recommendation 2.1 states the majority of the board should be independent directors. The current Board believes six Directors is an optimal number of directors for a company the size and growth profile of the Group. It believes the skills and industry knowledge of the three Executive Directors are required to lead the company forward.
The composition of the Board is determined by the Nomination and Remuneration Committee through a process of reviewing the current range of skills, experience and expertise of the Board and identifying the needs of the Company. Advice may also be sought for independent consultants.
ChairmanThe Chairman is responsible for leading the Board, ensuring Directors are properly briefed in all matters relevant to their role and responsibilities, facilitating Board discussions and managing the Board’s relationships with the Company’s senior executives.
ASXCGC Best Practice Recommendation 2.1 states the Chairperson should be an independent Director. The current Board believes Transpacific’s founder and major shareholder, Terry Peabody, has the vision, skills and deep industry knowledge required to lead the Company, clearly communicate the Company’s objectives and strategy, and to set market expectations.
Re-election of directorsIn accordance with Transpacific’s Constitution, one third of the Directors (excluding the Managing Director) must stand for re‑election at each Annual General Meeting. In addition, no director (other than the Managing Director) may hold office for more than three years without standing for re‑election, and any director appointed by the Board since the last Annual General Meeting must stand for re‑election at the next Annual General Meeting. All retiring directors are eligible for re‑election.
For
per
sona
l use
onl
y

PAGE 19 ||Transpacific Annual Report 2008
3. Independence of DirectorsThe Board acknowledges the importance of directors who are independent from management and free of any business or other relationship that could interfere, or reasonably be perceived to interfere, with the exercise of their independent judgement and ability to act in the best interests of Transpacific and its shareholders.
In applying the definition of independence outlined in the recommendations of the ASX Corporate Governance Council, it has been determined that the following directors constitute the independent directors of the Company:
Mr Bruce Brown – Deputy Chairman and Non‑Executive DirectorMr Graham Mulligan – Non‑Executive DirectorMr Bruce Allan – Non‑Executive Director
The current Board has overseen the growth and development of Transpacific since listing and in the Board’s view the Company derives benefits from having long serving directors with a detailed knowledge of its operations. The Board does not consider that the independence of any of the current directors is impacted by their length of service.
4. Conflicts of InterestDirectors are required to disclose to the Board on an ongoing basis any relationships from which a conflict of interest might arise. A Director who has an actual or potential conflict of interest or a material personal interest in a matter is required to declare that conflict to the Board, and if the Board determines there is a material conflict of interest that director:
• is not entitled to receive any relevant Board papers of other documents in reference to the matter;
• must not be present at the meeting while the matter is considered;
• must not participate in any decision on the matter.
The Board may resolve to permit a director to have an involvement in a matter involving a potential or actual conflict of interest. In such instances the Board must minute full details of the basis of the determination and the nature of the conflict, including a formal resolution concerning the matter.
5. Access to Independent AdviceDirectors and the Board Committees have the right in connection with their duties and responsibilities to seek
independent professional advice at the Company’s expense. Prior written approval of the Chairman is required, but this will not be unreasonably withheld. Where appropriate, directors share such advice with the other directors.
6. Board MeetingsThe Board meets at least eight times each year for scheduled meetings, and in addition meets wherever necessary to deal with specific matters that require attention between the scheduled meetings.
Together with the Board Committees, the directors use the Board meetings to challenge and fully understand the business and its operational issues. To assist in this, the Board regularly conducts its meetings at Transpacific’s operating sites, followed by management presentations and tours of the facilities.
The number of meetings of the Board and of each Board Committee held during the year ended 30 June 2007, and the number of meetings attended by each Director, is disclosed on page 26.
7. Board CommitteesThe Board has two standing Committees to assist in carrying out its duties and responsibilities as outlined in the Board Charter.
The standing Board Committees are:
(a) Audit and Risk Management and Compliance Committee
This committee consists of the following Non‑Executive Directors:
B R Brown (Chairman)G D MulliganB S Allan
Details of these Directors’ qualifications and attendance at meetings are set out earlier and in the Directors’ Report on page 26. The Committee has appropriate financial expertise and all members are financially literate and have an appropriate understanding of the industries in which Transpacific operates.
The Committee was established in March 2005 and is governed by a Charter which outlines the Committee’s role and responsibilities, composition and membership requirements. The Charter is regularly reviewed to ensure it remains consistent with the Board’s objectives and responsibilities. The current Charter is available under the Corporate Governance section of the Company’s website.
For
per
sona
l use
onl
y

Transpacific Annual Report 2008 || PAGE 20
The External Auditor, Chairman, Chief Executive Officer, Chief Financial Officer, Company Secretary and other Transpacific executives attend meetings of the Committee as required to present the relevant statutory information, financial statements, reports, and to answer the questions of the Committee members.
The main responsibilities of the Committee include:
• Review of financial statements and external financial reporting prior to consideration by the Board of Directors to ensure they represent a true and fair view of Transpacific’s financial position and performance;
• Assess the management processes supporting external reporting;
• Review of the process the Executive Chairman, Chief Executive Officer and Chief Financial Officer have in place to support its certifications to the Board;
• Recommend to the board the appointment, reappointment or replacement of the External Auditor, and review the terms of its engagement, the scope and quality of the audit and consider the auditors independence on an on‑going basis;
• Review and monitor risk management and internal compliance and control systems;
• Determine the scope of the internal audit function (if any);
• Report to the Board on matters relevant to the Committee’s role and responsibilities.
At the Committee meeting to consider the half and full year financial results, the Committee members will meet with the External Auditor without management present.
(b) Nomination and Remuneration Committee
This committee consists of the following Directors:
G D Mulligan (Chairman, Non‑Executive Director)B R Brown (Non‑Executive Director)T E Peabody (Executive Director)
The Committee meets as required and attendances at meetings are set out in the Directors’ Report on page [26].
The Committee was established in March 2005 and is governed by a Charter which outlines the Committee’s role and responsibilities, composition and membership requirements. The Charter is regularly reviewed to ensure it remains consistent with the Board’s objectives and responsibilities. The current Charter is available under the Corporate Governance section of the Company’s website.
The main responsibilities of the Committee include:
• Review and assessment of the necessary and desirable competencies of Board members and relevant Board Committees;
• Evaluation of the performance and contributions of Board members and senior executives on an annual basis;
• Overseeing the selection and appointment practices for Directors and senior executives;
• Assisting the Board in relation to the remuneration policy for the Company and the application of the policy to senior executives.
In performing its responsibilities, the Committee receives appropriate advice from external consultants and other advisors as required.
8. Code of Conduct and Securities Trading PolicyThe Company conducts its business with the highest standards of personal and corporate integrity. To assist employees in achieving this objective, the Company has developed a Statement of Values and Corporate Code of Conduct (the Code) which guides the behaviour of Directors, officers and employees and demonstrates the commitment of the Company to ethical practices.
The Code is fully endorsed by the Board, and is regularly reviewed and updated as necessary to ensure it reflects the highest standards of behaviour and professionalism and the practices necessary to maintain confidence in the Company’s integrity.
The Code states the values and policies of the Company and complements the Company’s risk management and internal control practices. It details the key principles of the Company’s Trade Practices and Fair Trading polices.
Additionally the Code reinforces the Company’s Securities Trading policy. The Securities Trading Policy permits Directors and employees to buy and sell Company securities during the six week period following release of the half‑yearly and annual financial results to the market and the six week period following the Annual General Meeting. Trading outside the permitted trading windows is permitted only with the prior consent of the Executive Chairman, Chief Executive Officer or Company Secretary. At all times, if an employee possesses unpublished insider information about the Company, that person is prohibited from trading.
The Code requires employees who are aware of unethical practices within the Company or breaches of the trading policy to report these to the Company Secretary or Audit and Risk Management and Compliance Committee.
// Corporate Governance
For
per
sona
l use
onl
y

PAGE 21 ||Transpacific Annual Report 2008
Appropriate training programs on the Company’s internal policies including workplace health and safety, environmental law compliance, trade practices legislation and equal opportunity employment support the code.
The Directors are satisfied that the Company has complied with its policies on ethical standards, including trading in securities.
A copy of the Code and the securities trading policy are available under the Corporate Governance section of the Company’s website.
9. Risk Management and Internal ControlsThe Board recognises that effective risk management processes are imperative to the Company achieving its business objectives and to the Board meeting its corporate governance responsibilities.
The Board, through the Audit and Risk Management and Compliance Committee, is responsible for ensuring there are adequate policies in relation to risk management, compliance and internal controls to ensure strategic, operational, legal, regulatory and financial risks are identified, assessed, effectively and efficiently managed and monitored to enable achievement of the Company’s business objectives.
Detailed control procedures cover management accounting, financial reporting, project appraisal, environment, health and safety, IT security, compliance and other risk management issues. Numerous risk management controls are embedded in the Company’s management and reporting systems, including:
• Policies and procedures for the management of financial risk and treasury operations, including hedging exposure to foreign currencies and interest rates;
• Annual budgeting and monthly reporting systems for all divisions which enable monitoring of progress against performance targets, evaluation of trends and variances to be acted upon;
• Health and safety programs and targets;
• Due diligence procedures for acquisitions.
In view of the divisional structure of the Company with divisional accounting functions, and considering cost effectiveness, the Company relies on its financial management team to perform internal audit functions.
Occupational Health, Safety and Environment (OHSE)
The Company recognises the importance of OHSE issues and is committed to the highest levels of performance and review. The Company:
• Monitors its compliance with all relevant legislation;
• Continually assesses and improves the impact of its operations on the environment;
• Encourages employees to actively participate in the management of OHSE issues.
The OHSE department conducts management systems, operational and licensing audits throughout the Company as part of the Compliance Management Strategy. Transpacific has also undertaken a major initiative with the implementation of a National Integrated Management System covering all areas of ISO 14001 (Environment), AS/NZS (Occupational Health and Safety) and ISO 9001 (Quality) relevant to the business processes, products and services provided by the Company. External certification has been obtained in a number of the Company’s operating divisions and are continuing to achieve certification in the remaining divisions.
A new Greenhouse Gas Emissions Policy has been implemented across the Group. The policy is focused on improving our environmental footprint through the reduction of greenhouse gas emissions. Energy efficiency and emission reduction strategies will be assessed and implemented to help TPI achieve this goal.
Information on compliance with significant environmental regulations is set out in the Directors’ Report.
Certification of Risk Management Controls
In conjunction with the certification of financial reports the Chairman, Chief Executive Officer and Chief Financial Officer state in writing to the Board each reporting period that in their opinion:
• The statement is founded on a sound system of risk management and internal compliance and control which implements the policies adopted by the Board; and
• The Company’s risk management and internal compliance and control system is operating efficiently and effectively in all material respects.
This statement is based on a formal sign off framework established throughout the Company and reviewed by the Audit and Risk Management and Compliance Committee as part of the six‑monthly financial reporting process.
10. Audit and Auditor IndependenceThe Board recognises the importance of an independent audit firm to ensure that the audit function delivers, for the benefit of the Board and all other stakeholders, an unbiased confirmation of both the financial statements and the state of affairs of the Company.
Consistent with this commitment a policy has been prepared and approved by the Board on the Role of the External
For
per
sona
l use
onl
y

Transpacific Annual Report 2008 || PAGE 22
Auditor, which is designed to ensure the independence of the external audit function.
Bentleys MRI Brisbane Partnership was appointed as the external auditor in 2002. Bentleys MRI has declared its independence to the Board through its representations to the Audit and Risk Management Committee and provision of its Lead Auditor Independence Declaration, stating that there have been no contraventions of auditor independence requirements as set out in the Corporations Act or any auditors’ professional code. The lead engagement partner was rotated following the audit signing of the FY07 statutory accounts.
11. Continuous Disclosure and Communication with ShareholdersTranspacific is committed to ensuring shareholders are provided with full, open and timely material information about its activities. This is achieved by the following:
• Complying with the continuous disclosure obligations contained in the ASX Listing Rules and the Corporations Act 2001. Written policies and procedures are in place to ensure the Company complies with the continuous disclosure requirements and to ensure accountability at the executive and senior management level for that compliance;
• Ensuring that all communications with shareholders (including the annual report and notice of annual general meeting) satisfy statutory requirements and are easily understandable;
• Ensuring that all shareholders have the opportunity to receive external communications issued by the Company. All company announcements and information released are posted to the investor section of the Transpacific website following confirmation of its release by the ASX to the market. This section of the website also outlines the Corporate Governance practices of the Company and other relevant information;
• Encouraging shareholders to attend Annual General Meetings and to use this opportunity to ask questions. If shareholders are unable to attend in person, they are encouraged to participate through the appointment of a proxy or proxies; and
• The Company’s external auditor attends the Annual General Meeting to answer questions from shareholders about the conduct of the audit and the preparation and content of the Independent Audit Report. Shareholders attending the meeting are made aware that they may ask such questions of the auditor.
// Corporate Governance
For
per
sona
l use
onl
y

PAGE 23 ||Transpacific Annual Report 2008
// Financial Report
Contents// Directors’ Report 24 // Auditor’s Independence Declaration 36 //Income Statement 37 // Statement of Recognised Income and Expense 38 // Balance Sheet 39 // Cash Flow Statement 40 // Notes to the Financial Statements 41 // Directors’ Declaration
105 // Independent Auditor’s Report to the Members of Transpacific Industries Group Ltd 106 // Shareholder Information 108
Transpacific Industries Group Ltd ABN 74 101 155 220
Financial Year Ended 30 June 2008
For
per
sona
l use
onl
y
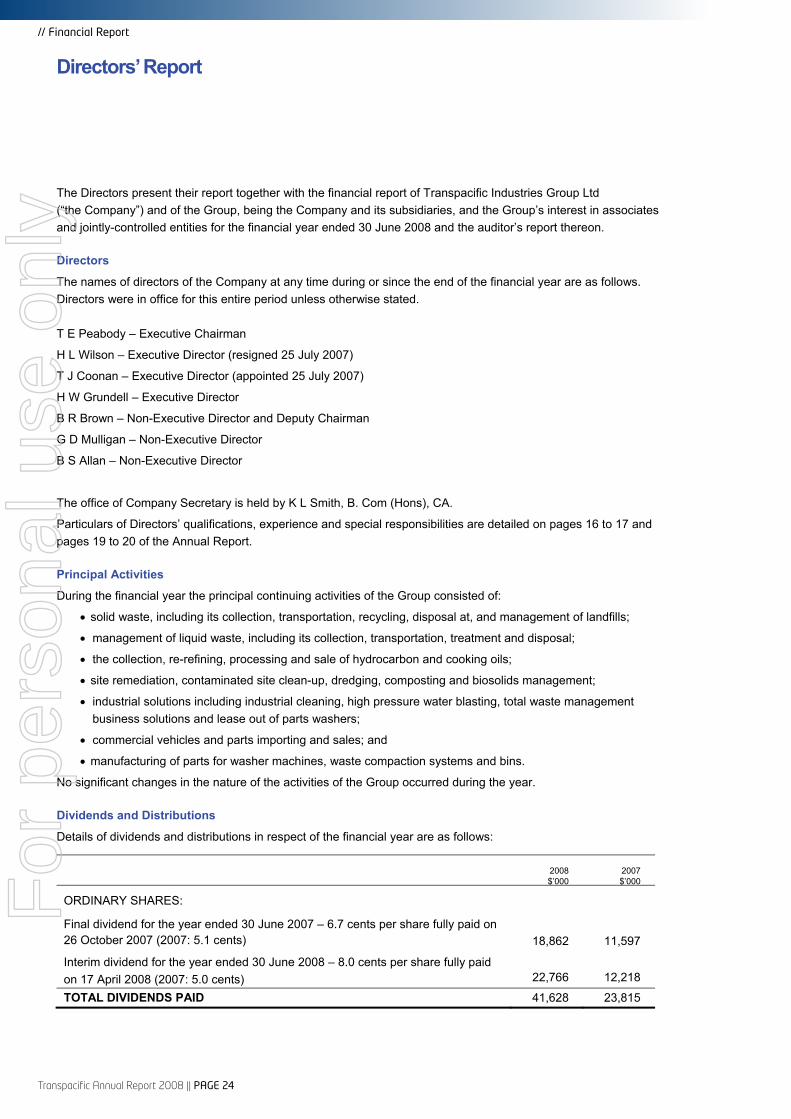
Transpacific Annual Report 2008 || PAGE 24
// Financial Report
Directors’ Report
The Directors present their report together with the financial report of Transpacific Industries Group Ltd (“the Company”) and of the Group, being the Company and its subsidiaries, and the Group’s interest in associates and jointly-controlled entities for the financial year ended 30 June 2008 and the auditor’s report thereon.
Directors
The names of directors of the Company at any time during or since the end of the financial year are as follows. Directors were in office for this entire period unless otherwise stated. T E Peabody – Executive Chairman
H L Wilson – Executive Director (resigned 25 July 2007)
T J Coonan – Executive Director (appointed 25 July 2007)
H W Grundell – Executive Director
B R Brown – Non-Executive Director and Deputy Chairman
G D Mulligan – Non-Executive Director
B S Allan – Non-Executive Director
The office of Company Secretary is held by K L Smith, B. Com (Hons), CA.
Particulars of Directors’ qualifications, experience and special responsibilities are detailed on pages 16 to 17 and pages 19 to 20 of the Annual Report.
Principal Activities
During the financial year the principal continuing activities of the Group consisted of:
solid waste, including its collection, transportation, recycling, disposal at, and management of landfills;
management of liquid waste, including its collection, transportation, treatment and disposal;
the collection, re-refining, processing and sale of hydrocarbon and cooking oils;
site remediation, contaminated site clean-up, dredging, composting and biosolids management;
industrial solutions including industrial cleaning, high pressure water blasting, total waste management business solutions and lease out of parts washers;
commercial vehicles and parts importing and sales; and
manufacturing of parts for washer machines, waste compaction systems and bins.
No significant changes in the nature of the activities of the Group occurred during the year.
Dividends and Distributions
Details of dividends and distributions in respect of the financial year are as follows:
2008 $’000
2007 $’000
ORDINARY SHARES:
Final dividend for the year ended 30 June 2007 – 6.7 cents per share fully paid on 26 October 2007 (2007: 5.1 cents) 18,862 11,597
Interim dividend for the year ended 30 June 2008 – 8.0 cents per share fully paid on 17 April 2008 (2007: 5.0 cents) 22,766 12,218
TOTAL DIVIDENDS PAID 41,628 23,815
For
per
sona
l use
onl
y
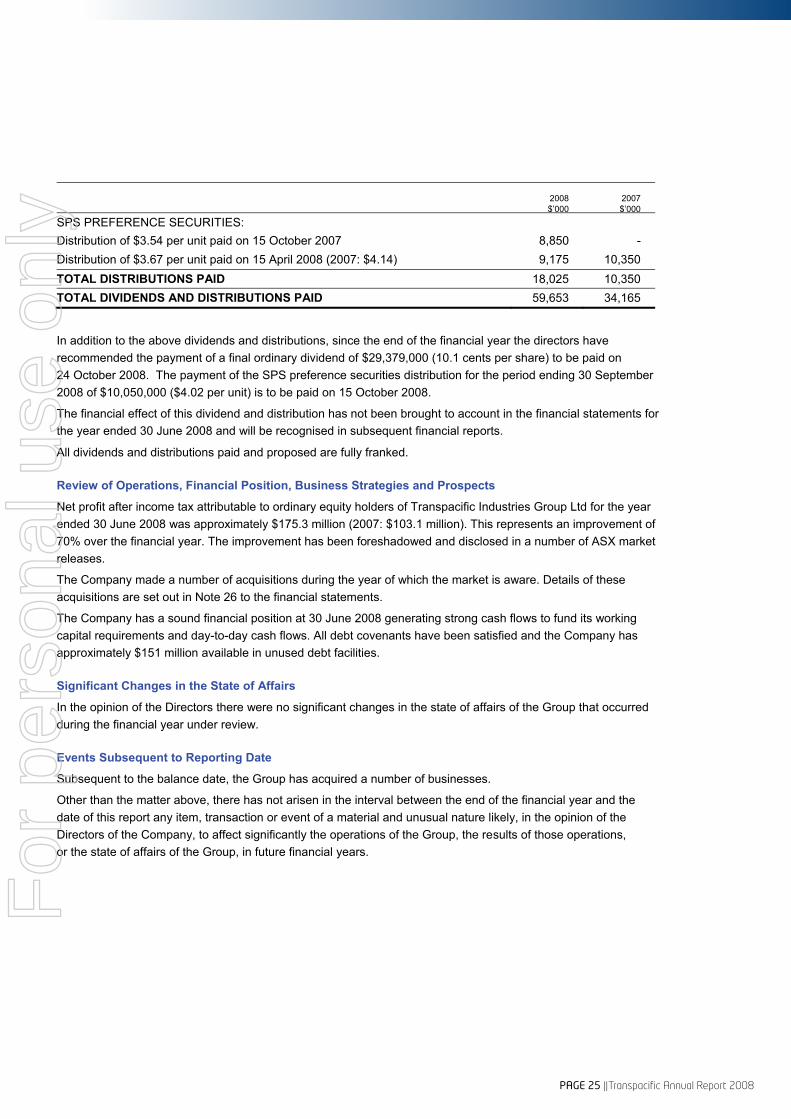
PAGE 25 ||Transpacific Annual Report 2008
2008 $’000
2007 $’000
SPS PREFERENCE SECURITIES: Distribution of $3.54 per unit paid on 15 October 2007 8,850 - Distribution of $3.67 per unit paid on 15 April 2008 (2007: $4.14) 9,175 10,350 TOTAL DISTRIBUTIONS PAID 18,025 10,350 TOTAL DIVIDENDS AND DISTRIBUTIONS PAID 59,653 34,165
In addition to the above dividends and distributions, since the end of the financial year the directors have recommended the payment of a final ordinary dividend of $29,379,000 (10.1 cents per share) to be paid on 24 October 2008. The payment of the SPS preference securities distribution for the period ending 30 September 2008 of $10,050,000 ($4.02 per unit) is to be paid on 15 October 2008.
The financial effect of this dividend and distribution has not been brought to account in the financial statements for the year ended 30 June 2008 and will be recognised in subsequent financial reports.
All dividends and distributions paid and proposed are fully franked.
Review of Operations, Financial Position, Business Strategies and Prospects
Net profit after income tax attributable to ordinary equity holders of Transpacific Industries Group Ltd for the year ended 30 June 2008 was approximately $175.3 million (2007: $103.1 million). This represents an improvement of 70% over the financial year. The improvement has been foreshadowed and disclosed in a number of ASX market releases.
The Company made a number of acquisitions during the year of which the market is aware. Details of these acquisitions are set out in Note 26 to the financial statements.
The Company has a sound financial position at 30 June 2008 generating strong cash flows to fund its working capital requirements and day-to-day cash flows. All debt covenants have been satisfied and the Company has approximately $151 million available in unused debt facilities.
Significant Changes in the State of Affairs
In the opinion of the Directors there were no significant changes in the state of affairs of the Group that occurred during the financial year under review.
Events Subsequent to Reporting Date
Subsequent to the balance date, the Group has acquired a number of businesses.
Other than the matter above, there has not arisen in the interval between the end of the financial year and the date of this report any item, transaction or event of a material and unusual nature likely, in the opinion of the Directors of the Company, to affect significantly the operations of the Group, the results of those operations, or the state of affairs of the Group, in future financial years.
For
per
sona
l use
onl
y

Transpacific Annual Report 2008 || PAGE 26
// Financial Report
Directors’ Report (continued)
Likely Developments and Expected Results of Operations
Material likely developments and expected results of operations of the Group have been notified to the market and include our investigation of further acquisitions and market opportunities.
Further information about likely developments in the operations of the Group and the expected results of those operations in future financial years has not been included in this report because disclosure of the information would be likely to result in unreasonable prejudice to the Group.
Environmental Regulation
The Group’s operations are subject to significant environmental regulation.
The Group holds environmental licences for its sites throughout Australia and New Zealand.
The Group is committed to achieving the highest standards of environmental performance. There were no material breaches of environmental statutory requirements and no material prosecutions during the year.
Meetings of Directors
The number of Directors’ meetings (including meetings of Committees of Directors) and number of meetings attended by each of the Directors of the Company during the financial year are:
BOARD MEETINGS
AUDIT RISK MANAGEMENT AND COMPLIANCE
COMMITTEE
NOMINATION & REMUNERATION COMMITTEE
DIRECTOR
MEETINGS HELD WHILE A DIRECTOR
NUMBER ATTENDED
MEETINGSHELD WHILE A MEMBER
NUMBER ATTENDED
MEETINGS HELD WHILE
A MEMBER NUMBER
ATTENDED
T E Peabody 11 11 * * 2 2 H L Wilson - - * * * *
T J Coonan 11 11 * * * *
H W Grundell 11 11 * * * *
B R Brown 11 11 4 4 2 2
G D Mulligan 11 11 4 4 2 2
B S Allan 11 11 4 4 * *
* Not a member of the relevant Committee.
Directors’ Interests
The relevant interest of each Director in the shares and options over such instruments issued by the companies within the Group and other related bodies corporate, as notified by the Directors to the Australian Securities Exchange in accordance with section 205G(1) of the Corporations Act 2001, at the date of this report is as follows:
ORDINARY SHARES OPTIONS OVER UNISSUED
ORDINARY SHARES
EXECUTIVE T E Peabody 76,269,039 6,950,000
T J Coonan 1,275,384 433,334
H W Grundell 459,047 266,667 NON-EXECUTIVE
B R Brown 100,000 50,000
G D Mulligan 32,222 50,000
B S Allan 5,000 50,000
For
per
sona
l use
onl
y

PAGE 27 ||Transpacific Annual Report 2008
REMUNERATION REPORT
REMUNERATION POLICY
The key driver of Transpacific’s remuneration policy is to attract and retain top quality directors and executives to ensure the continued success of the Group for the benefit of all our stakeholders.
The Remuneration Report is set out under the following main headings:
A Principles used to determine the nature and amount of remuneration
B Details of remuneration
C Service agreements
D Share-based compensation.
A Principles used to determine the nature and amount of remuneration
The objective of the Company’s executive remuneration framework is to ensure remuneration for performance is competitive and appropriate for the results delivered. The framework aligns executive remuneration with achievement of strategic objectives and the creation of value for shareholders, and conforms with market practice for delivery of reward. In our business it is assumed that all environmental and safety requirements are satisfied but there are penalties in our remuneration framework if they are not. The Board ensures that executive remuneration satisfies the following key criteria for good remuneration governance practices:
competitiveness and reasonableness;
acceptability and transparency to shareholders; and
performance linkage/alignment of executive compensation to financial results, safety requirements, environmental compliance and contribution to continuous improvement initiatives.
The Company has structured an executive remuneration framework that is market competitive and complementary to the reward strategy of the organisation.
Alignment to shareholders’ interests:
has economic profit as a core component of plan design;
focuses on sustained growth in shareholder wealth, consisting of dividends and growth in share price;
delivering constant return on assets as well as focusing the executive on key non-financial drivers of value; and
attracts and retains high calibre executives.
Alignment to program participants’ interests:
rewards capability and experience;
reflects competitive reward for contribution to growth in shareholder wealth;
provides a clear structure for earning rewards; and
provides recognition for contribution.
The framework provides a mix of fixed and variable pay, and a blend of short and long-term incentives.
As executives gain seniority within the Group, the balance of this mix shifts to a higher proportion of “at risk” remuneration.
The overall level of executive remuneration takes into account the performance of the Group over a number of years, with greater emphasis given to the current and prior year.
The Nomination & Remuneration Committee is responsible for reviewing remuneration and performance and may refer to external information on remuneration to establish remuneration policy and levels.
For
per
sona
l use
onl
y

Transpacific Annual Report 2008 || PAGE 28
// Financial Report
Directors’ Report (continued)
Non-Executive Directors
Non-Executive Directors are paid Directors’ fees. The payment of Directors’ fees is to reflect the demands which are made on, and the responsibilities of, the Directors. Non-Executive Directors’ fees and payments are reviewed annually by the Board and are determined within an aggregate directors’ fee pool limit, which is periodically recommended for approval by shareholders. The maximum currently stands at $750,000 per annum, to be apportioned among the Non-Executive Directors as the Board determines in its absolute discretion.
The Non-Executive Directors were also granted TPI share options which are discussed below.
Executives
Executive remuneration has four components:
base salary and benefits;
short-term performance incentives;
long-term incentives through participation in the Transpacific Executive Share Option Plan; and
other remuneration such as superannuation.
Base salary
Executives are offered a competitive base salary that is structured as a total employment cost package which may be delivered as a combination of cash and prescribed non-financial benefits at the Executives’ discretion. Base salary for senior Executives is reviewed annually to ensure it is competitive with the market. An Executive’s salary is also reviewed on promotion. There are no guaranteed base pay increases included in any senior Executives’ contracts. Benefits
Executives may receive benefits including car allowances, mobile phone and car parking.
Retirement benefits
Retirement benefits are not provided with the exception of statutory superannuation. Other retirement benefits may be provided directly by the Company if approved by shareholders but there are none at this time.
Short-term incentives (Incentive Compensation – IC)
Should the Company achieve a pre-determined profit target set by management and approved by the Board, then an IC pool is available for allocation to Executives during the annual review. Using a profit target ensures variable reward is only available when value has been created for shareholders and when profit is consistent with the business plan.
Each Executive has a target IC opportunity depending on the accountabilities of the role and organisation or business unit performance. For senior Executives the maximum target IC bonus opportunity is 50% of total base salary. Each year, the Remuneration Committee considers the appropriate targets and key performance indicators (KPIs) to link the IC plan and the level of payout if targets are met. This includes setting any maximum payout under the IC plan, and minimum levels of performance to trigger payment of an IC.
For the years ended 30 June 2008 and 30 June 2007, the KPIs linked to short-term incentive plans were based on group and individual business objectives. These KPIs are generic across the senior Executive team. ICs paid to the senior executive team are disclosed on pages 29 and 30.
The Nomination & Remuneration Committee is responsible for assessing whether the KPIs are met. To help make this assessment, the Committee receives detailed reports on performance from management.
ICs may be adjusted up or down in line with under or over achievement against the target performance levels but cannot be adjusted to exceed the maximum payable. This is at the discretion of the Nomination & Remuneration Committee.
Cash IC (bonuses) are payable in September each year after the financial year’s results are compiled, audited and released to the market. This ensures transparency and shareholders can see the link between shareholder returns and employee remuneration.
For
per
sona
l use
onl
y

PAGE 29 ||Transpacific Annual Report 2008
Long-term incentives (Transpacific Executive Share Option Plan)
Information on the Transpacific Executive Share Option Plan is set out on page 68. In short, however, the options granted to the Non-Executive Directors and certain Executives vest in equal tranches over two or three years. 75% of the options vest if total shareholder return (TPI share price increment over offer price plus dividend) totals at least 15% per annum on a cumulative basis and 25% vest if the volume weighted average price of TPI shares has outperformed the S&P/ASX200 (less financials) by 5% on a cumulative basis since the date the Company listed on the ASX. The options granted to date were issued for no consideration. From time to time, the Board will recommend that further options be issued in order to attract, incentivise and reward Executives and Non-Executive Directors. Staff eligible to participate in the plan are senior management and Non-Executive Directors nominated by the Nomination & Remuneration Committee.
B Details of remuneration
Details of the remuneration of the Directors and the key management personnel (as defined in AASB 124 Related Party Disclosures) of the Company and Group are set out in the following tables. You will see the base fixed components and the “at risk” performance related components discussed above. The options have been costed in accordance with methodology set out in D below.
REMUNERATION OF DIRECTORS OF TRANSPACIFIC INDUSTRIES GROUP LTD
SHORT-TERM
SHARE-BASED
PAYMENTS
POST EMPLOY-
MENT
SALARY
AND FEES $
STI CASH BONUS
$
NON-MONETARY
BENEFITS $
OPTIONS $
SUPER-ANNUATION
BENEFITS $
TOTAL $
% OF REMUN-ERATION
PERFORMANCE RELATED
EXECUTIVE
T E Peabody – 2008 732,056 - 18,629 - 65,689 816,374 -
– 2007 504,597 - 27,526 - 45,414 577,537 -
H W Grundell – 2008 524,010 183,486 14,323 93,293 61,515 876,627 20.9% (B)
– 2007 305,089 68,598 30,847 80,869 33,092 518,495 13.2% (F)
T J Coonan* – 2008 774,015 200,000 7,715 328,561 67,501 1,377,792 14.5% (E)
– 2007 364,374 156,132 5,467 99,490 33,435 658,898 23.7% (A)
H L Wilson** – 2008 153,968 - 7,848 19,746 12,980 194,542 -
– 2007 460,706 150,240 4,349 124,595 52,825 792,715 19.0% (C)
NON-EXECUTIVE
B R Brown – 2008 60,000 - - 2,962 5,400 68,362 -
– 2007 55,046 - - 6,230 4,954 66,230 -
G D Mulligan – 2008 60,000 - - 2,962 5,400 68,362 -
– 2007 55,046 - - 6,230 4,954 66,230 -
B S Allan *** – 2008 60,000 - - 23,472 5,400 88,872 -
– 2007 49,895 - - 11,184 4,491 65,570 -
J J Richards ****– 2008 - - - - - - -
– 2007 6,822 - - 922 614 8,358 -
Total – 2008 2,364,049 383,486 48,515 470,996 223,885 3,490,931
Total – 2007 1,801,575 374,970 68,189 329,520 179,779 2,754,033
* T J Coonan was appointed Chief Executive Officer (CEO) on 1 July 2007 and an Executive Director on 25 July 2007. ** H L Wilson resigned as CEO on 30 June 2007, Director on 25 July 2007 and ceased employment on 31 October 2007. *** B S Allan was appointed as Director on 23 August 2006. **** J J Richards resigned as Director on 23 August 2006.
For
per
sona
l use
onl
y

Transpacific Annual Report 2008 || PAGE 30
// Financial Report
Directors’ Report (continued)
REMUNERATION OF THE KEY MANAGEMENT PERSONNEL OF THE GROUP
SHORT-TERM
SHARE-BASED
PAYMENTS
POST EMPLOY-
MENT
SALARY AND FEES
$
STI CASH BONUS
$
NON-MONETARY
BENEFITS $
OPTIONS $
SUPER-ANNUATION
BENEFITS $
TOTAL $
% OF REMUN-ERATION
PERFORMANCE RELATED
S T Barnard * – 2008 270,633 18,349 6,102 98,545 24,358 417,987 4.4% (H)
– 2007 - - - - - - -
P A Glavac – 2008 320,006 137,615 8,896 93,293 39,386 599,196 23.0% (A)
– 2007 241,748 116,152 26,104 80,869 32,211 497,084 23.4% (A)
T A A Woods – 2008 380,775 45,872 13,559 93,293 38,398 571,897 8.0% (G)
– 2007 323,089 137,196 6,086 80,869 39,266 586,506 23.4% (A)
N M Badyk – 2008 324,000 91,742 6,824 93,293 35,257 551,116 16.6% (D)
– 2007 264,679 58,077 1,680 80,869 28,016 433,321 13.4% (F)
G F Sparks*** –2008 145,667 - 1,337 29,619 1,727 178,350 -
– 2007 230,280 - 20,836 62,298 20,725 334,139 -
G S Campbell –2008 459,638 183,486 4,925 375,239 39,014 1,062,302 17.3% (B)
– 2007 305,217 152,610 43,296 299,280 - 800,403 19.1% (A)
B D Stam** –2008 304,006 64,220 18,055 74,214 30,980 491,475 13.1% (F)
– 2007 184,002 22,018 16,802 93,888 16,382 333,092 6.6% (F)
A G Roderick – 2008 324,006 91,743 3,653 244,693 44,258 708,353 13.0% (D)
– 2007 277,216 58,076 7,283 277,443 35,613 655,631 8.9% (F)
S G Smith**** – 2008 - - - - - - -
– 2007 183,753 - 10,575 93,446 15,278 303,052 23.7%(A)
Total – 2008 2,528,731 633,027 63,351 1,102,189 253,378 4,580,676
Total – 2007 2,009,984 544,129 132,662 1,068,962 187,491 3,943,228
* S T Barnard commenced employment on 1 August 2007. ** B D Stam was appointed as Managing Director, Corporate Services and Government Affairs on 1 July 2007. *** G F Sparks retired on 31 July 2007. **** S G Smith retired on 30 June 2008.
Notes relating to short-term incentives
Amounts included in remuneration for the financial year represent the amount that vested in the financial year based on achievement of personal goals and satisfaction of specified performance criteria. No amounts vest in future financial years in respect of the bonus schemes for the 2008 financial year.
(A) Executives received 100% of their applicable IC (short-term incentive); (B) Executive received 80% of their applicable IC (short-term incentive); (C) Executive received 75% of their applicable IC (short-term incentive); (D) Executive received 67% of their applicable IC (short-term incentive); (E) Executive received 53% of their applicable IC (short-term incentive); (F) Executive received 50% of their applicable IC (short-term incentive); (G) Executive received 33% of their applicable IC (short-term incentive); (H) Executive received 25% of their applicable IC (short-term incentive); The amounts of ICs forfeited are due to the performance or service criteria not being met in relation to the current financial year.
For
per
sona
l use
onl
y

PAGE 31 ||Transpacific Annual Report 2008
C Service agreements
Remuneration and other terms of employment for the Executive Chairman, Chief Executive Officer and the Executives specified above are formalised in Executive Service Agreements. Each of these agreements provide for a performance-related cash IC (bonuses), other benefits including car allowances, and participation, when eligible, in the Transpacific Executive Share Option Plan. The agreements are ongoing and reviewed on a periodic basis. The Executive Chairman and Chief Executive Officers’ agreements may be terminated on six months’ notice. The other agreements may be terminated by the Company or the Executive at any time on one month notice. There are no non-statutory termination benefits provided for in the Service Agreements.
D Share-based compensation
Details on options over ordinary shares in the Company that were granted as compensation to each key management person during the reporting period and details on options that were vested during the reporting period are as follows:
NUMBER OF OPTIONS GRANTED DURING THE YEAR
NUMBER OF OPTIONS VESTED DURING THE YEAR
NUMBER OF OPTIONS LAPSED DURING THE YEAR
2008 2007 2008 2007 2008 2007
EXECUTIVE DIRECTORS
T J Coonan 300,000 200,000 216,665 166,666 - -
H W Grundell - 100,000 166,667 166,666 - -
B S Allan - 50,000 16,666 - - -
G D Mulligan - - 16,666 16,667 - -
B R Brown - - 16,666 16,667 - -
OTHER KEY MANAGEMENT PERSONNEL
S T Barnard 150,000 - 9,999 - - -
S G Smith - - 250,000 250,000 - -
P A Glavac - 100,000 166,666 166,666 - -
T A A Woods - 100,000 166,667 166,666 - -
N M Badyk - 100,000 166,667 166,666 - -
G S Campbell 250,000 200,000 133,333 50,000 - -
B D Stam - 75,000 50,000 - - -
A G Roderick - 200,000 133,333 - - -
The assessed fair value at grant date of options granted to individuals is allocated equally over the period from grant date to vesting date, and the amount is included in the remuneration tables above. Options are granted for no consideration. 75% of the options vest if total shareholder return (TPI share price increment over offer price plus dividend) totals at least 15% per annum on a cumulative basis and 25% vest if the volume weighted average price of TPI shares has outperformed the S&P/ASX200 (less financials) by 5% on a cumulative basis since the date the Company listed on the ASX.
No further options have been granted to key management subsequent to year end.
No terms of equity-settled share-based payment transactions have been altered or modified by the issuing entity during the reporting period.
For
per
sona
l use
onl
y

Transpacific Annual Report 2008 || PAGE 32
// Financial Report
Directors’ Report (continued)
Details of ordinary shares in the Company provided as a result of the exercise of remuneration options to each Director and key management personnel are set out below:
2008 2008 2007 2007
AMOUNT PAID PER SHARE
NUMBER OF SHARES
AMOUNT PAID PER SHARE
NUMBER OF SHARES
EXECUTIVE DIRECTORS
T J Coonan $2.40 199,999 $2.40 166,666
T J Coonan $8.81 16,666 - -
H W Grundell $2.40 166,666 $2.40 166,666
H L Wilson $2.40 333,333 $2.40 333,333
OTHER KEY MANAGEMENT PERSONNEL
P A Glavac $2.40 166,666 $2.40 166,666
T A A Woods $2.40 166,667 $2.40 166,666
N M Badyk $2.40 166,667 $2.40 166,666
G S Campbell - - $4.26 50,000
No amounts are unpaid on any shares issued on the exercise of options.
Details of the vesting profile of the options granted as remuneration to each Director of the Company and each of the key management Executives of the Group are set out below. No options will vest if performance conditions detailed earlier are not satisfied, hence the minimum value of the option to vest is nil. The maximum value of the options yet to vest has been determined as the fair value amount of the options at grant date that is yet to be expensed.
VALUE OF OPTIONS AS
PROPORTION OF REMUN-
ERATION %
FINANCIAL YEAR
GRANTED NUMBER
VESTED IN 2008
%
LAPSED IN 2008
%
FINANCIAL YEARS IN
WHICH OPTIONS
VEST
MINIMUM TOTAL
VALUE YET TO VEST
$
MAXIMUM TOTAL
VALUE YET TO VEST
$
EXECUTIVE DIRECTORS
T E Peabody - - - - - - -
T J Coonan 23.8 2005 500,000 67 - A - 4,083
2007 200,000 - - C - 203,600
2008 200,000 - - D - 138,380
2008 100,000 50 - B - 11,029
H W Grundell 10.6 2005 500,000 67 - A - 4,083
2007 100,000 - - C - 101,756
NON-EXECUTIVE DIRECTORS
B R Brown 4.3 2005 50,000 67 - A - 409
G D Mulligan 4.3 2005 50,000 67 - A - 409
B S Allan 26.4 2007 50,000 33 - B - 12,370
KEY MANAGEMENT PERSONNEL
S T Barnard 22.6 2008 30,000 33 - B - 6,998
2008 20,000 - - C - 12,735
2008 100,000 - - D - 73,482
For
per
sona
l use
onl
y

PAGE 33 ||Transpacific Annual Report 2008
VALUE OF OPTIONS AS
PROPORTION OF REMUN-
ERATION %
YEAR GRANTED NUMBER
VESTED %
FORFEITED %
FINANCIAL YEARS IN
WHICH OPTIONS
VEST
MINIMUM TOTAL
VALUE YET TO VEST
$
MAXIMUM TOTAL
VALUE YET TO VEST
$
KEY MANAGEMENT PERSONNEL
P A Glavac 15.6 2005 500,000 67 - A - 4,085
2007 100,000 - - C - 101,800
T A A Woods 18.1 2005 500,000 67 - A - 4,085
2007 100,000 - - C - 101,800
N M Badyk 16.9 2005 500,000 67 - A - 4,085
2007 100,000 C 101,800
G S Campbell 22.7 2006 150,000 67 - A - 1,440
2006 150,000 33 - B - 47,175
2007 100,000 - - C - 21,140
2007 100,000 - - D - 101,800
2008 100,000 - - C - 101,800
2008 150,000 - - D - 103,785
B D Stam 19.9 2006 75,000 33 - B - 23,588
2007 75,000 - - C - 16,200
A G Roderick 34.5 2006 150,000 33 - B - 24,000
2006 150,000 33 - B - 47,175
2007 100,000 - - C - 21,140
2007 100,000 - - D - 69,190
A – Options vest in equal tranches over three years commencing financial year beginning 1 July 2006.
B – Options vest in equal tranches over three years commencing financial year beginning 1 July 2007.
C – Options vest in equal tranches over two years commencing financial year beginning 1 July 2009.
D – Options vest in equal tranches over three years commencing financial year beginning 1 July 2008.
Shares Under Option
At the date of this report unissued ordinary shares of the Company under option are:
DATE OPTIONS GRANTED EXPIRY DATE EXERCISE PRICE
$
NUMBER UNDER
OPTION
3 May 2005 – Non-Executive Directors and Executives *
31 July 2009 2.40 1,204,004
3 May 2005 – Brenzil Pty Ltd 31 July 2009 2.76 to 3.65 6,950,000
8 November 2005 – Executives 31 July 2009 4.26 100,000
17 February 2006 – Executives 31 July 2010 5.40 333,334
24 April 2006 – Executives 31 July 2010 8.53 708,334
13 September 2006 - Executives 31 July 2010 7.25 720,001
20 September 2006 - Executives 31 July 2010 7.28 283,333
23 October 2006 - Executives 31 July 2010 8.20 40,000
10 November 2006 - Executives 31 July 2010 8.09 50,000
14 December 2006 - Executives 31 July 2010 8.81 53,334
12 March 2007 - Executives 31 July 2010 9.98 1,295,000
For
per
sona
l use
onl
y
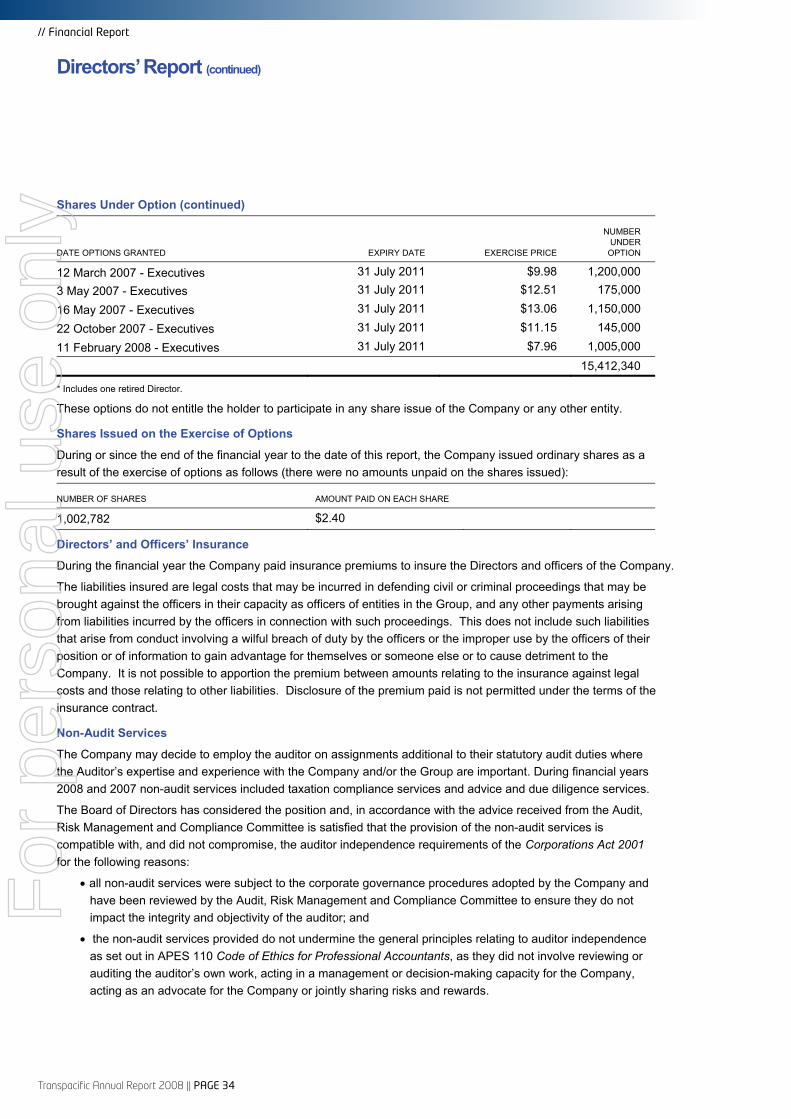
Transpacific Annual Report 2008 || PAGE 34
// Financial Report
Directors’ Report (continued)
Shares Under Option (continued)
DATE OPTIONS GRANTED EXPIRY DATE EXERCISE PRICE
NUMBER UNDER
OPTION
12 March 2007 - Executives 31 July 2011 $9.98 1,200,000 3 May 2007 - Executives 31 July 2011 $12.51 175,000
16 May 2007 - Executives 31 July 2011 $13.06 1,150,000
22 October 2007 - Executives 31 July 2011 $11.15 145,000
11 February 2008 - Executives 31 July 2011 $7.96 1,005,000
15,412,340
* Includes one retired Director.
These options do not entitle the holder to participate in any share issue of the Company or any other entity.
Shares Issued on the Exercise of Options
During or since the end of the financial year to the date of this report, the Company issued ordinary shares as a result of the exercise of options as follows (there were no amounts unpaid on the shares issued):
NUMBER OF SHARES AMOUNT PAID ON EACH SHARE
1,002,782 $2.40
Directors’ and Officers’ Insurance
During the financial year the Company paid insurance premiums to insure the Directors and officers of the Company.
The liabilities insured are legal costs that may be incurred in defending civil or criminal proceedings that may be brought against the officers in their capacity as officers of entities in the Group, and any other payments arising from liabilities incurred by the officers in connection with such proceedings. This does not include such liabilities that arise from conduct involving a wilful breach of duty by the officers or the improper use by the officers of their position or of information to gain advantage for themselves or someone else or to cause detriment to the Company. It is not possible to apportion the premium between amounts relating to the insurance against legal costs and those relating to other liabilities. Disclosure of the premium paid is not permitted under the terms of the insurance contract.
Non-Audit Services
The Company may decide to employ the auditor on assignments additional to their statutory audit duties where the Auditor’s expertise and experience with the Company and/or the Group are important. During financial years 2008 and 2007 non-audit services included taxation compliance services and advice and due diligence services.
The Board of Directors has considered the position and, in accordance with the advice received from the Audit, Risk Management and Compliance Committee is satisfied that the provision of the non-audit services is compatible with, and did not compromise, the auditor independence requirements of the Corporations Act 2001 for the following reasons:
all non-audit services were subject to the corporate governance procedures adopted by the Company and have been reviewed by the Audit, Risk Management and Compliance Committee to ensure they do not impact the integrity and objectivity of the auditor; and
the non-audit services provided do not undermine the general principles relating to auditor independence as set out in APES 110 Code of Ethics for Professional Accountants, as they did not involve reviewing or auditing the auditor’s own work, acting in a management or decision-making capacity for the Company, acting as an advocate for the Company or jointly sharing risks and rewards.
For
per
sona
l use
onl
y
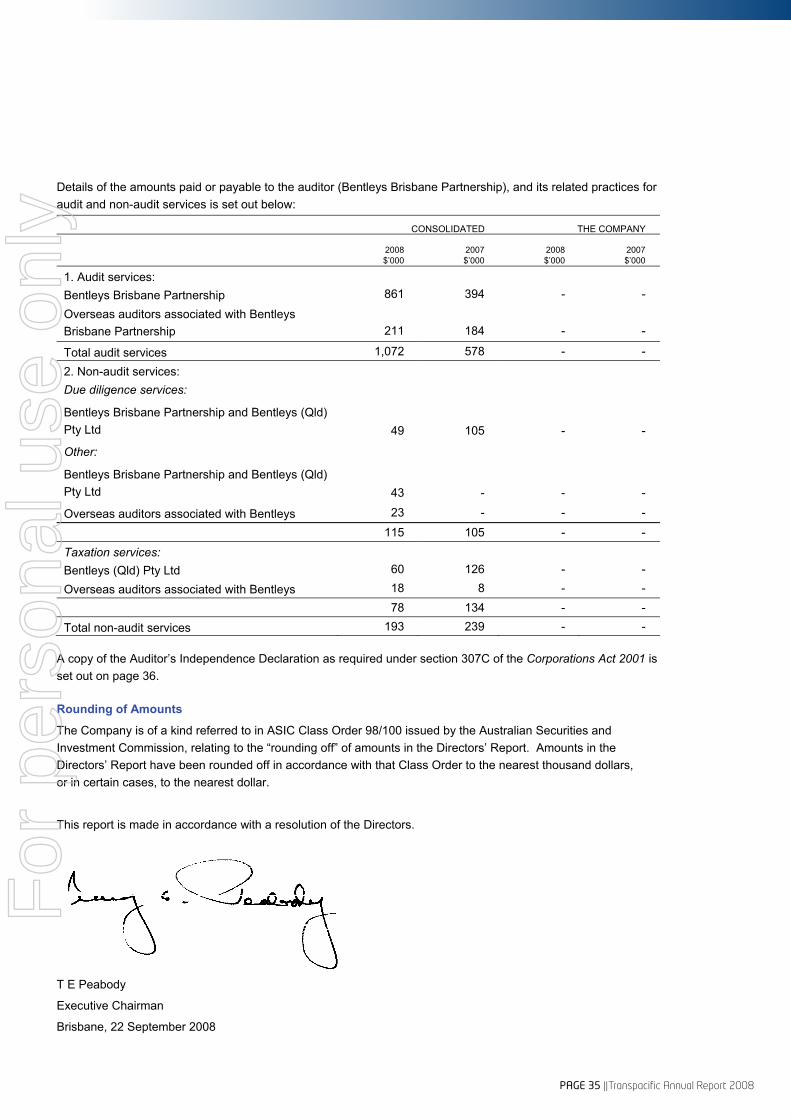
PAGE 35 ||Transpacific Annual Report 2008
Details of the amounts paid or payable to the auditor (Bentleys Brisbane Partnership), and its related practices for audit and non-audit services is set out below:
CONSOLIDATED THE COMPANY
2008 $’000
2007 $’000
2008 $’000
2007 $’000
1. Audit services: Bentleys Brisbane Partnership 861 394 - -
Overseas auditors associated with Bentleys Brisbane Partnership 211 184 - -
Total audit services 1,072 578 - -
2. Non-audit services: Due diligence services:
Bentleys Brisbane Partnership and Bentleys (Qld) Pty Ltd 49 105 - -
Other:
Bentleys Brisbane Partnership and Bentleys (Qld) Pty Ltd 43 - - -
Overseas auditors associated with Bentleys 23 - - -
115 105 - -
Taxation services: Bentleys (Qld) Pty Ltd 60 126 - -
Overseas auditors associated with Bentleys 18 8 - -
78 134 - -
Total non-audit services 193 239 - -
A copy of the Auditor’s Independence Declaration as required under section 307C of the Corporations Act 2001 is set out on page 36.
Rounding of Amounts
The Company is of a kind referred to in ASIC Class Order 98/100 issued by the Australian Securities and Investment Commission, relating to the “rounding off” of amounts in the Directors’ Report. Amounts in the Directors’ Report have been rounded off in accordance with that Class Order to the nearest thousand dollars, or in certain cases, to the nearest dollar.
This report is made in accordance with a resolution of the Directors.
T E Peabody
Executive Chairman
Brisbane, 22 September 2008
For
per
sona
l use
onl
y

Transpacific Annual Report 2008 || PAGE 36
// Financial Report
// Lead Auditor’s Independence Declaration under section 307c of the Corporations Act 2001 to the
Directors of Transpacific Industries Group Limited
For
per
sona
l use
onl
y

PAGE 37 ||Transpacific Annual Report 2008
Income Statement For the Financial Year Ended 30 June 2008
CONSOLIDATED THE COMPANY
NOTES 2008$’000
2007$’000
2008 $’000
2007 $’000
CONTINUING OPERATIONS Revenue 4 2,191,971 1,287,918 205,856 109,801
Cost of sales (799,065) (568,022) - -
Gross profit 1,392,906 719,896 205,856 109,801 Other income 5 4,737 7,113 4,382 -
Employee expenses (551,748) (261,824) (3,516) (3,354)
Depreciation and amortisation expenses (123,104) (70,143) (4,020) -
Finance costs 6 (186,319) (98,435) (153,222) (50,958)
Repairs and maintenance (89,465) (41,557) - -
Fuel purchases (66,537) (24,957) - -
Leasing charges (38,047) (14,258) - -
Freight costs (17,157) (13,314) - -
Other expenses (88,033) (58,649) (768) (852)
Results from operating activities 237,233 143,872 48,712 54,637 Share of net profits of associates accounted for using the equity method 24c 2,632 4,241 - -
Profit before income tax 239,865 148,113 48,712 54,637
Income tax expense 7 (44,298) (33,811) (47,907) (29,850)
Profit from continuing operations 195,567 114,302 805 24,787
Net profit attributable to minority interests (2,291) (897) - -
Profit attributable to equity holders 193,276 113,405 805 24,787
Distribution to step up preference securityholders (18,025) (10,350) - -
Profit attributable to ordinary equity holders of the parent 175,251 103,055 805 24,787
Earnings per share for profit attributable to the ordinary equity holders of the Company:
Basic earnings per share 32 61.8 44.1
Diluted earnings per share 32 58.4 41.4
The above income statement should be read in conjunction with the accompanying Notes.
For
per
sona
l use
onl
y

Transpacific Annual Report 2008 || PAGE 38
// Financial Report
Statement of Recognised Income and Expense For the Financial Year Ended 30 June 2008
CONSOLIDATED THE COMPANY
NOTES 2008 $’000
2007 $’000
2008 $’000
2007 $’000
Cash flow hedges Gain/(loss) taken to equity 22 12,640 (253) 9,357 4,888
Translation of foreign operations
Exchange differences taken to equity 22 (90,672) 44,480 - -
Revaluation of assets
Asset revaluation taken to equity 22 28,825 - - - Net (loss)/income recognised directly in equity (49,207) 44,227 9,357 4,888 Profit for the period 195,567 114,302 805 24,787
Total recognised income and expense for the period 146,360 158,529 10,162 29,675
Attributable to:
Equity holders of the parent 144,069 157,632 10,162 29,675
Minority interest 2,291 897 - -
Total recognised income and expense for the period 146,360 158,529 10,162 29,675
Other movements in equity arising from transactions with owners as owners are set out in Note 22.
The above statement of recognised income and expense should be read in conjunction with the accompanying Notes.
For
per
sona
l use
onl
y
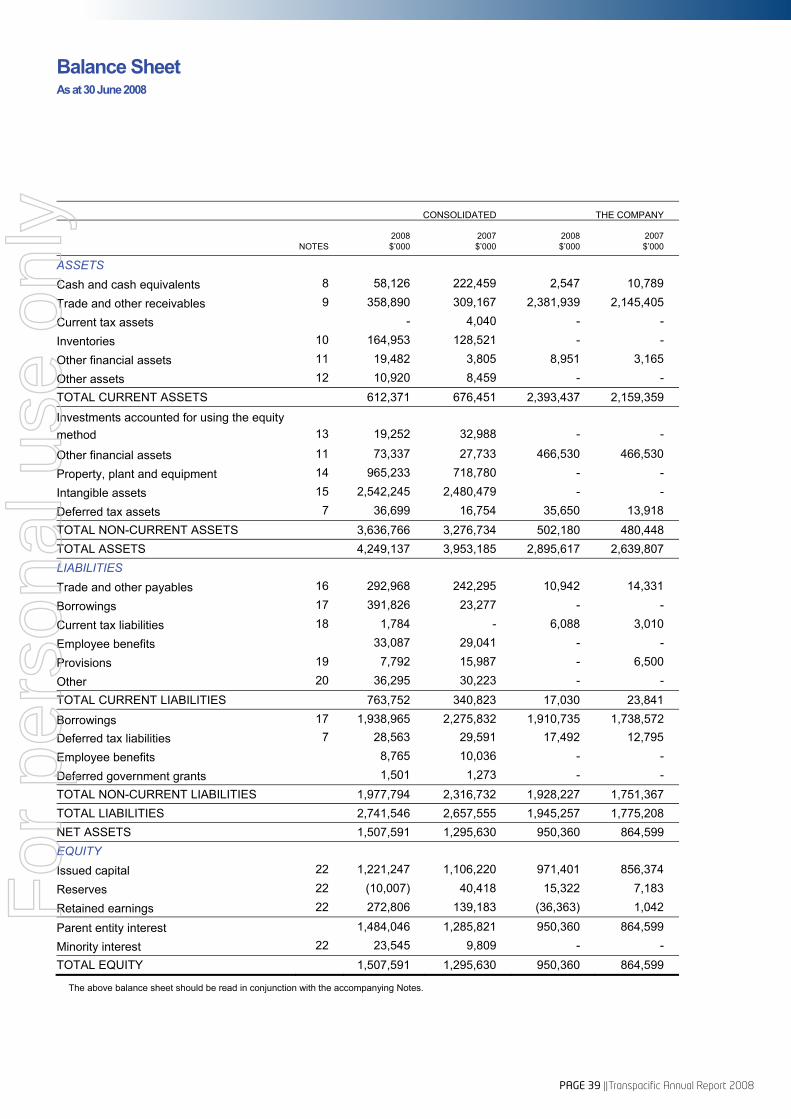
PAGE 39 ||Transpacific Annual Report 2008
Balance Sheet As at 30 June 2008
CONSOLIDATED THE COMPANY
NOTES 2008 $’000
2007 $’000
2008 $’000
2007 $’000
ASSETS Cash and cash equivalents 8 58,126 222,459 2,547 10,789
Trade and other receivables 9 358,890 309,167 2,381,939 2,145,405
Current tax assets - 4,040 - -
Inventories 10 164,953 128,521 - -
Other financial assets 11 19,482 3,805 8,951 3,165
Other assets 12 10,920 8,459 - - TOTAL CURRENT ASSETS 612,371 676,451 2,393,437 2,159,359
Investments accounted for using the equity method 13 19,252 32,988 - -
Other financial assets 11 73,337 27,733 466,530 466,530
Property, plant and equipment 14 965,233 718,780 - -
Intangible assets 15 2,542,245 2,480,479 - -
Deferred tax assets 7 36,699 16,754 35,650 13,918 TOTAL NON-CURRENT ASSETS 3,636,766 3,276,734 502,180 480,448 TOTAL ASSETS 4,249,137 3,953,185 2,895,617 2,639,807 LIABILITIES Trade and other payables 16 292,968 242,295 10,942 14,331
Borrowings 17 391,826 23,277 - -
Current tax liabilities 18 1,784 - 6,088 3,010
Employee benefits 33,087 29,041 - -
Provisions 19 7,792 15,987 - 6,500
Other 20 36,295 30,223 - - TOTAL CURRENT LIABILITIES 763,752 340,823 17,030 23,841
Borrowings 17 1,938,965 2,275,832 1,910,735 1,738,572 Deferred tax liabilities 7 28,563 29,591 17,492 12,795
Employee benefits 8,765 10,036 - -
Deferred government grants 1,501 1,273 - - TOTAL NON-CURRENT LIABILITIES 1,977,794 2,316,732 1,928,227 1,751,367 TOTAL LIABILITIES 2,741,546 2,657,555 1,945,257 1,775,208 NET ASSETS 1,507,591 1,295,630 950,360 864,599 EQUITY Issued capital 22 1,221,247 1,106,220 971,401 856,374
Reserves 22 (10,007) 40,418 15,322 7,183
Retained earnings 22 272,806 139,183 (36,363) 1,042
Parent entity interest 1,484,046 1,285,821 950,360 864,599
Minority interest 22 23,545 9,809 - - TOTAL EQUITY 1,507,591 1,295,630 950,360 864,599
The above balance sheet should be read in conjunction with the accompanying Notes.
For
per
sona
l use
onl
y

Transpacific Annual Report 2008 || PAGE 40
// Financial Report
Cash Flow Statement For the Financial Year Ended 30 June 2008
CONSOLIDATED THE COMPANY
NOTES 2008$’000
2007$’000
2008 $’000
2007 $’000
CASH FLOWS FROM OPERATING ACTIVITIES Receipts from customers (inclusive of GST) 2,349,331 1,322,378 - -
Payments to suppliers and employees (inclusive of GST) (1,914,251) (1,115,748) (5,786) (1,321)
Other revenue 19,564 5,841 4,382 1,203
Interest received 6,370 9,966 145,856 48,598
Interest paid (185,191) (78,662) (153,222) (34,161)
Income taxes paid (45,989) (25,423) (37,447) (15,218)NET CASH FROM/(USED IN) OPERATING ACTIVITIES 25 229,834 118,352 (46,217) (899)
CASH FLOWS FROM INVESTING ACTIVITIES Payments for purchase of equity and other investments, net of cash acquired (48,322) (2,165,846) - (357,288)
Payments for purchase of businesses (193,455) (268,309) - -
Payments for property, plant and equipment (158,554) (87,170) - -
Proceeds from disposal of property, plant and equipment 9,732 17,840 - -
NET CASH (USED IN) INVESTING ACTIVITIES (390,599) (2,503,485) - (357,288)
CASH FLOWS FROM FINANCING ACTIVITIES Proceeds from issue of equity 6,904 824,273 6,558 574,273
Payment of dividend to minority shareholders (1,514) (227) - -
Payment of dividend to pre-IPO shareholders (6,500) - (6,500) -
Dividend received from associates 3,513 - - -
Payment of step-up securities distribution (18,025) (10,350) - -
Ordinary equity dividends paid (41,628) (23,815) (41,628) (23,815)
Dividend reinvestment plan and underwrite 41,628 23,815 41,628 23,815
Net movement in trade and vendor finance - (14,842) - -
Payment of equity raising costs (464) (14,292) (464) (14,138)
Payment of debt raising costs (33,266) (8,606) (33,266) (8,606)
Repayment of bank loans (2,614,048) (1,062,974) (2,159,260) (615,500)
Proceeds from issue of convertible notes 347,500 - - -
Proceeds from bank loans 2,340,095 2,842,551 2,406,696 2,148,146
Repayment of lease liabilities (18,064) (9,799) - -
Repayment of loans by/(to) related parties (4,703) 1,431 - -
Loans made to controlled entities - - (175,789) (1,731,845)NET CASH FROM FINANCING ACTIVITIES 1,428 2,547,165 37,975 352,330
NET INCREASE IN CASH HELD (159,337) 162,032 (8,242) (5,857)Cash at the beginning of the financial year 222,459 55,336 10,789 16,646
Net foreign exchange differences (4,996) 5,091 - - CASH AT THE END OF THE FINANCIAL YEAR 8 58,126 222,459 2,547 10,789
The above cash flow statement should be read in conjunction with the accompanying Notes.
For
per
sona
l use
onl
y

PAGE 41 ||Transpacific Annual Report 2008
Notes to the Financial Statements For the Financial Year Ended 30 June 2008
1 Reporting entity
Transpacific Industries Group Ltd (the “Company”) is a listed public Company, incorporated in Australia and operating in Australia, New Zealand and South East Asia. The consolidated financial statements of the Company as at and for the financial year ended 30 June 2008 comprise the Company and its subsidiaries (together referred to as the “Group”) and the Group’s interest in associates and jointly-controlled entities.
2 Basis of preparation
The financial report is a general purpose financial report which has been prepared in accordance with the Australian Accounting Standards (including Australian Interpretations) adopted by the Australian Accounting Standards Board (AASB), the Corporations Act 2001, and complies with other requirements of the law. Australian Accounting Standards include Australian Equivalents to International Financial Reporting Standards (AIFRSs).
The consolidated financial report of the Group and the financial report of the Company comply with International Financial Reporting Standards (IFRSs) and Interpretations adopted by the International Accounting Standards Board (IASB).
The financial report was authorised for issue by the Directors on 22 September 2008.
The financial report has been prepared on the basis of historical cost, except for the revaluation of certain non-current assets and financial instruments. Cost is based on the fair values of the consideration given in exchange for assets. All amounts are presented in Australian dollars, unless otherwise noted, which is the Company’s functional currency.
The Company is of a kind referred to in ASIC Class Order 98/100 dated 10 July 1998 and in accordance with that Class Order, amounts in the financial report have been rounded off to the nearest thousand dollars, unless otherwise stated.
The preparation of financial statements in accordance with Australian International Financial Reporting Standards (AIFRS) requires management to make judgements, estimates and assumptions that affect the application of accounting policies and reported amounts of assets, liabilities, income and expenses. The estimates and associated assumptions are based on historical experience and various other factors that are believed to be reasonable under the circumstances, their results of which form the basis of making the judgements about carrying values of assets and liabilities that are not readily apparent from other sources. Actual results may differ from these estimates. These accounting policies have been consistently applied by each entity in the Group.
The estimates and underlying assumptions are reviewed on an ongoing basis. Revisions to accounting estimates are recognised in the period in which the estimate is revised and in any future periods affected.
3 Significant accounting policies
In the current year, the Group has adopted all of the new and revised Standards and Interpretations issued by the AASB that are relevant to its operations and effective for the current annual reporting period. Details of the impact of the adoption of these new accounting standards are set out in the individual accounting policy Notes set out below. The Group has also adopted the following Standards as listed below which only impacted on the Group’s financial statements with respect to disclosure.
- AASB 7 Financial Instruments: Disclosures
The Directors have elected under section 334(5) of the Corporations Act 2001 to apply AASB 8 Operating Segments, AASB 2007-3 Amendments to Australian Accounting Standards arising from AASB 8, AASB 123 Borrowing Costs, and AASB 2007-6 Amendments to Australian Accounting Standards arising from AASB 123, even though the Standards are not required to be applied until annual reporting periods beginning on or after 1 January 2009.
For
per
sona
l use
onl
y
Transpacific Annual Report 2008 || PAGE 42
// Financial Report
Notes to the Financial Statements For the Financial Year Ended 30 June 2008 (continued)
3 Significant accounting policies (continued)
AASB 123 provides that all reporting entities are required to capitalise borrowing costs directly attributable to the acquisition, construction or production of a qualifying asset rather than expensed when incurred.
The following significant accounting policies have been adopted in the preparation and presentation of the financial report.
(A) BASIS OF CONSOLIDATION
(i) Subsidiaries The consolidated financial statements incorporate the assets and liabilities of all subsidiaries of Transpacific Industries Group Ltd (“Company” or “parent entity”) as at 30 June 2008 and the results of all subsidiaries for the year then ended. Transpacific Industries Group Ltd and its subsidiaries together are referred to in this financial report as the Group.
Subsidiaries are all those entities over which the Group has the power to govern the financial and operating policies, generally accompanying a shareholding of more than one-half of voting rights. In assessing control, potential voting rights that are presently exercisable or convertible are taken into account. Subsidiaries are fully consolidated from the date on which control is transferred to the Group. They are deconsolidated from the date that control ceases. The accounting policies of subsidiaries have been changed when necessary to align them with the policies adopted by the Group.
The Group applies a policy of treating transactions with minority interests as transactions with parties external to the Group. Disposals to minority interests result in gains and losses for the Group that are recorded in the income statement. Purchases from minority interests result in goodwill, being the difference between any consideration paid and the relevant share acquired of the carrying value of identifiable net assets of the subsidiary.
Inter-company transactions, balances and unrealised gains on transactions between Group companies are eliminated. Unrealised losses are also eliminated unless the transaction provides evidence of the impairment of the asset transferred.
Minority interests in the results and equity of subsidiaries are shown separately in the Consolidated Income Statement and Balance Sheet respectively.
Investments in subsidiaries are carried at their cost of acquisition in the Company’s financial statements.
(ii) Associates Associates are all entities over which the Group has significant influence but not control, over the financial and operating policies. Investments in associates are accounted for in the consolidated financial statements using the equity method of accounting, after initially being recognised at cost.
The Group’s share of its associates’ post-acquisition profits or losses is recognised in the income statement, and its share of post-acquisition movements in reserves is recognised in reserves. The cumulative post-acquisition movements are adjusted against the carrying amount of the investment.
Where the Group’s share of losses in an associate equals or exceeds its interest in the associate, including any other unsecured long-term receivables, the Group does not recognise further losses, unless it has incurred obligations or made payments on behalf of the associate.
Unrealised gains on transactions with associates are eliminated to the extent of the Group’s interest in the associates. Unrealised losses are also eliminated unless the transaction provides evidence of an impairment of the asset transferred. Accounting policies have been changed where necessary to ensure consistency with the policies adopted by the Group.
For
per
sona
l use
onl
y

PAGE 43 ||Transpacific Annual Report 2008
(B) BUSINESS COMBINATIONS The purchase method of accounting is used to account for all business combinations, regardless of whether equity instruments or other assets are acquired. Cost is measured as the fair value of the assets given, equity instruments issued or liabilities incurred or assumed at the date of exchange plus costs directly attributable to the acquisition. Where equity instruments are issued in an acquisition, the fair value of the instruments is the published market price as at the date of exchange. Transaction costs arising on the issue of equity instruments are recognised directly in equity.
Identifiable assets acquired and liabilities and contingent liabilities assumed in a business combination are measured initially at their fair values at the acquisition date, irrespective of the extent of any minority interest. The excess of the cost of the acquisition over the fair value of the Group’s share of the identifiable net assets acquired is recorded as goodwill (refer to Note 3(L). If the cost of the acquisition is less than the Group’s share of the fair value of the identifiable net assets of the subsidiary acquired, the difference is recognised directly in the income statement, but only after a reassessment of the identification and measurement of the net assets acquired.
(C) INCOME TAX The income tax expense or revenue for the period is the tax payable on the current period’s taxable income based on the national income tax rate for each jurisdiction adjusted by changes in deferred tax assets and liabilities attributable to temporary differences and to used tax losses.
Deferred income tax is provided in full, using the liability method, on temporary differences arising between the tax bases of assets and liabilities and their carrying amounts in the consolidated financial statements. However, the deferred income tax is not accounted for if it arises from initial recognition of an asset or liability in a transaction other than a business combination that at the time of the transaction affects neither accounting nor taxable profit or loss. Deferred income tax is determined using tax rates (and laws) that have been enacted or substantially enacted by the balance sheet date and are expected to apply when the related deferred income asset is realised or the deferred income tax liability is settled.
Deferred tax assets are recognised for deductible temporary differences and unused tax losses only if it is probable that future taxable amounts will be available to utilise those temporary differences and losses.
Deferred tax liabilities and assets are not recognised for temporary differences between the carrying amount and tax bases of investments in controlled entities where the parent entity is able to control the timing of the reversal of the temporary differences and it is probable that the differences will not reverse in the foreseeable future.
Deferred tax assets and liabilities are offset where there is a legally enforceable right to offset current tax assets and liabilities and they relate to income taxes levied by the same taxation authority on the same taxable entity, or on different tax entities, but they intend to settle current tax liabilities and assets on a new basis or their tax assets and liabilities will be realised simultaneously.
Current and deferred tax balances attributable to amounts recognised directly in equity are also recognised directly in equity.
Tax consolidation legislation
The Company and all its wholly-owned Australian resident entities are part of a tax-consolidated group under Australian taxation law. Transpacific Industries Group Ltd is the head entity in the tax consolidation group, and as a consequence recognises current and deferred tax amounts relating to transactions, events and balances of the wholly-owned Australian controlled entities in this group as if those transactions, events and balances were its own, in addition to the current and deferred tax amounts arising in relation to its own transactions, events and balances. The tax-consolidated group has not entered into a tax sharing agreement.
For
per
sona
l use
onl
y

Transpacific Annual Report 2008 || PAGE 44
// Financial Report
Notes to the Financial Statements For the Financial Year Ended 30 June 2008 (continued)
(D) FOREIGN CURRENCY
(i) Foreign currency transactions and balances Foreign currency transactions are translated at the foreign exchange rate ruling at the date of the transaction. Monetary assets and liabilities denominated in foreign currencies at the balance sheet date are translated to Australian dollars at the foreign exchange rate ruling at that date. Foreign exchange differences arising on translation are recognised in the income statement and are reported on a net basis. Non-monetary assets and liabilities that are measured in terms of historical cost in a foreign currency are translated using the exchange rate at the date of the transaction. Non-monetary assets and liabilities denominated in foreign currencies that are stated at fair value are translated to Australian dollars at foreign exchange rates ruling at the dates the fair value was determined.
(ii) Financial statements of foreign operations The assets and liabilities of foreign operations, including goodwill and fair value adjustments arising on consolidation, are translated to Australian dollars at foreign exchange rates ruling at the balance sheet date. The revenues and expenses of foreign operations, excluding foreign operations in hyperinflationary economies, are translated to Australian dollars at rates approximating to the foreign exchange rates ruling at the dates of the transactions. The revenues and expenses of foreign operations in hyperinflationary economies are translated to Australian dollars at the foreign exchange rates ruling at the balance sheet date. Foreign exchange differences arising on retranslation are recognised directly in a separate component of equity. Foreign exchange gains and losses arising from a monetary item receivable from or payable to a foreign operation, the settlement of which is neither planned nor likely in the foreseeable future, are considered to form part of a net investment in a foreign operation and are recognised directly in equity.
(iii) Net investment in foreign operations On consolidation, exchange differences arising from the translation of any net investment in foreign entities and of borrowings and other financial instruments designated as hedges of such investments, are taken to shareholders’ equity. When a foreign operation is sold or any borrowings forming part of the net investment are repaid, a proportionate share of such exchange differences are recognised in the income statement, as part of the gain or loss on sale where applicable.
Goodwill and fair value adjustments arising on the acquisition of a foreign entity are treated as assets and liabilities of the foreign entities and translated at the closing rate.
(E) DERIVATIVE FINANCIAL INSTRUMENTS The Group enters into a variety of derivative financial instruments to manage its exposure to foreign exchange and interest rate risk, including forward foreign exchange contracts and interest rate swaps. Derivatives are initially recognised at fair value on the date a derivative contract is entered into and are subsequently remeasured to their fair value at each reporting date. The gain or loss on remeasurement to fair value is recognised immediately in profit or loss. However, where the derivatives qualify for hedge accounting, recognition of any resultant gain or loss depends on the nature of the item being hedged. The fair value of interest rate swaps is the estimated amount that the Group would receive or pay to terminate the swap at the balance date, taking into account current interest rates and the current creditworthiness of the swap counterparties. The fair value of forward foreign exchange contracts is their quoted market price at the balance sheet date, being the present value of the quoted forward price. On entering into a hedging relationship, the Group designates certain derivatives as either hedges of the fair value of recognised assets or liabilities or firm commitments (fair value hedges), hedges of highly probable forecast transactions (cash flow hedges), or hedges of net investments in foreign operations.
For
per
sona
l use
onl
y

PAGE 45 ||Transpacific Annual Report 2008
(E) DERIVATIVE FINANCIAL INSTRUMENTS (CONTINUED)
(i) Fair value hedge Changes in the fair value of derivatives that are designated and qualify as fair value hedges are recorded in profit or loss immediately, together with any changes in the fair value of the hedged asset or liability that is attributable to the hedged risk. If the hedge no longer meets the criteria for hedge accounting, the adjustment to the carrying amount of a hedge item for which the effective interest method is used is amortised to profit or loss over the period to maturity using a recalculated effective interest rate.
(ii) Cash flow hedge The effective portion of changes in the fair value of derivatives that are designated and qualify as cash flow hedges is recognised in equity in the hedging reserve. The gain or loss relating to the ineffective portion is recognised immediately in profit or loss. Amounts accumulated in equity are recycled in profit or loss in the periods when the hedged item affects profit or loss. However, when the forecast transaction that is hedged results in the recognition of a non-financial asset or liability, the gains and losses previously deferred in equity are transferred from equity and included in the initial measurement of the cost of the asset or liability.
When the hedging instrument expires or is sold, or terminated, or when a hedge no longer qualifies for hedge accounting, any cumulative gain or loss existing in equity at that time remains in equity and is recognised when the forecast transaction is ultimately recognised in profit or loss. When a forecast transaction is no longer expected to occur, the cumulative gain or loss that was reported in equity is recognised immediately in profit or loss.
(iii) Net investment hedge Hedges of net investments in foreign operations are accounted for similarly to cash flow hedges. Any gain or loss on the hedging instrument relating to the effective portion of the hedge is recognised in the foreign currency translation reserve, the gain or loss relating to the ineffective portion is recognised immediately in profit or loss. Gains and losses deferred in the foreign currency translation reserve are recognised immediately in profit or loss when the foreign operation is disposed of.
(iv) Compound financial instruments The component parts of compound instruments are classified separately as financial liabilities and equity in accordance with the substance of the contractual arrangement. At the date of issue, the fair value of the liability component is estimated using the prevailing market interest rate for a similar non-convertible instrument. This amount is recorded as a liability on an amortised cost basis until extinguished on conversion or upon the instruments reaching maturity. The equity component initially brought to account is determined by deducting the amount of the liability component from the fair value of the compound instrument as a whole. This is recognised and included in equity, net of income tax effects and is not subsequently remeasured.
(v) Derivatives that do not qualify for hedge accounting Certain derivative instruments do not qualify for hedge accounting. Changes in the fair value of any derivative instruments that do not qualify for hedge accounting are recognised immediately in profit or loss. F
or p
erso
nal u
se o
nly

Transpacific Annual Report 2008 || PAGE 46
// Financial Report
Notes to the Financial Statements For the Financial Year Ended 30 June 2008 (continued)
(F) REVENUE Amounts disclosed as revenue are net of returns, trade allowances and duties and taxes paid. Revenue from the sale of goods is recognised when the significant risks and rewards of ownership of the goods have passed to the buyer and can be measured reliably. Risks and rewards are considered passed to the buyer at the time of delivery of goods to customers. Revenue from the rendering of services is recognised upon delivery of services to the customer. Revenue is recognised for the major business activities as follows:
(i) Liquid waste and biosolids Revenue from the collection and treatment of liquid waste is recognised after the waste has been collected and treated and the related costs incurred.
(ii) Energy Revenue is recognised on the sale of oil and by-products to customers.
(iii) Industrial solutions Contract revenue is measured by reference to labour hours incurred to date and actual costs incurred. Other revenue is recognised upon the delivery of goods or services to customers.
(iv) Commercial vehicles Revenue from the sale of goods is recognised when the significant risks and rewards of ownership of the goods have passed to the buyer and can be measured reliably. Risks and rewards are considered passed to the buyer at the time of delivery of goods to customers.
(v) Solid waste Revenue is recognised when the service has been provided to customers.
(vi) Manufacturing Revenue from the sale of goods is recognised when the significant risks and rewards of ownership of the goods have passed to the buyer and can be measured reliably. Risks and rewards are considered passed to the buyer at the time of delivery of goods to customers.
(vii) Interest Interest revenue is recognised on an accruals basis taking into account the interest rates applicable to the financial assets.
(viii) Dividends
Dividend revenue is recognised when the right to receive a dividend has been established. Dividends received from associates are accounted for in accordance with the equity method of accounting.
(ix) Government grants Grants from the government are recognised at their fair value when there is a reasonable assurance that the grant will be received and the Group will comply with all attached conditions. Grants relating to costs are deferred and recognised in the income statement over the period necessary to match them with the costs that they are intended to compensate. Grants relating to the purchase of property, plant and equipment are included in liabilities as deferred income and are credited to the income statement on a straight-line basis over the expected lives of the related assets.
(x) Other revenue Other revenue is recognised when the right to receive the revenue has been established.
(G) TRADE AND OTHER RECEIVABLES All trade debtors are recognised and carried at original invoice amount as they are due for settlement no more than 30 days from the date of invoice. On special occasions some divisions may give extended terms. Collectibility of trade debtors is reviewed on an ongoing basis. Debts which are known to be uncollectible are written off. A provision for impairment is raised when collection of the full amount is no longer probable (shown in Note 31(F)).
For
per
sona
l use
onl
y
PAGE 47 ||Transpacific Annual Report 2008
(H) INVENTORIES Inventories are valued at the lower of cost and net realisable value. The cost of inventories is based on the method most appropriate to each particular class of inventory and includes expenditure incurred in acquiring the inventories, production or conversion costs and other costs incurred in bringing them to their existing location and condition. In the case of manufactured inventories and work in progress, cost includes an appropriate share of production overheads based on normal operating capacity. The cost of inventory may also include transfers from equity of any gain or loss on qualifying cash flow hedges of foreign currency purchases of inventory. Commercial vehicles are valued at actual cost, with the remainder of inventory valued at standard cost.
(I) IMPAIRMENT OF ASSETS A financial asset is assessed at each reporting date to determine whether there is any objective evidence that it is impaired. Goodwill and intangible assets that have an indefinite useful life are not subject to amortisation and are tested annually for impairment, or more frequently if events or changes in circumstances indicate that they might be impaired. Other assets are reviewed for impairment whenever events or changes in circumstances indicate that the carrying amount may not be recoverable. An impairment loss is recognised for the amount by which the asset’s carrying amount exceeds its recoverable amount. The recoverable amount is the higher of an asset’s fair value less costs to sell and value in use. For the purposes of assessing impairment, assets are grouped at the lowest levels for which there are separately identifiable cash inflows which are largely independent of the cash inflows from other assets or groups of assets (cash generating units). The goodwill acquired in a business combination, for the purpose of impairment testing, is allocated to cash generating units that are expected to benefit from the synergies of the combination. Non-financial assets other than goodwill that suffer an impairment loss are reviewed for reversal of the impairment loss at each subsequent reporting date.
(J) PROPERTY, PLANT AND EQUIPMENT Landfills, cell development and provision for remediation
(i) Landfills
The Group owns landfill assets. A landfill may be: (a) developed by the Group or (b) purchased by the Group.
The cost of developing a landfill includes the cost of land, permitting and overall site and infrastructure development to bring the asset to its condition necessary for its intended use, that is, to receive and dispose of waste. If the landfill is purchased, then an additional intangible (landfill airspace) cost may be recognised.
The value composition of a landfill changes over time. Initially a landfill’s value is more of an intangible asset including location, permitting and airspace which generates future earnings. As airspace is consumed and landfilling continues to completion, the landfill’s value shifts to a tangible asset, being the value of the land.
In recognition of this occurrence, it is the Group’s policy at time of development or acquisition and reporting dates to:
(a) capitalise the cost of a developed landfill to landfills; (b) capitalise the cost of purchased landfills to intangibles (Landfill Airspace) and landfills based on a
split of the intangible and tangible value paid for the landfill; (c) assess impairment of each landfill asset or group of landfill assets which work together as a unit by
reference to both intangible and tangible values. If the asset is impaired an impairment loss is recorded:
(d) measure the intangible value by reference to remaining available airspace and the future earnings it will generate;
(e) measure the tangible land value by reference to an independent valuation (carried out periodically every three years); and
(f) transfer the consumption of landfill airspace to landfills, over the life of the landfill in conjunction with the measurement of intangible value in point (d) above.
For
per
sona
l use
onl
y

Transpacific Annual Report 2008 || PAGE 48
// Financial Report
Notes to the Financial Statements For the Financial Year Ended 30 June 2008 (continued)
(J) PROPERTY, PLANT AND EQUIPMENT (CONTINUED) The portion of landfill airspace transferred from intangible assets to tangible assets in a reporting period is calculated as the tonnes of airspace consumed in the reporting period divided into the tonnes of airspace available at the beginning of the reporting period.
Discounted cash flows are used to test impairment (refer Note 3(I)). Landfill assets are carried at Directors’ valuation in the accounts which is based on cost adjusted for the amortisation of any landfill airspace and is less than independent valuation. (ii) Cell development A landfill will normally be divided into parts, with each part (a cell) being developed one at a time to receive waste. When a cell is nearly full, a new cell is developed in readiness to receive waste from the time the former cell closes. The closed cell is then capped and may return a revenue stream, such as from the sale of landfill gas, to the Group for years to come. The cost of cell development includes earthworks, gas capture infrastructure and cell lining to bring the asset to its condition necessary for its intended use, that is, to receive and dispose of waste and generate revenue streams. Cell development costs also include the cost of capping on closure of the cell. Expenditure on cell development may be incurred in one reporting period but the airspace in the cell may last for more than that reporting period.
In recognition of the above, it is the Group’s policy at time of cell development and reporting dates to:
(a) capitalise the cost of cell development in landfill assets; (b) amortise the cost of cell development over the useful life of the cell; and (c) recognise income streams in the reporting period earned.
The amortisation charge for a reporting period is calculated by the tonnes of airspace consumed during the reporting period divided into the total airspace available at the beginning of the reporting period. Future landfill site restoration and aftercare costs capitalised are depreciated at rates that match the pattern of benefits expected to be derived from use of the respective sites.
(iii) Landfill closure and provision for remediation
A landfill is deemed full when its permitted airspace is consumed and it cannot legally accept any more waste. Alternatively, a landfill may be deemed full earlier should other factors exist, for example, if it is not economically viable to continue accepting waste. At that point:
(a) the value of the landfill has fully shifted to tangible land asset and there is no intangible asset remaining; and
(b) the cost of cell development is fully amortised to nil.
Generally, a landfill must be maintained and left in a condition specified by the Environmental Protection Authority or government authorities. Therefore, remediation occurs on an ongoing basis, at the time the landfill closes and also post closure. The Group has a site remediation division so the cost of remediation can be controlled. Certain landfills will also have revenue streams from, for example, the supply of landfill gas into electricity grids for many years.
In recognition of the above, it is the Group’s policy at the time of development and reporting dates to :
(a) in the case of developing a landfill, provide for the expected remediation at time of development;
(b) in the case of purchasing a landfill, account for the acquisition in accordance with AASB 3 Business Combinations at the time of acquisition;
(c) request environmental scientists to calculate the expected cost of remediation for each landfill asset or group of landfill assets working together as a unit taking into account future revenue streams; and
(d) assess the adequacy of the provision for remediation against (c) at each reporting date and either confirm its adequacy or increase or decrease the provision to the landfill asset or profit and loss account as required and account for the cost of remediation against the provision.
For
per
sona
l use
onl
y

PAGE 49 ||Transpacific Annual Report 2008
(J) PROPERTY, PLANT AND EQUIPMENT (CONTINUED)
Future landfill site restoration and aftercare costs provided for are initially capitalised in the balance sheet. Any change in the provision for future landfill site restoration and aftercare costs arising from a change in estimate of those costs is also recognised in non-current assets in the balance sheet.
The provision is stated at the present value of the future cash outflows expected to be incurred, which increases each period due to the passage of time. The annual change in the net present value of the provision due to the passage of time is recognised in the income statement as a time value adjustment.
(iv) Landfill sales
A landfill may be disposed of as an operating landfill or it may be retained until post closure and then sold.
In accordance with the above, it is the Group’s policy at time of sale and reporting periods to:
(a) if the landfill is sold as an operating landfill, recognise the profit on sale of an asset; or
(b) if the landfill is intended to be sold in the future, transfer the landfill balance to non-current assets held for sale.
Other property, plant and equipment
Land and buildings are shown at fair value, based on periodic, but at least triennial, valuations by external independent valuers, less subsequent depreciation for buildings. The fair values are recognised in the financial statements of the Group, and are reviewed at the end of each reporting period to ensure that the carrying value of land and buildings is not materially different from their fair values.
Any revaluation increase arising on the revaluation of land and buildings is credited to the asset revaluation reserve, except to the extent that it reverses a revaluation decrease for the same asset previously recognised as an expense in profit or loss, in which case the increase is credited to the income statement to the extent of the decrease previously charged. A decrease in carrying amount arising on the revaluation of land and buildings is charged as an expense in profit or loss to the extent that it exceeds the balance, if any, held in the asset revaluation reserve relating to a previous revaluation of that asset.
Depreciation on revalued buildings is charged to profit or loss. On the subsequent sale or retirement of a revalued property, the attributable revaluation surplus remaining in the asset revaluation reserve, net of any related deferred taxes, is transferred directly to retained earnings.
Plant and equipment, and equipment under finance lease are stated at cost less accumulated depreciation and impairment. Cost includes expenditure that is directly attributable in bringing the asset to the location and condition necessary for its intended use. In the event that settlement of all or part of the purchase consideration is deferred, cost is determined by discounting the amounts payable in the future to their present value as at the date of acquisition. Cost also may include transfers from equity of any gain or loss on qualifying cash flow hedges of foreign currency purchases of property, plant and equipment. Purchased software that is integral to the functionality of the related equipment is capitalised as part of that equipment. Borrowing costs related to the acquisition or construction of qualifying assets are also capitalised as part of that asset.
Gains and losses on disposal of an item of other property, plant and equipment are determined by comparing the proceeds from disposal with the carrying amount of the other property, plant and equipment and are recognised net within “other income” in profit or loss. When revalued assets are sold, the amounts included in the revaluation reserve are transferred to retained earnings.
Depreciation is provided on other property, plant and equipment, including freehold buildings but excluding land. Depreciation of all other assets is calculated on a straight-line basis so as to write off the net cost or other revalued amount of each asset over its expected useful life to the Group. Leasehold improvements are depreciated over the period of the lease or estimated useful lives, whichever is the shorter, using the straight-line method.
For
per
sona
l use
onl
y

Transpacific Annual Report 2008 || PAGE 50
// Financial Report
Notes to the Financial Statements For the Financial Year Ended 30 June 2008 (continued)
(J) PROPERTY, PLANT AND EQUIPMENT (CONTINUED) Estimates of remaining useful lives are made on a regular basis for all assets, with annual reassessments for major items. The expected useful lives are as follows: Buildings and site improvements 15 to 40 years Plant and equipment 2.5 to 20 years Leasehold improvement 5.0 to 10 years
(K) LEASES Leases are classified as finance leases whenever the terms of the lease transfer substantially all the risks and rewards of ownership to the lessee. All other leases are classified as operating leases.
(i) Finance leases Assets held under finance leases are initially recognised at their fair value or, if lower, at amounts equal to the present value of the minimum lease payments, each determined at the inception of the lease. The corresponding liability to the lessor is included in the balance sheet as a finance lease obligation.
Lease payments are apportioned between finance charges and reduction of the lease obligation so as to achieve a constant rate of interest on the remaining balance of the liability. Finance charges are charged directly against income, unless they are directly attributable to qualifying assets, in which case they are capitalised in accordance with the Group’s general policy on finance costs. Refer to Note 3(O).
Finance leases are depreciated over the shorter of the estimated useful life of the asset or the lease term.
(ii) Operating leases Operating lease payments are recognised as an expense on a straight-line basis over the lease term, except where another systematic basis is more representative of the time pattern in which economic benefits from the leased asset are consumed.
(L) INTANGIBLES
(i) Goodwill Goodwill represents the excess of the cost of an acquisition over the fair value of the Group’s share of the net identifiable assets of the acquired business, subsidiary or associate at the date of acquisition. Goodwill on the acquisition of businesses or subsidiaries is included in intangible assets. Goodwill on acquisition of associates is included in investments in associates. Goodwill is not amortised. Instead goodwill is tested for impairment annually, or more frequently if events or changes in circumstances indicate that it might be impaired, and is carried at cost less accumulated impairment losses. Gains and losses on the disposal of an entity include the carrying amount of goodwill relating to the entity sold.
Goodwill is allocated to cash generating units for the purpose of impairment testing.
(ii) Research and development Expenditure on research activities, undertaken with the prospect of gaining new technical knowledge and understanding, is recognised in the income statement as an expense as incurred.
Expenditure on development activities, whereby research findings are applied to a plan or design for the production of new or substantially improved products and processes, is capitalised if the product or process is technically and commercially feasible and the Group has sufficient resources to complete development. The expenditure capitalised includes the costs of materials, direct labour and overhead costs that are directly attributable to preparing the asset for its intended use. Borrowing costs related to the development of qualifying assets are also capitalised. Other development expenditure is recognised in the income statement as an expense as incurred. Capitalised development expenditure is stated at cost less accumulated amortisation and impairment losses (see Note 3(I)).
(iii) Landfill airspace Landfill airspace and its amortisation is addressed in Note 3(J).
For
per
sona
l use
onl
y
PAGE 51 ||Transpacific Annual Report 2008
(L) INTANGIBLES (CONTINUED)
(iv) Other intangible assets Other intangible assets include customer contracts recognised on business combinations and licences. Other intangible assets that are acquired by the Group are stated at cost less accumulated amortisation (see below) and impairment losses (see Note 3(I)).
(v) Amortisation (other than amortisation of landfill airspace) Amortisation is charged to the income statement on a straight-line basis over the estimated useful lives of intangible assets unless such lives are indefinite. Goodwill and intangible assets with an indefinite useful life are systematically tested for impairment at each balance sheet date. Other intangible assets are amortised from the date they are available for use. The estimated useful lives are as follows:
Licences 5 to 10 years
Other 3 to 5 years
(M) TRADE AND OTHER PAYABLES Trade and other payables are stated at their amortised cost.
Trade payables are non-interest bearing and are normally settled on 30-day terms.
(N) BORROWINGS Borrowings are initially recognised at fair value of the consideration received net of issue costs incurred. Subsequent to initial recognition, interest-bearing borrowings are stated at amortised cost with any difference between costs and redemption value being recognised in the income statement over the period of the borrowings on an effective interest basis.
Borrowings are derecognised when the obligation specified in the contract is discharged, cancelled or expired. The difference between the carrying amount of a financial liability that has been extinguished or transferred to another party and the consideration paid, including any non-cash assets transferred or liabilities assumed, is recognised in other income or other expenses.
(O) FINANCE COSTS Finance costs are recognised as expenses in the period in which they are incurred. Finance costs include:
interest on bank overdrafts and short-term and long-term borrowings, including amounts paid or received on interest rate swaps;
amortisation of discounts or premiums relating to borrowings;
amortisation of ancillary costs incurred in connection with the arrangement of borrowings; and
finance lease charges.
There have been no qualifying assets and related debt to which borrowing costs could have been applied and as a result no borrowing costs have been capitalised to qualifying assets.
(P) REPAIRS AND MAINTENANCE Plant and equipment of the Group is required to be overhauled on a regular basis. This is managed as part of an ongoing major cyclical maintenance program. The costs of this maintenance are charged as expenses as incurred, except where they relate to the replacement of a component of an asset, in which case the costs are capitalised and depreciated in accordance with Note 3(J). Other routine operating maintenance, repair and minor renewal costs are also charged as expenses as incurred.
(Q) EMPLOYEE BENEFITS
(i) Wages and salaries, annual leave and sick leave Liabilities for wages and salaries, including non-monetary benefits, annual leave and vesting sick leave expected to be settled within 12 months of the reporting date are recognised in other creditors and provision for employee entitlements in respect of employees' services up to the reporting date and are measured at the amounts expected to be paid when the liabilities are settled.
For
per
sona
l use
onl
y

Transpacific Annual Report 2008 || PAGE 52
// Financial Report
Notes to the Financial Statements For the Financial Year Ended 30 June 2008 (continued)
(Q) EMPLOYEE BENEFITS (CONTINUED)
(ii) Long service leave The liability for long service leave expected to be settled within 12 months of the reporting date is recognised in the provision for employee benefits and is measured in accordance with (i) above. The liability for long service leave expected to be settled more than 12 months from the reporting date is recognised in the provision for employee benefits and measured as the present value of expected future payments to be made in respect of services provided by employees up to the reporting date. Consideration is given to expected future wage and salary levels, experience of employee departures and periods of service. Expected future payments are discounted using market yields at the reporting date on national government bonds with terms to maturity and currency that match, as closely as possible, the estimated future cash outflows.
(iii) Short-term incentive compensation (ICs)/bonus plans A liability for employee benefits in the form of ICs is recognised when the nomination and remuneration committee determines that IC criteria has been achieved and an amount is payable in accordance with the terms of the IC plan.
Liabilities for ICs are expected to be settled within 12 months and are measured at the amounts expected to be paid when they are settled.
(iii) Employee benefit on-costs Employee benefit on-costs, including payroll tax, are recognised and included in employee benefit liabilities and costs when the employee benefits to which they relate, are recognised as liabilities.
(v) Share-based payment transactions Share-based payments are provided to Directors and employees via the Transpacific Industries Group Executive Share Option Plan.
Share-based compensation payments are measured at fair value at the date of grant and expensed to employee benefit expense with a corresponding increase in equity over the period during which the employees become unconditionally entitled to the options. Fair value is measured by an external valuer using a binomial model that takes into account the exercise price, the term of the option, the impact of dilution, the share price at grant date and expected price volatility of the underlying share, the expected dividend yield and the risk-free interest rate for the term of the option.
(R) PROVISIONS A provision is recognised in the balance sheet when the Group has a present legal or constructive obligation as a result of a past event. It is probable that an outflow of economic benefits will be required to settle the obligation, and a reliable estimate can be made of the amount of the obligation. If the effect of the time value of money is material, provisions are determined by discounting the expected future cash flows at a pre-tax rate that reflects current market assessments of the time value of money and, where appropriate, the risks specific to the liability.
(i) Warranties A provision for warranties is recognised when the underlying products are sold. The provision is based on historical warranty data and a weighting of all possible outcomes against their probabilities.
For
per
sona
l use
onl
y

PAGE 53 ||Transpacific Annual Report 2008
(S) CASH AND CASH EQUIVALENTS Cash and cash equivalents comprise cash balances, short term bills and call deposits. Bank overdrafts that are repayable on demand and form an integral part of the Group’s cash management position are included as a component of cash and cash equivalents for the purpose of the cash flow statement.
(T) INVESTMENTS AND OTHER FINANCIAL ASSETS Financial assets are recognised when the entity becomes a party to the contractual provisions of the instrument at trade date.
Financial assets are initially measured at fair value plus transaction costs where the instrument is not classified at fair value through profit and loss. Transaction costs related to financial assets classified as fair value through profit and loss are expensed immediately.
The Group’s non-derivative financial assets are currently measured after initial recognition as loans and receivables or available-for-sale financial assets. The Group has no non-derivative financial assets classified as fair value through the profit and loss or held-to-maturity under accounting standard AASB 139. Subsequent measurement of loans and receivables is disclosed in Note 3(G).
Available-for-sale financial assets are measured at fair value with any changes in the fair value recognised directly in equity. The Group’s investments in equity securities, other than controlled entities and associates, are classified as available-for-sale. Fair value is determined by reference to official bid prices quoted on the relevant securities exchange, or where not listed and fair value cannot be reliably ascertained, at cost.
Controlled entities and associates are accounted for in the consolidated financial statements as set out in Note 3(A).
Financial assets are derecognised when the rights to receive cash flows from the financial assets have expired or have been transferred and the Group has transferred substantially all the risks and rewards of ownership.
(U) ISSUED CAPITAL Issued and paid up capital is recognised at the fair value of the consideration received by the Company. Any transaction costs incurred by the Company arising on the issue of capital are recognised directly in equity as a reduction of the share proceeds received.
(V) EARNINGS PER SHARE
(i) Basic earnings per share Basic earnings per share is determined by dividing net profit after income tax attributable to members of the Company, excluding any costs of servicing equity other than ordinary shares, by the weighted average number of ordinary shares outstanding during the financial year, adjusted for bonus elements in ordinary shares issued during the year.
(ii) Diluted earnings per share Diluted earnings per share adjusts the figures used in the determination of basic earnings per share to take into account the after income tax effect of interest and other financing costs associated with dilutive potential ordinary shares and the weighted average number of shares assumed to have been issued for no consideration in relation to dilutive potential ordinary shares. F
or p
erso
nal u
se o
nly

Transpacific Annual Report 2008 || PAGE 54
// Financial Report
Notes to the Financial Statements For the Financial Year Ended 30 June 2008 (continued)
(W) GOODS AND SERVICES TAX Revenue, expenses and assets are recognised net of the amount of goods and services tax (GST), except where the amount of GST incurred is not recoverable from the taxation authority. In these circumstances, the GST is recognised as part of the cost of acquisition of the asset or as part of the expense.
Receivables and payables are stated with the amount of GST included. The net amount of GST recoverable from, or payable to, the ATO is included as a current asset or liability in the balance sheet.
Cash flows are included in the cash flow statement on a gross basis. The GST component of cash flows arising from investing and financing activities which are recoverable from, or payable to, the ATO are classified as operating cash flows.
(X) ISSUED STANDARDS NOT EARLY ADOPTED At the date of authorisation of the financial report, the Standards and Interpretations listed below were in issue but not yet effective.
Initial application of the following Standard will not affect any of the amounts recognised in the financial report but will change the disclosures presently made in relation to the Group and the Company’s financial report:
(i) AASB 101 Presentation of Financial Statements (revised September 2007) – effective for annual reporting periods beginning on or after 1 January 2009.
Initial application of the following Standards and Interpretations is not expected to have any material impact on the financial report of the Group and the Company:
(i) AASB Interpretation 12 Service Concession Arrangements – effective for annual reporting periods beginning on or after 1 January 2009.
(ii) AASB Interpretation 14 AASB 119 – The Limit on a Defined Benefit Asset, Minimum Funding Requirements and their Interaction – effective for annual reporting periods beginning on or after 1 January 2009.
(iii) AASB Interpretation 13 Customer Loyalty Programmes – effective for annual reporting periods beginning on or after 1 July 2008.
(iv) AASB 2008-2 Amendments to Australian Accounting Standards – Puttable Financial Instruments and Obligations arising on Liquidation - effective for annual reporting periods beginning on or after 1 January 2009.
The potential effect of the initial application of the expected issue of an Australian equivalent accounting Standard to the following Standard has not yet been determined:
(i) IFRS 3 Business Combinations and IAS 27 Separate and Consolidated Financial Statements – effective for annual reporting periods beginning on or after 1 July 2009.
(Y) CRITICAL ACCOUNTING ESTIMATES AND JUDGEMENTS
The Directors evaluate estimates and judgements incorporated into the financial report based on historical knowledge and best available current information. Significant key estimates in the financial report are:
(i) Impairment: Details of the key estimates used in assessing value-in-use calculations and impairment generally are disclosed in Note 15.
(ii) Closure and post closure provisions: The Group assesses provisions for closure and post-closure costs in respect of its landfill sites by reference to external and internal sources to determine the best estimate of costs required to remediate the landfill sites. Further details are disclosed in Note 3(J)(iii).
For
per
sona
l use
onl
y

PAGE 55 ||Transpacific Annual Report 2008
CONSOLIDATED THE COMPANY
2008$’000
2007$’000
2008 $’000
2007 $’000
4 Revenue
Sale of goods and services 2,149,615 1,256,138 - -
Product stewardship oil benefits 19,618 15,947 - -
Interest revenue 6,370 9,966 145,856 48,598
Dividends from subsidiaries - - 60,000 60,000
Other revenue 16,368 5,867 - 1,203
2,191,971 1,287,918 205,856 109,801
5 Other income
Profit on acquisition of businesses 3,250 2,863 - -
Foreign currency exchange gains 348 1,724 4,382 -
Gain on disposal of property, plant and equipment 1,139 2,526 - -
4,737 7,113 4,382 -
6 Finance costs
Interest on bank overdrafts and loans 157,780 92,863 129,587 48,609
Interest on obligations under finance leases 4,354 3,223 - -
Interest on convertible notes 13,227 - 13,227 -
Total interest 175,361 96,086 142,814 48,609
Amortisation of deferred borrowing costs 10,408 2,349 10,408 2,349
Unwinding of discounts on provisions 550 - - -
186,319 98,435 153,222 50,958
For
per
sona
l use
onl
y

Transpacific Annual Report 2008 || PAGE 56
// Financial Report
Notes to the Financial Statements For the Financial Year Ended 30 June 2008 (continued)
CONSOLIDATED THE COMPANY
NOTES 2008$’000
2007 $’000
2008 $’000
2007 $’000
7 Income tax (A) RECOGNISED IN THE INCOME STATEMENT
Current tax expense
Current year 63,192 19,109 43,372 11,486
Adjustments for prior years (2,847) - (2,847) -
60,345 19,109 40,525 11,486
Deferred tax expense Origination and reversal of temporary differences (15,007) 14,702 7,382 18,364
Benefit of tax losses recognised (1,040) - - -
(16,047) 14,702 7,382 18,364
Total income tax expense in income statement 44,298 33,811 47,907 29,850
(B) NUMERICAL RECONCILIATION BETWEEN TAX EXPENSE AND PRE-TAX NET PROFIT
Profit before tax 239,865 148,113 48,712 54,637
Income tax using the domestic corporation tax rate of 30% (2007: 30%) 71,960 44,434 14,614 16,391
Increase/(decrease) in income tax expense due to:
Rebateable dividends - - (18,000) (18,000)
Share of associates’ net profits (790) (1,272) - -
Non-deductible expenses/non-assessable income (16,239) (794) 793 949
Effect of tax losses recognised (1,040) - - -
Tax liabilities assumed by ultimate Australian parent entity - - 50,500 30,510
Income tax expense/(benefit) on transfer of deferred tax balances on application of tax consolidation - - - -
Under/(over) provision in prior years (2,847) (4,000) - -
Other (6,921) (3,864) - -
Change in overseas tax rate - (852) - -
Differential tax rate on overseas income 175 159 - -
Income tax expense on pre-tax net profit 44,298 33,811 47,907 29,850
For
per
sona
l use
onl
y

PAGE 57 ||Transpacific Annual Report 2008
CONSOLIDATED THE COMPANY
NOTES 2008$’000
2007 $’000
2008 $’000
2007 $’000
7 Income tax (continued)
Deferred income tax in the Balance Sheet as at 30 June 2008 relates to the following:
Deferred tax assets
Employee benefits 11,689 8,315 11,402 4,810
Provisions 18,824 5,669 18,824 5,536
Finance leases 500 623 487 619
Tax losses 1,040 177 - -
IPO Costs – blackhole expenditure 387 534 387 534
Other 4,259 1,436 4,550 2,419
36,699 16,754 35,650 13,918
Deferred tax liabilities Property, plant and equipment 11,537 22,585 3,647 865
Deferred income 1,485 3,141 1,385 3,141
Other 150 874 150 6,979
Revaluation of land and buildings to fair value 15,391 2,991 12,310 1,810
28,563 29,591 17,492 12,795
Deferred income tax expense in the Income Statement for the year ended 30 June 2008 relates to the following:
Deferred tax assets
Employee post employment benefits (5,498) (2,072) (4,040) (937)
Provisions 9,492 (464) 9,492 (463)
Finance leases 407 10 (420) (49)
Tax losses - (64) - -
Blackhole expenditure (147) 18,766 (147) 18,766
Other - (265) 2,131 535
Deferred tax liabilities
Property, plant and equipment (1,124) 229 168 (500)
Change in overseas tax rate - (852) - -
Other (19,177) (586) 198 1,012
(16,047) 14,702 7,382 18,364
For
per
sona
l use
onl
y
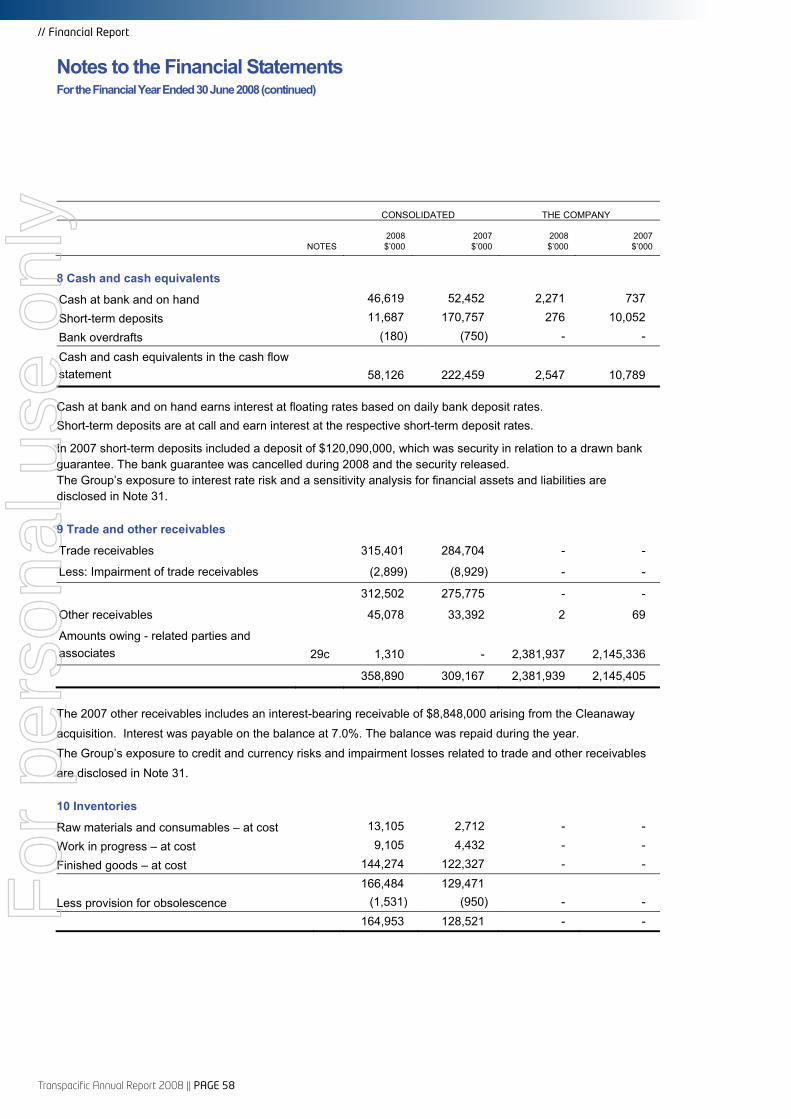
Transpacific Annual Report 2008 || PAGE 58
// Financial Report
Notes to the Financial Statements For the Financial Year Ended 30 June 2008 (continued)
CONSOLIDATED THE COMPANY
NOTES 2008$’000
2007$’000
2008 $’000
2007 $’000
8 Cash and cash equivalents
Cash at bank and on hand 46,619 52,452 2,271 737
Short-term deposits 11,687 170,757 276 10,052
Bank overdrafts (180) (750) - -
Cash and cash equivalents in the cash flow statement 58,126 222,459 2,547 10,789
Cash at bank and on hand earns interest at floating rates based on daily bank deposit rates. Short-term deposits are at call and earn interest at the respective short-term deposit rates.
In 2007 short-term deposits included a deposit of $120,090,000, which was security in relation to a drawn bank guarantee. The bank guarantee was cancelled during 2008 and the security released. The Group’s exposure to interest rate risk and a sensitivity analysis for financial assets and liabilities are disclosed in Note 31.
9 Trade and other receivables
Trade receivables 315,401 284,704 - -
Less: Impairment of trade receivables (2,899) (8,929) - -
312,502 275,775 - -
Other receivables 45,078 33,392 2 69
Amounts owing - related parties and associates 29c 1,310 - 2,381,937 2,145,336
358,890 309,167 2,381,939 2,145,405
The 2007 other receivables includes an interest-bearing receivable of $8,848,000 arising from the Cleanaway acquisition. Interest was payable on the balance at 7.0%. The balance was repaid during the year. The Group’s exposure to credit and currency risks and impairment losses related to trade and other receivables are disclosed in Note 31.
10 Inventories
Raw materials and consumables – at cost 13,105 2,712 - -
Work in progress – at cost 9,105 4,432 - -
Finished goods – at cost 144,274 122,327 - -
166,484 129,471 Less provision for obsolescence (1,531) (950) - -
164,953 128,521 - - For
per
sona
l use
onl
y
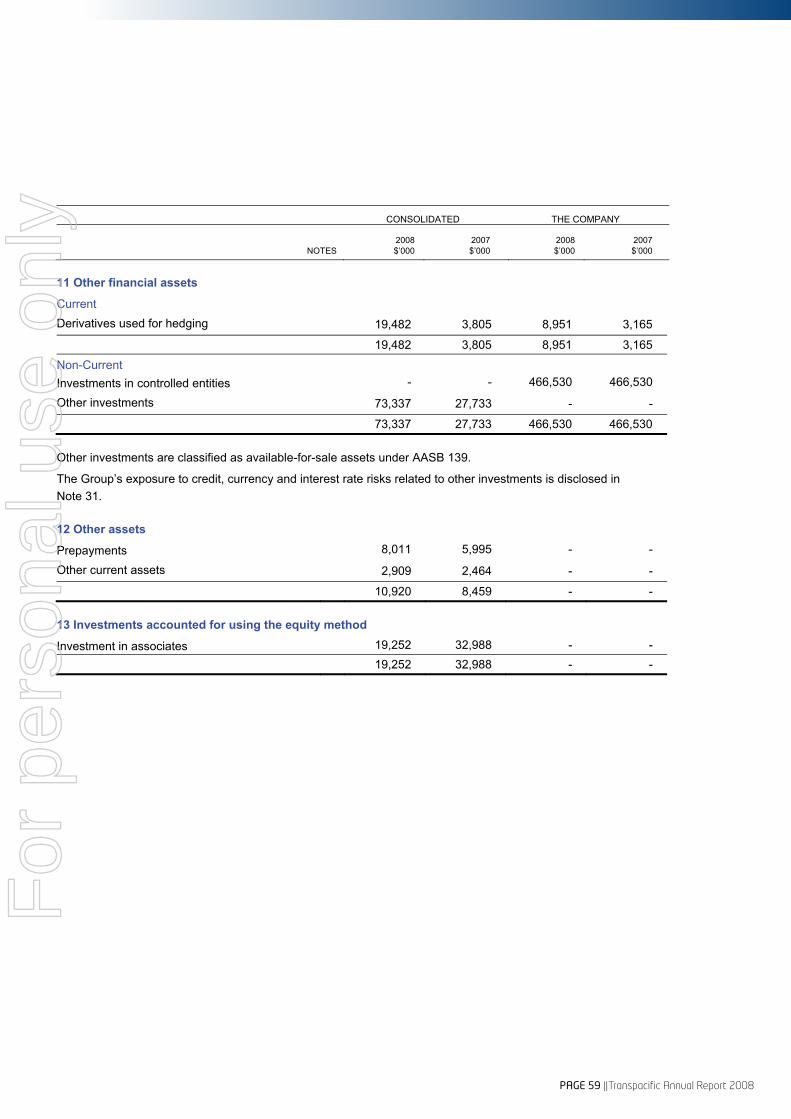
PAGE 59 ||Transpacific Annual Report 2008
CONSOLIDATED THE COMPANY
NOTES 2008$’000
2007 $’000
2008 $’000
2007 $’000
11 Other financial assets
Current
Derivatives used for hedging 19,482 3,805 8,951 3,165
19,482 3,805 8,951 3,165
Non-Current Investments in controlled entities - - 466,530 466,530
Other investments 73,337 27,733 - -
73,337 27,733 466,530 466,530
Other investments are classified as available-for-sale assets under AASB 139.
The Group’s exposure to credit, currency and interest rate risks related to other investments is disclosed in Note 31.
12 Other assets
Prepayments 8,011 5,995 - -
Other current assets 2,909 2,464 - -
10,920 8,459 - -
13 Investments accounted for using the equity method
Investment in associates 19,252 32,988 - -
19,252 32,988 - -
For
per
sona
l use
onl
y

Transpacific Annual Report 2008 || PAGE 60
// Financial Report
Notes to the Financial Statements For the Financial Year Ended 30 June 2008 (continued)
CONSOLIDATED THE COMPANY
NOTES 2008$’000
2007$’000
2008 $’000
2007 $’000
14 Property, plant and equipment LAND
Land at fair value 202,730 122,492 - -
Provision for depreciation - - - -
Net book value 202,730 122,492 - -
Movements Opening written down value 122,492 34,524 - -
Additions through business combinations 15,376 78,552 - -
Additions 22,830 10,916 - -
Disposals (857) (2,776) - -
Transfer between categories (5,834) - - -
Revaluation 56,331 - - -
Effect of movements in foreign exchange (7,608) 1,276 - -
Closing written down value 202,730 122,492 - -
LANDFILL, CELL DEVELOPMENT AND REMEDIATION
Landfill and cell development 186,722 94,931 - -
Provision for remediation (78,840) (74,276)
Provision for depreciation (20,277) (7,925) - -
Net book value 87,605 12,730 - -
Movements Opening written down value 12,730 - - -
Additions through business combinations 17,587 14,274 - -
Additions 30,693 6,038 - -
Disposals - (1,017) - -
Transfer from landfill airspace 50,113 - - -
Transfer between categories 1,132 - - -
Depreciation (12,352) (7,925) - -
Other (889) 270 - -
Effect of movements in foreign exchange (11,409) 1,090 - -
Closing written down value 87,605 12,730 - -
For
per
sona
l use
onl
y

PAGE 61 ||Transpacific Annual Report 2008
CONSOLIDATED THE COMPANY
NOTES 2008$’000
2007$’000
2008 $’000
2007$’000
14 Property, plant and equipment (continued)
BUILDINGS
Buildings at fair value 75,454 57,498 - -
Provision for depreciation (7,356) (4,669) - -
Net book value 68,098 52,829 - -
Movements Opening written down value 52,829 34,385 - -
Additions through business combinations 2,692 21,896 - -
Additions 13,210 4,100 - -
Disposals (64) (7,065) - -
Transfer between categories 3,553 (607) - -
Depreciation (2,687) (1,321) - -
Effect of movements in foreign exchange (1,435) 1,441 - -
Closing written down value 68,098 52,829 - -
LEASEHOLD IMPROVEMENTS
Leasehold improvements 7,370 4,964 - -
Provision for depreciation (1,073) (694) - -
Net book value 6,297 4,270 - -
Movements Opening written down value 4,270 257 - -
Additions through business combinations - - - -
Additions 625 4,404 - -
Disposals (256) (269) - -
Transfer between categories 2,545 - - -
Depreciation (379) (280) - -
Effect of movements in foreign exchange (508) 158 - -
Closing written down value 6,297 4,270 - -
For
per
sona
l use
onl
y

Transpacific Annual Report 2008 || PAGE 62
// Financial Report
Notes to the Financial Statements For the Financial Year Ended 30 June 2008 (continued)
CONSOLIDATED THE COMPANY
NOTES 2008$’000
2007$’000
2008 $’000
2007$’000
14 Property, plant and equipment (continued)
PLANT AND EQUIPMENT Plant and equipment 801,581 653,832 - -
Provision for depreciation (252,345) (149,505) - -
Net book value 549,236 504,327 - -
Movements Opening written down value 504,327 133,885 - -
Additions through business combinations 45,686 345,527 - -
Additions 121,397 80,956 - -
Disposals (7,223) (4,187) - -
Transfer between categories (1,396) 607 - -
Depreciation (102,840) (57,242) - -
Effect of movements in foreign exchange (10,715) 4,781 - -
Closing written down value 549,236 504,327 - - CAPITAL WORK IN PROGRESS Balance at beginning of year 22,132 11,476 - -
Net movement 29,136 10,656 - -
Balance at end of year 51,268 22,132 - - TOTAL PROPERTY PLANT AND EQUIPMENT Property, plant and equipment 1,325,125 955,849 - -
Provision for remediation (78,840) (74,276) - -
Provision for depreciation (281,052) (162,793) - -
Net book value 965,233 718,780 - -
Movements Opening written down value 718,780 214,527 - -
Additions through business combinations 81,341 460,249 - -
Additions 188,755 106,414 - -
Net movement in capital WIP 29,136 10,656 - -
Disposals (8,400) (15,314) - -
Transfer from landfill airspace 50,113 - - -
Depreciation (61,927) (66,768) - -
Other (889) 270 - -
Effect of movements in foreign exchange (31,676) 8,746 - -
Closing written down value 965,233 718,780 - -
For
per
sona
l use
onl
y

PAGE 63 ||Transpacific Annual Report 2008
VALUATIONS
On 30 June 2008 an independent valuation was obtained to determine fair value of land which was determined by reference to an open market basis, being the amount for which the assets could be exchanged between a knowledgeable willing buyer and a knowledgeable willing seller in an arm’s length transaction at the valuation date. The revaluations of land were based on independent assessments by a member of the Australian Property Institute. Fair value is determined by reference to market-based evidence, which are the amounts for which the assets could be exchanged between a knowledgeable willing buyer and a knowledgeable willing seller in an arm’s length transaction as at the valuation date.
Any revaluation surplus is credited to the asset revaluation reserve included in the equity section of the balance sheet. Any revaluation deficit directly offsetting a previous surplus in the same asset is directly offset against the surplus in the asset revaluation reserve, otherwise it is charged to profit or loss.
If land and buildings were measured using the cost model, the carrying amounts would be as follows:
CONSOLIDATED THE COMPANY
NOTES 2008 $’000
2007 $’000
2008 $’000
2007$’000
LAND (EXCLUDING LANDFILL) Cost 127,784 93,269 - - BUILDINGS Cost 77,993 59,119 - -
Accumulated depreciation (8,405) (6,290) - -
Net carrying amount 69,588 52,829 - -
LEASED PLANT AND EQUIPMENT
The carrying amount of plant and equipment held under finance lease and hire purchase contracts at 30 June 2008 is $89,973,000 (2007: $51,747,000). Leased assets and assets under hire purchase contracts are pledged as security for the related finance lease and hire purchase liabilities.
15 Intangibles
CONSOLIDATED THE COMPANY
NOTES 2008 $’000
2007 $’000
2008 $’000
2007$’000
GOODWILL Goodwill at cost 2,002,294 2,275,464 - -
Provision for amortisation - - - -
Net book value 2,002,294 2,275,464 - -
Movements Opening written down value 2,275,464 114,552
Additions through business combinations 201,993 2,088,015 - -
Reclassification of identifiable intangibles on acquisition to landfill airspace * (381,880) - - -
Effect of movements in foreign exchange (93,283) 72,897 - -
Closing written down value 2,002,294 2,275,464 - -
* Refer to Note 3(J)
For
per
sona
l use
onl
y

Transpacific Annual Report 2008 || PAGE 64
// Financial Report
Notes to the Financial Statements For the Financial Year Ended 30 June 2008 (continued)
CONSOLIDATED THE COMPANY
NOTES 2008 $’000
2007 $’000
2008 $’000
2007$’000
15 Intangibles (continued)
LANDFILL AIRSPACE Landfill airspace at cost 331,767 - - -
Provision for amortisation - - - -
Net book value 331,767 - - -
Movements Opening written down value - -
Reclassification of identifiable intangibles on acquisition from goodwill 381,880 - - -
Transfer to landfill and cell development costs (50,113) - - -
Closing written down value 331,767 - - - PATENTS AND LICENCES Patents and licences at cost 77,117 77,117 - -
Provision for amortisation (1,720) (1,290) - -
Net book value 75,397 75,827 - -
Movements Opening written down value 75,827 1,529 - -
Additions through business combinations - 74,728 - -
Amortisation (430) (430) - -
Closing written down value 75,397 75,827 - - OTHER INTANGIBLES Other intangibles at cost 134,045 129,860 - -
Provision for amortisation (1,258) (672) - -
Net book value 132,787 129,188 - -
Movements Opening written down value 129,188 30,195 - -
Additions through business combinations 4,185 99,590 - -
Amortisation (565) (597) - -
Effect of movement in foreign exchange (21) - - -
Closing written down value 132,787 129,188 - - TOTAL INTANGIBLES Intangibles at cost 2,545,223 2,482,441 - -
Provision for amortisation (2,978) (1,962) - -
Net book value 2,542,245 2,480,479 - -
Movements Opening written down value 2,480,479 146,276 - -
Acquisitions through business combinations 206,178 2,262,333 - -
Transfer to landfill and cell development costs (50,113) - - -
Amortisation (995) (1,027) - -
Effect of movement in foreign exchange (93,304) 72,897 - -
Closing written down value 2,542,245 2,480,479 - -
For
per
sona
l use
onl
y

PAGE 65 ||Transpacific Annual Report 2008
15 Intangibles (continued)
Other intangibles include customer contracts valued at $46,221,000 (2007: $42,036,000) which are considered to have an indefinite life as the contracts are evergreen contracts and have no expiry dates.
During the financial year ended 30 June 2008, all intangible assets were tested for impairment as required by AASB 136 Impairment of Assets. No impairment loss was charged for continuing operations in the 2008 financial year.
The Group has multiple cash generating units. The cash generating units with significant goodwill, and other intangibles attributable to them are:
CONSOLIDATED THE COMPANY
NOTES 2008 $’000
2007 $’000
2008 $’000
2007$’000
CASH GENERATING UNIT Transpacific Industries Group (NZ) Ltd 704,315 752,460 - -
Victoria Landfill Division 337,052 327,564 - -
Transpacific Cleanaway Pty Ltd 1,193,047 1,118,779 - -
2,234,414 2,198,803 - -
There are no other individual cash generating units with significant goodwill and intangibles attributable to them.
The recoverable amounts of the cash generating units have been based on value in use calculations. These calculations use cash flow projections based on actual operating results and financial budgets approved by management. Cash flows are extrapolated over 10 years using a 3% growth rate for the first three years and nil growth thereafter. Both of these assumptions are deemed conservative as there are no intentions to dispose of any businesses and the historic growth rate of the Group is greater than 3%. A pre-tax discount rate of 9% (2007: 7.5%) has been used in discounting the projected cash flows. Management believes that any possible change in the key assumptions on which recoverable amount is based would not cause the carrying amount to exceed its recoverable amount.
16 Trade and other payables
CONSOLIDATED THE COMPANY
NOTES 2008 $’000
2007 $’000
2008 $’000
2007$’000
CURRENT
Trade payables 183,943 164,380 - -
Other payables and accruals 86,085 74,164 10,942 14,331
Payables to related parties and associates 29c 65 - - -
Deferred settlements 22,875 3,751 - -
292,968 242,295 10,942 14,331
The Group’s exposure to currency and liquidity risk related to trade and other payables is disclosed in Note 31.
For
per
sona
l use
onl
y

Transpacific Annual Report 2008 || PAGE 66
// Financial Report
Notes to the Financial Statements For the Financial Year Ended 30 June 2008 (continued)
CONSOLIDATED THE COMPANY
NOTES 2008 $’000
2007 $’000
2008 $’000
2007$’000
17 Borrowings
CURRENT
UNSECURED
Bank loans 364,193 3,399 - -
Loans to related parties and associates 29c 7,723 5,824 - -
Other 614 - - - 372,530 9,223 - - SECURED Obligations under finance leases and hire purchase liabilities 27b 19,296 14,054 - -
391,826 23,277 - -
NON-CURRENT
UNSECURED
Bank loans 1,433,349 2,232,824 1,480,421 1,740,641
US Private Placement notes 169,196 - 169,196 -
6.75% Subordinated Convertible notes 347,500 - 347,500 -
Convertible notes taken to equity 22 (51,951) - (51,951) -
Amortisation of convertible notes 4,020 - 4,020 -
Deferred borrowing costs (38,451) (2,069) (38,451) (2,069)
Loans from related parties 29c - 4,636 - -
Other 2,125 - - -
1,865,788 2,235,391 1,910,735 1,738,572
SECURED Obligations under finance leases and hire purchase liabilities 27b 73,177 40,441 - -
1,938,965 2,275,832 1,910,735 1,738,572
FINANCING FACILITIES
The Group’s finance facilities are summarised below:
FACILITY AMOUNT
Syndicated facility agreement 2,128,000 2,100,000 2,128,000 2,100,000
US Private Placement notes 169,196 - 169,196 -
6.75% Subordinated Convertible notes 347,500 - 347,500 -
2,644,696 2,100,000 2,644,696 2,100,000
The syndicated facility consists of one and three-year tranches, which are subject to annual extensions. The one- year tranches have been extended subsequent to year end through to 15 December 2009. The three-year tranches mature 15 December 2010.
Interest rates are variable under the syndicated facility agreement. The Company manages its exposure to floating rate debt by hedging a proportion of its exposure with interest rate swaps.
For
per
sona
l use
onl
y

PAGE 67 ||Transpacific Annual Report 2008
17 Borrowings (continued)
The maturity profile for the US Private Placement notes is as follows:
PRINCIPAL AMOUNT AUD FIXED AMOUNT MATURITY DATE
USD87,000,000 AUD97,752,808 17 December 2012 CAD15,000,000 AUD17,510,580 17 December 2012
USD48,000,000 AUD53,932,584 17 December 2017
The US Private Placement has been swapped to AUD fixed rate debt.
In December 2007 the Company issued AUD347.5 million subordinated notes due 7 December 2014. The Notes carry a coupon of 6.75% per annum and will, unless previously converted, be redeemed at their principal amount on maturity. The conversion price of the Notes has been set at AUD14.8648 per ordinary share, subject to adjustment in accordance with the conditions.
The Group and the Company can also borrow outside of the facilities detailed above.
CONSOLIDATED THE COMPANY
NOTES 2008 $’000
2007 $’000
2008 $’000
2007 $’000
DEBT FACILITIES Total facilities available 2,666,696 2,919,982 2,666,696 2,919,982
Facilities utilised at balance date (2,515,720) (2,537,488) (2,515,720) (2,537,488)
Facilities not utilised at balance date 150,976 382,494 150,976 382,494
Facilities used at balance date include AUD137.7 million (2007: AUD237.3 million) in guarantees and letters of credit which are off the balance sheet. Refer Note 27.
18 Current tax liabilities
Income tax payable 1,784 - 6,088 3,010
19 Provisions
CURRENT Provision for warranty Balance at beginning of year 3,784 3,209 - -
Provisions made during the year 4,397 2,763 - -
Provisions used during the year (2,524) (1,733) - -
Provisions reversed during the year - (455) - -
Balance at end of year 5,657 3,784 - - Provision – Other Balance at beginning of year 5,703 961 - -
Provisions acquired in business combinations - 2,699 - -
Provisions made during the year 17,385 5,933 - -
Provisions used during the year (14,620) (3,603) - -
Provisions reversed during the year (6,333) (287) - -
Balance at end of year 2,135 5,703 - -
For
per
sona
l use
onl
y

Transpacific Annual Report 2008 || PAGE 68
// Financial Report
Notes to the Financial Statements For the Financial Year Ended 30 June 2008 (continued)
CONSOLIDATED THE COMPANY
NOTES 2008 $’000
2007$’000
2008 $’000
2007$’000
19 Provisions (continued) Provision – Dividend and distributions
Balance at beginning of year 6,500 6,727 6,500 6,500
Provisions made during the year 41,628 34,165 - -
Provisions used during the year (48,128) (34,392) (6,500) -
Balance at end of year - 6,500 - 6,500 Total current provisions Balance at beginning of year 15,987 10,897 6,500 6,500
Provisions made during the year 63,410 42,861 - -
Provisions acquired in business combinations - 2,699 - -
Provisions used during the year (65,272) (39,728) (6,500) -
Provisions reversed during the year (6,333) (742) - -
Balance at end of year 7,792 15,987 - 6,500
WARRANTIES
The provision for warranties relates mainly to the Commercial Vehicle division warranties for vehicles. The provision is based on estimates made from historical warranty data associated with similar services.
DIVIDENDS AND DISTRIBUTIONS
The provision relates to the consolidated Group’s obligation to pay dividends to its shareholders.
20 Other liabilities
CONSOLIDATED THE COMPANY
NOTES 2008$’000
2007 $’000
2008 $’000
2007$’000
Deferred income 24,464 24,605 - - Derivatives 11,831 5,618 - -
36,295 30,223 - -
For
per
sona
l use
onl
y

PAGE 69 ||Transpacific Annual Report 2008
21 Share-based payments
The Company operates an Executive Share Option Plan (“the Option Plan”) approved by shareholders of the Company in March 2005. Under the Option Plan the Board of Directors may issue options to Non-Executive Directors and Executives of the Company. The Board determines the price, number, exercise price, expiry date and relevant performance hurdles of options to be issued. There are no voting or dividend rights attached to the options.
Upon exercise of the options and payment of the exercise price, the executives are allotted one fully paid ordinary share in the Company for each option held.
On termination of employment of a participant “generally” the option lapses. In certain circumstances, the Board may elect to allow the terminating participant to retain their options.
The following share-based payment arrangements were in existence during the current and comparative reporting periods:
DATE OPTIONS GRANTED FIRST EXERCISE
DATE ON OR AFTER EXPIRY DATE EXERCISE
PRICE NUMBER UNDER
OPTION 2008 NUMBER UNDER
OPTION 2007
(1) 3 May 2005 31 August 2006 31 July 2009 $2.40 6,731,112 6,950,000 (2) 8 November 2005 31 August 2006 31 July 2009 $4.26 150,000 150,000
(3) 17 February 2006 31 August 2007 31 July 2010 $5.40 350,000 350,000
(4) 24 April 2006 31 August 2007 31 July 2010 $8.53 725,000 725,000
(5) 13 September 2006 31 August 2007 31 July 2010 $7.25 820,000 850,000
(6) 20 September 2006 31 August 2007 31 July 2010 $7.28 300,000 300,000
(7) 23 October 2006 31 August 2007 31 July 2010 $8.20 60,000 60,000
(8) 10 November 2006 31 August 2008 31 July 2010 $8.09 50,000 50,000
(9) 14 December 2006 31 August 2008 31 July 2010 $8.81 70,000 100,000
(10) 12 March 2007 31 August 2008 31 July 2010 $9.98 1,295,000 1,250,000
(11) 12 March 2007 31 August 2008 31 July 2011 $9.98 1,200,000 1,425,000
(12) 3 May 2007 31 August 2008 31 July 2011 $12.51 175,000 190,000
(13) 16 May 2007 31 August 2008 31 July 2011 $13.06 1,150,000 1,300,000
(14) 22 October 2007 31 August 2008 31 July 2011 $11.15 145,000 -
(15) 8 February 2008 31 August 2009 31 July 2011 $7.96 1,005,000 -
Options issued under the Option Plan are exercisable in two or three equal tranches and will vest when the exercise conditions have been met. 75% of each tranche of options vest if total shareholder return (TPI share price increment over share price at grant date plus dividends paid) totals at least 15% per annum on a cumulative basis. 25% of each tranche of options vest if the volume weighted average price of TPI shares has outperformed the S&P/ASX200 (less financials) by 5% on a cumulative basis. The fair value of the options are estimated at the date of grant using the binomial model incorporating a Monte-Carlo simulation.
The number and weighted average exercise prices of share options are as follows:
WEIGHTED AVERAGE EXERCISE
PRICE 2008
NUMBER OF OPTIONS
2008
WEIGHTED AVERAGE EXERCISE
PRICE 2007
NUMBER OF OPTIONS
2007
Outstanding at the beginning of the period $6.65 11,423,33 $3.11 8,175,000 Granted during the period $8.78 1,355,000 $10.17 5,525,000
Exercised during the period (i) $2.78 (2,484,327) $2.44 (2,276,663)
Cancelled during the period (828,888) -
Outstanding at the end of the period (ii) 9,465,122 $6.65 11,423,337
Exercisable at the end of the period $6.77 723,249 $2.40 90,004
For
per
sona
l use
onl
y

Transpacific Annual Report 2008 || PAGE 70
// Financial Report
Notes to the Financial Statements For the Financial Year Ended 30 June 2008 (continued)
21 Share-based payments (continued)
OPTION SERIES NUMBER EXERCISED EXERCISE DATE
SHARE PRICE AT EXERCISE
DATE
(1) 3 May 2005 15,000 03/07/2007 $13.25 (1) 3 May 2005 16,666 20/07/2007 $14.29
(1) 3 May 2005 358,333 31/08/2007 $10.92
(1) 3 May 2005 400,000 04/09/2007 $11.20
(4) 24 April 2006 16,666 04/09/2007 $11.20
(6) 20 September 2006 16,667 04/09/2007 $11.20
(1) 3 May 2005 108,334 11/09/2007 $11.10
(7) 23 October 2006 20,000 11/09/2007 $11.10
(1) 3 May 2005 249,998 17/09/2007 $10.27
(9) 14 December 2006 16,666 17/09/2007 $10.27
(5) 13 September 2006 25,000 26/09/2007 $11.14
(1) 3 May 2005 1,043,999 26/09/2007 $11.14
(1) 3 May 2005 83,333 28/09/2007 $11.30
(5) 13 September 2006 33,333 01/10/2007 $11.21
(1) 3 May 2005 5,333 01/10/2007 $11.21
(3) 17 February 2006 16,666 26/10/2007 $11.02
(5) 13 September 2006 41,666 11/12/2007 $11.50
(1) 3 May 2005 16,667 21/01/2008 $8.27
2,484,327
(i) Exercised during the financial year. (ii) Balance at end of the financial year.
The options outstanding at 30 June 2008 have an exercise price in the range of $2.40 to $13.06 (2007 $2.40 to $13.06) and a weighted average contractual life of 1.9 years (2007: 3.2 years). The total share-based payment expense included in the Income Statement is set out in Note 22(F). The following table gives the assumptions made in determining the value of the options granted during the year:
22/10/07 08/02/08
Expected life Tranche 1 0.80 1.60
Tranche 2 0.80 2.60
Tranche 3 2.80 -
Volatility – Transpacific (%) 28.00 28.00
Volatility – S&P/ASX200 (%) 10.00 10.00
Risk-free interest rate (%) Tranche 1 6.15 6.15
Tranche 2 6.10 6.10
Dividend yield – Transpacific (%) 2.00 2.00
Dividend yield – S&P/ASX200 (%) 4.20 4.20
For
per
sona
l use
onl
y
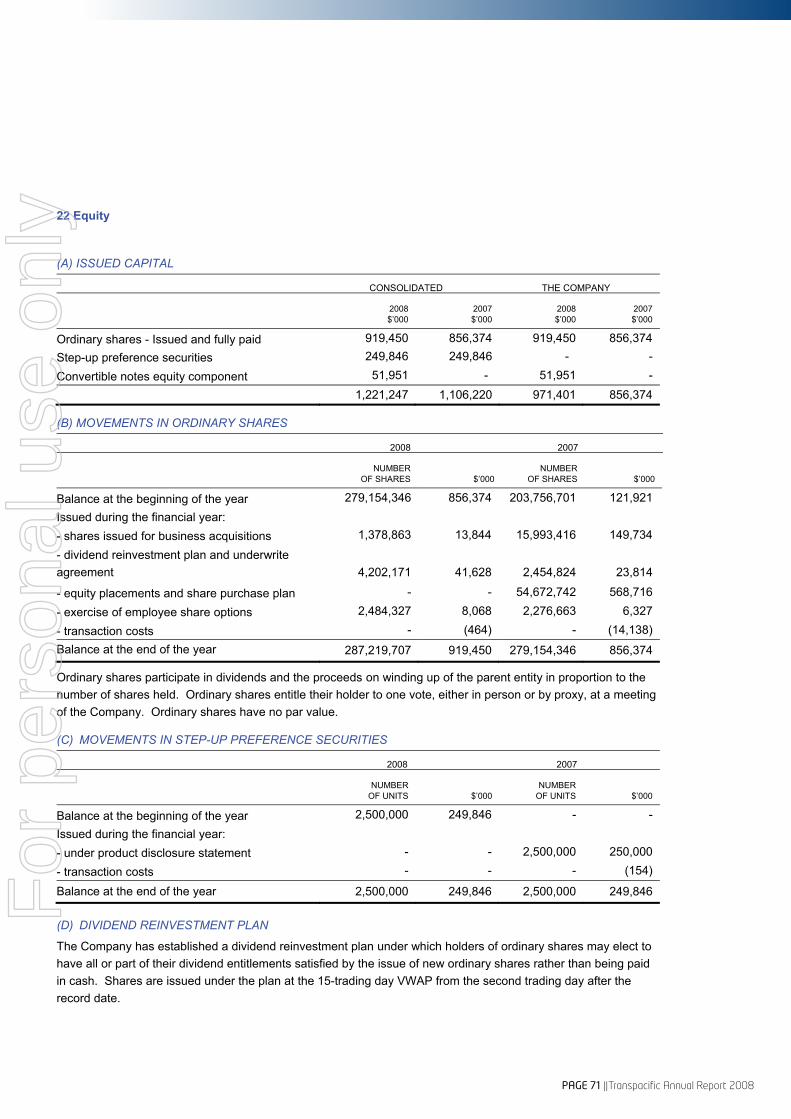
PAGE 71 ||Transpacific Annual Report 2008
22 Equity
(A) ISSUED CAPITAL
CONSOLIDATED THE COMPANY
2008$’000
2007$’000
2008 $’000
2007 $’000
Ordinary shares - Issued and fully paid 919,450 856,374 919,450 856,374 Step-up preference securities 249,846 249,846 - -
Convertible notes equity component 51,951 - 51,951 -
1,221,247 1,106,220 971,401 856,374
(B) MOVEMENTS IN ORDINARY SHARES
2008 2007
NUMBER
OF SHARES $’000 NUMBER
OF SHARES $’000
Balance at the beginning of the year 279,154,346 856,374 203,756,701 121,921 Issued during the financial year:
- shares issued for business acquisitions 1,378,863 13,844 15,993,416 149,734
- dividend reinvestment plan and underwrite agreement 4,202,171 41,628 2,454,824 23,814
- equity placements and share purchase plan - - 54,672,742 568,716
- exercise of employee share options 2,484,327 8,068 2,276,663 6,327
- transaction costs - (464) - (14,138) Balance at the end of the year 287,219,707 919,450 279,154,346 856,374
Ordinary shares participate in dividends and the proceeds on winding up of the parent entity in proportion to the number of shares held. Ordinary shares entitle their holder to one vote, either in person or by proxy, at a meeting of the Company. Ordinary shares have no par value.
(C) MOVEMENTS IN STEP-UP PREFERENCE SECURITIES
2008 2007
NUMBER
OF UNITS $’000 NUMBER
OF UNITS $’000
Balance at the beginning of the year 2,500,000 249,846 - - Issued during the financial year:
- under product disclosure statement - - 2,500,000 250,000
- transaction costs - - - (154)
Balance at the end of the year 2,500,000 249,846 2,500,000 249,846
(D) DIVIDEND REINVESTMENT PLAN
The Company has established a dividend reinvestment plan under which holders of ordinary shares may elect to have all or part of their dividend entitlements satisfied by the issue of new ordinary shares rather than being paid in cash. Shares are issued under the plan at the 15-trading day VWAP from the second trading day after the record date.
For
per
sona
l use
onl
y

Transpacific Annual Report 2008 || PAGE 72
// Financial Report
Notes to the Financial Statements For the Financial Year Ended 30 June 2008 (continued)
22 Equity (continued)
(E) SHARE OPTIONS Executive Share Option Plan
The details of the Executive Share Option Plan are set out at Note 21.
Brenzil Pty Ltd Option Deed
The Company entered into an Option Deed with Brenzil Pty Ltd, an entity associated with the Peabody family interests, in March 2005. These options are intended to enable the Peabody family to retain effective control as the Non-Executive Director and Executive options are exercised. There are no voting or dividend rights attached to the options. Details of these options are as follows:
DATE OPTIONS GRANTED
EXERCISE DATE ON OR AFTER EXPIRY DATE
EXERCISE PRICE
$ OPTIONS
GRANTED
NUMBER OF OPTIONS AT END OF YEAR
ON ISSUE VESTED
BRENZIL PTY LTD SHARE OPTIONS
3 May 2005 31 August 2006 31 July 2009 2.76 2,316,667 2,316,667 2,316,667
3 May 2005 31 August 2007 31 July 2009 3.17 2,316,667 2,316,667 2,316,667
3 May 2005 31 August 2008 31 July 2009 3.65 2,316,666 2,316,666 - Outstanding at the end of the period 6,950,000 6,950,000 4,553,334
(F) RESERVES
CONSOLIDATED THE COMPANY
NOTES 2008 $’000
2007 $’000
2008 $’000
2007 $’000
Foreign currency translation reserve (56,464) 34,208 - - Asset revaluation reserve 33,048 4,223 - -
Hedging reserve 7,038 (2,031) 8,951 3,165
Employee equity benefits reserve 6,371 4,018 6,371 4,018
(10,007) 40,418 15,322 7,183
Foreign Currency Translation Reserve
Nature and purpose of Reserve
The foreign currency translation reserve is used to record differences arising from the translation of the financial statements of foreign subsidiaries. It is also used to record the net investment hedged in these securities. Movements
Foreign currency translation reserve
Opening balance 34,208 (10,272) - -
Exchange differences taken to equity (90,672) 44,480 - -
CLOSING BALANCE (56,464) 34,208 - -
For
per
sona
l use
onl
y
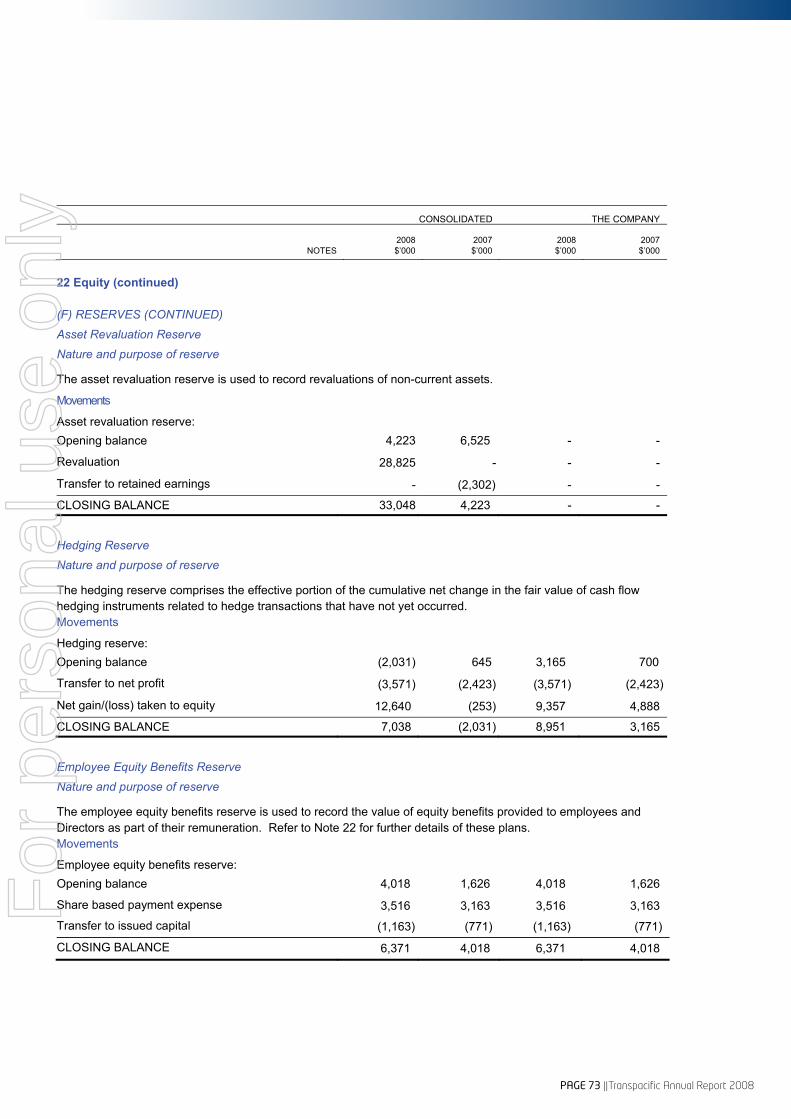
PAGE 73 ||Transpacific Annual Report 2008
CONSOLIDATED THE COMPANY
NOTES 2008$’000
2007$’000
2008 $’000
2007$’000
22 Equity (continued)
(F) RESERVES (CONTINUED) Asset Revaluation Reserve Nature and purpose of reserve
The asset revaluation reserve is used to record revaluations of non-current assets.
Movements
Asset revaluation reserve:
Opening balance 4,223 6,525 - -
Revaluation 28,825 - - -
Transfer to retained earnings - (2,302) - -
CLOSING BALANCE 33,048 4,223 - -
Hedging Reserve Nature and purpose of reserve
The hedging reserve comprises the effective portion of the cumulative net change in the fair value of cash flow hedging instruments related to hedge transactions that have not yet occurred. Movements
Hedging reserve:
Opening balance (2,031) 645 3,165 700
Transfer to net profit (3,571) (2,423) (3,571) (2,423)
Net gain/(loss) taken to equity 12,640 (253) 9,357 4,888
CLOSING BALANCE 7,038 (2,031) 8,951 3,165
Employee Equity Benefits Reserve Nature and purpose of reserve
The employee equity benefits reserve is used to record the value of equity benefits provided to employees and Directors as part of their remuneration. Refer to Note 22 for further details of these plans. Movements
Employee equity benefits reserve:
Opening balance 4,018 1,626 4,018 1,626
Share based payment expense 3,516 3,163 3,516 3,163 Transfer to issued capital (1,163) (771) (1,163) (771)
CLOSING BALANCE 6,371 4,018 6,371 4,018
For
per
sona
l use
onl
y
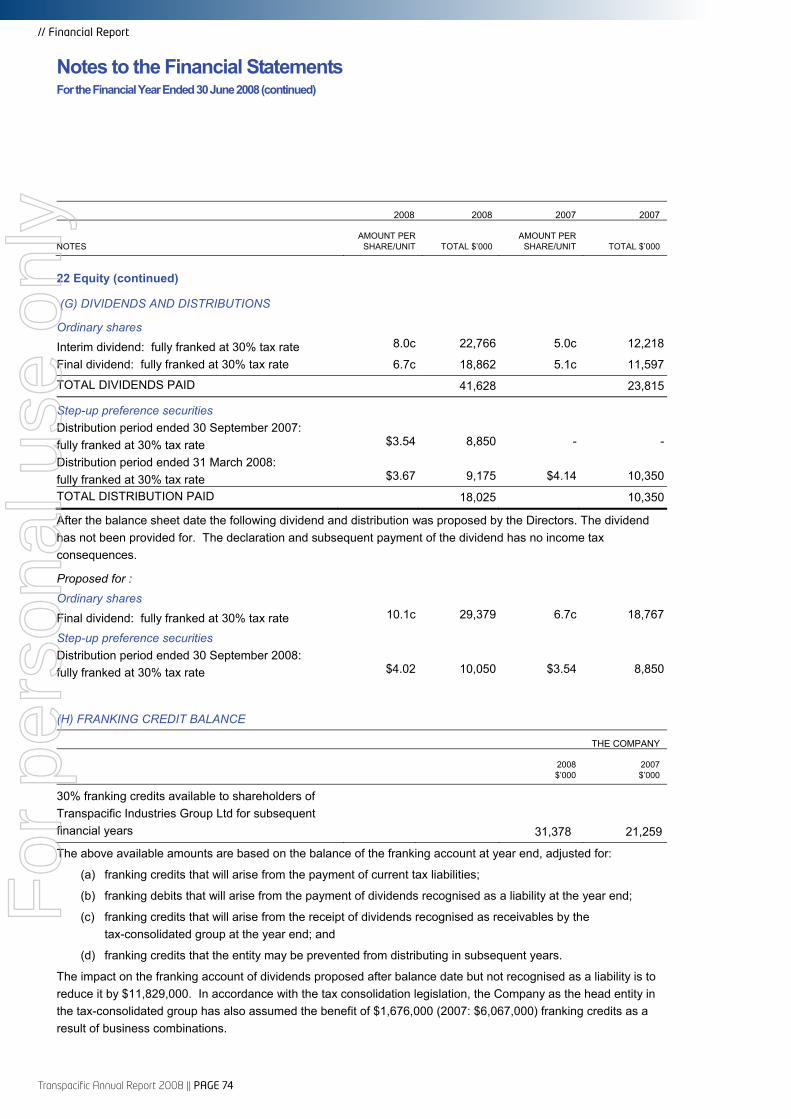
Transpacific Annual Report 2008 || PAGE 74
// Financial Report
Notes to the Financial Statements For the Financial Year Ended 30 June 2008 (continued)
2008 2008 2007 2007
NOTES AMOUNT PER
SHARE/UNIT TOTAL $’000 AMOUNT PER
SHARE/UNIT TOTAL $’000
22 Equity (continued)
(G) DIVIDENDS AND DISTRIBUTIONS
Ordinary shares
Interim dividend: fully franked at 30% tax rate 8.0c 22,766 5.0c 12,218
Final dividend: fully franked at 30% tax rate 6.7c 18,862 5.1c 11,597
TOTAL DIVIDENDS PAID 41,628 23,815
Step-up preference securities
Distribution period ended 30 September 2007: fully franked at 30% tax rate $3.54 8,850 - -
Distribution period ended 31 March 2008: fully franked at 30% tax rate $3.67 9,175 $4.14 10,350
TOTAL DISTRIBUTION PAID 18,025 10,350
After the balance sheet date the following dividend and distribution was proposed by the Directors. The dividend has not been provided for. The declaration and subsequent payment of the dividend has no income tax consequences.
Proposed for :
Ordinary shares
Final dividend: fully franked at 30% tax rate 10.1c 29,379 6.7c 18,767
Step-up preference securities
Distribution period ended 30 September 2008: fully franked at 30% tax rate $4.02 10,050 $3.54 8,850
(H) FRANKING CREDIT BALANCE
THE COMPANY
2008 $’000
2007$’000
30% franking credits available to shareholders of Transpacific Industries Group Ltd for subsequent financial years 31,378 21,259
The above available amounts are based on the balance of the franking account at year end, adjusted for:
(a) franking credits that will arise from the payment of current tax liabilities;
(b) franking debits that will arise from the payment of dividends recognised as a liability at the year end;
(c) franking credits that will arise from the receipt of dividends recognised as receivables by the tax-consolidated group at the year end; and
(d) franking credits that the entity may be prevented from distributing in subsequent years.
The impact on the franking account of dividends proposed after balance date but not recognised as a liability is to reduce it by $11,829,000. In accordance with the tax consolidation legislation, the Company as the head entity in the tax-consolidated group has also assumed the benefit of $1,676,000 (2007: $6,067,000) franking credits as a result of business combinations.
For
per
sona
l use
onl
y
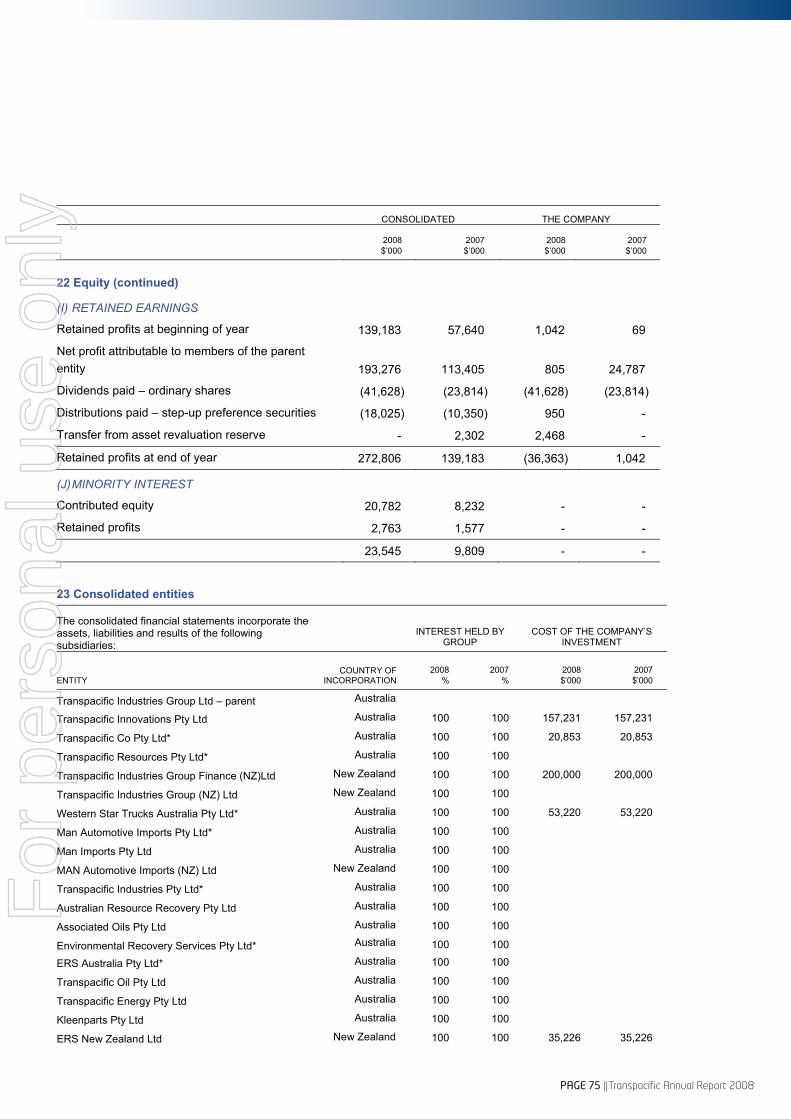
PAGE 75 ||Transpacific Annual Report 2008
CONSOLIDATED THE COMPANY
2008 $’000
2007 $’000
2008 $’000
2007 $’000
22 Equity (continued)
(I) RETAINED EARNINGS
Retained profits at beginning of year 139,183 57,640 1,042 69
Net profit attributable to members of the parent entity 193,276 113,405 805 24,787
Dividends paid – ordinary shares (41,628) (23,814) (41,628) (23,814)
Distributions paid – step-up preference securities (18,025) (10,350) 950 -
Transfer from asset revaluation reserve - 2,302 2,468 -
Retained profits at end of year 272,806 139,183 (36,363) 1,042
(J) MINORITY INTEREST
Contributed equity 20,782 8,232 - -
Retained profits 2,763 1,577 - -
23,545 9,809 - -
23 Consolidated entities
The consolidated financial statements incorporate the assets, liabilities and results of the following subsidiaries:
INTEREST HELD BY GROUP
COST OF THE COMPANY’S INVESTMENT
ENTITY COUNTRY OF
INCORPORATION 2008
% 2007
% 2008 $’000
2007 $’000
Transpacific Industries Group Ltd – parent Australia
Transpacific Innovations Pty Ltd Australia 100 100 157,231 157,231
Transpacific Co Pty Ltd* Australia 100 100 20,853 20,853
Transpacific Resources Pty Ltd* Australia 100 100
Transpacific Industries Group Finance (NZ)Ltd New Zealand 100 100 200,000 200,000
Transpacific Industries Group (NZ) Ltd New Zealand 100 100
Western Star Trucks Australia Pty Ltd* Australia 100 100 53,220 53,220
Man Automotive Imports Pty Ltd* Australia 100 100
Man Imports Pty Ltd Australia 100 100
MAN Automotive Imports (NZ) Ltd New Zealand 100 100
Transpacific Industries Pty Ltd* Australia 100 100
Australian Resource Recovery Pty Ltd Australia 100 100
Associated Oils Pty Ltd Australia 100 100
Environmental Recovery Services Pty Ltd* Australia 100 100
ERS Australia Pty Ltd* Australia 100 100
Transpacific Oil Pty Ltd Australia 100 100
Transpacific Energy Pty Ltd Australia 100 100
Kleenparts Pty Ltd Australia 100 100
ERS New Zealand Ltd New Zealand 100 100 35,226 35,226
For
per
sona
l use
onl
y
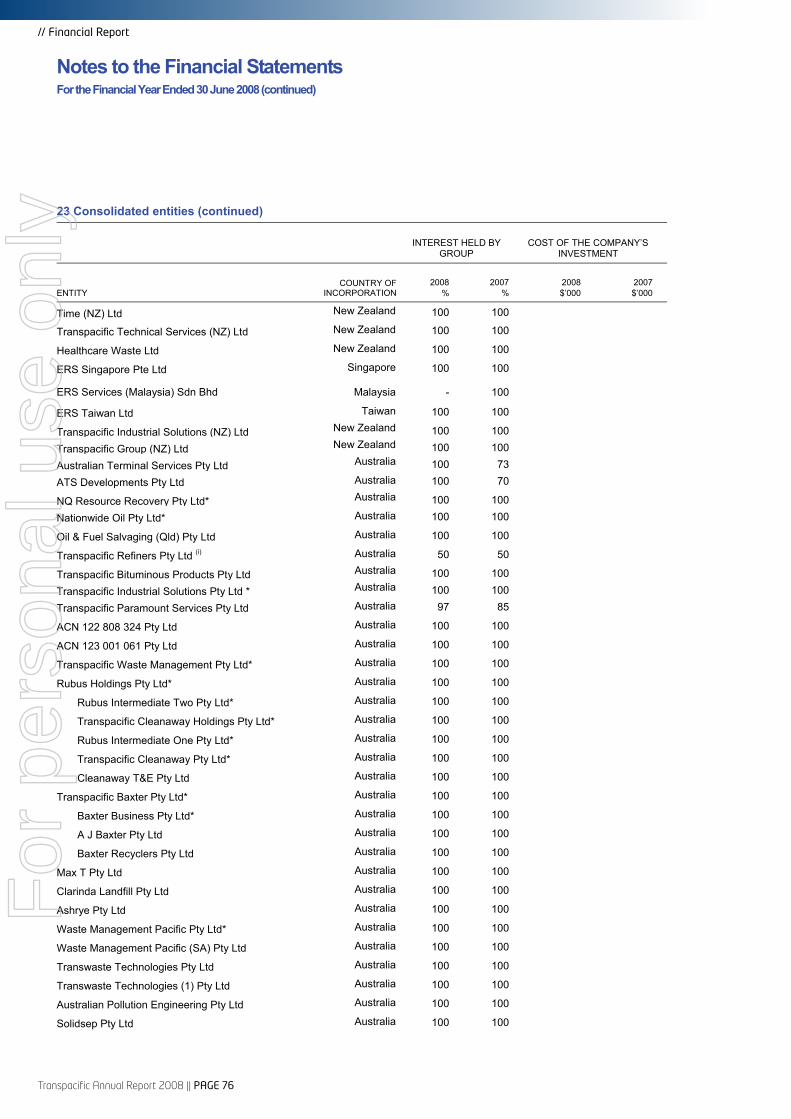
Transpacific Annual Report 2008 || PAGE 76
// Financial Report
Notes to the Financial Statements For the Financial Year Ended 30 June 2008 (continued)
23 Consolidated entities (continued)
INTEREST HELD BY
GROUP COST OF THE COMPANY’S
INVESTMENT
ENTITY COUNTRY OF
INCORPORATION 2008
% 2007
% 2008 $’000
2007 $’000
Time (NZ) Ltd New Zealand 100 100
Transpacific Technical Services (NZ) Ltd New Zealand 100 100
Healthcare Waste Ltd New Zealand 100 100
ERS Singapore Pte Ltd Singapore 100 100
ERS Services (Malaysia) Sdn Bhd Malaysia - 100
ERS Taiwan Ltd Taiwan 100 100
Transpacific Industrial Solutions (NZ) Ltd New Zealand 100 100
Transpacific Group (NZ) Ltd New Zealand 100 100
Australian Terminal Services Pty Ltd Australia 100 73
ATS Developments Pty Ltd Australia 100 70
NQ Resource Recovery Pty Ltd* Australia 100 100
Nationwide Oil Pty Ltd* Australia 100 100
Oil & Fuel Salvaging (Qld) Pty Ltd Australia 100 100
Transpacific Refiners Pty Ltd (i) Australia 50 50
Transpacific Bituminous Products Pty Ltd Australia 100 100
Transpacific Industrial Solutions Pty Ltd * Australia 100 100
Transpacific Paramount Services Pty Ltd Australia 97 85
ACN 122 808 324 Pty Ltd Australia 100 100
ACN 123 001 061 Pty Ltd Australia 100 100
Transpacific Waste Management Pty Ltd* Australia 100 100
Rubus Holdings Pty Ltd* Australia 100 100
Rubus Intermediate Two Pty Ltd* Australia 100 100
Transpacific Cleanaway Holdings Pty Ltd* Australia 100 100
Rubus Intermediate One Pty Ltd* Australia 100 100
Transpacific Cleanaway Pty Ltd* Australia 100 100
Cleanaway T&E Pty Ltd Australia 100 100
Transpacific Baxter Pty Ltd* Australia 100 100
Baxter Business Pty Ltd* Australia 100 100
A J Baxter Pty Ltd Australia 100 100
Baxter Recyclers Pty Ltd Australia 100 100
Max T Pty Ltd Australia 100 100
Clarinda Landfill Pty Ltd Australia 100 100
Ashrye Pty Ltd Australia 100 100
Waste Management Pacific Pty Ltd* Australia 100 100
Waste Management Pacific (SA) Pty Ltd Australia 100 100
Transwaste Technologies Pty Ltd Australia 100 100
Transwaste Technologies (1) Pty Ltd Australia 100 100
Australian Pollution Engineering Pty Ltd Australia 100 100
Solidsep Pty Ltd Australia 100 100
For
per
sona
l use
onl
y

PAGE 77 ||Transpacific Annual Report 2008
23 Consolidated entities (continued)
INTEREST HELD BY
GROUP COST OF THE COMPANY’S
INVESTMENT
ENTITY COUNTRY OF
INCORPORATION 2008
% 2007
% 2008 $’000
2007 $’000
Transpacific Superior Pak Pty Ltd* Australia 100 100
Mann Waste Management Pty Ltd Australia 100 100
Transpacific All-Brite Ltd New Zealand 80 80
Transpacific Environmental Services Pty Ltd Australia 51 51
QORS Pty Ltd Australia 100 100
Olmway Pty Ltd (i) Australia 50 50
L V Rawlinson & Associates Pty Ltd Australia 100 80
Transpacific Biofuels Pty Ltd(i) Australia 50 50
Transpacific Manufacturing Systems P/L Australia 51 51
Canterbury Waste Services Ltd New Zealand 100 50
Transwaste Canterbury Pty Ltd(i) New Zealand 50 25
Tiromoana Station Limited New Zealand 100 50
Enviroguard Pty Ltd Australia 100 50
466,530 466,530
(i) Wholly-owned subsidiaries of the Company have management control and the casting vote of Transpacific Refiners Pty Ltd, Olmway Pty Ltd, Transpacific Biofuels Pty Ltd and Transwaste Canterbury Pty Ltd and thus the Company has the capacity to dominate decision making in relation to the financial and operating policies so as to enable those entities to operate as part of the Group in pursuing its objectives.
* These wholly-owned subsidiaries have entered into a Deed of Cross Guarantee with Transpacific Industries Group Ltd on 29 June 2007 pursuant to ASIC Class Order 98/1418 and are relieved from the requirement to prepare and lodge an audited financial report.
The consolidated Income Statement and Balance Sheet of the entities party to the Deed of Cross Guarantee are:
INCOME STATEMENT 2008$’000
2007$’000
Revenue from continuing activities 1,713,807 871,863 Other income 28,379 3,476
Cost of sales (578,279) (375,473)
Employee expenses (405,334) (193,447)
Depreciation and amortisation expenses (82,960) (42,567)
Finance costs (162,308) (34,197)
Repairs and maintenance (68,843) (26,015)
Fuel purchases (50,269) (17,929)
Leasing charges (13,050) (3,928)
Freight costs (6,913) (10,102)
Other expenses (185,119) (61,673)
Share of net profits of associates accounted for using the equity method 1,460 1,359
Profit before income tax 190,571 111,367
Income tax expense (49,506) (31,399)
Profit from continuing operations 141,065 79,968
For
per
sona
l use
onl
y

Transpacific Annual Report 2008 || PAGE 78
// Financial Report
Notes to the Financial Statements For the Financial Year Ended 30 June 2008 (continued)
23 Consolidated entities (continued)
BALANCE SHEET 2008 $’000
2007$’000
ASSETS Cash and cash equivalents 31,980 73,808
Trade and other receivables 455,360 255,045
Inventories 126,318 98,389
Other assets 20,262 6,836TOTAL CURRENT ASSETS 633,920 434,078
Investments accounted for using the equity method 8,503 18,799
Investments 551,202 519,382
Property, plant and equipment 633,277 458,792
Intangible assets 1,696,990 1,799,359
Deferred tax assets 35,145 16,317TOTAL NON-CURRENT ASSETS 2,925,117 2,812,649TOTAL ASSETS 3,559,037 3,246,727LIABILITIES Trade and other payables 226,844 200,165
Interest-bearing loans and borrowings 381,527 13,034
Income tax payable 23,084 1,662
Employee entitlements 30,584 27,885
Provisions 2,144 7,996
Other 20,308 12,385TOTAL CURRENT LIABILITIES 684,491 263,127
Interest-bearing loans and borrowings 1,619,606 1,806,203Deferred tax liabilities 14,990 15,229
Employee entitlements 8,009 5,667
Deferred government grants 1,559 1,273TOTAL NON-CURRENT LIABILITIES 1,644,164 1,828,372TOTAL LIABILITIES 2,328,655 2,091,499NET ASSETS 1,230,382 1,155,228EQUITY Issued capital 1,158,500 1,041,241
Reserves 46,018 9,248
Retained earnings 25,864 104,739TOTAL EQUITY 1,230,3821 1,155,228F
or p
erso
nal u
se o
nly

PAGE 79 ||Transpacific Annual Report 2008
24 Investments accounted for using the equity method
(A) DETAILS OF INTERESTS IN ASSOCIATES ARE AS FOLLOWS:
OWNERSHIP INTEREST CARRYING VALUE OF
INVESTMENT
ENTITY COUNTRY REPORTING
DATE 2008
% 2007
% 2008 $’000
2007 $’000
Truck and bus dealership:
Western Star Truck Centre Trust Australia 30 June 50 50 (1,176) (800)
Liquid waste management:
Total Waste Management Pty Ltd Australia 31 December 50 50 5,261 5,165
Western Resource Recovery Pty Ltd Australia 31 December 50 50 4,261 3,339
Daniel’s Sharpsmart New Zealand Ltd New Zealand 30 June - 50 - 58
Solid waste management:
Otago Southland Waste Services Ltd New Zealand 30 June 50 50 1,153 1,090
Canterbury Waste Services New Zealand 30 June 100 50 - 7,188
Living Earth Ltd New Zealand 30 June 50 50 1,421 1,879
Midwest Disposals Ltd New Zealand 30 June 50 50 2,460 2,510
Pikes Point Transfer Station Ltd New Zealand 30 June 50 50 991 1,502
Mullan and Noy New Zealand 30 June 50 - 1,177 -
Wellington Waste Disposal Pty Ltd Australia 30 June 50 50 2,319 2,333
Wonthaggi Recyclers Pty Ltd Australia 30 June 50 50 378 37
Enviroguard Pty Ltd Australia 30 June - 50 - 8,172
Earthpower Pty Ltd Australia 30 June 50 - 1,432 -
Enviroway Ltd New Zealand 30 June 50 50 (425) 515
19,252 32,988
The reporting dates for those entities noted as at 31 December is a result of that being the reporting date of the other 50% shareholder.
For
per
sona
l use
onl
y
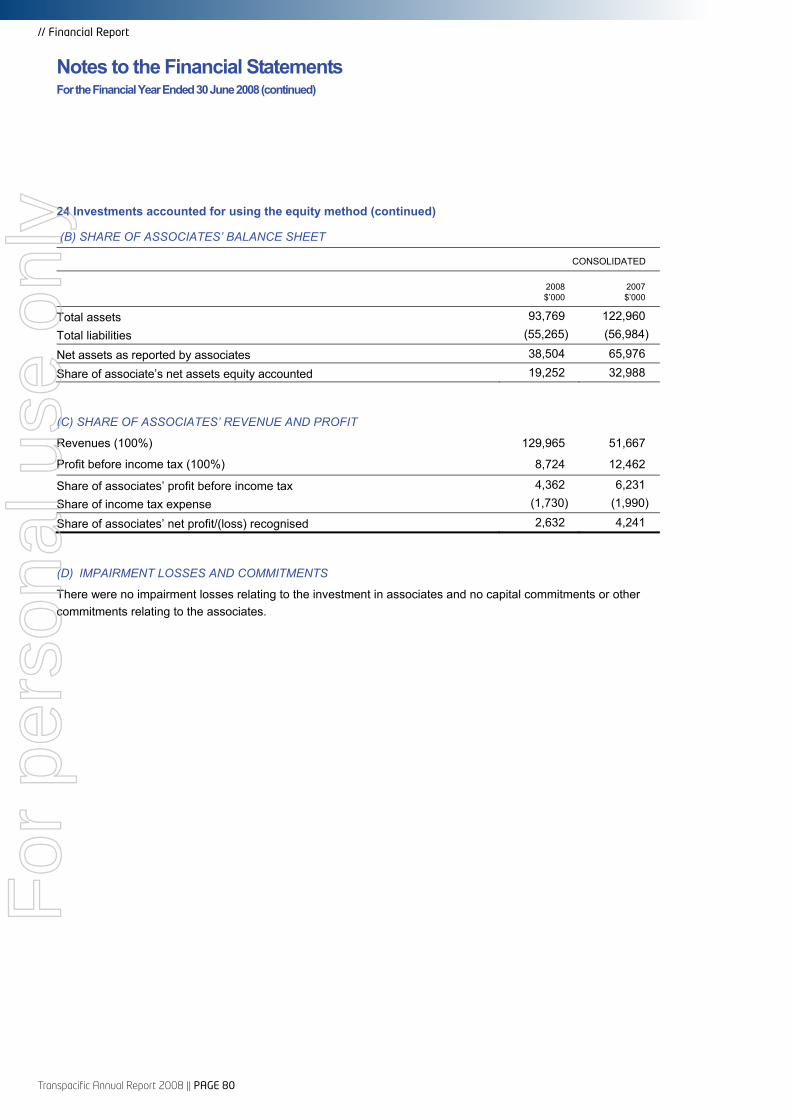
Transpacific Annual Report 2008 || PAGE 80
// Financial Report
Notes to the Financial Statements For the Financial Year Ended 30 June 2008 (continued)
24 Investments accounted for using the equity method (continued)
(B) SHARE OF ASSOCIATES’ BALANCE SHEET
CONSOLIDATED
2008 $’000
2007 $’000
Total assets 93,769 122,960 Total liabilities (55,265) (56,984)
Net assets as reported by associates 38,504 65,976
Share of associate’s net assets equity accounted 19,252 32,988
(C) SHARE OF ASSOCIATES’ REVENUE AND PROFIT
Revenues (100%) 129,965 51,667
Profit before income tax (100%) 8,724 12,462
Share of associates’ profit before income tax 4,362 6,231 Share of income tax expense (1,730) (1,990)
Share of associates’ net profit/(loss) recognised 2,632 4,241
(D) IMPAIRMENT LOSSES AND COMMITMENTS
There were no impairment losses relating to the investment in associates and no capital commitments or other commitments relating to the associates.
For
per
sona
l use
onl
y

PAGE 81 ||Transpacific Annual Report 2008
CONSOLIDATED THE COMPANY
2008 $’000
2007 $’000
2008 $’000
2007 $’000
25 Reconciliation of cash flows from operating activities
Cash flows from operating activities
Profit for the period 195,567 114,302 805 24,787 ADJUSTMENTS FOR
Share options expensed 3,516 3,163 3,516 3,163
Other non-cash items - - 8,660 2,329
Profits on acquisition of businesses (3,250) (2,863) - -
Depreciation 118,089 65,920 - -
Amortisation 11,403 4,223 - -
Bad and doubtful debt expense - - - -
Foreign exchange gain on loan - - - -
Dividends received from associates - - (60,000) (60,000)
Share of associates’ net profits (2,632) (4,241) - -
Net (gain)/loss on disposal of property, plant and equipment (1,139) (2,526) - -
OPERATING PROFIT BEFORE CHANGE IN ASSETS AND LIABILITIES 321,554 177,978 (47,019) (29,721)
CHANGES IN ASSETS AND LIABILITIES
(Increase)/decrease in receivables (39,485) (86,739) 67 (69)
(Increase)/decrease in other assets (1,045) 6,814 - -
(Increase)/decrease in inventories (21,275) (49,946) - -
Increase/(decrease) in payables (1,781) 63,902 (2,658) 14,169
Increase/(decrease) in income tax payable 5,824 (9,502) 3,078 (4,535)
Increase/(decrease) in deferred taxes (7,427) 20,229 315 19,257
Increase/(decrease) in other liabilities 140 5,673 - -
Increase/(decrease) in other provisions (26,671) (10,057) - - NET CASH FROM/(USED IN) OPERATING ACTIVITIES 229,834 118,352 (46,217) (899)
Non-cash financing and investing activities.
During the 2008 year the Group acquired plant and equipment with an aggregate fair value of $55,405,563 (2007: $22,452,673) by means of finance lease. These acquisitions are not reflected in the cash flow statement.
During the year ended 30 June 2008 1,378,863 (2007: 15,993,416) ordinary shares were issued for a value of $13,843,735 (2007: $149,734,000) as part settlement for acquisitions and repayment of loans. These share issues are not reflected in the cash flow statement as they were not cash flows.
For
per
sona
l use
onl
y

Transpacific Annual Report 2008 || PAGE 82
// Financial Report
Notes to the Financial Statements For the Financial Year Ended 30 June 2008 (continued)
26 Business combinations
In September and November 2007, the Group acquired certain Envirowaste Services Ltd assets from Ironbridge Capital Pty Ltd.
From the date of acquisition, the business combination has contributed $16,237,014 to the earnings before income tax, depreciation and amortisation of the consolidated entity.
The aggregated fair value of the identifiable assets and liabilities are:
CONSOLIDATED
RECOGNISED ON ACQUISITION
$’000
CARRYING VALUE
$’000
Cash and cash equivalents 2,650 2,650
Trade and other receivables 4,643 4,643
Inventories 27 27
Other current assets 3,012 3,012
Property, plant and equipment 69,540 69,540
Intangibles 4,440 4,440
Investment in associates (6,732) (6,732)
77,580 77,580
Trade creditors and other payables (4,981) (4,981) Loans (43,621) (43,621)
Employee entitlements (541) (541)
Other (6,184) (6,184)
(55,327) (55,327)
Fair value of net assets 22,253 22,253
Profit arising on acquisition - Goodwill arising on acquisition 62,184
84,437
Consideration:
Shares issued, at fair value -
Costs associated with the acquisition 84,437
Total consideration paid 84,437 The cash outflow on acquisition is as follows:
Net cash acquired with the business 2,650
Costs associated with the acquisition (84,437)
Paid prior year (148)
(81,935)
For
per
sona
l use
onl
y

PAGE 83 ||Transpacific Annual Report 2008
26 Business combinations (continued)
Throughout the year the Group has acquired a number of businesses which are individually immaterial.
The aggregated fair value of the identifiable assets and liabilities of these entities as at their dates of acquisition are:
CONSOLIDATED
RECOGNISED ON ACQUISITION
$’000
CARRYINGVALUE
$’000
Cash and cash equivalents 603 603
Trade and other receivables 4,407 4,407
Inventories 5,517 5,517
Other current assets 4,388 4,388
Future income tax benefits 17,621 17,621
Property, plant and equipment 32,461 32,461
Intangibles 349 349
Investment in associates (4,098) (4,098)
61,248 61,248
Trade creditors and other payables (29,011) (29,011)Employee entitlements (1,803) (1,803)
Loans (2,766) (2,766)
Other provisions (6,348) (6,348)
(39,928) (39,928)
Fair value of net assets 21,320 21,320
Profit arising on acquisition (3,250) Goodwill arising on acquisition 131,461
149,531
Consideration:
Shares issued, at fair value 12,656
Costs associated with the acquisition 133,206
Minority interests 3,669
Total consideration paid 149,531
The cash outflow on acquisition is as follows:
Net cash acquired with the business 603
Costs associated with the acquisition (133,206)
Deferred settlement 19,139
(113,464)
Included in the goodwill recognised on all of the business combinations detailed above are certain intangible assets that cannot be individually separated and reliably measured from the acquiree due to their nature. Assets included in this balance consist of customer loyalty.
A total of 1,237,085 ordinary shares were issued as part settlement of these business combinations. The shares were issued at the three-day volume weighted average share price prior to settlement date.
The Group has a history of turning businesses around and as such, it is impracticable to measure the contribution these business combinations would have made to profit of the Group had they been held for the full year.
For
per
sona
l use
onl
y

Transpacific Annual Report 2008 || PAGE 84
// Financial Report
Notes to the Financial Statements For the Financial Year Ended 30 June 2008 (continued)
CONSOLIDATED THE COMPANY
NOTES 2008 $’000
2007 $’000
2008 $’000
2007 $’000
27 Commitments and contingencies
(A) OPERATING LEASE COMMITMENTS
The Group leases property, plant and equipment under operating leases expiring over terms of up to ten years. Leases generally provide the Group with a right of renewal at which time all terms are renegotiated.
Non-cancellable operating lease rentals are payable as follows:
Within one year 24,098 14,752 - -
Between one and five years 53,586 26,440 - -
More than five years 46,543 25,221 - -
124,227 66,413 - -
(B) FINANCE LEASE AND HIRE PURCHASE COMMITMENTS
The Group leases plant and equipment under finance leases and hire purchase agreements expiring over terms of up to seven years. At the end of the lease term the Group generally has the option to purchase the equipment at a percentage of market value.
Commitments in relation to finance leases are payable as follows:
Within one year 24,867 16,029 - -
Between one and five years 80,671 46,513 - -
More than five years 6,638 1,509 - -
Minimum lease payments 112,176 64,051 - - Less:
Future finance charges (19,703) (9,556) - - TOTAL LIABILITIES 92,473 54,495 - -
Representing: Current 17 19,296 14,054 - -
Non-current 17 73,177 40,441 - - TOTAL LIABILITIES 92,473 54,495 - -
(C) CAPITAL EXPENDITURE AND OTHER COMMITMENTS
Commitments in relation to capital expenditure and purchase commitments entered into:
Within one year 31,097 10,302 - -
Other 8,102 - - - COMMITMENTS NOT RECOGNISED IN THE FINANCIAL STATEMENTS 39,199 10,302 - -
For
per
sona
l use
onl
y

PAGE 85 ||Transpacific Annual Report 2008
CONSOLIDATED THE COMPANY
NOTES 2008$’000
2007$’000
2008 $’000
2007 $’000
27 Commitments and contingencies (continued)
(D) GUARANTEES
The Group is, in the normal course of business, required to provide guarantees and letters of credit on behalf of controlled entities and associates in respect of their contractual performance-related obligations.These guarantees and indemnities only give rise to a liability where the entity concerned fails to perform its contractual obligations.
Letters of credit issued to suppliers 4,923 70 - -
Bank guarantees outstanding at balance date in respect of financing facilities 70,126 141,342 - -
Bank guarantees outstanding at balance date in respect of contractual performance 62,672 95,853 - -
137,721 237,265 - -
(E) CONTINGENT LIABILITIES
The Directors are of the opinion that there are no contingent liabilities relating to current or threatened litigation or other matters that require disclosure in the financial report.
28 Auditor’s remuneration
CONSOLIDATED THE COMPANY
2008 $’000
2007 $’000
2008 $’000
2007 $’000
1. Audit services:
Bentleys Brisbane Partnership 861 394 - -
Overseas auditors associated with Bentleys Brisbane Partnership 211 184 - -
Total audit services 1,072 578 - -
2. Non-audit services: Due diligence services:
Bentleys Brisbane Partnership and Bentleys (Qld) Pty Ltd 49 105 - -
Other:
Bentleys Brisbane Partnership and Bentleys (Qld) Pty Ltd 43 - - -
Overseas auditors associated with Bentleys 23 - - -
115 105 - -
Taxation services: Bentleys (Qld) Pty Ltd 60 126 - -
Overseas auditors associated with Bentleys 18 8 - -
78 134 - -
Total non-audit services 193 239 - -
For
per
sona
l use
onl
y
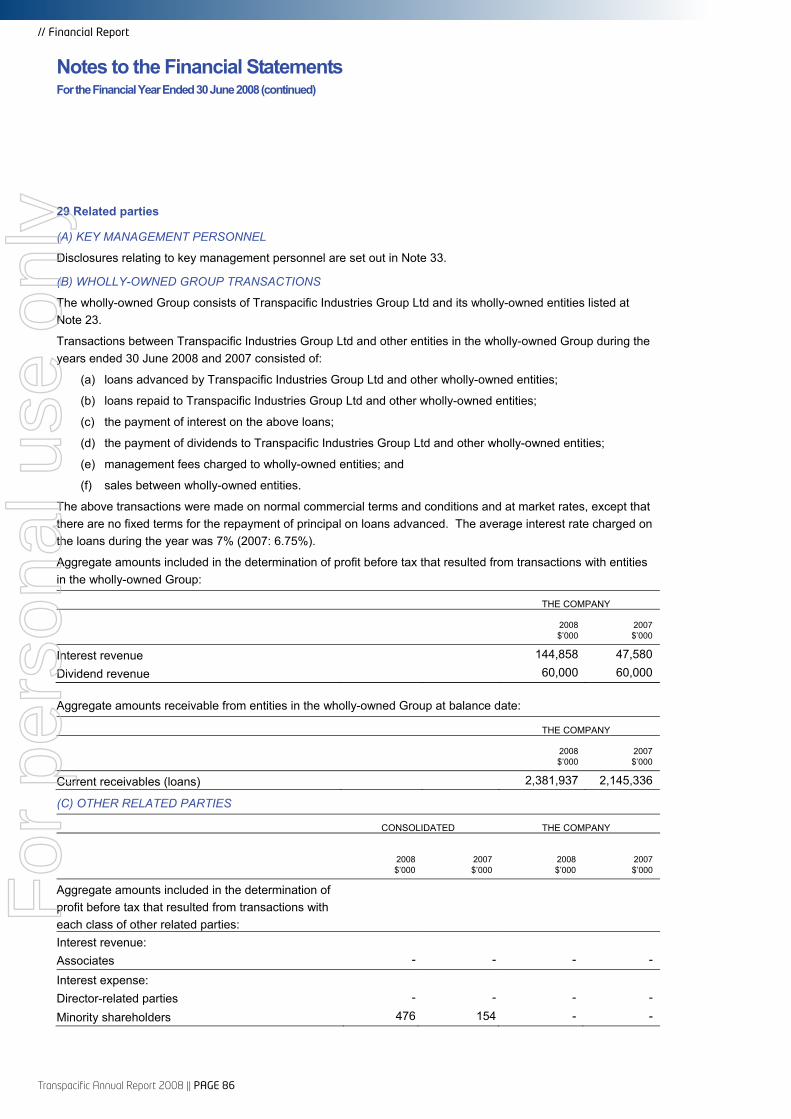
Transpacific Annual Report 2008 || PAGE 86
// Financial Report
Notes to the Financial Statements For the Financial Year Ended 30 June 2008 (continued)
29 Related parties
(A) KEY MANAGEMENT PERSONNEL
Disclosures relating to key management personnel are set out in Note 33.
(B) WHOLLY-OWNED GROUP TRANSACTIONS
The wholly-owned Group consists of Transpacific Industries Group Ltd and its wholly-owned entities listed at Note 23.
Transactions between Transpacific Industries Group Ltd and other entities in the wholly-owned Group during the years ended 30 June 2008 and 2007 consisted of:
(a) loans advanced by Transpacific Industries Group Ltd and other wholly-owned entities;
(b) loans repaid to Transpacific Industries Group Ltd and other wholly-owned entities;
(c) the payment of interest on the above loans;
(d) the payment of dividends to Transpacific Industries Group Ltd and other wholly-owned entities;
(e) management fees charged to wholly-owned entities; and
(f) sales between wholly-owned entities.
The above transactions were made on normal commercial terms and conditions and at market rates, except that there are no fixed terms for the repayment of principal on loans advanced. The average interest rate charged on the loans during the year was 7% (2007: 6.75%).
Aggregate amounts included in the determination of profit before tax that resulted from transactions with entities in the wholly-owned Group:
THE COMPANY
2008 $’000
2007 $’000
Interest revenue 144,858 47,580 Dividend revenue 60,000 60,000
Aggregate amounts receivable from entities in the wholly-owned Group at balance date:
THE COMPANY
2008 $’000
2007 $’000
Current receivables (loans) 2,381,937 2,145,336
(C) OTHER RELATED PARTIES
CONSOLIDATED THE COMPANY
2008$’000
2007$’000
2008 $’000
2007 $’000
Aggregate amounts included in the determination of profit before tax that resulted from transactions with each class of other related parties:
Interest revenue: Associates - - - -
Interest expense: Director-related parties - - - -
Minority shareholders 476 154 - -
For
per
sona
l use
onl
y

PAGE 87 ||Transpacific Annual Report 2008
29 Related parties (continued)
(C) OTHER RELATED PARTIES (CONTINUED)
CONSOLIDATED THE COMPANY
2008$’000
2007$’000
2008 $’000
2007 $’000
Aggregate amounts brought to account in relation to other transactions with each class of other related parties:
Loans advanced to/(from):
Associates (564) - - -
Minority shareholders - (3,587) - -
Loan repayments (from):
Associates - (642) - -
Minority shareholders - - - -
Loan repayments to:
Associates - 1,900 - -
Minority shareholders 4,636 892 - -
Aggregate amounts receivable from, and payable to, each class of other related parties at balance date:
Current receivables:
Associates 1,310 - - -
Director-related entities - - - -
Minority shareholders - - - -
1,310 - - -
Current payables: Associates 16 - - -
Director-related entities - - - -
Minority shareholders 49 - - -
65 - - -
Current borrowings: Associates 7,723 5,824 - -
7,723 5,824 - -
Non-current borrowings: Minority shareholders - 4,636 - -
- 4,636 - -
Transactions were made on normal commercial terms and conditions and at market rates, except that there are no fixed terms for the repayment of loans between the parties. Interest was charged at 7% (2007: 6.5%).
A number of key management persons or their related parties, hold positions in other entities that result in them having control or significant influence over the financial or operating policies of those entities.
A number of these entities transacted with the Company or its subsidiaries in the reporting period. The terms and conditions of the transactions with management persons and their related parties were no more favourable than those available, or which might reasonably be expected to be available, on similar transactions to Non-Director related entities on an arm’s length basis.
For
per
sona
l use
onl
y

Transpacific Annual Report 2008 || PAGE 88
// Financial Report
Notes to the Financial Statements For the Financial Year Ended 30 June 2008 (continued)
29 Related parties (continued)
(C) OTHER RELATED PARTIES (CONTINUED)
The Group expensed $252,411 (2007: $135,650) for the hire of aircraft from Brenzil Pty Ltd (an entity related to Mr Terry Peabody) which was used to fly Transpacific Executives in connection with the acquisition of businesses, bank negotiations and investor relations. $203,770 (2007: $430,000) was capitalised to the cost of acquisitions. The Group performed a small amount of administrative work in relation to Brenzil Pty Ltd. No charter revenue or costs, other than when the Group hires the aircraft, are borne by the Group. The Group charges the related party $10,000 per annum for administration time. At 30 June 2008 the related party owed $205,051 (2007: $261) to the Group.
The Group performs a small amount of administrative work for Craggy Range Australia Pty Ltd, an entity related to Mr Terry Peabody, throughout the year. At 30 June 2008 the related party owed $326,450 (2007: $214,867) in respect of the business and its employees. The Group incurs no profit or loss on these transactions.
The Company administered charters and costs in relation to Tengis Ltd an entity related to Mr Terry Peabody. At 30 June 2008, the related party owed $108,953 to the Company (2007: $398,155). The Company incurs no profit or loss on these transactions.
Consulting fees of $55,643 (2007: nil) were paid by the Group to International Infrastructure Ventures Pty Ltd. Mr Graham Mulligan, a Non-Executive Director of the Group, is the Managing Director and owner of this company. The Group trades on normal commercial terms and conditions on an arm’s length basis with Campbell Brothers Ltd. Mr Bruce Brown, a Non-Executive Director of the Group, is a Non-Executive Director of this company.
30 Segment information
The Group has adopted AASB 8 “Operating Segments” and AASB 2007-3 “Amendments to Australian Accounting Standards” arising from AASB 8 in advance of their effective dates, with effect from 1 July 2007. AASB 8 requires operating segments to be identified on the basis of internal reports about components of the Group that are regularly reviewed by the chief operating decision maker in order to allocate resources to the segment and to assess its performance. As a result, following the adoption of AASB 8, there is no change to the Group’s reportable segments. Reporting is based on the Group’s management reporting divisions. Inter-segment pricing is determined on an arm’s length basis. Segment results, assets and liabilities include items directly attributable to a segment as well as those that can be allocated on a reasonable basis. Unallocated items comprise mainly options expense and profits on business combinations. Segment capital expenditure is the total cost incurred during the period to acquire segment assets that are expected to be used for more than one period.
PRIMARY REPORTING – BUSINESS SEGMENTS
The Group comprises the following main business segments:
Liquid waste management
Includes collection, transportation, treatment and sale or disposal of liquid waste
Energy
Includes collection, transportation, treatment and sale or disposal of waste mineral oil and cooking oil
Industrial solutions
Includes industrial cleaning, high pressure water blasting and manufacture and lease out of parts washers
Commercial vehicles Importation and distribution of commercial vehicles and parts Solid waste management
Includes collection, transportation, recycling and disposal of solid waste
Other
Includes the manufacturing and biosolids divisions. These have not been disclosed separately due to immateriality.
For
per
sona
l use
onl
y

PAGE 89 ||Transpacific Annual Report 2008
30 Segment information (continued)
2008
LIQUID WASTE MANAGEMENT
$’000 ENERGY
$’000
INDUSTRIAL SOLUTIONS
$’000
COMMERCIAL VEHICLES
$’000
SOLID WASTE
$’000 OTHER $’000 CONSOLIDATED
$’000
Revenue
Sales – external 182,277 110,658 284,718 473,893 1,011,012 87,057 2,149,615
Inter-segment sales 31,734 18,868 9,383 - 33,703 16,447 110,135
Total Sales 214,011 129,526 294,101 473,893 1,044,715 103,504 2,259,750
Other revenue 5,259 17,944 1,690 1,495 12,928 158 39,474
Total segment revenue 219,270 147,470 295,791 475,388 1,057,643 103,662 2,299,224
Inter-segment elimination
(110,135)
Unallocated revenue
2,882
Total consolidated
2,191,971
Result
Segment result 30,396 30,719 20,502 43,422 178,341 6,664 310,044
Unallocated revenue less unallocated expenses
(72,811) Share of profit of associates 1,018 - - - 1,614
2,632
PROFIT BEFORE INCOME TAX
239,865
Income tax expense (44,298)
NET PROFIT 195,567
Segment assets 368,767 144,564 287,542 189,259 3,549,861 121,494 4,661,487Investments in associates 9,522 - 18 (1,176) 10,888
19,252
Unallocated assets 1,779,282
Eliminations (2,132,044)
TOTAL ASSETS 4,327,977
Segment liabilities 315,000 82,082 200,514 93,387 2,350,887 81,940 3,123,810
Unallocated liabilities 315,579
Eliminations (619,003)
TOTAL LIABILITIES 2,820,386
Depreciation and amortisation expense 10,166 5,747 20,704 929
79,381 2,157 119,084
Unallocated 4,020
Total depreciation and amortisation
123,104
Acquisition property, plant and equipment 22,716 18,895 40,243 4,111 198,389 14,878 299,232
For
per
sona
l use
onl
y
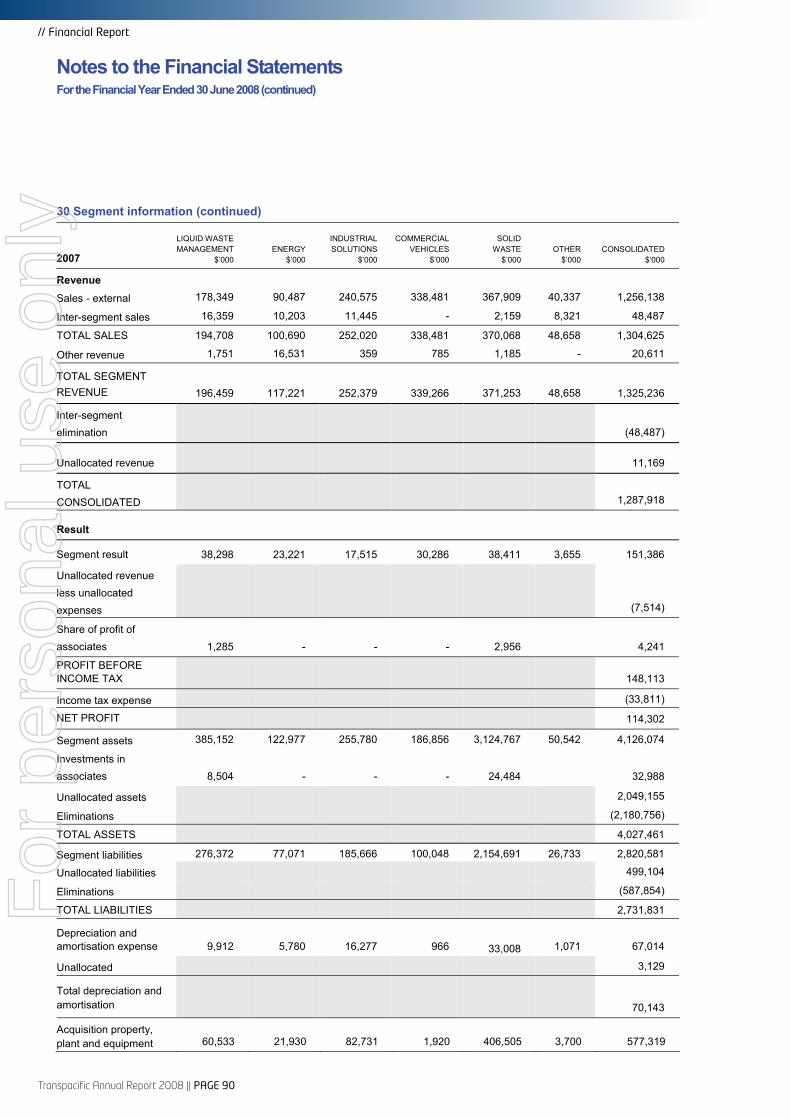
Transpacific Annual Report 2008 || PAGE 90
// Financial Report
Notes to the Financial Statements For the Financial Year Ended 30 June 2008 (continued)
30 Segment information (continued)
2007
LIQUID WASTE MANAGEMENT
$’000 ENERGY
$’000
INDUSTRIAL SOLUTIONS
$’000
COMMERCIAL VEHICLES
$’000
SOLID WASTE
$’000 OTHER
$’000 CONSOLIDATED
$’000
Revenue
Sales - external 178,349 90,487 240,575 338,481 367,909 40,337 1,256,138
Inter-segment sales 16,359 10,203 11,445 - 2,159 8,321 48,487
TOTAL SALES 194,708 100,690 252,020 338,481 370,068 48,658 1,304,625
Other revenue 1,751 16,531 359 785 1,185 - 20,611
TOTAL SEGMENT REVENUE 196,459 117,221 252,379 339,266
371,253
48,658 1,325,236
Inter-segment elimination
(48,487)
Unallocated revenue
11,169
TOTAL CONSOLIDATED
1,287,918
Result
Segment result 38,298 23,221 17,515 30,286 38,411 3,655 151,386
Unallocated revenue less unallocated expenses
(7,514)
Share of profit of associates 1,285 - - - 2,956
4,241
PROFIT BEFORE INCOME TAX
148,113
Income tax expense (33,811)
NET PROFIT 114,302
Segment assets 385,152 122,977 255,780 186,856 3,124,767 50,542 4,126,074
Investments in associates 8,504 - - - 24,484
32,988
Unallocated assets 2,049,155
Eliminations (2,180,756)
TOTAL ASSETS 4,027,461
Segment liabilities 276,372 77,071 185,666 100,048 2,154,691 26,733 2,820,581
Unallocated liabilities 499,104
Eliminations (587,854)
TOTAL LIABILITIES 2,731,831
Depreciation and amortisation expense 9,912 5,780 16,277 966
33,008 1,071 67,014
Unallocated 3,129
Total depreciation and amortisation
70,143
Acquisition property, plant and equipment 60,533 21,930 82,731 1,920 406,505 3,700 577,319
For
per
sona
l use
onl
y

PAGE 91 ||Transpacific Annual Report 2008
30 Segment information (continued)
SECONDARY REPORTING – GEOGRAPHICAL SEGMENTS
In presenting information on the basis of geographic segments, segment revenue is based on the geographical location of business. Segment assets are based on the geographical location of the assets:
Australia All business segments have operations. New Zealand All business segments have operations. South East Asia Industrial services operations and commercial vehicles sales.
2008 AUSTRALIA
$’000
NEW ZEALAND
$’000
SOUTH EAST ASIA $’000
TOTAL $’000
Sales to external customers 1,763,719 385,379 517 2,149,615 Segment net assets 1,260,725 247,392 (526) 1,507,591
Acquisition of property, plant and equipment 118,997 39,281 76 158,354
2007 AUSTRALIA
$’000
NEW ZEALAND
$’000
SOUTH EAST ASIA $’000
TOTAL $’000
Sales to external customers 956,085 299,514 539 1,256,138 Segment net assets 555,641 740,247 (258) 1,295,630
Acquisition of property, plant and equipment 501,602 150,260 - 651,862
31 Financial instruments
The Group’s principal financial instruments, other than derivatives, comprise bank loans, finance leases and hire purchase contracts, cash and short-term deposits.
The main purpose of these financial instruments is to raise finance for the Group’s operations. The Group has various other financial instruments such as trade receivables, trade payables and equity investments.
The Group also enters into derivative transactions, principally interest rate swaps and forward currency contracts. The purpose is to manage the interest rate and currency risks arising from the Group’s operations and its sources of finance.
It is the Group’s policy that no trading in financial instruments shall be undertaken.
The main risks arising from the Group’s financial instruments are foreign currency risk, interest rate risk, liquidity risk and credit risk. The Board reviews and agrees policies for managing each of these risks and they are summarised below.
For
per
sona
l use
onl
y
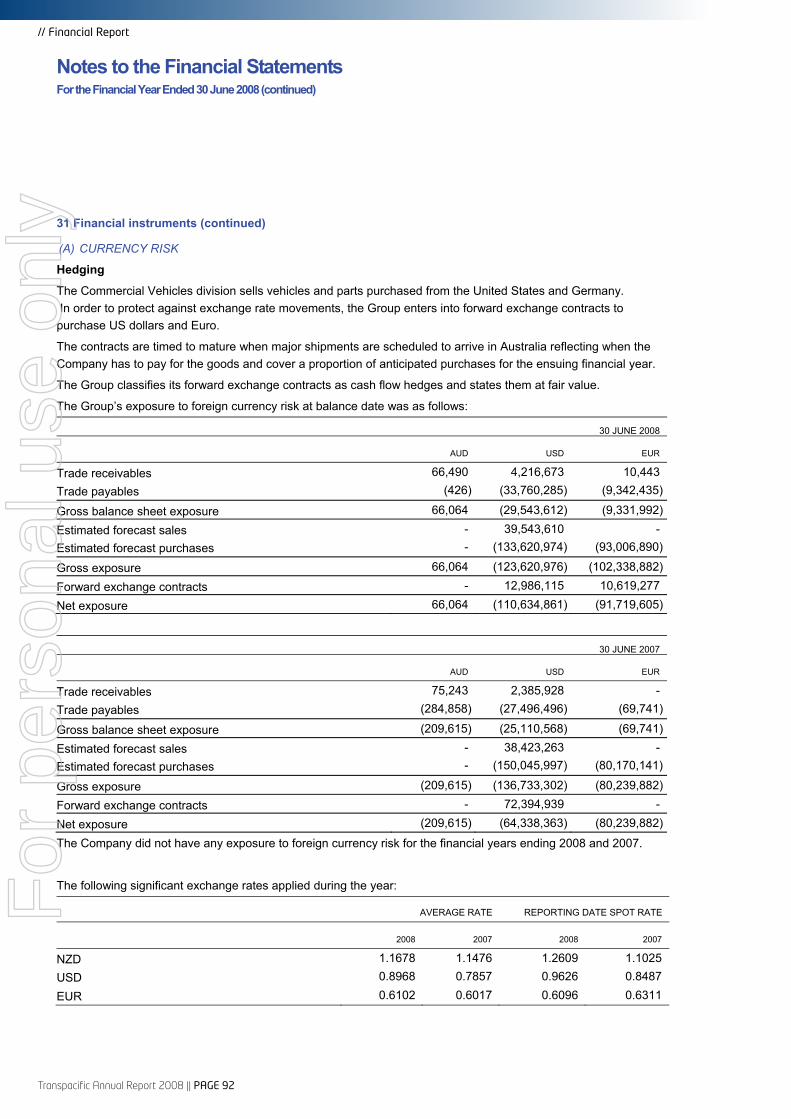
Transpacific Annual Report 2008 || PAGE 92
// Financial Report
Notes to the Financial Statements For the Financial Year Ended 30 June 2008 (continued)
31 Financial instruments (continued)
(A) CURRENCY RISK
Hedging
The Commercial Vehicles division sells vehicles and parts purchased from the United States and Germany. In order to protect against exchange rate movements, the Group enters into forward exchange contracts to purchase US dollars and Euro.
The contracts are timed to mature when major shipments are scheduled to arrive in Australia reflecting when the Company has to pay for the goods and cover a proportion of anticipated purchases for the ensuing financial year.
The Group classifies its forward exchange contracts as cash flow hedges and states them at fair value.
The Group’s exposure to foreign currency risk at balance date was as follows:
30 JUNE 2008
AUD USD EUR
Trade receivables 66,490 4,216,673 10,443 Trade payables (426) (33,760,285) (9,342,435)
Gross balance sheet exposure 66,064 (29,543,612) (9,331,992)
Estimated forecast sales - 39,543,610 - Estimated forecast purchases - (133,620,974) (93,006,890)
Gross exposure 66,064 (123,620,976) (102,338,882)
Forward exchange contracts - 12,986,115 10,619,277
Net exposure 66,064 (110,634,861) (91,719,605)
30 JUNE 2007
AUD USD EUR
Trade receivables 75,243 2,385,928 - Trade payables (284,858) (27,496,496) (69,741)
Gross balance sheet exposure (209,615) (25,110,568) (69,741)
Estimated forecast sales - 38,423,263 - Estimated forecast purchases - (150,045,997) (80,170,141)
Gross exposure (209,615) (136,733,302) (80,239,882)
Forward exchange contracts - 72,394,939 -
Net exposure (209,615) (64,338,363) (80,239,882)
The Company did not have any exposure to foreign currency risk for the financial years ending 2008 and 2007.
The following significant exchange rates applied during the year:
AVERAGE RATE REPORTING DATE SPOT RATE
2008 2007 2008 2007
NZD 1.1678 1.1476 1.2609 1.1025 USD 0.8968 0.7857 0.9626 0.8487
EUR 0.6102 0.6017 0.6096 0.6311
For
per
sona
l use
onl
y

PAGE 93 ||Transpacific Annual Report 2008
31 Financial instruments (continued)
(A) CURRENCY RISK (CONTINUED)
Sensitivity analysis
A 10% strengthening of the Australian dollar against the following currencies at 30 June would have increased (decreased) equity and profit or loss by the amounts shown below. This analysis assumes that all other variables, in particular interest rates, remain constant.
CONSOLIDATED COMPANY
EQUITY NPAT EQUITY NPAT
30 June 2008 NZD (16,446,645) (1,856,828) - -
30 June 2007
NZD (40,533,594) (639,233) - -
A 10% weakening of the Australian dollar against the above currencies at 30 June would have had the equal but opposite effect on the above currencies to the amounts shown above, on the basis that all other variables remain constant.
(B) CREDIT RISK EXPOSURES
Management has a credit policy in place and exposure to credit risk is monitored on an ongoing basis. Credit evaluations are performed on all customers requiring credit over a certain amount. The Group does not require collateral in respect of financial assets. For certain export sales the Group requires the vendor to provide a letter of credit.
The Group minimises concentrations of credit risk by undertaking transactions with a large number of customers. Credit risk on interest rate and foreign exchange contracts is minimal as counterparties are large Australian and international banks with acceptable credit ratings determined by a recognised ratings agency.
The maximum exposure to credit risk is represented by the carrying amount of each financial asset, including derivative financial instruments, in the balance sheet. The Group’s maximum exposure to credit risk at the reporting date was:
CARRYING AMOUNT
NOTES 2008 $’000
2007 $’000
Available-for-sale financial assets 11 73,337 27,733 Loans and receivables 9 358,890 309,167
Cash and cash equivalents (excluding bank overdrafts) 8 58,306 223,209
Other forward exchange contracts (derivatives) 11 19,482 3,805
510,015 563,914
The Company’s maximum exposure to credit risk at the reporting date was $2,381,939,000 (2007: $2,145,405,000) for loans and receivables from group companies and $2,547,000 (2007: $10,789,000) for cash and cash equivalents and $8,951,000 (2007: $3,165,000) for forward exchange contracts, totalling $2,410,465,000 (2007: $2,159,359,000).
For
per
sona
l use
onl
y

Transpacific Annual Report 2008 || PAGE 94
// Financial Report
Notes to the Financial Statements For the Financial Year Ended 30 June 2008 (continued)
31 Financial instruments (continued)
(B) CREDIT RISK EXPOSURES (CONTINUED)
The Group’s maximum exposure to credit risk for trade receivables at reporting date by geographic region was:
CARRYING AMOUNT
2008 $’000
2007 $’000
Australia 264,528 237,610 New Zealand 47,583 37,694
Asia 391 471
312,502 275,775
The Company’s maximum exposure to credit risk for trade receivables at the reporting date by geographic region was Australia $2,220,432,000 (2007: $2,141,424,000) and New Zealand $161,507,000 (2007: $3,981,000). All receivables are due from subsidiaries.
(C) INTEREST RATE RISK EXPOSURES
Hedging
The Group’s exposure to interest rate risk is predominantly cash flow interest rate risk. The Group adopts a policy of ensuring at least 40% of its exposure to changes in interest rates on borrowings is on a fixed rate basis. Accordingly, the Group has entered into interest rate swap contracts under which it is obliged to receive interest at variable rates and to pay interest at fixed rates. The contracts are settled on a net basis and require settlement of net interest receivable or payable each 30 days or 90 days.
Swaps currently in place cover approximately 44% (2007 – 44%) of term debt outstanding and expire November 2008, July 2009, October 2010, September 2011, March 2013 and February 2015. The fixed interest rates currently range between BBSY 5.46% and 6.93% (2007: 6.16% – 7.04%).
The Group classifies interest rate swaps as cash flow hedges and states them at fair value.
At the reporting date the interest rate profile of the Company and the Group’s interest-bearing financial instruments was:
CONSOLIDATED CARRYING
AMOUNT COMPANY CARRYING AMOUNT
2008$’000
2007$’000
2008 $’000
2007 $’000
Fixed rate instruments Financial assets 78,482 226,264 2,393,435 2,159,290
Financial liabilities (989,723) (62,343) (516,696) -
(911,241) 163,921 1,876,739 2,159,290
Variable rate instruments Financial liabilities (1,436,542) (2,236,223) (1,480,421) (1,740,641)
(2,347,783) (2,072,302) 396,318 418,649
For
per
sona
l use
onl
y
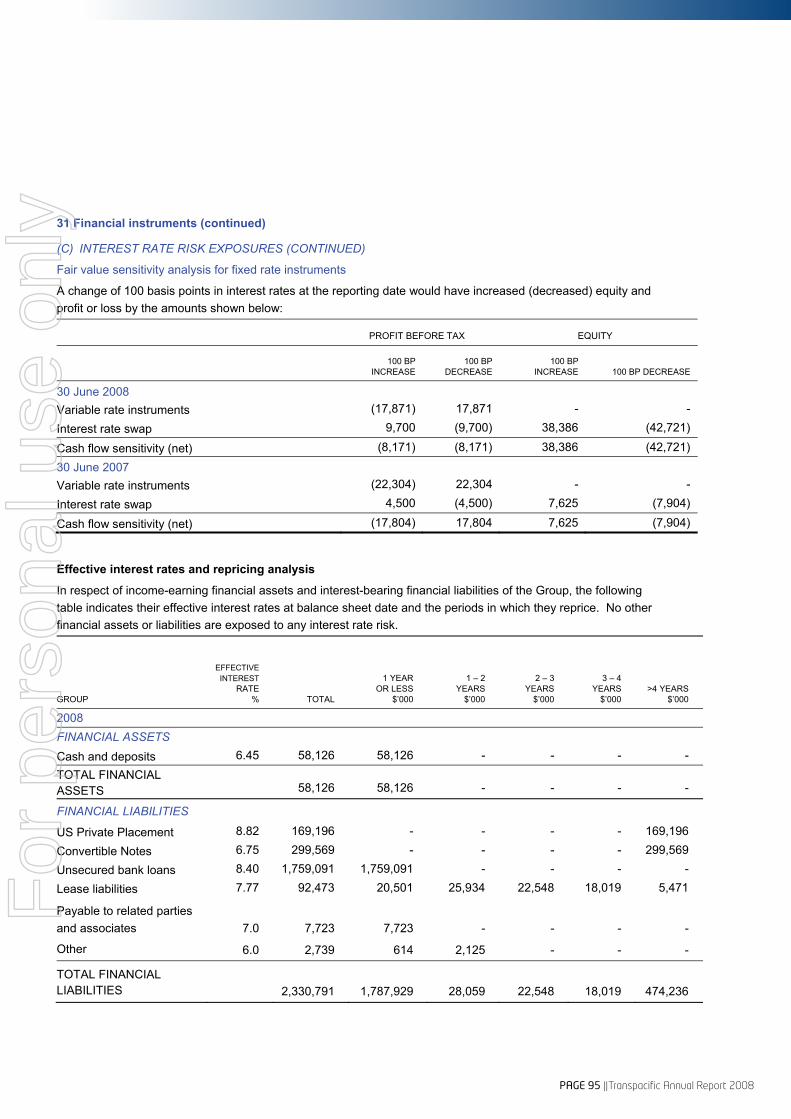
PAGE 95 ||Transpacific Annual Report 2008
31 Financial instruments (continued)
(C) INTEREST RATE RISK EXPOSURES (CONTINUED)
Fair value sensitivity analysis for fixed rate instruments
A change of 100 basis points in interest rates at the reporting date would have increased (decreased) equity and profit or loss by the amounts shown below:
PROFIT BEFORE TAX EQUITY
100 BP
INCREASE 100 BP
DECREASE 100 BP
INCREASE 100 BP DECREASE
30 June 2008 Variable rate instruments (17,871) 17,871 - -
Interest rate swap 9,700 (9,700) 38,386 (42,721)
Cash flow sensitivity (net) (8,171) (8,171) 38,386 (42,721)
30 June 2007 Variable rate instruments (22,304) 22,304 - -
Interest rate swap 4,500 (4,500) 7,625 (7,904)
Cash flow sensitivity (net) (17,804) 17,804 7,625 (7,904)
Effective interest rates and repricing analysis
In respect of income-earning financial assets and interest-bearing financial liabilities of the Group, the following table indicates their effective interest rates at balance sheet date and the periods in which they reprice. No other financial assets or liabilities are exposed to any interest rate risk.
GROUP
EFFECTIVE INTEREST
RATE % TOTAL
3 – 4 YEARS
$’000 >4 YEARS
$’000
1 YEAR OR LESS
$’000
1 – 2 YEARS
$’000
2 – 3 YEARS
$’000
2008 FINANCIAL ASSETS
Cash and deposits 6.45 58,126 58,126 - - - - TOTAL FINANCIAL ASSETS 58,126 58,126 - - - -
FINANCIAL LIABILITIES
US Private Placement 8.82 169,196 - - - - 169,196
Convertible Notes 6.75 299,569 - - - - 299,569
Unsecured bank loans 8.40 1,759,091 1,759,091 - - - -
Lease liabilities 7.77 92,473 20,501 25,934 22,548 18,019 5,471
Payable to related parties and associates 7.0 7,723 7,723 - - - -
Other 6.0 2,739 614 2,125 - - -
TOTAL FINANCIAL LIABILITIES 2,330,791 1,787,929 28,059 22,548 18,019 474,236
For
per
sona
l use
onl
y

Transpacific Annual Report 2008 || PAGE 96
// Financial Report
Notes to the Financial Statements For the Financial Year Ended 30 June 2008 (continued)
31 Financial instruments (continued)
GROUP
EFFECTIVE INTEREST
RATE % TOTAL
3 – 4 YEARS
$’000 >4 YEARS
$’000
1 YEAR OR LESS
$’000
1 – 2 YEARS
$’000
2 – 3 YEARS
$’000
2007 FINANCIAL ASSETS
Cash and deposits 6.11 222,459 222,459 - - - -
Loans to related parties and associates 7.0 8,848 8,848 - - - -
TOTAL FINANCIAL ASSETS 231,307 231,307 - - - -
FINANCIAL LIABILITIES
Unsecured bank loans 7.09 2,234,154 2,222,136 3,610 4,063 4,345 -
Lease liabilities 7.04 54,495 14,054 13,250 12,071 10,762 4,358
Payable to related parties and associates 6.2 10,460 5,824 4,636 - - -
TOTAL FINANCIAL LIABILITIES 2,299,109 2,242,014 21,496 16,134 15,107 4,358
In respect of income-earning financial assets and interest-bearing financial liabilities of the Company, the following table indicates their effective interest rates at balance sheet date and the periods in which they reprice. No other financial assets or liabilities are exposed to any interest rate risk.
THE COMPANY
EFFECTIVE INTEREST
RATE % TOTAL
3 – 4 YEARS
$’000 >4 YEARS
$’000
1 YEAR OR LESS
$’000
1 – 2 YEARS
$’000
2 – 3 YEARS
$’000
2008 FINANCIAL ASSETS Cash and deposits 6.12 2,547 2,547 - - - - Loans to related parties and associates 7.0 2,371,437 2,371,437 - - - -
TOTAL FINANCIAL ASSETS 2,373,984 2,373,984 - - - -
FINANCIAL LIABILITIES
US Private Placement 8.82 169,196 - - - - 169,196
Convertible Notes 6.75 299,569 - - - - 299,569
Unsecured bank loans 8.40 1,441,970 1,441,970 - - - -
TOTAL FINANCIAL LIABILITIES 1,910,735 1,441,970 - - - 468,765
For
per
sona
l use
onl
y

PAGE 97 ||Transpacific Annual Report 2008
31 Financial instruments (continued)
THE COMPANY
EFFECTIVE INTEREST
RATE % TOTAL
3 – 4 YEARS
$’000
>4 YEARS
$’000
1 YEAR OR LESS
$’000
1 – 2 YEARS
$’000
2 – 3 YEARS
$’000
2007
FINANCIAL ASSETS
Cash and deposits 6.2 10,789 10,789 - - - - Loans to related parties and associates 6.5 2,145,336 2,145,336 - - - -
TOTAL FINANCIAL ASSETS 2,156,125 2,156,125 - - - -
FINANCIAL LIABILITIES
Unsecured bank loans 6.7 1,738,572 1,738,572 - - - -
TOTAL FINANCIAL LIABILITIES 1,738,572 1,738,572 - - - -
(D) LIQUIDITY RISK
The following table discloses the contractual maturities of financial liabilities, including estimated interest payment and excluding the impact of netting agreements:
CONSOLIDATED
CARRYING AMOUNT
$’000
CONTRACT-UAL CASH
FLOWS $’000
MORE THAN 5 YEARS
$’000
LESS THAN ONE YEAR
$’000 1 – 2 YEARS
$’000 2 – 5 YEARS
$’000
2008
Non-derivative financial liabilities
US Private Placement 169,196 (259,526) (14,937) (14,937) (154,554) (75,098)
Convertible Notes 299,569 (499,965) (23,456) (23,456) (70,369) (382,684)
Loans from associates 7,723 (8,264) (8,264)
Finance lease liabilities 92,473 (112,176) (24,867) (31,460) (49,211) (6,638)
Unsecured bank loans 1,759,091 (2,143,446) (497,867) (123,079) (1,522,500) -
Trade and other payables* 278,667 (278,667) (278,667) - - -
Bank overdraft 180 (180) (180) - - -
Derivative financial liabilities
Interest rate swaps used for hedging 11,831 (11,831) (11,831) - - -
2,618,730 (3,314,055) (860,069) (192,932) (1,796,634) (464,420)
* Excludes derivatives shown separately.
For
per
sona
l use
onl
y
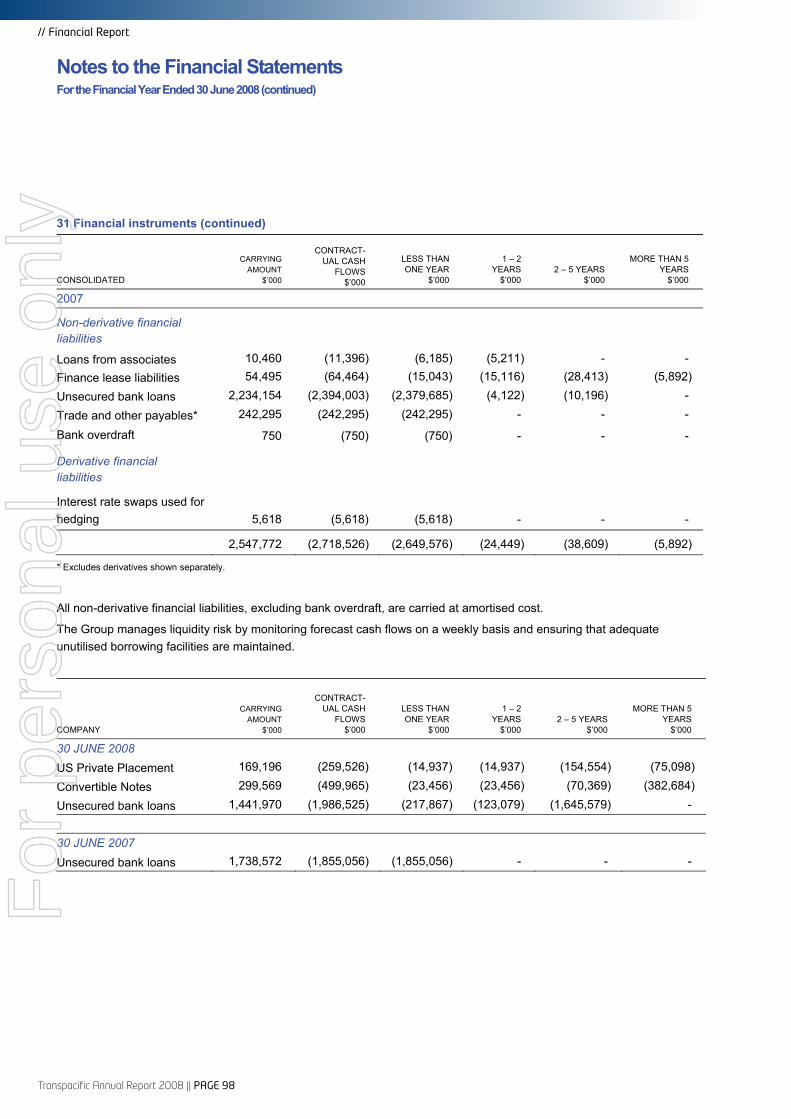
Transpacific Annual Report 2008 || PAGE 98
// Financial Report
Notes to the Financial Statements For the Financial Year Ended 30 June 2008 (continued)
31 Financial instruments (continued)
CONSOLIDATED
CARRYING AMOUNT
$’000
CONTRACT-UAL CASH
FLOWS $’000
MORE THAN 5 YEARS
$’000
LESS THAN ONE YEAR
$’000
1 – 2 YEARS
$’000 2 – 5 YEARS
$’000
2007
Non-derivative financial liabilities
Loans from associates 10,460 (11,396) (6,185) (5,211) - - Finance lease liabilities 54,495 (64,464) (15,043) (15,116) (28,413) (5,892)
Unsecured bank loans 2,234,154 (2,394,003) (2,379,685) (4,122) (10,196) -
Trade and other payables* 242,295 (242,295) (242,295) - - -
Bank overdraft 750 (750) (750) - - -
Derivative financial liabilities
Interest rate swaps used for hedging 5,618 (5,618) (5,618) - - -
2,547,772 (2,718,526) (2,649,576) (24,449) (38,609) (5,892)
* Excludes derivatives shown separately.
All non-derivative financial liabilities, excluding bank overdraft, are carried at amortised cost.
The Group manages liquidity risk by monitoring forecast cash flows on a weekly basis and ensuring that adequate unutilised borrowing facilities are maintained.
COMPANY
CARRYING AMOUNT
$’000
CONTRACT-UAL CASH
FLOWS $’000
LESS THAN ONE YEAR
$’000
1 – 2 YEARS
$’000 2 – 5 YEARS
$’000
MORE THAN 5 YEARS
$’000
30 JUNE 2008
US Private Placement 169,196 (259,526) (14,937) (14,937) (154,554) (75,098)
Convertible Notes 299,569 (499,965) (23,456) (23,456) (70,369) (382,684)
Unsecured bank loans 1,441,970 (1,986,525) (217,867) (123,079) (1,645,579) -
30 JUNE 2007 Unsecured bank loans 1,738,572 (1,855,056) (1,855,056) - - -
For
per
sona
l use
onl
y

PAGE 99 ||Transpacific Annual Report 2008
31 Financial instruments (continued)
The following table indicates the periods in which the cash flows associated with derivatives that are cash flow hedges are expected to occur and impact profit or loss:
2008 CARRYING
AMOUNT
CONTRACT-UAL CASH
FLOWS MORE THAN 5
YEARS
LESS THAN ONE YEAR
$’000
1 – 2 YEARS $’000
2 – 5 YEARS
$’000
Interest rate swaps
Assets 19,482 (19,482) (19,482) - - -
Liabilities 11,831 (11,831) (11,831) - - -
2007
Interest rate swaps
Assets 3,805 (3,805) (3,805) - - -
Liabilities 5,618 (5,618) (5,618)
(E) CAPITAL MANAGEMENT
The Board’s policy is to maintain a strong capital base so as to maintain investor, creditor and market confidence and to sustain future development of the business. The Board of Directors monitors the return on capital, which the Group defines as net operating income divided by total shareholders equity. The Board of Directors also monitors the level of dividends paid to ordinary shareholders which is currently between 30% to 50% of net profit after tax.
The Board seeks to maintain a balance between debt and equity funding.
There were no changes in the Group’s approach to capital management during the year.
Neither the Company nor any of its subsidiaries are subject to externally imposed capital requirements.
(F) IMPAIRMENT LOSSES
None of the Company’s receivables are past due (2007: nil). The ageing of the Group’s trade receivables at the reporting date was:
GROSS 2008
$’000
IMPAIRMENT 2008 $’000
GROSS 2007 $’000
IMPAIRMENT 2007 $’000
Not past due 199,120 - 169,432 - Past due 0-30 days 75,749 - 74,394 -
Past due 31-120 days 34,360 - 23,142 122
Past due 122 days to one year 3,219 2,845 1,609 1,609
More than one year 54 54 7,198 7,198
312,502 2,899 275,775 8,929
The movement in the allowance for impairment in respect of trade receivables during the year was as follows:
2008 $’000
2007 $’000
Balance at 1 July 8,929 629 Impairment loss / (reversed) recognised (6,030) 8,300
Balance 30 June 2,899 8,929
The impairment loss at 30 June 2008 of $54,000 >1 yr relates to several minor customers.
Based on historic default rates, the Group believes that no impairment allowance is necessary in respect of trade receivables not past due or past due by up to 30 days. No single customer’s annual revenue is greater than 1% of the Group’s total revenue.
For
per
sona
l use
onl
y

Transpacific Annual Report 2008 || PAGE 100
// Financial Report
Notes to the Financial Statements For the Financial Year Ended 30 June 2008 (continued)
31 Financial instruments (continued)
(G) FAIR VALUES
A comparison by category of carrying amounts and fair values of all of the Group’s financial instruments that are carried in the financial statements at other than fair values.
CONSOLIDATED CARRYING
VALUE FAIR VALUE CARRYING
VALUE FAIR VALUE
2008 $’000
2008 $’000
2007 $’000
2007 $’000
Financial assets Cash and cash equivalents 58,126 58,126 222,459 222,459
Trade and other receivables 358,890 358,890 309,167 309,167
Financial liabilities
Trade and other payables – current (292,968) (292,968) (242,295) (242,295)
Unsecured bank loans (2,227,856) (2,227,856) (2,234,154) (2,234,154)
Other (2,739) (2,739) - -
Loans from related parties (7,723) (7,723) (10,460) (10,460)
Lease liabilities (92,473) (96,480) (54,495) (56,873)
Forward exchange contracts - - (5,618) (5,618)
(2,206,743) (2,210,750) (2,015,396) (2,017,774)
Unrecognised (losses)/gains (4,007) (2,378)
THE COMPANY CARRYING
VALUE FAIR VALUE CARRYING
VALUE FAIR VALUE
2008 $’000
2008 $’000
2007 $’000
2007 $’000
Financial assets Cash and cash equivalents 2,547 2,547 10,789 10,789
Other receivables 2 2 69 69
Loans to related parties and associates 2,371,437 2,371,437 2,145,336 2,145,336
Financial liabilities
Trade and other payables (10,942) (10,942) (14,331) (14,331)
Unsecured bank loans (1,910,735) (1,910,735) (1,738,572) (1,738,572)
Interest rate swaps - - - -
452,309 452,309 403,291 403,291
Unrecognised (losses)/gains - -
For
per
sona
l use
onl
y

PAGE 101 ||Transpacific Annual Report 2008
31 Financial instruments (continued)
FAIR VALUES
The following summarises the major methods and assumptions used in estimating the fair values of financial instruments reflected in the table.
DERIVATIVES
Forward exchange contracts are either mark to market using listed market prices or by discounting the contractual forward price and deducting the current spot rate. For interest rate swaps broker quotes are used.
INTEREST-BEARING LOANS AND BORROWINGS
Fair value is calculated based on discounted expected future principal and interest cash flows.
LEASE LIABILITIES
The fair value is estimated as the present value of future cash flows, discounted at market interest rates for homogeneous lease agreements. The estimated fair values reflect change in interest rates.
TRADE AND OTHER RECEIVABLES/PAYABLES
As the remaining life of all trade and other receivables and payables is less than one year, the notional amount is deemed to reflect the fair value.
INTEREST RATES USED FOR DETERMINING FAIR VALUE
The entity uses government yield curve as of 30 June 2008 plus an adequate constant credit spread to discount financial instruments. The interest rates used are as follows:
2008 2007
Loans and borrowings 8.0% 7.3% Secured bank loans 8.7% 8.0%
32 Earnings per share
2008 2007
Calculated in accordance with AASB 133: Basic earnings per share (cents per share) 61.8c 44.1c
Diluted earnings per share (cents per share) 58.4c 41.4c
Weighted average number of ordinary shares used as the denominator in calculating basic earnings per share 283,537,333 233,736,834
Effect of share options on issue 16,743,454 15,439,556
Weighted average number of ordinary shares used as the denominator in calculating diluted earnings per share 300,280,787 249,176,390
2008 $000
2007 $000
Reconciliation of earnings used as the numerator in calculating basic and diluted earnings per share:
Profit from continuing operations 195,567 114,302
Net profit attributable to minority interests (2,291) (897)
Distribution to step-up preference Securityholders (18,025) (10,350)
175,251 103,055
For
per
sona
l use
onl
y

Transpacific Annual Report 2008 || PAGE 102
// Financial Report
Notes to the Financial Statements For the Financial Year Ended 30 June 2008 (continued)
33 Key management personnel disclosures
(A) DETAILS OF SPECIFIED DIRECTORS AND SPECIFIED EXECUTIVES
The following were key management personnel of the Group at any time during the reporting period and unless otherwise indicated were key management personnel for the entire period:
(i) Executive Directors T E Peabody (Chairman) H L Wilson (Chief Executive Officer) (resigned as Director 25 July 2007) H W Grundell (Managing Director, Energy Division) T J Coonan – (Chief Executive Officer) (appointed Director 25 July 2007) (appointed CEO 1 July 2007) (ii) Non-Executive Directors B R Brown G D Mulligan B S Allan (iii) Key Executives P A Glavac – Managing Director, Commercial Vehicles Division T A A Woods – Managing Director, Mergers and Acquisitions N M Badyk – Managing Director, Industrial Services Division G S Campbell – Managing Director, New Zealand A G Roderick – Managing Director, Liquid Waste and Recycling Division B D Stam – Managing Director, Corporate Services and Government Affairs (appointed 1 July 2007)
S T Barnard – (appointed 1 August 2007) Chief Financial Officer until 30 June 2008, then General Manager, Strategy and Systems
G F Sparks – Managing Director, Corporate Services and Government Affairs (retired 31 July 2007)
(B) KEY MANAGEMENT PERSONNEL COMPENSATION
The key management personnel compensation included in employee expenses are as follows:
CONSOLIDATED THE COMPANY
2008$’000
2007$’000
2008 $’000
2007 $’000
Short-term employee benefits 6,021 4,737 - -
Post-employment benefits 477 352 - -
Equity compensation benefits 1,573 1,305 1,573 1,305
8,071 6,394 1,573 1,305
The key management personnel receive no compensation in relation to the management of the Company. The compensation disclosed above represents an allocation of the key management personnel’s estimated compensation from the Group in relation to their services rendered to the Company.
The disclosures relating to remuneration of specified Directors’ and Executives is set out in the Remuneration Report section of the Directors Report on pages 27 to 34.
33 Key management personnel disclosures (continued)
(C) OPTIONS OVER EQUITY INSTRUMENTS GRANTED
The movement during the reporting period in the number of options over ordinary shares in the Company held, directly, indirectly or beneficially, by each key management person, including their related parties, is as follows. No options are vested but not exercisable at the end of the year.
NAME
BALANCE AT THE START OF
THE YEAR
GRANTED DURING THE
YEAR AS REMUNERATION
EXERCISED DURING THE
YEAR
OTHER CHANGES
DURING THE YEAR
BALANCE AT THE END OF
THE YEAR
VESTED AND EXERCISABLE
AT THE END OF THE YEAR
Executive Directors: T E Peabody * 6,950,000 - - - 6,950,000 -
T J Coonan 533,334 300,000 (216,665) - 616,669 -
H L Wilson 866,667 - (333,333) (422,222) 111,112 -
H W Grundell 433,334 - (166,667) - 266,667 -
Non-Executive Directors:
B R Brown 50,000 - - - 50,000 33,333
G D Mulligan 50,000 - - - 50,000 33,333
B S Allan 50,000 - - - 50,000 16,666
Key Executives: -
S T Barnard - 150,000 - - 150,000 9,999
P A Glavac 433,334 - (166,666) - 266,668 -
T A A Woods 433,334 - (166,667) - 266,667 -
N M Badyk 433,334 - (166,667) - 266,667 -
G S Campbell 450,000 250,000 - - 700,000 133,333
A G Roderick 500,000 - - - 500,000 133,333
* The options held by Terry Peabody are under terms of an option deed to enable the Peabody family to retain effective control.
(D) SHARE HOLDINGS
The movement during the reporting period in the number of ordinary shares in the Company held, directly, indirectly or beneficially, by each key management person, including their related parties, is as follows:
NAME
BALANCE AT THE START OF THE
YEAR
RECEIVED DURING THE
YEAR ON THE EXERCISE OF
OPTIONS
OTHER CHANGES
DURING THE YEAR
BALANCE AT THE END OF THE
YEAR
Executive Directors: T E Peabody (including related parties) 102,001,428 - 7,999,272 110,000,700
H W Grundell 292,380 166,667 - 459,047
T J Coonan 875,384 216,665 - 1,092,049
Non-Executive Directors:
B R Brown 100,000 - - 100,000
G D Mulligan 31,750 - 472 32,222 B S Allan (appointed 23 August 2006) 5,000 - - 5,000
Key Executives:
P A Glavac 167,380 166,666 (44,965) 289,081
T A A Woods 254,428 166,667 6,267 427,362
N M Badyk 167,593 166,667 - 334,260
G S Campbell - - - -
A G Roderick - - - -
For
per
sona
l use
onl
y

PAGE 103 ||Transpacific Annual Report 2008
33 Key management personnel disclosures (continued)
(C) OPTIONS OVER EQUITY INSTRUMENTS GRANTED
The movement during the reporting period in the number of options over ordinary shares in the Company held, directly, indirectly or beneficially, by each key management person, including their related parties, is as follows. No options are vested but not exercisable at the end of the year.
NAME
BALANCE AT THE START OF
THE YEAR
GRANTED DURING THE
YEAR AS REMUNERATION
EXERCISED DURING THE
YEAR
OTHER CHANGES
DURING THE YEAR
BALANCE AT THE END OF
THE YEAR
VESTED AND EXERCISABLE
AT THE END OF THE YEAR
Executive Directors: T E Peabody * 6,950,000 - - - 6,950,000 -
T J Coonan 533,334 300,000 (216,665) - 616,669 -
H L Wilson 866,667 - (333,333) (422,222) 111,112 -
H W Grundell 433,334 - (166,667) - 266,667 -
Non-Executive Directors:
B R Brown 50,000 - - - 50,000 33,333
G D Mulligan 50,000 - - - 50,000 33,333
B S Allan 50,000 - - - 50,000 16,666
Key Executives: -
S T Barnard - 150,000 - - 150,000 9,999
P A Glavac 433,334 - (166,666) - 266,668 -
T A A Woods 433,334 - (166,667) - 266,667 -
N M Badyk 433,334 - (166,667) - 266,667 -
G S Campbell 450,000 250,000 - - 700,000 133,333
A G Roderick 500,000 - - - 500,000 133,333
* The options held by Terry Peabody are under terms of an option deed to enable the Peabody family to retain effective control.
(D) SHARE HOLDINGS
The movement during the reporting period in the number of ordinary shares in the Company held, directly, indirectly or beneficially, by each key management person, including their related parties, is as follows:
NAME
BALANCE AT THE START OF THE
YEAR
RECEIVED DURING THE
YEAR ON THE EXERCISE OF
OPTIONS
OTHER CHANGES
DURING THE YEAR
BALANCE AT THE END OF THE
YEAR
Executive Directors: T E Peabody (including related parties) 102,001,428 - 7,999,272 110,000,700
H W Grundell 292,380 166,667 - 459,047
T J Coonan 875,384 216,665 - 1,092,049
Non-Executive Directors:
B R Brown 100,000 - - 100,000
G D Mulligan 31,750 - 472 32,222 B S Allan (appointed 23 August 2006) 5,000 - - 5,000
Key Executives:
P A Glavac 167,380 166,666 (44,965) 289,081
T A A Woods 254,428 166,667 6,267 427,362
N M Badyk 167,593 166,667 - 334,260
G S Campbell - - - -
A G Roderick - - - -
For
per
sona
l use
onl
y

Transpacific Annual Report 2008 || PAGE 104
// Financial Report
Notes to the Financial Statements For the Financial Year Ended 30 June 2008 (continued)
33 Key management personnel disclosures (continued)
(E) CHANGES IN KEY MANAGEMENT PERSONNEL IN THE PERIOD AFTER THE REPORTING DATE AND PRIOR TO THE DATE WHEN THE FINANCIAL REPORT IS AUTHORISED FOR ISSUE
Subsequent to balance date Mr Stephen Barnard resigned as Chief Financial Officer to take up the position of General Manager, Strategy and Systems. Mr Glen Battershill was appointed Chief Financial Officer at that date.
(F) LOANS TO DIRECTORS AND EXECUTIVES
There were no loans to Directors and Executives during the year.
34 Subsequent events Subsequent to 30 June 2008 the Group has acquired a number of businesses, which individually and in aggregate are not material.
The syndicated facility consists of one and three year tranches, which are subject to annual extensions. The one year tranches have been extended subsequent to year-end through to 15 December 2009. The three year tranches mature 15 December 2010.
No other matter or circumstance has arisen since 30 June 2008 that has significantly affected or may significantly affect the operations of the Group, the results of those operations in future financial years or the state of affairs of the Group in subsequent financial years.
For
per
sona
l use
onl
y

PAGE 105 ||Transpacific Annual Report 2008
Directors’ Declaration
1. In the Directors’ opinion:
(a) the financial statements,additional disclosures included in the Directors’ Report designated as audited and Notes set out on pages 37 to 104 are in accordance with the Corporations Act 2001, including:
(i) giving a true and fair view of the Company’s and the Group’s financial position as at 30 June 2008 and of their performance for the financial year ended on that date; and
(ii) complying with Australian Accounting Standards (including the Australian Accounting Interpretations), and the Corporations Regulations 2001.
(b) there are reasonable grounds to believe the Company will be able to pay its debts as and when they become due and payable.
2. The Directors have been given the declarations required by section 295A of the Corporations Act 2001.
3. At the date of this declaration, the Company is within the class of companies affected by ASIC Class Order 98/1418. The nature of the Deed of Cross Guarantee is such that each Company which is party to the Deed guarantees to each creditor’s payment in full of any debt in accordance with the Deed of Cross Guarantee.
In the Directors’ opinion, there are reasonable grounds to believe that the Company and the companies to which the ASIC Class Order applies, as detailed in Note 23 to the financial statements will, as a Group, be able to meet any obligations to which they are, or may become, subject by virtue of the Deed of Cross Guarantee.
This declaration is made in accordance with a resolution of the Directors.
T E Peabody B R Brown Executive Chairman Deputy Chairman
Brisbane, 22 September 2008
For
per
sona
l use
onl
y
Transpacific Annual Report 2008 || PAGE 106
// Financial Report
Independent Auditor’s Report to the Members of Transpacific Industries Group Ltd
REPORT ON THE FINANCIAL REPORT
We have audited the accompanying financial report of Transpacific Industries Group Ltd and the entities it controlled, which comprises the balance sheet as at 30 June 2008, and the income statement, statement of recognised income and expense and cash flow statement for the year ended on that date, a summary of significant accounting policies and other explanatory notes and the Directors’ declaration of the consolidated entity comprising the entities it controlled at the year’s end or from time to time during the financial year.
DIRECTORS’ RESPONSIBILITY FOR THE FINANCIAL REPORT
The Directors of the Company are responsible for the preparation and fair presentation of the financial report in accordance with Australian Accounting Standards (including the Australian Accounting Interpretations) and the Corporations Act 2001. This responsibility includes establishing and maintaining internal control relevant to the entity’s preparation and fair presentation of the financial report that is free from material misstatement, whether due to fraud or error; selecting and applying appropriate accounting policies; and making accounting estimates that are reasonable in the circumstances. In Note 1, the Directors also state, in accordance with Accounting Standard AASB 101 Presentation of Financial Statements, that compliance with the Australian equivalents to International Financial Reporting Standards (IFRS) ensures that the financial report, comprising the financial statements and notes, complies with IFRS.
AUDITOR’S RESPONSIBILITY
Our responsibility is to express an opinion on the financial report based on our audit. We conducted our audit in accordance with Australian Auditing Standards. These Auditing Standards require that we comply with relevant ethical requirements relating to audit engagements and plan and perform the audit to obtain reasonable assurance whether the financial report is free from material misstatement.
An audit involves performing procedures to obtain audit evidence about the amounts and disclosures in the financial report. The procedures selected depend on the Auditor’s judgement, including the assessment of the risks of material misstatement of the financial report, whether due to fraud or error. In making those risk assessments, the auditor considers internal control relevant to the entity’s preparation and fair presentation of the financial report in order to design audit procedures that are appropriate in the circumstances but not for the purpose of expressing an opinion on the effectiveness of the entity’s internal control.
An audit also includes evaluating the appropriateness of accounting
policies used and the reasonableness of accounting estimates made by the Directors, as well as evaluating the overall presentation of the financial report.
We believe that the audit evidence we have obtained is sufficient and appropriate to provide a basis for our audit opinion.
INDEPENDENCE
In conducting our audit, we have complied with the independence requirements of the Corporations Act 2001. We confirm that the independence declaration required by the Corporations Act 2001, provided to the Directors of Transpacific Industries Group Ltd on 18 September 2008, would be in the same terms if provided to the Directors as at the date of this Auditor’s Report.
For
per
sona
l use
onl
y

PAGE 107 ||Transpacific Annual Report 2008
AUDITOR’S OPINION
In our opinion:
(a) the financial report of Transpacific Industries Group Ltd and Transpacific Industries Group Ltd and its Controlled Entities is in accordance with the Corporations Act 2001, including:
(i) giving a true and fair view of the Company’s and Consolidated Entities’ financial position as at 30 June 2008 and of their performance for the year ended on that date; and
(ii) complying with Australian Accounting Standards (including the Australian Accounting Interpretations) and the Corporations Regulations 2001.
(b) the financial report also complies with International Financial Reporting Standards as disclosed in Note 1.
REPORT ON THE REMUNERATION REPORT
We have audited the Remuneration Report included on pages 27 to 34 of the Directors’ Report for the financial year ended 30 June 2008.
The Directors of the Company are responsible for the preparation and presentation of the Remuneration Report in accordance with section 300A of the Corporations Act 2001. Our responsibility is to express an opinion on the Remuneration Report, based on our audit conducted in accordance with Australian Auditing Standards.
AUDITOR’S OPINION
In our opinion the Remuneration Report of Transpacific Industries Group Ltd for the financial year ended 30 June 2008 complies with section 300A of the Corporations Act 2001.
Bentleys R J Forbes Brisbane Partnership Partner Chartered Accountants
Brisbane 22 September 2008
For
per
sona
l use
onl
y

Transpacific Annual Report 2008 || PAGE 108
// Financial Report
Top 20 largest shareholders as at 31 August 2008 No. of shares % Held
Tandom Pty Ltd 39,741,280 13.71Brenzil Pty Ltd 36,527,759 12.60Filmore Limited 33,731,661 11.62J P Morgan Nominees Australia Limited 27,319,670 9.42National Nominees Limited 20,464,219 7.06HSBC Custody Nominees (Australia) Limited 17,751,595 6.12ANZ Nominees Limited <Cash Income A/C> 16,779,384 5.79JJ Richards & Sons Pty Ltd 8,891,724 3.07Cogent Nominees Pty Limited 8,389,240 2.89Citicorp Nominees Pty Limited 6,708,505 2.31Queensland Investment Corporation 3,994,231 1.38Twigg Landfill Pty Ltd <Max Twigg Family A/C> 2,979,754 1.03ANZ Nominees Limited <SL Cash Income A/C> 2,024,646 0.70Cogent Nominees Pty Limited <SMP Accounts> 1,941,654 0.67Fordson Flats Pty Ltd <Fordson Discretionary A/C> 1,633,769 0.56UBS Wealth Management Australia Nominees Pty Ltd 1,494,880 0.52Custodial Services Limited 1,335,775 0.46Twigg Investments Pty Ltd <Twigg Investment A/C> 1,106,468 0.38Citicorp Nominees Pty Limited <CFSIL Cwlth Aust SHS 5 A/C> 1,096,050 0.38MPC Traders Ltd 1,055,870 0.36Report Total 234,968,134 81.03Remainder 54,983,304 18.97Grand Total 289,951,438 100.00Substantial shareholders
The number of shares held by substantial shareholders as disclosed in the substantial shareholding notices given to the Company as at 31 August 2008 were:
Tandom Pty Ltd 39,741,280 13.71Brenzil Pty Ltd 36,527,759 12.60Filmore Limited 33,731,661 11.62ING Australia Holdings Limited <and its related companies> 26,547,693 9.24 Schroder Investment Management Australia Ltd 15,754,432 5,49Total 152,302,825 52.66
An entity has a substantial shareholding if the total votes attaching to shares in which the entity and their associates have a relevant interest is 5% or more. The list of the 20 largest shareholders is based on the number of shares held in the name of each shareholder (not including their associates), even if the shareholder does not have a relevant interest in the shares, for example, because the shareholder holds the share as a nominee. The list of the 20 largest shareholders of the Company and the list of substantial shareholders of the Company differ for this reason.
Statement of Quoted Securities
The Company’s total number of shares on issue as at 31 August 2008 is 289,951,438 ordinary fully paid shares. At 31 August 2008 the total number of shareholders owning these shares was 11,660 on the register of members maintained by Computershare Investor Services Pty Ltd.
81.03% of total issued capital is held by or on behalf of the 20 largest shareholders.
Voting rights
Under the Company’s Constitution, every member entitled to vote who is present at a general meeting of the Company in person or by proxy or by attorney or in the case of a corporation, by representative, shall, upon a show of hands, have one vote only.
Where a member is entitled to cast two or more votes it may appoint not more than two proxies or attorneys.
Poll – On a poll, every member entitled to vote shall, whether present in person or by proxy or attorney or, in the case of a corporation, by representative, have one vote for every share held by the member.
At 31 August 2008, there were options over 16,415,122 unissued ordinary shares. 9,465,122 options are held by Non-Executive Directors and Executives of the Corporate Group (excluding the Executive Chairman) granted under the Transpacific Executive Share Option Plan. 6,950,000 options are held by Brenzil Pty Ltd under an option deed. There are no voting rights attached to unissued ordinary shares. Voting rights will be attached to the unissued ordinary shares when the options have been exercised.
Distribution Schedule of Shareholders
No. of shares: 1 – 1000 1,001 – 5,000 5,001 – 10,000 10,001 – 100,000 100,001 and overNo. of shareholders: 4,545 5,513 976 544 82
The number of shareholders each holding less than a marketable parcel of the Company’s ordinary shares at 31 August 2008 was 346.
Securities Exchange listing
The shares of Transpacific Industries Group Ltd are listed on the Australian Securities Exchange under the trade symbol TPI, with Brisbane being the home exchange.
// Shareholder Information
For
per
sona
l use
onl
y

ABN 74 101 155 220
DirectorsTerry Peabody (Executive Chairman and Director)
Trevor Coonan (Chief Executive Officer and Executive Director)
Bruce Brown (Deputy Chairman and Non-Executive Director)
Graham Mulligan (Non-Executive Director)
Bruce Allan (Non-Executive Director)
Harold Grundell (Executive Director)
Company SecretaryKellie Smith
Registered OfficeLevel 1, Caroma Building 159 Coronation Drive Milton QLD 4064
AuditorsBentleys Brisbane Partnership Level 26, AMP Place 10 Eagle Street Brisbane QLD 4000
// Corporate Information
Growth Actual Actual Actual on 2007 $m $m $m
Revenue 70% 2196.7 1,295.0 649.5EBITDA 79% 540.5 302.8 106.9Depreciation -119.1 –70.1 –24.8EBIT 81% 421.4 232.7 82.1Interest (net) 179.9 –88.5 –16.0NPBT, associates and unusuals 67% 241.5 144.2 66.1Associates NPAT 2.6 4.2 1.8NPBT and unusuals 64% 244.1 148.4 67.9One-off costs – – –1.0Profits on acquisitions 3.3 2.9 1.7Options expense -3.5 –3.2 –1.4Amortisation of convertible -4.0NPBT 62% 239.9 148.1 67.2Tax expense -44.3 –33.8 –19.1NPAT 71% 195.6 114.3 48.1Minority interests -2.3 –0.9 –0.6NPAT Transpacificpre distribution 193.3 113.4 47.5Hybrid distribution -18.0 -10.3 –NPAT Transpacific 70% 175.3 103.1 47.5
Scorecard. 2008. 2007. 2006.
contents//Chairman’s Letter 1 // Focused on sustainable business 2 // Chief Executive Officer’s Review 8 // Board of Directors 16 // Corporate Governance Statement 18 // Financial Report 23
Des
igne
d an
d pr
oduc
ed b
y w
alte
rwak
efiel
d.co
m.a
uTh
is re
port
is p
rinte
d on
Mon
za S
atin
, an
FSC
cer
tified
mix
ed s
ourc
epap
er.
By b
uyin
g pr
oduc
ts w
ith th
e FS
C la
bel y
ou
are
supp
ortin
g th
e gr
owth
of r
espo
nsib
le
fore
st m
anag
emen
t wor
ldw
ide.
For
per
sona
l use
onl
y

Annual Report 2008
Focused on Sustainable Business
Annual Report 2008
www.transpacific.com.au
Focused on Sustainable Business Transpacifi
c Annual R
eport 20
08
For
per
sona
l use
onl
y