Embed Size (px)
Citation preview

Reference Data(Consolidated Financial Results for 2Q FY2008)
Reference Data(Consolidated Financial Results for 2Q FY2008)
October 31, 2008
TSE : 4568
Corporate Communications Departmenthttp://www.daiichisankyo.com

(This page is intentionally left blank)
Summary of Income StatementCurrency RateSales of Global ProductsOverseas SalesConsolidated Segment Information – Operating SegmentConsolidated Segment Information – Geographic SegmentStatus of Major CompaniesNumber of EmployeesMajor Management / Financial IndicatorsCapital Expenditure and Depreciation ExpensesNumber of Shares Held and Shareholders by CategoryConsolidated Balance SheetsConsolidated Statements of IncomeConsolidated Statements of Cash FlowsR&D Pipeline
<Historical Data>
Reference Data(Consolidated Financial Results for 2Q FY2008)
Reference Data(Consolidated Financial Results for 2Q FY2008)
[1][2][3][4][5][6][7][8][9]
[10][11][12][13][14][15]
P1P1P3P3P4P4P5P9P10P10P10P11P12P13P14
TSE : 4568
Each numerical value regarding the future prospect in this material is derived from our judgment and assumptions based on the currently available information and may include risk and uncertainty. For this reason, the actual performance data, etc. may differ from the prospective value.

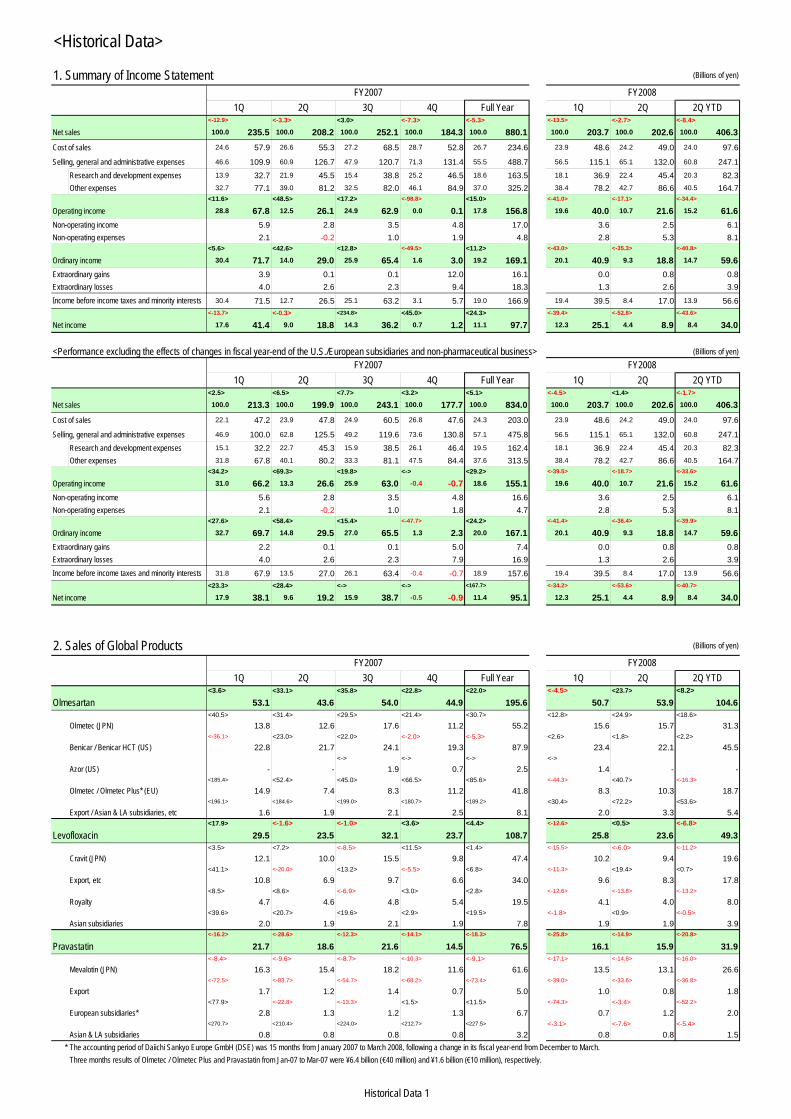
1. Summary of Income Statement(Billions of yen)
From JulyForecast
YoYChanges
<-2.7> <-8.4>
Net sales 100.0 202.6 100.0 406.3 6.3 -37.4
Cost of sales 24.2 49.0 24.0 97.6 -2.9 -15.6
Selling, general and administrative expense 65.1 132.0 60.8 247.1 -2.4 10.5
Research and development expenses 22.4 45.4 20.3 82.3 -2.7 4.1
Other expenses 42.7 86.6 40.5 164.7 0.2 6.4
<-17.1> <-34.4>
Operating income 10.7 21.6 15.2 61.6 11.6 -32.3
Non-operating income 2.5 6.1 0.1 -2.6
Non-operating expenses 5.3 8.1 6.1 6.2
<-35.3> <-40.8>
Ordinary income 9.3 18.8 14.7 59.6 5.6 -41.1
Extraordinary gains 0.8 0.8 -1.7 -3.1
Extraordinary losses 2.6 3.9 0.9 -2.8
8.4 17.0 13.9 56.6 3.1 -41.4
<-52.8> <-43.6>
Net income 4.4 8.9 8.4 34.0 4.0 -26.3
From JulyForecast
YoYChanges
<1.4> <-1.7>
Net sales 100.0 202.6 100.0 406.3 6.3 -6.9
Cost of sales 24.2 49.0 24.0 97.6 -2.9 2.7 +1.0 pt: Change in business scheme of Panaldine, etc.
Selling, general and administrative expense 65.1 132.0 60.8 247.1 -2.4 21.6
Research and development expenses 22.4 45.4 20.3 82.3 -2.7 4.9 Increase due to progress in development of principal projects
Other expenses 42.7 86.6 40.5 164.7 0.2 16.7
<-18.7> <-33.6> Operating income 10.7 21.6 15.2 61.6 11.6 -31.1
Non-operating income 2.5 6.1 0.1 -2.3
Non-operating expenses 5.3 8.1 6.1 6.2
<-36.4> <-39.9>
Ordinary income 9.3 18.8 14.7 59.6 5.6 -39.6
Extraordinary gains 0.8 0.8 -1.7 -1.5 FY2006-Gain on sale of investments in affiliates:2.3
Extraordinary losses 2.6 3.9 0.9 -2.7 FY2007-Loss on business integration/restructuring: 4.0
8.4 17.0 13.9 56.6 3.1 -38.3
<-53.6> <-40.7>
Net income 4.4 8.9 8.4 34.0 4.0 -23.3
2. Currency Rate
1st half Full year
Yen / USD (average) * 2nd half forecast 1$=100yen 100.0 100.0
Yen / EUR (average) * 2nd half forecast 1€=120yen 155.0 155.0
FY07 1st half Results ===> FY08 1st half Results
FY07 1st half Results ===> FY08 1st half Results
Commercial rights transfer (Coversyl, Zantac, etc.): -7.6Loss from currency fluctuation: approximately -14.0Azor (lump sum payment received): +4.7Main 3 products sales: +4.0
2Q 1st half
FY2008 Results
* In order to make comparison with the existing businesses easier, "Pharma business" does not include certain figures from the non-pharmaceuticals operations. Thus, it does not meet the figures in the "Segment information - Operating Segment" section.
Income before income taxes and minority interests
<Performance excluding the effects of changes in fiscal year-end and non-pharmaceutical business>
Income before income taxes and minority interests
Increase in personnel cost (Japan): +3.1(temporarily decreased in FY07 due to the integreation of retirement benefit andpension plans)Intensive investment in U.S./EU: +11.4(approximately 700 increase in number of MRs)
Loss on revaluation of synthetic stock options in DSI in the USValuation loss of European subsidiary's asset
Details
Non-pharmaceutical business: -16.4Change in fiscal year-end of European subsidiaries: -14.1
Change in fiscal year-end of European subsidiaries: -2.1
Change in fiscal year-end of European subsidiaries: -2.0
Change in fiscal year-end of European subsidiaries: -1.8
FY2008 Results Details
FY2008 Original Forecast
2Q 1st half
Non-pharmaceutical business: -2.5Change in fiscal year-end of European subsidiaries: -8.6
1st half 1st half Results Full year Forecast
FY2007 Results FY2008
160.4 162.7 141.3
119.3 106.1 103.1
1

(Billions of yen)
From JulyForecast
From JulyForecast
<-0.6> <-4.6>
Net sales 100.0 433.7 -6.3 100.0 840.0 0.0
Cost of sales 24.8 107.4 -0.6 24.4 205.0 -3.5
Selling, general and administrative expense 61.8 267.9 15.9 61.3 515.0 13.5
Research and development expenses 22.5 97.7 13.7 21.4 180.0 11.0
Other expenses 39.3 170.3 2.3 39.9 335.0 2.5
<-7.2> <-23.5>
Operating income 13.5 58.4 -21.6 14.3 120.0 -10.0
Non-operating income 2.9 -2.1 9.0 -2.0
Non-operating expenses 7.9 6.9 16.0 13.0
<-21.9> <-33.2>
Ordinary income 12.3 53.4 -30.6 13.5 113.0 -25.0
Extraordinary gains 4.2 3.7 5.0 2.0
Extraordinary losses 5.1 2.6 9.0 3.5
12.1 52.4 -29.6 13.0 109.0 -26.5
<-17.1> <-33.4>
Net income 7.2 31.0 -19.0 7.7 65.0 -15.0
From JulyForecast
From JulyForecast
<3.1> <0.7>
Net sales 100.0 433.7 -6.3 100.0 840.0 0.0
Cost of sales 24.8 107.4 -0.6 24.4 205.0 -3.5
Selling, general and administrative expense 61.8 267.9 15.9 61.3 515.0 13.5
Research and development expenses 22.5 97.7 13.7 21.4 180.0 11.0
Other expenses 39.3 170.3 2.3 39.9 335.0 2.5
<-6.4> <-22.6> Operating income 13.5 58.4 -21.6 14.3 120.0 -10.0
Non-operating income 2.9 -2.1 9.0 -2.0
Non-operating expenses 7.9 6.9 16.0 13.0
<-21.3> <-32.4> Ordinary income 12.3 53.4 -30.6 13.5 113.0 -25.0
Extraordinary gains 4.2 3.7 5.0 2.0
Extraordinary losses 5.1 2.6 9.0 3.5
12.1 52.4 -29.6 13.0 109.0 -26.5 <-18.0> <-31.7>
Net income 7.2 31.0 -19.0 7.7 65.0 -15.0
Annual impact of one yen per USD/EURchange in currency rate
¥0.5 billion -
Net SalesOperating Income
¥2.1 billion ¥0.3 billion
Net SalesOperating Income
FY2008 Forecast
<Performance excluding the effects of changes in fiscal year-end and non-pharmaceutical business>
2nd half Full Year
FY2008 Forecast
Income before income taxes and minority interests
Details
2nd half Full Year
FY2008 Forecast
Increase in R&D expenses including acquisition of U3 Pharma
Goodwill amortization of U3 Pharma: +3.7
Loss from currency fluctuation: -1.0 <1st half: +8.5, 2nd half: -9.0>Domestic prescription drugs: -5.0, OTC drugs: -2.0, LPI: +7.5, DSI: +2.0
Extraordinary depreciation for the closure of Osaka plant
Income before income taxes and minority interests
Decrease in operating assets
Interest expense for borrowings related to Ranbaxy dealLoss on revaluation of synthetic stock options in DSI in the USCurrency valuation loss on intangible asset of European subsidiary
2

3. Sales of Global Products(Billions of yen)
2Q 1st half From Jul.Forecast
YoYChanges 2nd half From Jul.
Forecast Full Year From Jul.Forecast 1st half Full Year
<23.7> <8.2> <14.7> <11.5> <15.9> <15.2>
(area) 53.9 104.6 4.6 7.9 113.4 -0.6 218.0 4.0 14.3 28.8<24.9> <18.6> <27.5> <23.2>
15.7 31.3 -1.7 4.9 36.7 1.7 68.0 0.0
<1.8> <2.2> <-2.0> <0.1>
22.1 45.5 4.5 1.0 42.5 -0.5 88.0 4.0
<-> <-> <124.3> <272.9>
2.4 3.8 0.8 3.8 5.7 0.2 9.5 1.0
<40.7> <-16.3> <-11.2> <-13.9> <17.4> <1.6>
10.3 18.7 -0.3 -3.6 17.3 -5.1 36.0 -5.4 2.8 0.5
<-> <->- - - - 4.0 3.4 4.0 3.4
<72.2> <53.6> <53.8> <53.7>
3.3 5.4 1.4 1.9 7.1 -0.4 12.5 1.0
<0.5> <-6.8> <-5.6> <-6.2>
(area) 23.6 49.3 -0.7 -3.6 52.7 -1.3 102.0 -2.0<-6.0> <-11.2> <0.4> <-5.0>
9.4 19.6 -2.4 -2.5 25.4 0.4 45.0 -2.0
<19.4> <0.7> <-13.2> <-5.9>
8.3 17.8 1.8 0.1 14.2 -1.8 32.0 0.0
<-13.8> <-13.2> <-12.5> <-12.9>
4.0 8.0 0.0 -1.2 9.0 0.0 17.0 0.0
<0.9> <-0.5> <4.7> <2.2>
1.9 3.9 -0.1 0.0 4.1 0.1 8.0 0.0
<-14.9> <-20.8> <-21.0> <-20.9> <-17.5> <-19.2>
(area) 15.9 31.9 -1.1 -8.4 28.6 -0.9 60.5 -2.0 -6.8 -14.4<-14.8> <-16.0> <-18.4> <-17.2>
13.1 26.6 -1.4 -5.1 24.4 -0.6 51.0 -2.0
<-33.6> <-36.8> <-44.6> <-40.1>
0.8 1.8 0.8 -1.1 1.2 0.2 3.0 1.0
<-3.4> <-52.2> <-40.5> <-47.7> <-21.8> <-31.2>
1.2 2.0 -0.5 -2.2 1.5 -0.5 3.5 -1.0 -0.6 -1.6
<-7.6> <-5.4> <-7.0> <-6.2>
0.8 1.5 0.0 -0.1 1.5 0.0 3.0 0.0
* The accounting period of Daiichi Sankyo Europe GmbH (DSE) in FY2007 was 15 months from January 2007 to March 2008, following a change in its fiscal year-end from December to March. Three months results of Olmetec / Olmetec Plus and Pravastatin from Jan-07 to Mar-07 were ¥6.4 billion (€40 million) and ¥1.6 billion (€10 million), respectively.
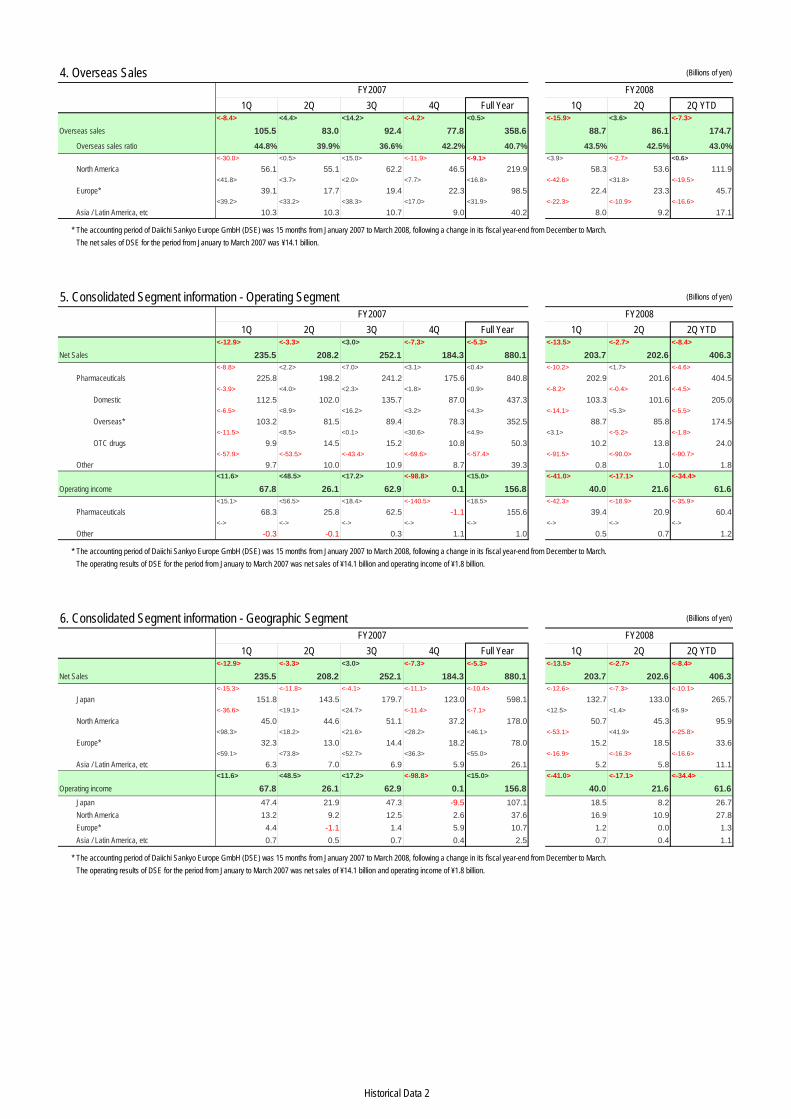
4. Overseas Sales(Billions of yen)
2Q 1st half From Jul.Forecast
YoYChanges 2nd half From Jul.
Forecast Full Year From Jul.Forecast 1st half Full Year
<3.6> <-7.3> <0.1> <-3.8> <0.2> <0.1>
Overseas sales 86.1 174.7 15.7 -13.8 170.3 -6.7 345.0 9.0 0.4 0.5Overseas sales ratio 42.5% 43.0% 39.3% 41.1%
<-2.7> <0.6> <-3.3> <-1.3>
53.6 111.9 15.9 0.7 105.1 -2.9 217.0 13.0
<31.8> <-19.5> <8.6> <-7.6> <7.2> <7.9>
23.3 45.7 -0.3 -11.0 45.3 -4.7 91.0 -5.0 3.1 6.7
<-10.9> <-16.6> <0.9> <-8.1>
9.2 17.1 0.1 -3.4 19.9 0.9 37.0 1.0
* The accounting period of Daiichi Sankyo Europe GmbH (DSE) in FY2007 was 15 months from January 2007 to March 2008, following a change in its fiscal year-end from December to March. The net sales of DSE for the period from January to March 2007 was ¥14.1 billion.
Europe *
Asia / Latin America, etc
Pravastatin<antihyperlipidemic>
Levofloxacin<synthetic antibacterial>
Olmesartan<antyihypertensive>
North America
Export
European subsidiaries *
Asian & Latin American subsidiaries
US
US
EU
EU
YoY changes excludingfiscal year-end changes
YoY changes excludingfiscal year-end changes
FY2008 Results FY2008 Forecast
FY2008 Results FY2008 Forecast
Export / Asian & LA subsidiaries, etc
Olmetec / Olmetec Plus *
AZOR
Benicar / Benicar HCT
Olmetec JPN
Sevikar
Cravit JPN
Export, etc
Royalty
Asian subsidiaries
Mevalotin JPN
3
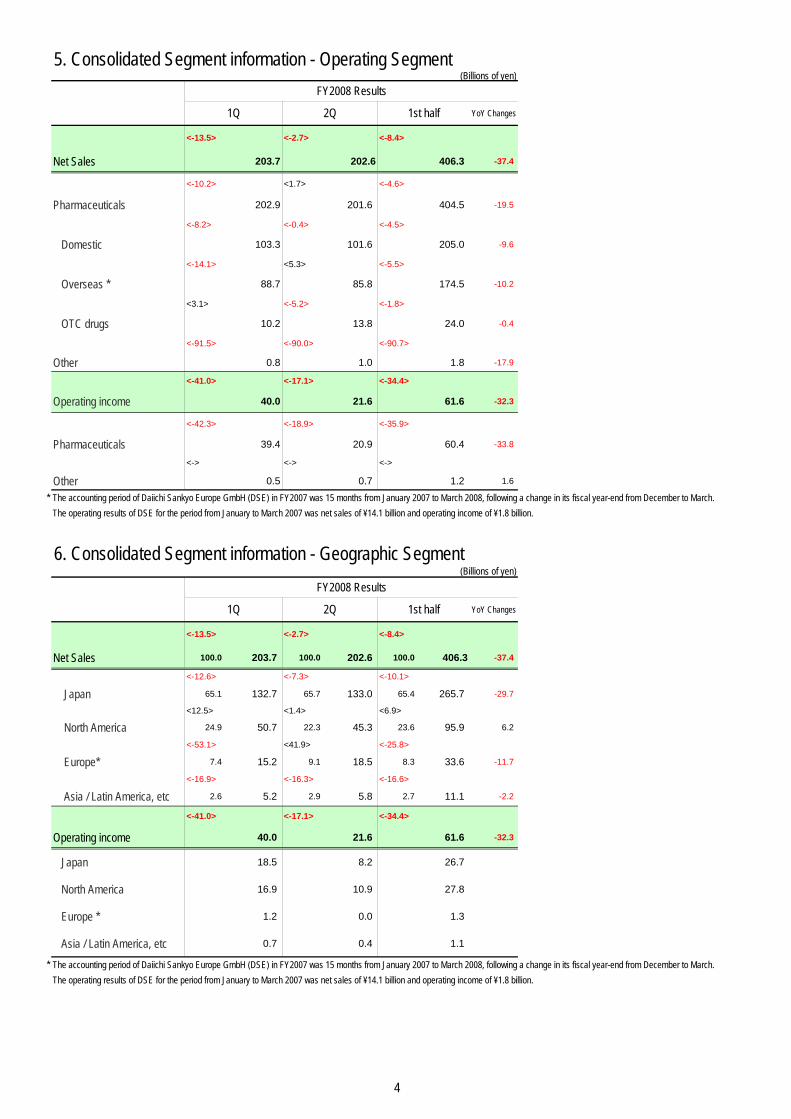
5. Consolidated Segment information - Operating Segment(Billions of yen)
YoY Changes
<-13.5> <-2.7> <-8.4>
Net Sales 203.7 202.6 406.3 -37.4
<-10.2> <1.7> <-4.6>
Pharmaceuticals 202.9 201.6 404.5 -19.5
<-8.2> <-0.4> <-4.5>
Domestic 103.3 101.6 205.0 -9.6
<-14.1> <5.3> <-5.5>
Overseas * 88.7 85.8 174.5 -10.2
<3.1> <-5.2> <-1.8>
OTC drugs 10.2 13.8 24.0 -0.4
<-91.5> <-90.0> <-90.7>
Other 0.8 1.0 1.8 -17.9
<-41.0> <-17.1> <-34.4>
Operating income 40.0 21.6 61.6 -32.3
<-42.3> <-18.9> <-35.9>
Pharmaceuticals 39.4 20.9 60.4 -33.8
<-> <-> <->
Other 0.5 0.7 1.2 1.6
* The accounting period of Daiichi Sankyo Europe GmbH (DSE) in FY2007 was 15 months from January 2007 to March 2008, following a change in its fiscal year-end from December to March. The operating results of DSE for the period from January to March 2007 was net sales of ¥14.1 billion and operating income of ¥1.8 billion.
6. Consolidated Segment information - Geographic Segment(Billions of yen)
YoY Changes
<-13.5> <-2.7> <-8.4>
Net Sales 100.0 203.7 100.0 202.6 100.0 406.3 -37.4
<-12.6> <-7.3> <-10.1>
Japan 65.1 132.7 65.7 133.0 65.4 265.7 -29.7
<12.5> <1.4> <6.9>
North America 24.9 50.7 22.3 45.3 23.6 95.9 6.2
<-53.1> <41.9> <-25.8>
Europe* 7.4 15.2 9.1 18.5 8.3 33.6 -11.7
<-16.9> <-16.3> <-16.6>
Asia / Latin America, etc 2.6 5.2 2.9 5.8 2.7 11.1 -2.2
<-41.0> <-17.1> <-34.4>
Operating income 40.0 21.6 61.6 -32.3
Japan 18.5 8.2 26.7
North America 16.9 10.9 27.8
Europe * 1.2 0.0 1.3
Asia / Latin America, etc 0.7 0.4 1.1
* The accounting period of Daiichi Sankyo Europe GmbH (DSE) in FY2007 was 15 months from January 2007 to March 2008, following a change in its fiscal year-end from December to March. The operating results of DSE for the period from January to March 2007 was net sales of ¥14.1 billion and operating income of ¥1.8 billion.
1Q 2Q 1st half
FY2008 Results
1Q 2Q 1st half
FY2008 Results
4

7. Status of Major Companies
7-1. Daiichi Sankyo Co., Ltd.(Billions of yen)
1st half From Jul.Forecast
YoYChanges FY07 Results ===> FY08 Results 2nd half From Jul.
Forecast Full Year From Jul.Forecast
<-5.0> <-0.7> <-2.8>
200.4 0.4 -10.6 214.6 -5.4 415.0 -5.0
<-4.2> <0.7> <-1.7>
117.2 -4.8 -5.1 122.8 -0.2 240.0 -5.0
<18.6> <27.5> <23.2>
31.3 -1.7 4.9 36.7 1.7 68.0 0.0
<23.0> <49.9> <37.1>
6.0 -1.0 1.1 8.0 1.0 14.0 0.0
<4.1> <4.0> <4.1>
11.0 0.0 0.4 11.0 0.0 22.0 0.0
<-16.0> <-18.4> <-17.2>
26.6 -1.4 -5.1 24.4 -0.6 51.0 -2.0
<3.9> <22.1> <13.0>
6.4 0.4 0.2 7.6 -0.4 14.0 0.0
<-5.8> <-0.2> <-2.8>
4.2 -0.8 -0.3 5.3 0.3 9.5 -0.5
<11.8> <79.0> <46.6>
2.9 -0.1 0.3 5.1 0.1 8.0 0.0
<-3.6> <2.3> <-0.7>
5.9 -1.1 -0.2 6.1 1.1 12.0 0.0
<-0.3> <32.2> <15.8>
2.6 -0.4 0.0 3.4 0.4 6.0 0.0
<-2.3> <2.2> <0.1>
62.7 -1.3 -1.5 76.3 4.3 139.0 3.0
<-11.2> <0.4> <-5.0>
19.6 -2.4 -2.5 25.4 0.4 45.0 -2.0
<15.2> <22.7> <19.0>
18.9 -0.1 2.5 21.1 1.1 40.0 1.0
<-14.8> <11.3> <-2.4>
4.6 -1.4 -0.8 5.4 0.4 10.0 -1.0
<52.2> <60.5> <57.0>
3.5 -0.5 1.2 5.0 0.0 8.5 -0.5
<-20.7> <-14.2> <-16.9>
3.6 -0.4 -0.9 5.4 0.4 9.0 0.0
<-18.1> <-19.5> <-18.8>
24.8 -1.2 -5.5 23.2 -2.8 48.0 -4.0
<-8.5> <-5.3> <-6.9>
14.6 0.6 -1.3 14.4 0.4 29.0 1.0
<1.4> <9.2> <5.3>
3.1 0.1 0.0 3.4 0.4 6.5 0.5
Sales dropped reflecting the NHI price revision and commercial rightstransfer of certain product. Volume increased centering on the growthof Olmetec.
Number of prescriptions and hospitals using Urief increased becauseof its strong efficacy. Market share has steadily risen, achieving thirdplace in its class.
Sales declined due to launches of generics by 29 companies.
Sales declined due to a shrinking market and increased prescriptionof generics as a result of the introduction of DPC.
Despite the growth of generics, new prescriptions of Kremezin aregrowing due to practice guidelines for chronic kidney disease thatrecommend doctors prescribe oral adsorbents in severe cases.
Although Hanp firmly maintained the competitive edge as the firstchoice for the treatment of acute heart failure, sales dropped slightlydue to the effects of NHI price revision and the Diagnosis ProcedureCombination (DPC).
Daiichi Sankyo, as a pioneer manufacturer of statins offeredproposals for effective dyslipidemia treatment which increased thenumber of prescriptions and hospitals using Livalo.
Despite holding the competitive edge as the first choice prescriptionfor patients with atrial fibrillation, sales of Sunrythm decreased slightlydue to NHI price revision.
Although Olmetec was the most affected by the NHI price revision(approx. -10%), sales have expanded on the strength of itsantihypertensive effects to strongly lead the market.
With its efficacy for renal protection, concomitant prescriptions ofCalblock and ARB increased in hypertensive patients who also sufferfrom chronic kidney disease.
Prescriptions of Topotecin increased due to its addition to apharmacotherapy regimen as a standard drug for treatment ofgastrointestinal cancer.
Sales dropped reflecting the NHI price revision and commercial rightstransfer of certain product.
Fastic firmly maintained top share in the glinide market.
Sales dropped due to the stagnant market condition and NHI pricerevision. However, Cravit further established its reputation for safetyand antibacterial effects, and maintained its market share even withthe launch of a rival drug from a competitor.Even with the growing number of generics prescriptions, salesincreased due to the launch of the Loxonin Tape in July with superiorefficacy and the strong Loxonin brand name, and also from thecontribution of Loxonin Poultice.
Sales declined due to the launch of generics in July and COX-2inhibitor by a competitor.
Sales dropped reflecting the NHI price revision and decline of Cravit.Volume increased centering on Loxionin and Urief.
Despite a shrinking market, Artist prescriptions increased mainly forcardiac conditions and firmly maintained the top share among drugsin its class as the only beta-blocker indicated for the treatment ofchronic heart failure.Despite the increase in the number of prescriptions after MEGA Studyresults were reflected in treatment Guideline, sales of Mevalotindeclined due to increasing prescriptions of generics and competitionfrom other products.
Zyrtec<antiallergic agent>
Omnipaque<contrast agent>
Livalo<antihyperlipidemic agent>
Sunrythm<antiarrhythmic agent>
Infectious diseases / bone and joint diseases /immunological allergic diseases / urology
Fastic<antidiabetic agent>
Topotecin<anticancer agent>
Cravit<synthetic antibacterial agent>
Loxonin<anti-inflammatory analgesic>
Mobic<anti-inflammatory analgesic>
Urief<treatment for dysuria>
Contrast agents / cancer / gastric diseases
FY2008 ForecastFY2008 Results
Total net sales of ethical pharmaceuticals
Cardiovascular disease
Kremezin<treatment for chronic renal failure>
Hanp<treatment for acute cardiac failure>
Olmetec<antihypertensive>
Calblock<antihypertensive>
Artist<antihypertensive>
Mevalotin<antihyperlipidemic agent>
5

7-2. Daiichi Sankyo Healthcare Co., Ltd(Billions of yen)
1st half From Jul.Forecast
YoYChanges FY07 Results ===> FY08 Results 2nd half From Jul.
Forecast Full Year From Jul.Forecast
<-1.8> <8.1> <3.3>
24.0 -2.0 -0.4 28.0 0.0 52.0 -2.0<0.6> <5.7> <3.2>
4.9 -0.1 0.0 5.4 0.1 10.3 0.0
<-4.0> <21.6> <9.1>
1.6 -0.1 -0.1 2.2 0.1 3.8 0.0
<20.0> <-11.2> <0.8>
1.6 0.0 0.3 1.9 0.0 3.5 0.0
<-14.5> <23.2> <0.1>
1.6 0.1 -0.3 1.4 -0.1 3.0 0.0
<-14.5> <50.3> <14.9>
1.2 -0.8 -0.2 1.8 -1.2 3.0 -2.0
7-3. Daiichi Sankyo, Inc. (US) (Billions of yen)
1st half From Jul.Forecast
YoYChanges FY07 Results ===> FY08 Results 2nd half From Jul.
Forecast Full Year From Jul.Forecast
<5.8> <7.0> <6.4>
68.9 9.9 3.8 66.1 -3.9 135.0 6.0<19.0> <17.0> <18.0>
649 59 104 661 -39 1,310 20<2.2> <-2.0> <0.1>
45.5 4.5 1.0 42.5 -0.5 88.0 4.0
<15.0> <7.3> <11.0>
428 18 56 425 -5 854 14
<-> <124.3> <272.9>
3.8 0.8 3.8 5.7 0.2 9.5 1.0
<-> <153.5> <313.5>
36 6 36 57 2 92 7
<9.9> <18.9> <14.4>
12.5 1.0 1.1 13.5 0.0 26.0 1.0
<23.6> <29.8> <26.8>
118 3 23 134 -1 252 2
7-4. Luitpold Pharmaceuticals, Inc. (US)(Billions of yen)
1st half From Jul.Forecast
YoYChanges FY07 Results ===> FY08 Results 2nd half From Jul.
Forecast Full Year From Jul.Forecast
<9.9> <-17.0> <-4.0>
27.0 7.0 2.4 22.0 2.0 49.0 9.0<23.6> <-8.3> <6.4>
255 55 49 221 21 475 75<14.0> <-16.2> <-1.8>
16.8 5.3 2.1 13.7 2.2 30.5 7.5
<28.3> <-7.3> <8.9>
159 44 35 137 22 296 66mil USD
Welchol<antihyperlipidemic / type 2 diabetes>
mil USD
Strengthened promotions since the October 2007launch of Azor to ensure its position as a drug withstrong efficacy and good safety.
Sales increased due to strengthened promotionsfollowing the approval of additional indication for type 2diabetes in January 2008.
In addition to steady performance in the dialysis market,Venofer sales grew in the non-dialysis market as well.
mil USD
Luitpold Pharmaceuticals, Inc. (LPI)
Daiichi Sankyo Healthcare Co., Ltd
Daiichi Sankyo, Inc. (DSI)
LuLu Series
Gaster 10
Shin-Sankyo Ichoyaku series
Patecs series
FY2008 Results
FY2008 Results
Despite the steady increase in new users since the September2007 launch, Transino is yet to fully develop its potential market.
FY2008 Forecast
Transino
mil USD
Actively promoted as an ARB with outstandingantihypertensive effects, Benicar/Benicar HCT postedstrong growth surpassing ARB market growth. Solemarketing of DSI from FY 2008 started smoothly.
Benicar / Benicar HCT<antyihypertensive>
mil USD
Azor<antyihypertensive>
mil USD
Venofer<treatment for iron deficiency anemia>
FY2008 Forecast
FY2008 Results FY2008 Forecast
Sales were level due to the stagnant market condition. However,LuLu series increased its market share.
Sales dropped reflecting increased competition.
Sales increased due to favorable sales of newly launched Shin-Sankyo Ichoyaku Plus (Nov-2007), with little competition amongother existing products.
The Patecs Felbinac series(5, 35, and polutice) launched in thefirst half of FY 2007 helped revenues reach targets.
6
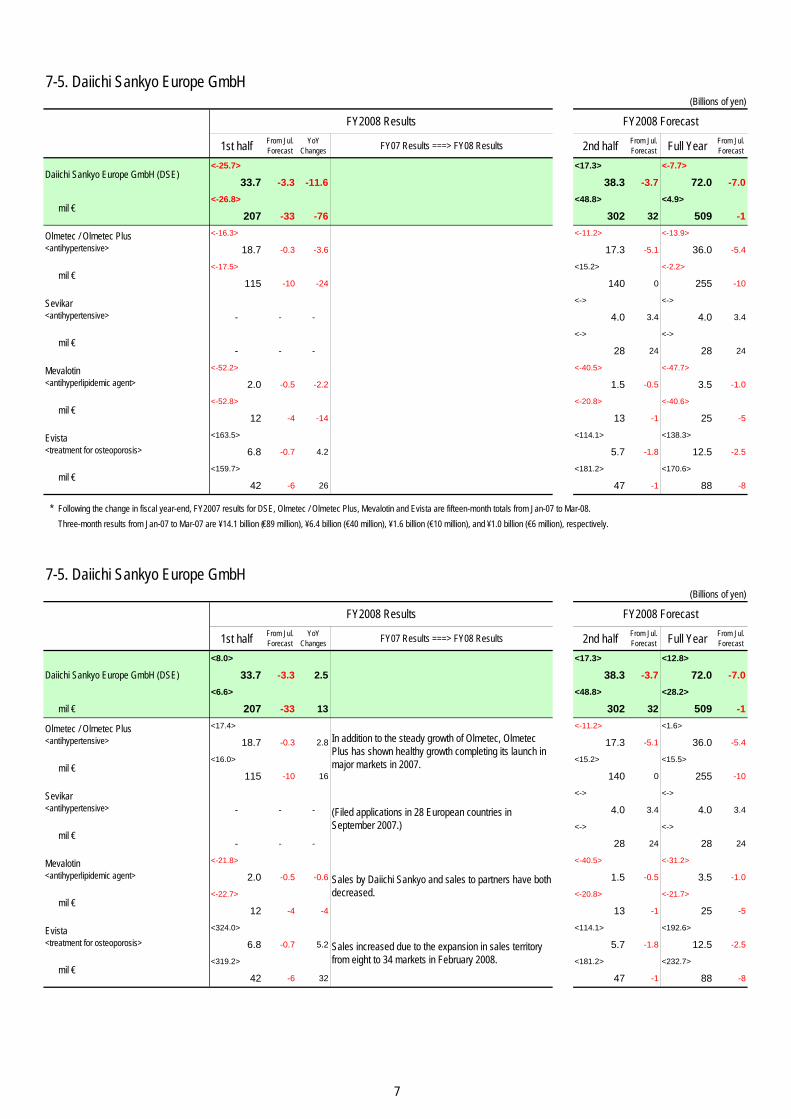
7-5. Daiichi Sankyo Europe GmbH(Billions of yen)
1st half From Jul.Forecast
YoYChanges FY07 Results ===> FY08 Results 2nd half From Jul.
Forecast Full Year From Jul.Forecast
<-25.7> <17.3> <-7.7>
33.7 -3.3 -11.6 38.3 -3.7 72.0 -7.0<-26.8> <48.8> <4.9>
207 -33 -76 302 32 509 -1<-16.3> <-11.2> <-13.9>
18.7 -0.3 -3.6 17.3 -5.1 36.0 -5.4
<-17.5> <15.2> <-2.2>
115 -10 -24 140 0 255 -10
<-> <->
- - - 4.0 3.4 4.0 3.4
<-> <->
- - - 28 24 28 24
<-52.2> <-40.5> <-47.7>
2.0 -0.5 -2.2 1.5 -0.5 3.5 -1.0
<-52.8> <-20.8> <-40.6>
12 -4 -14 13 -1 25 -5
<163.5> <114.1> <138.3>
6.8 -0.7 4.2 5.7 -1.8 12.5 -2.5
<159.7> <181.2> <170.6>
42 -6 26 47 -1 88 -8
* Following the change in fiscal year-end, FY2007 results for DSE, Olmetec / Olmetec Plus, Mevalotin and Evista are fifteen-month totals from Jan-07 to Mar-08.Three-month results from Jan-07 to Mar-07 are ¥14.1 billion (€89 million), ¥6.4 billion (€40 million), ¥1.6 billion (€10 million), and ¥1.0 billion (€6 million), respectively.
7-5. Daiichi Sankyo Europe GmbH(Billions of yen)
1st half From Jul.Forecast
YoYChanges FY07 Results ===> FY08 Results 2nd half From Jul.
Forecast Full Year From Jul.Forecast
<8.0> <17.3> <12.8>
Daiichi Sankyo Europe GmbH (DSE) 33.7 -3.3 2.5 38.3 -3.7 72.0 -7.0<6.6> <48.8> <28.2>
mil € 207 -33 13 302 32 509 -1<17.4> <-11.2> <1.6>
18.7 -0.3 2.8 17.3 -5.1 36.0 -5.4
<16.0> <15.2> <15.5>
115 -10 16 140 0 255 -10
<-> <->
- - - 4.0 3.4 4.0 3.4
<-> <->
- - - 28 24 28 24
<-21.8> <-40.5> <-31.2>
2.0 -0.5 -0.6 1.5 -0.5 3.5 -1.0
<-22.7> <-20.8> <-21.7>
12 -4 -4 13 -1 25 -5
<324.0> <114.1> <192.6>
6.8 -0.7 5.2 5.7 -1.8 12.5 -2.5
<319.2> <181.2> <232.7>
42 -6 32 47 -1 88 -8
Sales increased due to the expansion in sales territoryfrom eight to 34 markets in February 2008.
FY2008 Results
mil €
Sales by Daiichi Sankyo and sales to partners have bothdecreased.
mil €
Mevalotin<antihyperlipidemic agent>
mil €
Sevikar<antihypertensive>
Mevalotin<antihyperlipidemic agent>
Olmetec / Olmetec Plus<antihypertensive>
mil €
Evista<treatment for osteoporosis>
In addition to the steady growth of Olmetec, OlmetecPlus has shown healthy growth completing its launch inmajor markets in 2007.
(Filed applications in 28 European countries inSeptember 2007.)
mil €
Sevikar<antihypertensive>
mil €
Olmetec / Olmetec Plus<antihypertensive>
FY2008 Forecast
FY2008 Results FY2008 Forecast
Daiichi Sankyo Europe GmbH (DSE)
mil €
mil €
Evista<treatment for osteoporosis>
mil €
7
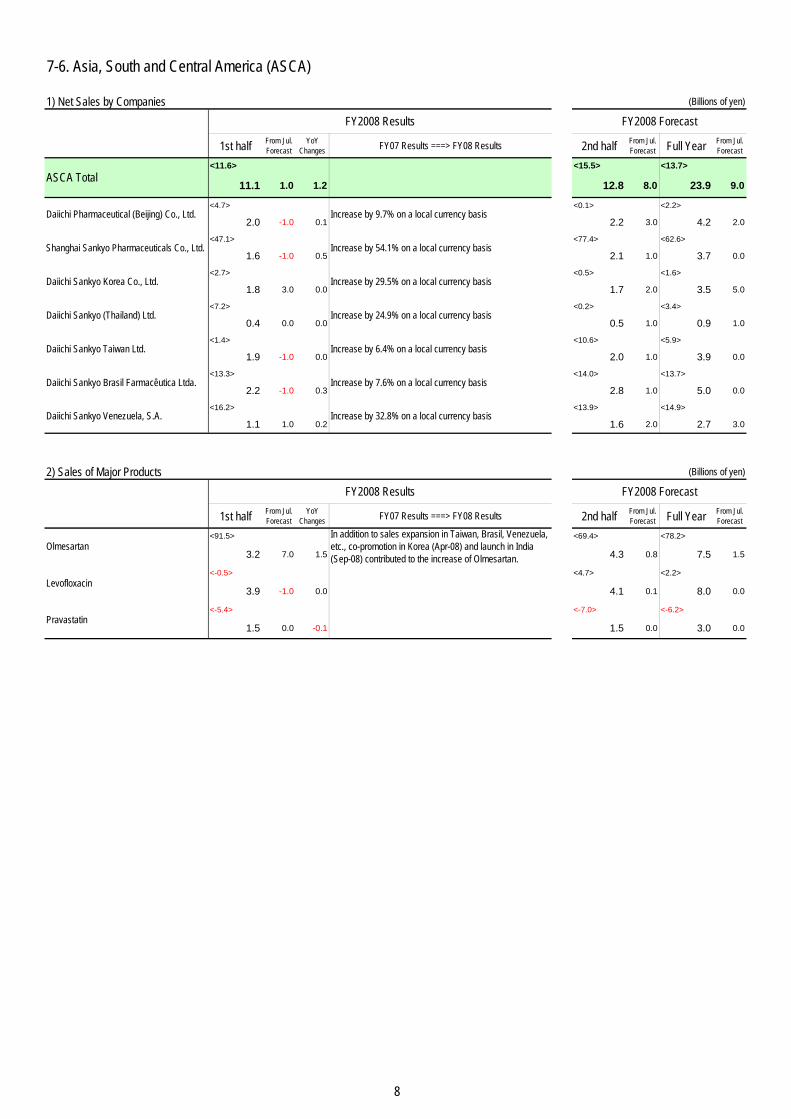
7-6. Asia, South and Central America (ASCA)
1) Net Sales by Companies (Billions of yen)
1st half From Jul.Forecast
YoYChanges FY07 Results ===> FY08 Results 2nd half From Jul.
Forecast Full Year From Jul.Forecast
<11.6> <15.5> <13.7>
11.1 1.0 1.2 12.8 8.0 23.9 9.0
<4.7> <0.1> <2.2>
2.0 -1.0 0.1 2.2 3.0 4.2 2.0
<47.1> <77.4> <62.6>
1.6 -1.0 0.5 2.1 1.0 3.7 0.0
<2.7> <0.5> <1.6>
1.8 3.0 0.0 1.7 2.0 3.5 5.0
<7.2> <0.2> <3.4>
0.4 0.0 0.0 0.5 1.0 0.9 1.0
<1.4> <10.6> <5.9>
1.9 -1.0 0.0 2.0 1.0 3.9 0.0
<13.3> <14.0> <13.7>
2.2 -1.0 0.3 2.8 1.0 5.0 0.0
<16.2> <13.9> <14.9>
1.1 1.0 0.2 1.6 2.0 2.7 3.0
2) Sales of Major Products (Billions of yen)
1st half From Jul.Forecast
YoYChanges FY07 Results ===> FY08 Results 2nd half From Jul.
Forecast Full Year From Jul.Forecast
<91.5> <69.4> <78.2>
3.2 7.0 1.5 4.3 0.8 7.5 1.5
<-0.5> <4.7> <2.2>
3.9 -1.0 0.0 4.1 0.1 8.0 0.0
<-5.4> <-7.0> <-6.2>
1.5 0.0 -0.1 1.5 0.0 3.0 0.0Pravastatin
In addition to sales expansion in Taiwan, Brasil, Venezuela,etc., co-promotion in Korea (Apr-08) and launch in India(Sep-08) contributed to the increase of Olmesartan.
Daiichi Sankyo Venezuela, S.A.
ASCA Total
Olmesartan
Levofloxacin
Daiichi Sankyo (Thailand) Ltd.
Daiichi Sankyo Taiwan Ltd.
Daiichi Sankyo Brasil Farmacêutica Ltda.
Daiichi Pharmaceutical (Beijing) Co., Ltd.
Shanghai Sankyo Pharmaceuticals Co., Ltd.
Daiichi Sankyo Korea Co., Ltd.
FY2008 Results
Increase by 9.7% on a local currency basis
Increase by 54.1% on a local currency basis
Increase by 32.8% on a local currency basis
Increase by 29.5% on a local currency basis
Increase by 24.9% on a local currency basis
Increase by 6.4% on a local currency basis
Increase by 7.6% on a local currency basis
FY2008 Forecast
FY2008 Forecast
FY2008 Results
8

8. Number of Employees
Total number of Employees
Japan
Overseas
Mar-08 MRs Jun-08 MRs Sep-08* MRs
Total number of Employees 15,349 15,731 16,237
<Japan>
Daiichi Sankyo Co., Ltd. (DS) 5,925 2,400 6,024 2,400 6,007 2,400
Daiichi Sankyo Healthcare Co., Ltd (DSHC) 396 150 399 150 401 150
<US>
Daiichi Sankyo, Inc. (DSI) 2,446 1,550 2,667 1,590 2,856 1,810
Luitpold Pharmaceuticals, Inc. (LPI) 498 90 495 90 497 90
<Europe>
Daiichi Sankyo Europe GmbH (DSE) 1,776 830 1,774 850 2,031 1,020
<Asia / Latin America>
Daiichi Pharmaceutical (Beijing) Co., Ltd. (DPP) 443 143 443 143 470 164
Shanghai Sankyo Pharmaceuticals Co., Ltd. (SSP) 456 196 476 196 486 201
Daiichi Sankyo Hong Kong Ltd. (DSHK) 7 - 7 - 7 -
Daiichi Sankyo Korea Co., Ltd. (DSKR) 89 51 89 49 89 48
Daiichi Sankyo (Thailand) Ltd. (DSTH) 46 18 43 17 38 13
Daiichi Sankyo Taiwan Ltd. (DSTW) 150 65 158 65 159 69
Daiichi Sankyo Brasil Farmacêutica Ltda. (DSBR) 266 118 266 118 288 116
Daiichi Sankyo Venezuela, S.A. (DSVE) 123 70 123 70 128 61
* For overseas subsidiaries with different fiscal year-ends, figures as of Jun-08 are shown
6,301 6,625 7,141
FY2007 FY2008
15,349 15,731 16,237
9,048 9,106 9,096
FY2007 FY2008
Mar-08 Jun-08 Sep-08*
9

9. Major Management / Financial IndicatorsFY2008Results
FY2008Forecast
1st Half Full Year 1st Half Full Year
Dividend payout ratio (Consolidated) 42.1% 51.7% 83.9% (86.3%)
Dividend on equity (DOE) - 4.0% - -
Earnings per share (EPS) 83.2 yen 135.3 yen 47.7 yen (92.3 yen)
Dividend per share 35.0 yen 70.0 yen 40.0 yen 80.0 yen
Dividend payment (billions of yen) 25.2 billion 50.3 billion 28.2 billion
Return on equity (ROE) - 7.8% -
Book value per share (BPS) 1,762.0 yen 1,730.1 yen 1,683.8 yen
Equity ratio 83.6% 83.6% 83.9%
Number of treasury stock purchased 10.0 million 10.0 million 15.0 million * including cancellation of 26 million shares (Sep.)
Treasury stock purchase (billions of yen) 33.4 billion 33.4 billion 45.8 billion
Total number of common shares* 719 million 719 million 704 million
Share price at end of period 3,450 yen 2,945 yen 2,695 yen
Market value (billions of yen) 2.481 billion 2,117 billion 1,897 billion
Financial Indicators (billions of yen)Total assets 1,515.8 1,487.9 1,412.3
Current assets 944.9 926.5 857.5
Debt with interest 5.9 0.1 0.0
Shareholder's equity 1,266.8 1,243.9 1,185.3
CF from operating activities -6.8 66.7 18.8
CF from investing activities 5.6 -49.4 -198.0
CF from financial activities -59.5 -82.9 -71.0
Free cash flow** -1.2 17.3 -179.3
Cash and cash equivalents, end of year 453.9 444.3 192.1
Liquidity on hand*** 652.6 665.5 385.1Others
Number of consolidated subsidiaries 46 43 43
* excluding treasury stock** CF from operating activities + CF from investing activities
*** Current deposits + marketable securities + investment securities, etc
10. Capital Expenditure and Depreciation Expense(Billions of yen)
FY2008Results
FY2008Forecast
1st Half Full Year 1st Half Full Year
Depreciation expense 18.8 38.7 19.3 38.5
Capital expenditure 12.8 21.1 7.7 18.0
11. Number of Shares Held and Shareholders by Category
Number ofshareholders
Number ofshares % Number of
shareholdersNumber of
shares % Number ofshareholders
Number ofshares %
Government and public 1 0 0.0% 1 0 0.0% 2 0 0.0%
Financial institutions 192 343 46.7% 187 350 47.8% 189 340 48.0%
Financial instruments firms 65 17 2.4% 45 19 2.7% 46 12 1.8%
Corporate investors 653 44 6.0% 673 44 6.1% 645 44 6.4%
Foreign investors 614 221 30.2% 653 212 29.0% 642 216 30.6%
individuals 58,079 91 12.5% 56,944 89 12.2% 56,967 88 12.5%
Treasury stock 1 16 2.2% 1 16 2.2% 1 5 0.7%
Total 59,605 733 100.0% 58,504 733 100.0% 58,492 707 100.0%
As of Sep. 30 , 2007 As of March 31, 2008 As of Sep. 30 , 2008
FY2007 Results
FY2007 Results
Managenent Indicators
10

12. Consolidated Balance Sheets(Billions of yen)
Change
% %
Current assets 926.5 62.3% 857.5 60.7% -69.0
Cash and time deposits 47.3 48.2 0.8 Liquidity on hand (current deposits + marketable securities + investment securities)
Trade notes and accounts receivable 167.0 180.5 13.6 Total ¥385.1 billion (¥-276.9 billion from the end of fiscal 2007)Marketable securities 526.8 262.0 -264.8
Inventories 98.2 100.5 2.4Deferred tax assets 52.7 66.5 13.8
Deposits paid - 170.9 170.9
Other current assets 34.9 29.2 -5.7 Deferred tax assets of derivative related to acquisition of Ranbaxy: ¥+9.1Allowance for doubtful accounts -0.3 -0.2 0.1
Non-current assets 561.4 37.7% 554.8 39.3% -6.6
Property, plant and equipment 221.3 14.9% 213.2 15.1% -8.0 Buildings and structures 136.8 131.2 -5.6Machinery, equipment and vehicles 33.2 30.5 -2.7Land 33.1 33.5 0.4 Construction in progress 2.9 3.1 0.2Other 15.2 14.8 -0.4
Intangible assets 91.1 6.1% 104.8 7.4% 13.8
Goodwill, net 15.4 37.5 22.1Other intangible assets, net 75.7 67.3 -8.4
Investments and other assets 249.0 16.7% 236.7 16.8% -12.3Investment securities 216.0 204.9 -11.1 Decrease of market value due to stagnation in equity marketLong-term loans 1.3 0.2 -1.1
Prepaid pension costs 8.0 7.4 -0.7Deferred tax assets 6.0 6.0 0.0Other assets 18.0 18.6 0.6Allowance for doubtful accounts -0.4 -0.4 0.0
Total assets 1,487.9 100.0% 1,412.3 100.0% -75.6
(Billions of yen) Change
% %
Liabilities 243.4 16.4% 226.7 16.1% -16.7
194.5 13.1% 183.2 13.0% -11.4Trade notes and accounts payable 46.4 45.2 -1.2 Short-term bank loans 0.1 0.0 -0.1Income taxes payable 18.7 14.1 -4.6Allowance for sales returns 0.8 0.8 0.0Allowance for sales rebates 0.8 1.2 0.4Allowance for contingent losses 0.2 - -
Other current liabilities 127.6 121.9 -5.7
48.9 3.3% 43.6 3.1% -5.3Deferred tax liabilities 26.7 22.6 -4.1
Accrued employees’ severance andretirement benefits 6.8 8.0 1.2
Accrued directors' and corporateauditors’ severance and retirement 0.1 0.1 0.0
Provision for environmental measures 1.1 0.3 -0.7Other non-current liabilities 14.2 12.4 -1.7
Net assets 1,244.5 83.6% 1,185.6 83.9% -58.9
1,211.6 81.4% 1,172.1 83.0% -39.5Common stock 50.0 50.0 0.0
Capital surplus 179.9 105.2 -74.7 Cancellation of treasury stock ¥-74.7 billion (26 million shares)
Retained earnings 1,025.1 1,031.4 6.3 Retained earnings increase ¥+6.3 billion<Variation factors>: Net income ¥+34.0 billion, Dividend ¥-25.2 billion
Treasury stock at cost -43.4 -14.5 28.9 Share buyback: 15 million shares, ¥45.7 billionCancellation: 26 million shares, ¥74.7 billion
32.3 2.2% 13.2 0.9% -19.1 Net unrealized gain on investment securities 48.5 42.6 -6.0 Decrease due to stagnation in equity market
Deferred gains or losses on hedges - -13.4 -13.4 Revaluation loss of derivatives related to acquisition of Ranbaxy's shares Foreign currency translation adjustments -16.3 -16.0 0.3
0.3 0.0% 0.3 0.0% 0.0
0.4 0.0% 0.0 0.0% -0.4
Total liabilities and net assets 1,487.9 100.0% 1,412.3 100.0% -75.6
<Breakdown>¥+34.0 billion in net income, ¥-25.2 billion from dividends paid¥-45.8 billion from share buybacks¥-26.8 billion from acquisition of U3 Pharma AG¥-174.0 billion for the acquisition of Ranbaxy's share (Open offer, etc.)
Decrease due to payment of accured expense for the acquisistion of Evista'scommercial rights, etc. ¥-28.8 billionDerivatives debt related to acquisition of Ranbaxy's shares ¥+25.5 billion
2008.3.31 Details
Details2008.3.31
Acquisition of U3 Pharma AG: ¥+25.1billion(Amortization period: five years from 2Q of FY2008)
Non-current liabilities
Shareholders' equity
Valuation and other adjustments
Minority interestsSubscription rights to shares
Current liabilities
2008.9.30
<Liabilities and Net Assets>2008.9.30
<Assets>
11
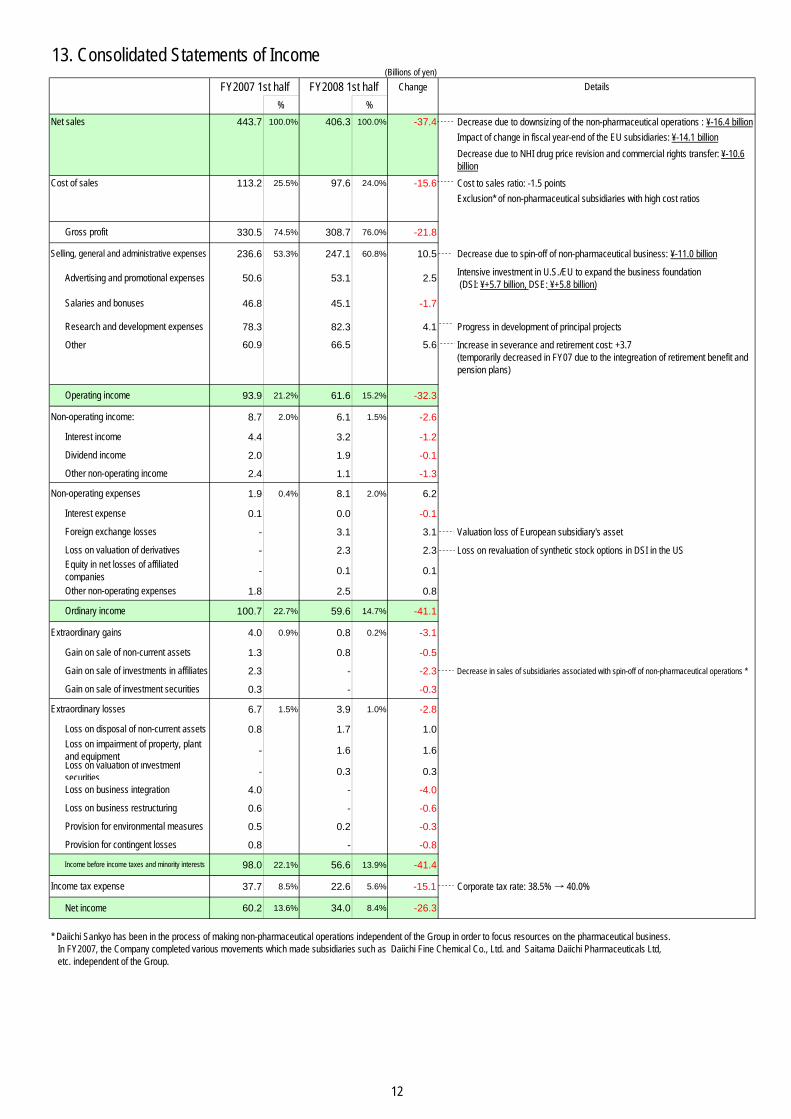
13. Consolidated Statements of Income (Billions of yen) Change
% %
443.7 100.0% 406.3 100.0% -37.4 Decrease due to downsizing of the non-pharmaceutical operations : ¥-16.4 billion Impact of change in fiscal year-end of the EU subsidiaries: ¥-14.1 billion
113.2 25.5% 97.6 24.0% -15.6 Cost to sales ratio: -1.5 points Exclusion* of non-pharmaceutical subsidiaries with high cost ratios
330.5 74.5% 308.7 76.0% -21.8
236.6 53.3% 247.1 60.8% 10.5 Decrease due to spin-off of non-pharmaceutical business: ¥-11.0 billion
50.6 53.1 2.5 Intensive investment in U.S./EU to expand the business foundation (DSI: ¥+5.7 billion, DSE: ¥+5.8 billion)
46.8 45.1 -1.7
78.3 82.3 4.1 Progress in development of principal projects
Other 60.9 66.5 5.6
Increase in severance and retirement cost: +3.7(temporarily decreased in FY07 due to the integreation of retirement benefit andpension plans)
93.9 21.2% 61.6 15.2% -32.3
8.7 2.0% 6.1 1.5% -2.6
4.4 3.2 -1.2
2.0 1.9 -0.1
2.4 1.1 -1.3
1.9 0.4% 8.1 2.0% 6.2
0.1 0.0 -0.1
- 3.1 3.1 Valuation loss of European subsidiary's asset
- 2.3 2.3 Loss on revaluation of synthetic stock options in DSI in the US
- 0.1 0.1
1.8 2.5 0.8
100.7 22.7% 59.6 14.7% -41.1
4.0 0.9% 0.8 0.2% -3.1
1.3 0.8 -0.5
2.3 - -2.3 Decrease in sales of subsidiaries associated with spin-off of non-pharmaceutical operations *
0.3 - -0.3
6.7 1.5% 3.9 1.0% -2.8
0.8 1.7 1.0
- 1.6 1.6
- 0.3 0.3
4.0 - -4.0
0.6 - -0.6
0.5 0.2 -0.3
0.8 - -0.8
98.0 22.1% 56.6 13.9% -41.4
37.7 8.5% 22.6 5.6% -15.1 Corporate tax rate: 38.5% → 40.0%
Net income 60.2 13.6% 34.0 8.4% -26.3
Decrease due to NHI drug price revision and commercial rights transfer: ¥-10.6billion
Loss on valuation of investmentsecurities
Gain on sale of investments in affiliates
Gain on sale of investment securities
* Daiichi Sankyo has been in the process of making non-pharmaceutical operations independent of the Group in order to focus resources on the pharmaceutical business. In FY2007, the Company completed various movements which made subsidiaries such as Daiichi Fine Chemical Co., Ltd. and Saitama Daiichi Pharmaceuticals Ltd, etc. independent of the Group.
Extraordinary losses
Loss on disposal of non-current assets
Loss on business restructuring
Provision for environmental measures
Provision for contingent losses
Income tax expense
Loss on impairment of property, plantand equipment
Loss on business integration
Other non-operating income
Non-operating expenses
Interest expense
Foreign exchange losses
Loss on valuation of derivatives
Ordinary income
Extraordinary gains
Gain on sale of non-current assets
Equity in net losses of affiliatedcompaniesOther non-operating expenses
Operating income
Non-operating income:
Interest income
Dividend income
Salaries and bonuses
Research and development expenses
Cost of sales
Gross profit
Selling, general and administrative expenses
Advertising and promotional expenses
Details
Net sales
Income before income taxes and minority interests
FY2007 1st half FY2008 1st half
12

14. Consolidated Statements of Cash Flows(Billions of yen)
FY2007 FY20081st half 1st half
98.0 56.6 -41.4
18.8 19.3 0.5
1.8 2.9 1.1
-24.6 0.2 24.8
14.3 0.7 -13.6
4.6 -13.9 -18.5
-0.7 -2.0 -1.4
-8.1 -1.1 7.0
-65.0 -11.3 53.7
-9.1 -0.9 8.2
-36.8 -31.7 5.1
I. Cash flows from operating activities -6.8 18.8 25.6
3.9 41.5 37.6 Decreased investment activity (¥30.9 billion)
-12.8 -27.5 -14.6 Acquisiston of the right to expand marketing area of Evista
-3.0 -188.4 -185.4
8.7 0.6 -8.1
8.8 - -8.8
- -24.3 -24.3 Acquisiston of U3 Pharma AG
II. Cash flows from investing activities 5.6 -198.0 -203.7
-4.2 -0.1 4.1
-33.4 -45.8 -12.4
-21.9 -25.2 -3.3 Dividend increase of 5 yen per share
-0.1 -0.0 0.1
III. -59.5 -71.0 -11.5
IV. -0.1 -1.9 -1.8
V. -60.8 -252.2 -191.4
VI. 513.2 444.3 -68.9
VII. 0.5 - -0.5
VIII. 1.0 - -1.0
IX. Cash and cash equivalents, end of year 453.9 192.1 -261.8
FY2007Payment of accrued severance and retirement benefits due toworkforce resizing and employment transfer to function-basedsubsidiaries, etc
FY2008:Acquired 15 million shares for ¥45.7 billionFY2007:Acquired 10 million shares for ¥33.2 billion
Increase (decrease) in accounts payable and accrued expense
Change
Income before income taxes and minority interests
Depreciation
Amortization of goodwill
Increase (decrease) in accrued severance and retirement benefits
Details
Net increase (decrease) in short-term bank loans
Increase (decrease) in cash and cash equivalents due tochanges in scope of consolidation
Increase in cash and cash equivalents due to merger withunconsolidated subsidiaries
Other, net
Cash flows from financing activities
Effect of exchange rate changes on cash and cash equivalents
Net increase (decrease) in cash and cash equivalents
Cash and cash equivalents, beginning of period
Dividends paid
(Increase) decrease in prepaid pension costs
(Increase) decrease in trade notes and accounts receivable
(Increase) decrease in inventories
Increase (decrease) in trade notes and accounts payable
Other, net
Purchases of treasury stock
Proceeds from sale of investments in consolidated subsidiaries
Purchases of investments in consolidated subsidiaries resultingin changes in scope of consolidation
Income taxes paid
Net decrease (increase) in short-term operating assets
Acquisition/sales of fixed assets
Acquisition/sales of investment securities
Net decrease (increase) in loans receivable
13
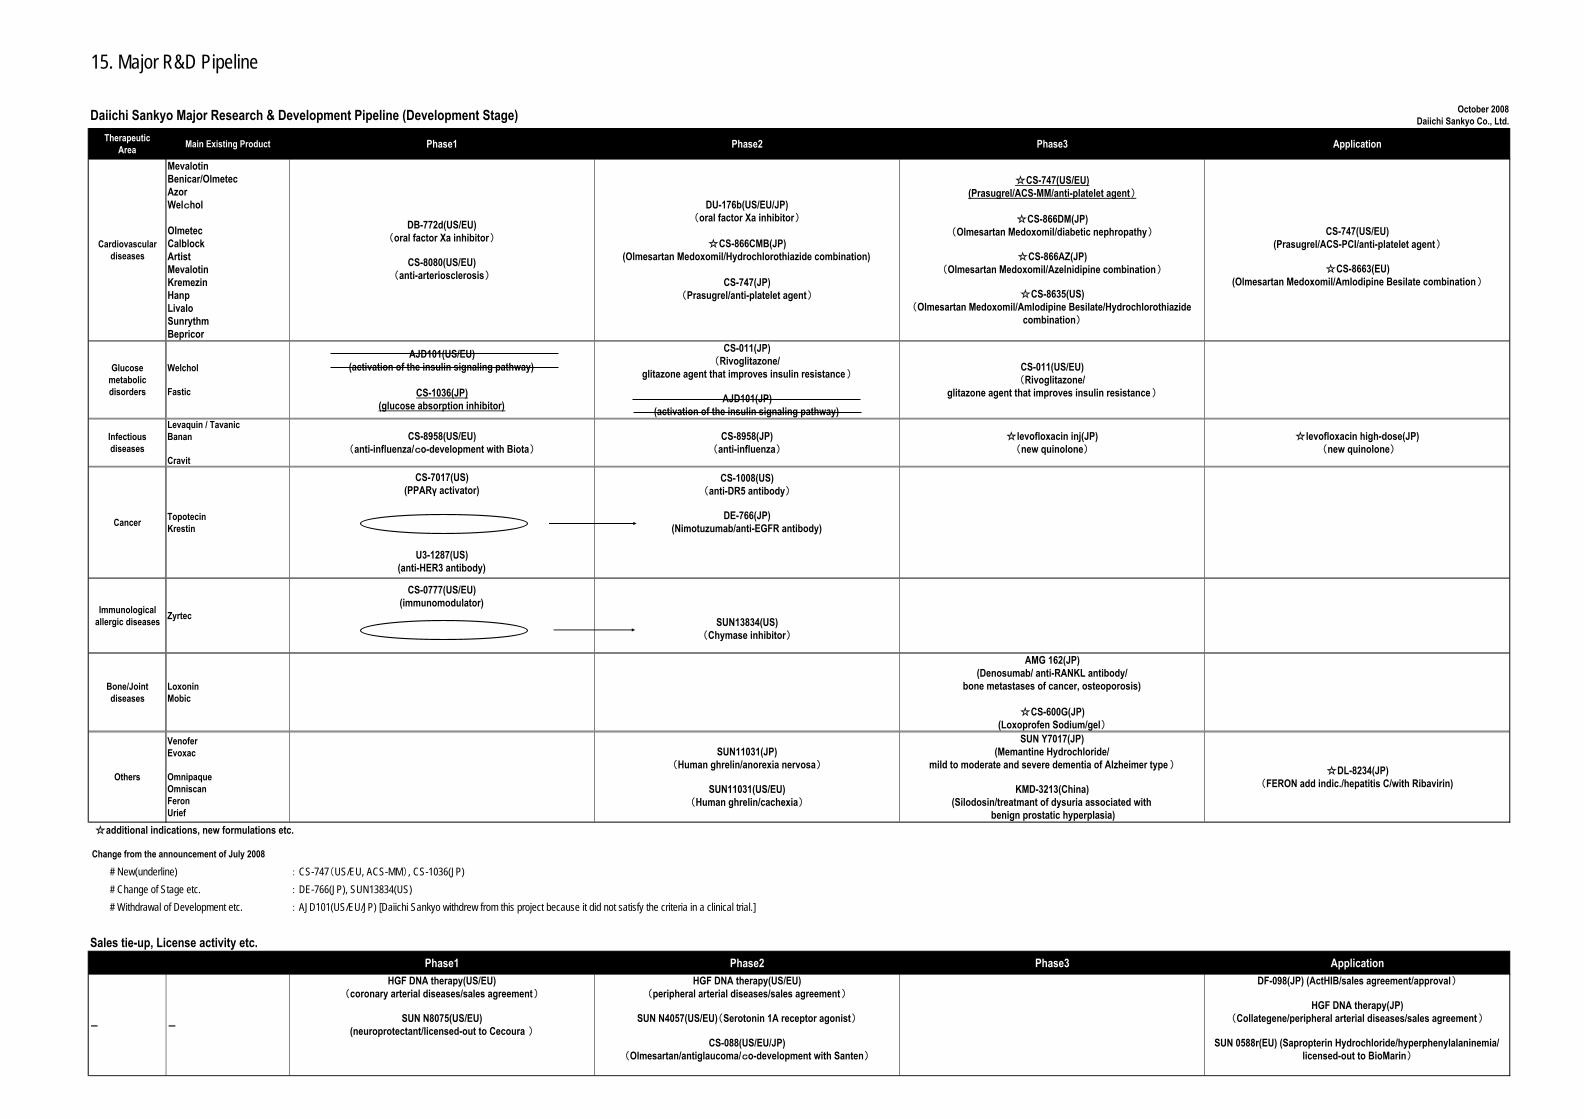
15. Major R&D Pipeline
Daiichi Sankyo Major Research & Development Pipeline (Development Stage) October 2008Daiichi Sankyo Co., Ltd.
TherapeuticArea Main Existing Product Phase1 Phase2 Phase3 Application
Cardiovasculardiseases
MevalotinBenicar/OlmetecAzorWelchol
OlmetecCalblockArtistMevalotinKremezinHanpLivaloSunrythmBepricor
DB-772d(US/EU)(oral factor Xa inhibitor)
CS-8080(US/EU)(anti-arteriosclerosis)
DU-176b(US/EU/JP)(oral factor Xa inhibitor)
☆CS-866CMB(JP)(Olmesartan Medoxomil/Hydrochlorothiazide combination)
CS-747(JP)(Prasugrel/anti-platelet agent)
☆CS-747(US/EU)(Prasugrel/ACS-MM/anti-platelet agent)
☆CS-866DM(JP)(Olmesartan Medoxomil/diabetic nephropathy)
☆CS-866AZ(JP)(Olmesartan Medoxomil/Azelnidipine combination)
☆CS-8635(US)(Olmesartan Medoxomil/Amlodipine Besilate/Hydrochlorothiazide
combination)
CS-747(US/EU)(Prasugrel/ACS-PCI/anti-platelet agent)
☆CS-8663(EU)(Olmesartan Medoxomil/Amlodipine Besilate combination)
Glucosemetabolicdisorders
Welchol
Fastic
AJD101(US/EU)(activation of the insulin signaling pathway)
CS-1036(JP)(glucose absorption inhibitor)
CS-011(JP)(Rivoglitazone/
glitazone agent that improves insulin resistance)
AJD101(JP)(activation of the insulin signaling pathway)
CS-011(US/EU)(Rivoglitazone/
glitazone agent that improves insulin resistance)
Infectiousdiseases
Levaquin / TavanicBanan
Cravit
CS-8958(US/EU)(anti-influenza/co-development with Biota)
CS-8958(JP)(anti-influenza)
☆levofloxacin inj(JP)(new quinolone)
☆levofloxacin high-dose(JP) (new quinolone)
Cancer TopotecinKrestin
CS-7017(US)(PPARγ activator)
U3-1287(US)(anti-HER3 antibody)
CS-1008(US)(anti-DR5 antibody)
DE-766(JP)(Nimotuzumab/anti-EGFR antibody)
Immunologicalallergic diseases Zyrtec
CS-0777(US/EU)(immunomodulator)
SUN13834(US)(Chymase inhibitor)
Bone/Jointdiseases
LoxoninMobic
AMG 162(JP)(Denosumab/ anti-RANKL antibody/
bone metastases of cancer, osteoporosis)
☆CS-600G(JP)(Loxoprofen Sodium/gel)
Others
VenoferEvoxac
OmnipaqueOmniscanFeronUrief
SUN11031(JP)(Human ghrelin/anorexia nervosa)
SUN11031(US/EU)(Human ghrelin/cachexia)
SUN Y7017(JP)(Memantine Hydrochloride/
mild to moderate and severe dementia of Alzheimer type )
KMD-3213(China)(Silodosin/treatmant of dysuria associated with
benign prostatic hyperplasia)
☆DL-8234(JP)(FERON add indic./hepatitis C/with Ribavirin)
☆additional indications, new formulations etc.
Change from the announcement of July 2008
# New(underline) : CS-747(US/EU, ACS-MM), CS-1036(JP) # Change of Stage etc. : DE-766(JP), SUN13834(US) # Withdrawal of Development etc. : AJD101(US/EU/JP) [Daiichi Sankyo withdrew from this project because it did not satisfy the criteria in a clinical trial.]
Sales tie-up, License activity etc.Phase1 Phase2 Phase3 Application
― ―
HGF DNA therapy(US/EU)(coronary arterial diseases/sales agreement)
SUN N8075(US/EU)(neuroprotectant/licensed-out to Cecoura )
HGF DNA therapy(US/EU)(peripheral arterial diseases/sales agreement)
SUN N4057(US/EU)(Serotonin 1A receptor agonist)
CS-088(US/EU/JP)(Olmesartan/antiglaucoma/co-development with Santen)
DF-098(JP) (ActHIB/sales agreement/approval)
HGF DNA therapy(JP)(Collategene/peripheral arterial diseases/sales agreement)
SUN 0588r(EU) (Sapropterin Hydrochloride/hyperphenylalaninemia/licensed-out to BioMarin)
Cardiovascular diseases 【project after PhaseⅡ】
DevelopmentCode Number
Generic NameDosageForm
Class Indication Origin Region Stage
CS-747 Prasugrel Oral Anti-platelet agent Acute coronary syndromeDAIICHI
SANKYO,Ube Industries
USEUJP
ApplicationApplication
P2
DevelopmentCode Number
Generic NameDosageForm
Class Indication Origin Region Stage
DU-176b - Oral Factor Xa inhibitorAtrial fibrillation,
Venous thromboembolismDAIICHISANKYO
USEUJP
P2P2P2
DevelopmentCode Number
Generic NameDosageForm
Class Indication Origin Region Stage
CS-8663Olmesartanmedoxomil,
Amlodipine besilateOral
Angiotensin Ⅱ receptorantagonist,
Calcium channel blockerHypertension
DAIICHISANKYO
EU Application
DevelopmentCode Number
Generic NameDosageForm
Class Indication Origin Region Stage
CS-866DMOlmesartanmedoxomil
OralAngiotensin Ⅱ receptor
antagonistDiabetic nephropathy
in patients with type 2 DMDAIICHISANKYO
JP P3
DevelopmentCode Number
Generic NameDosageForm
Class Indication Origin Region Stage
CS-866AZOlmesartanmedoxomil,Azelnidipine
OralAngiotensin Ⅱ receptor
antagonist,Calcium channel blocker
HypertensionDAIICHISANKYO
JP P3
DevelopmentCode Number
Generic NameDosageForm
Class Indication Origin Region Stage
CS-866CMBOlmesartanmedoxomil,
HydrochlorothiazideOral
Angiotensin Ⅱ receptorantagonist,Diuretic
HypertensionDAIICHISANKYO
JP P2
DevelopmentCode Number
Generic NameDosageForm
Class Indication Origin Region Stage
CS-8635
Olmesartanmedoxomil,
Amlodipine besilate,Hydrochlorothiazide
Oral
Angiotensin Ⅱ receptorantagonist,
Calcium channel blocker,Diuretic
HypertensionDAIICHISANKYO
US P3
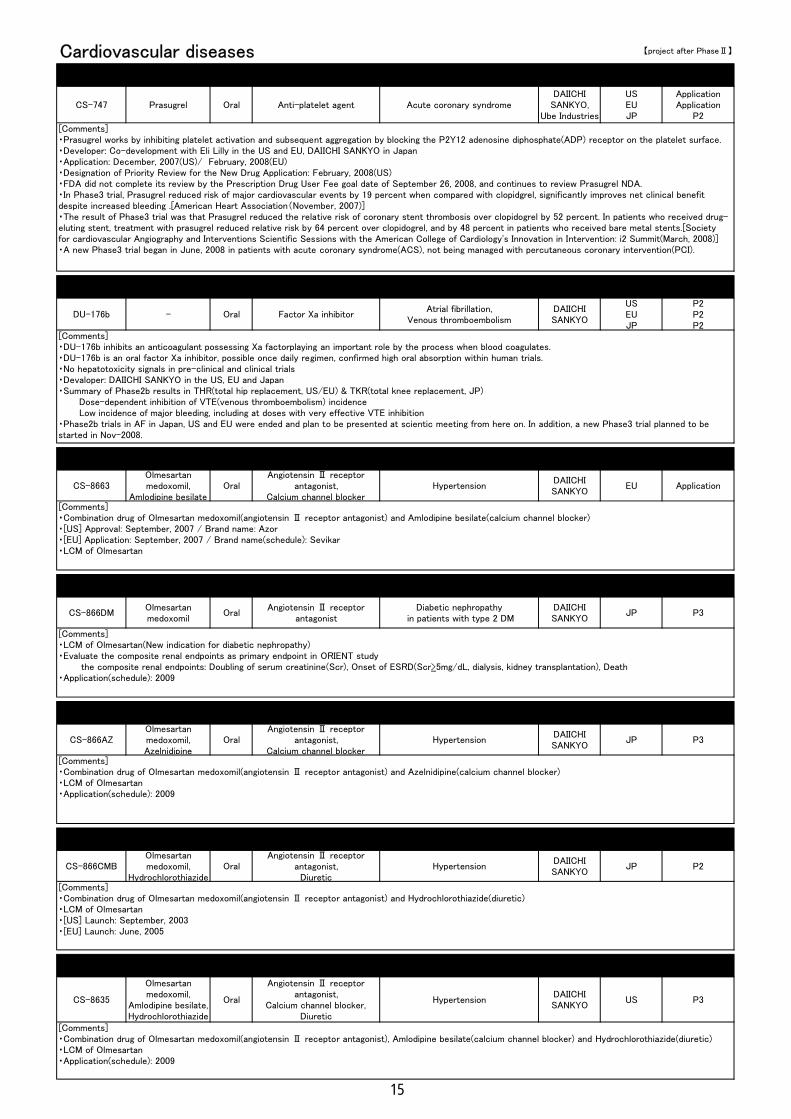
[Comments]・Combination drug of Olmesartan medoxomil(angiotensin Ⅱ receptor antagonist) and Azelnidipine(calcium channel blocker)・LCM of Olmesartan・Application(schedule): 2009
[Comments]・Combination drug of Olmesartan medoxomil(angiotensin Ⅱ receptor antagonist), Amlodipine besilate(calcium channel blocker) and Hydrochlorothiazide(diuretic)・LCM of Olmesartan・Application(schedule): 2009
[Comments]・Combination drug of Olmesartan medoxomil(angiotensin Ⅱ receptor antagonist) and Hydrochlorothiazide(diuretic)・LCM of Olmesartan・[US] Launch: September, 2003・[EU] Launch: June, 2005
[Comments]・Prasugrel works by inhibiting platelet activation and subsequent aggregation by blocking the P2Y12 adenosine diphosphate(ADP) receptor on the platelet surface.・Developer: Co-development with Eli Lilly in the US and EU, DAIICHI SANKYO in Japan・Application: December, 2007(US)/ February, 2008(EU)・Designation of Priority Review for the New Drug Application: February, 2008(US)・FDA did not complete its review by the Prescription Drug User Fee goal date of September 26, 2008, and continues to review Prasugrel NDA.・In Phase3 trial, Prasugrel reduced risk of major cardiovascular events by 19 percent when compared with clopidgrel, significantly improves net clinical benefitdespite increased bleeding .[American Heart Association(November, 2007)]・The result of Phase3 trial was that Prasugrel reduced the relative risk of coronary stent thrombosis over clopidogrel by 52 percent. In patients who received drug-eluting stent, treatment with prasugrel reduced relative risk by 64 percent over clopidogrel, and by 48 percent in patients who received bare metal stents.[Societyfor cardiovascular Angiography and Interventions Scientific Sessions with the American College of Cardiology's Innovation in Intervention: i2 Summit(March, 2008)]・A new Phase3 trial began in June, 2008 in patients with acute coronary syndrome(ACS), not being managed with percutaneous coronary intervention(PCI).
[Comments]・DU-176b inhibits an anticoagulant possessing Xa factorplaying an important role by the process when blood coagulates.・DU-176b is an oral factor Xa inhibitor, possible once daily regimen, confirmed high oral absorption within human trials.・No hepatotoxicity signals in pre-clinical and clinical trials・Devaloper: DAIICHI SANKYO in the US, EU and Japan・Summary of Phase2b results in THR(total hip replacement, US/EU) & TKR(total knee replacement, JP) Dose-dependent inhibition of VTE(venous thromboembolism) incidence Low incidence of major bleeding, including at doses with very effective VTE inhibition・Phase2b trials in AF in Japan, US and EU were ended and plan to be presented at scientic meeting from here on. In addition, a new Phase3 trial planned to bestarted in Nov-2008.
[Comments]・Combination drug of Olmesartan medoxomil(angiotensin Ⅱ receptor antagonist) and Amlodipine besilate(calcium channel blocker)・[US] Approval: September, 2007 / Brand name: Azor・[EU] Application: September, 2007 / Brand name(schedule): Sevikar・LCM of Olmesartan
[Comments]・LCM of Olmesartan(New indication for diabetic nephropathy)・Evaluate the composite renal endpoints as primary endpoint in ORIENT study the composite renal endpoints: Doubling of serum creatinine(Scr), Onset of ESRD(Scr>5mg/dL, dialysis, kidney transplantation), Death・Application(schedule): 2009
15

Glucose metabolic disordersDevelopmentCode Number
Generic NameDosageForm
Class Indication Origin Region Stage
CS-011 Rivoglitazone OralGlitazone agent that improves
insulin resistanceDiabetes
DAIICHISANKYO
USEUJP
P3P3P2
Infectious diseasesDevelopmentCode Number
Generic NameDosageForm
Class Indication Origin Region Stage
CS-8958 - Inhalant Newranibidase inhibitor InfluenzaDAIICHISANKYO
USEUJP
P1P1P2
DevelopmentCode Number
Generic NameDosageForm
Class Indication Origin Region Stage
levofloxacinhigh-dose
levofloxacin Oral New quinolone Bacterial infectionsDAIICHISANKYO
JP Application
DevelopmentCode Number
Generic NameDosageForm
Class Indication Origin Region Stage
levofloxacin inj levofloxacin Injection New quinolone Bacterial infectionsDAIICHISANKYO
JP P3
CancerDevelopmentCode Number
Generic NameDosageForm
Class Indication Origin Region Stage
CS-1008 - Injection Anti-DR5 antibody -DAIICHISANKYO
US P2
DevelopmentCode Number
Generic NameDosageForm
Class Indication Origin Region Stage
DE-766 nimotuzumab Injection Anti-EGFR antibody -DAIICHISANKYO
JP P2
Immunological allergic diseasesDevelopmentCode Number
Generic NameDosageForm
Class Indication Origin Region Stage
SUN13834 -Oralagent
Chymase inhibitor Atopic DermatitisAsubioPharma
US P2
[Comments]・A glitazone type antidiabetic drug which exhibits strong PPARγactivity.・Summary of Rivoglitazone Ph2 trial HbA1C: Both 2 and 3 mg rivoglitazone showed significantly greater HbA1c placebo-corrected decreases from baseline than pioglitazone 45 mg. TG and HDL-C: Rivoglitazone showed greater TG reductions and HDL-C increases than pioglitazone 45 mg.
[Comments]・CS-8958 is a long-acting neuraminidase inhibitor that is expected to be used as single administration for treatment and once a week for prophylaxis.・Developer: Co-development with Biota in the US and EU, DAIICHI SANKYO in Japan・CS-8958 is under development as an inhalant that will act directly on the pulmonary and tracheal sites of infection.・A new phase 3 trial will be started from this winter.
[Comments]・The drug inhibits bacterial DNA composition by inhibiting a DNA gyrase activity and a topoisomerase Ⅳ activity.・Application: November, 2007・Change of the directions and dosage( 100mg, b.d. or t.d. → 500mg, o.d.)・One of levofloxacin's LCM strategies
[Comments]・A humanized monoclonal antibody against Epidermal Growth Factor Receptor(EGFR).・Expected to be a best in class EGFR antibody, safety against the skin toxicity and the efficacy comparable to the other EGFR antibodies.
[Comments]・Inhibiting chymase, one of endogenous proteases, which is released from mast cells and involves allergic reaction.・Under development in the US by Asubio Pharma.・Expected to be an oral anti-atopic dermatitis drug with a novel mechanism of action.
[Comments]・The drug inhibits bacterial DNA composition by inhibiting a DNA gyrase activity and a topoisomerase Ⅳ activity.・New formulation(injection of levofloxacin)
[Comments]・A humanized version TRA-8, a murine agonistic Mab raised against human death receptor 5(DR5).・DR5 is rarely expressed in normal tissues, expected to show selective activity against tumor cells.・Induces apoptosis of tumor cells expressing DR5 on the cell surface.
16

Bone/Joint diseasesDevelopmentCode Number
Generic NameDosageForm
Class Indication Origin Region Stage
AMG162 Denosumab Injection Anti-RANKL antibodyOsteoporosis
Bone metastases of cancerAmgen JP P3
DevelopmentCode Number
Generic NameDosageForm
Class Indication Origin Region Stage
CS-600G Loxoprofen sodium GelAnti-inflammatory and
analgesic-
DAIICHISANKYO
JP P3
OthersDevelopmentCode Number
Generic NameDosageForm
Class Indication Origin Region Stage
SUN Y7017Memantine
hydrochlorideOral NMDA receptor antagonist Dementia of Alzheimer type Merz JP
P3(Mild tomoderate)
P3(Moderatelysevere to
DevelopmentCode Number
Generic NameDosageForm
Class Indication Origin Region Stage
KMD-3213 Silodosin Oral Selective alpha 1A blockerTreatment of dysuria associated with
benign prostatic hyperplasiaKissei China P3
DevelopmentCode Number
Generic NameDosageForm
Class Indication Origin Region Stage
SUN11031 Human ghrelin Injection -Cachexia
Anorexia NervosaAsubioPharma
USEUJP
P2P2P2
DevelopmentCode Number
Generic NameDosageForm
Class Indication Origin Region Stage
DL-8234 Interferonーβ Injection Interferonーβ Hepatitis C (with Ribavirin ) Toray JP Application
[Comments]・Denosumab is a fully human monoclonal antibody that specifically targets the receptor activator of nuclear factor kappa B ligand (RANKL), a key mediator of theresorptive phase of bone remodeling.・July, 2007 In-licensed from Amgen・Phase3 : Osteoporosis・Phase3 : Bone metastases of cancer(Phase3 multinational trials)
[Comments]・An alpha1A blocker which effectively reduces urinary tract resistance and improves dysuria associated with benign prostatic hyperplasia.・Reduces cardiocvascular side effects due to its alpha1A selectivity.・Silodosin is marketed in Japan as brand name of URIEF by DAIICHI SANKYO and Kissei.・Developer: DAIICHI SANKYO in China
[Comments]・DL-8234 is marketed in Japan as brand name of FERON.・Application: September, 2007・Co-development with Toray・A natural interferon-beta preparation with reduced adverse reactions, such as depression and alopecia, in comparison with interferon-alpha.
[Comments]・Mechanism of action: inhibition of prostaglandin composition/ Point of action: cyclooxygenase・Developer: DAIICHI SANKYO・Loxoprofen gel・New formulation of LOXONIN
[Comments]・Memantine, categorized as an antagonist of the NMDA receptor which is one of the Glutamate receptor subtypes in the central nervous system in mammals,possesses therapeutic action for dementia of Alzheimer type. The drug is expected to demonstrate effectivity in slowing down the progression of the disease by it'sneuroprotective action, which is distinct from cholinesterase inhibitors.・Developer: Asubio pharma・The phase3 trials for moderately severe to severe dementia of Alzheimer type and for mild to moderate dementia of Alzheimer type is on-going in Japan.
[Comments]・Ghrelin is an endogenous peptide known as one-and-only peripheral appetite stimulator among all hormones discovered the relationship with feeding behavior up tonow. In addition to it, ghrelin is a potent stimulator of growth hormone release.・Developer: Asubio pharma in the US, EU and Japan・Phase2 trials ongoing for cachexia in the US and EU, and for anorexia nervosa in Japan.
17

(This page is intentionally left blank)
<Historical Data>
1. Summary of Income Statement (Billions of yen)
<-12.9> <-3.3> <3.0> <-7.3> <-5.3> <-13.5> <-2.7> <-8.4>
Net sales 100.0 235.5 100.0 208.2 100.0 252.1 100.0 184.3 100.0 880.1 100.0 203.7 100.0 202.6 100.0 406.3Cost of sales 24.6 57.9 26.6 55.3 27.2 68.5 28.7 52.8 26.7 234.6 23.9 48.6 24.2 49.0 24.0 97.6
Selling, general and administrative expenses 46.6 109.9 60.9 126.7 47.9 120.7 71.3 131.4 55.5 488.7 56.5 115.1 65.1 132.0 60.8 247.1Research and development expenses 13.9 32.7 21.9 45.5 15.4 38.8 25.2 46.5 18.6 163.5 18.1 36.9 22.4 45.4 20.3 82.3Other expenses 32.7 77.1 39.0 81.2 32.5 82.0 46.1 84.9 37.0 325.2 38.4 78.2 42.7 86.6 40.5 164.7
<11.6> <48.5> <17.2> <-98.8> <15.0> <-41.0> <-17.1> <-34.4>
Operating income 28.8 67.8 12.5 26.1 24.9 62.9 0.0 0.1 17.8 156.8 19.6 40.0 10.7 21.6 15.2 61.6Non-operating income 5.9 2.8 3.5 4.8 17.0 3.6 2.5 6.1Non-operating expenses 2.1 -0.2 1.0 1.9 4.8 2.8 5.3 8.1
<5.6> <42.6> <12.8> <-49.5> <11.2> <-43.0> <-35.3> <-40.8>
Ordinary income 30.4 71.7 14.0 29.0 25.9 65.4 1.6 3.0 19.2 169.1 20.1 40.9 9.3 18.8 14.7 59.6Extraordinary gains 3.9 0.1 0.1 12.0 16.1 0.0 0.8 0.8Extraordinary losses 4.0 2.6 2.3 9.4 18.3 1.3 2.6 3.9
30.4 71.5 12.7 26.5 25.1 63.2 3.1 5.7 19.0 166.9 19.4 39.5 8.4 17.0 13.9 56.6<-13.7> <-0.3> <234.8> <45.0> <24.3> <-39.4> <-52.8> <-43.6>
Net income 17.6 41.4 9.0 18.8 14.3 36.2 0.7 1.2 11.1 97.7 12.3 25.1 4.4 8.9 8.4 34.0
<Performance excluding the effects of changes in fiscal year-end of the U.S./European subsidiaries and non-pharmaceutical business> (Billions of yen)
<2.5> <6.5> <7.7> <3.2> <5.1> <-4.5> <1.4> <-1.7>
Net sales 100.0 213.3 100.0 199.9 100.0 243.1 100.0 177.7 100.0 834.0 100.0 203.7 100.0 202.6 100.0 406.3Cost of sales 22.1 47.2 23.9 47.8 24.9 60.5 26.8 47.6 24.3 203.0 23.9 48.6 24.2 49.0 24.0 97.6
Selling, general and administrative expenses 46.9 100.0 62.8 125.5 49.2 119.6 73.6 130.8 57.1 475.8 56.5 115.1 65.1 132.0 60.8 247.1Research and development expenses 15.1 32.2 22.7 45.3 15.9 38.5 26.1 46.4 19.5 162.4 18.1 36.9 22.4 45.4 20.3 82.3Other expenses 31.8 67.8 40.1 80.2 33.3 81.1 47.5 84.4 37.6 313.5 38.4 78.2 42.7 86.6 40.5 164.7
<34.2> <69.3> <19.8> <-> <29.2> <-39.5> <-18.7> <-33.6>
Operating income 31.0 66.2 13.3 26.6 25.9 63.0 -0.4 -0.7 18.6 155.1 19.6 40.0 10.7 21.6 15.2 61.6Non-operating income 5.6 2.8 3.5 4.8 16.6 3.6 2.5 6.1Non-operating expenses 2.1 -0.2 1.0 1.8 4.7 2.8 5.3 8.1
<27.6> <58.4> <15.4> <-47.7> <24.2> <-41.4> <-36.4> <-39.9>
Ordinary income 32.7 69.7 14.8 29.5 27.0 65.5 1.3 2.3 20.0 167.1 20.1 40.9 9.3 18.8 14.7 59.6Extraordinary gains 2.2 0.1 0.1 5.0 7.4 0.0 0.8 0.8Extraordinary losses 4.0 2.6 2.3 7.9 16.9 1.3 2.6 3.9
31.8 67.9 13.5 27.0 26.1 63.4 -0.4 -0.7 18.9 157.6 19.4 39.5 8.4 17.0 13.9 56.6<23.3> <28.4> <-> <-> <167.7> <-34.2> <-53.6> <-40.7>
Net income 17.9 38.1 9.6 19.2 15.9 38.7 -0.5 -0.9 11.4 95.1 12.3 25.1 4.4 8.9 8.4 34.0
2. Sales of Global Products (Billions of yen)
<3.6> <33.1> <35.8> <22.8> <22.0> <-4.5> <23.7> <8.2>
Olmesartan 53.1 43.6 54.0 44.9 195.6 50.7 53.9 104.6<40.5> <31.4> <29.5> <21.4> <30.7> <12.8> <24.9> <18.6>
Olmetec (JPN) 13.8 12.6 17.6 11.2 55.2 15.6 15.7 31.3<-36.1> <23.0> <22.0> <-2.0> <-5.3> <2.6> <1.8> <2.2>
Benicar / Benicar HCT (US) 22.8 21.7 24.1 19.3 87.9 23.4 22.1 45.5<-> <-> <-> <->
Azor (US) - - 1.9 0.7 2.5 1.4 - -<185.4> <52.4> <45.0> <66.5> <85.6> <-44.3> <40.7> <-16.3>
Olmetec / Olmetec Plus* (EU) 14.9 7.4 8.3 11.2 41.8 8.3 10.3 18.7<196.1> <184.6> <199.0> <180.7> <189.2> <30.4> <72.2> <53.6>
Export / Asian & LA subsidiaries, etc 1.6 1.9 2.1 2.5 8.1 2.0 3.3 5.4<17.9> <-1.6> <-1.0> <3.6> <4.4> <-12.6> <0.5> <-6.8>
Levofloxacin 29.5 23.5 32.1 23.7 108.7 25.8 23.6 49.3<3.5> <7.2> <-8.5> <11.5> <1.4> <-15.5> <-6.0> <-11.2>
Cravit (JPN) 12.1 10.0 15.5 9.8 47.4 10.2 9.4 19.6<41.1> <-20.0> <13.2> <-5.5> <6.8> <-11.3> <19.4> <0.7>
Export, etc 10.8 6.9 9.7 6.6 34.0 9.6 8.3 17.8<8.5> <8.6> <-6.9> <3.0> <2.8> <-12.6> <-13.8> <-13.2>
Royalty 4.7 4.6 4.8 5.4 19.5 4.1 4.0 8.0<39.6> <20.7> <19.6> <2.9> <19.5> <-1.8> <0.9> <-0.5>
Asian subsidiaries 2.0 1.9 2.1 1.9 7.8 1.9 1.9 3.9<-16.2> <-28.6> <-12.3> <-14.1> <-18.3> <-25.8> <-14.9> <-20.8>
Pravastatin 21.7 18.6 21.6 14.5 76.5 16.1 15.9 31.9<-8.4> <-9.6> <-8.7> <-10.3> <-9.1> <-17.1> <-14.8> <-16.0>
Mevalotin (JPN) 16.3 15.4 18.2 11.6 61.6 13.5 13.1 26.6<-72.5> <-83.7> <-54.7> <-68.2> <-73.4> <-39.0> <-33.6> <-36.8>
Export 1.7 1.2 1.4 0.7 5.0 1.0 0.8 1.8<77.9> <-22.8> <-13.3> <1.5> <11.5> <-74.3> <-3.4> <-52.2>
European subsidiaries* 2.8 1.3 1.2 1.3 6.7 0.7 1.2 2.0<270.7> <210.4> <224.0> <212.7> <227.5> <-3.1> <-7.6> <-5.4>
Asian & LA subsidiaries 0.8 0.8 0.8 0.8 3.2 0.8 0.8 1.5* The accounting period of Daiichi Sankyo Europe GmbH (DSE) was 15 months from January 2007 to March 2008, following a change in its fiscal year-end from December to March.
Three months results of Olmetec / Olmetec Plus and Pravastatin from Jan-07 to Mar-07 were ¥6.4 billion (€40 million) and ¥1.6 billion (€10 million), respectively.
Income before income taxes and minority interests
Income before income taxes and minority interests
FY2007
FY20071Q 2Q
1Q 2Q 3Q
1QFull Year
Full Year4Q
1Q4Q Full Year
3Q
2QFY2007
3Q1Q 4Q
FY2008
FY2008
FY2008
2Q 2Q YTD
2Q 2Q YTD1Q
2Q 2Q YTD
Historical Data 1
4. Overseas Sales (Billions of yen)
1Q 2Q 3Q 4Q Full Year 1Q 2Q 2Q YTD<-8.4> <4.4> <14.2> <-4.2> <0.5> <-15.9> <3.6> <-7.3>
Overseas sales 105.5 83.0 92.4 77.8 358.6 88.7 86.1 174.7Overseas sales ratio 44.8% 39.9% 36.6% 42.2% 40.7% 43.5% 42.5% 43.0%
<-30.0> <0.5> <15.0> <-11.9> <-9.1> <3.9> <-2.7> <0.6>
North America 56.1 55.1 62.2 46.5 219.9 58.3 53.6 111.9<41.8> <3.7> <2.0> <7.7> <16.8> <-42.6> <31.8> <-19.5>
Europe* 39.1 17.7 19.4 22.3 98.5 22.4 23.3 45.7<39.2> <33.2> <38.3> <17.0> <31.9> <-22.3> <-10.9> <-16.6>
Asia / Latin America, etc 10.3 10.3 10.7 9.0 40.2 8.0 9.2 17.1
* The accounting period of Daiichi Sankyo Europe GmbH (DSE) was 15 months from January 2007 to March 2008, following a change in its fiscal year-end from December to March. The net sales of DSE for the period from January to March 2007 was ¥14.1 billion.
5. Consolidated Segment information - Operating Segment (Billions of yen)
1Q 2Q 3Q 4Q Full Year 1Q 2Q 2Q YTD<-12.9> <-3.3> <3.0> <-7.3> <-5.3> <-13.5> <-2.7> <-8.4>
Net Sales 235.5 208.2 252.1 184.3 880.1 203.7 202.6 406.3<-8.8> <2.2> <7.0> <3.1> <0.4> <-10.2> <1.7> <-4.6>
Pharmaceuticals 225.8 198.2 241.2 175.6 840.8 202.9 201.6 404.5<-3.9> <4.0> <2.3> <1.8> <0.9> <-8.2> <-0.4> <-4.5>
Domestic 112.5 102.0 135.7 87.0 437.3 103.3 101.6 205.0<-6.5> <8.9> <16.2> <3.2> <4.3> <-14.1> <5.3> <-5.5>
Overseas* 103.2 81.5 89.4 78.3 352.5 88.7 85.8 174.5<-11.5> <8.5> <0.1> <30.6> <4.9> <3.1> <-5.2> <-1.8>
OTC drugs 9.9 14.5 15.2 10.8 50.3 10.2 13.8 24.0<-57.9> <-53.5> <-43.4> <-69.6> <-57.4> <-91.5> <-90.0> <-90.7>
Other 9.7 10.0 10.9 8.7 39.3 0.8 1.0 1.8<11.6> <48.5> <17.2> <-98.8> <15.0> <-41.0> <-17.1> <-34.4>
Operating income 67.8 26.1 62.9 0.1 156.8 40.0 21.6 61.6<15.1> <56.5> <18.4> <-140.5> <18.5> <-42.3> <-18.9> <-35.9>
Pharmaceuticals 68.3 25.8 62.5 -1.1 155.6 39.4 20.9 60.4<-> <-> <-> <-> <-> <-> <-> <->
Other -0.3 -0.1 0.3 1.1 1.0 0.5 0.7 1.2
* The accounting period of Daiichi Sankyo Europe GmbH (DSE) was 15 months from January 2007 to March 2008, following a change in its fiscal year-end from December to March. The operating results of DSE for the period from January to March 2007 was net sales of ¥14.1 billion and operating income of ¥1.8 billion.
6. Consolidated Segment information - Geographic Segment (Billions of yen)
1Q 2Q 3Q 4Q Full Year 1Q 2Q 2Q YTD<-12.9> <-3.3> <3.0> <-7.3> <-5.3> <-13.5> <-2.7> <-8.4>
Net Sales 235.5 208.2 252.1 184.3 880.1 203.7 202.6 406.3<-15.3> <-11.8> <-4.1> <-11.1> <-10.4> <-12.6> <-7.3> <-10.1>
Japan 151.8 143.5 179.7 123.0 598.1 132.7 133.0 265.7<-36.6> <19.1> <24.7> <-11.4> <-7.1> <12.5> <1.4> <6.9>
North America 45.0 44.6 51.1 37.2 178.0 50.7 45.3 95.9<98.3> <18.2> <21.6> <28.2> <46.1> <-53.1> <41.9> <-25.8>
Europe* 32.3 13.0 14.4 18.2 78.0 15.2 18.5 33.6<59.1> <73.8> <52.7> <36.3> <55.0> <-16.9> <-16.3> <-16.6>
Asia / Latin America, etc 6.3 7.0 6.9 5.9 26.1 5.2 5.8 11.1<11.6> <48.5> <17.2> <-98.8> <15.0> <-41.0> <-17.1> <-34.4>
Operating income 67.8 26.1 62.9 0.1 156.8 40.0 21.6 61.6Japan 47.4 21.9 47.3 -9.5 107.1 18.5 8.2 26.7North America 13.2 9.2 12.5 2.6 37.6 16.9 10.9 27.8Europe* 4.4 -1.1 1.4 5.9 10.7 1.2 0.0 1.3Asia / Latin America, etc 0.7 0.5 0.7 0.4 2.5 0.7 0.4 1.1
* The accounting period of Daiichi Sankyo Europe GmbH (DSE) was 15 months from January 2007 to March 2008, following a change in its fiscal year-end from December to March. The operating results of DSE for the period from January to March 2007 was net sales of ¥14.1 billion and operating income of ¥1.8 billion.
FY2007
FY2007
FY2007
FY2008
FY2008
FY2008
Historical Data 2

7. Status of Major Companies
7-1. Daiichi Sankyo Co., Ltd. (Billions of yen)
1Q 2Q 3Q 4Q Full Year 1Q 2Q 2Q YTD<0.1> <5.0> <-0.7> <3.5> <1.6> <-8.8> <-0.9> <-5.0>
Total net sales of ethical pharmaceuticals 110.7 100.3 131.9 84.2 427.1 100.9 99.5 200.4<3.3> <-5.9> <-2.2> <-4.2>
Cardiovascular disease 63.8 58.5 71.8 50.2 244.2 60.0 57.2 117.2<40.5> <31.4> <29.5> <21.4> <30.7> <12.8> <24.9> <18.6>
Olmetec <antihypertensive> 13.8 12.6 17.6 11.2 55.2 15.6 15.7 31.3<17.8> <16.6> <10.2> <23.1> <16.3> <19.4> <26.9> <23.0>
Calblock <antihypertensive> 2.5 2.3 3.0 2.4 10.2 3.0 2.9 6.0<5.2> <16.3> <3.7> <16.5> <9.6> <3.3> <4.9> <4.1>
Artist <antihypertensive> 5.5 5.1 6.0 4.6 21.1 5.7 5.3 11.0<-8.4> <-9.6> <-8.7> <-10.3> <-9.1> <-17.1> <-14.8> <-16.0>
Mevalotin <antihyperlipidemic agent> 16.3 15.4 18.2 11.6 61.6 13.5 13.1 26.6<-4.1> <7.9> <1.8> <1.8> <1.7> <3.9> <3.9> <3.9>
Kremezin <treatment for chronic renal failure> 3.1 3.1 3.5 2.7 12.4 3.2 3.2 6.4<4.2> <13.0> <-1.7> <15.5> <6.4> <-7.8> <-3.2> <-5.8>
Hanp <treatment for acute cardiac failure> 2.6 1.9 2.9 2.4 9.8 2.4 1.8 4.2<5.9> <7.5> <3.0> <10.1> <6.3> <10.0> <13.8> <11.8>
Livalo <antihyperlipidemic agent> 1.4 1.3 1.6 1.2 5.5 1.5 1.5 2.9<-0.6> <10.6> <-2.4> <7.5> <3.0> <-4.2> <-2.9> <-3.6>
Sunrythm <antiarrhythmic agent> 3.2 3.0 3.4 2.5 12.1 3.1 2.9 5.9<-8.1> <2.9> <-5.6> <-4.0> <-4.0> <-0.5> <-0.1> <-0.3>
Fastic <antidiabetic agent> 1.3 1.3 1.5 1.1 5.2 1.3 1.3 2.6<1.7> <-8.3> <4.2> <-2.3>
33.6 30.6 45.9 28.7 138.8 30.8 31.9 62.7<3.5> <7.2> <-8.5> <11.5> <1.4> <-15.5> <-6.0> <-11.2>
Cravit <synthetic antibacterial agent> 12.1 10.0 15.5 9.8 47.4 10.2 9.4 19.6<4.0> <16.2> <9.0> <6.0> <8.7> <2.2> <28.3> <15.2>
Loxonin <anti-inflammatory analgesic> 8.3 8.1 9.8 7.4 33.6 8.4 10.4 18.9<-3.5> <3.1> <-10.6> <-2.8> <-4.0> <-13.1> <-16.7> <-14.8>
Mobic <anti-inflammatory analgesic> 2.8 2.6 2.9 2.0 10.2 2.4 2.1 4.6<36.2> <401.8> <145.4> <168.5> <139.3> <59.7> <45.4> <52.2>
Urief <treatment for dysuria> 1.1 1.2 1.7 1.4 5.4 1.8 1.8 3.5<-8.9> <-13.8> <-18.4> <0.6> <-9.5> <-23.8> <-16.1> <-20.7>
Zyrtec <antiallergic agent> 2.7 1.9 2.7 3.7 10.8 2.0 1.6 3.6<-5.6> <-22.2> <-13.6> <-18.1>
15.8 14.5 17.1 11.7 59.1 12.3 12.5 24.8<-3.0> <-2.4> <-6.3> <12.7> <-1.2> <-11.3> <-5.4> <-8.5>
Omnipaque <contrast agent> 8.2 7.7 9.2 6.0 31.2 7.3 7.3 14.6<15.1> <20.9> <4.0> <18.8> <13.8> <0.7> <2.1> <1.4>
Topotecin <anticancer agent> 1.6 1.5 1.7 1.3 6.2 1.6 1.5 3.1
7-2. Daiichi Sankyo Healthcare Co., Ltd (Billions of yen)
1Q 2Q 3Q 4Q Full Year 1Q 2Q 2Q YTD<-11.5> <8.5> <0.1> <30.6> <4.9> <3.1> <-5.2> <-1.8>
Daiichi Sankyo Healthcare Co., Ltd 9.9 14.5 15.2 10.8 50.3 10.2 13.8 24.0<-11.7> <-8.7> <3.4> <28.9> <-0.5> <8.7> <-2.0> <0.6>
LuLu Series 1.1 3.7 3.7 1.5 10.0 1.2 3.6 4.9<-9.8> <13.0> <-28.9> <64.0> <-3.0> <-15.5> <7.8> <-4.0>
Gaster 10 0.9 0.8 1.0 0.8 3.5 0.7 0.9 1.6<-9.8> <-5.5> <39.1> <45.4> <17.5> <7.9> <31.2> <20.0>
Shin-Sankyo Ichoyaku series 0.6 0.7 1.3 0.8 3.5 0.7 0.9 1.6<60.0> <63.1> <41.1> <63.6> <56.6> <-19.5> <-9.0> <-14.5>
Patecs series 1.0 0.9 0.7 0.5 3.0 0.8 0.8 1.6<-> <-> <-> <-> <-> <-62.0> <-14.5>
Transino - 1.4 0.7 0.5 2.6 0.7 0.5 1.2
Contrast agents / cancer / gastric diseases
Infectious diseases / bone and joint diseases /immunological allergic diseases / urology
FY2008
FY2008FY2007
FY2007
Historical Data 3
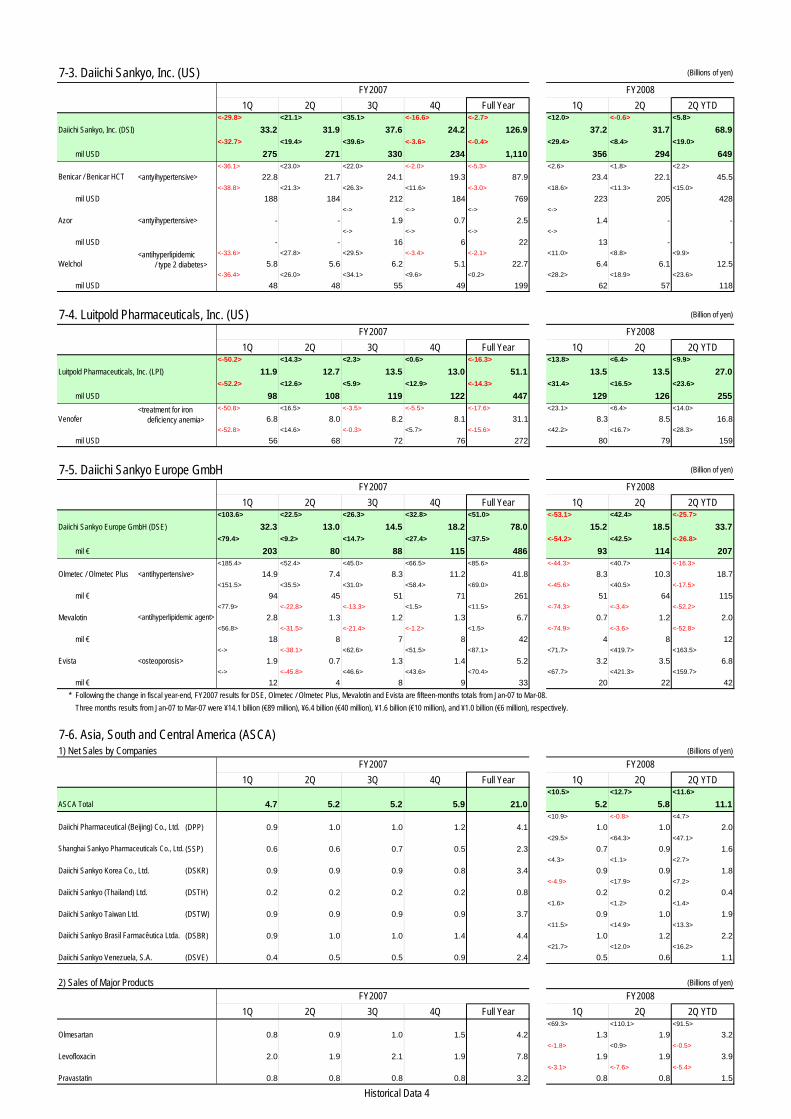
7-3. Daiichi Sankyo, Inc. (US) (Billions of yen)
1Q 2Q 3Q 4Q Full Year 1Q 2Q 2Q YTD<-29.8> <21.1> <35.1> <-16.6> <-2.7> <12.0> <-0.6> <5.8>
Daiichi Sankyo, Inc. (DSI) 33.2 31.9 37.6 24.2 126.9 37.2 31.7 68.9<-32.7> <19.4> <39.6> <-3.6> <-0.4> <29.4> <8.4> <19.0>
mil USD 275 271 330 234 1,110 356 294 649<-36.1> <23.0> <22.0> <-2.0> <-5.3> <2.6> <1.8> <2.2>
<antyihypertensive> 22.8 21.7 24.1 19.3 87.9 23.4 22.1 45.5<-38.8> <21.3> <26.3> <11.6> <-3.0> <18.6> <11.3> <15.0>
mil USD 188 184 212 184 769 223 205 428<-> <-> <-> <->
Azor <antyihypertensive> - - 1.9 0.7 2.5 1.4 - -<-> <-> <-> <->
mil USD - - 16 6 22 13 - -<-33.6> <27.8> <29.5> <-3.4> <-2.1> <11.0> <8.8> <9.9>
Welchol 5.8 5.6 6.2 5.1 22.7 6.4 6.1 12.5<-36.4> <26.0> <34.1> <9.6> <0.2> <28.2> <18.9> <23.6>
mil USD 48 48 55 49 199 62 57 118
7-4. Luitpold Pharmaceuticals, Inc. (US) (Billion of yen)
1Q 2Q 3Q 4Q Full Year 1Q 2Q 2Q YTD<-50.2> <14.3> <2.3> <0.6> <-16.3> <13.8> <6.4> <9.9>
Luitpold Pharmaceuticals, Inc. (LPI) 11.9 12.7 13.5 13.0 51.1 13.5 13.5 27.0<-52.2> <12.6> <5.9> <12.9> <-14.3> <31.4> <16.5> <23.6>
mil USD 98 108 119 122 447 129 126 255<-50.8> <16.5> <-3.5> <-5.5> <-17.6> <23.1> <6.4> <14.0>
Venofer 6.8 8.0 8.2 8.1 31.1 8.3 8.5 16.8<-52.8> <14.6> <-0.3> <5.7> <-15.6> <42.2> <16.7> <28.3>
mil USD 56 68 72 76 272 80 79 159
7-5. Daiichi Sankyo Europe GmbH (Billion of yen)
1Q 2Q 3Q 4Q Full Year 1Q 2Q 2Q YTD<103.6> <22.5> <26.3> <32.8> <51.0> <-53.1> <42.4> <-25.7>
Daiichi Sankyo Europe GmbH (DSE) 32.3 13.0 14.5 18.2 78.0 15.2 18.5 33.7<79.4> <9.2> <14.7> <27.4> <37.5> <-54.2> <42.5> <-26.8>
mil € 203 80 88 115 486 93 114 207<185.4> <52.4> <45.0> <66.5> <85.6> <-44.3> <40.7> <-16.3>
Olmetec / Olmetec Plus <antihypertensive> 14.9 7.4 8.3 11.2 41.8 8.3 10.3 18.7<151.5> <35.5> <31.0> <58.4> <69.0> <-45.6> <40.5> <-17.5>
mil € 94 45 51 71 261 51 64 115<77.9> <-22.8> <-13.3> <1.5> <11.5> <-74.3> <-3.4> <-52.2>
Mevalotin 2.8 1.3 1.2 1.3 6.7 0.7 1.2 2.0<56.8> <-31.5> <-21.4> <-1.2> <1.5> <-74.9> <-3.6> <-52.8>
mil € 18 8 7 8 42 4 8 12<-> <-38.1> <62.6> <51.5> <87.1> <71.7> <419.7> <163.5>
Evista <osteoporosis> 1.9 0.7 1.3 1.4 5.2 3.2 3.5 6.8<-> <-45.8> <46.6> <43.6> <70.4> <67.7> <421.3> <159.7>
mil € 12 4 8 9 33 20 22 42* Following the change in fiscal year-end, FY2007 results for DSE, Olmetec / Olmetec Plus, Mevalotin and Evista are fifteen-months totals from Jan-07 to Mar-08.
Three months results from Jan-07 to Mar-07 were ¥14.1 billion (€89 million), ¥6.4 billion (€40 million), ¥1.6 billion (€10 million), and ¥1.0 billion (€6 million), respectively.
7-6. Asia, South and Central America (ASCA)1) Net Sales by Companies (Billions of yen)
1Q 2Q 3Q 4Q Full Year 1Q 2Q 2Q YTD<10.5> <12.7> <11.6>
ASCA Total 4.7 5.2 5.2 5.9 21.0 5.2 5.8 11.1<10.9> <-0.8> <4.7>
(DPP) 0.9 1.0 1.0 1.2 4.1 1.0 1.0 2.0<29.5> <64.3> <47.1>
(SSP) 0.6 0.6 0.7 0.5 2.3 0.7 0.9 1.6<4.3> <1.1> <2.7>
Daiichi Sankyo Korea Co., Ltd. (DSKR) 0.9 0.9 0.9 0.8 3.4 0.9 0.9 1.8<-4.9> <17.9> <7.2>
Daiichi Sankyo (Thailand) Ltd. (DSTH) 0.2 0.2 0.2 0.2 0.8 0.2 0.2 0.4<1.6> <1.2> <1.4>
Daiichi Sankyo Taiwan Ltd. (DSTW) 0.9 0.9 0.9 0.9 3.7 0.9 1.0 1.9<11.5> <14.9> <13.3>
(DSBR) 0.9 1.0 1.0 1.4 4.4 1.0 1.2 2.2<21.7> <12.0> <16.2>
Daiichi Sankyo Venezuela, S.A. (DSVE) 0.4 0.5 0.5 0.9 2.4 0.5 0.6 1.1
2) Sales of Major Products (Billions of yen)
1Q 2Q 3Q 4Q Full Year 1Q 2Q 2Q YTD<69.3> <110.1> <91.5>
Olmesartan 0.8 0.9 1.0 1.5 4.2 1.3 1.9 3.2<-1.8> <0.9> <-0.5>
Levofloxacin 2.0 1.9 2.1 1.9 7.8 1.9 1.9 3.9<-3.1> <-7.6> <-5.4>
Pravastatin 0.8 0.8 0.8 0.8 3.2 0.8 0.8 1.5
<treatment for iron deficiency anemia>
FY2007
FY2007
FY2007
<antihyperlipidemic agent>
Shanghai Sankyo Pharmaceuticals Co., Ltd.
Daiichi Pharmaceutical (Beijing) Co., Ltd.
Daiichi Sankyo Brasil Farmacêutica Ltda.
FY2007
FY2007
<antihyperlipidemic / type 2 diabetes>
Benicar / Benicar HCT
FY2008
FY2008
FY2008
FY2008
FY2008
Historical Data 4