Embed Size (px)
Citation preview
Running Head: Patient Safety
Patient Safety Concerns as a Result of Nursing Shortage
Trends
U.S. Army - Baylor University Graduate Program in
Healthcare Administration
Captain John W Lee, U.S. Army Medical Service Corps
Brooke Army Medical Center, San Antonio, Texas
20071101296

Shortage of Nursing ii
Acknowledgements
I would like to dedicate this research project to myfamily, which includes my spouse Bittna and daughtersElizabeth and Isabel. They have endured the bulk of thehardship and have supported all of my endeavors with themilitary. Their dedication and support is greatlyappreciated.
I would also like to express my gratitude to MAJ JonHollenbeck for his patience and his support for reviewingthis report. I would also like to thank LTC Glen Yap forhis advice and expertise in this subject matter inaccomplishing this research project. I appreciate thesupport and assistance that COL Shero and COL Ford of BAMChave given.
Shortage of Nursing iii
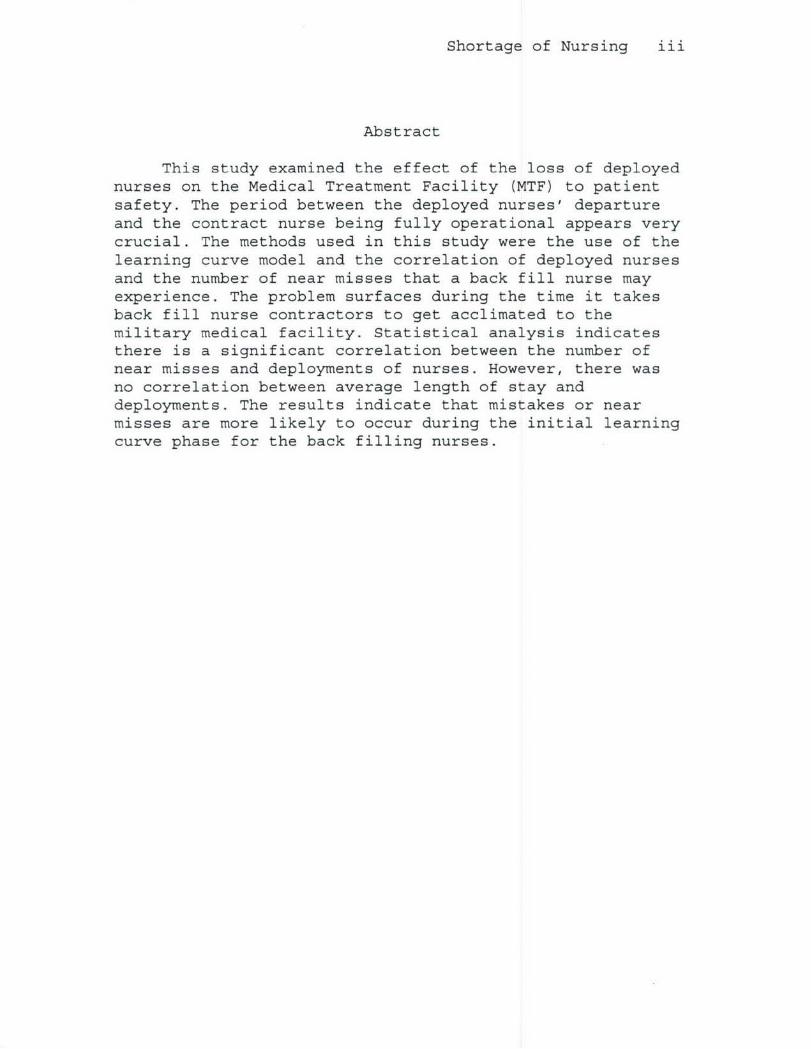
Abstract
This study examined the effect of the loss of deployednurses on the Medical Treatment Facility (MTF) to patientsafety. The period between the deployed nurses' departureand the contract nurse being fully operational appears verycrucial. The methods used in this study were the use of thelearning curve model and the correlation of deployed nursesand the number of near misses that a back fill nurse mayexperience. The problem surfaces during the time it takesback fill nurse contractors to get acclimated to themilitary medical facility. Statistical analysis indicatesthere is a significant correlation between the number ofnear misses and deployments of nurses. However, there wasno correlation between average length of stay anddeployments. The results indicate that mistakes or nearmisses are more likely to occur during the initial learningcurve phase for the back filling nurses.

Shortage of Nursing iv
Table of Contents
Topic Page
List of Tables vList of Figures viIntroduction 1
Conditions that Prompted the Study 5State of the Problem or Question 8Literature Review 9Purpose 22
Method and Procedures 24Research 28Data Source/ Data Collection 39Sample/ Population Size 41Reliability and Validity 41Limitations 42Ethical Concerns 44
Results 45Discussion 50Conclusions and Recommendations 52References 57Appendices 62
Shortage of Nursing v
List of Tables
Table 1 - Descriptive Statistics Near Miss and
Deployment ..................................... 44
Table 2 - Descriptive Statistics for Average Length of Stay
and Deployments .. .............................. 46
Shortage of Nursing vi
List of Figures
Figure 1 - California Nurse to Patient Ratio ............ 13
Figure 2 - The Learning Curve Model of Healthcare ...... 28
Figure 3 - Factors, Process, and Measures Leading to
Outcomes ....................................... 30
Figure 4 - Reliability and Validity Demonstration ....... 41
Figure 5 - Year 2002-2003 Near Miss and Deployment
Correlation Graph ............................ 44
Figure 6- SPSS Output of the Near Miss Versus Deployment
Numbers Showing Direction and Magnitude ...... 46
Figure 7- Times Series Graph Average Length of Stay Versus
Deployments .................................. 47
Figure 8 - Average Length of Stay ........................ 48
Shortage of Nursing 1
Introduction
Cultural, regulatory, economic, and environmental
changes in healthcare, along with the corresponding
societal impacts of these changes have contributed to the
increasing shortage of registered nurses. The future
outlook for our health systems' nurse staffing models will
be in great jeopardy, especially for long-term care and
hospice care. As baby boomers enter into retirement age,
the increase in healthcare demand from the retired
population will place great strain on our healthcare
system, to the extent that it will surpass what our nursing
labor force can handle. As a result, this will cause
dramatic changes in healthcare systems business models in
the near future, particularly in long-term care and hospice
care.
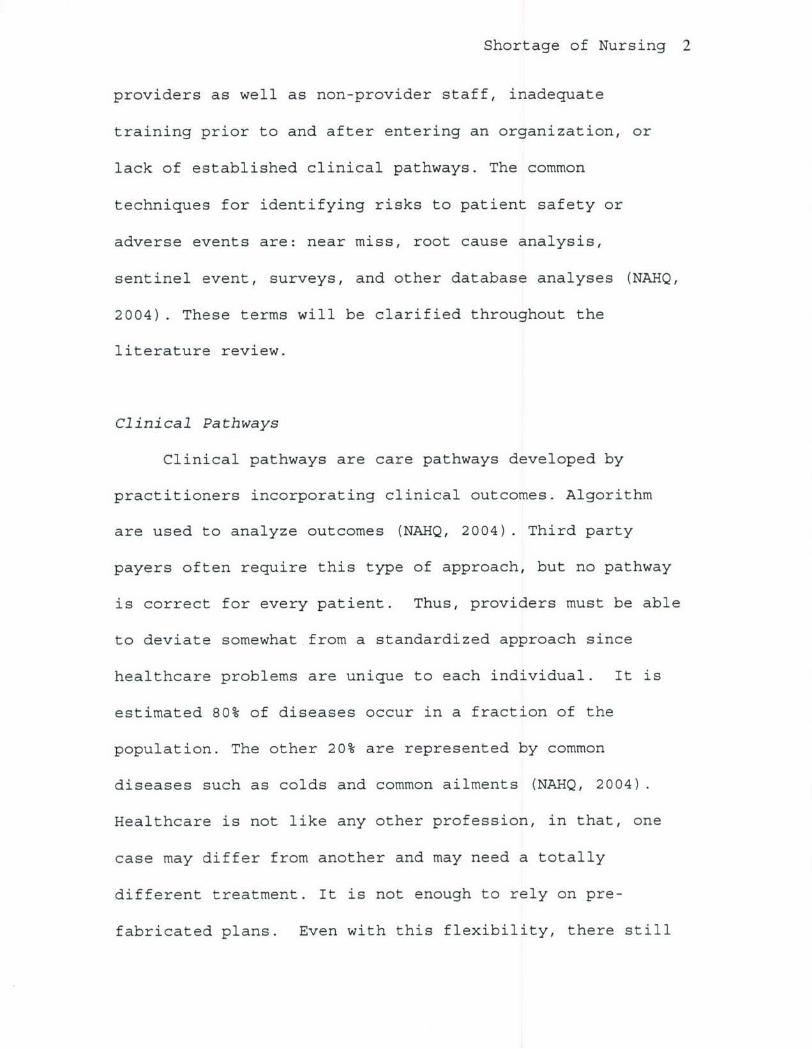
The nursing shortage will continue to impact patient
safety. Patient safety is defined as a patient being free
from accidental injury when interacting in any way with a
healthcare system (National Association for Healthcare
Quality [NAHQ], 2004). The conventional view of patient
safety attributes adverse events to human error (NAHQ,
2004). The cause of many adverse events appears to be a
result of system factors such as dysfunctional
organizational structures, faulty communication among
Shortage of Nursing 2
providers as well as non-provider staff, inadequate
training prior to and after entering an organization, or
lack of established clinical pathways. The common
techniques for identifying risks to patient safety or
adverse events are: near miss, root cause analysis,
sentinel event, surveys, and other database analyses (NAHQ,
2004). These terms will be clarified throughout the
literature review.
Clinical Pathways
Clinical pathways are care pathways developed by
practitioners incorporating clinical outcomes. Algorithm
are used to analyze outcomes (NAHQ, 2004). Third party
payers often require this type of approach, but no pathway
is correct for every patient. Thus, providers must be able
to deviate somewhat from a standardized approach since
healthcare problems are unique to each individual. It is
estimated 80% of diseases occur in a fraction of the
population. The other 20% are represented by common
diseases such as colds and common ailments (NAHQ, 2004).
Healthcare is not like any other profession, in that, one
case may differ from another and may need a totally
different treatment. It is not enough to rely on pre-
fabricated plans. Even with this flexibility, there still
Shortage of Nursing 3
must be a common base of knowledge, which the providers
should utilize for initial diagnosis. Algorithms are the
most effective method for a standard approach to diagnoses
and planning treatment.
Sentinel events are adverse events, resulting from
errors in mechanics or judgment. The outcomes may vary in
their degree of harm caused (i.e. morbidity, loss of limb,
or further complication beyond the original problem).
Errors in mechanics or judgment without adverse events are
referred to as near misses (IOM, 2004).
Adverse Events
Adverse events are incidents that may occur from
therapeutic misadventures, iatrogenic injuries or other
adverse occurrences that are associated with healthcare
services. Adverse events mainly arise from violation or
omission of systematic procedures in healthcare (NAHQ,
2004). Examples include medication errors, performing the
wrong medical procedure on the wrong patient, mis-
diagnosis, suicides, and other patient safety issues (NAHQ,
2004).
Shortage of Nursing 4
Near Misses
Near misses are events or situation that could have
resulted in injury from a number of events such as
procedural errors (wrong patient, wrong body parts) or
mechanical errors (wrong doses, wrong medication). Near
misses are events that potentially could have harmed the
patient but by chance or by timely intervention were caught
before the event occurred (NAHQ, 2004). Near misses should
receive the same level of scrutiny as if they were a
sentinel event.
Root Cause Analysis
Root cause analysis (RCA) is a step by step process
that concentrates on finding the cause of the problem from
a systems point of view. RCA's main objective is to
determine what happened, why it happened, and what can be
done to improve the system so that it does not happen again
(Blendon, et al., 2002).
Currently, nurses in many of work settings suffer from
over-work and many feel overwhelmed with the amount of
responsibilities. Under these circumstances, many nurses
experience "burn-out" before the age of 35 (Buerhaus,
Staiger, & Auerbach, 2000). Having fewer nurses doing more
work may have an adverse effect on patient safety. Imagine
Shortage of Nursing 5
the overall impact on patient safety, when the ratio of
patients to providers increases past an optimal level. One
cause is the growing number of nurses reaching retirement
age, who are a part of the baby boomer generation based on
previous remarks from Dr Buerhaus. Additionally, as the
overall retiree population grows, the demand for healthcare
resources grows. Furthermore, healthcare organizations may
experience a decreased standard of care rendered by reduced
nursing staff in times of shortage.
Military deployments have steadily increased over the
past few years as the United States has responded to the
Global War on Terrorism (GWOT). Operation Iraqi Freedom
(OIF) is starting to exhaust the military healthcare
system's resources, both financially and through the
healthcare needs of those wounded in action. As the war
continues, the military healthcare system will be in a
continual struggle to maintain the proper balance of
military registered nurses and their civilian contractor
counterparts.
Conditions that Prompted the Study
The current nursing shortage trend suggests that there
may be an increased concern for patient safety in the
future. According to NAHQ (2004), the results of one
Shortage of Nursing 6
million patients who were surveyed by the United States
Department of Health and Human Services (DHHS), indicated
that ensuring optimal nurse staffing was the most salient
factor in preventing medical complications and decreasing
risk to patients (NAHQ, 2004). The NAHQ (2004) determined
that, among medical patients, having optimal nurse staffing
mitigated the risk for longer length of stay in a hospital
by three to twelve percent. The American Healthcare
Association Special Workforce Survey in 2001 confirmed that
the shortage in nurse staffing negatively affected the
quality of care and patient satisfaction associated with
the treatment of illnesses such as urinary tract infection,
pneumonia, and upper gastrointestinal bleeding (NAHQ,
2004). A survey reported in the New England Journal of
Medicine (2002) found that 53% of physicians and 65% of the
public cited the shortage of nurses as the leading cause of
errors associated with the practice of medicine (Blendon,
et al., 2002).
In the military, the shortage of nurses is affecting
the Military Health System's (MHS) ability to adequately
support the Global War on Terrorism (GWOT) and Operation
Iraqi Freedom (OIF). GWOT and OIF have created a great need
for nurses in the desert, and are ongoing operations that
will extend beyond the time originally projected. The GWOT
Shortage of Nursing 7
may require troops for long periods of time in the country
in order to stabilize it. One concern is that the GWOT and
OIF require military trained nurses to staff Combat Support
Hospitals (CSH). This requirement has increased the demand
for backfilling deployed nurses in the Medical Treatment
Facilities (MTF) in the Continental United States (CONUS).
At Great Plains Regional Medical Command (GPRMC), many
nurses are deployed to support OIF. Due to a shortage in
the total number of nurses system-wide, including the
civilian population, reservists cannot support all the
backfill mission requirements. Reservists have
traditionally supported the requirements for an MTF during
times of great demand. However, in the GWOT, reservists are
now being deployed. Therefore, GPRMC has resorted to
contracting civilian nurses to fill positions once occupied
reservists.
A major problem has been identified as a result of
utilizing civilian contractors as replacements for the
deployed military nurses. There has been an increase in the
time needed to orient new personnel. This study will
explore the possibility that errors in patient care, which
may effect patient safety, may increase as a result of the
shortage of military nurses due to deployments in support
of the GWOT and OIF.
Shortage of Nursing 8
Statement of the Problem or Question
This study seeks to determine if there are significant
safety problems associated with nursing shortages which are
either directly or indirectly linked to the GWOT. Such a
study will help to identify critical mechanisms needed to
rectify or mitigate risks to Department of Defense (DoD)
personnel and their families. Specifically, does the
nursing shortage due to deployments in support of the GWOT
and OIF greatly impact the care for military beneficiaries?
Does the nursing shortage effect patient care negatively
and place the patient at risk of harm due to an increase in
errors?
It is predicted that there will be a functional
relationship between the dependent variables, Near Misses
(X1), Average Length of Stay (X2), and the independent
variable Deployment (Y). These events are measured to
determine if the variables resulted in substantial injury
to the patient as a result of errors either due to problems
with the system in place or of human origins. The errors
may also include iatrogenic injuries. These near misses
that increase hospital morbidity rates as well as increase
the average length of stay. The relationship of the
Shortage of Nursing 9
independent variable on the dependent variable is
represented through the functional form, Y=f (X,X 2).
Literature Review
Since 1998, experts in the nursing field, such as the
American Nursing Association, suggested that the shortage
in nursing personnel is of epidemic proportions (Murray,
2002). The NAHQ reported on a 2001 American Hospital
Association national survey that there were an estimated
168,000 healthcare position vacancies across the nation,
with eleven percent being nursing positions (NAHQ, 2004).
The President of the Saskatchewan Regional Health Nursing
Association (SRNA), stated, "... we do not have enough RNs
in our system now. Unless we do something soon, the
situation will become critical" (Nursing Shortage Bites,
1999, p. 34). Adequate staffing is so essential to
healthcare facilities that the Joint Commission for
Accreditation of Healthcare Organization (JCAHO) suggested
that staffing is one of the most important issues facing
healthcare executives (NAHQ, 2004). Moreover, JCAHO
reported that a study conducted on patient outcomes
associated with adequate nurse staffing levels indicated a
lowering of mortality rates, nosocomical infections, and
other health related indicators (Insitute of Medicine
Shortage of Nursing 10
[IOM], 2004). JCAHO also suggested that insufficient
staffing not only adversely impacted health care quality,
it also compromised the safety of the nurses themselves
(IOM, 2004).
Some of the factors that have contributed to the
downward trend in the supply of nurses included overwork
(IOM, 2004), changes in healthcare delivery, a decrease in
nursing school enrollment, and an increase in opportunities
for other employment for women in general. Other factors
include both social and economic trends, such as equality
in pay and availability of careers that were once perceived
as male dominated, and the aging nurse workforce. In the
Journal of Nursing Administration, Marylin Murray, noted
that in the year 2000, there was a significant reduction in
the number of nurses that were licensed in the United
States (Murray, 2002). Likewise, there was only a 5.4%
increase in nurses that graduated in the same year; the
lowest rate in the history of nursing in the United States
(Murray, 2002). Beginning in 1996, the number of enrollees
in nursing schools has continued to decrease each year
(Levine, 2001). There is also a decreasing trend in
candidates' enrollment for bachelor's degree in nursing
falling from 5.5% in 1998 to 4.6% in 1999, and to 2.1% in
2000 (Murray, 2002).
Shortage of Nursing 11
A Nurseweek article by the U.S. Department of Health
and Human Services cited that the average age of nurses in
2000 was 45.2 years ("The Registered Nurse Population",
2000). This indicates nursing as an occupation is not
being sought out by the younger generation. This aging
workforce will begin to retire within the next 10 years.
This will leave a significant shortage in the overall
number of nurses working in the field. Furthermore, the
Bureau of Labor Statistics estimated that the need for
registered nurses is expected to reach more than one
million by the year 2010 (Office of Congressional &
Legislative Affairs, 2003). Underscoring this problem is a
recent survey conducted by healthcare executives. The
survey results revealed that one of the most frequently
identified problems in the healthcare industry is the aging
registered nurse workforce (Buerhaus, et al., 2000).
Nurse "burn-out" is another factor that contributes to
the shortage in nursing. Over-scheduling and overtime have
historically placed great strain on nurses. This has
contributed to the decrease in the number of nurses in the
workforce because these burned-out nurses left professional
practice before their retirement age was reached. A recent
survey conducted by the American Nurses Association asked
what the major causes of stress were for nurses. The

Shortage of Nursing 12
results indicated verbal abuse by providers was a
significant factor in increased stress levels (Buback,
2004). Similarly, a 1999 survey indicated that about 94% of
nurses, experienced some sort of verbal abuse in the
workplace (Buback, 2004). High turnover rates, negative
effects on patient care, and a decrease in job satisfaction
and motivation were some of the outcomes reported as a
result of verbal abuse toward nurses (Buback, 2004).
Another contributing factor in nurse "burn-out" is workload
amount. The number hours worked has steadily increased over
the years. Andrew McVicar (2003) suggested that work
overload due to lack of staff has greatly contributed to an
increase in stress levels for nurses. A shortage of nurses,
which leads to inadequate scheduling, is the cause of the
on-going problem with workload. There is a constant
struggle for administrators to maintain an adequate level
of patient care, supported by a high nurse to patient ratio
based on the level of care required. Suzanne Beyea (2004),
indicated that twelve hour shifts are becoming commonplace
in today's healthcare environment for nurses. She also
revealed that full-time nurses work an average of 42.2
hours a week based on 39.3 hours scheduled hours (Beyea,
2004). She also suggested that those working on the night
shift have greater difficulty staying alert contributing to
Shortage of Nursing 13
systems errors (Beyea, 2004). An analysis conducted at
three teaching hospitals suggests that fatigue and
excessive workload may lead to medical errors (Beyea,
2004). As a consequence of over work and fatigue many
nurses suffer high stress. One in three nurses plan to
leave his or her job due to high stress levels and
dissatisfaction with scheduling (Murray, 2002).
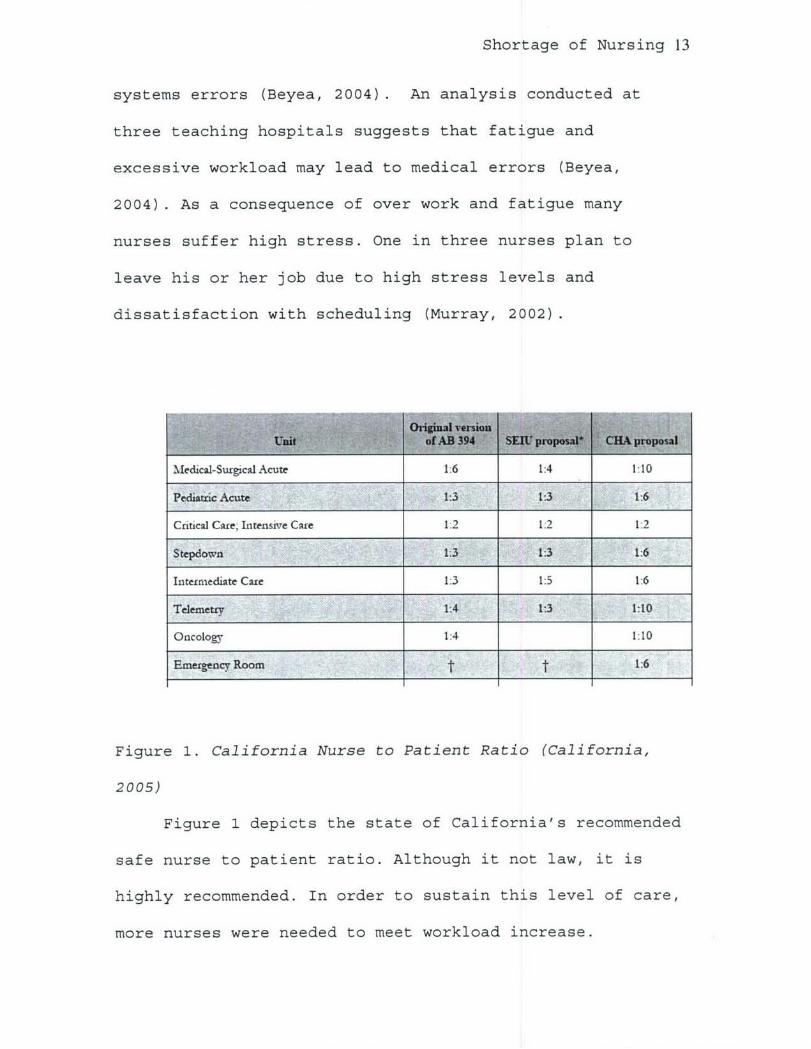
Medical-Surgical Acute 1:6 1:4 1: 10
Critical Cafe; Intensive Care 2 1:2 h2
Stepdown 1:3 . 1:3 1:6
Intermedizte Caue 1:3 1:5 1:6
Telemetr 1:4 1:3 1:10
Oncology 1:4 1:10Emergency Room 1:6
Figure 1. California Nurse to Patient Ratio (California,
2005)
Figure 1 depicts the state of California's recommended
safe nurse to patient ratio. Although it not law, it is
highly recommended. In order to sustain this level of care,
more nurses were needed to meet workload increase.
Shortage of Nursing 14
Nurses have multiple assignments and duties ranging
from providing direct patient care to duties associated
with administration of the ward. Not only do nurses
document all patient care, they also must have a working
knowledge of the various systems that provide proper
documentation for all of the patient's requirements. Today,
an increase in the use of new medical technology has led to
an increase in the amount of care required by patients
while they are in the hospital. New medical technologies
allow many seriously ill patients to receive outpatient
care instead of the traditional inpatient surgical care
that was provided in the past. These technological
innovations have greatly altered the practice of nursing
thereby requiring nurses to be more technologically
skilled. It is estimated that by 2020 seventy percent of
all nurses will be required to have a minimum of a
baccalaureate degree, mostly due to the increased
complexity of the nurse's role (Purnell, Gonzales, &
Westman, 2001).
Some nurses have the task of staffing and supervisory
roles, which may include becoming liaisons to the higher
executive levels of administration. Nurses also must
maintain a certain number of hours of direct patient care
in order to maintain their certification. These extra
Shortage of Nursing 15
duties compound fatigue. In turn, fatigue increases the
likelihood of mistakes being made in medication
administration as well as procedural errors in handling
patients, such as chart documentation and attention to
detail during assessment of patients. A study in the
Journal of Health Affairs (2004), indicated that nurses
working twelve hour shifts or unplanned overtime are likely
to cause three times more errors, such as medication errors
and improper assessment, than those working normal shifts
(Daily health policy, 2004). The most common types of
errors that were preventable according to the Institute of
Medicine (IOM) report were technical errors (44%),
diagnosis (17%), failure to prevent injury (12%), and
medications errors (10%) (IOM, 2000).
Another problem associated with fatigue is
communication lapses. In an analysis conducted by IOM, it
found that nurses had intercepted 87 percent of 334
medications errors created by a physician (IOM, 2004).
Fatigue would significantly reduce a nurse's ability to
detect medication errors. In the IOM report, "Keeping
Patients Safe", it recommended that licensed nurses serve
as the integrator or coordinator of patient care (IOM,
2004). This coordinated care provided by the nurses
includes: implementing physician treatment orders and

Shortage of Nursing 16
explaining it to the patients, planning for patients'
discharge from healthcare facilities, to enable continued
care in their primary residence and educating the patient
and family about the patient's disease, course of therapy,
medications, self-care activities (IOM, 2004). Nursing
fatigue will severely hamper their ability to carry out
these vital functions.
Military
In the Army Medical Department (AMEDD), 40% of the
active duty component is primarily focused on the delivery
of peacetime medicine in the Army's MTF (Center for Defense
Information [CDI], 2002). The military component is relying
heavily on the reserve component to provide the back up for
deployed nurses. Over the last 30 years, the U.S. Military
has been involved in over 85 deployments or engagements
including support for humanitarian relief efforts (CDI,
2002). The effects of nursing shortages are primarily due
to major deployments in support of GWOT and OIF missions.
The Air Force, Army, and Navy are struggling to maintain
the required number of military nurses to support the
military missions (Mientka, 2001). The MTF is very similar
to its civilian counterpart with the major exception that
it must provide continual support for its military

Shortage of Nursing 17
beneficiaries as well as supporting its wartime mission
both at home and abroad. Military nurses are trained for
deployment. One good example is the Forward Surgical Team
(FST). FST's were designed to provide urgent surgical
intervention in the field environment. They are capable of
performing up to 24 operations per day. They also provide
postoperative care for patients up to 72 hours. The FST's
mission is to maintain resuscitative surgical intervention
as far forward on the battle field as possible. Nurses are
trained to provide support in Combat Support Hospitals
(CSH). CSHs are also organized to provide surgical
intervention, patient hold capability, and function as a
routine ambulatory care service center. A CSH is a
modular-designed facility, which consists of a Hospital
Unit Base (HUB) and a Hospital Unit Surgical (HUS). The CSH
has eight wards providing intensive nursing care for up to
96 patients, seven wards providing intermediate nursing
care for up to 140 patients and one ward providing
neuropsychiatric (NP) care for up to 20 patients. Surgical
capacity is based on eight operating room tables that
provide for a surgical capacity of 144 operating room (OR)
table hours per day. The unit can be further augmented
with specialty surgical/medical teams to increase its
capabilities (CDI, 2002).

Shortage of Nursing 18
As indicated previously, communication and systematic
process are vital in mitigating patient risk. After the
tragic events of "911", the U.S. military has been called
to go to war against terrorism. Many military nurses and
providers have been deployed to support the GWOT and OIF in
FSTs and CSHs.
Global War on Terrorism & Operation Iraq Freedom
The GWOT and OIF are related in that OIF is a result
of the GWOT. Since the attack on the World Trade Center,
the military has struggled in a constant battle with the Al
Qaeda network to rid the world of terrorism. The war has
cost the government upwards of 65 billion dollars (US) in
the year 2004 (Government Accountability Office [GAO],
2004). The GWOT's impact on healthcare is tremendous, as
the government recently approved a supplemental
appropriation of 35 billion dollars (US) in 2005, a portion
of which is earmarked for MTFs. The military, in the past,
has used GWOT funds to hire civilian contract workers and
fill vacancies left by deploying nurses. In one MTF,
Brooke Army Medical Center (BAMC), over $10 million dollars
was spent on contractor backfill for deployed nurses in
year 2005. That number represented about 4% of BAMC's
total budget and half of the budget for nursing contracts.
Shortage of Nursing 19
The GWOT and OIF have consistently tested the MTF's
ability to support the war by requiring them to deploy
necessary medical personnel, which includes both LPNs and
RNs, for medical support in Iraq. In Great Plains Regional
Medical Command (GPRMC), there are a number of deployed
nurses who have been backfilled by contractors. The
departed soldiers leave a void in terms of continuity of
care, which is mainly left for the civilian contractors to
fill. The combination of weak standardization and lack of
face-to-face interactions regarding continuity of care
between the deploying nurse and the contractor is a gap in
the current military system. Medical facilities must
overcome this to mitigate some of the patient risks that
are indicated by the learning curve model.
This study will investigate the learning curve for
civilian nurses backfilling for deployed nurses, using both
the measures of near miss data and the average length of
stay (ALOS) data. In simplifying the model, the study will
look at the impact on patient safety caused by contractors
replacing deployed nurses.
Average Length of Stay
ALOS is one of the main performance indicators for
healthcare facilities. It is no different in the military
Shortage of Nursing 20
system (Thomas, Guire, and Horvat, 1997). The ALOS is
considered one of the key indicators of the efficiency of
the medical treatment facility (Yap, 2004). Griffith (2002)
determined that the validity, reliability, and sensitivity
of ALOS was positively correlated with mortality rates for
the MTF. Yap (2004) researched outcomes in the military
healthcare facility using data such as mortality rates to
determine efficiency. He concluded, using the discharge
data from hospitals, that lower levels of registered nurse
staffing was associated with increase in average length of
stay, after adjusting for case mix. In certain areas such
as the Intensive Care Unit, a higher nurse to patient ratio
is needed than on a floor unit. This would require a
determination of the proper nursing hours mix among the
different skill levels of nursing.
In the military, there are many barriers to efficiency
associated with a system that replaces a military nurse
with a civilian contractor. A military nurse may have more
exposure to care of illness and injuries more prevalent in
the military system. These differences from civilian and
MTF represent a learning curve for the replacement
personnel. Nurses have to learn not only the standard
practices for a military facility, but they must also learn
Shortage of Nursing 21
all the nuances associated with delivering care to active
duty military and their dependents.
In most MTFs, there are Stand Operating Practices
(SOPs) in place. However, as similar as they may be to
other facilities, the SOPs differ slightly with each
facility. Specific local needs create differences in SOPs
for institutions. Especially in regards to "Space
Available" care, where each MTF commander will dictate how
many resources are available to facilitate this additional
care. A nurse may be required to transfer a patient
elsewhere depending on category and status of the patient.
There are also procedural differences with each MTF, such
is the case in most surgery, as surgical providers perform
the surgery with their uniqueness and unique preference of
equipment required. Nurses working for these surgeons
usually implement SOPs that cater to their style and
preferences, which would require a learning curve for
newcomers. Most military nurses have acquired procedural
skills after entering the MTF. These established procedures
are not necessarily transferred to those individuals
backfilling their positions. Contracted civilian nurses
must cope with the challenges associated with a steep
learning curve, while adjusting to their new environment.
Shortage of Nursing 22
The military healthcare environment is fast paced and
continuous.
The learning curve model suggests that errors can be
caused by new employees entering the work environment. The
learning curve model is a mathematical time series model
that estimates the duration of learning required in a new
environment (Luebbe & Finch, 1990). The learning curve
model quantifies errors made by new staff members during
initial entry into their work environment. The IOM (2004)
reported that high turnover rates in staffing, especially
in nursing, had adverse consequences in regards to patient
safety. The IOM hypothesized high turnover rates are
linked to reduced quality in healthcare provision (IOM,
2004).
Purpose
The purpose of this research is to examine the impact
of current and projected nursing shortages on the MTF.
Specifically, how does deployment, resulting in active duty
nursing shortage in MTFs impact patient safety? The
hypothesis of this study are: (1) As deployment of active
duty nurses increases, near misses increases; (2) As
deployment of active duty nurses increases, ALOS increases.
Major deployments include those in the period from 2000 to
Shortage of Nursing 23
2004 leading up to OIF and GWOT. The null hypothesis is
that there will be no significant changes in the number of
near misses or errors reported during a period of increased
deployment and the increased learning curve. Through this
study, the following questions are to be addressed:
1. Does the shortage of nurses impact patient safety?
2. How much of an impact does deployment have on
patient safety in Military Treatment Facilities?
3. What are the implications associated with the
findings from this study on educational strategies
to communicate the SOP for incoming civilian nurse
contractors backfilling for deployed nurses?
4. What is the nature of the observed relationship
between patient safety and nurse shortages? What
impact does the nursing shortage have on military
readiness and the military's ability to provide
quality care with the civilian contractors?
Shortage of Nursing 24
Method and Procedures
There are two models being used to test the
hypotheses. The first is a time series model called the
learning curve model. It involves observing the number of
near misses and errors reported by the treatment facility
as new staff come in to the MTF. In this model, spikes or
trends are associated with near misses or errors during
certain periods during the learning phase would provide
support for the hypothesis.
The second model, depicted in Appendix A, is a
correlation matrix model. SPSS® software was used to
analyze data for determining correlation between near miss
data with deployment of nurses. Also, the average length of
stay for inpatient bed days was analyzed to determine if
there was a correlation with the deployment of nurses.
SPSS® software is used for conducting statistical analyses,
manipulating data, and generating tables and graphs that
summarize data. Statistical analyses range from basic
descriptive statistics, such as averages and frequencies,
to advanced inferential statistics, such as regression
models, analysis of variance, and factor analysis (SPPS,
2005).
Shortage of Nursing 25
Correlation Matrix Model
Two models are used to show significance between the
independent and dependent variables. The first model, the
correlation matrix model, uses a graph to depict the spikes
in the number of near misses being reported in order to
illustrate the relationship between deployment and near
misses.
The other model seeks to link patient safety issues
with a nursing shortage caused by deployment of the
military nurses by using a time series model, the Learning
Curve model.
For the correlation model, the units of analysis are
as follows: the dependent variable (Y) is the number of
near misses and also the average length of stay data, the
independent variable (X) is the number of deployed nurses,
measured in FTEs, in support of OIF and OEF. Correlation is
used to determine the relationships between two or more
variables. The actual study on aggregate number of near
misses in GPRMC will be compared to the four year period
starting from September 11, 2001. The year 2000 serves as
the control group (prior to significant deployment)and the
years following 2000 represent the variable of interest.
The control group is the benchmark, wherein adequate nurse
to patient ratio will be used in contrast to the case group
Shortage of Nursing 26
which is where an inadequate nurse to patient ratio exists.
The inadequate nurse to patient ratio exists primarily due
to lag in hiring actions from the shortage of nurses in the
medical facility as mentioned by Deputy Commander for
Nurses at BAMC.
Learning Curve Model
The learning curve model is based on numerous empirical
studies, demonstrating that as the number of units produced
in a repetitive process doubles, the cost to produce the
doubled quantity declines by some constant percentage
(Luebbe & Finch, 1990). This technique, estimates the
reduction in cost resulting from labor and other
efficiencies (e.g., enhanced skill sets via knowledge and
experience) as the result of the repetition of a process.
The repetitive process can involve hands-on labor or mental
exercises and can range from simple to complex. The
learning curve has traditionally been used to estimate the
cost to manufacture items, but it can also be used to
estimate installation costs or the costs of any other
repetitive process (Luebbe & Finch, 1990) . The learning
curve model is a time series model in which the number of
near misses and the average length of stay data will be
Shortage of Nursing 27
examined separately as the dependent variable (Y) and the
number of deployed nurses FTE's per month will be the
independent variable (X). The learning curve, which
originated from observations made in manufacturing, was
based on relationships in quantitative aspects (Luebbe &
Finch, 1990). The quantitative aspects are measured
through time series. This represents observation of a
relationship between changes in data and certain other
events. These observations are made during specific points
in time. Simply put, the more a system produces a product,
the lower its cost and errors since it can pinpoint the
problematic areas and adjust accordingly. In healthcare
systems, minimizing errors is extremely important because
of the grave implications of a mistake. In healthcare, as
more procedures are performed, more identifiable patterns
emerge and more error improvement is possible. Since
healthcare is unique, providers have varying degrees of
knowledge and experience. Therefore, healthcare does not
lend itself to assembly line solutions; the basic
principles of triage and diagnosis may be similar in
nature.

Shortage of Nursing 28
Research
Design limitations include confounding factors
associated with the learning curve. For providers have
variable levels of knowledge. Not all healthcare workers
have equal diagnostic skill sets. The broader the scope of
previous experience, the more quickly the nurses will
advance in their learning curve. The high turn-over ratio
creates a knowledge gap in the system. When experienced
workers depart from an organization, managers and
supervisors are also affected, since the focus shifts to
teaching and mentoring the new members of the staff (Luebbe
& Finch, 1990).

Shortage of Nursing 29
Factors:Managerial Factors
Staff TurnoverExperience
Knowledge Base
Intttoa roup ) IndividualLerigLann Learning
Outcomes/ Measures:Average Length of StayNear Misses
Sentinel Events
Figure 2. The Learning Curve Model of healthcare.
Constraints in healthcare also affect the learning
process. Constraints in healthcare include but are not
limited to various providers' beliefs, the principles of
the healthcare provider, and values held by either
individuals or the organization itself (Dragoo, 1998). Most
of these constraints evolve from various ethical beliefs,
principles, and values. Some healthcare workers may feel
Shortage of Nursing 30
that an algorithm guideline may impair learning or restrict
the nurse's ability to detect the true problems associated
with an individual patient (Dragoo, 1998). The provider's
limited level of knowledge and experience may hinder the
learning process as well. As they gain greater exposure to
certain diseases, a knowledge base for the healthcare
worker increases.
Shortage of Nursing 31
FactorsNurse Shortage
Over Worked
MiscommunicationMeasur
Deployment
Staffing Levels Near Misses
Average Length ofClinical Pathways Ssan
High Turn-Over.RateEducation
Backglround
Experience
Judgment
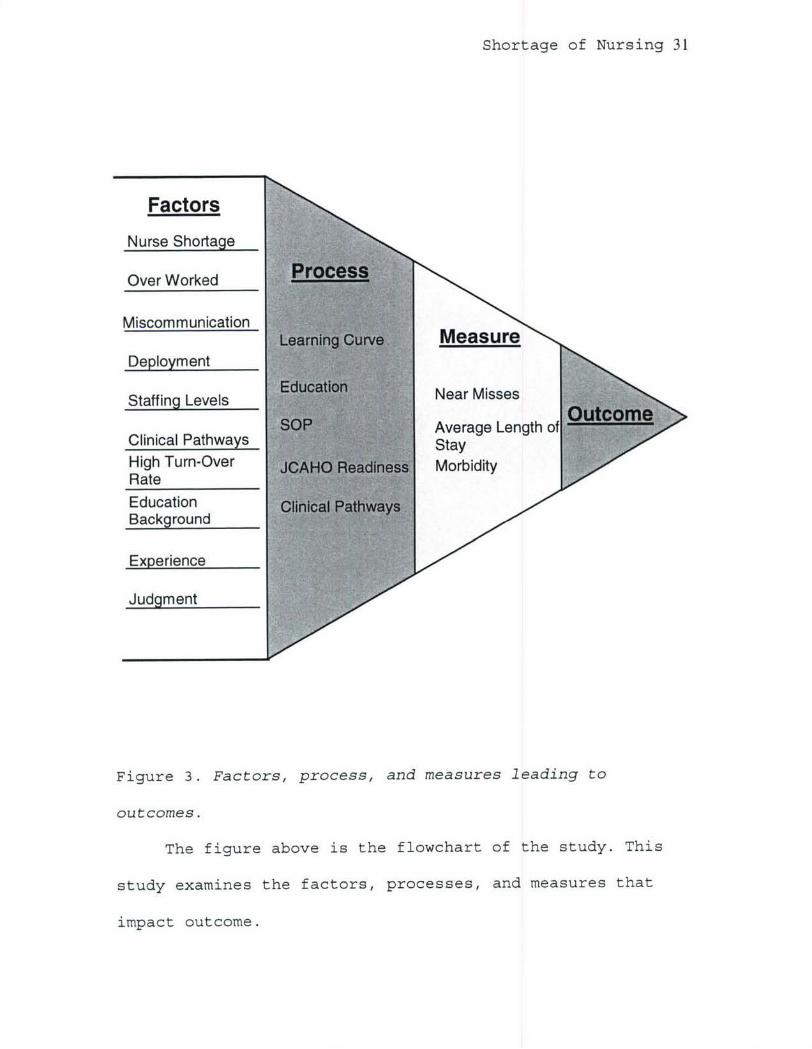
Figure 3. Factors, process, and measures leading to
outcomes.
The figure above is the flowchart of the study. This
study examines the factors, processes, and measures that
impact outcome.
Shortage of Nursing 32
To establish the learning curve model, the unit of
measure for deployments is converted to Full Time
Equivalent (FTE) metrics to fit the statistical model. The
raw near miss data is converted to a measurement of number
of near misses per 100 bed days. This adjustment reduces
the data to a more comparable number to that of near misses
and ALOS. The number of near misses is grouped by month to
establish a time series model that will span over a three
year period. Then the data is compared to the number of
deployments within the same allotted time period. The raw
deployment data was converted to FTEs. Using raw deployment
numbers will not reflect the actual deployment time spent
each month. The FTE will ensure that the deployed soldiers'
days are captured in the following months as well, since
the length of the deployment impacts the days the contract
backfills are hired. The FTE is the amount of man hours
that are deemed a full time employee. The FTE equates to
the number of hours worked per month by an employee. FTEs
are mainly used to determine the staffing level. In this
study, the FTE is equivalent to 168 hours per month. This
is the same conversion used by standard system such as
Medical Expense and Performance Reporting System (MEPRS).
The formula for conversion is as follows: the number of
deployment days for each individual per month is converted

Shortage of Nursing 33
to number hours for that month; this is accomplished by
taking each individual member's deployment and the number
of days per deployment then multiplying it by eight hours.
Also, twenty days were added to the actual deployed days to
ensure that the average training and preparation are
included in the deployment process. The training and
preparation includes Soldier Readiness Process (SRP) that
each soldier must attend prior to deployment. This will
give number of hours per deployment. This conversion
ensures that the exact amount of days deployed are used
rather than using just the number of individual deployments
which does not capture the exact days deployed. This is
true because not all deployments will have the same number
of days that a nurse will be out of the facility. Next, the
number of hours deployed will be converted to FTEs by
dividing total hours deployed by 168 hours which will give
the monthly FTE data. The FTE is aggregated monthly to
establish month by month FTE loss to the GPRMC, which is
compared to the number of near misses per month.
The comparison of the data is made in two manners, the
time-series learning curve and correlation comparison.
First, using the Learning Curve, the data is compared using
a graphical time series to display the effects deployments
have on patient safety or the learning curve. In the

Shortage of Nursing 34
learning curve comparison, the study will examine the
influence of the independent variable on the dependent
variable. It is a visual representation of the correlation
among two variables. The second comparison is accomplished
through the use of SPSS®. The two sets of data are compared
through the use of correlation matrix and an Analysis of
Variance (ANOVA) table. This will determine the strength of
the relationship between the two variables.
The ALOS and deployment data are compared and analyzed
in a similar manner. The learning curve's intent is to
establish a correlation among the variables of ALOS and
deployment using a time series display. The graphical
representation was also established to display time series
significance among the variables rather than using
statistical analysis alone. Solely relying on SPSS®
statistical analysis will give only a partial result. The
SPSS® results may not truly depict the learning curve since
it does not graphically depict the lag time between time of
near miss reporting and the deployment. The SPSS® uses a
linear model that does not represent this lag time.
Therefore, a time-series learning curve model must also be
used to truly display a the lag time the correlation to
it's variables.

Shortage of Nursing 35
During the SPSS® analysis, a control factor of case
mix was used. The case mix variable was adjusted for
patient case severity relative to other inpatients.
Relative Weighted Products (RWP) is a measurement of
resource consumption of patient's hospitalization in
comparison to other inpatients (Yap, 2004). An assumption
is made that the higher the resource consumption, the
higher the patient case acuity. The RWP is derived from the
Diagnosed Related Group (DRG) that the TRI-Care Management
Activity (TMA) uses to measure MTF inpatient workload.
The RWP will then be used to establish the case mix
index. The case mix index will be used to adjust for
different patient mix. Case mix index is determined by the
formula relative weighted products divided by the total
number of facility dispositions. The formula represents the
complexity of the average inpatient case, which may be
calculated for a military treatment facility. A regression
analysis allows one to assess the relationship between
dependent and independent variables. A correlation matrix
of the variables along with descriptive statistics should
first be completed to determine the general relationship of
the variables and to ensure the assumptions underlying
regression analysis are not violated (Yap, 2004). The
regression looks at the linear model to test for
Shortage of Nursing 36
significance of its coefficients among the variables
outlined in the hypothesis.
Since there was a time lag between the deployed
soldiers and the hiring contract backfill, data adjustments
were made during the analysis portion. This approach was
discussed with Department of Healthcare Operations (DHCO)
at BAMC, who are experts in data analysis, and they agreed
to a shift methodology. A shift methodology uses the data
of two months of near misses which were shifted in the
SPSS® to coincide with the two month hiring lag of
contracts. The reason for using only two months was mainly
due to contract backfill taking on an average of two months
to be hired which was supported by the M2 data.
In summary, the legal restrictions (e.g. no TDY for
contractors), ethical beliefs (e.g. against abortion), and
the level of experience of the providers may impact the
learning curve of the providers. These learning curve
phenomenon sometimes lead to identification of near misses,
as healthcare organizations learn from their mistakes and
establish a data base. We will start with the 2002 "near
miss" data and make a comparison with deployment data
starting at the same timeframe. Therefore, 2001 would be
the last year that the deployment issue would not have been
significant because it was the year in which the World

Shortage of Nursing 37
Trade Center attack occurred. Subsequent years would
contain data that would represent the deployment issue and
its impact on the healthcare organizations within the
military healthcare system.
The control group will be represented by the near miss
or error data reported prior to and including the year
2000. This represents the recommended safe nurse to patient
ratio determined by the California Nurses Association (CNA)
(Robusto, n.d.). The CNA suggested five patient to one
nurse as a ratio excluding specialty care such as the ICU.
The year 2000 was the last year since the first Gulf War
that the military was not involved in a major conflict
requiring large deployments of healthcare personnel. The
first Gulf War data is not included in this study due to
near miss data not being readily reported to higher
command. In later years, emphasis was placed on the near
miss data. The case study group is represented by the data
from the near misses reported from areas that fell below
the minimal nurse to patient ratio which was caused by OIF
in 2001, 2002, 2003, and 2004. A second aspect of the
study will be the length of inpatient hospitalization stay.
This will be measured by the ALOS increase for inpatients
during the same time period as this study. The length of
stay will be studied to determine if there is a correlation
Shortage of Nursing 38
between increased length of stay and increased deployment,
by comparing the data through use of the learning curve
model. This will support the study's validation in its the
concern for patient safety that is associated with a nurse
shortage that stems from deployment. In addition, a
regression analysis will be performed to see the
statistical relationship between average length and the
amount of stay nurses deployed.
A regression equation coupled with a scatter plot of
the dependent and independent variable illustrated the
level of relatedness of the two variables. The regression
equation was defined as the best total fit line, with
moving averages, taken from the scatter plot of the
dependent and independent variable. By analyzing the slope
of the regression line and the Y-intercept, the
relationship between the independent variable and the
dependent variable can be determined. An Analysis of
Variance (ANOVA) table was developed which displayed the
residual and the regression line, as well as the F ratio
values. The residual was calculated from the regression
value by subtracting it from the Error Sum of Squares
total. The degrees of freedom were also calculated as part
of the Pearson coefficient. By interpreting the ANOVA table
along with the Pearson correlation, the direction and the
Shortage of Nursing 39
magnitude of the variables were determined. Pearson's
correlation squared (coefficient of determination) times by
100, was used to determine the common, or shared variance
among those variables in a bivariate distribution. The t -
test values were calculated to examine the significance of
the variables in establishing the prevalence of the
alternate hypothesis (Ha). An Alpha of .05 was used as a
benchmark in the decision making process to determine the
significance of the F ratio value.
Data Source/ Data Collection
There were three data sources in this study. The first
data source was the M2 information system (MHS Management
Analysis and Reporting Tool), which supplied the average
length of stay. M2 extracts the information from a data
repository located in Montgomery, Alabama. This data
repository is fed from many other systems including the
Composite Health Care System (CHCS) and the Defense
Enrollment and Eligibility Reporting System (DEERS). M2 is
a powerful ad-hoc query tool used to obtain summary and
detailed views of population, clinical, and financial data
from all MHS regions (Department of Defense, PA&E, 2000).
M2 includes MTF and purchased care data integrated with
eligibility and enrollment data. M2 data can be used to
Shortage of Nursing 40
perform trend analyses, conduct patient and provider
profiling studies, and for this study, the Average Length
of Stay analysis for the GPRMC region. Appendix C will
address some of the definition that are essential to
understanding the how the M2 defines the Bed Days in MTF.
The near miss data, which is comprised only of
reported data from the GPRMC region was obtained from the
GPRMC Clinical Operation Division (GCOD). The GPRMC
consists of the following medical facilities: Fort Bliss,
William Beaumont Army Medical Center, Fort Carson, Evans
Army Community Hospital, Fort Hood, Darnell Army Community
Hospital, Fort Huachuca, Raymond Bliss Army Health Center,
Fort Leavenworth, Munson Army Health Center, Fort Leonard
Wood, Leonard Wood Army Community Hospital, Fort Polk,
Bayne-Jones Army Community Hospital, Fort Riley, Irwin Army
Community Hospital, Fort Sam Houston, Brooke Army Medical
Center, Fort Sill, Reynolds Army Community Hospital. The
GCOD division collects the data from of all its medical
facilities around Great Plains. Then it consolidates and
interprets the information into a report for the Tri-Care
Management Activity (TMA), which monitors all military
healthcare activities.
The actual number of nurses deployed into OIF and OEF
since year 2000 was obtained from the GPRMC Operation and
Shortage of Nursing 41
Readiness Division. The data is deemed reliable since the
GPRMC is the center that determines and provides the orders
for the nurse personnel that are picked to deploy for OIF
and OEF within the Great Plains region.
Sample/Population Size
The sample sizes for this study are as follows:
deployments from year 2002 to year 2005 comprised of 1,158
data points, near misses from year 2002 to year 2005 were
5,727 data points, and bed days annotated from year 2002 to
2005 were 65,535 data points with adjusted amount 56,463.
Adjustments were made to eliminate the Drug/Alcohol,
depressive neuroses, and normal new borns. These areas
were areas not affected in staffing levels by nursing
deployments.
Reliability and Validity
Experimental findings should be tested to ensure they
are reliable and valid. Validity is when the study actually
measures what it is intended to measure (Cooper &
Schindler, 1998). In this study, construct validity, which
involves establishing operational measures that correspond
and capture the essence of the attribute being studied, was
Shortage of Nursing 42
increased by using multiple sources and measures that
related to the theory.
Reliability is the replicability and consistency of
the results. It's the accuracy and precision of a measure
in which errors and bias are minimized (Cooper & Schindler,
1998). A study is reliable when another investigator is
able to perform the same study, under the same conditions,
with the same outcome. There would be consistent results
among the testers. For this study, to ensure reliability,
documentation and use of proper procedures were
standardized across investigators.
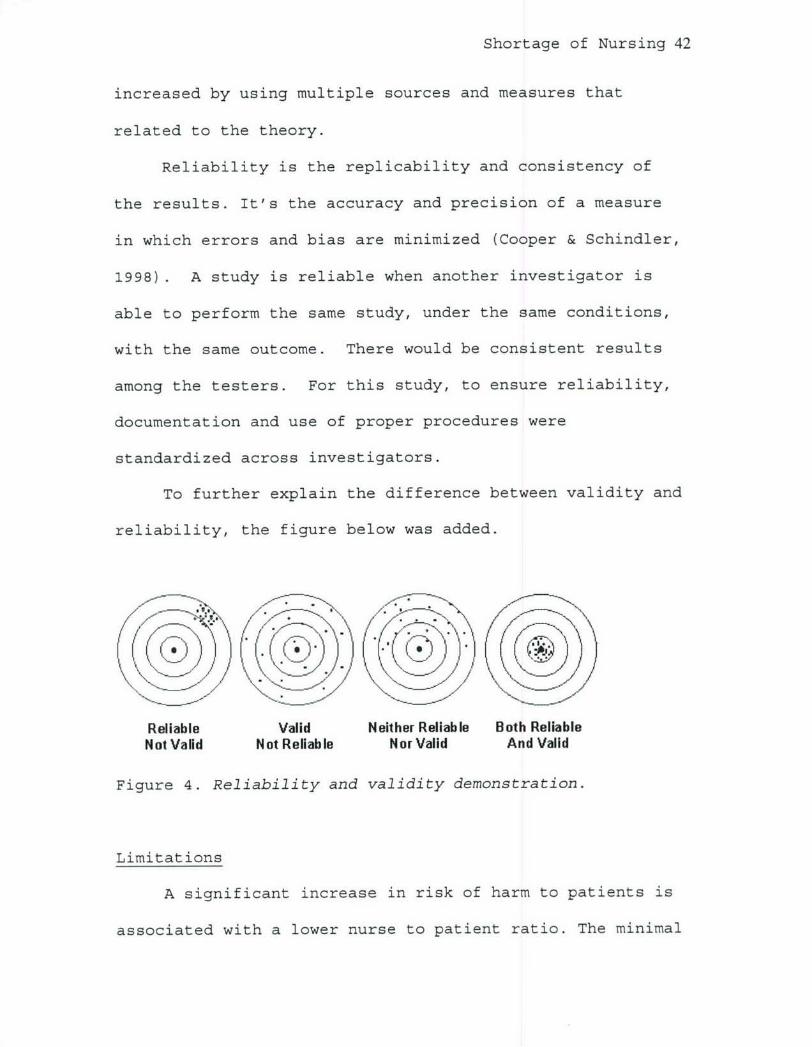
To further explain the difference between validity and
reliability, the figure below was added.
I..s
Reliable Valid Neither Reliable Both ReliableNot Valid Not Reliable Nor Valid And Valid
Figure 4. Reliability and validity demonstration.
Limitations
A significant increase in risk of harm to patients is
associated with a lower nurse to patient ratio. The minimal
Shortage of Nursing 43
safe nurse to patient ratio recommended by the California
Nurses Association and supported by the American Nurses
Association is five patients to every one nurse in a
general medical ward; different ratios are used for
specialties (Robusto, 2004). However, the trend indicates
that by the year 2010 there will be a severe shortage of
nurses and these requirements may not be met. Since the
recommended patient to nurse ratio is just that and not a
requirement, it is not enforced by any agencies.
There may be some underreporting of "near miss" data.
Currently, complete confidentiality for reporting does not
exist. Therefore, the actual numbers are likely to be
somewhere in-between the report and the actual incident.
Forecasting trends will always have variability based
on season, place, time, and situation. Errors occur due to
the lack of identification of all the variables associated
with making a prediction. Environmental or Criterion
Contamination factors such as state laws, local specific
regulations, and procedures can also influence future trend
predictions since there are unpredictable factors.
Policy changes in medical procedures and practice due
to changing regulations may impact the data collection
process, whenever the rules for reporting or methods of
data collection change.
Shortage of Nursing 44
Finally, the data obtained from GPRMC is limited to
three years due to reporting guidelines. The emphasis
placed on data quality may not have been as strict in prior
years. There were parts of the data that had missing months
and those months were replaced by the averages of the
collective whole. A total of two months were projected.
Ethical Concerns
Information gathered for this study was aggregated,
without identifying information, to preserve the privacy of
the study respondents. All study participants are with the
U.S. Army and the materials associated with the study are
not classified in nature. No IRB review was required for
this study due to the voluntary and non-clinical nature of
the questionnaires. No outside financial funding sources
were used for this study.
Shortage of Nursing 45
Results
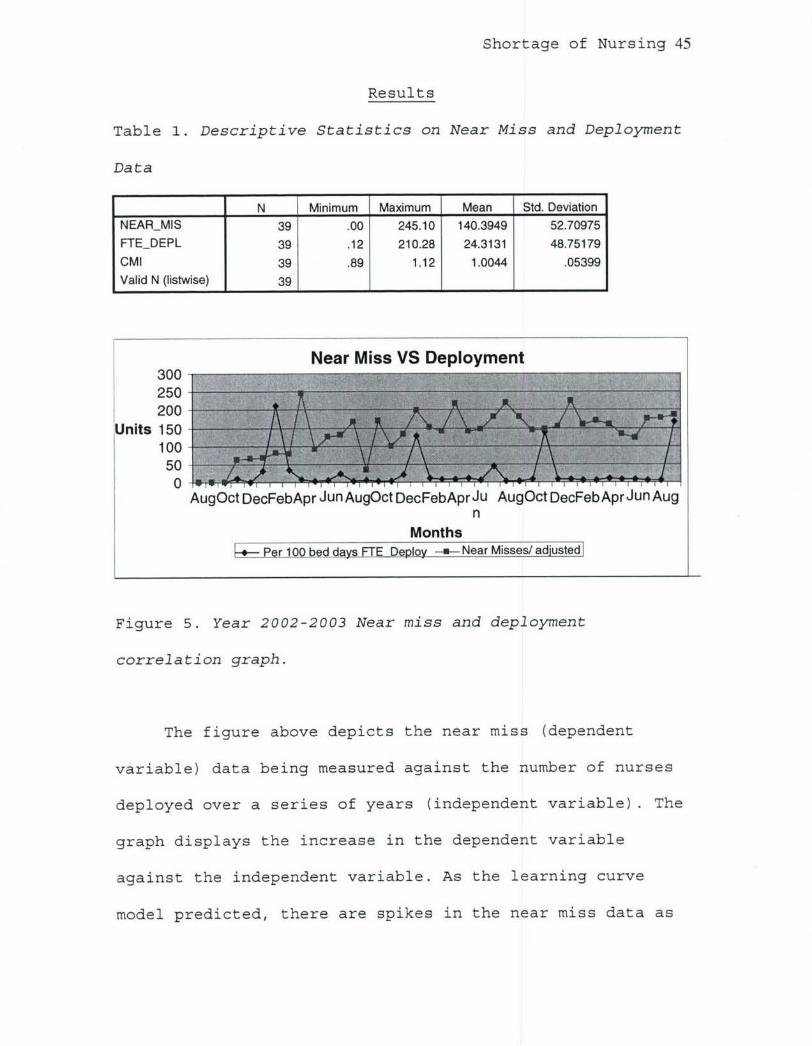
Table 1. Descriptive Statistics on Near Miss and Deployment
Data
N Minimum Maximum Mean Std. DeviationNEARMIS 39 .00 245.10 140.3949 52.70975FTEDEPL 39 .12 210.28 24.3131 48.75179
CMI 39 .89 1.12 1.0044 .05399
Valid N (listwise) 39 1 1 1 1
Near Miss VS Deployment300250200
Units 150100500
AugOct DecFebApr Jun AugOct DecFebApr Ju AugOct DecFebApr Jun Augn
MonthsPer 100 bed days FTE Deploy -a-- Near Misses/ adjusted]
Figure 5. Year 2002-2003 Near miss and deployment
correlation graph.
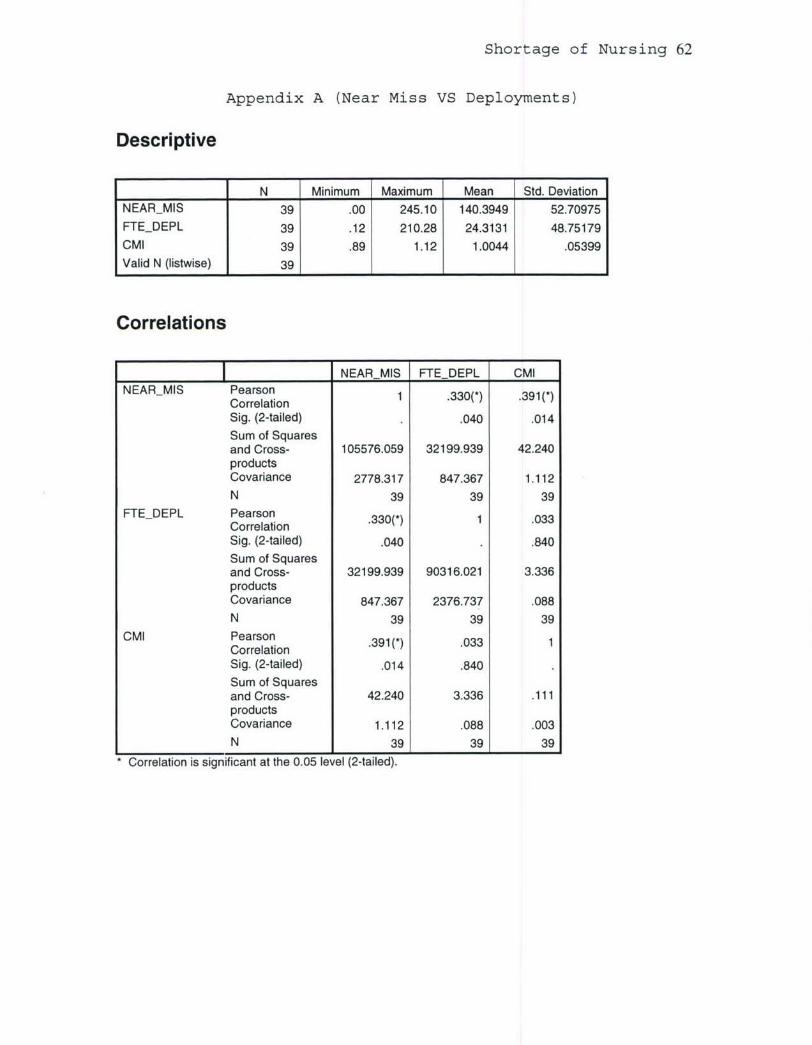
The figure above depicts the near miss (dependent
variable) data being measured against the number of nurses
deployed over a series of years (independent variable). The
graph displays the increase in the dependent variable
against the independent variable. As the learning curve
model predicted, there are spikes in the near miss data as

Shortage of Nursing 46
the number of deployments increase. The lag in the spikes
is due to the hiring time for contract backfills. As
mentioned previously, it takes approximately two months to
hire a contract employee. In Appendix A, the SPSS output
further illustrates the magnitude of the relationship
between the variables. The t-test result (t = 2.200 with p
< .034 with 37 degrees of freedom) demonstrated a
significant relationship. The shared variance was 33% with
the alpha level being set at .05 which assumes a 95%
confidence level. The Pearson Correlation Matrix also
indicates that there is significant positive correlation
between near misses and deployment.
Shortage of Nursing 47
Near Miss VS Deployment300
200
100 " --
0.0O' 0
Z -100-100 0 100 200 300
Deployment FTE
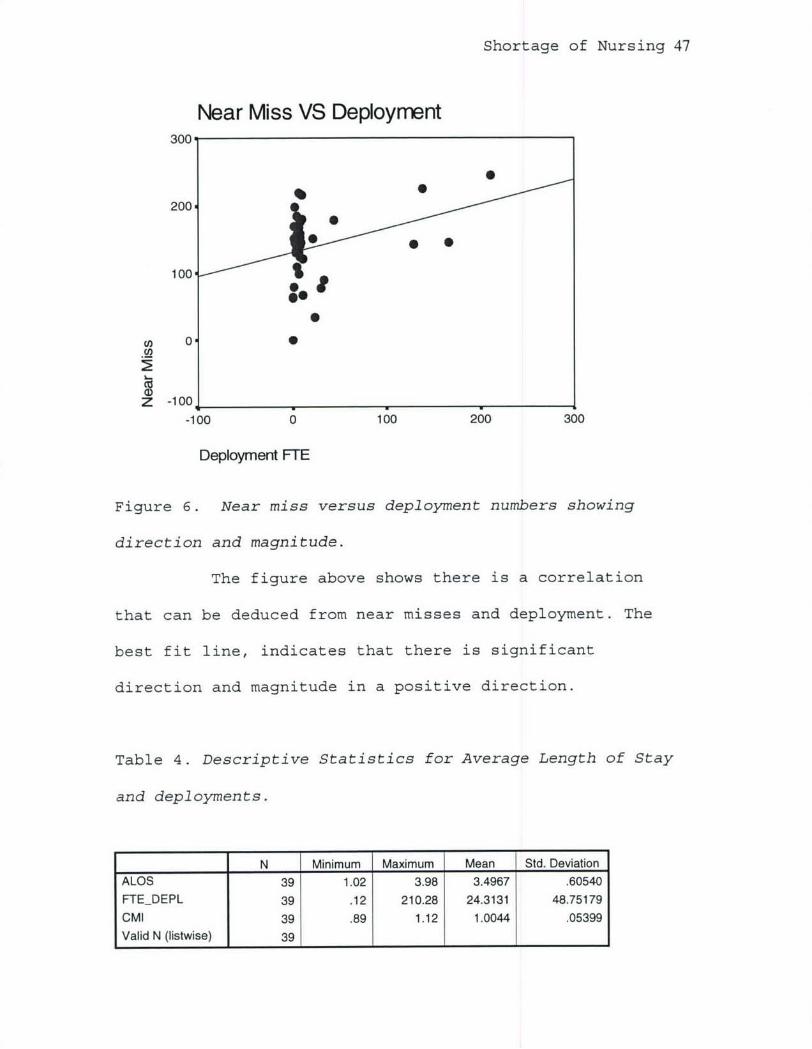
Figure 6. Near miss versus deployment numbers showing
direction and magnitude.
The figure above shows there is a correlation
that can be deduced from near misses and deployment. The
best fit line, indicates that there is significant
direction and magnitude in a positive direction.
Table 4. Descriptive Statistics for Average Length of Stay
and deployments.
N Minimum Maximum Mean Std. Deviation
ALOS 39 1.02 3.98 3.4967 .60540
FTEDEPL 39 .12 210.28 24.3131 48.75179
CMI 39 .89 1.12 1.0044 .05399Valid N (listwise) 39 1 1 1 1 _1
Shortage of Nursing 48
ALOS VS. Deployment250
200Units150
100
50
augoct decfeb apr jun augoct dec eb apr jun augoct dec eb aprljun aug
Monthsp ALOS --- FTEDeployment
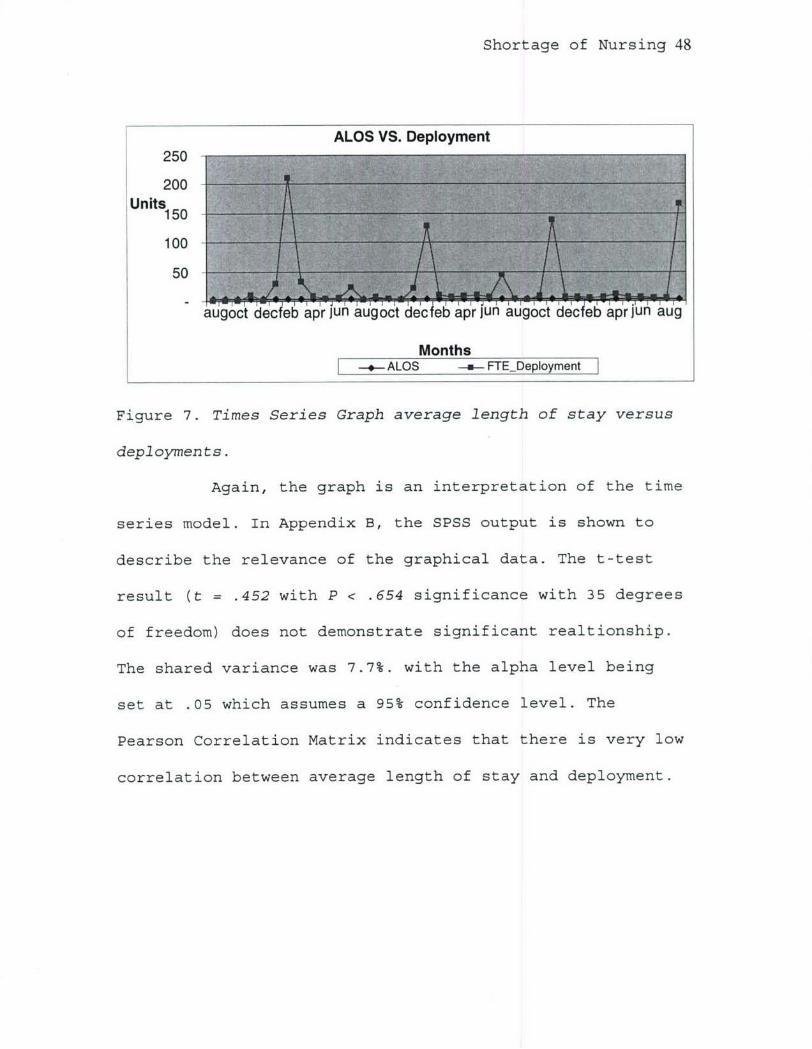
Figure 7. Times Series Graph average length of stay versus
deployments.
Again, the graph is an interpretation of the time
series model. In Appendix B, the SPSS output is shown to
describe the relevance of the graphical data. The t-test
result (t = .452 with P < .654 significance with 35 degrees
of freedom) does not demonstrate significant realtionship.
The shared variance was 7.7%. with the alpha level being
set at .05 which assumes a 95% confidence level. The
Pearson Correlation Matrix indicates that there is very low
correlation between average length of stay and deployment.
Shortage of Nursing 49
ALOS VS Deployment4.5,
4.0
3.5 0 63.5 0
3.0-
2.5
2.0,
1.5'
Cl 1.0
.5 _
-100 0 100 200 300 400 500 600 700
Deployment FTE
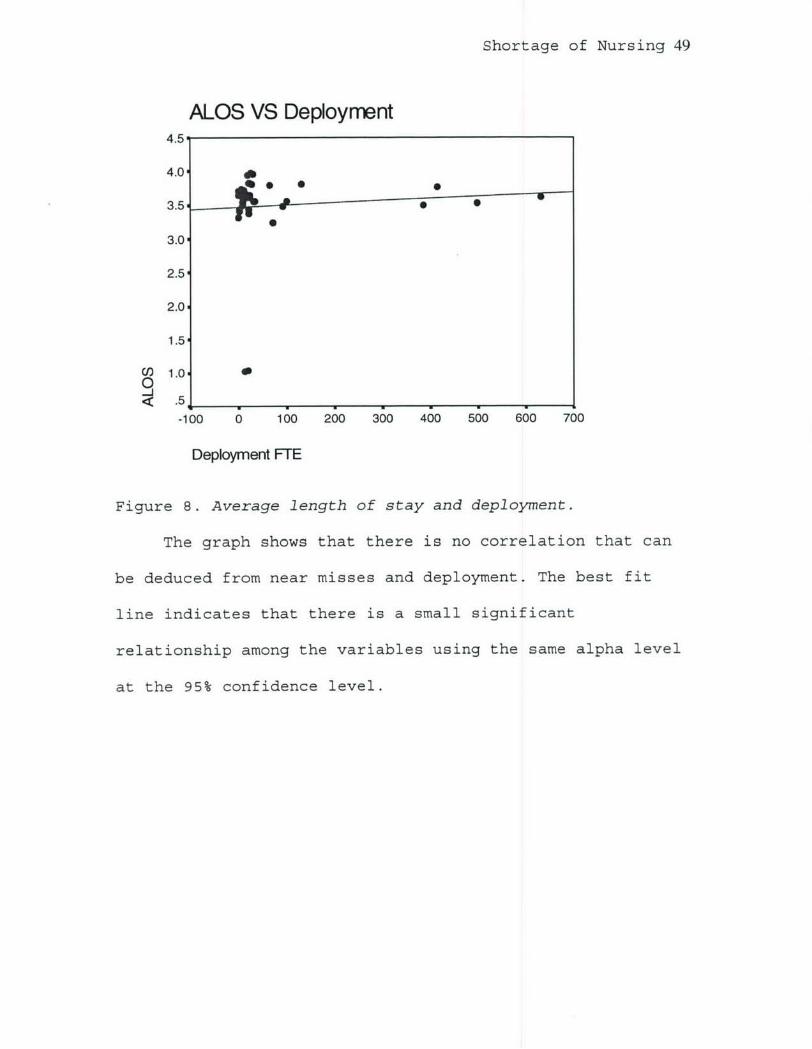
Figure 8. Average length of stay and deployment.
The graph shows that there is no correlation that can
be deduced from near misses and deployment. The best fit
line indicates that there is a small significant
relationship among the variables using the same alpha level
at the 95% confidence level.
Shortage of Nursing 50
Discussion
The results indicated that there was correlation
between near miss and deployment; however, there is no
correlation with average length of stay and deployments. In
terms of average length of stay, the confounding factor of
less workload as a result of decreased personnel may be a
reason why the inpatient days were not increasing. In
other words, the smaller workforce as a result of a hiring
lag in addition to the major CSH units deploying within the
GPRMC may have contributed to fewer patients being
admitted. Therefore, they're were less patients in an
inpatient status. The deployment of CSH units from Fort
Carson and Fort Bliss greatly reduced the availability of
inpatient beds. In some instances, wards were closed for
certain periods of time. Most of the MTF inpatients are
surgery patients. A decrease in the amount of surgeries
performed results in fewer days for inpatient care. Future
research should try narrowing the study to observe the
correlation between deployments and patient injuries.
The results for near misses and deployments comply
with the learning curve theory. As backfill nurses enter
the work force, there will be a lag in time for personnel
to establish proper orientation to the facility as they get
acclimated to their surroundings. This lag is measured

Shortage of Nursing 51
through near misses, which is supported by the significant
findings of this study. Does the steep learning curve model
experienced by contract backfills deprive mostly from
environmental changes or is it related to cultural changes?
Environmental changes are those associated with nurses
exposed to new surroundings. Cultural changes are defined
as those involving behavioral and psychological changes.
The difference lies in the way business is conducted. These
are some of the future studies that may be conducted in
order to more accurately pinpoint the exact causes of the
learning curve.
Shortage of Nursing 52
Conclusion and Recommendation
In regard to the three "E" analyses for healthcare,
efficiency, effectiveness, and equity, both efficiency and
effectiveness are impacted by the nursing shortage. These
shortages may prevent quality care from being rendered to
patients. Nurse staffing shortages and increased medical
errors will result from nurses being forced to do more with
less. Being too aggressive in maximizing the usage of staff
may lead to ineffectiveness and loss of efficiency.
Equity among nurses will be non-existent with some
nurses receiving more pay and benefits, while others will
be working more with less pay and benefits. The reason for
this inequity stems from nurses working administrative
duties as well as clinical practice. Those fortunate enough
to just concentrate on clinical duties will have less
responsibility than those that are "dual-hatted". However,
one possible impact of the shortage of nursing staff will
be the impetus created to develop higher-level technology
to assist nurses in their duties. As previously mentioned,
robotics could make healthcare more efficient and force
nurses to adapt and learn to utilize the newer technologies
in lieu of more manpower. Another advantage the nursing
shortage may bring is cultural changes in the way we
perceive nurses. When a commodity is in great demand, the

Shortage of Nursing 53
value placed on that scarce commodity is greatly increased.
The shortage of nurses may bring back the luster the
nursing profession once enjoyed.
The practical use of these findings, should the
alternate hypothesis be accepted, is that MTFs will be
obligated to implement SOPs that addresses the education of
incoming personnel to the nuances of the military
healthcare delivery system. An orientation with exposure
to the "near misses" and errors specific to the MTF should
be introduced as part of that orientation. Through
separate classes, education should be provided for each
civilian contractor that replaces a deployed soldier. If
possible, a face to face meeting with their replacements
should be arranged to assure continuity of care for the
existing patients. This process will help alleviate some,
but not all of the challenges of the steep learning curve
that a contractor will go through and thus ensure that
patient safety is of foremost concern. BAMC, in
particular, could improve procedures to assist the
temporary personnel, help lower the incidence of errors and
lessen the impact of the steep learning curve.
Clinical pathways may be better developed to improve
patient outcomes. Better quality of service can be
rendered and errors lessened through having a better SOP in

Shortage of Nursing 54
place that is embraced by a majority of providers. By
reviewing past performance, along with a comprehensive
assessment, a systemic approach could be developed that may
save lives. Saving lives would be the ultimate proof of
success of a healthcare system.
Nursing deployment mirrors another salient issue which
is the growing nursing shortage. This will be a challenge
for healthcare executives entering the field today and even
more-so in the future. Their challenge is to ensure
adequate staffing in all areas of healthcare, especially in
the area of nursing. Healthcare organizations are spending
increasing amounts of money to ensure that their
organizations attract nurses through certification as a
Magnet Organization. A Magnet Organization is a medical
facility dedicated to excellence in nursing services. The
Magnet facilities are commissioned by the Magnet
Recognition Program®. It recognizes medical facilities that
are dedicated to improving the quality of life for nurses.
This program awards organizations based on their patient
care and nursing services (McVicar, 2003). Other healthcare
organizations offer increased compensation, different
scheduling options, and recognition bonuses and incentives.
Healthcare executives must be creative and proactive to
compete with organizations that have already taken
Shortage of Nursing 55
initiatives to recruit and retain their current nurse
staffing.
Finally, the large percentage of the population who
are retiring will also change the culture of the United
States. The increasing numbers of retired people will
cause a strain on healthcare and the economy. Healthcare
organizations, both civilian and military, will undergo a
metamorphosis from their current organizational structures
in order to meet the demands of a growing retirement
community. The combination of a shortage of nurses, the
backbone of the healthcare industry and the increase in the
number of retired persons, places the U.S. in danger of
having inadequate healthcare systems in the future.
Patient safety should be a concern for not only
healthcare workers but the entire population. Providers and
managers must take a proactive role in establishing well
structured protocols in medical systems to ensure their
proper application for learning. The institutions must also
provide opportunities to apply any lessons learned from
near miss data to better serve both military and civilian
patients. It must then be communicated to others so that
all may benefit. It can help reduce aggregate healthcare
cost by first reducing errors and lessening iatrogenic
mistakes. Second, it may reduce the number of repeat visits
Shortage of Nursing 56
by patients because their symptoms and diagnoses were not
identified and treated properly the first time around.
Lastly, it will save lives.
Further studies can be conducted in order to properly
link the correlation of a nursing shortage to patient
safety with the use of greater and more in depth
statistical analysis to accurately correlate the "near
miss" data to the case group. This research will only
demonstrate the relationship of a nursing shortage with
patient safety using limited data from limited sources
(i.e. the MTF in the Great Plains region). Further studies
should be directed toward patient mishaps/injuries
committed by nursing personnel on a national scale. This
type of study has the potential to expose a possible
national epidemic facing healthcare in the near future. The
areas of suggested concentration would include: overtime
hours worked, the fatigue factor, staffing issues, and
increased patient care responsibilities.
Extensive research using multiple types of anonymous
surveys that protect participant confidentiality should be
used encourage open participation. A survey conducted in
an environment free from any identification of the subject
would result in a more accurate depiction of the true
character of the nursing shortage problem.

Shortage of Nursing 57
References
Beyea, S. (2004). Too tired to work safely? The Association
of Perioperative Registered Nurses. 559, 561-562.
Retrieved June 14, 2005, (from Ovid database).
Blendon R. J. (ScD), DesRoche C. M., Benson, J. M. (MA),
Rosen, A.B. (MD), Schnieder, E.S. (MD), (2002). Views
of practicing physicians and the public on medical
errors. The New England Journal of Medicine. 347, 933-
940.
Buback, D. (2004). Assertiveness training to prevent verbal
abuse in the OR. The Association of Preoperative
Registered Nurses, 98(3), 147-190. Retrieved December
14, 2004, from Ovid database.
Buerhaus, P.I., Staiger, D.O., & Auerbach, D.I. (2000).
Implications of an aging registered nurse workforce.
The Journal of the American Medical Association, VOl.
II, 2948-2954. Retrieved May 06, 2004, from Ovid
database.
California Workforce Initiative (2000). Minimum Nurse
Staffing Ratio in California Acute Care Hospital.
Retrieved September 5, 2005, from
http://futurehealth.ucsf.edu/pdf files/MinNurseStaffin
gRatiosl.pdf
Shortage of Nursing 58
Center for Defense Information (CDI) (2002) Military
Almanac. Washington, D.C.
Cooper, D. & Schindler, P. (1998). Business research
methods (6 th ed.). Boston: Irwin/McGraw-Hil.
Daily Health Policy. Nurses' Overtime Hours, Medical Errors
Linked, Report Indicates. Retrieved September 07,
2004, from http://kaisernetwork.org/
Department of Defense, M2 Systems Data Dictionary (2005).
M2 data dictionary, PA&E website.
Dragoo, Jessie (1998). Mentoring a Novice Chief Nurse
Executive. Journal of Nursing Administration, 28(9),
12-14. Retrieved June 14, 2005, from Ovid database.
Government Accountability Office (GAO) (2004). Military
Operations: Fiscal Year 2004 Costs for the Global War
on Terrorism will exceed supplemental, requiring DOD
to shift funds from other uses. Report to Congress
Committees. Retrieved June 15, 2005, from GAO website.
Griffith JR. (2002). Measuring comparative hospital
performance. Journal of Healthcare Management. 47(1),
41-57.
Institute of Medicine (IOM) (2004). Keeping patients safe:
Transforming the work environment of nurses.
Washington, D.C: National Academy Press.
Shortage of Nursing 59
IOM Institute of Medicine (IOM) (2000). To err is human:
Building a safer health system. Washington, D.C:
National Academy Press.
Levine, L. (2001). A shortage of registered nurses:
Is it on the horizon or already here? Congressional
Research Service. Retrieved December 14, 2004, from
CRS Web database.
Luebbe, R. L. & Finch, B. J. (1990). How long is the job
going to take? Gale Group. Ohio: Lotus.
McVicar, Andrew. (2003). Workplace stress in nursing.
Journal of Advanced Nursing, Vol. I, 633-642.
Retrieved August 04, 2004, from Ovid database.
Mientka, M. (2001). U.S. Faces Nursing Shortage. U.S.
Medicine Information Central. Retrieved December 18,
2004, from http://www.usmedicine.com/article.cfm.
Murray, M.K. (2002). The nursing shortage: past, present,
and future. Journal of Nursing Administration, 96(6),
79-84. Retrieved July 15, 2004, from First Search
database.
National Association for Healthcare Quality (NAHQ) (2004).
Impact on quality and patient safety: The new shortage
of healthcare professionals (n.d.). Retrieved July 10,
2004, from NAHQ website.

Shortage of Nursing 60
Nursing Shortage Bites (1999, February). Sun Spots
Newsletter, 25(2). Retrieved December 18, 2004, from
EbscoHost database.
NurseWeek (2001, February). The registered nurse population
Retrieved August 07, 2004, from http://nurseweek.com
Purnell, M., Horner, D., Gonzales J. & Westman, N. (2001).
The Nursing Shortage: Revisioning the Future. The
Journal of Nursing Administration, 34(1), 179-186.
Robusto, L. (n.d.). California sets safe nurse ratios.
Retrieved December 18, 2004, from
http://nursing.about.com/cs/nursingmanagement/a/htm
SPPS Science Products Company (2005). Software and
Solutions. Retrieved September 5, 2005, from
http://www.spss.com/scienceproducts.htm
Statement before the House of Representatives, Committee on
Veterans' Affairs, & Subcommittee on Oversight and
Investigation (2003, October). Office of Congressional
& Legislative Affairs. Retrieved December 26, 2004,
from
http://www.officeofcongressional&legislativeaffairs.or
g/statementdeptva/oct03.htm
Shortage of Nursing 61
Thomas J. W., Guire K.E., Hovart G.G. (1997). Is patient
length of stay related to quality of care? Journal of
Healthcare Management 42(4): 489-507.
Trochim, William (2002). Reliability and Validity.
Retrieved
September 5, 2005, from
http://www.socialresearchmethods.net/kb/rel&val.htm
Yap G. (2004). Staffing level and inpatient outcomes at
military healthcare facilities: A resource based view.
Unpublished Dissertation for Birmingham Alabama
University, 22-47.
Shortage of Nursing 62
Appendix A (Near Miss VS Deployments)
Descriptive
N Minimum Maximum Mean Std. Deviation
NEARMIS 39 .00 245.10 140.3949 52.70975FTEDEPL 39 .12 210.28 24.3131 48.75179
CMI 39 .89 1.12 1.0044 .05399Valid N (listwise) 39 1_1 _ 1_1_1
Correlations
NEAR-MIS FTEDEPL CMINEARMIS Pearson
Creain1 .330(*) .391(*)Correlation
Sig. (2-tailed) .040 .014Sum of Squaresand Cross- 105576.059 32199.939 42.240productsCovariance 2778.317 847.367 1.112N 39 39 39
FTEDEPL PearsonCorrelation .330() .033Sig. (2-tailed) .040 .840
Sum of Squaresand Cross- 32199.939 90316.021 3.336productsCovariance 847.367 2376.737 .088
N 39 39 39
CMI PearsonCorrelation .391 () .033 1Sig. (2-tailed) .014 .840Sum of Squaresand Cross- 42.240 3.336 .111productsCovariance 1.112 .088 .003
N 39 39 39
Correlation is significant at the 0.05 level (2-tailed).
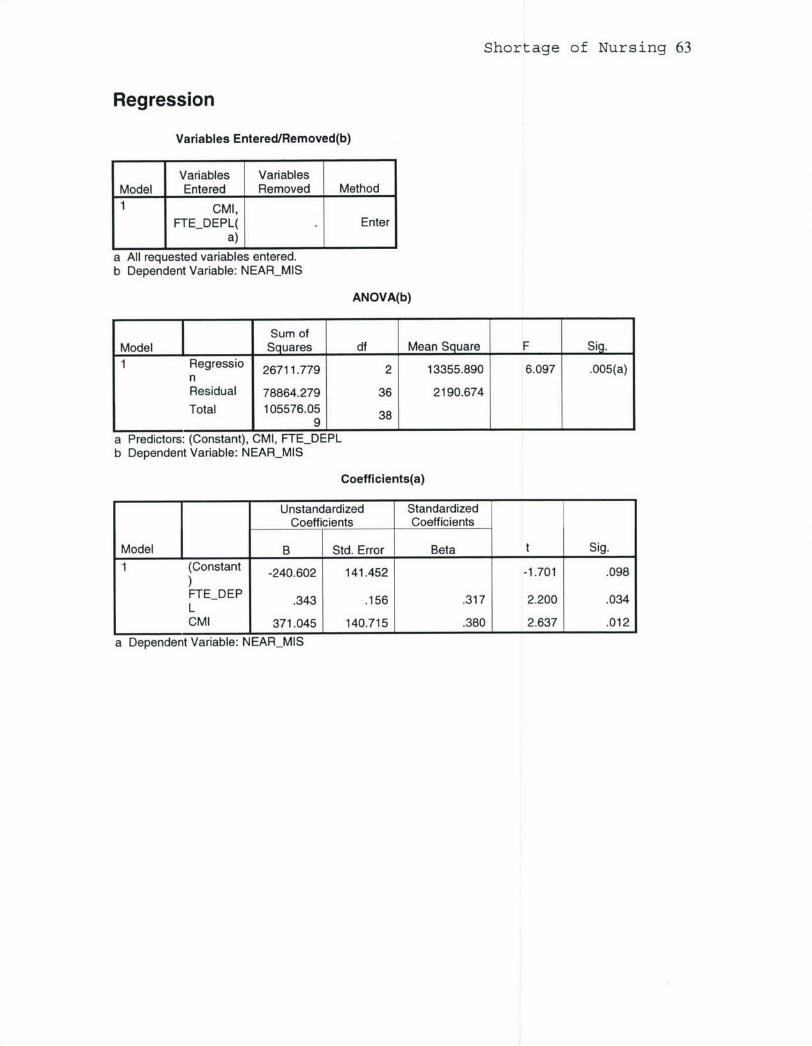
Shortage of Nursing 63
Regression
Variables Entered/Removed(b)
Variables VariablesModel Entered Removed Method1 CMI,
FTEDEPL( Entera) , I _I
a All requested variables entered.b Dependent Variable: NEARMIS
ANOVA(b)
Sum ofModel Squares df Mean Square F Sig.1 Regressio 26711.779 2 13355.890 6.097 .005(a)
nResidual 78864.279 36 2190.674Total 105576.05 38
98a Predictors: (Constant), CMI, FTEDEPLb Dependent Variable: NEARMIS
Coefficients(a)
Unstandardized StandardizedCoefficients Coefficients
Model B Std. Error Beta t Sig.
1 (Constant -240.602 141.452 -1.701 .098
FTEDEP .343 .156 .317 2.200 .034LCMI 371.045 140.715 .380 2.637 .012
a Dependent Variable: NEARMIS
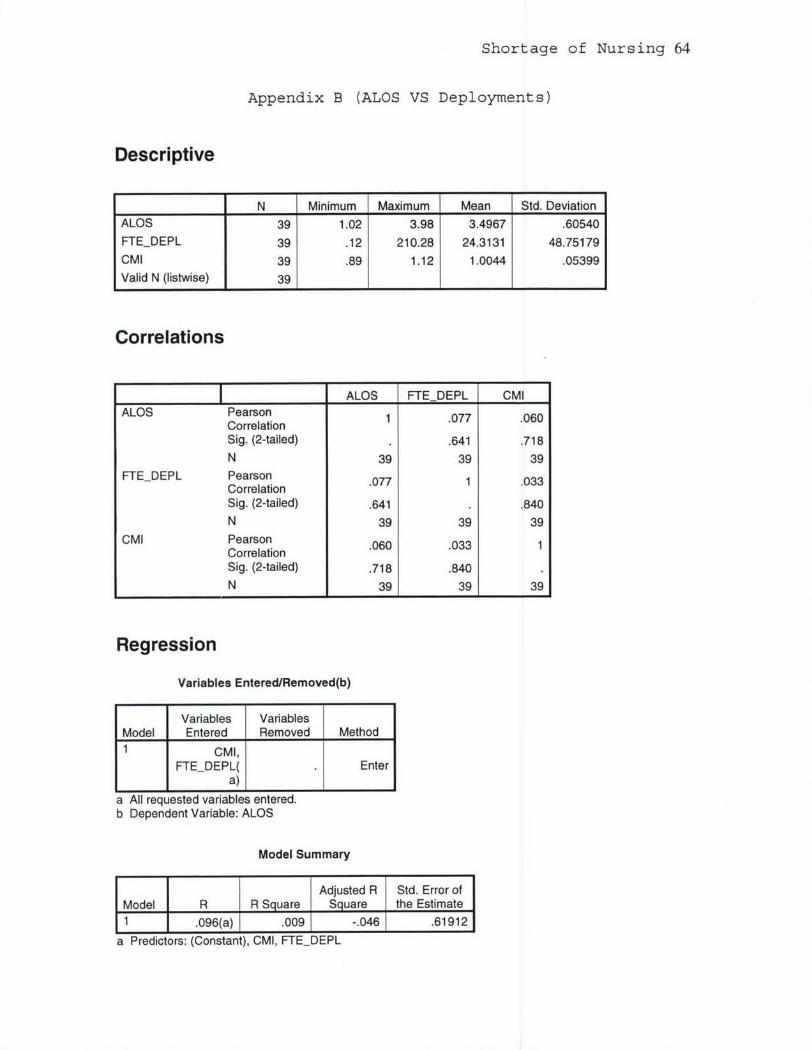
Shortage of Nursing 64
Appendix B (ALOS VS Deployments)
Descriptive
N Minimum Maximum Mean Std. Deviation
ALOS 39 1.02 3.98 3.4967 .60540FTEDEPL 39 .12 210.28 24.3131 48.75179
CMI 39 .89 1.12 1.0044 .05399
Valid N (listwise) 39 1 1 1 _1
Correlations
ALOS FTEDEPL CMIALOS Pearson 1 .077 .060
CorrelationSig. (2-tailed) .641 .718
N 39 39 39FTEDEPL PearsonCreain.077 1 .033Correlation
Sig. (2-tailed) .641 .840
N 39 39 39
CMI Pearson .060 .033 1CorrelationSig. (2-tailed) .718 .840N 39 39 39
Regression
Variables Entered/Removed(b)
Variables VariablesModel Entered Removed Method1 CMI,
FTEDEPL( Entera) L
a All requested variables entered.b Dependent Variable: ALOS
Model Summary
Adjusted R Std. Error ofModel R R Square Square the Estimate1 .096(a) .009 -.046 .61912
a Predictors: (Constant), CMI, FTEDEPL
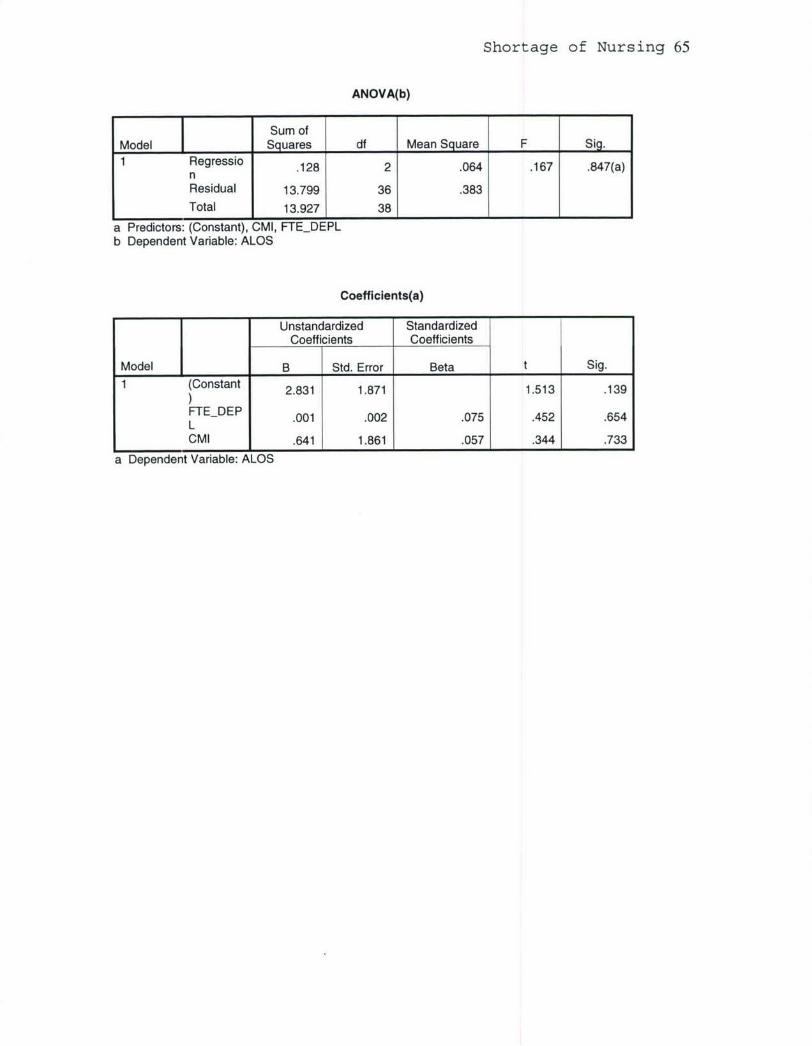
Shortage of Nursing 65
ANOVA(b)
Sum ofModel Squares df Mean Square F Sig.
Regressio .128 2 .064 .167 .847(a)nResidual 13.799 36 .383Total 13.927 38
a Predictors: (Constant), CMI, FTEDEPLb Dependent Variable: ALOS
Coefficients(a)
Unstandardized StandardizedCoefficients Coefficients
Model B Std. Error Beta t Sig.
1 (Constant 2.831 1.871 1.513 .139
FTEDEP .001 .002 .075 .452 .654LCMI .641 1.861 .057 .344 .733
a Dependent Variable: ALOS

Shortage of Nursing 66
Appendix C (M2 Definitions)
M2 definition for Tri-Care beneficiary (M2, 2005).
Expected number of admissions per enrolleeper month, adjusted for age, gender, active
Admissions MHS Norm duty and marital status, based on thehistorical utilization of those enrolled toMTFs and regional managed care supportcontractors.
Expected number of bed days per enrollee permonth, adjusted for age, gender, active duty
Bed Days MHS Norm and marital status, based on the historicalutilization of those enrolled to MTFs andregional managed care support contractors.
Expected number of bed days per enrollee permonth, adjusted for age, gender, active duty
Bed Days MHS Peer and marital status, based on the historicalutilization of those enrolled to theorganizations in the same peer group.
M2 Bed days definition (M2, 2005).
Bed Calculated byDays Bed Days Civ Norm, Raw Num dividing CompletionCiv estimated to completion. (6,2) Factor into Bed DaysNorm, Civ Norm, Raw.Total
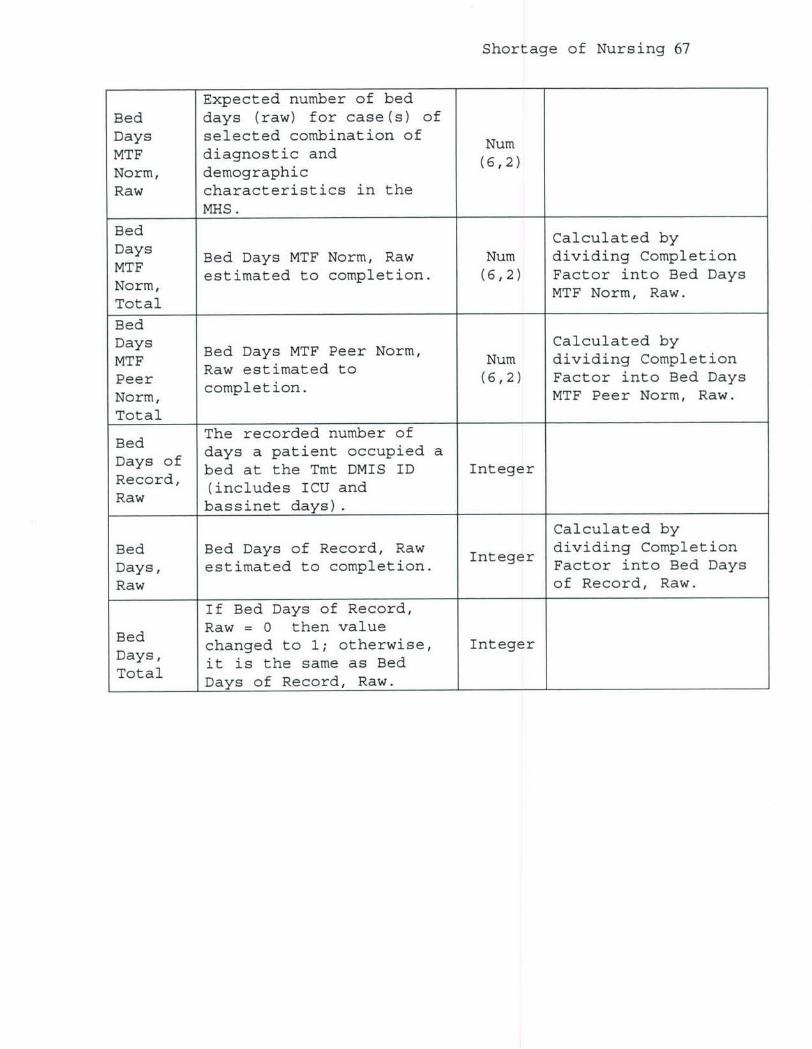
Shortage of Nursing 67
Expected number of bedBed days (raw) for case(s) ofDays selected combination of NumMTF diagnostic and (6,2)Norm, demographicRaw characteristics in the
MHS.
Bed Calculated byDays Bed Days MTF Norm, Raw Num dividing CompletionMTF estimated to completion. (6,2) Factor into Bed DaysNorm, MTF Norm, Raw.Total
BedBed Days MTF Peer Norm, Calculated byMTF Betatee o Num dividing CompletionPeer etimae (6,2) Factor into Bed Days
Norm, MTF Peer Norm, Raw.Total
Bed The recorded number of
Days of days a patient occupied abed at the Tmt DMIS ID Integer
Recd (includes ICU andbassinet days).
Calculated byBed Bed Days of Record, Raw dividing CompletionDays, estimated to completion. Integer Factor into Bed DaysRaw of Record, Raw.
If Bed Days of Record,
Bed Raw = 0 then valuechanged to 1; otherwise, Integer
Days, it is the same as BedTDays of Record, Raw.
REPORT DOCUMENTATION PAGE 1Form Approved
IT OMB No. 0704-0188
The public reporting burden for this collection of information is estimated to average 1 hour per response, including the time for reviewing instructions. eearching existing data sources.gathering end maintaining the data needed, end completing and reviewing the collection of information. Send comments regarding this burden estimate or any other aspect of this collection ofinformation. including suggestions for reducing the burden, to Department of Defense, Washington Headquarters Services, Directorate for Information Operations end Reports (0704-0188),
1215 Jefferson Davis Highway, Suite 1204, Arlington. VA 22202-4302. Respondents should be aware that notwithstanding any other provision of law, no person shall be subject to anypenalty for failing to comply with a collection of information if it does not display a currently valid OMB control number.
PLEASE DO NOT RETURN YOUR FORM TO THE ABOVE ADDRESS.1. REPORT DATE (DD-MM-YYYY) 2. REPORT TYPE 3. DATES COVERED (From - To)
07-10-2006 Final Report I July 2004 to Jul 2006
4. TITLE AND SUBTITLE 5a. CONTRACT NUMBER
Patient Safety Concerns as a Result of Nursing Shortage Trends
5b. GRANT NUMBER
5c. PROGRAM ELEMENT NUMBER
6. AUTHOR(S) 5d. PROJECT NUMBER
John W. Lee, CPT, MS
5e. TASK NUMBER
5f. WORK UNIT NUMBER
7. PERFORMING ORGANIZATION NAME(S) AND ADDRESS(ES) 8. PERFORMING ORGANIZATION
U.S. Army Medical Department Center and School REPORT NUMBER
BLDG 2841 MCCS-HFB(Army-Baylor Program in Healthcare Adminstration)3151 Scott Road, Suite 1411Fort Sam Houston, TX 78234-6135
9. SPONSORING/MONITORING AGENCY NAME(S) AND ADDRESS(ES) 10. SPONSOR/MONITOR'S ACRONYM(S)
11. SPONSOR/MONITOR'S REPORTNUMBER(S)
3-05
12. DISTRIBUTION/AVAILABILITY STATEMENT
Approved for public release; distribution is unlimited
13. SUPPLEMENTARY NOTES
14. ABSTRACT
This study examined the effect of the loss of deployed nurses on the Medical Treatment Facility (MTF) to patient safety. The period
between the deployed nurses' departure and the contract nurse being fully operational appears very crucial. The methods used in this
study were the use of the learning curve model and the correlation of deployed nurses and the number of near misses that a back fill
nurse may experience. The problem surfaces during the time it takes back fill nurse contractors to get acclimated to the military
medical facility. Statistical analysis indicates there is a significant correlation between the number of near misses and deployments
of nurses. However, there was no correlation between average length of stay and deployments. The results indicate that mistakes or
near misses are more likely to occur during the initial learning curve phase for the back filling nurses.
15. SUBJECT TERMS
Nursing Shortage and Patient Safety Outcomes
16. SECURITY CLASSIFICATION OF: 17. LIMITATION OF 18. NUMBER 19a. NAME OF RESPONSIBLE PERSON
a. REPORT b. ABSTRACT c. THIS PAGE ABSTRACT OF Rene PryorPAGES67 19b. TELEPHONE NUMBER (Include area code)(9Li67 (210) 221-6443
Standard Form 298 (Rev. 8/98)Prescribed by ANSI Std. Z39 18