Embed Size (px)
Citation preview

2007 UPDATE RESOURCE ESTIMATION ON THE
RED BIRD PORPHYRY Mo/Cu DEPOSIT
Haven Lake Area Skeena Mining Division
West Central British Columbia Latitude: 53°16’39” to 53°18’16” North
Longitude: 126°59’10” to 127°3’39” West NTS Map-Area 93E/6
For
TORCH RIVER RESOURCES
By
G.H. Giroux, P.Eng., MASc.
Giroux Consultants Ltd. 1215 – 675 W. Hastings St. Vancouver, B.C. V6B 1N2
January 11, 2008

i
TABLE OF CONTENTS
Page
1.0 SUMMARY…………………………………………………………………………………….. 1 2.0 INTRODUCTION AND TERMS OF REFERENCE...……………………………………... 3 3.0 RELIANCE ON OTHER EXPERTS…………………….…………………………………….. 3 4.0 PROPERTY DESCRIPTION AND LOCATION……………………………………………. 4 5.0 ACCESSIBILITY, LOCAL RESOURCES, INFRASTRUCTURE, CLIMATE AND
PHYSIOGRAPHY……………………………………………………………………………… 6 6.0 HISTORY………………………………………………………………………………………. 8 7.0 GEOLOGICAL SETTING ……………………………..……………………………… 12 8.0 DEPOSIT TYPE………..………………………………………………………………………. 14 9.0 MINERALIZATION…………………………………………………………………………... 15 10.0 EXPLORATION………………………………………………………………………………. 16 11.0 DRILLING…………………………………………………………………………………..… 19 11.1 Historic Drilling………………………………………………………………………. 19 11.2 2006 Drilling…………………………………………………………………………. 21 11.3 2007 Drilling…………………………………………………………………………. 22 12.0 SAMPLING METHOD AND APPROACH………………………………………….………. 25 13.0 SAMPLE PREPARATION, ANALYSIS AND SECURITY…………………………..…….. 27 14.0 DATA VERIFICATION………………………………………………………………………. 29 15.0 ADJACENT PROPERTIES…………………………………………………………………. 33 16.0 MINERAL PROCESSING AND PROCESS TESTING…………………………………… 33 17.0 MINERAL RESOURCE ESTIMATION…………………………………………………….. 34 17.1 Data Analysis……………………………………………………………………… 34 17.2 Geologic Model……………………………………………………………………. 35 17.3 Composites…………………………………………………………………………. 36 17.4 Variography………………………………………………………………………… 37 17.5 Block Model………………………………………………………………………. 37 17.6 Interpolation……………………………………………………………………….. 38 17.7 Bulk Density……………………………………………………………………….. 38 17.8 Classification………………………………………………………………………. 39 18.0 OTHER RELEVANT DATA AND INFORMATION……………………………………… 45 19.0 INTERPRETATIONS AND CONCLUSIONS……………………………………………… 45 20.0 RECOMMENDATIONS……………………………………………………………………… 46 21.0 BIBLIOGRAPHY……………………………………………………………………………… 47 22.0 CERTIFICATE………………………………………………………………………………… 49
TABLES Table 1: List of Mineral Tenures and expiry dates Red Bird Property………………….. 4 Table 2: Craigmont Mines Ltd. Red Bird Property, Historical Resource Estimates……. 9 Table 3: Parameters used in a preliminary economic appraisal of the Red Bird Deposit.. 10 Table 4: Redbird Resource using 2006 Drill Program………………………………………….. 10 Table 5: Table of Formations…………………………………………………………… 12 Table 6: Some examples of Porphyry Mo (Low F Type) deposits……………………... 14 Table 7: Duplicate geochem samples sent to Pioneer and Chemex……………………………. 17

ii
TABLES (cont.) Table 8: List of 2006 Drill Holes………………………………………………………………. 22 Table 9: List of Drill holes completed in 2007………………………………………………… 24 Table 10: List of Significant Intersections in 2007 Drill Program……………………………… 24 Table 11: Summary of 2004 results for drill core samples………………………………. 29 Table 12: Comparison of Craigmont Original Mo Assays with 2005 Check Samples….. 29 Table 13: Key metallurgical parameter for the Red Bird property………………………. 33 Table 14: Summary of Drilling……………………………………………………………. 34 Table 15: Summary statistics for Mo, Cu and Ag assays used for estimate……………… 34 Table 16: Summary statistics for Mo Populations………………………………………… 35 Table 17: Summary statistics for Mo and Cu in 5 m composites…………………………. 36 Table 18: Summary of Semivariogram parameters for Mo and Cu………………………. 37 Table 19: Search Parameters for Ordinary Kriging……………………………………….. 38 Table 20: 2007 Red Bird Indicated Resource….………………………………………….. 40 Table 21: 2007 Red Bird Inferred Resource……………………………………………….. 41 Table 22: Summary of Red Bird Resource Estimates…………………………………………….. 41
FIGURES 1 Location of Red Bird Property………………………………………………………….. 5 2 Claim Map ……………………………………………………………………………… 7 3 Historic Drill hole plan and proposed open pits, Red Bird property…………………… 11 4 Regional geologic setting of the Red Bird property……………………………………. 13 5 Craigmont drill hole plan showing significant MoS2 intersections……………………. 16 6 2007 Soil sample results for Mo and Cu at Red Bird………………………………….. 18 7 Drill hole section 10200 E, Main zone ………………………………………………… 19 8 Drill hole section 9800 N, SW zone……………………………………………………. 20 9 Drill hole section 9700 N, SE zone……………………………………………………. 21 10 Redbird Drill Hole Plan……………………………………………………………….. 23 11 Scatter Plot for original Craigmont Mo% assays and 2005 check assays…………….. 30 12 Blank Samples assayed for Mo……………………………………………………….. 31 13 Blank Samples assayed for Cu………………………………………………………... 31 14 Standard assayed for Mo……………………………………………………………… 32 15 Standard assayed for Cu………………………………………………………………. 32 16 Isometric plot showing geologic mineralized solid and drill holes……………………. 36 17 Red Bird 1155 Level………………………………………………………………….. 42 18 Red Bird 1175 Level…………………………………………………………………… 43 19 Red Bird 1195 Level…………………………………………………………………… 44
APPENDICIES
1 Semivariogram models for Mo and Cu…………………………………………………. 50

1
1.0 SUMMARY
• This report is written to update the resource estimation for the Red Bird Property and was requested by Bill Pfaffenberger, President and CEO of Torch River Resources. It represents an update of previous NI 43-101 reports the most recent of which was completed by G.H. Giroux and Ron Parent in August 2007. This update includes the results from 10 diamond drill holes totalling 2,645 m completed by Torch River in 2007. These 10 holes were all drilled in the western part of the Main Zone to infill gaps within the previous drill campaigns.
• The Red Bird molybdenum property consisting of 3 mineral claims totalling 1,256 ha is
located 133 km southwest of Burns Lake and 105 km north of Bella Coola in west central British Columbia. The property boarders on Tweedsmuir Park, but the resource is located south of the Park Boundary and as a result can be exploited.
• The property was first staked in 1937 with several claims located near Red Bird
Mountain. Phelps Dodge prospected the area in 1958 and staked the property in 1959. Geologic mapping, trenching and geophysical surveys were completed from 1960 to 1962 with the first drilling stated in 1963. By 1966 Phelps Dodge had completed 58 diamond drill holes totalling 13,807 m. Phelps Dodge also constructed a 17.7 km road east of the property to connect with the mouth of Bone Creek at Eutsuk Lake. In 1967 Ashfork Mines Ltd., a subsidiary of Phelps Dodge, completed 3,544 m of diamond drilling in 15 holes. During 1968 Ashfork drilled an additional 2 holes totalling 286 m and completed 1,005 m of trenching. In 1979 Craigmont Mines Ltd. optioned the property from Phelps Dodge and complete 9,090 m of diamond drilling in 36 holes. The aim of this program was to better define the main zone located along the northern contact of the quartz monzonite stock. In 1980 Craigmont tested the southeast and southwest zones with an additional 4,881 m in 22 diamond drill holes. A resource estimate was completed in 1980 by N. Vollo for Craigmont and a preliminary economic appraisal was completed in 1981 by N. Farnsworth.
• The Red Bird deposit is associated with an Eocene quartz monzonite porphyry stock that
intrudes predominantly pyroclastic volcanic rocks of the Upper Cretaceous Kasalka Group. The quartz monzonite porphyry that hosts the Red Bird deposit is an elliptical body roughly 1300 m long and up to 900 m wide.
• The Red Bird deposit consists of three zones of molybdenum mineralization labelled
Main, Southwest and Southeast which are located around the outer margin of the quartz monzonite stock and in adjacent wall rocks. Mineralization occurs as molybdenum within quartz veinlets with the best grades located in banded veins where molybdenite is concentrated along the vein walls. Quartz veinlets and fracture coatings within Biotite Hornfels near the stock contact also contain significant amounts of molybdenum, chalcopyrite and pyrite.
• A re-sampling program of Craigmont drill core was completed by Torch River during
August 2005. This program was supervised by A. Kikauka, P.Geo. A total of 1,569

2
sections of ½ drill core were re-sampled and analyzed for molybdenum and copper and a multi element ICP package.
• Field exploration in 2007 consisted of 130 soil samples over the Main Zone.
• In the summer of 2007 Torch River, under the supervision of A. Kikauka, P.Geo.,
completed a drill program consisting of ten diamond drill holes totalling 2,645 m. The holes were collared from 2 sites located on the east side of Big Creek in an area where the west extension of the Main Zone molybdenite mineralization occurs. Drill core was sampled for Mo, Cu and Ag.
• The 2007 drill assays were added to the data base of historic holes, 2005 re-sampled
holes and 2006 drilling. A total of 10 Mo assays were capped at 0.33 % Mo and 12 Cu assays were capped at 0.49% Cu. A geologic three dimensional model was constructed from cross sections and 3 mineralized zones; Main, Southwest and Southeast were formed. Uniform 5 m down hole composites were produced for Mo and Cu within these mineralized solids.
• Semivariograms were reviewed based on the additional data. Pairwise relative
semivariograms were produced on 5 m composites and showed a geometric anisotropy for both Mo and Cu elongated in the E-W direction. The maximum range for Mo was increased in all directions over the model used in the 2006 estimate.
• A block model of blocks 20 x 20 x 10 m was superimposed on the mineralized zones and
Mo and Cu were interpolated into the blocks using ordinary kriging.
• The results were classed as indicated and inferred at this time due to lack of original Phelps Dodge assays and the drill hole spacing. No economic evaluation has been done on this resource and as a result no comment can be made regarding an economic cutoff grade. Using a cutoff established in the 1981 study of 0.03% Mo a total of 88.2 million tonnes at an average grade of 0.061 % Mo are classed indicated while an additional 63.4 million tonnes averaging 0.055 % Mo are classed inferred. This represents an increase of 103 % on indicated tonnes and 93 % on indicated contained pounds of Mo over the 2006 estimate. The inferred tonnes have decreased by 10% with inferred contained Mo decreasing by 15%.
• A preliminary economic assessment is recommended. The current block model resource
should be given to a Mining Engineer for a preliminary mine design using reasonable metal prices and costs. In addition to optimizing open pits over the various zones the possibility of underground extraction should be investigated. The property should also be evaluated with regards to possible locations of mill site, waste rock dumps and tailings pond areas in light of the close proximity to Tweedsmuir Park. Possible road access should also be looked into as well as environmental and social concerns. Recommendations are also made for infill drilling on near surface higher grade targets to increase the confidence in potential starter pit areas. This program is estimated to cost $1,500,000.

3
2.0 INTRODUCTION AND TERMS OF REFERENCE Red Bird Resources Ltd., a private Alberta company (President, Daniel R. Davis) and Fundamental Resources Corporation, a private BC company (President William E. Pfaffenberger) have entered into a joint venture agreement to develop the Red Bird property. Torch River Resources Ltd. has an option agreement with Red Bird Resources Ltd. to develop the property. This property, situated at Haven Lake in west central British Columbia, was extensively explored by Phelps Dodge Corp. and a subsidiary company in the 1960’s and by Craigmont Mines Ltd. in 1979 and 1980. During 2007 Torch River completed a 10 hole diamond drill hole program totaling 2,645 m within the western part of the Main Zone. A total of 144 diamond drill holes have defined a significant and potentially economic molybdenum resource associated with an Eocene age quartz monzonite porphyry intrusion. This report presents an update to the preliminary resource estimation for the Red Bird Porphyry Mo/Cu Deposit established in 2005 (Giroux, et. al., 2006) and updated in August 2007 (Giroux, et. al., 2007). The drill holes completed in 2007 were within the western part of the Main Zone. Geological descriptions and historical programs are repeated from an earlier report written by D. MacIntyre (MacIntyre, 2005). Sections of earlier reports that have not changed are repeated in their entirety for completeness. This technical report has been prepared in compliance with the requirements of National Instrument 43-101 and Form 43-101F1 and is intended to be used as supporting documentation to be filed with the Alberta Securities Commission, the British Columbia Securities Commission and the TSX Venture Exchange. Information used in the preparation of this report includes a number of internal company reports prepared by Craigmont Mines Limited detailing diamond drilling results and a preliminary economic analysis of the subject property completed in 1979 and 1980. These reports, which were not filed in support of assessment work requirements in the province of British Columbia, are not readily available to the public. These unpublished reports and maps provide detailed geologic information on Craigmont’s 1979 and 1980 diamond drilling program which was subsequently used to do an internal resource calculation and preliminary economic potential assessment for the Red Bird deposit. Citations for these and other internal company reports are contained in the Reference section of this report. The 2007 drill program was carried out by Torch River under the supervision of QP Andris A Kikauka, P Geo. The program consisted of the completion of 10 core holes for an aggregate length of 2,645 metres during the period July – September, 2007. The resource estimation was completed by G.H. Giroux, P.Eng. Mr. Giroux has visited the property on August 16-17, 2007. Units of measure in this report are metric; monetary amounts referred to are in Canadian dollars.

4
3.0 RELIANCE ON OTHER EXPERTS This report is based on a review and digital compilation of available historical data, including detailed diamond drill hole logs for 57 holes completed by Craigmont Mines Ltd. in 1979 and 1980. Drill hole logs for the 76 drill holes done prior to 1979 by Phelps Dodge Corporation and Ashfork Mines Limited (a subsidiary of Phelps Dodge) were not available at the time this report was written. Phelps Dodge assays were shown on cross sections as long composites through the mineralized zone. The results of this drilling were incorporated into the resource calculations and economic potential assessments done by Craigmont in 1980 and 1981. For this study the Phelps Dodge composited assays were used for the resource estimate but not for the semivariogram interpretation. The authors also had access to detailed drill hole sections which showed both Craigmont and earlier drill hole results. 4.0 PROPERTY DESCRIPTION AND LOCATION The Red Bird molybdenum property consists of three mineral claims situated in the Skeena Mining Division of west central British Columbia 133 kilometres southwest of Burns Lake and 105 kilometres north of Bella Coola (Figure 1). The property covers an area of 1,256.3 hectares between latitudes 53°16’39” to 53°18’16” North and longitudes 126°59’10” to 127°3’39” West (Universal Transverse Mercator NAD83 coordinates 5905047 to 5908034 North and 629255 to 634234 East) in NTS map-area 93E/6 (see Figure 2). As shown on Figure 2, parts of the Red Bird mineral claim are truncated by the boundary of Tweedsmuir Park. This park is a designated protected area that excludes all industrial activities including mineral exploration and development. The remaining claim area is open to mineral exploration and development. In the Haven Lake area, the park boundary corresponds to the drainage divide between the coast and interior watersheds. This drainage divide is also the boundary between the Omenica and Skeena Mining Divisions. All previous resource estimates of molybdenum bearing mineral zones made by Craigmont Mines Limited in 1980 and 1981 are located on the Red Bird mineral tenure (Figure 2) and, with the exception of the easternmost tip of the main (northern) zone, are not located in Tweedsmuir Park.
Table 1 List of mineral tenures and expiry dates, Red Bird property.
Claim Name Record No.
Hectares* Mining Division
Record Date Expiry Date
501914 405.968 Skeena Jan. 12, 2005 July 7, 2016 510491 811.716 Skeena April 9, 2005 July 7, 2016 513729 38.65 Skeena June 4, 2005 May 31, 2016
The Red Bird claims are registered to W.E. Pfaffenberger, director of Fundamental Resources Corp.(Free Miners Certificate No. 143363). At the time of writing the claims had not been legally surveyed. Red Bird Resources Ltd., a private Alberta company (President, Daniel R

5
Davis) and Fundamental Resources Corporation, a private BC company (President William E Pfaffenberger) have entered into a joint venture agreement to develop the property.
.

6
5.0 ACCESSIBILITY, CLIMATE, LOCAL RESOURCES, INFRASTRUCTURE AND PHYSIOGRAPHY The Red Bird claim is located north of Haven (Bone) Lake and southwest of Red Bird Mountain (Figure 2). Haven Lake is 5 kilometres southeast of Eutsuk Lake. Access to the property is via float plane in June-October and by helicopter in winter. Float plane access is available from Nimpo Lake and Bella Coola located south of the property and from Burns Lake or Houston northeast and north of the property. In 1966, Phelps Dodge built a 17.7 kilometre access road which connects to Eutsuk Lake via the Bone Creek valley. This road is badly overgrown and is within Tweedsmuir Provincial Park, as is most of Eutsuk Lake. At the same time, an airstrip was built near Eutsuk Lake and a barge was used to haul equipment and supplies from a logging road that connects to Vanderhoof on Highway 16 or Quesnel on Highway 97. Both of these communities are on major rail lines. If the Red Bird property should advance to the mining stage, this access route would probably be the most economic. This assumes that the provincial government would allow road construction through Tweedsmuir Park. An alternative access route would be to build a new road from the property westward down Salahagen Creek to connect to a network of logging roads in the Kimsquit River valley, a distance of less than 20 kilometres. These logging roads connect to tidewater at the head of the Dean Channel where a shipping facility could be built. This alternate access route does not involve crossing parks or designated environment conservancy areas but would involve road construction and maintenance through a narrow, steep-sided mountain pass with a high avalanche risk. If the Red Bird property should ever advance to the mine development and production stage, the nearest source of hydroelectric power generation would be at Alcan’s Kemano power station which is located 68 kilometres northwest of the property (Figure 1). The Red Bird property has cool to cold, moderately wet winters and warm relatively dry summers. Total yearly precipitation on the property is estimated at between 89-114 centimetres (35-45 inches). At higher elevations of 1,300 to 1,700 meters above sea level, work could be carried out between June and October, whereas heavy snowfall and cold weather would hamper activity in the winter months. The Red Bird property is located near the eastern edge of the Coast Mountains where the topography is characterized by steep mountain peaks bounding narrow, glacier carved valleys. Radial drainage patterns are common and the primary vegetation is a mixture of fir, hemlock, cedar and spruce. Further eastward the physiography changes to the rolling hills and broad valleys typical of the Interior Plateau. The climate here is more arid and the vegetation is predominantly pine, much of which has been killed by an uncontrolled infestation of the mountain pine beetle.

FIGURE 2 : CLAIM MAP
0 2 4 km.
Legend
This map is a user generated static output from an Internet mapping site and is for generalreference only. Data layers that appear on this map may or may not be accurate, current, orotherwise reliable. THIS MAP IS NOT TO BE USED FOR NAVIGATION.
Scale: 1:115,141Map center: 53°15' N, 127°5' W

8
6.0 HISTORY The first indication of mineral exploration on the Red Bird property was in 1937 when several claims were located near Red Bird Mountain. Phelps Dodge prospected the area in 1958, and located the CAFB claims in 1959. From 1960 to 1962 work consisted of geological mapping, trenching and geophysical surveys. Drilling started in 1963 and by 1966 a total of 13,807 metres (45,286 feet) of diamond drilling in 58 holes had been completed. In 1966, an access road was constructed from Haven Lake (1,041 metres elevation) to the main mineral zone at 1,460 metres elevation and a 17.7 kilometre (11 mile) road was constructed east of the property to connect to the mouth of Bone Creek at Eutsuk Lake. A ferry service across Eutsuk Lake gave access to the existing forestry road network. A 762 metre (2,500 feet) airstrip was also constructed near the eastern terminus of the Bone Creek access road. In 1967, Ashfork Mines Limited (a subsidiary of Phelps Dodge) did 3,544 metres (11,624 feet) of diamond drilling in 15 holes and this was followed in 1968 by an additional 286.5 metres (940 feet) of diamond drilling in 2 holes plus 1,005 metres (3,300 feet) of crawler dozer trenching and blasting. The property remained dormant until 1979 when Craigmont Mines Limited optioned the property from Phelps Dodge. In 1979, Craigmont did 9,060 metres of diamond drilling in 36 holes. The purpose of this drilling was to improve the definition of the main zone located along the northern contact of the quartz monzonite stock. In 1980, Craigmont did an additional 4,881.40 metres of diamond drilling in 22 holes. The purpose of this drilling was to better define the extents of the southeast and southwest zones intersected in the earlier work by Phelps Dodge. Drill hole locations, surface projections of zones of high (>.10%) and low (0.05-1.0%) grade MoS2 mineralization and Craigmont’s proposed pit outlines are shown on Figure 3. Drill hole intersections for the 1979-1980 Craigmont drilling (Holes 73 to 131) were converted to digital format by the writer. In 1979 and 1980, Craigmont did preliminary resource estimates using the 1979-1980 drill information and previous drill results from Phelps Dodge. Detailed cross sections were plotted manually and mineable blocks were defined on the basis of the drill hole information. An initial resource estimate was done by N.B. Vollo, P.Eng. in 1980. This estimate was based on 3 separate zones amenable to open pit mining - the main, southeast and southwest zones (Figure 3) plus a part of the main zone that could be mined from underground. Vollo’s resource estimate distinguished between relatively high grade blocks with grades greater that 0.10% MoS2 and a lower grade resource with grades between 0.05%-0.10% MoS2. These estimates were recalculated in 1981 by computer and the results were incorporated into a preliminary economic appraisal of the property (Farnsworth, 1981). Both Vollo’s and the computer generated resource estimates are shown in the following table taken from Farnsworth’s preliminary economic appraisal (Farnsworth, 1981).

9
Table 2.
Craigmont Mines Ltd. Red Bird Property, Historical Resource Estimates (Farnsworth, 1981)
Computer Estimate
N.B. Vollo's resource calculation (1980) Farnsworth, 1981 Zone Above 0.05%
>0.10% MoS2 0.05-0.10% MoS2 Total MoS2cut-off tonnes grade tonnes grade tonnes grade tonnes grade
Main Pit 12,650,000 0.20 3,800,000 0.08 16,450,000 0.17 39,981,000 0.121 SW Pit 14,400,000 0.18 7,700,000 0.09 22,100,000 0.15 21,586,000 0.13 SE Pit 6,700,000 0.14 4,800,000 0.08 11,500,000 0.11 19,910,000 0.097 Sub total 33,750,000 0.18 16,300,000 0.08 50,050,000 0.15 81,477,000 0.118 Main UG 30,350,000 0.16 21,200,000 0.08 51,550,000 0.13 - - Total 64,100,000 0.17 37,500,000 0.08 101,600,000 0.14 81,477,000 0.118 UG=underground; all grades are given as weight percent MoS2
Grade and tonnage figures quoted for the Red Bird property are referenced from previous work (Craigmont Mines Ltd Annual Report, 1980). These dated grade and tonnage estimates may not be in accordance with current National Instrument 43-101 regulations. However, the Red Bird grade and tonnage figures released by Craigmont Mines in 1980 were in accordance with relevant CIM definitions for their date. According to Farnsworth (1981) “the computer estimate resulted in considerably higher open pit tonnages at lower grades than did N.B. Vollo’s estimate. Vollo’s estimate was manually derived from two-dimensional sections. The computer estimated reserves to a 0.05% MoS2 cut-off on a three-dimensional basis. The influence of each block on another block within a zone of influence was weighted by the inverse of the distance squared – kriging was not used.” (Farnsworth, 1981, page 9). As shown in Table 2, no computer estimates were done for parts of the main zone that could be mined by underground methods. The preliminary economic appraisal done by Farnsworth in 1981 calculated a project rate of return of 8.0% based on a 10,000 tonne per day, 23 year mine life. Some of the key parameters used in this appraisal are listed below. All of the resource calculations and economic appraisals available for the Red Bird property were done internally by Craigmont Mines Limited staff. To the writers knowledge no other resource calculations exist for the Red Bird property. The Red Bird property was apparently the subject of a compensation package offered to Phelps Dodge Corporation by the Province of British Columbia. The writer has no information regarding the details or reasons for this compensation. The Red Bird property was restaked by Andris Kikauka as agent for W.E. Pfaffenberger, director of Fundamental Resources Corporation, a private company, on May 7, 2003.

10
Table 3. Parameters used in a preliminary economic appraisal of the Red Bird
deposit (Farnsworth, 1981).
Resource size and grade 81.5 million tonnes, average grade 0.118% MoS2, 0.05% MoS2cutoff grade Mining method 3 open pits Overall stripping ratio 1.90:1 Overall Head Grades 0.118% MoS2and 0.078% Cu Recoveries 80% for Mo, 65% for Cu Metal Prices (1981 U.S.$) Mo $8.50 (1981-89) $12.25/lb (1990 on); Cu $1.25/lb (1981
on)Exchange rate ($CDN per $1.00 U.S.) $1.11 (1981-89); $1.05 (1990 on) Mining cost per tonne mined $0.96 Capital cost $221 million
In July 2003, Andris Kikauka, P.Geo. on behalf of Fundamental Resources Limited visited the Red Bird property and quarter split and sampled 101 metres of drill core from holes 79-95 and 79-96 (Kikauka, 2004). These holes were drilled to the north and cut through the steep dipping Main zone that occurs along the northern contact of the quartz monzonite porphyry stock. A total of 21 samples (all 5 metre lengths except one 1 metre length) were submitted for 47 element ICP analysis. This work was done by ALS Chemex laboratories in Vancouver, B.C., a reputable and well established analytical laboratory. This resampling of core confirmed the MoS2 grades reported by Craigmont Mines Limited in their drilling logs for these holes. It also confirmed the concentric zonation of higher Mo values within the contact zone of the stock and increasing Cu values in the biotite hornfels surrounding the stock. The ICP analyses also showed elevated strontium-rubidium-cerium values possibly associated with the occurrence of apatite and to a lesser extent, rutile and sphene. In addition to resampling core, Kikauka submitted two samples from drill hole 79-95 to Vancouver Petrographics for analysis. During the 2006 field season Scott Geophysics Ltd. was contracted to complete a limited Induced Polarization (IP) study and Magnetometer survey on the Red Bird Property (Scott, 2006). A total of 6.7 km of IP and Magnetometer survey was completed on six north-south lines (see Giroux, et. al. 2007). Also during the 2006 field season soil geochem samples were taken at 50 m spacing along the lines used for the geophysical surveys. A total of 143 soil samples were collected and run for 30 element ICP. A 500 gram sample was digested with 3 ml of agua regia and diluted to 10 ml with water. This leach is partial for Mn, Fe, Ca, P, La, Cr and Mg and limited for Na, K and Al. The results from the 2005 re-sampling of historic drill core and 2006 drill programs resulted in a 43-101 compliant resource summarized as follows (Giroux, et.al., 2007):
Table 4: Redbird Resource using 2006 drill program
Mo Cutoff Tonnes> Cutoff Grade>Cutoff (%) (tonnes) Mo % Cu % Pounds Mo
Indicated 0.03 43,340,000 0.064 0.066 61,200,000Inferred 0.03 70,480,000 0.058 0.070 90,100,000

11

12
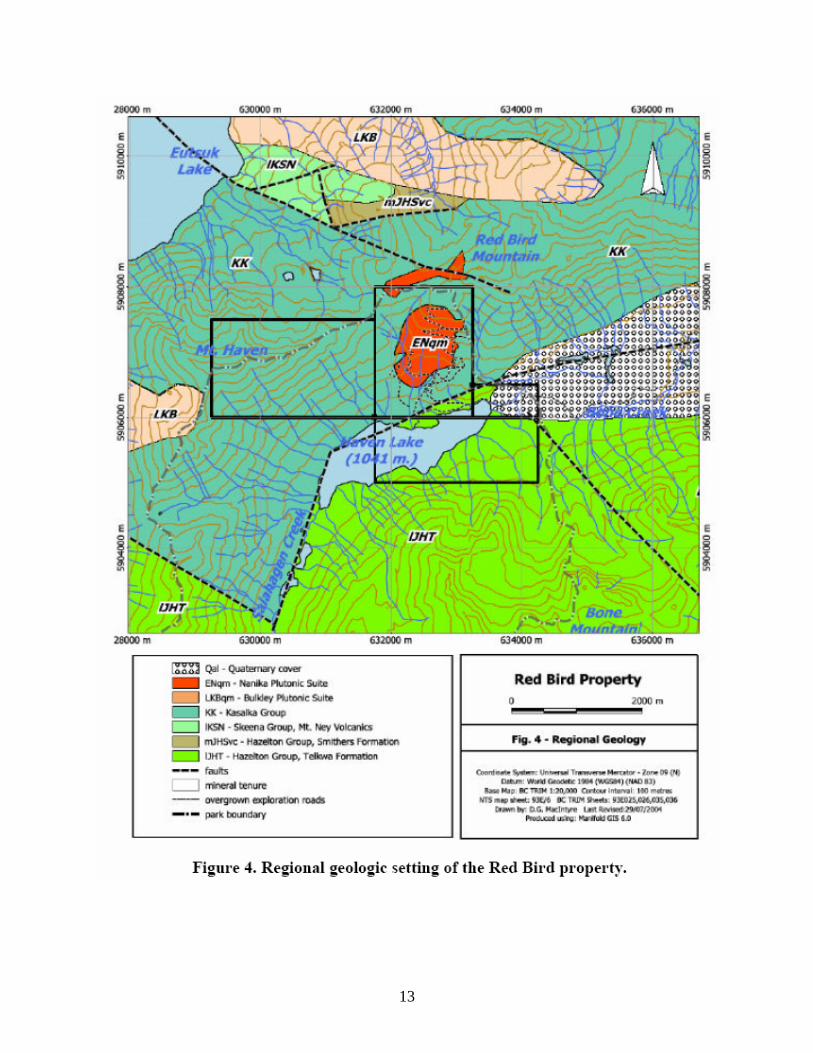
7.0 GEOLOGICAL SETTING The regional geologic setting of the Red Bird property, taken from the most recent British Columbia Geological Survey compilation (Massey et. al., 2003), is shown on Figure 4. The principal geologic units shown on this map are summarized in Table 5. As discussed previously, the Red Bird deposit is associated with an Eocene quartz monzonite porphyry stock that intrudes predominantly pyroclastic volcanic rocks. These rocks have been mapped as part of the Upper Cretaceous Kasalka Group. A major east to southeast trending fault along Bone and Salahagen creeks juxtaposes Kasalka Group rocks against older Lower Jurassic volcanic rocks of the Telkwa Formation. Uplifted fault blocks north of the property apparently contain Middle Jurassic Smithers Formation and Lower Cretaceous Skeena Group volcanic rocks. These fault blocks are in contact with an east trending quartz monzonite stock that is correlated with the Late Cretaceous Bulkley Plutonic Suite. Although the writer did not do any mapping in the vicinity of the deposit, examination of drill core suggests that the quartz monzonite porphyry is intruding Telkwa Formation tuffs and not the younger Kasalka Group. The latter is characterized by hornblende-feldspar phyric andesite flows and lahars and these lithologies were not observed in the drill core examined by the writer. On the other hand, lapilli and lithic tuffs in the drill core are typical of lithologies that characterize the Telkwa Formation.
Table 5 Table of Formations
Unit ID Age Unit Name Description ENqm EOCENE NANIKA
PLUTONIC SUITE quartz monzonite porphyry
LKB LATE CRETACEOUS
BULKLEY PLUTONIC SUITE
quartz equigranular hornblende quartz diorite monzonite, biotite-
KK UPPER CRETACEOUS
KASALKA GROUP hornblende-feldspar porphyritic andesite flows and related pyroclastics, lahars, debris flows, breccias and epiclastic beds
lKSN LOWER CRETACEOUS
SKEENA GROUP -MT. NEY
VOLCANICS
basalt to andesite flows; lesser dacite flows, bladed-feldspar porphyry, tuff, breccia and conglomerate
mJHSvc MIDDLE JURASSIC HAZELTON GROUP -
SMITHERS FORMATION
lapilli tuff, accretionary tuff
lJHT LOWER JURASSIC HAZELTON GROUP -TELKWA
FORMATION
maroon, green and purple subaerial andesitic to dacitic feldspar phyric flows, pyroclastic and epiclastic rocks, augite phyric to aphyric basalt, breccia, welded tuff
The quartz monzonite porphyry that hosts the Red Bird Deposit is an elliptical intrusion roughly 1300 metres long and up to 900 metres wide (Figure 4). Drill intersections indicate that the northern contact of the stock dips steeply inward at an angle between 60 and 70 degrees.
13

14
The contact with the surrounding volcanic rocks is generally sharp but alternating intervals of tuff and porphyry in the drill core suggest numerous offshoots of the main body extend into the surrounding rocks. Volcanic rocks in contact with the stock have been metamorphosed to biotite hornfels. Biotite from the main quartz monzonite porphyry stock has given K-Ar isotopic ages of 49.0+/-4.0 Ma and 50.0+/-4.0 Ma (Carter, 1981). These ages have been revised to 49.7+/- 4.0 Ma and 50.7+/-4.0 Ma using the current IUGS decay constants for K-Ar isotopic dating (Breitsprecher and Mortensen, 2004). Based on age and lithology this stock is correlated with the Eocene Nanika Plutonic Suite. The semi-circular intrusion just north of the property is also mapped as part of the Nanika Plutonic Suite. Several younger dykes cut the main quartz monzonite porphyry stock. These were recorded as felsite, rhyolite, feldspar porphyry, and andesite in the Craigmont drill logs. Only the andesite is clearly post-mineral. 8.0 DEPOSIT TYPE The Red Bird deposit is classified as a low F type porphyry molybdenum deposit (L05) by the British Columbia Geological Survey Branch (Sinclair, 1995). The definitive geological characteristic of this deposit type is the occurrence of molybdenite bearing quartz veinlet stockworks and fractures in high level, K-feldspar-biotite or quartz-sericite-+/-kaolinite altered, intermediate to felsic intrusive rocks and associated country rocks. Intrusions are often multi-phase calcalkaline bodies that range from quartz monzonite to granite in composition. The Eocene Nanika Plutonic Suite is predominantly quartz monzonite in composition and the source magmas are interpreted to be calc-alkaline in composition. The generally accepted genetic model for this deposit type is one in which large volumes of high pressure, highly saline magmatic fluids transport Mo and other metals from a crystallizing and differentiating magma into zones of intense fracturing and brecciation in the outer carapace of the source intrusion and, to a lesser extent, into surrounding country rock. Some examples of this deposit model and their grades and tonnages are listed in Table 6.
Table 6 Some examples of Porphyry Mo (Low F Type) deposits
Deposit Location Size Grade
(million tonnes) %Mo Adanac B.C. 94 0.094 Kitsault B.C. 108 0.115 Glacier Gulch B.C. 125 0.151 Endako B.C. 336 0.087 Red Mountain Yukon 187 0.100 Thompson Creek Idaho 181 0.110 Quartz Hill Alaska 793 0.091 Compaccha Peru 100 0.072
Source: Sinclair, 1995.

15
9.0 MINERALIZATION Exploratory work to date has shown that the Red Bird deposit is comprised of three zones of molybdenum concentration referred to as the Main, Southeast and Southwest zones (Figure 3). These zones occur in the outer margin of an elliptical quartz monzonite stock and adjacent wall rocks and are characterized by the occurrence of molybdenite in quartz veinlets with the best grade found in banded veins where molybdenite is concentrated along the vein walls. According to Sutherland Brown (1966) several generations of veins are present suggesting repeated episodes of fracturing and escape of magmatic fluids during crystallization and differentiation of the quartz monzonite stock. Beyond the main zones of molybdenite concentration there is an increase in the number of barren quartz veinlets interspersed with veinlets that contain pyrite and molybdenite. Craigmont did not sample core from the central part of the stock even though molybdenite bearing quartz veinlets are clearly visible in the core. It appears that their focus was the zone of molybdenite concentration found in the contact zone of the stock. Quartz veinlets and fracture coatings within biotite hornfels near the stock contact also contain significant amounts of molybdenite, chalcopyrite and pyrite. Within the Biotite hornfels that surrounds the stock, quartz veinlets and pyritic fracture coatings have sericitic alteration envelopes, generally on the order of 1 to 2 centimetres in width. Minor galena, sphalerite, fluorite and calcite has also been reported but was not observed in the drill core examined by the writer. In the main zones of molybdenite concentration at least three generations of barren quartz veins are recognized, all of which predate mineralized veins. At least three stages of quartz-molybdenite-pyrite mineralization are also recognized with the most prominent and economically important being banded quartz veinlets that locally have a drusy texture. A final stage of quartz veinlets with minor pyrite may also be present (Sutherland Brown, 1966). The Red Bird deposit is also reported to contain coarse grain apatite, minor rutile and sphene. Calcite is present in the quartz veins (natural acid buffer) and the Red Bird porphyry molybdenite deposit contains low total sulphide (approximately 0.5-1.5%). Lower total sulphides result in less acid rock drainage from mine waste compared to high sulphide tailings. In addition to naturally buffered mine waste, the Red Bird molybdenite deposit contains relatively low As, Bi, Cd, Pb, and/or Sb values, which if present in appreciable quantity, could devalue the concentrate.

16
Figure 5. Craigmont drill hole plan showing significant MoS2 intersections. 10.0 EXPLORATION In 2007, a total of 130 soil samples were taken at 50 m intervals along 6.5 km along north trending grid tie-lines (spaced 200 m apart) covering the 2006 geophysical IP survey cut lines. Soil samples were taken with a grub-hoe from a depth of 20-35 cm. The soil horizon is fair to moderately well developed in the grid area and the soil sample material is considered ‘B’ horizon with the exception of soil samples taken above tree line which are considered ‘C’ horizon (talus fines or weathered parent material). Soil samples were placed in marked kraft envelopes and

17
shipped to Pioneer Labs, Richmond, B.C element ICP geochemical analysis and subsequent assay for Mo. Select higher grade soils were re-sampled and 10 soil samples were shipped to ALS Chemex Labs, N Vancouver, BC for 48 element ICP (see Table 7). Lines were surveyed with Garmin C60 GPS, hip chain and compass. Flagging and aluminium tags were used to mark stations at 50 m intervals. Slope correction distance was adjusted with the use of clinometer readings.
Table 7 Duplicate geochem samples sent to Pioneer and Chemex
Grid Coordinates Pioneer
Assay (Mo)
Chemex Assay (Mo)
Pioneer Assay (Cu)
Chemex Assay (Cu)
10600E 10150N .541 % .212 % .125 % .146 % 10600E 10200N .103 % .095 % 10600E 10250N .298 % .194 % .074 % .088 % 10600E 10300N .087 % .043 % 10600E 10350N .221 % .250 % .098 % .088 % 10600E 10400N .240 % .269 % .089 % .071 % 10600E 10450N .221 % .258 % .107 % .106 % 10600E 10500N .114 % .157 % 10600E 10550N .334 % .332 % .087 % .146 % 10600E 10600N .291 % .272 % .055 % .054 %

18
Figure 6: 2007 Soil sample results for Mo and Cu at Red Bird

19
11.0 DRILLING 11.1 Historic Drilling (from MacIntyre, 2005) As described in a previous section, Phelps Dodge Corporation and Ashfork Mines Limited, a subsidiary of Phelps Dodge completed 75 drill holes on the Red Bird property totaling 17,637 metres between 1963 and 1968. These core boxes are currently stacked at the eastern edge of an overgrown clearing approximately 150 metres northeast of the old camp site. Core boxes have lids and are bound with wire. Each box has an embossed aluminum tag identifying the hole and core interval contained in the box. The writer did not examine the Phelps Dodge/Ashfork core and there are no drill logs or analytical reports available for this drilling.
Figure 7: Drill hole section 10200 E, Main Zone. See Figure 5 for section location. Craigmont Mines Limited drilled an additional 13,941.40 metres in 58 holes between 1979 and 1980. This core is currently stored in a core rack next to the Phelps Dodge/Ashfork core

20
described above. Although the core rack is tilted and many of the core boxes are wedged in and cannot be extracted without repairing the core rack, most boxes have metal tags that identify the drill hole and sample interval. Hand written drill hole logs describing the rock type, mineralization, sample numbers, sample interval and percent MoS2 and Cu are available for all of the drill holes completed by Craigmont. Figure 5 shows the location of drill holes and results of the Craigmont drilling. Figures 7, 8 and 9 are drill sections through the Main, Southwest and Southeast zones respectively. The location of these sections is shown on Figure 5. The writer generated Figures 5 and 10 to 12 by converting handwritten drill hole logs to digital format, plotting the drill holes as 3D lines in AutoCad using a plotting script program and importing the line and attribute data for each drill hole into Manifold GIS 6.0 for presentation.
Figure 8: Drill hole section 9800N, SW zone. See Figure 5 for section location.

21
Figure 9: Drill hole section 9700N, SE zone. See Figure 5 for section location.
11.2 2006 DRILL PROGRAM
The 2006 drill program was carried out under the management of ResourceEye Services Inc. of Mission, B.C. The program consisted of the completion of 7 core holes for an aggregate length of 1,943 metres during the period July – August, 2006. Ron Parent, P. Geo., President and Chief Geologist of ResourceEye was the QP responsible for the program under contract to Torch River Resources for the period of time covered by the program. The following table provides location and orientation information pertinent to the holes from the program. Details are provided in Giroux, et. al., 2007.

22
Table 8 List of 2006 Drill Holes
hole_id utm_E_NAD83 utm_N_NAD83 elevation true_azimuth Inclination total_depth
Main Zone RB06-132 632792.594 5907362.402 1,515.22 0 -65 443.50RB06-133 632402.348 5907353.605 1,486.48 354 -60 434.30
Southeast Zone RB06-134 632818.5 5906822.63 1,285.83 81 -70 142.60RB06-135 633002.11 5906836.8 1,311.62 90 -70 243.80
Southwest Zone RB06-136 632142.96 5906947.021 1,285.65 0 -45 167.03RB06-137 632138.96 5906947.255 1,284.05 310 -45 250.20RB06-138 632138.359 5906915.445 1,286.53 268 -55 261.52
11.3 2007 DRILL PROGRAM
In 2007 Torch River Resources Ltd completed an exploration program on Red Bird Mo-Cu porphyry Main Zone west extension. Diamond drilling was contracted (Neill’s Mining Ltd, Victoria, BC) and a total of 8,679 ft (2,645.4 m) of NQTW core drilling was carried out from July to September 2007. A total of 10 drill holes (DDH 139-148) were collared from 2 sites located on the east side of Big Creek in an area where the west extension of the Main Zone molybdenite mineralization occurs (see Figure 10). In part due to rugged terrain, no previous diamond drilling had been carried out this area of Big Creek. There is no road access to these 2 drill sites and a helicopter was used to move the drill. Core sampling and logging of DDH 139-148 was supervised by Andris A Kikauka, P.Geo. A total of 1,310 split core samples taken were systematically split at 2 meter intervals for all core. The remaining 1/2 split core was returned to the box as an oriented specimen and placed back in marked core boxes. After the core was examined, photographed, and split, core boxes were labelled and stored. The core boxes were cross-stacked >1 m high for storage. Split core samples were placed in marked poly bags and shipped to Pioneer Labs, Richmond, BC for 30 element ICP geochemical analyses, and samples that exceeded 2,000 ppm Mo were assayed. Split core samples exceeding 1,000 ppm Mo underwent geochemical analysis for Re (Chemex Labs, N. Vancouver, B.C.). A total of 131 split core samples were tested by Pioneer Labs Inc for specific gravity (every tenth sample).
Geological and geochemical data compilation has identified areas of interest, whereby potential exists for discovering additional economic concentrations of molybdenite close to the marginal phase of the Nanika quartz monzonite along its contact with the Telkwa Formation intermediate-felsic volcanic rocks. This is where the main zone of known molybdenite mineralization occurs. Molybedenite and chalcopyrite mineralization encountered in the Main Zone West Extension is related to a zone of stockwork quartz-carbonate-(anhydrite-Kspar) veining along a porphyritic quartz monzonite/hornfels andesite contact. The geology of the Main Zone West Extension is similar to the Main Zone mineralization located about 500 m to the east. The following table lists survey data for 2007, Torch River Res drilling (UTM easting and northing taken using a Garmin 60Cx GPS- NAD 83 datum).

23
5906500N5906500N
5906750N5906750N
5907000N5907000N
5907250N5907250N
5907500N5907500N
5907750N5907750N
5908000N 5908000N
632000E
632000E
632250E
632250E
632500E
632500E
632750E
632750E
633000E
633000E
633250E
633250E
63-1
63-10
63-11
63-12
63-2
63-3
63-4
63-5
63-6 63-7
63-8
63-9
64-13
64-14
64-15
64-16
64-17
64-18
64-19
64-20
64-21
64-22
64-23
64-24 64-25
64-26
64-27
65-28
65-29
65-30
65-31
65-32
65-33
65-34
65-35
65-36
65-37
65-38
65-38
65-40
65-41
65-42
65-44
65-45
65-46
65-47
65-48
65-49
65-50
65-51
66-52
66-53
66-54
66-55
66-56
66-57
66-58
66-59
66-60
66-61
66-62
66-63
66-64
66-65
66-66
66-66
66-67
66-68
66-69
66-70
66-71
66-72 79-100
79-101
79-102
79-103
79-104
79-105
79-106
79-107 79-73
79-74
79-75
79-76
79-77
79-78
79-79
79-80 79-81
79-82
79-83
79-84
79-85
79-86
79-87
79-88
79-89
79-90
79-91 79-92
79-93
79-94
79-95
79-96
79-97
79-98
79-99
80-108 80-109
80-110 80-111
80-112 80-113
80-114 80-115
80-116
80-117 80-118
80-119
80-120
80-121
80-122 80-123
80-124
80-125
80-128
80-129
80-130
80-131
RB06-132
RB06-133
RB06-134 RB06-135
RB06-136 RB06-137
RB06-138
N
DDH-139
DDH-140
DDH-141
DDH-142
DDH-143
DDH-144
DDH-145
DDH-146
DDH-147
DDH-148
MAIN ZONE
SW ZONE
SE ZONE
2006 Drill Holes2007 Drill Holes
0 250 500 m
Scale
Figure 10: Redbird Drill Hole Plan showing 2006 holes in red and 2007 holes in green.
24
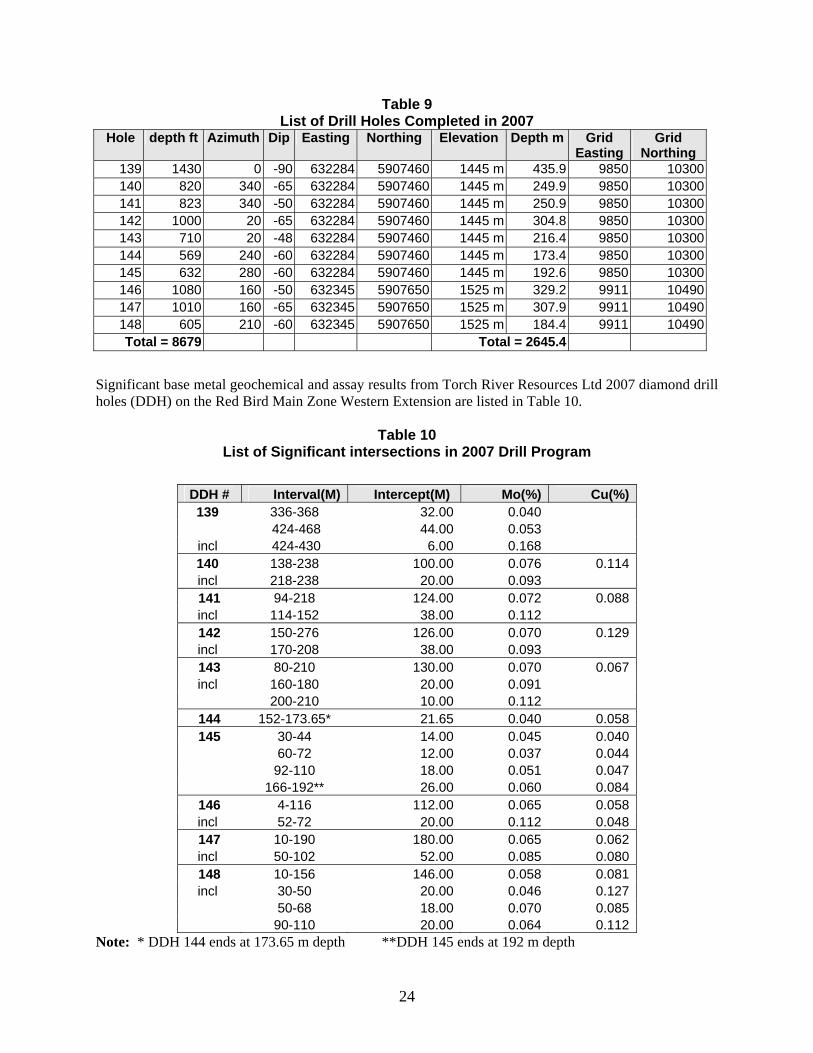
Table 9 List of Drill Holes Completed in 2007
Hole depth ft Azimuth Dip Easting Northing Elevation Depth m Grid Easting
Grid Northing
139 1430 0 -90 632284 5907460 1445 m 435.9 9850 10300140 820 340 -65 632284 5907460 1445 m 249.9 9850 10300141 823 340 -50 632284 5907460 1445 m 250.9 9850 10300142 1000 20 -65 632284 5907460 1445 m 304.8 9850 10300143 710 20 -48 632284 5907460 1445 m 216.4 9850 10300144 569 240 -60 632284 5907460 1445 m 173.4 9850 10300145 632 280 -60 632284 5907460 1445 m 192.6 9850 10300146 1080 160 -50 632345 5907650 1525 m 329.2 9911 10490147 1010 160 -65 632345 5907650 1525 m 307.9 9911 10490148 605 210 -60 632345 5907650 1525 m 184.4 9911 10490Total = 8679 Total = 2645.4
Significant base metal geochemical and assay results from Torch River Resources Ltd 2007 diamond drill holes (DDH) on the Red Bird Main Zone Western Extension are listed in Table 10.
Table 10
List of Significant intersections in 2007 Drill Program
DDH # Interval(M) Intercept(M) Mo(%) Cu(%) 139 336-368 32.00 0.040
424-468 44.00 0.053 incl 424-430 6.00 0.168 140 138-238 100.00 0.076 0.114 incl 218-238 20.00 0.093 141 94-218 124.00 0.072 0.088 incl 114-152 38.00 0.112 142 150-276 126.00 0.070 0.129 incl 170-208 38.00 0.093 143 80-210 130.00 0.070 0.067 incl 160-180 20.00 0.091
200-210 10.00 0.112 144 152-173.65* 21.65 0.040 0.058 145 30-44 14.00 0.045 0.040
60-72 12.00 0.037 0.044 92-110 18.00 0.051 0.047 166-192** 26.00 0.060 0.084
146 4-116 112.00 0.065 0.058 incl 52-72 20.00 0.112 0.048 147 10-190 180.00 0.065 0.062 incl 50-102 52.00 0.085 0.080 148 10-156 146.00 0.058 0.081 incl 30-50 20.00 0.046 0.127
50-68 18.00 0.070 0.085 90-110 20.00 0.064 0.112
Note: * DDH 144 ends at 173.65 m depth **DDH 145 ends at 192 m depth

25
DDH 140-144 and 148 intersected a relatively higher Cu/Mo ratio than the other drill holes. Zones of chalcopyrite mineralization are principally hosted in hornfels andesite tuff/flows and to a lesser extent, porphyritic quartz monzonite. DDH 139, 146, & 147 intersected short intervals of hornfels, andesite, tuff/flows and mostly consisted of porphyritic quartz monzonite host rock. With a higher proportion of intrusive host rock, in DDH 139, 146, & 147 the Cu/Mo ratios were much lower than the other drill holes and the principal mineralization encountered was molybdenite with lesser chalcopyrite. All drill holes contained variable amounts of pyrite-chalcopyrite-molybdenite mineralization associated with quartz-carbonate-(anhydrite and K-feldspar) stockwork veining. The Red Bird Mo-Cu porphyry is known to contain trace amounts of rhenium (Re) associated with molybdenite mineralization and to a lesser extent chalcopyrite, and rare bornite. The first drill hole drilled in 2006 (RB-06-132) was analyzed in detail (sample width @ 2 m. or 6.56 ft. for each of the 58 samples analyzed) for rhenium corresponding to the section which returned the best zone of molybdenite mineralization giving the following results:
DDH No. From To Interval Zone Name Mo Re RB-06-132 270 m.
(885.8 ft.) 386 m. (1,266.4 ft.)
116 m. (380.6 ft.)
Main 0.137 % 0.128 g/t
Rhenium geochemical analysis of 47 core samples were carried out on selected 2007 drill core intervals (94 of 2,645.4 meters). The two highest interval results were as follows:
DDH No. From To Interval Zone Name Mo Re RB-07-139 392 m 394 m 2 m Main-NW 0.389 % 0.397 g/t
RB-07-146 58 m 60m 2m Main-NW 0.308 % 0.295 g/t
From the total 47 samples (each sample being a 2 metre interval), the selected samples (>0.1% Mo) returned an average geochemical analysis value of 125 ppb Re or 0.125 grams/tonne Re. 12.0 SAMPLING METHOD AND APPROACH There is little information available concerning the sampling method and approach employed by Phelps Dodge and Ashfork Mines Limited during the first phase of drilling on the Red Bird property. Drill hole logs for the Craigmont drilling indicate that the core was sampled at 5 metre intervals although not all core was split and sampled. The 1979 drill holes were drilled at an angle to the north to intersect the Main zone at various depths. The 1980 drill holes were drilled at an angle to the west to intersect the Southwest and Southeast zones.

26
As an independent check on the grades reported in the Craigmont drill logs, D. MacIntyre collected several core samples during a visit to the property on July 7 and 8, 2004. A total of 11 samples were submitted to Eco-Tech Laboratory Limited, Kamloops, B.C., a certified analytical facility, for 28 element ICP analysis. Five grab samples of core from drill holes 79-84, 79-89 and 79-90 plus random chip samples from six 5 metre intervals in drill hole 79-93 were analyzed. In the summer of 2005 a re-sampling program was undertaken by A. Kikauka on behalf of Torch River Resources. The quality of data is good for DDH 73-131 (BQ core drilled for Craigmont-Placer Dome, 197-80). The drill logs written by J.Murphy and N. Vollo for Craigmont in 1979-80 are of good quality (lithology, alteration, structure and mineralization correlate well with assay results). The core was well stored and relatively undisturbed and Torch River Resources Ltd carried out a resample of 1,569 previously assayed for MoS2, split core samples. The core was laid out and checked with old drill logs and photographed with a high resolution digital camera. Phelps Dodge (1964-660 and Craigmont (1979-80) did not analyze for copper or silver. The molybdenum zone appears to be best developed in the white-grey coloured Eocene porphyritic quartz monzonite near the outer edges of the stock. The copper is best developed in the dark green-black Lower Jurassic intermediate-felsic tuff/hornfels which hosts the 1.0 to 1.3 km (elongated, circular) quartz monzonite stock. 2006 Drill Program The sampling method used to process the NQ (47.6 mm diameter) core samples received from the drill site consisted of the following series of steps once the core was transported to the core shack from the drill:
1. The core depth markers were converted to meters and the boxes of core are marked with the interpreted depths of tops and bottoms of each run.
2. The core was logged by the geologist and marked for sampling. All sample intervals are 2 m or less. Sampled intervals are restricted by unique rock types. As most of the cored material consisted of quartz monzonite, > 95% of the samples obtained during the program were 2 m in length.
3. Prior to sampling the core was photographed in dry and wet state by digital camera. 4. The core was marked for sawing and cut along its axis using an electrical diamond bladed
core saw. One half of the sample was returned to the box, the other half was bagged for shipment to the assay lab. One in every ten samples had its second half submitted for assay as a quality control sample Duplicate for QC_QA purposes.
5. A sample tag with two perforated duplicate numbered tags was filled out for each sampled interval. The original tag from the booklet was filed in a file folder at the field office. A copy was stapled to the inside of the core box and the other copy is put into the bag with the cut half of the sample. A record of the sample number and interval is also recorded in the sample log book.
6. The sample was then put into the sample bag along with the appropriate sample tag. The sample id and drill hole id and interval was written on the outside of the sample bag. The bag was then sealed with a plastic zip tie strap.
7. After sampling, the remaining core was photographed once again in dry and wet state by digital camera. The box was then closed securely and stacked in the core storage area.

27
2007 Drill Program Torch River Resources Ltd 2007 diamond drill core sampling and logging was performed by contract (Mr. A. Kikauka, P.Geo., Geofacts Consulting, Sooke, BC). Sampling methods for DDH 139-148 are described as follows: Diamond drill core boxes from the 10 drill holes were transported via helicopter to camp and laid out in sequence for visual inspection and photographic record. Geological and mineralogical data was recorded with visual observations in the form of drill log. The core was laid out in a manner whereby data for variance in mineral, alteration and structure could be recorded. The core depth markers were converted to meters and the boxes of core are marked with the interpreted depths of tops and bottoms of each run. The core was logged by the geologist and marked for sampling. All sample intervals are 2 m or less. Prior to sampling the core was soaked with water and photographed by digital camera. Prior to splitting core, the RQD (rock quality determination) was estimated as a percentage of pieces of core that exceeded 10 cm over a 2 metre run. 13.0 SAMPLE PREPARATION, ANALYSES AND SECURITY No original analytical certificates are currently available for either the Phelps Dodge/Ashfork or Craigmont Mines Limited drilling and the identity of the analytical laboratories that did the analyses is unknown. Presumably the analytical work was done by a reputable laboratory following best practices applicable at the time. Resampling of the Craigmont drill core by Kikauka (2004) and check samples collected by D. MacIntyre were analyzed by reputable analytical laboratories and confirm the values recorded in the Craigmont drill hole logs. Check samples collected by the MacIntyre were placed in labeled plastic bags and shipped to the Eco-Tech Laboratory via Greyhound Courier Express. No duplicate check samples were submitted due to the small size of the sample shipment. A 2005 program of geological and geochemical data was supervised by Mr. Andris Kikauka, P. Geo. on behalf of Torch River Resources Limited. A total 50 out of 58 diamond drill holes were re-logged and re-sampled. The diamond drilling was carried out during 1979 & 1980 by Craigmont Mines Ltd. (DDH 79-73 to DDH 80-131 for a total of 58 drill holes). All of the drill holes were re-sampled with the exception of the following holes which were not present in the core racks: DDH 79-84 to 86, 102, & 104 and DDH 80-126, 127. Samples were taken from 50 drill holes ranging in length from 1-10 meters and ranging from 7 to 66 samples per drill hole (mean value of 29.58 samples per drill hole). The drill core boxes were specifically designed to contain exactly 5 meters of core per box, thus most of the sampling was done in 5 meter intervals. Using a Nikon high resolution digital camera, hole ID and intervals (15 meter lengths) were recorded on photo by Brendan O’Leary. The split core intervals of all 50 drill holes were re-sampled to replicate Craigmont Mines diamond drill records (by J.D. Murphy and N.B. Vollo, 1979-80). Labelled (including from-to length in meters) plastic 12 X 20 inch bags and zap straps were used to ship each individual split core sample. All samples were shipped to Pioneer Labs for multi-element geochemical analysis. Rejects are stored and available for future geochemical and/or metallurgical work.

28
2006 Drill Program Samples were transported securely to the lab from the site in the following manner:
• Haven Lake to Burns Lake via Ootsa Air Ltd. in a Beaver aircraft. • Burns Lake to Pioneer Laboratories facilities in Richmond, BC via Bandstra
Transportation Systems of Smithers, BC. Pioneer Laboratories Inc. is an accredited British Columbia laboratory located in Richmond, BC. Pioneer Labs routinely performs assays for junior mining companies listed on the various Venture Exchanges. Upon opening the samples at the lab, they are dried at 60 degrees Celsius, then crushed to -4 mesh and riffle split. 250 g of the riffle split crushed rocks is pulverized to 90 % -100 mesh prior to analysis. The samples were subjected to Multi-element ICP Analysis where a .500 gram split of the sample is digested with 3 ml of aqua regia, diluted to 10 ml with water. This leach is partial for Mn, Fe, Ca, P, La, Cr, Mg, and limited for Na, K and Al. Detection Limit for Au is 3 ppm. The sampling, sample preparation, security and analysis were all undertaken by qualified personnel using industry standard and custom developed procedures. Pioneer Laboratories Ltd., of Richmond, BC is a reputable lab that performs analysis for NI 43-101 reporting issuers on a regular basis. ResourceEye Services Inc. has its own internal Quality Management System specially designed to provide additional quality control.
2007 Drill Program
A total of 1,310 split core samples taken were systematically split using screw vice core splitter at 2 meter intervals for all core. The remaining 1/2 split core was returned to the box as an oriented specimen and placed back in marked core boxes. After the core was examined, photographed, and split, core boxes were labelled and stored. The core boxes were cross-stacked >1 m high for storage.
One in every ten samples was replaced with a blank or a standard as a quality control sample for QC_QA purposes. A record of the sample number and interval is also recorded in the sample log book. The sample was then put into the sample bag along with the appropriate sample tag. The sample id and drill hole id and interval was written on the outside of the sample bag. The bag was then sealed with a plastic zip tie strap. After sampling, the core box was then closed securely and stacked in the core storage area.
Split core samples were placed in marked poly bags and shipped to Pioneer Labs, Richmond, BC for 30 element ICP geochemical analyses, and samples that exceeded 2,000 ppm Mo were assayed. Split core samples exceeding 1,000 ppm Mo underwent geochemical analysis for Re (Chemex Labs, N. Vancouver, B.C.). A total of 131 split core samples were tested by Pioneer Labs Inc for specific gravity (every tenth sample).

29
14.0 DATA VERIFICATION As previously mentioned, the original analytical certificates for the drilling done by Phelps Dodge/Ashfork and Craigmont Mines Limited were not available to the writer. In order to verify the grades recorded in the Craigmont drill logs, MacIntyre collected 11 samples of core during a visit to the property July 7 and 8, 2004. Table 11 summarizes the results for Ag, As, Cu, Mo, Pb and Zn plus the corresponding Craigmont MoS2 values for the interval sampled. The analytical results confirm the presence of moderate to high grade Mo in the drill core. Samples of hornfelsed tuff also contained significant Cu (5057 ppm) and elevated Zn (190 ppm) and Ag (10.9 ppm) values.
Table 11 Summary of 2004 results for drill core samples collected from the Red
Bird property
Craigmont Sample Unit Ag As Cu Mo Pb Zn Results
not sampled by 79-90 52.2 m QMP <0.2 <5 55 17 6 20 Craigmont not sampled by 79-89 58.0 m QMP 2.7 35 264 2498 <2 54 Craigmont 79-84 122.2 m QMP 0.4 <5 239 3402 2 9 0.33 MoS2 79-84 131.5 m QMP <0.2 <5 60 3292 4 20 0.23 MoS2 79-84 174.0 m TUFF 5.1 <5 5057 67 <2 133 0.04 MoS2 79-93 290-295 QMP 0.7 <5 484 474 4 43 0.08 MoS2 79-93 295-300 QMP 0.2 <5 330 868 2 10 0.08 MoS2 79-93 300-305 QMP 0.4 5 333 833 6 15 0.14 MoS2 79-93 305-310 QMP 0.4 <5 432 932 2 10 0.08 MoS2 79-93 310-315 QMP/TUFF 5.5 20 937 519 8 61 0.11 MoS2 79-93 315-320 TUFF 10.9 40 2920 186 88 190 0.03 MoS2
All values in parts per million; QMP=quartz monzonite porphyry; TUFF=Biotite hornfelsed tuff In 2005 a total of 1,569 samples were re-assayed by Pioneer Labs. A comparison of 1,554 original Craigmont Mo assays with the 2005 check samples is shown below in Table 12.
Table 12 Comparison of Craigmont Original Mo Assays with 2005 Check samples
Craigmont Mo (%) 2005 Check Mo (%) Number of Assays 1,554 1,554 Mean 0.060 0.053 Standard Deviation 0.047 0.043 Minimum 0.004 0.001 Maximum 0.390 0.489 Coefficient of Variation 0.77 0.81

30
The 2005 results compare well with the original Craigmont assays (see Figure 11). The two data sets have a correlation coefficient of 0.7485 with no indication of sampling bias.
Scatter Plot MO % - 2005 RE-ASSAYS
0.00
0.05
0.10
0.15
0.20
0.25
0.30
0.35
0.40
0.45
0.50
MO% CRAIGMONT
0.00
0.05
0.10
0.15
0.20
0.25
0.30
0.35
0.40
0.45
0.50
MO
% 2005 R
ES
AMP
LE
0.7485 R1554 N
Figure 11: Scatter Plot for Original Craigmont Mo% Assays and 2005 Check samples
2006 QA/QC The quality assurance/quality control program completed in 2006 is described in detail in Giroux, et.al., 2007. The results of the QA/QC checks on the 2006 drilling showed the data was suitable for completing a resource estimate. 2007 QA/QC In 2007, diamond drill core sampling was performed under the supervision of Andris A Kikauka, P Geo. In order to test accuracy and precision of Pioneer Lab results, one in every ten samples was replaced with a blank or a standard. Standards and blanks were obtained from another lab and inserted by the site geologist as a quality control sample for QC_QA purposes. Results from geochemical analysis of 69 standards and 71 blanks show minimal variance, suggesting there was adequate reliability of geochemical analysis results.

31
Blank Samples - Mo ppm
0
2
4
6
8
10
12
14
16
18
20
1 6 11 16 21 26 31 36 41 46 51 56 61 66 71
Sample
Mo
(ppm
)
Mo ppm
Figure 12: Blank Samples assayed for Mo (ppm)
Blank Samples - Cu ppm
0
2
4
6
8
10
12
14
16
18
20
1 5 9 13 17 21 25 29 33 37 41 45 49 53 57 61 65 69
Sample
Cu (p
pm)
Cu ppm
Figure 13: Blank Samples assayed for Cu (ppm)

32
Standard - Mo ppm
600
700
800
900
1000
1100
1200
1300
1400
1500
1 4 7 10 13 16 19 22 25 28 31 34 37 40 43 46 49 52 55 58 61 64 67
Sample
Mo
(ppm
) Mo ppmMean-2SDMeanMean+2SD
Figure 14: Standard assayed for Mo (ppm)
Standard - Cu ppm
3600
3800
4000
4200
4400
4600
4800
5000
1 4 7 10 13 16 19 22 25 28 31 34 37 40 43 46 49 52 55 58 61 64 67
Sample
Cu
(ppm
) Cu (ppm)Mean-2SDMeanMean+2SD
Figure 15: Standard assayed for Cu (ppm)

33
15.0 ADJACENT PROPERTIES There are no significant mineral properties in the vicinity of the Red Bird deposit. Most of the area around the Red Bird property is within Tweedsmuir Park and is not open to mineral exploration or development. 16.0 MINERAL PROCESSING AND METALLURGICAL TESTING The preliminary economic appraisal of the Red Bird property prepared by Farnsworth (1981) references preliminary flotation testwork done by Placer Developments Metallurgical Research Centre in March 1980 (King, 1980). The writer is not aware of any additional historical mineral processing or metallurgical testing done on the Red Bird property since this 1980 test. Key metallurgical parameters as reported by Farnsworth are given in Table 8.
Table 13 Key metallurgical parameters for the Red Bird property
Grinding index 12
Molybdenum recovery estimate 78-80%
Copper recovery estimate 65%
%Cu in Cu concentrate 25%
The test work done by Placer involved seven composite test samples totaling 700 kilograms in weight (King, 1980).

34
17.0 RESOURCE ESTIMATION 17.1 DATA ANALYSIS The data base for this updated resource estimate was composed of historic data from Phelps Dodge drill holes from 1963 to 1966, Craigmont drill hole data from 1979 to 1980, Torch River Resources (“TRR”) re-assay of Craigmont diamond drill core completed in 2005, 7 diamond drill holes completed by TRR in 2006 and an additional 10 diamond drill holes completed by TRR in 2007. The 2007 drill program concentrated on the west side of the Main Zone. There was no additional drilling on the South West or South East Zones. As a result only the Main Zone Resource was updated. A list of the drill holes used for this study is presented below in Table14.
Table 14 Summary of Drilling
YEAR COMPANY DRILL HOLE NUMBERS NUMBER OF HOLES 1963 Phelps Dodge 63-1 to 63-12 121964 Phelps Dodge 64-13 to 64-27 151965 Phelps Dodge 65-28 to 65-51 241966 Phelps Dodge 66-52 to 66-70 191979 Craigmont 79-73 to 79-107 351980 Craigmont 80-108 to 80-125, 80-128 to 80-
131 22
2006 Torch River Resources RB06-132 to 138 72007 Torch River Resources DDH-139 to 148 10 TOTAL 144 The historic assays used for the estimate were ranked as follows. If the Craigmont hole was re-assayed in 2005 this assay was used. For Craigmont holes samples not re-assayed the Craigmont MoS2value was converted to Mo (Mo = MoS2 * 0.5994)) and used. For Phelps Dodge holes the MoS2 assay was converted to Mo and used. Where drill holes penetrated the 3D mineralized solids and were not assayed a value of 0.0001 % Mo and 0.001% Cu was inserted. The statistics for the assays used in the resource estimate are shown below in Table 15.
Table 15 Summary statistics for Mo, Cu and Ag assays used for estimate
Mo (%) Cu (%) Ag (g/t) Number of Assays 4,969 4,581 3,733 Mean 0.037 0.058 2.10 Standard Deviation 0.048 0.080 6.24 Minimum 0.0001 0.001 0.15 Maximum 1.441 0.914 100.0 Coefficient of Variation 1.29 1.38 2.97

35
The distribution of Mo grades was evaluated using a lognormal cumulative distribution plot and 5 overlapping lognormal populations were identified. The statistics for each is presented below in Table 16.
Table 16 Summary statistics for Mo Populations
Population Mean Mo (%) Proportion of Total Number of Samples
1 0.435 0.17 % 6 2 0.161 1.31 % 44 3 0.101 4.85 % 162 4 0.034 71.42 % 2,380 5 0.001 22.25 % 740
Population 1 represented by 0.17 % of the total data and extending to a high of 1.44 % Mo, can be considered erratic high grade. A threshold of 2 standard deviations above the mean of population 2 can be used to cap these erratic grades. A total of 10 samples were capped at 0.33 % Mo. A similar procedure was used for copper and again the upper population was considered erratic high grade. A capping level of 2 standard deviations above the mean of population 2 was used to cap 12 copper assays at 0.49 % Cu.
17.2 GEOLOGIC MODEL The historic drill hole data was converted from mine grid to UTM coordinates and adjusted to fit current surface topography. The 2007 drill holes were added and a new geologic solid generated to constrain the mineralization. (see Figure 16).

36
Figure 16: Isometric plot showing geologic mineralized solid and drill holes 17.3 COMPOSITES The drill holes were “passed through” the geologic solid with the points at which the drill holes entered and exited the solid marked. Uniform down hole 5 m composites were formed that honoured these boundaries. Composites that were less than 2.5 m in length were combined with adjoining samples to produce a uniform support of 5 ± 2.5 m. A summary of statistics for the 5 m composites is presented below.
Table 17 Summary statistics for Mo and Cu in 5 m Composites
Mo (%) Cu (%)Number of Samples 3,910 3,215Mean 0.042 0.057Standard Deviation 0.042 0.076Minimum 0.0001 0.001Maximum 0.311 0.486Coefficient of Variation 0.99 1.34

37
17.4 VARIOGRAPHY Pairwise relative semivariograms were produced for the Craigmont and Torch River drill holes numbered 79-73 to 80-131 and RB06-132 to RB07-148 respectively. The Phelps Dodge holes were left out of this analysis due to their procedure of only assaying large composited intervals across the mineralized zones. While this data can be used for estimation it is of no value in determining grade continuity. Semivariograms were produced in both the horizontal and vertical planes to determine the directions of maximum continuity for both Mo and Cu. In all cases nested spherical models were fit to the data. The results are summarized below in Table 18 with semivariograms shown in Appendix 1.
Table 18 Summary of Semivariogram Parameters for Mo and Cu
Variable Direction Co C1 C2 Short Range
(m) Long Range
(m) Az. 90 Dip 0 0.10 0.16 0.14 30 80 Az. 0 Dip 0 0.10 0.16 0.14 20 50
Mo
Az. 0 Dip -90 0.10 0.16 0.14 30 120 Az. 90 Dip 0 0.10 0.18 0.17 20 60 Az. 0 Dip 0 0.10 0.18 0.17 20 60
Cu
Az. 0 Dip -90 0.10 0.18 0.17 20 100 Where Co – Nugget Effect, C1 – Short Range Structure and C2 – Long Range Structure The nugget to sill ratios of 25 % for Mo and 22 % are reasonable and indicate low levels of sampling variability. 17.5 BLOCK MODEL A block model consisting of blocks 20 x 20 x 10 m in dimension was superimposed on the geologic 3 D mineralized solid. The origin of the model is as follows: Lower Left Corner 631900 E 20 m wide 65 columns 5906500 N 20 m long 70 rows Top of Model 2000 Elevation 10 m high 110 levels No Rotation The proportion of each block contained within the mineralized solid and below topography was recorded and only blocks with some proportion within the solid were estimated. Of the total of 242,023 blocks with some proportion below topography 31,721 have some percentage within the mineralized solid.
38
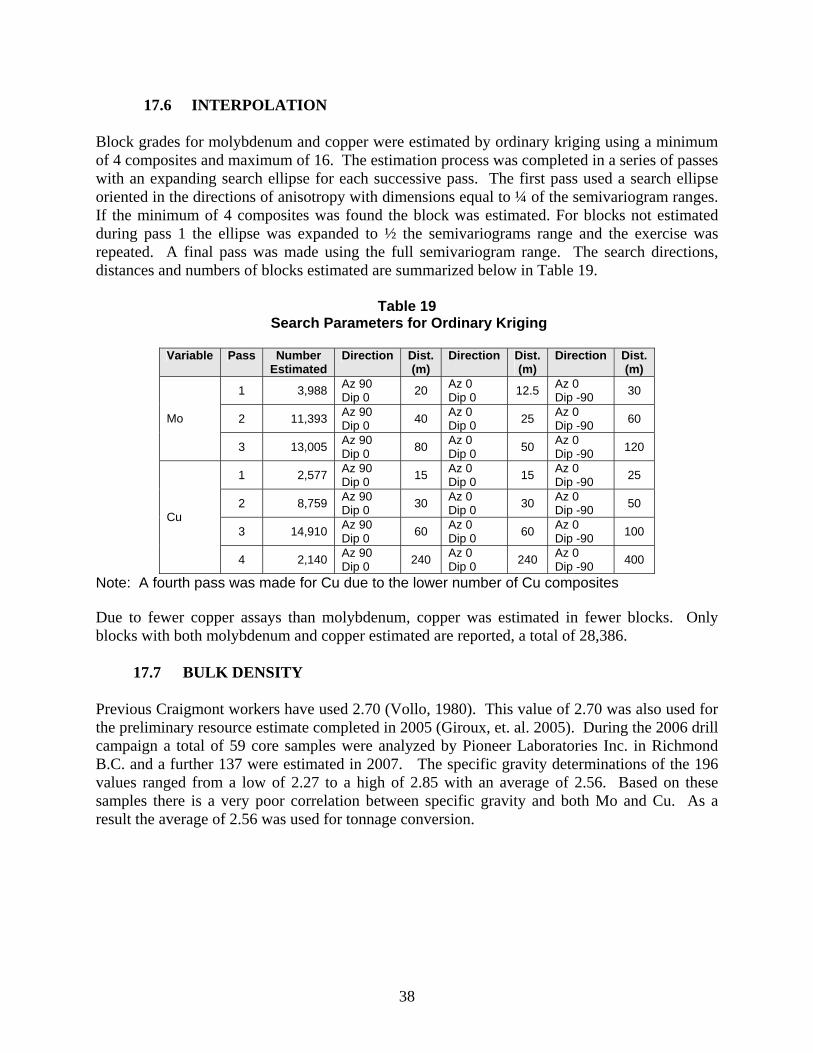
17.6 INTERPOLATION Block grades for molybdenum and copper were estimated by ordinary kriging using a minimum of 4 composites and maximum of 16. The estimation process was completed in a series of passes with an expanding search ellipse for each successive pass. The first pass used a search ellipse oriented in the directions of anisotropy with dimensions equal to ¼ of the semivariogram ranges. If the minimum of 4 composites was found the block was estimated. For blocks not estimated during pass 1 the ellipse was expanded to ½ the semivariograms range and the exercise was repeated. A final pass was made using the full semivariogram range. The search directions, distances and numbers of blocks estimated are summarized below in Table 19.
Table 19 Search Parameters for Ordinary Kriging
Variable Pass Number
Estimated Direction Dist.
(m) Direction Dist.
(m) Direction Dist.
(m)
1 3,988 Az 90 Dip 0 20 Az 0
Dip 0 12.5 Az 0 Dip -90 30
2 11,393 Az 90 Dip 0 40 Az 0
Dip 0 25 Az 0 Dip -90 60 Mo
3 13,005 Az 90 Dip 0 80 Az 0
Dip 0 50 Az 0 Dip -90 120
1 2,577 Az 90 Dip 0 15 Az 0
Dip 0 15 Az 0 Dip -90 25
2 8,759 Az 90 Dip 0 30 Az 0
Dip 0 30 Az 0 Dip -90 50
3 14,910 Az 90 Dip 0 60 Az 0
Dip 0 60 Az 0 Dip -90 100
Cu
4 2,140 Az 90 Dip 0 240 Az 0
Dip 0 240 Az 0 Dip -90 400
Note: A fourth pass was made for Cu due to the lower number of Cu composites Due to fewer copper assays than molybdenum, copper was estimated in fewer blocks. Only blocks with both molybdenum and copper estimated are reported, a total of 28,386. 17.7 BULK DENSITY Previous Craigmont workers have used 2.70 (Vollo, 1980). This value of 2.70 was also used for the preliminary resource estimate completed in 2005 (Giroux, et. al. 2005). During the 2006 drill campaign a total of 59 core samples were analyzed by Pioneer Laboratories Inc. in Richmond B.C. and a further 137 were estimated in 2007. The specific gravity determinations of the 196 values ranged from a low of 2.27 to a high of 2.85 with an average of 2.56. Based on these samples there is a very poor correlation between specific gravity and both Mo and Cu. As a result the average of 2.56 was used for tonnage conversion.

39
17.8 CLASSIFICATION Based on the study herein reported, delineated mineralization of the Red Bird Project is classified as a resource according to the following definition from National Instrument 43-101: “In this Instrument, the terms "mineral resource", "inferred mineral resource",
"indicated mineral resource" and "measured mineral resource" have the meanings ascribed to those terms by the Canadian Institute of Mining, Metallurgy and Petroleum, as the CIM Standards on Mineral Resources and Reserves Definitions and Guidelines adopted by CIM Council on August 20, 2000, as those definitions may be amended from time to time by the Canadian Institute of Mining, Metallurgy, and Petroleum.”
“A Mineral Resource is a concentration or occurrence of natural, solid, inorganic or fossilized organic material in or on the Earth's crust in such form and quantity and of such a grade or quality that it has reasonable prospects for economic extraction. The location, quantity, grade, geological characteristics and continuity of a Mineral Resource are known, estimated or interpreted from specific geological evidence and knowledge.”
The terms Measured, Indicated and Inferred are defined in NI 43-101 as follows: “A 'Measured Mineral Resource' is that part of a Mineral Resource for which
quantity, grade or quality, densities, shape, physical characteristics are so well established that they can be estimated with confidence sufficient to allow the appropriate application of technical and economic parameters, to support production planning and evaluation of the economic viability of the deposit. The estimate is based on detailed and reliable exploration, sampling and testing information gathered through appropriate techniques from locations such as outcrops, trenches, pits, workings and drill holes that are spaced closely enough to confirm both geological and grade continuity.”
“An 'Indicated Mineral Resource' is that part of a Mineral Resource for which quantity, grade or quality, densities, shape and physical characteristics, can be estimated with a level of confidence sufficient to allow the appropriate application of technical and economic parameters, to support mine planning and evaluation of the economic viability of the deposit. The estimate is based on detailed and reliable exploration and testing information gathered through appropriate techniques from locations such as outcrops, trenches, pits, workings and drill holes that are spaced closely enough for geological and grade continuity to be reasonably assumed.”
“An 'Inferred Mineral Resource' is that part of a Mineral Resource for which quantity and grade or quality can be estimated on the basis of geological evidence and limited sampling and reasonably assumed, but not verified,

40
geological and grade continuity. The estimate is based on limited information and sampling gathered through appropriate techniques from locations such as outcrops, trenches, pits, workings and drill holes.”
Due to the lack of detailed assay information on the Phelps Dodge holes and the overall drill hole spacing, none of this resource is presently classed measured . Blocks estimated in pass 1 or 2 using search ellipses up to ½ the semivariogram ranges are classed indicated. The remaining blocks are classed inferred. The results are presented below in Tables 20 and 21 at a variety of Mo % cutoff values to show the effects on tonnes and grade. At this time no economic evaluation has been completed so no economic cutoff can be presented. The 1981 Craigmont study (Farnsworth, 1981), however, used an economic cutoff of 0.05 MoS2 which would equate to a 0.03 % Mo cutoff so this cutoff has been highlighted for reference.
Table 20 2007 RED BIRD INDICATED RESOURCE
Mo Cutoff Tonnes> Cutoff Grade>Cutoff (%) (tonnes) Mo % Cu % Pounds Mo
0.01 113,340,000 0.052 0.063 130,000,000 0.02 102,000,000 0.056 0.066 125,900,000 0.03 88,210,000 0.061 0.068 118,600,000 0.04 68,870,000 0.068 0.068 103,300,000 0.05 50,080,000 0.077 0.070 85,000,000 0.06 35,940,000 0.085 0.068 67,400,000 0.07 23,960,000 0.096 0.066 50,700,000 0.08 17,250,000 0.104 0.065 39,600,000 0.09 12,150,000 0.112 0.065 30,000,000 0.10 8,300,000 0.120 0.067 22,000,000 0.11 5,270,000 0.129 0.065 15,000,000 0.12 3,410,000 0.136 0.065 10,200,000 0.13 1,940,000 0.146 0.071 6,200,000 0.14 930,000 0.158 0.077 3,200,000 0.15 600,000 0.165 0.083 2,200,000

41
Table 21
2007 RED BIRD INFERRED RESOURCE Mo Cutoff Tonnes> Cutoff Grade>Cutoff
(%) (tonnes) Mo % Cu % Pounds Mo 0.01 87,560,000 0.045 0.059 86,900,000 0.02 77,740,000 0.049 0.063 84,000,000 0.03 63,390,000 0.055 0.068 76,900,000 0.04 45,780,000 0.062 0.070 62,600,000 0.05 30,260,000 0.071 0.075 47,400,000 0.06 19,620,000 0.080 0.082 34,600,000 0.07 12,780,000 0.088 0.082 24,800,000 0.08 8,150,000 0.096 0.085 17,300,000 0.09 4,740,000 0.105 0.083 11,000,000 0.10 2,520,000 0.113 0.081 6,300,000 0.11 1,100,000 0.125 0.064 3,000,000 0.12 490,000 0.137 0.064 1,500,000 0.13 310,000 0.145 0.067 1,000,000 0.14 200,000 0.150 0.067 700,000 0.15 92,000 0.155 0.059 310,000
The 2007 drill campaign has resulted in a 103% increase in indicated tonnes at slightly lower grade at a 0.03% Mo cutoff.
Table 22 Summary of Red Bird Resource Estimates
Resource at Indicated Resource Inferred Resource 0.03 % Mo Cutoff Tonnes Mo Tonnes Mo (millions) Mo (%) (million lbs) (millions) Mo (%) (million lbs) 2005 Resource 75.3 0.065 107.9May 26, 2006 Report 2006 Resource 43.3 0.064 61.2 70.5 0.058 90.1Aug. 23, 2007 Report 2007 Resource 88.2 0.061 118.6 63.4 0.055 76.9Dec. 20, 2007 Report
The grade distribution for molybdenum in estimated blocks is presented in a series of level plans in Figures 17, 18 and 19. Kriged blocks are shown colour coded by molybdenum grade. The drill hole composites, also colour coded, are shown projected 20 m above and below the bench presented.


45
18.0 OTHER RELEVANT DATA AND INFORMATION The writer is not aware of any additional sources of information that might significantly change the conclusions presented in this technical report. 19.0 INTERPRETATIONS AND CONCLUSIONS The Red Bird property represents a reasonable molybdenum and copper porphyry target. Historic work completed by Phelps Dodge and Craigmont Mines Ltd. have outlined three deposits that might be developed by open pit mining methods. The data base for Phelps Dodge holes consisted of just cross sections with assay composites shown. The assays and drill hole coordinate information was all available for the Craigmont drill holes. During August 2005, under the direction of A. Kikauka, Craigmont drill core was re-sampled and assayed for molybdenum and copper. Sub-sets of data were also assayed for gold and rhenium. For this resource update the 2005 assays were used where available. Craigmont and Phelps Dodge assays were used where no new data was taken. During the 2006 field season Torch River drilled 7 diamond drill holes; 2 in the Main Zone, 3 in the SW Zone and 2 in the SE Zone. Resource Eye who managed the 2006 drill program also converted all coordinates from a historic mine grid to a UTM grid. During the 2007 field season an additional 10 diamond drill holes were completed from two drill pads on the west flank of the Main Zone. Semivariograms were produced using only Craigmont and Torch River data as the long composites from Phelps Dodge hole would bias the grade continuity. Based on the additional 2007 results for molybdenum the maximum range of continuity was increased in all three directions. Semivariogram ranges for copper remained the same. Ordinary kriging was used to interpolate molybdenum and copper grades into blocks 20 x 20 x 10 m in dimension. The additional data collected in the 2007 drill program expanded the mineralized Main zone to the west and to depth and as a result has significantly increased the indicated resource with a corresponding slight decrease in inferred resource. At a 0.03 % Mo cutoff a total of 88.2 million tonnes averaging 0.061 % Mo and 0.07 % Cu are classed as indicated while an additional 63.4 million tonnes averaging 0.055 % Mo and 0.07 % Cu are classed inferred. At a 0.03% Mo Cutoff the 2007 indicated resource contains a 103 % increase in tonnes and a 94 % increase in contained Mo over the published 2006 resource (Giroux, et.al., 2007). At the same cutoff the 2007 inferred resource shows a decrease of 10 % in tonnes and a 15% decrease in contained Mo.

46
20.0 RECOMMENDATIONS This project has reached the stage where a preliminary economic assessment should be completed. The current resource block model should have one or more pits optimized using reasonable metal prices and costs to determine the economic viability of the project. The existing land package should be examined to determine if sufficient non park land exists to allow for the possible mill site, waste rock and tailings disposal areas. Access to the area should be examined to determine if and where a road could be constructed. Preliminary environmental and social issues should be reviewed. Near surface higher grade mineralized targets in the Main, South-West and South-East zones should be drilled to increase the confidence in potential starter pit areas. The deep extension of the Main zone should also be drilled to increase the indicated resource. Eighteen drill pads have been recommended (14 on the Main Zone, 2 on the SE Zone and 2 on the SW Zone for a total of 7,000 m (22,960 ft.) of diamond drilling in holes from 200 to 500 m deep. Most holes will be vertical, and some holes will be inclined -60 to -70 degree dip (from horizontal). A smaller Longyear 28 drill will be used to drill from 2 proposed helicopter access sites located 150-200 m above the upper road (Main Zone East). These 2 helicopter access sites are at 1595 m. A larger Longyear 38 will be used to drill 12 holes from the Main Zone upper road at 50 m spacing, and 2 holes on SW Zone, and 2 holes on SE Zone. The smaller drill will be moved by helicopter and the larger drill will be moved on skids by the Hitachi excavator on pre-existing road network. The proposed program of diamond drilling will affect 0.0216 hectare and the camp will disturb 0.036 hectare, for a proposed total disturbed area of 0.0576 hectare. The core will be logged, split and stored at Haven Lake camp area. ATV’s are used be used to move core from the road to the camp. COST ESTIMATE
Camp Labour 100,000Assays 45,000Diamond Drilling 800,000Equipment and Supplies 50,000Food and Supplies 30,000Geologist 25,000Insurance 7,500Medical / Safety 20,000Engineering and Reports 20,000Telecommunication 20,000Transportation 200,000Contingency 82,500Sub Total 1,400,000Operator / Management 50,000Preliminary economic assessment 50,000Total $1,500,000

47
21.0 BIBLIOGRAPHY Carter, N.C., 1981, Porphyry Copper and Molybdenum Deposits, West Central B.C., B.C. Ministry of Energy, Mines and Petroleum Resources, Bulletin 64, pp 132-133 Clark, K.J., 1972, Stockwork Molybdenum Deposits in the Western Cordillera of North America, Econ. Geol. Volume 67, pp. 731-758 Farnsworth, D.J.M. 1981, Preliminary Economic Appraisal 93E/6 Redbird Molybdenum Deposit, Haven Lake, B.C., for Craigmont Mines Limited, Craigmont Mines Limited unpublished report. Giroux, G., D.G. MacIntyre, and A. Kikauka, (2006) “Preliminary Resource Estimation on the
Red Bird Porphyry Mo/Cu Deposit”, 43-101 Compliant Technical Report, May 26, 2006. Giroux, G., R. Parent, (2007) “Update Resource Estimation on the Red Bird Porphyry Mo/Cu
Deposit”, 43-101 Compliant Technical Report, August 23, 2007. Kikauka, A. A., 2004, Geological, Geochemical and Petrographic Report on the Red Bird Claim, Red Bird Porphyry Molybdenum Deposit formerly known as CAFB, Old Glory, Haven Lake, B.C., Fundamental Resource Corporation, unpublished company report. King, J.A., 1980. Redbird Property, Report No. 1, Preliminary Flotation Testwork, Placer Development Limited, Metallurgical Research Centre. MacIntyre, D. 2004. Geological Report on the Red Bird Porphyry Molybdenum Property, for Red Bird Resources Ltd. and Fundamental Resource Corporation, Dec. 10, 2004 (posted on SEDAR) Massey, N.W.D., MacIntyre, D.G. and Desjardins, P.J., 2003: Digital Geology Map of British Columbia: Tile NN9 North Coast, B.C. Ministry of Energy and Mines, Geofile 2003-13, scale 1:250,000. Murphy, J.D. and Vollo, N.B. 1979, Craigmont Mines Limited 93E/6 Redbird Molybdenum Diamond Drill Logs 79-73 to 79-107. Murphy, J.D. and Vollo, N.B. 1980, Craigmont Mines Limited 93E/6 Redbird Molybdenum Diamond Drill Logs 80-108 to 80-131. Parent, R. (2006) “Memo re. Preliminary discussion of 2006 Assay Results”, Private Memo from
ResourceEye to Torch River October 30, 2006. Scott, A. (2006) “Logistical report Induced Polarization and Magnetobeter Surveys Red Bird
Property, Skeena Mining Division, B.C.” Private report for Torch River. Sept. 14, 2006

48
Sinclair, W.D., 1995, Porphyry Mo (Low-F-Type) in Selected British Columbia Mineral Deposit Profiles, Volume 1 – Metallics and Coal, Lefebure, D.V. and Ray, G.E., Editors, British Columbia Ministry of Employment and Investment, Open File 1995-20, pp. 93-96. Sutherland-Brown, A., 1972, Red Bird Prospect, 24th Intl. Geol. Congress Guidebook, Field excursions, pp. 24-26 Vollo N.B. 1980, Craigmont Mines Limited 93E/6 Redbird Molybdenum Ore Reserve Estimate, private report Sept. 23, 1980
49
22.0 DATE AND SIGNATURE PAGE CERTIFICATE G.H. Giroux I, G.H. Giroux, of 982 Broadview Drive, North Vancouver, British Columbia, do hereby certify that: 1) I am a consulting geological engineer with an office at #1215 - 675 West Hastings Street, Vancouver, British Columbia. 2) I am a graduate of the University of British Columbia in 1970 with a B.A. Sc. and in
1984 with a M.A. Sc., both in Geological Engineering. 3) I am a member in good standing of the Association of Professional Engineers and Geoscientists of the Province of British Columbia. 4) I have practised my profession continuously since 1970. I have had over 30 years
experience calculating mineral resources. I have previously completed resource estimations on a wide variety of porphyry deposits both in B.C. and around the world, many similar to Red Bird.
5) I have read the definition of “qualified person” set out in National Instrument 43-101 and certify that by reason of education, experience, independence and affiliation with a professional association, I meet the requirements of an Independent Qualified Person as defined in National Instrument 43-101.
6) This report titled “2007 Update Resource Estimation on the, Red Bird Porphyry Mo/Cu Deposit” dated January 11, 2008, is based on a study of the data and literature available on the Red Bird Property. I am responsible for the Sections 1-10 and 14-21 including the resource estimations completed in Vancouver during 2007. I am also responsible for the preparation of the Technical Report. I have visited the property on August 15-16, 2007 and examined drill core, drill sites and discussed the project with field staff.
7) I have previously completed resource estimations on this property in 2006 and 2007. 8) As of the date of this certificate, to the best of my knowledge, information and belief, the
technical report contains all scientific and technical information that is required to be disclosed to make the technical report not misleading.
9) I am independent of the issuer applying all of the tests in section 1.4 of National Instrument 43-101.
10) I have read National Instrument 43-101 and Form 43-101F1, and the Technical Report has been prepared in compliance with that instrument and form.
Dated this 11th day of January, 2008 “signed and sealed” G. H. Giroux, P.Eng., MASc.

50
APPENDIX 1 SEMIVARIOGRAM MODELS
FOR MO AND CU

51

52

53

54

55

56


