Embed Size (px)
Citation preview

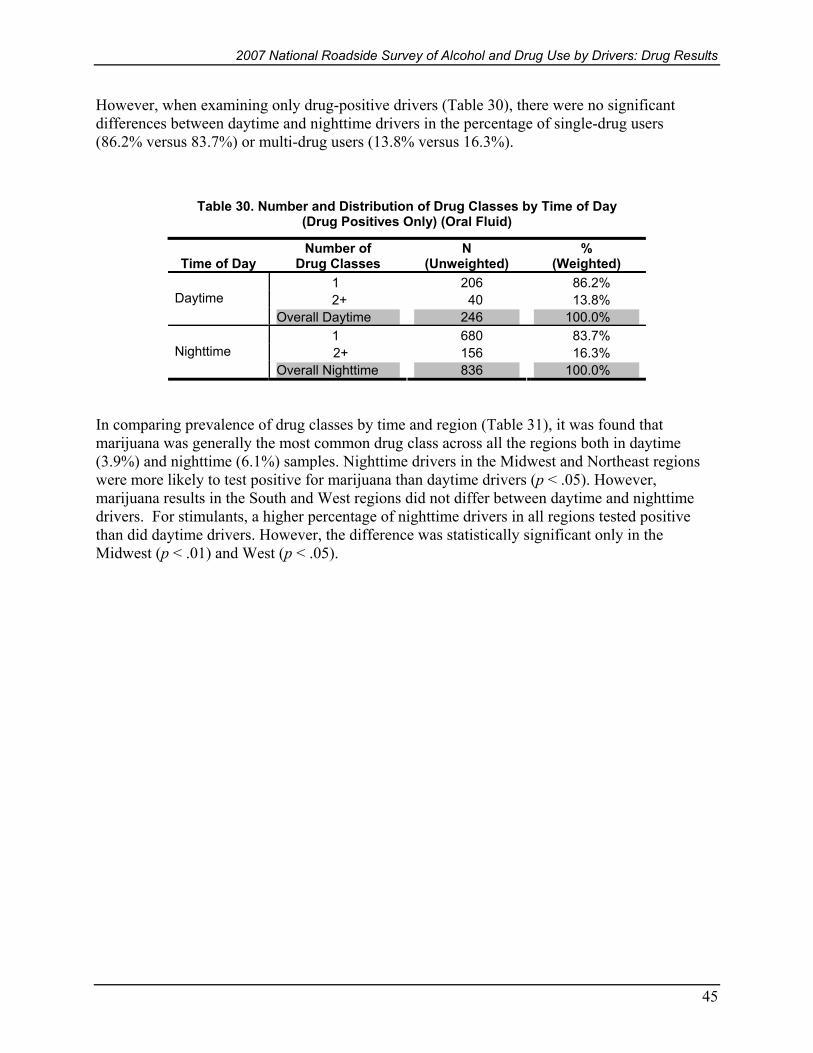
2007 National Roadside Survey of Alcohol and Drug Use by Drivers
Drug results
This publication is distributed by the US Department of Transportation National Highway Traffic Safety Administration in the interest of information exchange The opinions findings and conclusions expressed in this publication are those of the author(s) and not necessarily those of the Department of Transportation or the National Highway Traffic Safety Administration The United States Government assumes no liability for its content or use thereof If trade or manufacturersrsquo names or products are mentioned it is because they are considered essential to the object of the publication and should not be construed as an endorsement The United States Government does not endorse products or manufacturers
Technical Report Documentation Page 1 Report No
DOT HS 811 249 2 Government Accession No 3 Recipientrsquos Catalog No
4 Title and Subtitle
2007 National Roadside Survey of Alcohol and Drug Use by Drivers Drug Results
5 Report Date
December 2009 6 Performing Organization Code
7 Author(s)
John H Lacey Tara Kelley-Baker Debra Furr-Holden Robert B Voas Eduardo Romano Anthony Ramirez Katharine Brainard Christine Moore Pedro Torres and Amy Berning
8 Performing Organization Report No
9 Performing Organization Name and Address
Pacific Institute for Research and Evaluation 11720 Beltsville Drive Ste 900 Calverton MD 20705 Phone 301-755-2700 Fax 301-755-2799
10 Work Unit No (TRAIS)
11 Contract or Grant No
DTNH22-06-C-00040
12 Sponsoring Agency Name and Address
National Highway Traffic Safety Administration Office of Behavioral Safety Research 1200 New Jersey Avenue SE Washington DC 20590
13 Type of Report and Period Covered
Final Report 14 Sponsoring Agency Code
15 Supplementary Notes
Amy Berning served as the projectrsquos Contracting Officerrsquos Technical Representative The National Institute on Alcohol Abuse and Alcoholism (NIAAA) provided funding and support for the assessment of alcohol use disorders The National Institute on Drug Abuse (NIDA) provided funding for the collection of additional blood samples and the administration of the drug use disorders assessment The National Institute of Justice (NIJ) provided support for querying participants about interaction with the criminal justice system 16 Abstract
This report presents the first national prevalence estimates for drug-involved driving derived from the recently completed 2007 National Roadside Survey (NRS) The NRS is a national field survey of alcohol- and drug-involved driving conducted primarily among nighttime weekend drivers but also daytime Friday drivers The survey involved randomly stopping drivers at 300 locations across the continental United States sites were selected through a stratified random sampling procedure This included data that we collected during a two-hour Friday daytime session at 60 locations and during four 2-hour nighttime periods (10 pm to midnight and 1 am to 3 am on both Friday and Saturday) at 240 locations Both self-report and biological measures were taken Biological measures included breath alcohol measurements on 9413 respondents oral fluid from 7719 respondents and blood samples from 3276 respondents Oral fluid and blood samples were subjected to laboratory screening and LCMS-MS and GCMS confirmation for 75 drugs and metabolites including illegal prescription and over-the-counter drugs These data were analyzed to develop the first national prevalence estimate of alcohol- and drug-involved driving Two prior reports on the 2007 NRS described (1) the sampling plan and data collection methodology summarizing the response patterns to the various stages of the multi-part survey and (2) the prevalence estimates for alcohol-involved driving derived from the study and comparing them with the three previous National Roadside Surveys (NRS)
17 Key Words
Alcohol and driving drugs and driving roadside survey impaired driving drugged driving alcohol-involved driving drug-involved driving
18 Distribution Statement
Document is available to the public from the National Technical Information Service wwwntisgov
19 Security Classif (of this report)
Unclassified20 Security Classif (of this page)
Unclassified 21 No of Pages
148 22 Price
Form DOT F 17007 (872) Reproduction of completed page authorized
i
2007 National Roadside Survey of Alcohol and Drug Use by Drivers Drug Results
ii
2007 National Roadside Survey of Alcohol and Drug Use by Drivers Drug Results
Acknowledgements The authors received extensive assistance from State and local officials in the conduct of this project Our data collection procedures were not routine The willingness of officials to help us identify cooperating local law enforcement agencies and the willingness of agencies to participate in the project were essential to our success To all those who helped in conducting this study the authors express their sincere gratitude
iii
2007 National Roadside Survey of Alcohol and Drug Use by Drivers Drug Results
iv
Executive Summary 1
Methodology1 Results3 Summary 8
Introduction9 Background9 Prevalence of Drug-Involved Driving 10 Impact of Drugs on Driving Skills10
Laboratory Studies 10 Field Data11
Challenges in Measurement and Todayrsquos Drug Testing Opportunities13 Project Objectives 14
Methods17 Survey Sampling Procedures 17 Preparation for the 2007 NRS Survey 20 Driver Conversion23 Selection of Drugs for Screening and Analysis 24 Oral Fluid Collection Device 27 Blood Collection Procedures 29 Drug Questionnaire31
Oral Fluid Sample Analysis Procedures 32 Gas Chromatography-Mass Spectrometry (GCMS)32 Liquid Chromatography-Tandem Mass Spectrometry (LCMS-MS)32 Blood Sample Analysis Procedures 33 Ethanol (Oral Fluid and Blood) 33
Drug Classes and Categories 33 Results37
Oral Fluid Results (Daytime and Nighttime Samples) 37 Driver Drug Use Prevalence Based on Oral Fluid Results 37 Driver Drug Use Prevalence by Drug Class Based on Oral Fluid Results 44 Driver Drug Use Prevalence by Drug Category Based on Oral Fluid Results 48 Driver Drug Prevalence Based on Oral Fluid and BAC Results 53 Drugs Oral Fluid Results and Agreement With Self-Reported Drug Use59 Observed Safety Measures of Daytime and Nighttime Drivers (Oral Fluid) 62 Reported Contact With the Criminal Justice System (Oral Fluid) 66 Reported Contact With the Health System (Oral Fluid)69
Blood Results (Nighttime Samples)76 Driver Drug Use Prevalence Based on Blood Results76 Driver Drug Use Prevalence by Drug Class Based on Blood Results80 Driver Drug Use Prevalence by Drug Category Based on Blood Results82 Driver Drug Use Prevalence From Blood and BAC Results85
Oral Fluid andor Blood Results (Nighttime Samples)89 Driver Drug Use Prevalence Based on Oral Fluid andor Blood Results 89
2007 National Roadside Survey of Alcohol and Drug Use by Drivers Drug Results
Table of Contents
v
2007 National Roadside Survey of Alcohol and Drug Use by Drivers Drug Results
Driver Drug Use Prevalence by Drug Class Based on Oral Fluid andor Blood Results 94 Driver Drug Use Prevalence by Drug Category Based on Oral Fluid andor Blood Results 96 Driver Drug Use Prevalence From Oral Fluid andor Blood and BAC Results 98
Individual Drug Prevalence Estimates from Oral Fluid and Oral Fluid andor Blood Combined102
Overall Individual Drug Prevalence in Daytime and Nighttime 103 Individual Drug Prevalence in Nighttime Oral Fluid andor Blood 105 Individual Drug Prevalence Sorted by Drug Type from Oral Fluid and Oral Fluid andor Blood Combined107
Discussion111 Oral Fluid Analyses 111 Blood Analyses 113 Oral Fluid andor Blood Analyses Combined114
References115 Appendix A121
2007 National Roadside Survey Additional Tables122
Tables Table 1 Participating Drivers (Percentages in Parentheses) 3 Table 2 Drug Prevalence by Time of Day (Oral Fluid) 3 Table 3 Drug Categories Distribution by Time of Day (Oral Fluid) 4 Table 4 BAC Among Drug-Positive Drivers by Drug Category and Time of Day (Oral Fluid) 5 Table 5 Drug Classes by Time of Day and Region (Oral Fluid) 6 Table 6 Number and Distribution of Drug Classes by Time of Day (Oral Fluid) 6 Table 7 Drug Categories Distribution (Blood) 7 Table 8 BAC Among Drug-Positive Drivers by Drug Category (Percentage by Row) (Blood)7 Table 9 Comparison of Number of Nighttime Participants by Year in the National Roadside
Surveys21 Table 10 Participating Drivers (Percentages in Parentheses) 22 Table 11 Oral Fluid Analysis Results Among Converted Drivers 23 Table 12 Blood Analysis Results Among Converted Drivers 23 Table 13 Selected Drugs and Minimum Detection Concentrationsdagger24 Table 14 Extraction Efficiency of Quantisaltrade Oral Fluid Collection Device Over a Range of
Drugs Quintela29 Table 15 Extraction Efficiency of Quantisaltrade Oral Fluid Collection Device Over a Range of
Drugs Moore 29 Table 16 Drug Questionnaire Survey 31 Table 17 Drug Class CompositionmdashOral Fluid and Blood Combined 34 Table 18 Drug Category CompositionmdashOral Fluid and Blood Combined 35 Table 19 Drug Prevalence by Time of Day (Oral Fluid) 38 Table 20 Drug Prevalence by Time of DaySession (Oral Fluid)38 Table 21 Drug Prevalence by Time of Day and Region (Oral Fluid)39 Table 22 Drug Prevalence by Time of Day and Gender (Oral Fluid) 39 Table 23 Drug Prevalence by Time of Day and Age (Oral Fluid)40 Table 24 Drug Prevalence by Time of Day Age and Gender (Oral Fluid)41
vi
2007 National Roadside Survey of Alcohol and Drug Use by Drivers Drug Results
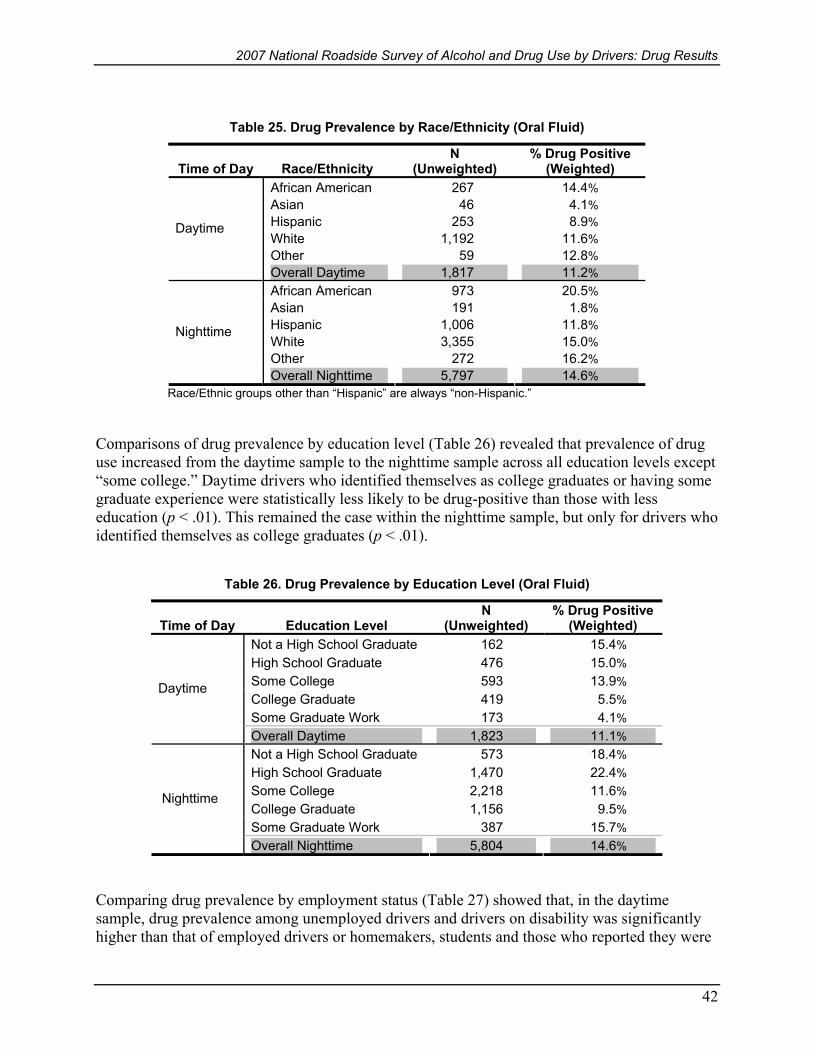
Table 25 Drug Prevalence by RaceEthnicity (Oral Fluid)42 Table 26 Drug Prevalence by Education Level (Oral Fluid) 42 Table 27 Drug Prevalence by Employment Status (Oral Fluid) 43 Table 28 Drug Prevalence by Vehicle Type (Oral Fluid)44 Table 29 Number and Distribution of Drug Classes by Time of Day (Oral Fluid) 44 Table 30 Number and Distribution of Drug Classes by Time of Day (Drug Positives Only)
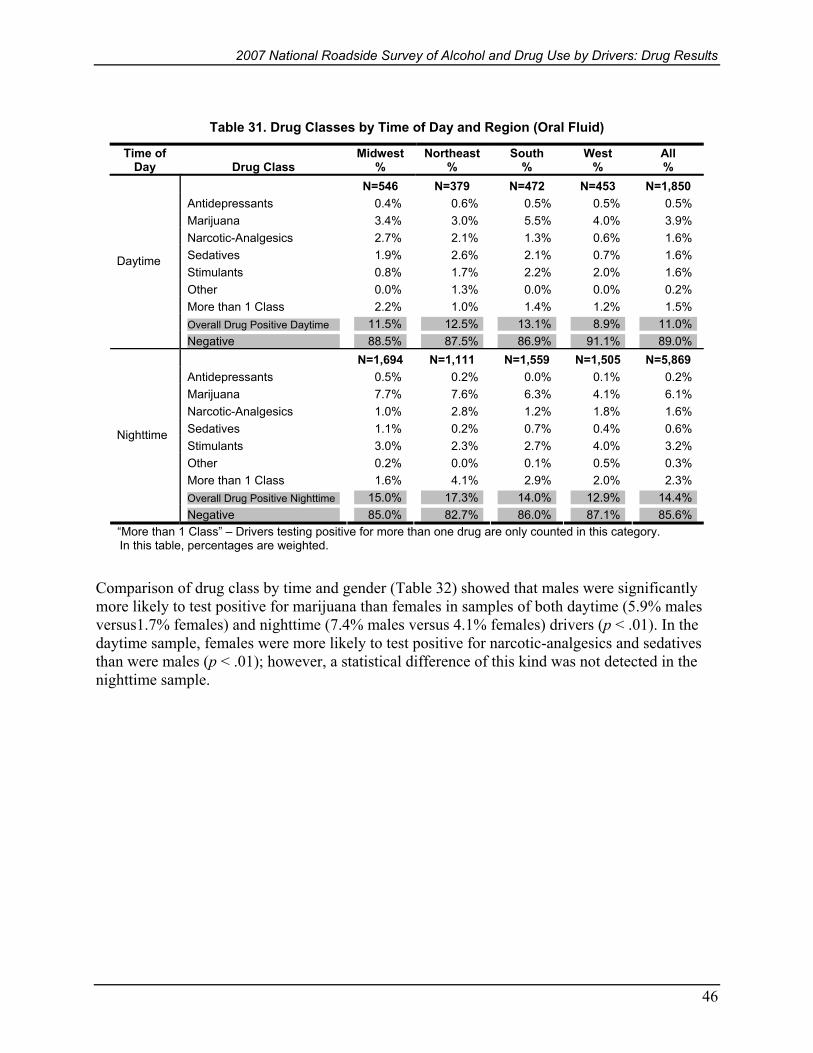
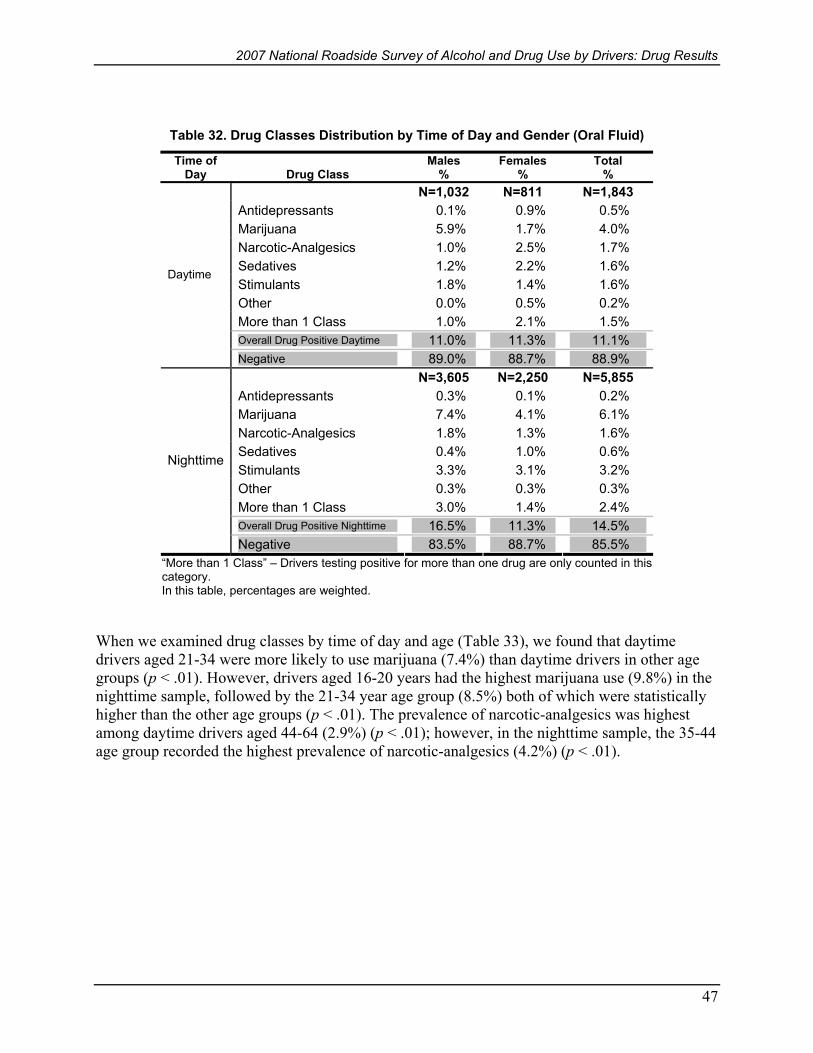
(Oral Fluid) 45 Table 31 Drug Classes by Time of Day and Region (Oral Fluid) 46 Table 32 Drug Classes Distribution by Time of Day and Gender (Oral Fluid)47 Table 33 Drug Class Distribution by Time of Day and Age (Oral Fluid) 48 Table 34 Drug Categories Distribution by Time of Day (Oral Fluid) 49 Table 35 Drug Categories Distribution by Time of Day and Region (Oral Fluid)50 Table 36 Drug Categories Distribution by Time of Day and Gender (Oral Fluid)51 Table 37 Drug Categories Distribution by Time of Day and Age (Oral Fluid)52 Table 38 Drug Prevalence by Time of Day and BAC (Percentages Calculated by Row)
(Oral Fluid) 54 Table 39 Drug Prevalence by Time of Day and BAC
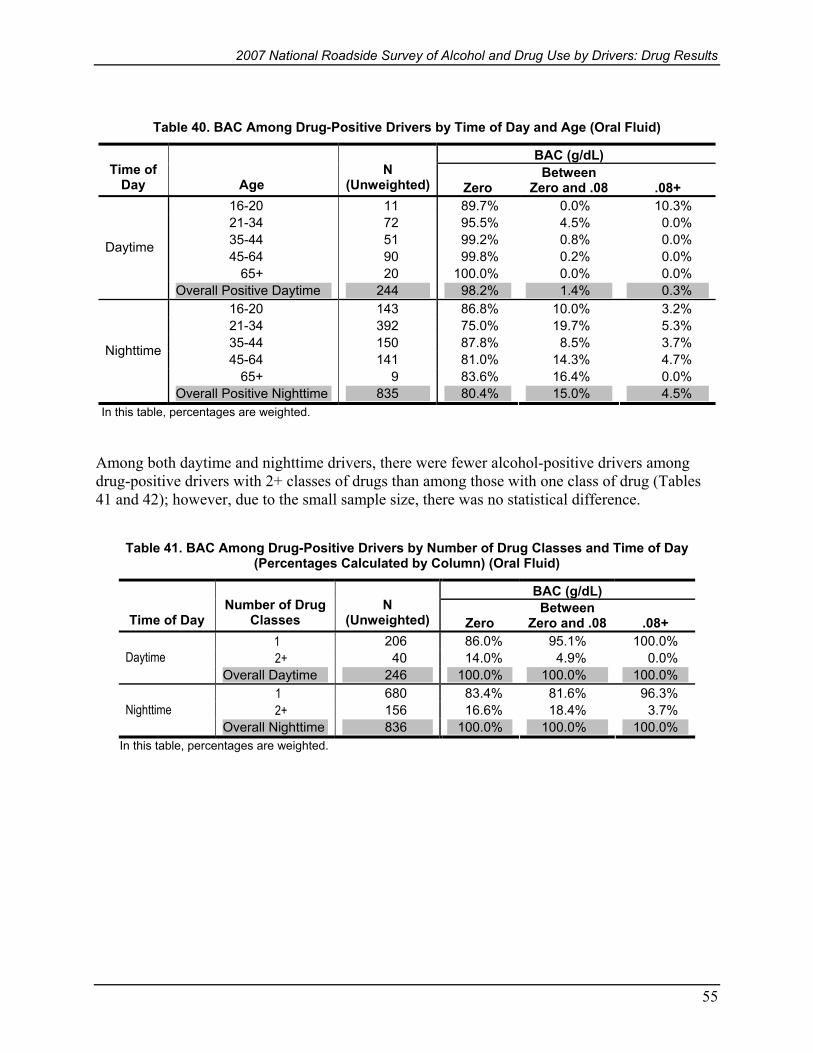
(Percentages Calculated by Column) (Oral Fluid)54 Table 40 BAC Among Drug-Positive Drivers by Time of Day and Age (Oral Fluid)55 Table 41 BAC Among Drug-Positive Drivers by Number of Drug Classes and Time of Day
(Percentages Calculated by Column) (Oral Fluid)55 Table 42 BAC Among Drug-Positive Drivers by Number of Drug Classes and Time of Day
(Percentages Calculated by Row) (Oral Fluid)56 Table 43 BAC Among Drug-Positive Drivers by Drug Category and Time of Day
(Oral Fluid) 56 Table 44 BAC of Drivers by Drug Category Age and Time of Day (Oral Fluid)57 Table 45 BAC of Drivers by Drug Category Gender and Time of Day (Oral Fluid)58 Table 46 Oral Fluid Results and Agreement With Self-Reported by Drug Type (Oral Fluid) 60 Table 47 Daytime Seat Belt Observation By Drug Prevalence (Oral Fluid)62 Table 48 Nighttime Seat Belt Observation by Drug Prevalence (Oral Fluid) 62 Table 49 Daytime Seat Belt Observation by Drug Class (Percentages Calculated by Row)
(Oral Fluid) 63 Table 50 Nighttime Seat Belt Observation by Drug Class (Percentages Calculated by Row)
(Oral Fluid) 63 Table 51 Daytime Seat Belt Observation by Drug Category (Percentages Calculated by Row)
(Oral Fluid) 64 Table 52 Nighttime Belt Observation by Drug Category (Percentages Calculated by Row)
(Oral Fluid) 64 Table 53 Daytime Helmet Use for Motorcycle Riders (Operators) by Drug Positive
(Oral Fluid) 64 Table 54 Nighttime Helmet Use for Motorcycle Riders (Operators) by Drug Positive
(Oral Fluid) 65 Table 55 Daytime Helmet Use for Motorcycle Riders (Operators) by Drug Class
(Oral Fluid) 65 Table 56 Nighttime Helmet Use for Motorcycle Riders (Operators) by Drug Class
(Percentages Calculated by Row) (Oral Fluid)65
vii
2007 National Roadside Survey of Alcohol and Drug Use by Drivers Drug Results
Table 57 Daytime Helmet Use for Motorcycle Riders (Operators) by Drug Category (Oral Fluid) 66
Table 58 Nighttime Helmet Use for Motorcycle Riders (Operators) by Drug Category (Percentages Calculated by Row) (Oral Fluid)66
Table 59 Arrests and Drug Positives Daytime (Oral Fluid) ldquoDuring the past 12 months were you arrested and booked for driving under the influence of alcohol or drugsrdquo66
Table 60 Arrests and Drug Positives Nighttime (Oral Fluid) ldquoDuring the past 12 months were you arrested and booked for driving under the influence of alcohol or drugsrdquo67
Table 61 Arrests and Drug Class Daytime (Oral Fluid) ldquoDuring the past 12 months were you arrested and booked for driving under the influence of alcohol or drugsrdquo67
Table 63 Arrests and Drug Categories Daytime (Oral Fluid) ldquoDuring the past 12 months were you arrested and booked for driving under the influence of alcohol or drugsrdquo68
Table 64 Arrests and Drug Categories Nighttime (Oral Fluid) ldquoDuring the past 12 months were you arrested and booked for driving under the influence of alcohol or drugrdquo 68
Table 65 Past Treatment Program and Drug Positive Daytime (Oral Fluid) ldquoDuring the past 12 months did you ever stay at least overnight in an inpatient or residential drug or alcohol treatment programrdquo 69
Table 66 Past Treatment Program and Drug Positive Nighttime (Oral Fluid) ldquoDuring the past 12 months did you ever stay at least overnight in an inpatient or residential drug or alcohol treatment programrdquo69
Table 67 Outpatient and Drug Positive Daytime (Oral Fluid) ldquoHave you ever been admitted to an outpatient drug or alcohol treatment program NOT including meetings like AA or NArdquo 70
Table 68 Outpatient and Drug Positive Nighttime (Oral Fluid) ldquoHave you ever been admitted to an outpatient drug or alcohol treatment program NOT including meetings like AA or NArdquo 70
Table 69 AA or NA and Drug Positives Daytime (Oral Fluid) ldquoDuring the past 12 months have you received treatment for your drug or alcohol use in a self-help group such as Alcoholics Anonymous or Narcotics Anonymousrdquo70
Table 70 AA or NA and Drug Positives Nighttime (Oral Fluid) ldquoDuring the past 12 months have you received treatment for your drug or alcohol use in a self-help group such as Alcoholics Anonymous of Narcotics Anonymousrdquo71
Table 71 Inpatient and Drug Class Daytime (Oral Fluid) ldquoDuring the past 12 months did you ever stay at least overnight in an impatient or residential drug or alcohol treatment program for example detox rehab a therapeutic community or a hospitalrdquo71
Table 72 Inpatient and Drug Class Nighttime (Oral Fluid) ldquoDuring the past 12 months did you ever stay at least overnight in an impatient or residential drug or alcohol treatment program for example detox rehab a therapeutic community or a hospitalrdquo72
Table 73 Inpatients and Drug Category Daytime (Oral Fluid) ldquoDuring the past 12 months were you arrested and booked for driving under the influence of alcohol or drugsrdquo72
Table 74 Inpatients and Drug Category Nighttime (Oral Fluid) ldquoDuring the past 12 months were you arrested and booked for driving under the influence of alcohol or drugsrdquo72
Table 75 Outpatient and Drug Class Daytime (Oral Fluid) ldquoHave you ever been admitted to an outpatient drug or alcohol treatment program NOT including meetings like AA or NArdquo 73
viii
2007 National Roadside Survey of Alcohol and Drug Use by Drivers Drug Results
Table 76 Outpatient and Drug Class Nighttime (Oral Fluid) ldquoHave you ever been admitted to an outpatient drug or alcohol treatment program NOT including meetings like AA or NArdquo 73
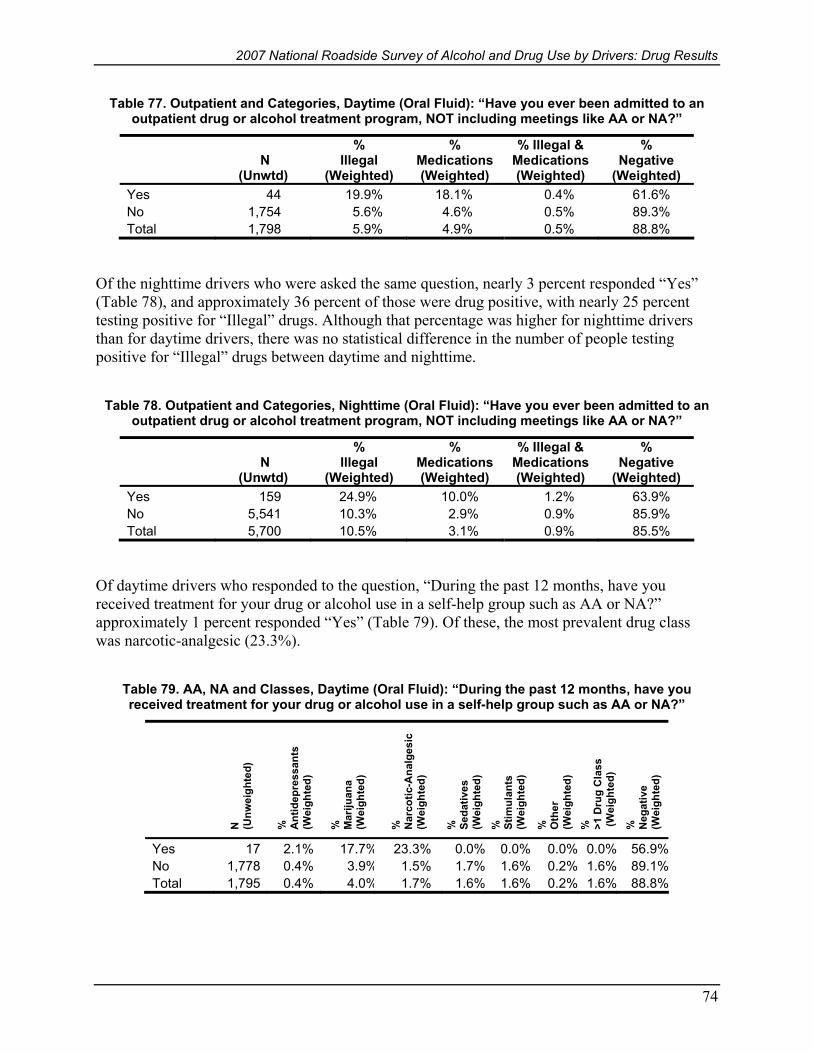
Table 77 Outpatient and Categories Daytime (Oral Fluid) ldquoHave you ever been admitted to an outpatient drug or alcohol treatment program NOT including meetings like AA or NArdquo 74
Table 78 Outpatient and Categories Nighttime (Oral Fluid) ldquoHave you ever been admitted to an outpatient drug or alcohol treatment program NOT including meetings like AA or NArdquo 74
Table 79 AA NA and Classes Daytime (Oral Fluid) ldquoDuring the past 12 months have you received treatment for your drug or alcohol use in a self-help group such as AA or NArdquo74
Table 80 AA NA and Classes Nighttime (Oral Fluid) ldquoDuring the past 12 months have you received treatment for your drug or alcohol use in a self-help group such as AA or NArdquo75
Table 81 NA AA and Drug Categories Daytime (Oral Fluid) ldquoDuring the past 12 months have you received treatment for your drug or alcohol use in a self-help group such as AA or NArdquo 75
Table 82 NA AA and Drug Categories Nighttime (Oral Fluid) ldquoDuring the past 12 months have you received treatment for your drug or alcohol use in a self-help group such as AA or NArdquo 76
Table 83 Drug Prevalence by Time of Day (Blood)76 Table 84 Drug Prevalence by Session (Blood) 77 Table 85 Drug Prevalence by Region (Blood)77 Table 86 Drug Prevalence by Gender (Blood) 77 Table 87 Drug Prevalence by Age (Blood)78 Table 88 Drug Prevalence by Age and Gender (Blood) 78 Table 89 Drug Prevalence by RaceEthnicity (Blood) 78 Table 90 Drug Prevalence by Education Level (Blood)79 Table 91 Drug Prevalence by Employment Status (Blood)79 Table 92 Drug Prevalence by Vehicle Type (Blood)80 Table 93 Number and Distribution of Drug Classes (Blood) 80 Table 94 Drug Classes Distribution by Region (Blood)81 Table 95 Drug Classes Distribution by Gender (Blood)81 Table 96 Drug Classes Distribution by Age (Blood)82 Table 97 Drug Categories Distribution (Blood) 82 Table 98 Drug Categories Distribution by Region (Blood)83 Table 99 Drug Categories Distribution by Gender (Blood)84 Table 100 Drug Categories Distribution by Age (Blood)85 Table 101 Drug Prevalence by BAC (Percentages Calculated by Row) (Blood)86 Table 102 Drug Prevalence by BAC (Percentages Calculated by Column) (Blood) 86 Table 103 BAC Among Drug-Positive Drivers by Age (Blood)86 Table 104 BAC Among Drug-Positive Drivers by Number of Drug Classes
(Percentages Calculated by Column) (Blood) 87 Table 105 BAC Among Drug-Positive Drivers by Number of Drug Classes
(Percentages Calculated by Row) (Blood)87 Table 106 BAC Among Drug-Positive Drivers by Drug Category
(Percentage by Row) (Blood) 87 Table 107 BAC Among Drug-Positive Drivers by Drug Category
(Percentage by Column) (Blood) 88
ix
2007 National Roadside Survey of Alcohol and Drug Use by Drivers Drug Results
Table 108 BAC of Drivers by Drug Category and Age (Blood) 88 Table 109 BAC of Drivers by Drug Category and Gender (Blood) 89 Table 110 Nighttime Drug Prevalence by Time of Day (Oral Fluid andor Blood)90 Table 111 Drug Prevalence by Session (Oral Fluid andor Blood) 90 Table 112 Drug Prevalence by Region (Oral Fluid andor Blood)90 Table 113 Drug Prevalence by Gender (Oral Fluid andor Blood)91 Table 114 Drug Prevalence by Age (Oral Fluid andor Blood)91 Table 115 Drug Prevalence by Age and Gender (Oral Fluid andor Blood) 92 Table 116 Drug Prevalence by RaceEthnicity (Oral Fluid andor Blood)92 Table 117 Drug Prevalence by Education Level (Oral Fluid andor Blood) 93 Table 118 Drug Prevalence by Employment Status (Oral Fluid andor Blood) 93 Table 119 Drug Prevalence by Vehicle Type (Oral Fluid andor Blood)93 Table 120 Number and Distribution of Drug Classes (Oral Fluid andor Blood) 94 Table 121 Number and Distribution of Drug Classes (Drug Positives Only)
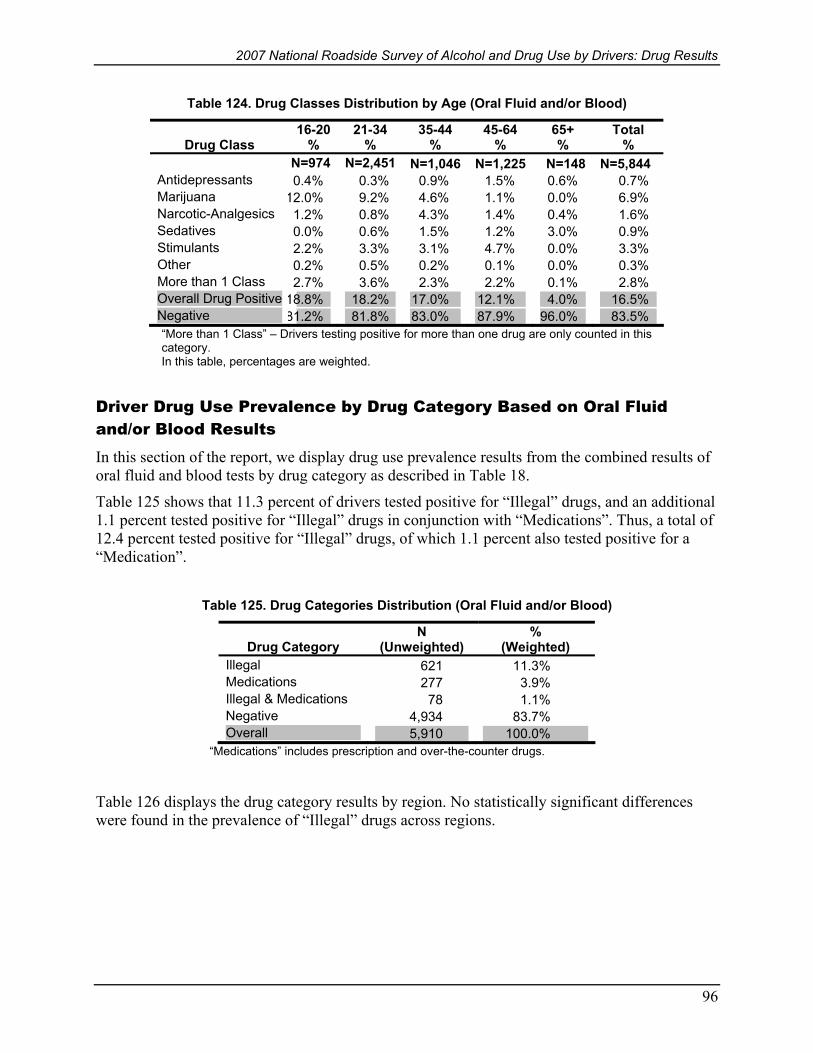
(Oral Fluid andor Blood) 94 Table 122 Drug Classes Distribution by Region (Oral Fluid andor Blood) 95 Table 123 Drug Classes Distribution by Gender (Oral Fluid andor Blood)95 Table 124 Drug Classes Distribution by Age (Oral Fluid andor Blood) 96 Table 125 Drug Categories Distribution (Oral Fluid andor Blood)96 Table 126 Drug Categories Distribution by Region (Oral Fluid andor Blood) 97 Table 127 Drug Categories by Gender (Oral Fluid andor Blood) 97 Table 128 Drug Categories Distribution by Age (Oral Fluid andor Blood)98 Table 129 Drug Prevalence by BAC (Percentages Calculated by Row)
(Oral Fluid andor Blood) 99 Table 130 Drug Prevalence by BAC (Percentages Calculated by Column)
(Oral Fluid andor Blood) 99 Table 131 BAC Among Drug-Positive Drivers by Age (Oral Fluid andor Blood)99 Table 132 BAC Among Drug-Positive Drivers by Number of Drug Classes
(Percentages Calculated by Column) (Oral Fluid andor Blood)100 Table 133 BAC Among Drug-Positive Drivers by Number of Drug Classes
(Percentages Calculated by Row) (Oral Fluid andor Blood)100 Table 134 BAC Among Drug-Positive Drivers by Drug Category
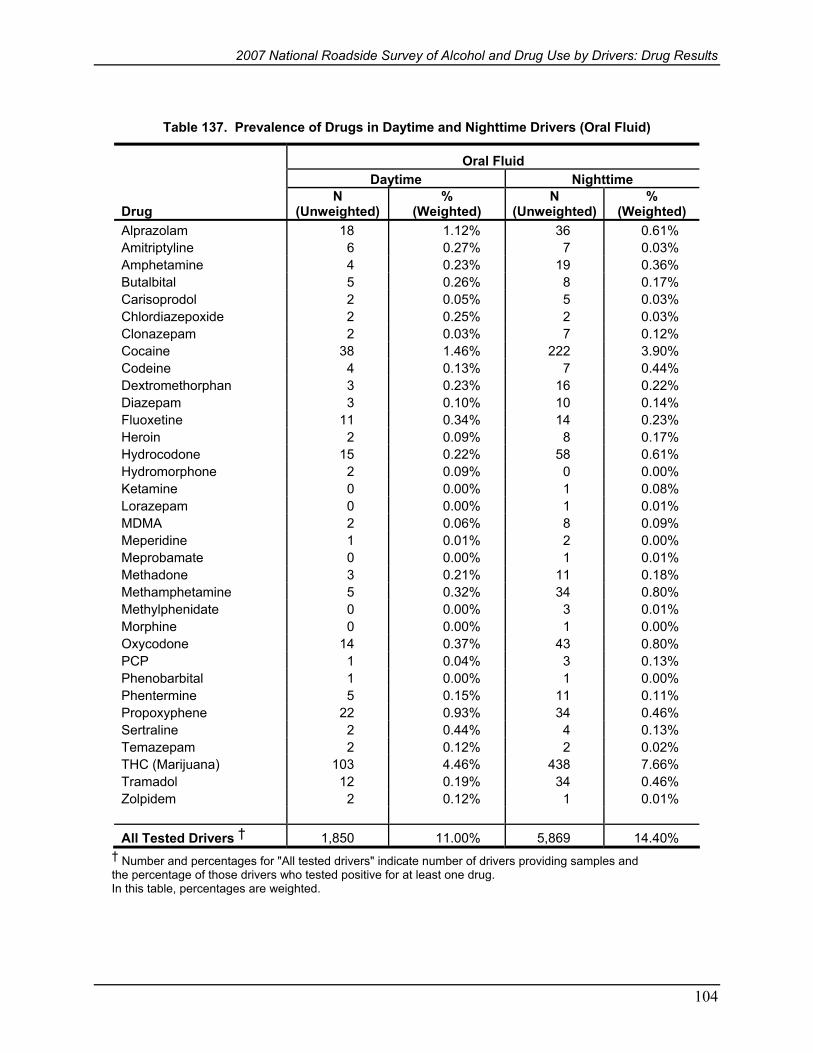
(Oral Fluid andor Blood) 100 Table 135 BAC of Drivers by Drug Category and Age (Oral Fluid andor Blood) 101 Table 136 BAC of Drivers by Drug Category and Gender (Oral Fluid andor Blood) 102 Table 137 Prevalence of Drugs in Daytime and Nighttime Drivers (Oral Fluid)104 Table 138 Prevalence of Drugs in All Drug-Tested Nighttime Drivers
(Oral Fluid andor Blood) 106 Table 139 Prevalence of Drugs in Daytime and Nighttime Drivers (Oral Fluid)108 Table 140 Prevalence of Drugs in All Drug-Tested Nighttime Drivers (Oral Fluid andor Blood) 109 Table 141 Nighttime Blood Results and Agreement With Self-Reported by
Drug Type (Blood)123 Table 142 Nighttime Seat Belt Observation by Drug Prevalence (Blood)125 Table 143 Nighttime Seat Belt Observation by Drug Class
(Percentages Calculated by Row) (Blood)125
x
2007 National Roadside Survey of Alcohol and Drug Use by Drivers Drug Results
Table 144 Nighttime Seat Belt Observation by Drug Category (Blood)126 Table 145 Nighttime Helmet Use for Motorcycle Riders (Operators)
by Drug Positive (Blood) 126 Table 146 Nighttime Helmet Use for Motorcycle Riders (Operators) by Drug Class
(Percentages Calculated by Row) (Blood)126 Table 147 Nighttime Helmet Use for Motorcycle Riders (Operators) by Drug Category
(Percentages Calculated by Row) (Blood)126 Table 148 Nighttime Arrests and Drug Positives (Blood) ldquoDuring the past 12 months
were you arrested and booked for driving under the influence of alcohol or drugsrdquo127 Table 149 Nighttime Arrests and Drug Class (Blood) ldquoDuring the past 12 months
were you arrested and booked for driving under the influence of alcohol or drugsrdquo127 Table 150 Nighttime Arrests and Drug Categories (Blood) ldquoDuring the past 12 months
were you arrested and booked for driving under the influence of alcohol or drugsrdquo127 Table 151 Nighttime Past Treatment Program and Drug Positive (Blood)
ldquoDuring the past 12 months did you ever stay at least overnight in an inpatient or residential drug or alcohol treatment programrdquo 127
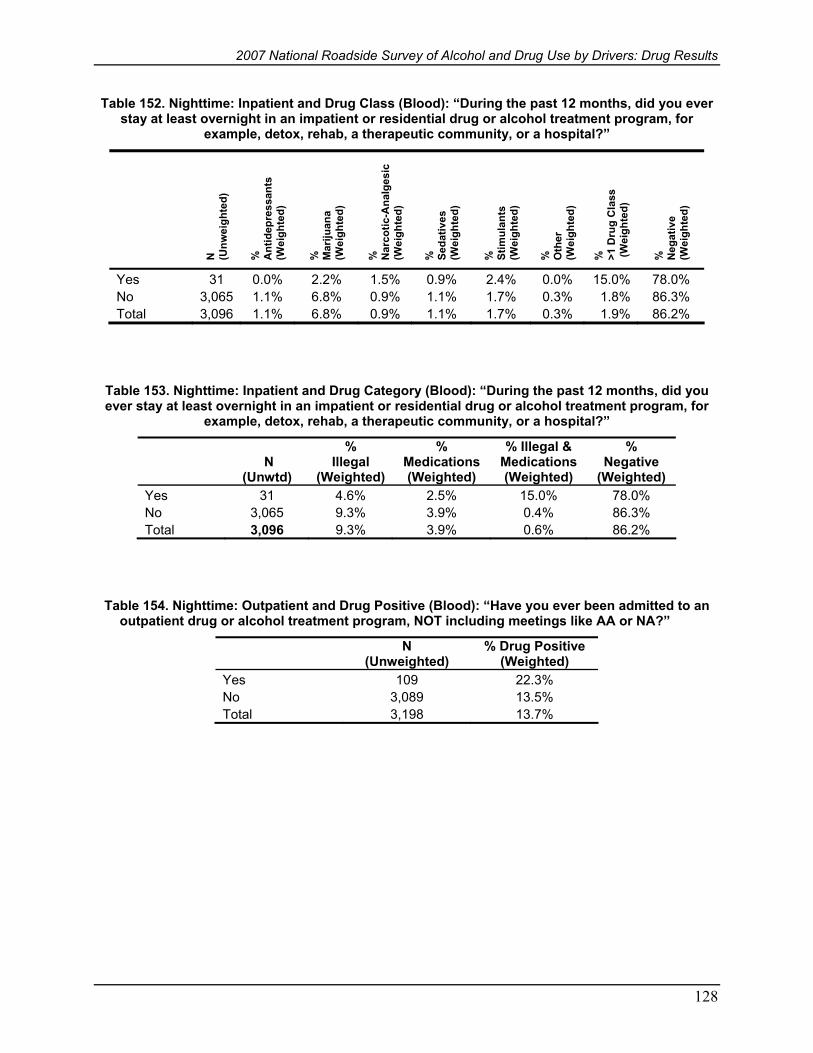
Table 152 Nighttime Inpatient and Drug Class (Blood) ldquoDuring the past 12 months did you ever stay at least overnight in an impatient or residential drug or alcohol treatment program for example detox rehab a therapeutic community or a hospitalrdquo128
Table 153 Nighttime Inpatient and Drug Category (Blood) ldquoDuring the past 12 months did you ever stay at least overnight in an impatient or residential drug or alcohol treatment program for example detox rehab a therapeutic community or a hospitalrdquo128
Table 154 Nighttime Outpatient and Drug Positive (Blood) ldquoHave you ever been admitted to an outpatient drug or alcohol treatment program NOT including meetings like AA or NArdquo128
Table 155 Nighttime Outpatient and Drug Class (Blood) ldquoHave you ever been admitted to an outpatient drug or alcohol treatment program NOT including meetings like AA or NArdquo 129
Table 156 Nighttime Outpatient and Categories (Blood) ldquoHave you ever been admitted to an outpatient drug or alcohol treatment program NOT including meetings like AA or NArdquo 129
Table 157 Nighttime AA or NA and Drug Positives (Blood) ldquoDuring the past 12 months have you received treatment for your drug or alcohol use in a self-help group such as AA or NArdquo129
Table 158 Nighttime AA or NA and Class (Blood) ldquoDuring the past 12 months have you received treatment for your drug or alcohol use in a self-help group such as AA or NArdquo 130
Table 159 Nighttime AA or NA and Drug Categories (Blood) ldquoDuring the past 12 months have you received treatment for your drug or alcohol use in a self-help group such as AA or NArdquo 130
Figures Figure 1 Map of Sixty 2007 National Roadside Survey Sites 19 Figure 2 Collecting an Oral Fluid Sample with the Quantisaltrade Oral Fluid Collection Device 28
xi
2007 National Roadside Survey of Alcohol and Drug Use by Drivers Drug Results
xii
2007 National Roadside Survey of Alcohol and Drug Use by Drivers Drug Results
Executive Summary This report presents the first US national prevalence estimate of drug-involved driving It is based on the results of analyses of oral fluid blood and breath specimens collected during the 2007 National Roadside Survey of Alcohol and Drug Use by Drivers It is one of the three reports that summarize the results of a 2007 study conducted by the Pacific Institute for Research and Evaluation (PIRE) for the National Highway Traffic Safety Administration (NHTSA) under Contract DTNH22-06-C-00040 ldquo2007 Roadside Survey of Alcohol and Drugged Drivingrdquo There are two prior reports on the 2007 National Roadside Survey (NRS) (1) ldquo2007 National Roadside Survey of Alcohol and Drug Use by Drivers Methodologyrdquo (Lacey Kelley-Baker Furr-Holden Voas Moore Brainard Tippetts Romano Torres amp Berning 2009a) which describes the sampling plan and data collection methodology and summarizes the response patterns to the various stages of the multi-part survey and (2) ldquo2007 National Roadside Survey of Alcohol and Drug Use by Drivers Alcohol Resultsrdquo (Lacey Kelley-Baker Furr-Holden Voas Romano Tippetts Ramirez Brainard amp Berning 2009b) which presents the prevalence estimates for alcohol-involved driving derived from the study and compares those estimates with data from the three previous National Roadside Surveys
Methodology Three prior national roadside surveys of drivers to estimate prevalence of drinking and driving and determine changes over time have been conducted in the United States These surveys which included a brief interview and a breath sample to determine blood alcohol concentration (BAC) were conducted on a stratified random sample of weekend nighttime drivers in the 48 contiguous States The first National Roadside Survey (NRS) sponsored by NHTSA was conducted in 1973 (Wolfe 1974) The second NRS was sponsored by the Insurance Institute for Highway Safety (IIHS) and conducted in 1986 (Lund amp Wolfe 1991) and the third jointly funded by IIHS and NHTSA was conducted in 1996 (Voas Wells Lestina Williams amp Greene 1998) NHTSA sponsored the 2007 NRS described in this report with additional funding from the National Institute on Alcohol Abuse and Alcoholism (NIAAA) the National Institute on Drug Abuse (NIDA) and the National Institute of Justice (NIJ) Like its predecessors the 2007 NRS covered the 48 contiguous States
As in previous NRS studies the 2007 NRS data were collected during the following periods on both Friday and Saturday nights 10 pm to midnight and 1 am to 3 am1 In addition the 2007 survey also included a Friday daytime data collection period either from 930 am to 1130 am or from 130 pm to 330 pm The prior three surveys did not include commercial vehicles and motorcycles in the sample this survey however included motorcycles In addition to a daytime survey and the inclusion of motorcycles the 2007 NRS included other features that the prior surveys did not (1) more data collectors per survey site to achieve a larger sample size (2) the collection of biological samples (oral fluid and blood) to determine the presence of drugs other than alcohol in the driving population (3) a questionnaire to allow an estimation of alcohol use disorders (AUDs) among drinking drivers (4) a questionnaire to study driversrsquo patterns of drug
1 In this report a ldquoFriday nightrdquo or a ldquoSaturday nightrdquo includes the early hours of the following day
1
2007 National Roadside Survey of Alcohol and Drug Use by Drivers Drug Results
consumption (5) questions about interaction with the criminal justice system and the treatment system and (6) collection of information on passengers
In all four NRS studies police officers directed vehicles to a safe location where an interviewer approached the driver and requested participation in a survey followed by a breath test Random selection of drivers was insured by selecting the next vehicle when an interviewer became available Any driver suspected of impairment was subjected to a safety protocol designed to dissuade hisher continued driving on that trip See the Methodology Report for details (Lacey et al 2009a)
As noted above the original 1973 survey used a four-stage sampling plan and the 1986 NRS attempted to replicate the 1973 locations In the 1996 and 2007 surveys the first stage was taken from the NHTSArsquos National Automotive Sampling SystemCrashworthiness Data System (NASSCDS 1995) The second stage involved the selection of police jurisdictions within the NASSCDS primary sampling units The third stage of the sampling design involved the selection of survey sites within police jurisdictions and the fourth stage consisted of selecting drivers at random from the traffic flow at these sites Details regarding the sampling plan can be found in the Methodology Report (Lacey et al 2009a)
New to the 2007 survey was the collection of additional types of biological samples (oral fluid and blood) to determine the presence of drugs other than alcohol in the driving population Oral fluid and blood samples were analyzed in a laboratory using enzyme-linked immunosorbent assay (ELISA) screening followed by a confirmatory analysis by Liquid Chromatography-Tandem Mass Spectrometry (LCMS-MS) or Gas ChromatographyMass Spectrometry (GCMS) This 2007 NRS is more extensive than any previous NRS study and provides a much broader perspective on alcohol and drug use in the driving population than previously available These data are essential to developing more precise estimates of the presence of alcohol and other drugs in drivers and in measuring the prevalence of alcohol- and drug-involved driving
This report summarizes the drug-involved driving prevalence estimates obtained through analyses of oral fluid and blood specimen results and combined with alcohol using breath alcohol measurements It should be emphasized that prevalence estimates do not necessarily imply ldquoimpairmentrdquo but rather in this case the presence of drugs and alcohol in the driver population For many drug types drug presence can be detected long after any impairment that might affect driving has passed2 Other studies are required to assess whether that presence implies an increased risk of crash involvement In this study we developed driver-prevalence estimates for illegal prescription and over-the-counter drugs which were determined by a panel of experts to possibly cause impairment It should be noted that prescription and over-the-counter drugs can be used according to medical advice or extra-medicinally Again the prevalence estimates indicate the presence of the drugs in drivers but do not necessarily indicate that the drivers were impaired Alcohol presence above the legal limit implies impairment alcohol below the legal limit may not imply impairment
2 For example traces of metabolites of marijuana can be detected in blood samples several days after chronic users stop ingestion Also whereas the impairment effects for various concentration levels of alcohol is well understood little evidence is available to link concentrations of other drug types to driver performance
2
2007 National Roadside Survey of Alcohol and Drug Use by Drivers Drug Results
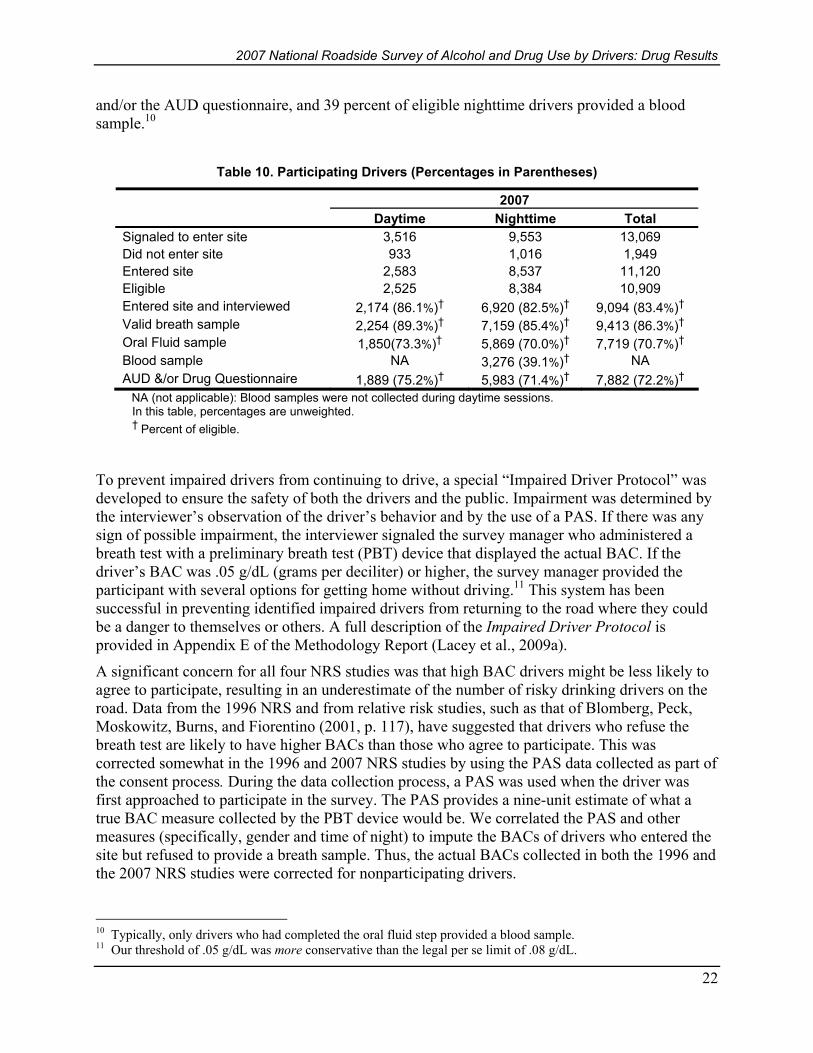
As discussed earlier we gathered data from drivers on US roadways during Friday daytime hours and Friday nights and Saturday nights As indicated in Table 1 we obtained oral fluid samples from drivers in each of those data collection periods (1850 during daytime and 5869 during nighttime) We also collected blood samples during the nighttime data collection periods (3276)
Table 1 Participating Drivers (Percentages in Parentheses)
2007 Daytime Nighttime Total
Signaled to enter site 3516 9553 13069 Did not enter site 933 1016 1949 Entered site 2583 8537 11120 Eligible 2525 8384 10909
Entered site and interviewed 2174 (861) dagger 6920 (825) dagger 9094 (834) dagger
Valid breath sample 2254 (893) dagger 7159 (854) dagger 9413 (863) dagger
Oral Fluid sample 1850(733) dagger 5869 (700) dagger 7719 (707) dagger
Blood sample NA 3276 (391) dagger NA
AUD ampor Drug Questionnaire 1889 (752) dagger 5983 (714) dagger 7882 (722) dagger
NA (not applicable) Blood samples were not collected during daytime sessions In this table percentages are unweighted dagger Percent of eligible
Results In this study analyses of the oral fluid and blood samples were conducted to identify the presence of some 75 drugs and metabolites including illegal prescription and over-the-counter drugs
Comparison of overall drug prevalence by time of day (Table 2) indicates that 11 percent of drivers in the daytime sample were drug-positive This level was significantly lower than the 144 percent of nighttime drivers who tested positive for drugs (p lt 01)3
Table 2 Drug Prevalence by Time of Day (Oral Fluid)
Time of Day N
(Unweighted) Drug Positive
(Weighted) Daytime 1850 110 Nighttime 5869 144
To make the presentation of results most useful we identified three broad categories of drugs illegal prescription and over-the-counter Because few over-the-counter drugs were found the prescription and over-the-counter drugs were combined for many analyses and labeled
3 p lt 01 indicates that under the null hypothesis the probability of encountering this difference by chance is less than 1 percent p lt 05 indicates that the probability of encountering this difference by chance is less than 5 percent
3
2007 National Roadside Survey of Alcohol and Drug Use by Drivers Drug Results
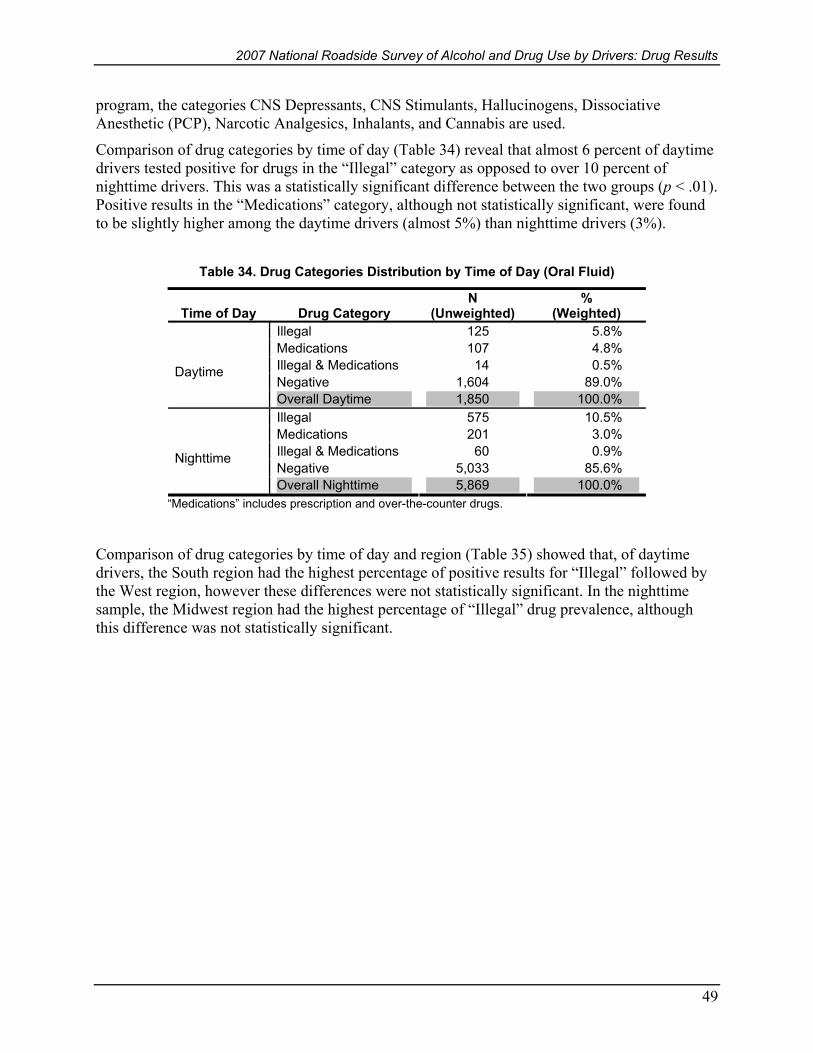
ldquoMedicationsrdquo Additionally some respondents tested positive for more than one category of drug Thus tables presenting drug categories present four mutually exclusive categories Illegal Medications Illegal and Medications and Negative So as not to double count individual positive results an individualrsquos result appears in only one of these categories However for example in Table 3 to determine the proportion of daytime drivers who tested positive for illegal drugs one could sum the daytime values for the ldquoIllegalrdquo category (58) and for the rdquo Illegal amp Medicationsrdquo category (05) to arrive at a prevalence estimate of 63 of daytime drivers who were positive for at least one illegal drug Detailed summaries of prevalence estimates for individual drugs appear in Tables 137-140 later in the report As indicated in Table 3 comparison of drug categories by time of day revealed that based on oral fluid analyses almost 6 percent of daytime drivers tested positive for drugs in the ldquoIllegalrdquo category (primarily marijuana and cocaine) as opposed to over 10 percent of nighttime drivers There was a statistically significant difference between daytime and nighttime drivers (p lt 01)
Table 3 Drug Categories Distribution by Time of Day (Oral Fluid)
N Time of Day Drug Category (Unweighted) (Weighted)
Daytime
Illegal Medications Illegal amp Medications Negative
125 107 14
1604
58 48 05
890 Overall Daytime 1850 1000
Nighttime
Illegal Medications Illegal amp Medications Negative
575 201 60
5033
105 30 09
856 Overall Nighttime 5869 1000
ldquoMedicationsrdquo includes prescription and over-the-counter drugs
Positive results in the ldquoMedicationsrdquo category though not statistically significant were found to be slightly higher among the daytime drivers (almost 5) than nighttime drivers (3) Additionally some drivers tested positive for both ldquoIllegal drugs and Medicationsrdquo (05 of daytime drivers and 09 of nighttime drivers) This indicates that drugs were not detected in 890 percent of daytime drivers and 856 percent of nighttime drivers
When oral fluid drug category findings were combined with BAC results we found that in both the daytime and nighttime samples the drug-positive drivers who were also alcohol-positive were more likely to be positive for ldquoIllegalrdquo drugs than ldquoMedicationsrdquo (Table 4) This was particularly true in the nighttime sample in which 173 percent of drivers in the illegal category had BACs between zero and 08 grams per deciliter (gdL) (compared to 63 in the ldquoMedicationsrdquo category) and 57 percent had BACs greater than 08 (compared to 12 in the ldquoMedicationsrdquo category) (p lt 01) In the daytime sample however the differences were statistically non-significant (p value = 05)
4
2007 National Roadside Survey of Alcohol and Drug Use by Drivers Drug Results
Table 4 BAC Among Drug-Positive Drivers by Drug Category and Time of Day (Oral Fluid)
Time of Day Drug Category
N (Unweighted)
BAC (gdL)
Zero Between
Zero and 08 08+
Daytime Illegal Medications Illegal amp Medications Negative
125 107 14
1604
971 996 983 992
23 04 17 06
06 00 00 02
Nighttime Illegal Medications Illegal amp Medications Negative
575 199 60
5033
770 925 814 902
173 63
177 81
57 12 09 17
ldquoMedicationsrdquo includes prescription and over-the-counter drugs In this table percentages are weighted
In addition to the three drug categories we also examined drug class (Table 5) The drug classes were antidepressants marijuana narcotic-analgesics sedatives stimulants and other plus a ldquomore than one drugrdquo class To avoid double counting individual positive results the classes were mutually exclusive Thus for example since marijuana is both a class by itself and could appear in the ldquoMore than 1 classrdquo cell as well (as could other classes of drugs) from this table one cannot arrive at an overall prevalence estimate for marijuana alone However detailed summaries of prevalence estimates for individual drugs appear in Tables 137-140 later in the report In comparing prevalence of drug classes by time and region4 we found that marijuana was generally the most common drug class across all the regions both in daytime (39) and nighttime (61) samples Among the nighttime sample drivers in the Midwest and Northeast regions were more likely to test positive for marijuana than daytime drivers (p lt 05) In the South and West regions however there was little difference between daytime and nighttime drivers with respect to marijuana For stimulants a higher percentage of nighttime drivers in all regions tested positive than did daytime drivers However the difference was statistically significant only in the Midwest (p lt 01) and West (p lt 05)
When one examines the ldquoAllrdquo column of Table 5 one finds that overall sedatives were found in 16 percent of daytime drivers and in 06 percent of nighttime drivers Stimulants were found in 16 percent of daytime drivers and in 32 percent of nighttime drivers
4 Regions are defined by the NASSGES system according to US Census Regions (Midwest includes the West North Central and East North Central States Northeast includes New England and Middle Atlantic States South includes the West South Central East South Central and South Atlantic States and West includes West and Mountain States
5
2007 National Roadside Survey of Alcohol and Drug Use by Drivers Drug Results
Table 5 Drug Classes by Time of Day and Region (Oral Fluid)
Time of Midwest Northeast South West All Day Drug Class
Daytime
Antidepressants
Marijuana
Narcotic-Analgesics
Sedatives
Stimulants
Other
More than 1 Class
N=546
04
34
27
19
08
00
22
N=379
06
30
21
26
17
13
10
N=472
05
55
13
21
22
00
14
N=453
05
40
06
07
20
00
12
N=1850
05
39
16
16
16
02
15
Overall Drug Positive Daytime 115 125 131 89 110
Negative 885 875 869 911 890
Nighttime
Antidepressants
Marijuana
Narcotic-Analgesics
Sedatives
Stimulants
Other
More than 1 Class
N=1694
05
77
10
11
30
02
16
N=1111
02
76
28
02
23
00
41
N=1559
00
63
12
07
27
01
29
N=1505
01
41
18
04
40
05
20
N=5869
02
61
16
06
32
03
23
Overall Drug Positive Nighttime 150 173 140 129 144
Negative 850 827 860 871 856
In this table percentages are weighted ldquoMore than 1 Classrdquo ndash Drivers testing positive for more than one drug class are counted only in this category
Further as indicated in Table 6 comparison of number of drug classes by time of day indicated that nighttime drivers (23) were significantly more likely to test positive for more than one drug class than daytime drivers (15) (p lt 01)
Table 6 Number and Distribution of Drug Classes by Time of Day (Oral Fluid)
Number of N Time of Day Drug Classes (Unweighted) (Weighted)
1 206 95 2+ 40 15Daytime
Negative 1604 890 1850 1000
1 680 121 2+ 156 23
Overall Daytime
Nighttime Negative 5033 856
5869 1000Overall Nighttime
6
2007 National Roadside Survey of Alcohol and Drug Use by Drivers Drug Results
As mentioned earlier 3276 blood samples were obtained from nighttime drivers As expected the results of the blood analyses were quite close to those obtained by the nighttime driver oral fluid analyses For example (Table 7) among nighttime drivers 91 percent tested positive for ldquoIllegalrdquo drugs 4 percent for ldquoMedicationsrdquo and 07 percent for the combination of both ldquoIllegal and Medicationsrdquo
Table 7 Drug Categories Distribution (Blood)
N Drug Category (Unweighted) (Weighted)
Illegal 267 91 Medications 169 40 Illegal amp Medications 30 07 Negative 2810 862 Overall 3276 1000
ldquoMedicationsrdquo includes prescription and over-the-counter drugs
Additionally as indicated in Table 8 283 percent of nighttime drivers testing positive for ldquoIllegalrdquo drugs in blood also tested positive for alcohol as did 64 percent of drivers who tested positive for ldquoMedicationsrdquo and 232 percent of those testing positive for both ldquoIllegal drugs and Medicationsrdquo
Table 8 BAC Among Drug-Positive Drivers by Drug Category (Percentage by Row) (Blood)
Drug Category N
(Unweighted)
BAC (gdL)
Zero Between
Zero and 08 08+ Illegal 267 717 204 79 Medications 169 936 49 15 Illegal amp Medications 30 768 232 00
ldquoMedicationsrdquo includes prescription and over-the-counter drugs In this table percentages are weighted
As indicated in Table 6 some individuals tested positive for more than one drug Thus we also present the drug analysis results by individual drug where drug is the unit of analysis (Tables 137-140) Those results indicate that the most prevalent drug other than alcohol was marijuana The overall marijuana prevalence rate in oral fluid was 45 percent daytime and 77 percent nighttime
When we examined the analysis results of the combination of oral fluid andor blood in the nighttime driver population we found that the marijuana prevalence rate was 87 percent The next most frequently encountered individual drug was cocaine with a daytime oral fluid prevalence rate of 15 percent and a nighttime rate of 39 percent
7
2007 National Roadside Survey of Alcohol and Drug Use by Drivers Drug Results
Summary Overall analyses of the oral fluid samples obtained indicated a drug use prevalence rate of 11 percent for daytime drivers and 144 percent for nighttime drivers This difference between day and night is statistically significant (p lt 01) Among nighttime drivers providing blood samples 138 percent overall tested positive for at least one of the drugs in our panel This includes all drugs for which we tested whether illegal prescription or over-the-counter Additionally of the 98 percent of drivers testing positive for ldquoIllegalrdquo drugs in blood 28 percent also tested positive for alcohol as did 64 percent who tested positive for ldquoMedicationsrdquo and 232 percent for those testing for both ldquoIllegal drugs and Medicationsrdquo The most frequently encountered individual drug other than alcohol was marijuana
Again it is important to emphasize that the results presented in this report are estimates of the prevalence of drug use among drivers Further research is needed to determine the effect of drug prevalence on crash risk This report provides detailed displays of the data discussed above
8
2007 National Roadside Survey of Alcohol and Drug Use by Drivers Drug Results
Introduction This report presents prevalence estimates for drug-involved driving obtained from the 2007 National Roadside Survey of alcohol- and drug-involved driving Though national roadside surveys of alcohol-involved driving have been conducted on a decennial basis since the midshy1970s this is the first US national roadside survey where biological measures of drugs other than alcohol were obtained
Background Forty years ago when the Department of Transportation (DOT) was established it was well understood that alcohol was an important factor in traffic crashes In 1968 a new agency that was to become the National Highway Traffic Safety Administration (NHTSA) delivered its Report to the Congress on Alcohol and Highway Safety pointing to the need for improved data on drinking and driving (USDOT 1968) This need led to the establishment of incentives for States to conduct blood alcohol concentration (BAC) tests on all fatally injured drivers and pedestrians and eventually to the establishment of the Fatality Analysis Reporting System5
(FARS) in 1975 Initially this data file was limited by the low level of testing for alcohol by the States but since 1982 through the use of an imputation system and increased testing by states it has provided a reliable means of assessing the Nationrsquos progress in reducing crashes in which drivers have been drinking It is important to note however that FARS provides very limited information related to drugs While States routinely test drivers involved in fatal vehicle crashes for alcohol only a few also routinely test for other drugs According to the Centers for Disease Control and Prevention less than half of the fatalities in the 2005 FARS had drug test results available (CDC 2006) In our review of the FARS data we identified a lack of information related to drug use
In addition to FARS the national roadside survey (NRS) series estimates the prevalence of drinking and driving on weekends in the 48 contiguous States and assesses changes in prevalence over time The first NRS was conducted in 1973 (Wolfe 1974) the second in 1986 (Lund amp Wolfe 1991) and the third in 1996 (Voas Wells Lestina Williams amp Greene 1998) Each of these surveys included a brief verbal survey and a breath sample to determine BAC Together the first three national surveys and FARS (1995) document reductions in the number of drinking drivers on US roadways and alcohol-related fatalities over three decades The fourth NRS conducted in 2007 followed the general methodology of the three prior surveys in obtaining BACs to enable comparison with the earlier surveys but also incorporated several new features These included questionnaires on drug and alcohol use disorders and biological sampling of oral fluid and blood to determine the extent of the presence of drugs other than alcohol (ie illegal prescription and over-the-counter) among drivers
In 2005 NHTSA conducted a pilot study as a precursor to this full decennial 2007 NRS (Lacey et al 2007) The primary objective of the pilot study was to determine whether it was feasible to collect data for drugs other than alcohol through oral fluid and blood samples The pilot study consisted of six rounds of nighttime data collection with over 800 drivers participating in the survey Approximately 78 percent of the drivers participating in the survey agreed to provide an
5 FARS was originally called the Fatal Accident Reporting System
9
2007 National Roadside Survey of Alcohol and Drug Use by Drivers Drug Results
oral fluid sample and almost 50 percent of the drivers participating in the survey provided blood samples The pilot study showed that it was clearly feasible to conduct a survey that included drugs other than alcohol Such data are essential to developing more precise estimates of the presence of alcohol and other drugs in drivers and for estimating the prevalence of alcohol- and drug-involved driving
Prevalence of Drug-Involved Driving In their review of the research literature Kelly Darke and Ross (2004) cite the 2001 National Household Survey to report that 4 percent of US residents reported driving while under the influence of drugs in the preceding 12 months These data based on self-report did not distinguish between legal and illegal drugs Using data collected in Tennessee in December 1986 Lund Preusser Blomberg and Williams (1988) studied a sample of truck drivers to report prevalence of marijuana (15) cocaine (2) prescription stimulants (5) and nonprescription stimulants (12) among the drivers According to a literature review by Jones Shinar and Walsh (2003) the Lund et al study (1988) was at that time the only US study that had performed chemical tests of drivers stopped at a roadside location
With respect to prescription drugs Jones et al (2003) reported that benzodiazepines (tranquilizers) were found in four percent of non-crash-involved drivers De Gier (2006) reviewed the literature and reported that benzodiazepines were more commonly found in middle-aged to older drivers ldquopresumably due to the high rates of benzodiazepine prescriptions among these age groupsrdquo Neutel (1998) estimated a lower crash risk for older persons (OR = 28) after benzodiazepine use than younger persons (OR = 32)
Impact of Drugs on Driving Skills Laboratory Studies A number of laboratory studies have been conducted on the impact of both legal and illegal drugs on driving-related skills Still results from these experimental studies are not straightforward and are sometimes contradictory One confounding factor is that different drugs have different effects on driving-related skills with the thresholds at which those different effects occur varying as a function of the measure used (Shinar 2006) Additionally Shinar found that because of the large individual variation in human response to drug consumption attempts to define a ldquonormrdquo for the behavioral response to drugs is difficult
Some studies have found that drugs that stimulate the central nervous system (eg amphetamines cocaine caffeine) sometimes may improve laboratory driving performance (Ward Kelly Foltin amp Fischman 1997 Burns 1993 Higgins et al 1990 Hurst 1976) However in the Jones et al (2003) literature review it is reported that amphetamines are not usually associated with easily observable behavioral impairments
There is considerable evidence from laboratory studies that cannabis (marijuana) impairs reaction time attention tracking hand-eye coordination and concentration although not all of these impairments were equally detected by all studies (Couper amp Logan 2004a Heishman Stitzer amp Yingling 1989 Gieringer 1988 Moskowitz 1985) In reviewing the literature on marijuana Smiley (1998) concluded that marijuana impairs performance in divided attention tasks (ie a poorer performance on subsidiary tasks) Jones et al (2003) adds that Smileyrsquos finding is relevant to the multitasking essence of driving in particular by making marijuanashy
10
2007 National Roadside Survey of Alcohol and Drug Use by Drivers Drug Results
impaired drivers perhaps less able to handle unexpected events Interestingly there is also evidence showing that unlike alcohol marijuana enhances rather than mitigates the individualrsquos perception of impairment (Lamers amp Ramaekers 1999 Robbe amp OHanlon 1993 Perez-Reyes Hicks Bumberry Jeffcoat amp Cook 1988) Robbe and OHanlon (1993) reported that in laboratory conditions drivers under the influence of marijuana were aware of their impairment which led them to decrease speed avoid passing other vehicles and reduce other risk-taking behaviors Such was not the case with alcohol for the authors reported that alcohol-impaired drivers were generally not aware of impairment and therefore did not adjust their driving accordingly
There is laboratory evidence that benzodiazepines impair some driving skills (Drummer 2002) However there are some contradictory results Mathijssen et al (2002) reported on a case-control study conducted in the Netherlands that found there is an increased risk for benzodiazepine and alcohol use together but no increased risk for benzodiazepine use alone Additionally there is evidence that the impairing effects of benzodiazepine might be circumscribed to the first days of benzodiazepine use before tolerance develops (Lucki Rickels amp Geller 1985) leading some to conclude that the extent to which benzodiazepines increase crash risk has to be balanced against the health benefits for those taking these drugs for medicinal purposes (Beirness Simpson amp Williams 2006)
Laboratory reports are not necessarily the best indicators of the impact of drugs on driving skills As Beirness et al (2006 pages 16-17) stated ldquoan impairment or skill enhancement identified in a laboratory test may not show up on the road because the drugs may lead to other changes in driver behavior Additionally laboratory tests can address the effects of drugs only on skills not judgment and the latter may be as important when it comes to driving Thus even if drugs are found to affect driving skills in laboratory tests actual crash risk may or may not be affectedrdquo
Field Data Data from drivers apprehended for impaired driving have been used to estimate the prevalence of drug use Jones et al (2003) reviewed the literature on drug involvement among arrested drivers and reported a variety of drug prevalence levels based on the location and the population under study White et al (1981) reported the following prevalence of drugs among drivers arrested for impaired driving in California in the 1970s with BACs lower than 10 gdL sedativehypnotic (30 to 47) phencyclidine or PCP (79) and morphine (62) In contrast Polkis Maginn and Barr (1987) reported the following prevalence rates among drivers arrested in St Louis Missouri in the 1980s phencyclidine or PCP (47) marijuana (47) benzodiazepines (22) barbiturates (15) opiates (11) and cocaine (9) Walsh et al (2000) reported that marijuana and cocaine were the primary drugs detected (19 and 16 respectively) among arrested drivers in Tampa Florida with narcotics and amphetamines found in less than 1 percent of the drivers Thus as studies of drug-use patterns in the United States have shown the types of substances consumed vary across locations and time making it difficult to characterize the drug involvement of drivers
As part of the Drug Evaluation and Classification (DEC) Program trained drug recognition experts are used to determine drug usage by looking for relevant signs and symptoms Preusser Ulmer and Preusser (1992) evaluated DEC programs in Arizona California Colorado New York and Texas from 1986 to 1991 reported that about 1 to 3 percent of the drivers arrested for driving while intoxicated (DWI) were classified as drug-impaired by Drug Recognition Experts
11
2007 National Roadside Survey of Alcohol and Drug Use by Drivers Drug Results
trained in the DEC Program The most prevalent substances found were marijuana (42) stimulants (36) depressants (16) narcotic analgesics (13) and PCP (5) As Jones et al (2003) pointed out these estimates apply only to the restricted group of driving-under-theshyinfluence-of-drugs (DUID) suspects that were evaluated by officers who participated in the DEC program rather than to all drivers arrested for DWI or all drivers on the road
Other studies have been conducted using crash data to estimate the prevalence of drugs among injured drivers and their role in crashes Terhune et al (1992) used a responsibility-analysis approach6 in studying fatally injured drivers and reported no increase in crash risk due to marijuana or cocaine use alone although multiple drug use could be associated with increased responsibility They also reported that ldquodrivers with alcohol in their systems had the highest crash responsibility ratesrdquo and ldquoan alcohol-drug combined impairment effect was suggested by the responsibility analysisrdquo (pg ix) Leveille et al (1994) used a small matched-case control study design to study crash risk among drivers aged 65 or older in Seattle Washington The authors did not find an association between crash risk and benzodiazepine or sedating antihistamines among this group although they acknowledged that the sample size (234 drivers) might have been too small for significance Ray Fought and Decker (1992) also studied crash risk for drivers aged 65 years or older using data from the Tennessee Medicaid program With this larger sample (16262 drivers) they found an association between presence of benzodiazepines or tricyclic antidepressants and crash risk However they did not find a correlation for people taking oral opioid analgesics Other studies of drug over-involvement in crashes report contradictory results (eg Hemmelgarn Suissa Huang Boivin amp Pinard 1997) These results should be considered cautiously due to data limitations such as small sample size
In summary Jones et al (2003 pp 85-86) stated ldquoThe role of drugs as a causal factor in traffic crashes involving drug-positive drivers is still not understood Drug risk factors are still not known with acceptable precision with some evidence suggesting little or no increase in crash risk at drug levels being detected by current chemical test procedures Further current research does not enable one to predict whether a driver testing positive for a drug even at some measured level of concentration was actually impaired by that drug at the time of crash This is in sharp contrast to alcohol where BAC measurements can provide a good estimate of impairmentrdquo
Jones et al (2003 p 86) also stated ldquoAnother complicating factor is the role of drugs taken in combination with alcohol For many drugs a drug in combination with alcohol accounts for a significant percentage of the occurrences of that drug in crash victims Waller et al (1995) found that roughly one-half of the occurrences of drivers positive for marijuana cocaine and or opiates had elevated BACs and that the crashes of drivers testing positive for drugs alone were very similar to the crashes of drivers testing negative for both alcohol and drugs This adds further doubts about the role of drugs in the impairment of crash-involved drivers and suggests that it may be much smaller than had been suspectedrdquo
6 Responsibility-analysis was used to suggest which drugs contributed to the occurrence of the crashes This method involves examining crash reports which have no indication of driver drug use and rating each driverrsquos crash responsibility If proportionately more drug-present drivers are judged responsible than are those free of drugs this is considered evidence of drug impairment effects
12
2007 National Roadside Survey of Alcohol and Drug Use by Drivers Drug Results
Challenges in Measurement and Todayrsquos Drug Testing Opportunities According to the review of the drug impaired literature conducted by Jones et al (2003) blood is usually the ldquogold standardrdquo for linking drug concentration to behavioral impairment However the collection of other types of biological fluids (eg sweat oral fluid urine) is less invasive and easier to collect in both field studies and law enforcement operations and thus oral fluid has emerged as a valid alternative to blood collection for field use Oral fluids normally contain the parent drug substance rather than drug metabolites that are present in urine Additionally Jones et al (2003) concluded that collection of oral fluid is generally considered less invasive than either blood or urine and ldquocould be an excellent matrix to tie recent drug use with behavioral impairmentrdquo
In some applications oral fluid samples are collected and then subjected to a screening analysis in the field or at the police station to develop a basis for more definitive collection of and laboratory analysis of urine or blood In the application used for this study the oral fluid sample was collected and then sent to a laboratory for a more refined enzyme-linked immunosorbent assay (ELISA) screening followed by a confirmatory analysis by Liquid Chromatography-Tandem Mass Spectrometry (LCMS-MS) or Gas ChromatographyMass Spectrometry (GCMS)
In a recent study conducted by Cone et al (2002) oral fluid testing of 77218 subjects in private industry showed a 5 percent positive rate for any of the five Substance Abuse and Mental Health Services Administration drug categories (marijuana cocaine opiates phencyclidine and amphetamines) The pattern and frequency of drug positives was remarkably similar to urine drug prevalence rates in the general workplace from other surveys (Cone et al 2002) Further in a study of 180 drivers given blood urine and oral fluid tests which were analyzed using quantitative Gas ChromatographyMass Spectrometry (GCMS) the positive predictive value of oral fluids was 98 percent for amphetamines 92 percent for cocaine and 90 percent for cannabinoids (Samyn et al 2002)
However in an analysis of blood urine saliva and sweat from 198 injured drivers admitted to a hospital saliva detected only 14 positives for cannabinoids while 22 positives were detected in the urine (Klintz et al 2000) According to the study authors the amount of matrix (body fluid) collected in saliva appears to be smaller when compared to urine and the levels of drugs are typically higher in urine than in saliva In a study of saliva and sweat Samyn and van Haeren (2000) concluded that saliva should be considered a useful analytical matrix for the detection of recent drug use when analyzed using GCMS This finding indicates oral fluid testing would be desirable in the roadside testing of drivers
Yacoubian et al (2001) tested 114 adult arrestees using saliva and urine and concluded that saliva testing may have certain advantages over urine testing for drugs including (1) ease of sample collection (2) subject preference for giving saliva over urine (3) less vulnerability of adulteration in saliva (4) little concern for subjects producing an adequate sample with saliva and (5) saliva storage is easier than urine The authors found a sensitivity of 100 percent and a specificity7 of 99 percent for cocaine in saliva and a sensitivity of 88 percent and specificity of
7 Sensitivity Sensitivity is the ability of a test to measure what it purports to measure or in this case the ability of the oral fluid tests to correctly identify active drug users It is operationalized as a proportion represented by the true
13
2007 National Roadside Survey of Alcohol and Drug Use by Drivers Drug Results
100 percent for heroin However saliva results only had a sensitivity of five percent for marijuana likely reflecting only detection of very recent smoking as marijuana does not migrate from the blood supply to the oral fluid Thus some positives may indicate residual marijuana remaining in the mouth after ingestion This may well be a positive factor for this study in that when marijuana is detected in saliva it is more likely to be in its active phase in the body rather than simply evidence the marijuana has been consumed during a ldquolook-backrdquo period that could be as long as two weeks and may no longer have a potential impairing effect
Hold et al (1999) conducted a review of the literature concerning using oral fluid for drug testing the review included 135 references and provided guidelines for techniques for collecting and measuring drugs in saliva In an earlier review of drug use evidence found in oral fluid Schramm et al (1992) concluded that initial studies with cocaine and phencyclidine or PCP suggested a correlation between oral fluid and blood concentration but that tetrahydrocannabinol (THC) does not appear to be transferred from blood to saliva Recent marijuana smoking however can be detected in saliva from the buccal cavity8
With regard to oral fluid and BAC Bates et al (1993) found a high correlation between saliva strips and breath tester results for alcohol (r = 89-90) Blood sample analyses however still remain the ldquogold standardrdquo measurement of drugs in the human body because evidence supporting accuracy is best established for that approach
Project Objectives New to the 2007 National Roadside Survey was the collection of biological samples that could be used to determine the extent of the presence of drugs other than alcohol in the nighttime driving population These additional data are essential to estimating the national progress in reducing the prevalence of alcohol- and drug-involved driving
The objective of this report is to present the first US national prevalence estimates of drug-involved driving The first report stemming from this study described the methods used in the sampling data collection and biological specimen analysis portions of the 2007 NRS (Lacey et al 2009a) The second report describes the studyrsquos analytic approach and summarizes the alcohol data we place the set of descriptive estimates of alcohol use within the context of societal trends by comparing these measures with similar ones from the prior surveys over the
positives (ie those who are drug positive and actually test positive) divided by all persons who are drug positive (ie those who are positive and test positive [ie true positives] plus those who are positive and test negative [false negatives]) The formula for sensitivity is Sn = TP (TP + FN) where TP and FN are the number of true positive and false negative results respectively Sensitivity can also be thought of as 1 minus the false negative rate Notice that the denominator for sensitivity is the number of drug positive persons Specificity Specificity is the ability of a test to correctly identify non-cases of disease or in this case the ability of
the oral fluid tests to correctly identify non-drug users It is operationalized as a proportion represented by the true negatives (ie those who are drug negative and test negative) divided by all persons who are drug negative (ie those who are negative and test negative [true negatives] plus those who are negative but falsely test positive [false positives]) The formula for specificity is Sp = TN (TN + FP) where TN and FP are the number of true negative and false positive results respectively Specificity can be thought of as 1 minus the false-positive rate Notice that the denominator for specificity is the number of nondrug users
8 The buccal cavity includes that part of the mouth bounded anteriorly and laterally by the lips and the cheeks posteriorly and medially by the teeth andor gums and above and below by the reflections of the mucosa from the lips and cheeks to the gums
14
2007 National Roadside Survey of Alcohol and Drug Use by Drivers Drug Results
last four decades These trend analyses enable detection of changes in our populations rates and degree of alcohol-involved driving over time (Lacey et al 2009b) The current report provides insight into the use of drugs other than alcohol (illegal prescription and over the counter) in the driving population and will provide a baseline for future studies to assess trends and changes
The report will first present a summary of the methods and procedures used in survey sampling and biological sampling This is followed by a description of the drugs selected for analysis and then a description of the actual drug-collection instruments and how they were administered
The results of our analyses are divided into three sections The first presents the analyses of the oral fluid results with BAC measurement obtained through breath tests These data include both daytime and nighttime drivers The second section will report the results of the blood analysis again with the BAC measurements from breath tests In both of these sections we also contrast the results obtained from the biological specimens with driversrsquo self-report drug use Additionally we present drug prevalence estimates for nighttime weekend drivers based on the combination of results of analyses of both oral fluid and blood combined Finally we discuss the implications of these analyses in terms of estimating the prevalence of drug use among Friday daytime drivers and weekend nighttime drivers Additional tables with further blood results are included in Appendix A These analyses include results of self-reported drug use by drug type safety observation measures (seatbelt helmet use etc) as well as the results on items relating to interaction with the criminal justice and treatment systems The presence of drugs in these drivers does not necessarily imply that they are impaired and at greater risk of crash involvement Indication of impairment and increased risk will be addressed in an upcoming study of the potential contribution of drugs to crash risk
15
2007 National Roadside Survey of Alcohol and Drug Use by Drivers Drug Results
16
2007 National Roadside Survey of Alcohol and Drug Use by Drivers Drug Results
Methods This section of the report briefly summarizes the methodology used in conducting the 2007 NRS with special emphasis on sampling procedures A separate Methodology Report (Lacey et al 2009a) provides detailed descriptions of the multiple components of the data collection process
Survey Sampling Procedures This section presents an abridged description of the sampling approach we followed in conducting the 2007 NRS Because it is infeasible to conduct surveys on all the roads in the United States we constructed a sampling system for the 2007 NRS that represented the whole Nation but required interviewing only a practical portion of the almost 203 million drivers on US roads (FHWA 2006) As in the three prior surveys the area covered in this study was limited to the 48 contiguous States
For practicality we limited locations to roadways where surveys could be performed safely and with sufficient traffic to recruit the number of participants required for valid estimates of the national prevalence of drinking and drug involved-drivers as did prior NRS studies
The past three national surveys provided information on private four-wheel vehicle operators at representative then randomly selected locations during weekend nighttime periods when drinking and driving is most prevalent The 2007 NRS covered the same time periods and added two Friday daytime periods As in the three earlier surveys the 2007 NRS excluded commercial vehicles but unlike previous practice included motorcycles
The 2007 NRS followed the practice of the 1973 1986 and 1996 national surveys by using a multistage sampling system that represented the drivers at risk for crash involvement in the 48 contiguous States In this process the initial sample structure was taken from NHTSArsquos National Automotive Sampling SystemGeneral Estimates System (NASSGES) (NHTSA 1995) which was constructed to provide a basis for making nationally representative estimates of highway crashes The four steps included
1 Selecting the primary sampling units (PSUs) which are cities large counties or groups of counties from within four regions of the United States and three levels of population density
2 Randomly selecting 30 specific square-mile-grid areas within each PSU and randomly numbering them to form an order of priority from among the total of all the square mile sectors comprising the PSU area Then we attempted to recruit the cooperation of local law enforcement agencies that had jurisdiction over the selected grids One law enforcement agency often would cover several of the selected square mile areas
3 Identifying appropriate survey sites within the square-mile-grid areas Appropriate sites had a safe area large enough to accommodate the survey operation and had sufficient traffic flow to generate an adequate number of subjects In some cases more than one such location was available within a square mile grid In this case the survey manager exercised herhis judgment to select the optimal location for safe data collection This resulted in selection of five data collection or survey sites within each PSU
17
2007 National Roadside Survey of Alcohol and Drug Use by Drivers Drug Results
4 Selecting at random drivers to be interviewed from the traffic passing by the survey site The total number of eligible vehicles was counted to determine the proportion of the traffic passing by each survey site that was sampled
These sampling procedures were followed to ensure that the probability of selecting a PSU a survey location within the PSU and a driver at a survey location was known at each of the sample design stages Knowing these probabilities permitted the computation of the probability that a given driver would be interviewed in the survey This was done by multiplying the sampling probabilities at each of the four steps to obtain the final overall probability of being sampled The weight given to each case in the final totals (sampling weight) was computed as the inverse of the sampling probability This statistical procedure accounts for differences among PSUs in the size of the driver population In other words although we sampled approximately the same number of drivers at each PSU the actual number of individuals driving at each sampling site was not uniform To make the sample of drivers at each site representative of the actual number of drivers we applied the above-described weights As a result drivers interviewed at sites with a relatively heavy traffic flow (ie a relatively large pool of actual drivers) carry a larger weight than drivers sampled from sites with less traffic loads This ensured that the basic requirement of sampling theorymdashthat every driver has an equal chance of being interviewedmdashwas met by adjusting for the biases inherent in the selection of locations within the sampling frame
The major barrier to carrying out this staged sampling system was obtaining law enforcement support for the survey In some localities city attorneys or law enforcement leadership with concerns such as potential liability and scare resources declined to participate In these cases substitution PSUs were obtained Although this process was time-consuming similar difficulties had also been experienced in all three previous NRS studies Replacement PSUs were chosen from within the same GES geographic region9 and the same GES PSU type (city large suburban area all others) as the unavailable PSU For more information on PSU replacement see Lacey et al (2009a) The 60 PSUs used in the 2007 NRS are shown in Figure 1
9 GES defines four geographic strata
18
2007 National Roadside Survey of Alcohol and Drug Use by Drivers Drug Results
Figure 1 Map of Sixty 2007 National Roadside Survey Sites
As mentioned the roadside survey procedures used in the 2007 NRS followed as closely as possible those used in the previous three surveys (see Lacey et al 2009a Lestina et al 1999) However the 2007 NRS departed from the earlier surveys in several important ways The earlier surveys included only a brief questionnaire and a breath test that generally required less than 5 minutes of a participantrsquos time The 2007 NRS included a more extensive set of questions (base survey a drug questionnaire questions about interaction with the criminal justice and treatment systems an alcohol-use disorder and a drug-use disorder survey) The 2007 survey protocol also attempted to collect two biological samples (oral fluid and blood) from participants as well as a breath test Data collection for the earlier surveys was conducted by three teams of three interviewers the 2007 NRS consisted of 6 teams of 10 to 12 members The earlier surveys were conducted at 24 PSUs whereas the 2007 survey was conducted at 60 PSUs This increase in the number of PSUs allowed us to maximize the use of all possible PSUs defined by the NASSGES and increase the representativeness of the sample The earlier surveys had four 2-hour data collection periods on weekend nights the 2007 survey added a 2-hour data collection period during the daytime on Fridays for a total of five 2-hour survey periods during the weekend Finally the number of participants in the 2007 survey was about three times as many as in the 1973 study
PIRE employed and trained six specialized teams of interviewers from both the east and west coasts of the United States All staff was trained during the summer of 2007 Surveys began the weekend of July 20 and 21 2007 and concluded 20 weeks later on December 1 2007 As in the three previous NRS studies nighttime surveys were conducted between 10 pm and midnight and between 1 am and 3 am on both Friday and Saturday For the 2007 survey a 2-hour Friday daytime data collection period was added either between 930 am and 1130 am or between 130 pm and 330 pm The daytime data collection period was randomly selected for each PSU The daytime periods were added to determine the extent of alcohol- and drugshy
19
2007 National Roadside Survey of Alcohol and Drug Use by Drivers Drug Results
involved driving during the day and whether the number of drivers using drugs and the types of drugs used differed between day and night Each component used in the roadside survey is thoroughly described in the Methodology Report (Lacey et al 2009a)
Preparation for the 2007 NRS Survey The size and complexity of the 2007 NRS required extensive preparation that NHTSA began years before the actual survey was initiated including a pilot test of survey procedures (Lacey Kelley-Baker Furr-Holden Voas Brainard amp Moore 2007) The preparation activitiesmdash selection and testing of equipment for collecting biological samples recording and organizing the self-report and observational data at the roadside recruiting and training of survey staff pretesting of survey procedures developing procedures for protection of survey respondents and the publicmdashare fully described in the Methodology Report (Lacey et al 2009a) Only a brief overview of this work is described here
Survey equipment Interviewers recorded the responses to the traditional NRS interview on a handheld portable digital assistant (PDA) Through a special program developed for the 2007 NRS the PDA provided a means of prompting the interviewer through each step of the data collection process
As part of the program to protect survey participants and the public it was important to know the extent of the driversrsquo drinking To this end a passive alcohol sensor (PAS) attached to the PDA with Velcrotrade was used to collect mixed expired air from approximately 6 inches in front of the driverrsquos face (we used the PAS Vrtrade manufactured by PAS International Inc of Fredericksburg Virginia) This small handheld unit was used because it was less obvious and intimidating than the larger flashlight-based passive sensors We researched three available styles of PAS models (1) the handheld unit that was used in the pilot study (2) the flashlight PAS and (3) a clipboard device with an alcohol sensor built into one corner We tested the devices for accuracy ease of use and reliability and found that the PAS Vrtrade was best suited to the needs of this study The PAS unit can detect alcohol in emitted breath around the face (Kiger Lestina amp Lund 1993) The PAS was held within 6 inches of the participantrsquos face and when the subject spoke the interviewer activated the small electrical pump which pulled in the exhaled breath from the participant and produced an estimate of the participantrsquos breath alcohol level
Data collection To compare results from the 2007 survey to prior surveys a strong effort was made to follow the same data collection protocol employed in the three prior NRS studies despite the addition of a large number of questions and new biological specimen collections following the traditional questionnaire and breath test As described in the Methodology Report (Lacey et al 2009a) we placed the traditional NRS interview and breath-test collection before the new NRS questions and the specimen collections We believed that by structuring data collection in this way the additions to the basic survey would not affect our ability to compare the responses to the basic survey with responses from the three earlier surveys Nevertheless the 2007 NRS experienced a somewhat larger refusal rate than the 1996 NRS (see Table 9)
To determine whether the 2007 survey procedure accounted for producing the lower response rate we conducted a replica of the 1996 NRS procedure in one of our 2007 sites (Knox County Tennessee) The simpler protocol followed that used in the 1996 and earlier surveys collecting the traditional interview and a breath sample only About 16 percent of all drivers signaled to stop by the officer during this ldquoreplica surveyrdquo failed to stop andor enter the site This is similar
20
2007 National Roadside Survey of Alcohol and Drug Use by Drivers Drug Results
to the 15 percent that failed to stop (when the police signaled) in the 2007 NRS study Among those who entered the research bay and were eligible for the survey the proportion of refusals in the replica survey was similar to the full 2007 NRS (163 and 175 respectively) Thus it appears that the lower response rate in the 2007 NRS reflects a change in the driving publicrsquos willingness to be interviewed rather than an effect of the more elaborate survey procedures implemented in 2007
Table 9 Comparison of Number of Nighttime Participants by Year in the National Roadside Surveys
1973 1986 1996 2007 Signaled to enter site Not reported 3260 6480 9553 Did not enter site Not reported 217 182 1016 Entered site 3698 3043 6298 8537 Eligible for survey Not reported Not reported Not reported 8384dagger
Entered site and interviewed
Valid breath sampledaggerdaggerdagger 3353 (907) 3192 (863)
2971 (976) 2850 (937)
6045 (960) 6028 (957)
6920 (825)daggerdagger
7159 (854)daggerdagger
dagger Commercial vehicles not eligible daggerdagger Because previous surveys did not inform about the eligibility of the drivers percentages for the years 1973 1986 and 1996 are based on drivers who stopped and entered the site Percentages for 2007 are based on drivers who not only were stopped and entered site but also were eligible for the survey (ie noncommercial drivers drivers aged 16 and older and not constrained by language barriers) Percentages are based on nighttime drivers daggerdaggerdagger Some drivers provided breath samples but declined to be interviewed In this table percentages are unweighted
The basic procedure in the 2007 NRS as well as in the prior three surveys was for the law enforcement officer working with the survey team to direct the potential respondent into the survey site without speaking to the driver Once in the site the driver was directed into a research bay and was approached by an interviewer and recruited to participate in the interview Prospective participants were informed that they had done nothing wrong and that the interview concerned traffic safety and was anonymous A PAS reading was also taken at this point If the individual agreed to participate the interviewer asked the 22 questions on the traditional NRS protocol and requested a breath sample Only after the completion of the standard NRS procedure did the additional data collection for the 2007 NRS begin A detailed description of the survey procedures is provided in the Methodology Report (Lacey et al 2009a)
As indicated in Table 10 which presents response patterns for both the daytime and nighttime data collection periods over 13000 vehicles were selected to participate in the 2007 NRS of these 10909 entered the data collection site and the drivers were determined to be eligible for survey participation (for example commercial vehicles such as pizza delivery vehicles drivers under the age of 16 and drivers who could not communicate with us either in English or Spanish were not eligible to participate) Eighty-three percent of eligible drivers participated in the survey and because some of those that refused the survey did agree to provide a breath sample BACs from the PBTs were available on 86 percent of the eligible drivers Among eligible drivers 71 percent provided an oral fluid sample 72 percent completed a drug questionnaire
21
2007 National Roadside Survey of Alcohol and Drug Use by Drivers Drug Results
andor the AUD questionnaire and 39 percent of eligible nighttime drivers provided a blood sample10
Table 10 Participating Drivers (Percentages in Parentheses)
2007 Daytime Nighttime Total
Signaled to enter site 3516 9553 13069 Did not enter site 933 1016 1949 Entered site 2583 8537 11120 Eligible 2525 8384 10909 Entered site and interviewed Valid breath sample Oral Fluid sample Blood sample AUD ampor Drug Questionnaire
2174 (861)dagger
2254 (893)dagger
1850(733)dagger
NA
1889 (752)dagger
6920 (825)dagger
7159 (854)dagger
5869 (700)dagger
3276 (391)dagger
5983 (714)dagger
9094 (834)dagger
9413 (863)dagger
7719 (707)dagger
NA
7882 (722)dagger
NA (not applicable) Blood samples were not collected during daytime sessions In this table percentages are unweighted dagger Percent of eligible
To prevent impaired drivers from continuing to drive a special ldquoImpaired Driver Protocolrdquo was developed to ensure the safety of both the drivers and the public Impairment was determined by the interviewerrsquos observation of the driverrsquos behavior and by the use of a PAS If there was any sign of possible impairment the interviewer signaled the survey manager who administered a breath test with a preliminary breath test (PBT) device that displayed the actual BAC If the driverrsquos BAC was 05 gdL (grams per deciliter) or higher the survey manager provided the participant with several options for getting home without driving11 This system has been successful in preventing identified impaired drivers from returning to the road where they could be a danger to themselves or others A full description of the Impaired Driver Protocol is provided in Appendix E of the Methodology Report (Lacey et al 2009a)
A significant concern for all four NRS studies was that high BAC drivers might be less likely to agree to participate resulting in an underestimate of the number of risky drinking drivers on the road Data from the 1996 NRS and from relative risk studies such as that of Blomberg Peck Moskowitz Burns and Fiorentino (2001 p 117) have suggested that drivers who refuse the breath test are likely to have higher BACs than those who agree to participate This was corrected somewhat in the 1996 and 2007 NRS studies by using the PAS data collected as part of the consent process During the data collection process a PAS was used when the driver was first approached to participate in the survey The PAS provides a nine-unit estimate of what a true BAC measure collected by the PBT device would be We correlated the PAS and other measures (specifically gender and time of night) to impute the BACs of drivers who entered the site but refused to provide a breath sample Thus the actual BACs collected in both the 1996 and the 2007 NRS studies were corrected for nonparticipating drivers
10 Typically only drivers who had completed the oral fluid step provided a blood sample 11 Our threshold of 05 gdL was more conservative than the legal per se limit of 08 gdL
22
2007 National Roadside Survey of Alcohol and Drug Use by Drivers Drug Results
Driver Conversion As presented in the Methodology Report (Lacey et al 2009a) there were 444 attempts to convert drivers who had initially declined to participate in our study (ie to change their minds and provide us with at least a breath sample) This was done to develop an understanding of whether drivers who refused to participate were more or less likely to be alcohol or drug positive than those who initially agreed to participate Drivers who refused were offered a $100 incentive as an inducement to convert Of the 444 total attempts 50 percent were successfully converted (ie provided a breath sample) Among those converted drivers 156 (70) also provided an oral fluid sample and 49 drivers (22) also provided a blood sample
Tables 11 and 12 show the outcome of the Oral Fluid and Blood analyses (respectively) performed on the converted drivers Among converted drivers who provided an oral fluid sample the distribution of drivers who were drug positive appears to be somewhat higher than that of the total sample of daytime and nighttime participants where 110 percent of the general daytime samples were positive (as compared to 162 of converted drivers) and 144 percent of the general nighttime samples were positive (compared to the 170 of converted drivers) These differences however were not statistically significant
Table 11 Oral Fluid Analysis Results Among Converted Drivers
Daytime Nighttime Presence of Drugs N N in Oral Fluid (Unweighted) (Weighted) (Unweighted) (Weighted) Negative 27 838 107 831 Positive 6 162 16 170 All 33 100 123 100
Among drivers who were converted and provided a blood sample 127 percent were drug positive This distribution is very similar to that of the total nighttime participants who provided blood where 138 percent were drug positive (blood was not collected in the daytime sample) Given the low sample size statistical tests were not performed
Table 12 Blood Analysis Results Among Converted Drivers
Presence of Drugs in Blood
Negative Positive
Nighttime N
(Unweighted)
(Weighted) 43 873
6 127 All 49 100
23
2007 National Roadside Survey of Alcohol and Drug Use by Drivers Drug Results
Selection of Drugs for Screening and Analysis PIRE and NHTSA jointly developed an initial list of drugs to be detected based on the literature (eg Jones Shinar amp Walsh 2003 Couper amp Logan 2004) and experience with drug-involved driving research The drugs were selected because of a combination of their potential impaired-driving effects their likelihood of appearing in drivers and in the case of oral fluid the availability of scientific techniques to analyze oral fluid to detect and quantify the drug NHTSA then provided this list to experts in the field of epidemiology of drug use driving and toxicology both in the United States and abroad The experts responded to the list with additions and deletions
The list of selected drugs is shown in Table 13 The first five categories of drugs listed constitute the National Institute on Drug Abuse (NIDA)-5 which are prevalent drugs of abuse and of universal interest in the study of drug involvement The NIDA-5 are routine components of a drug-screening panel The other drugs on the list (with the exception of barbiturates) appear in the NHTSA publication titled ldquoDrugs and Human Performance Fact Sheetsrdquo (Couper amp Logan 2004) and are of interest because the expert panel for that effort believed those drugs presented potential traffic safety risks The drugs we tested for represented illegal prescription and overshythe-counter drugs that (1) have the potential to impair driving performance and (2) could reasonably be expected to appear in the driver population
Table 13 Selected Drugs and Minimum Detection Concentrationsdagger
Drug Class Minimum Concentration
Oral Fluid (ngmL) Minimum Concentration
Blood (ngmL) Self-report Item
Screen Confirm Screen Confirm
Cocaine (Cocaine benzoylecgonine)
20 8 25 10 Cocaine (eg crack or coke)
Opiates (6-AM codeine morphine hydrocodone hydromorphone)
40 10 25 10
Heroin Morphine or Codeine (eg Tylenolreg with codeine)
Amphetamine Methamphetamine (MDMA MDA MDEA Ephedrine Psuedoephedrine)
50 50
50 20 20
10
Amphetamine or Methamphetamine (eg speed crank crystal meth) Ecstasy
Cannabinoids (THC THC-COO[THCA])
4 2 10 1 Marijuana (eg pot hash weed)
Phencyclidine 10 10 10 10 PCP (eg angeldust) Benzodiazepines (oxazepam nordiazepam bromazepam flurazepam
10 5 20 10 Benzodiazepines (eg Valiumreg or tranquilizers)
24
2007 National Roadside Survey of Alcohol and Drug Use by Drivers Drug Results
Drug Class Minimum Concentration
Oral Fluid (ngmL) Minimum Concentration
Blood (ngmL) Self-report Item
Screen Confirm Screen Confirm
flunitrazepam lorazepam chlordiazepoxide temazepam diazepam clonazepam alprazolam triazolam midazolam nitrazepam) Barbiturates (Phenobarbital pentobarb secobarbital butalbital)
50 50 500 500 Barbiturates (eg phenobarbital)
Methadone 50 25 50 10 Methadone Ethyl alcohol 02 02 02 02 Alcohol Oxycodone (Percocetreg) 25 10 25 10 Prescription pain
killers (eg Percocetreg OxyContinreg oxycodone Demerolreg Darvonreg)
Propoxyphene (Darvonreg)
10 10 10 10
Tramadol (Ultramreg) 50 25 50 10 Carisoprodol (Somareg) 100 50 500 500 Meperidine (Demerolreg) Sertraline (Zoloftreg) 50 25 50 10
Antidepressants (eg Prozacreg Zoloftreg)
Fluoxetine (Prozacreg) 50 25 50 10 Tricyclic Antidepressants (amitryptiline nortriptyline)
25 25 25 10
Zolpidem (Ambienreg) 10 10 10 10 Ambienreg or other sleep aids
Methylphenidate (Ritalinreg)
10 10 10 10 ADHD medications (eg Ritalinreg)
Dextromethorphan 50 20 50 20 Cough medicines (eg Robitussinreg Vicks 44reg etc)
Ketamine 10 10 10 10 KetamineSpecial K daggerScreening utilizes ELISA micro-plate and confirmation utilizes GCMS or LCMSMS technology
We screened using ELISA micro-plate technology Confirmation was performed using GCMS or LCMSMS technology Our toxicological laboratory Immunalysis Corporation provided all necessary confirmations
Cocaine which can be used as a local anesthetic is often abused because of its stimulating effects on the central nervous system (CNS) At low doses cocaine might actually have performance enhancing effects however little is known about its effects on human performance at higher levels and in conjunction with alcohol It is clearly a drug of abuse in the United States and worthy of study in drivers
Opiates are narcotic analgesics used both medicinally and as drugs of abuse After an initial rush opiates act as CNS depressants and certainly could have performance-decreasing effects
25
2007 National Roadside Survey of Alcohol and Drug Use by Drivers Drug Results
Amphetamines are CNS stimulants and are used both medicinally and as drugs of abuse Amphetamines are generally taken recreationally and to enhance performance (eg truck drivers staying awake) Ecstasy falls within this category and as a methylated amphetamine derivative it also has hallucinogenic properties Amphetamines have been associated with crash occurrence and could logically be associated with driving impairment both in the stimulation and withdrawal stages in the latter case especially as the drug interacts with fatigue The analytical methodology is described in an article by Moore Coulter and Crompton (2007)
Cannabinoids have a variety of effects on humans and can be associated with stimulant sedative and hallucinogenic effects Both the experimental and epidemiologic evidence on cannabinoidsrsquo effects on driving are mixed When marijuana is found in drivers however it is often in conjunction with alcohol where an impairing effect is more likely The most prevalent drug detected in the pilot study was marijuana (Lacey et al 2007) There appeared to be a strong positive correlation between the oral fluid and blood tests and the only discrepancies found in the pilot study (negative oral fluid and a positive blood) were from 10 cases in which the inactive metabolites were detected in blood but not the active tetrahydrocannabinol (THC) A positive metabolite result (THCA) with a negative parent compound (THC) is consistent with less recent use (eg in the days before sample was taken) A positive oral fluid for the parent compound is likely to be associated with very recent THC use the timeframe consistent with potential impairing effects Thus such oral fluid results can be very informative The laboratory procedures for testing the oral fluid results have been previously published in several articles (Moore et al 2006 Moore Rana amp Coulter 2007c Coulter Miller Crompton amp Moore 2008)
Phencyclidine (PCP) is related to veterinary tranquilizers such as ketamine that impair motor ability but it also has hallucinogenic effects and is used as a recreational drug PCP has serious performance diminishing effects and has been found in impaired-driving cases Its determination in oral fluid has recently been published in Coulter Crompton and Moore (2008)
Benzodiazepines include many widely prescribed drugs (eg Valiumreg Xanaxreg) to reduce anxiety These drugs act as CNS depressants show cross-tolerance to ethanol and are potentially associated with driver impairment Different types of benzodiazepines have very short to very long half-lives For example the desiredtherapeutic effect of lorazepam (Ativanreg) is sedation which would obviously have a detrimental effect on driving a motor vehicle The most common benzodiazepine is diazepam (Valiumreg) andor its metabolites nordiazepam oxazepam and temazepam The confirmation procedure for the 2007 study included LCMSMS confirmation using the method described in Moore Coulter Crompton and Zumwalt (2007)
Barbiturates are still widely prescribed CNS depressants and in some cases as anti-epileptic medications Because of their depressive effects barbiturates are associated with delayed reaction times and possibly loss of concentration both effects likely to affect driving performance
Methadone a narcotic analgesic is used both medicinally for opiate detoxification and maintenance and for pain relief It has also been used as a drug of abuse It may have differential performance effects in naiumlve or recreational users versus tolerant therapeutic users and certainly deserves study
Painkillers are a class of drugs that may lead to driving impairment Commonly used painkillers include oxycodone (an opioid) Oxycodone has similar effects to morphine and heroin If used in
26
2007 National Roadside Survey of Alcohol and Drug Use by Drivers Drug Results
combination with other depressants of the CNS such as alcohol or benzodiazepines it can cause severe impairment or lead to death Tramadol an opiate analgesic has similar effects to oxycodone Propoxyphene and meperidine also atypical opiates are included in the panel The methods used for their analysis are described (Rana et al 2006 Moore Rana et al 2007b) Other painkillers such as carisoprodol a CNS depressant and muscle relaxant (Somareg also called Miltownreg) are used as prescription drugs but can lead to abuse Even at therapeutic concentrations carisoprodol and its metabolite meprobamate may cause driving impairment as the desired effect is sedation
Antidepressants are most commonly in the form of selective serotonin uptake inhibitors (SSRIs) such as fluoxetine (Prozacreg) and sertraline (Zoloftreg) They can cause impairment especially in circumstances where extremely high blood concentrations are measured or if they are taken outside of medical need or therapeutic treatment There is also an additional risk of impairment associated with combined use with alcohol
Sleep aids such as Ambienreg cause drowsiness and may cause dizziness If consumed with alcohol there is an increased likelihood of these symptoms Sleep aids alone or in combination with alcohol could have a detrimental effect on driving ability
Other stimulants such as methylphenidate (sold as Ritalinreg) are amphetamine-like prescription drugs commonly used to treat Attention Deficit Hyperactivity Disorder (ADHD) in children and adults They are CNS stimulants Some people abuse these drugs by crushing the tablets and snorting them The effect of this other stimulant abuse is similar to that of cocaine or amphetamine
Dextromethorphan a synthetic analog of codeine is an antitussive widely used in cough medicines (eg Robitussinreg Sucretsreg Vicks Formula 44reg) When consumed in high doses in recreational use it is a CNS depressant and may have driving impairment effects at those levels The analytical method has recently been published in Rodrigues et al (2008)
Ketamine (Special K) is used medicinally as a veterinary tranquilizer but it is also abused as a recreational drug for its psychedelic effects Ketamine use by humans would likely be associated with decrements in skills related to driving
Oral Fluid Collection Device Following the NRS interview and collection of the breath test the interviewer requested an oral fluid sample and offered a $10 incentive for providing one We used the Quantisaltrade (manufactured by Immunalysis Corporation) oral fluid collection device (see Appendix F of the Methodology Report [Lacey et al 2009a]) The subject placed this device under hisher tongue and its pad changed color (blue) when 1 mL of oral fluid (the necessary sample volume) was collected The collection device was then placed into a tube containing 3 mL of a stabilizing buffer solution and capped for storage and transport to the laboratory The steps are illustrated in Figure 2
27
2007 National Roadside Survey of Alcohol and Drug Use by Drivers Drug Results
Figure 2 Collecting an Oral Fluid Sample With the Quantisaltrade Oral Fluid Collection Device Distributed by Immunalysis Inc Pomona CA
httpwwwimmunalysiscomquantisal_procedurehtm
The oral fluid samples were labeled with pre-printed Chain-of-Custody (CoC) labels to be linked with the subject and additional data collected This allowed the specimen to be tracked throughout the project The CoC labels contained a unique identifier that corresponded to that sample This number was also entered into the PDA CoC numbers were preprinted by the laboratory and were used to maintain a documented link between each sample collected and the respondent who provided it A different CoC number was assigned to the oral fluid and blood sample for an individual subject and the laboratory was blinded to any link between them This assured the oral fluid and blood analyses and results were independent of one another
The collection of oral fluid while less invasive than the collection of blood or urine has some associated difficulties (ONeal Crouch Rollins amp Fatah 2000) Various researchers have noted that the method of collection and the medium itself (oral fluid) significantly affect drug concentration in the specimen and consequently whether some drugs can be detected at all However while some collection devices give no indication of the amount of oral fluid actually collected (rendering a quantitative result meaningless) the Quantisaltrade oral fluid collection device collects 1 mL (+10) of clear oral fluid from the donor Researchers have studied the device to assess the efficiency of drug release from the collection pad (Quintela Crouch amp Andrenyak 2006 Moore et al 2006 Moore Rana amp Coulter 2007b) and have found a high rate of extraction efficiency Tables 14 and 15 summarize the effectiveness of the Quantisaltrade oral fluid collection device across a range of drugs by two different research groups Findings above 100 percent are due to slight variations in the amount of the substances actually added to the scientific control samples (scientific error)
28
2007 National Roadside Survey of Alcohol and Drug Use by Drivers Drug Results
Table 14 Extraction Efficiency of Quantisaltrade Oral Fluid Collection Device Over a Range of Drugs Quintela
Drug Target Value (ngmL) Mean Recovery from the Pad () Amphetamine 50 943
Methamphetamine 50 1038
Cocaine 20 912
Benzoylecgonine 20 869
Codeine 40 956
Morphine 40 926
6-acetylmorphine 4 922
THC 4 914
Methadone 50 997
Oxazepam 20 1013
Source Quintela et al 2006
Table 15 Extraction Efficiency of Quantisaltrade Oral Fluid Collection Device Over a Range of Drugs Moore
Drug Target Value (ngmL) Mean Recovery from the Pad () Meperidine 25 867
Tramadol 25 877
Oxycodone 20 966
Source Moore Rana amp Coulter 2007a Moore et al 2006 THC recovery from the pad gt 80
For a more thorough discussion of the Quantisal device see the pilot study report (Lacey et al 2007)
Blood Collection Procedures After completion of the oral fluid sample and the drug questionnaire the interviewer requested that the subject provide a blood sample in exchange for an additional $50 incentive The incentives were given as money orders so subjects could not spend the money immediately especially on items such as alcohol and other drugs
Licensed phlebotomists conducted the blood draws The phlebotomist set up the blood draw station in the rear seat of a rental van The subject sat in the back seat of the van and the phlebotomist stood just outside the van or sat in the adjoining seat
During blood draws one gray-top tube (10 mL) of the subjectrsquos blood was drawn There are several types of tubes available for the collection of blood specimens with different color tops The choice of tube is dependent upon the type of test to be performed on the blood The Federal Aviation Administration (FAA) recommends the gray-topped tube for drug and alcohol testing of blood specimens The gray-top tube contains two preservatives potassium oxalate and sodium fluoride The oxalate is an anti-coagulant and the sodium fluoride is an anti-bacterial stabilizer These preservatives reduce the need for refrigeration but do not affect the ability to detect and quantify drugs Both additives are inorganic therefore they oxidize very slowly and are extremely stable The preservative helps inhibit the degradation of cocaine in storage to its
29
2007 National Roadside Survey of Alcohol and Drug Use by Drivers Drug Results
metabolite benzoylecgonine (Toennes amp Kauert 2001) The presence of sodium fluoride with or without refrigeration and potassium oxalate effectively inhibits cocaine degradation with 86 to 91 percent of the drug present after 48 hours In contrast substantial degradation of cocaine occurs in the samples stored without sodium fluoride (Brogan et al 1992) The presence of the parent drug is particularly useful in the determination of recent use since more cocaine per se (prior to its transformation to benzoylecgonine) indicates more recent drug use Additionally gray-top tubes are helpful in conducting ethanol analysis because the sodium fluoride is an effective antibacterial agent that helps inhibit endogenous alcohol production
For this study glass tubing was used as opposed to plastic to better maintain reliable drug results For example in a study by Christophersen (1986) on the stability of THC in whole blood during storage THC concentration in blood stored in glass vials for four weeks at -20 C remained unchanged however blood stored in plastic vials lost 60 to 100 percent of its THC content during storage Thus glass vials are recommended for collection of blood samples where marijuana content is suspected In this study approximately 10 percent of the blood samples were analyzed immediately upon receipt by the laboratory However the remaining samples were stored at 4 degrees Centigrade until additional funding was obtained for their analyses approximately one year later As a check on 13 samples which had been analyzed initially and were found to be positive for THC andor its metabolites reanalysis for THC and its metabolites one year later revealed that though values obtained were generally lower than in the initial analyses each specimen tested positive for THC andor a metabolite at the retest Additionally six samples which initially had been found to be positive for cocaine andor its metabolites were reanalyzed and though parent drug values had eroded metabolite values had increased and all were still positive for cocaine at retest For eight opiate samples and six amphetamine samples the results at retest remained positive after one year
The blood sample tubes were labeled with pre-printed Chain-of-Custody (CoC) labels that linked the blood sample to the oral fluid sample to the subject so the specimen could be tracked throughout the project The CoC labels contained a unique identifier that corresponded to that sample thus there was no identifying information traceable to the subject This number was also entered into the PDA CoC numbers were preprinted by the laboratory and were used to maintain a documented link between each sample collected and the respondent who provided it As noted above a different CoC number was assigned to the oral fluid and blood sample for an individual subject and the laboratory was blinded to any link between them
In the few cases where phlebotomists were not able to draw a full tube for a subject because some individuals had small andor difficult-to-locate veins the laboratory was able to conduct an initial screening test however it was not able to conduct a confirmatory analysis by GCMS due to the insufficient volume
At the conclusion of the blood draw procedure the subject received the $50 incentive and sat for a moment in the blood draw station The subject was offered a piece of candy before being directed safely out of the survey site and back onto the roadway
Once collected blood samples were stored either in refrigerators or in coolers with blue ice packs if no refrigeration was available The samples were subsequently shipped to the laboratory with blue ice as an additional precaution
Spanish-speaking participants were escorted to the phlebotomist by the Spanish-speaking interviewer and a Spanish consent form was given to the participant The interviewer read the
30
2007 National Roadside Survey of Alcohol and Drug Use by Drivers Drug Results
consent form to them and stayed with the participant to answer any questions and provide translation between the phlebotomist and participant
Drug Questionnaire While they provided an oral fluid sample drivers were asked to complete a drug questionnaire The 27-item questionnaire (Table 16) included a list of drugs including tobacco cough medicine other illegal prescription and over-the-counter drugs For items 1-23 subjects indicated when they last used a particular medicationdrug by responding ldquoTonightrdquo ldquoPast 2 daysrdquo ldquoPast monthrdquo Past yearrdquo ldquoOver a year agordquo or ldquoNeverrdquo
Table 16 Drug Questionnaire Survey
Item Drugs
1 Tobacco (eg cigarettes cigars)
2 Cough medicines (eg Robitussin Vicks 44 etc)
3 Other over-the-counter medicines
4 Prescription Pain Killers (eg Percocet OxyContin Oxycodone Demerol Darvon)
5 Ambien or other sleep aids
6 ADHD medications (eg Ritalin Aderall Concerta)
7 Muscle relaxants (eg Soma Miltown)
8 Prescription dietary supplements (eg Phentermine)
9 Antidepressants (eg Prozac Zoloft)
10 Marijuana (eg pot hash weed)
11 Cocaine (eg crack or coke)
12 Heroin
13 Methadone
14 LSD (acid)
15 Morphine or Codeine (eg Tylenol with Codeine)
16 Ecstasy (eg ldquoErdquo Extc MDMA ldquoXrdquo)
17 Amphetamine or Methamphetamine ( eg speed crank crystal meth)
18 GHB
19 PCP (eg Angeldust)
20 Rohypnol (Ruffies)
21 Ketamine (Special K)
22 Benzodiazepines (eg Valium or tranquilizers)
23 Barbiturates (eg Phenobarbital) Do you believe any of the medicationsdrugs you have taken (or are taking) could affect your 24 driving Have you taken any medications or drugs in the past YEAR that you think may have affected your 25 driving
26 Have you taken any medications or drugs TODAY that you think may affect your driving
27 Have you ever NOT driven because you were on a medicationdrug
31
2007 National Roadside Survey of Alcohol and Drug Use by Drivers Drug Results
Biological Sample Analysis Procedures The following sections briefly describe the analytic techniques used in the analyses of oral fluid and blood samples to determine the presence of the drugs of interest in this study
Oral Fluid Sample Analysis Procedures Each weekend the tubes from each data-collection period were packaged together and sent overnight to a laboratory for analysis Upon receipt of the specimens in the testing facility screening analysis was carried out using enzyme-linked immunosorbent assays (ELISA) at the cut-off concentrations described in Table 13 Screen positive specimens were then reanalyzed using a separate sample of the fluid using gas chromatography-mass spectrometry (GCMS) or liquid chromatography with tandem mass spectral detection (LCMSMS) according to standard operating procedures All methods were fully validated according to good laboratory practices and all standard operating procedures are on file at Immunalysis Corporation
Gas Chromatography-Mass Spectrometry (GCMS) Instrumentation
Agilent 6890 gas chromatography - 5973 or 5975 mass selective detector (GCMSD) electron impact (EI) mode
Extraction
Oral fluid (1 mL) of diluted specimen (13 buffer) was extracted using mixed mode solid phase methods with drug specific column phases
Derivatization
Drug specific derivatives used for maximum detectability and stability
Drugs included in the confirmation profile are shown in Table 13
Liquid Chromatography-Tandem Mass Spectrometry (LCMS-MS) Instrumentation
Agilent LCMS-MS System 1200 Series LC pump 6410 Triple Quadropole
Zorbax Eclipse XDB C18 (46 x 50mm x 18 μm) column
Extraction
Blood (1 mL) protein precipitate with cold acetonitrile mixed mode solid phase extraction using drug specific column phases
32
2007 National Roadside Survey of Alcohol and Drug Use by Drivers Drug Results
Blood Sample Analysis Procedures Upon receipt of the specimens by the testing facility screening analysis for 10 percent of the sample was carried out using enzyme-linked immunosorbent assays (ELISA) at the cut-off concentrations described in Table 13 The remaining 90 percent of the sample was stored at 4deg centigrade until funding was provided for their analysis Again specific drugs tested are shown in Table 13 Screen positive specimens were confirmed using either gas chromatography with mass spectral detection (GCMS) or liquid chromatography with tandem mass spectral detection (LCMSMS) All methods were fully validated according to good laboratory practices See above for instrumentation
Ethanol (Oral Fluid and Blood) Screen positive alcohol specimens were sent for confirmation to BioTox Laboratories or Immunalysis Corporation
Instrumentation
Perkin-Elmer Model F-45 Gas Chromatograph
Flame ionization detector (FID)
02 percent Carbowax 1500 Graphpac-GC 80100 column (6 ft x 18 in ID)
Extraction
Whole blood or 13 buffered oral fluid (01 mL) add 1 mL double deionized water containing 01 percent propanol
Analyzed using headspace GCFID
Drug Classes and Categories Due to the large number of drugs tested results were consolidated into drug classes and categories Drug classes are defined according to potential drug effects and include stimulants sedatives marijuana antidepressants narcotic analgesics and other Drugs were separately categorized as illegal prescription and over-the-counter12 13 Though some drugs could logically fall into more than one category we made the categories mutually exclusive and assigned each drug to only one category This approach facilitates clear presentation of results
Tables 17 and 18 present drug classes and categories In the tables the shaded entries indicate drugs that were identified only through blood analyses The non-shaded entries are drugs that were identified through both oral fluid and blood analyses
12 Drugs may be classified in different ways depending on the use of the classification system For example in NHTSArsquos drug evaluation and classification (DEC) program the categories CNS Depressants CNS Stimulants Hallucinogens Dissociative Anesthetic (PCP) Narcotic Analgesics Inhalants and Cannabis are used 13 Due to relative small sample sizes and for analytical purposes the over-the-counter and prescription categories were further collapsed into a single category (ldquoMedicationsrdquo)
33
20
07 N
atio
nal R
oads
ide
Sur
vey
of A
lcoh
ol a
nd D
rug
Use
by
Driv
ers
Dru
g R
esul
ts
34
Tab
le 1
7 D
rug
Cla
ss C
om
po
siti
on
mdashO
ral F
luid
an
d B
loo
d C
om
bin
ed
Sti
mu
lan
ts
Sed
ativ
es
Mar
ijuan
a A
nti
dep
ress
ants
N
arco
tic
An
alg
esic
s O
ther
Am
ph
etam
ines
B
arb
itu
rate
s C
ann
abin
oid
s S
SR
Is
Met
had
on
e
C
ou
gh
Su
pp
ress
ants
Am
phet
amin
e
But
albi
tal
TH
C
Flu
oxet
ine
Met
hado
ne
Dex
trom
etho
rpha
nM
DA
P
heno
barb
ital
11-O
H-T
HC
D
esm
ethy
lser
tral
ine
ED
DP
MD
EA
Pen
toba
rbita
l T
HC
-CO
OH
S
ertr
alin
e
S
tree
t D
rug
s M
DM
A
Sec
obar
bita
l
N
orflu
oxet
ine
O
pia
tes
Ket
amin
e M
etha
mph
etam
ine
6-A
M (
Her
oin)
N
orke
tam
ine
P
hent
erm
ine
B
enzo
dia
zep
ines
Tri
cyc
lics
6-
AC
(H
eroi
n im
purit
y)
PC
P
Pse
udoe
phed
rine
Alp
razo
lam
Am
itrip
tylin
e C
odei
ne
P
heny
lpro
pano
lam
ine
Alp
ha-h
ydro
xyal
praz
olam
Nor
trip
tylin
e M
orph
ine
C
hlor
diaz
epox
ide
D
oxep
in
H
ydro
codo
ne
Co
cain
e D
iaze
pam
Des
met
hyld
oxep
in
Hyd
rom
orph
one
Coc
aine
Lo
raze
pam
Im
ipra
min
e O
xyco
done
Ben
zoyl
ecgo
nine
O
xaze
pam
Des
ipra
min
e O
xym
orph
one
Coc
aeth
ylen
e T
emaz
epam
Trim
ipra
min
e
Nor
coca
ine
Tria
zola
m
C
lom
ipra
min
e
Aty
pic
al O
pio
ids
Alp
ha-h
ydro
xytr
iazo
lam
Am
oxap
ine
Tra
mad
ol
AD
HD
Med
icat
ion
s
C
lona
zepa
m
P
rotr
ipty
line
Mep
erid
ine
M
ethy
lphe
nida
te
Flu
nitr
azep
am
M
apro
tilin
e N
orm
eper
idin
e
7-
amin
oflu
nitr
azep
am
P
ropo
xyph
ene
Bro
maz
epam
Sle
ep A
ids
N
orpr
opox
yphe
ne
Nitr
azep
am
Z
olpi
dem
Est
azol
am
M
idaz
olam
Flu
raze
pam
N
ordi
azep
am
Car
iso
pro
do
l
C
aris
opro
dol
M
epro
bam
ate
Not
e S
had
ed e
ntrie
s in
dica
te d
rugs
iden
tifie
d th
roug
h bl
ood
ana
lyse
s o
nly
N
on-s
had
ed e
ntrie
s ar
e dr
ugs
ide
ntifi
ed
thro
ugh
both
blo
od
and
oral
flu
id a
naly
ses
Sel
ectiv
e S
erot
onin
Upt
ake
Inhi
bito
rs (
SS
RIs
)
20
07 N
atio
nal R
oads
ide
Sur
vey
of A
lcoh
ol a
nd D
rug
Use
by
Driv
ers
Dru
g R
esul
ts
35
Tab
le 1
8 D
rug
Cat
ego
ry C
om
po
siti
on
mdashO
ral F
luid
an
d B
loo
d C
om
bin
ed
Illeg
al
P
resc
rip
tio
n
Pre
scri
pti
on
(co
nt
) P
resc
rip
tio
n (
con
t)
Ove
r-th
e-C
ou
nte
r
Co
cain
e B
enzo
dia
zep
ines
T
ric
yclic
s A
nti
dep
ress
ants
M
eth
ado
ne
Co
ug
h S
up
pre
ssan
t C
ocai
ne
Alp
razo
lam
A
mitr
ipty
line
Met
hado
ne
Dex
trom
etho
rpha
nB
enzo
ylec
goni
ne
Alp
ha-h
ydro
xyal
praz
olam
N
ortr
ipty
line
ED
DP
C
ocae
thyl
ene
Nor
diaz
epam
D
oxep
in
C
old
Med
icin
e N
orco
cain
e C
hlor
diaz
epox
ide
Des
met
hyld
oxep
in
O
pia
tes
P
seud
oeph
edrin
e
D
iaze
pam
Im
ipra
min
e
C
odei
ne
C
ann
abin
oid
s Lo
raze
pam
D
esip
ram
ine
Mor
phin
e
T
HC
O
xaze
pam
T
rimip
ram
ine
Hyd
roco
done
11-O
H-T
HC
T
emaz
epam
C
lom
ipra
min
e H
ydro
mor
phon
e
T
HC
-CO
OH
T
riazo
lam
A
mox
apin
e O
xyco
done
Alp
ha-h
ydro
xytr
iazo
lam
P
rotr
ipty
line
Oxy
mor
phon
e
S
tree
t D
rug
s F
lura
zepa
m
Map
rotil
ine
Ket
amin
e F
luni
traz
epam
A
typ
ical
Op
ioid
s
Nor
keta
min
e 7-
amin
oflu
nitr
azep
am
S
tim
ula
nts
T
ram
adol
PC
P
Nitr
azep
am
Met
hylp
heni
date
M
eper
idin
e
M
idaz
olam
Phe
nter
min
e N
orm
eper
idin
e
Str
eet
Am
ph
etam
ines
B
rom
azep
am
Pro
poxy
phen
e
Am
phet
amin
e
C
lona
zepa
m
B
arb
itu
rate
s N
orpr
opox
yphe
ne
MD
A
Est
azol
am
But
albi
tal
MD
MA
Phe
noba
rbita
l S
leep
Aid
s
M
DE
A
SS
RIs
P
ento
barb
ital
Zol
pide
m
M
etha
mph
etam
ine
F
luox
etin
e S
ecob
arbi
tal
Phe
nylp
ropa
nola
min
e D
esm
ethy
lser
tral
ine
Car
iso
pro
do
l
S
ertr
alin
e
C
aris
opro
dol
O
pia
tes
Nor
fluox
etin
e
Mep
roba
mat
e
6-
AM
(H
eroi
n)
6-A
C (
Her
oin
impu
rity)
Not
e S
had
ed e
ntrie
s in
dica
te d
rugs
iden
tifie
d th
roug
h bl
ood
ana
lyse
s o
nly
N
on-s
had
ed e
ntrie
s ar
e dr
ugs
ide
ntifi
ed
thro
ugh
both
blo
od
and
oral
flu
id a
naly
ses
Sel
ectiv
e S
erot
onin
Upt
ake
Inhi
bito
rs (
SS
RIs
)
2007 National Roadside Survey of Alcohol and Drug Use by Drivers Drug Results
36
2007 National Roadside Survey of Alcohol and Drug Use by Drivers Drug Results
Results Since two different biological matrices (oral fluid and blood) were gathered to be analyzed for the presence of drugs we present prevalence estimates in three different ways in this report
1) We present both daytime and nighttime drug prevalence estimates based on the analyses of the oral fluid samples alone and then in combination with alcohol using breath alcohol test results Tables reporting self-report drug use observed safety measures and reports with contact with the criminal justice system and the health care system follow these results
2) We next present nighttime drug prevalence estimates based on analyses of blood14
and then in combination with alcohol using breath alcohol test results
3) The third section presents nighttime prevalence results based on the combination of the results of the oral fluid blood analyses and subsequently in combination with alcohol using breath alcohol test results We conclude this section by presenting prevalence estimates for specific drugs from oral fluid andor blood combined In each of the sections the results are presented first in terms of drivers who were positive for any drug then by class followed by category as described in Tables 17 and 18
Throughout this report we do not combine results for daytime and nighttime survey respondents but display the two groups separately because the sampling frame is different for the two groups The daytime drivers were sampled during a single Friday two-hour period in each PSU while the nighttime drivers were sampled during four two-hour periods (two on Friday night and two on Saturday night in each PSU) Thus combining the daytime and nighttime samples would not result in a meaningful representation of driver drug use overall
Each of the various sampling stages (or frames) required a separate calculation of probability which then became a component of the final probability computation reflecting all levels or frames The total weighted number of the sample was identical to the total number of eligible drivers entering the survey bays including refusers but was adjusted to reflect the estimated distribution of those drivers in the 48 contiguous States Error terms for the analyses were computed by STATA (Stat Corp 2006) to account for the differential weights and the amount of variance attributable to the various sampling frames Further information on the weighting of the data can be found in the Methodology Report (Lacey et al 2009a)
Oral Fluid Results (Daytime and Nighttime Samples) Driver Drug Use Prevalence Based on Oral Fluid Results This section of the report presents the overall results of oral fluid analyses for all of the drugs indicated in the introductory section Drivers who tested positive for one or more of the drugs we tested in oral fluid are categorized as drug-positive It should be emphasized that this set of tables aggregates over-the-counter prescription and illegal drugs and metabolites of drugs in each category indicating only that those who tested positive have recently consumed at least one of the tested drugs and not that they were necessarily impaired by the substance
14 Daytime data collection did not include requests for blood samples
37
2007 National Roadside Survey of Alcohol and Drug Use by Drivers Drug Results
Unless explicitly indicated sample size (N) refers to the actual unweighted number of respondents Percentages are weighted Sample size may vary between tables because of missing values
Comparison of drug prevalence by time of day (Table 19) indicates that 11 percent of drivers in the daytime sample were drug-positive This level was significantly lower than the 144 percent of nighttime drivers who tested positive for drugs (p lt 01)
Table 19 Drug Prevalence by Time of Day (Oral Fluid)
Time of Day N
(Unweighted) Drug Positive
(Weighted) Daytime 1850 110
Nighttime 5869 144
Further when we examined drug prevalence by time of daysession (Table 20) we found that late night (Sessions 3 and 5) drivers were significantly more likely to be drug-positive (172 and 174 respectively) than Friday daytime (Session 1) drivers (11) or Friday and Saturday early evening (Sessions 2 and 4) drivers (129 and 136 respectively) (p lt 01)
Table 20 Drug Prevalence by Time of DaySession (Oral Fluid)
Session N
(Unweighted) Drug Positive
(Weighted)
1 Friday 930 am ndash 1130 am or 130 pm ndash 330 pm
1850 110
2 Friday 1000 pm ndash Midnight 1610 129
3 Friday 100 am ndash 300 am 1299 172
4 Saturday 1000 pm ndash Midnight 1684 136
5 Saturday 100 am ndash 300 am 1276 174
Comparison of drug prevalence by time and region (Table 21) revealed that the Northeast region had the greatest percentage of drug-positive findings in the nighttime driving sample at 173 percent (p lt 05) The Northeast region also had the second highest percentage in the daytime driving sample at 125 percent (although there were no statistical differences by region during the daytime) In spite of the Northeast regionsrsquo relatively high prevalence of drug-positives no clear pattern by region emerged
38
2007 National Roadside Survey of Alcohol and Drug Use by Drivers Drug Results
Table 21 Drug Prevalence by Time of Day and Region15 (Oral Fluid)
N Drug Positive Time of Day Region (Unweighted) (Weighted)
Daytime
Midwest Northeast South West
546 379 472 453
115
125
131
89
Overall Daytime 1850 110
Nighttime
Midwest
Northeast
South
West
1694
1111
1559
1505
150
173
140
129
Overall Nighttime 5869 144
Although the daytime driving sample showed no statistically significant difference in drug prevalence between males and females (Table 22) in the nighttime driving sample male drivers were significantly more likely to be drug-positive (165) than female drivers (113) (p lt 01)
Table 22 Drug Prevalence by Time of Day and Gender (Oral Fluid)
N Drug Positive Time of Day Gender (Unweighted) (Weighted)
Daytime Males Females
1032 811
110
113
Overall Daytime 1843 110
Nighttime
Males
Females
3605
2250
165
113
Overall Nighttime 5855 144
Comparison of drug prevalence by time of day and age (Table 23) showed that within the daytime driving sample drivers aged 45-64 showed the highest percentage of drug positives and drivers aged 16-20 and aged 65+ were significantly less likely to be positive than other ages of drivers (p lt 05) In the nighttime driving sample drivers aged 45-64 and 65+ were significantly less likely to be drug positive (p lt 01) Drivers aged 16-20 21-34 years and 35-44 years all had results similar to each other Age was self-reported by respondent Note that in Table 23 as well as upcoming tables the age ranges are not of equal intervals but were developed to roughly
15 Regions are defined by the NASSGES system according to US Census Regions (Midwest includes the West North Central and East North Central States Northeast includes New England and Middle Atlantic States South includes the West South Central East South Central and South Atlantic States and West includes West and Mountain States
39
2007 National Roadside Survey of Alcohol and Drug Use by Drivers Drug Results
categorize underage drivers (16-20) young drivers (21-34) followed by middle age and late middle age (35-44 and 45-64) and finally by senior drivers (65+ years)
Table 23 Drug Prevalence by Time of Day and Age (Oral Fluid)
N Drug Positive Time of Day Age (Unweighted) (Weighted)
Daytime
16-20 21-34 35-44 45-64 65+
99 436 374 668 245
62
112
116
133
64
Overall Daytime 1822 111
Nighttime
16-20 21-34 35-44 45-64 65+
961 2437 1042 1216
148
161
171
152
95
20
Overall Nighttime 5804 146
Gender comparisons within age groups (Table 24) revealed that within the daytime sample drug prevalence among female daytime drivers aged 45-64 (168) was significantly higher than male drivers of the same age group (97) (p lt 05) The same was true of the nighttime sample with drug prevalence among female drivers aged 45-64 (131) being significantly higher than male drivers of the same age group (72) (p lt 01)
Within the daytime sample drug prevalence among male drivers aged 21-34 years was statistically higher than among female drivers of the same age group (139 versus 75) (p lt 05) Additionally in the nighttime sample drug prevalence among male drivers in age categories 16-20 years 21-34 years and 35-44 years was significantly higher than the same-aged female counterparts (p lt 01)
40
2007 National Roadside Survey of Alcohol and Drug Use by Drivers Drug Results
Table 24 Drug Prevalence by Time of Day Age and Gender (Oral Fluid)
N Drug Positive Time of Day Gender Age (Unweighted) (Weighted)
Daytime
Males
16-20
21-34
35-44
45-64
65+
59
243
192
362
161
45
139
137
97
71
Overall Males ndash Daytime 1017 110
Females
16-20
21-34
35-44
45-64
65+
39
192
181
304
84
103
75
101
168
48
Overall Females ndash Daytime 800 114
Nighttime
Males
16-20
21-34
35-44
45-64
65+
598
1492
630
734
101
207
202
182
72
19
Overall Males ndash Nighttime 3555 167
Females
16-20
21-34
35-44
45-64
65+
362
940
409
480
47
95
119
109
131
23
Overall Females ndash Daytime 2238 113
Comparisons by self-reported race and ethnicity (Table 25) showed that in both the daytime and nighttime samples drivers who identified themselves as Asian were significantly less likely to be drug-positive (41 and 18 respectively) than drivers who identified themselves as African American Hispanic White or Other (p lt 05 at daytime p lt 01 at nighttime) Although statistically non-significant African American drivers were found to have the highest percentage of drug-positive results in both daytime (144) and nighttime (205) samples followed by Other (128 daytime and 162 nighttime) and White (116 daytime and 15 nighttime)
41
2007 National Roadside Survey of Alcohol and Drug Use by Drivers Drug Results
Table 25 Drug Prevalence by RaceEthnicity (Oral Fluid)
N Drug Positive Time of Day RaceEthnicity (Unweighted) (Weighted)
Daytime
African American Asian Hispanic White Other
267 46
253 1192
59
144
41
89
116
128
Overall Daytime 1817 112
Nighttime
African American Asian Hispanic White Other
973 191
1006 3355
272
205
18
118
150
162
Overall Nighttime 5797 146
RaceEthnic groups other than ldquoHispanicrdquo are always ldquonon-Hispanicrdquo
Comparisons of drug prevalence by education level (Table 26) revealed that prevalence of drug use increased from the daytime sample to the nighttime sample across all education levels except ldquosome collegerdquo Daytime drivers who identified themselves as college graduates or having some graduate experience were statistically less likely to be drug-positive than those with less education (p lt 01) This remained the case within the nighttime sample but only for drivers who identified themselves as college graduates (p lt 01)
Table 26 Drug Prevalence by Education Level (Oral Fluid)
N Drug Positive Time of Day Education Level (Unweighted) (Weighted)
Daytime
Not a High School Graduate High School Graduate Some College College Graduate Some Graduate Work
162 476 593 419 173
154
150
139
55
41
Overall Daytime 1823 111
Nighttime
Not a High School Graduate High School Graduate Some College College Graduate Some Graduate Work
573 1470 2218 1156
387
184
224
116
95
157
Overall Nighttime 5804 146
Comparing drug prevalence by employment status (Table 27) showed that in the daytime sample drug prevalence among unemployed drivers and drivers on disability was significantly higher than that of employed drivers or homemakers students and those who reported they were
42
2007 National Roadside Survey of Alcohol and Drug Use by Drivers Drug Results
retired (p lt 01) In the nighttime sample drug prevalence among drivers on disability was again significantly higher than employed drivers (p lt 01) while no statistical difference in drug prevalence was found in the nighttime sample between unemployed and employed drivers Within the nighttime sample employed drivers had significantly higher drug prevalence than ldquohomemakerrdquo and ldquoretiredrdquo drivers (p lt 01)
Table 27 Drug Prevalence by Employment Status (Oral Fluid)
N Drug Positive Time of Day Gender (Unweighted) (Weighted)
Daytime
EmployedSelf Employed Homemaker Student UnemployedRetired On Disability Other
1240 90 73 78
286 45 11
104
42
72
213
139
387
307
Overall Daytime 1823 111
Nighttime
EmployedSelf Employed Homemaker Student UnemployedRetired On Disability Other
4618 104 585 204 205
67 22
150
59
132
168
74
412
43
Overall Nighttime 5805 146
Drug prevalence rates among drivers of various vehicle types (passenger vehicle pickup sports utility vehicles (SUV) vanminivan and motorcycles) (Table 28) were not statistically different in the daytime sample Note however that motorcyclists had the greatest percentage of drug-positive results in both the daytime and nighttime samples although this difference was found to be statistically significant only in the nighttime sample (p lt 01)
43
2007 National Roadside Survey of Alcohol and Drug Use by Drivers Drug Results
Table 28 Drug Prevalence by Vehicle Type (Oral Fluid)
Drug Time of N Positive
Day Vehicle Type (Unweighted) (Weighted)
Passenger Vehicle 952 121
Pickup 285 66
SUV 394 97Daytime Van amp Minivan 177 126
Motorcycle 30 248
1838 110
Passenger Vehicle 3623 151
Pickup 695 144
SUV 1055 121
Overall Daytime
Nighttime Van amp Minivan 381 130
Motorcycle 73 324
5827 145Overall Nighttime
Driver Drug Use Prevalence by Drug Class Based on Oral Fluid Results In this section of the report we display driver drug use prevalence by class of drug The classes of drugs for which we tested were antidepressants marijuana narcotic-analgesics sedatives stimulants and other (see Table 17) Because some drivers tested positive for drugs in more than one class an additional mutually exclusive category ldquoMore than 1 Classrdquo appears in the drug class tables This was done to avoid double counting individual positive results Thus for example since marijuana is both a class by itself and could appear in the ldquoMore than 1 classrdquo cell as well (as could other classes of drugs) from these tables one cannot arrive at an overall prevalence estimate for marijuana alone Detailed summaries of prevalence estimates for individual drugs appear in Tables 137-140 later in the report
Drug Class
Comparison of drug classes by time of day (Table 29) indicated that when examining all drivers nighttime drivers were significantly more likely to test positive for more than one drug class (23) than daytime drivers (15) (p lt 01)
Table 29 Number and Distribution of Drug Classes by Time of Day (Oral Fluid)
Number of N Time of Day Drug Classes (Unweighted) (Weighted)
1 206 95
2+ 40 15Daytime Negative 1604 890
1850 1000
1 680 121
2+ 156 23
Overall Daytime
Nighttime Negative 5033 856
5869 1000Overall Nighttime
44
2007 National Roadside Survey of Alcohol and Drug Use by Drivers Drug Results
However when examining only drug-positive drivers (Table 30) there were no significant differences between daytime and nighttime drivers in the percentage of single-drug users (862 versus 837) or multi-drug users (138 versus 163)
Table 30 Number and Distribution of Drug Classes by Time of Day (Drug Positives Only) (Oral Fluid)
Number of N Time of Day Drug Classes (Unweighted) (Weighted)
Daytime 1 2+
206 40
862 138
Overall Daytime 246 1000
Nighttime 1 2+
680 156
837 163
Overall Nighttime 836 1000
In comparing prevalence of drug classes by time and region (Table 31) it was found that marijuana was generally the most common drug class across all the regions both in daytime (39) and nighttime (61) samples Nighttime drivers in the Midwest and Northeast regions were more likely to test positive for marijuana than daytime drivers (p lt 05) However marijuana results in the South and West regions did not differ between daytime and nighttime drivers For stimulants a higher percentage of nighttime drivers in all regions tested positive than did daytime drivers However the difference was statistically significant only in the Midwest (p lt 01) and West (p lt 05)
45
2007 National Roadside Survey of Alcohol and Drug Use by Drivers Drug Results
Table 31 Drug Classes by Time of Day and Region (Oral Fluid)
Time of Midwest Northeast South West All Day Drug Class
N=546 N=379 N=472 N=453 N=1850
Antidepressants 04 06 05 05 05
Marijuana 34 30 55 40 39
Narcotic-Analgesics 27 21 13 06 16
Sedatives 19 26 21 07 16Daytime Stimulants 08 17 22 20 16
Other 00 13 00 00 02
More than 1 Class 22 10 14 12 15
115 125 131 89 110
885 875 869 911 890
Overall Drug Positive Daytime
Negative
N=1694 N=1111 N=1559 N=1505 N=5869
Antidepressants 05 02 00 01 02
Marijuana 77 76 63 41 61
Narcotic-Analgesics 10 28 12 18 16
Sedatives 11 02 07 04 06Nighttime Stimulants 30 23 27 40 32
Other 02 00 01 05 03
More than 1 Class 16 41 29 20 23
150 173 140 129 144
850 827 860 871 856
Overall Drug Positive Nighttime
Negative
ldquoMore than 1 Classrdquo ndash Drivers testing positive for more than one drug are only counted in this category In this table percentages are weighted
Comparison of drug class by time and gender (Table 32) showed that males were significantly more likely to test positive for marijuana than females in samples of both daytime (59 males versus17 females) and nighttime (74 males versus 41 females) drivers (p lt 01) In the daytime sample females were more likely to test positive for narcotic-analgesics and sedatives than were males (p lt 01) however a statistical difference of this kind was not detected in the nighttime sample
46
2007 National Roadside Survey of Alcohol and Drug Use by Drivers Drug Results
Table 32 Drug Classes Distribution by Time of Day and Gender (Oral Fluid)
Time of Males Females Total Day Drug Class
Daytime
Antidepressants Marijuana Narcotic-Analgesics Sedatives Stimulants Other More than 1 Class
N=1032 01 59 10 12 18 00 10
N=811 09 17 25 22 14 05 21
N=1843 05 40 17 16 16 02 15
Overall Drug Positive Daytime 110 113 111 Negative 890 887 889
Nighttime
Antidepressants Marijuana Narcotic-Analgesics Sedatives Stimulants Other More than 1 Class
N=3605 03 74 18 04 33 03 30
N=2250 01 41 13 10 31 03 14
N=5855 02 61 16 06 32 03 24
Overall Drug Positive Nighttime 165 113 145 Negative 835 887 855
ldquoMore than 1 Classrdquo ndash Drivers testing positive for more than one drug are only counted in this category In this table percentages are weighted
When we examined drug classes by time of day and age (Table 33) we found that daytime drivers aged 21-34 were more likely to use marijuana (74) than daytime drivers in other age groups (p lt 01) However drivers aged 16-20 years had the highest marijuana use (98) in the nighttime sample followed by the 21-34 year age group (85) both of which were statistically higher than the other age groups (p lt 01) The prevalence of narcotic-analgesics was highest among daytime drivers aged 44-64 (29) (p lt 01) however in the nighttime sample the 35-44 age group recorded the highest prevalence of narcotic-analgesics (42) (p lt 01)
47
Table 33 Drug Class Distribution by Time of Day and Age (Oral Fluid)
Time of 16-20 21-34 35-44 45-64 65+ Total Day Drug Class
N=99 N=436 N=374 N=668 N=245 N=1822 Antidepressants 09 02 03 08 03 05 Marijuana 44 74 48 17 07 40 Narcotic-Analgesics 00 07 19 29 08 17 Sedatives 07 02 14 23 40 16
Daytime Stimulants 03 22 12 22 01 16 Other 00 00 00 07 00 02 More than 1 Class 00 06 21 26 03 15 Overall Drug Positive
62 112 116 133 64 111 Daytime
Negative 938 888 884 867 936 889 N=961 N=2437 N=1042 N=1216 N=148 N=5804
Antidepressants 03 01 04 01 03 02 Marijuana 98 85 41 11 00 62 Narcotic-Analgesics 11 08 42 14 04 16 Sedatives 00 06 12 07 13 07
Nighttime Stimulants 20 36 28 45 00 33 Other 02 05 02 01 00 03 More than 1 Class 27 29 22 15 00 24 Overall Drug Positive
161 171 152 95 20 146 Nighttime
Negative 839 829 848 905 980 854 ldquoMore than 1 Classrdquo ndash Drivers testing positive for more than one drug are only counted in this category In this table percentages are weighted
2007 National Roadside Survey of Alcohol and Drug Use by Drivers Drug Results
Driver Drug Use Prevalence by Drug Category Based on Oral Fluid Results In this section of the report we display drug use prevalence results from oral fluid tests by drug category The three drug categories were illegal prescription and over-the-counter Because there were very few positive results for over-the-counter drugs the prescription and over-theshycounter categories are combined in these tables into a single category (ldquoMedicationsrdquo) Additionally some respondents tested positive for more than one category of drug Thus tables presenting drug categories present four mutually exclusive categories Illegal Medications Illegal and Medications and Negative So as not to double count individual positive results an individualrsquos result appears in only one of these categories However for example in Table 34 to determine the proportion of daytime drivers who tested positive for illegal drugs one could sum the daytime values for the ldquoIllegalrdquo category (58) and for the rdquo Illegal amp Medicationsrdquo category (05) to arrive at a prevalence estimate of 63 of daytime drivers who were positive for at least one illegal drug Detailed summaries of prevalence estimates for individual drugs appear in Tables 137-140 later in the report
As previously noted drugs may be classified in different ways depending on the use of the classification system For example in NHTSArsquos drug evaluation and classification (DEC)
48
2007 National Roadside Survey of Alcohol and Drug Use by Drivers Drug Results
program the categories CNS Depressants CNS Stimulants Hallucinogens Dissociative Anesthetic (PCP) Narcotic Analgesics Inhalants and Cannabis are used
Comparison of drug categories by time of day (Table 34) reveal that almost 6 percent of daytime drivers tested positive for drugs in the ldquoIllegalrdquo category as opposed to over 10 percent of nighttime drivers This was a statistically significant difference between the two groups (p lt 01) Positive results in the ldquoMedicationsrdquo category although not statistically significant were found to be slightly higher among the daytime drivers (almost 5) than nighttime drivers (3)
Table 34 Drug Categories Distribution by Time of Day (Oral Fluid)
N Time of Day Drug Category (Unweighted) (Weighted)
Daytime
Illegal Medications Illegal amp Medications Negative
125 107 14
1604
58 48 05
890 Overall Daytime 1850 1000
Nighttime
Illegal Medications Illegal amp Medications Negative
575 201 60
5033
105 30 09
856 Overall Nighttime 5869 1000
ldquoMedicationsrdquo includes prescription and over-the-counter drugs
Comparison of drug categories by time of day and region (Table 35) showed that of daytime drivers the South region had the highest percentage of positive results for ldquoIllegalrdquo followed by the West region however these differences were not statistically significant In the nighttime sample the Midwest region had the highest percentage of ldquoIllegalrdquo drug prevalence although this difference was not statistically significant
49
2007 National Roadside Survey of Alcohol and Drug Use by Drivers Drug Results
Table 35 Drug Categories Distribution by Time of Day and Region (Oral Fluid)
N Time Region Drug Category (Unweighted) (Weighted)
Daytime
Midwest
Illegal Medications Illegal amp Medications Negative
38 47 5
456
42 67 05
885 Overall 546 1000
Northeast
Illegal Medications Illegal amp Medications Negative
20 20 2
337
49 75 01
875 Overall 379 1000
South
Illegal Medications Illegal amp Medications Negative
35 22 5
410
82 46 03
869 Overall 472 1000
West
Illegal Medications Illegal amp Medications Negative
32 18 2
401
63 20 07
911 Overall 453 1000
Nighttime
Midwest
Illegal Medications Illegal amp Medications Negative
185 68 14
1427
115 30 04
850 Overall 1694 1000
Northeast
Illegal Medications Illegal amp Medications Negative
112 32 14
953
108 42 23
827 Overall 1111 1000
South
Illegal Medications Illegal amp Medications Negative
131 59 22
1347
102 25 13
860 Overall 1559 1000
West
Illegal Medications Illegal amp Medications Negative Overall
147 42 10
1306 1505
98 26 05
871 1000
ldquoMedicationsrdquo includes prescription and over-the-counter drugs
50
2007 National Roadside Survey of Alcohol and Drug Use by Drivers Drug Results
When examining prevalence by drug category and gender (Table 36) we found that in the daytime sample male drivers were more likely to test positive for ldquoIllegalrdquo drugs (82) than female drivers (30) (p lt 01) Conversely daytime female drivers were more likely to show positive results for ldquoMedicationsrdquo (76) than daytime male drivers (25) (p lt 01) In the nighttime sample 125 percent of male drivers tested positive for ldquoIllegalrdquo drugs as opposed to 75 percent of female drivers (p lt 01) The difference in percentage of positive results for ldquoMedicationsrdquo between male and female drivers was not as striking in the nighttime sample as in the daytime sample and was not statistically significant
Table 36 Drug Categories Distribution by Time of Day and Gender (Oral Fluid)
N Time of Day Gender Drug Category (Unweighted) (Weighted)
Illegal 87 82 Medications 35 25
Daytime
Male Illegal amp Medications Negative
9 901
03 890
Overall 1032 1000 Illegal 38 30 Medications 72 76
Female Illegal amp Medications Negative
5 696
06 887
Overall 811 1000 Illegal 410 125 Medications 106 28
Male Illegal amp Medications Negative
41 3048
11 835
Nighttime Overall 3605 1000 Illegal 164 75 Medications 95 33
Female Illegal amp Medications Negative
19 1972
05 887
Overall 2250 1000 ldquoMedicationsrdquo includes prescription and over-the-counter drugs In this table percentages are weighted
In comparing drug categories by time of day and age (Table 37) it was clear that within the daytime sample ldquoIllegalrdquo drug use was highest for drivers aged 21-34 (99) followed by drivers aged 35-44 (65) The prevalence of ldquoIllegalrdquo drugs for these age groups differed significantly from that in the remaining age groups (p lt 01) In the nighttime sample drivers in the 21-34 year age group still maintained the highest percentage (142) of positive results for ldquoIllegalrdquo drugs however that group was followed by the youngest age group (16-20 years) for ldquoIllegalrdquo drugs (131) (p lt 01) The use of ldquoMedicationsrdquo was highest among the 45-64 year age group (88) in the daytime sample (non-significant) and in the 35-44 year old age group the nighttime sample (69) (p lt 01)
51
2007 National Roadside Survey of Alcohol and Drug Use by Drivers Drug Results
Table 37 Drug Categories Distribution by Time of Day and Age (Oral Fluid)
N Time of Day Age Drug Category (Unweighted) (Weighted)
Daytime
16-20
Illegal
Medications
Illegal amp Medications
Negative
9
2
0
88
46
16
00
938
Overall 99 1000
21-34
Illegal
Medications
Illegal amp Medications
Negative
54
14
4
364
99
12
01
888
Overall 436 1000
35-44
Illegal
Medications
Illegal amp Medications
Negative
25
23
3
323
65
42
10
884
Overall 374 1000
45-64
Illegal
Medications
Illegal amp Medications
Negative
32
51
7
578
39
88
06
867
Overall 668 1000
65+
Illegal
Medications
Illegal amp Medications
Negative
3
17
0
225
08
56
00
936
Overall 245 1000 Nighttime
16-20
Illegal Medications Illegal amp Medications Negative
120 11 12
818
131 16 14
839 Overall 961 1000
21-34
Illegal
Medications
Illegal amp Medications
Negative
308
55
28
2045
142
19
10
829
Overall 2436 1000 35-44 Illegal
Medications Illegal amp Medications Negative
82 57 11
892
76 69 07
848
52
2007 National Roadside Survey of Alcohol and Drug Use by Drivers Drug Results
N Time of Day Age Drug Category (Unweighted) (Weighted)
Overall 1042 1000
45-64
Illegal
Medications
Illegal amp Medications
Negative
64
67
9
1075
57
30
07
905
Overall 1215 1000
65+
Illegal Medications Illegal amp Medications Negative
0 9 0
139
00 20 00
980 Overall 148 1000
ldquoMedicationsrdquo includes prescription and over-the-counter drugs In this table percentages are weighted
Driver Drug Prevalence Based on Oral Fluid and BAC Results The following section presents the results of the oral fluid drug analyses combined with the blood alcohol concentration (BAC) results obtained from breath tests16 Categories for BAC by grams per deciliter (gdL) are indicated as ldquozerordquo (BAC less than 005 gdL) ldquobetween zero and 08rdquo (greater than 005 up to 08 gdL) and ldquo08+rdquo (BAC greater than 08 gdL) Note that the daytime sample consisted of very few drug positive drivers with alcohol positive results which limited the statistical testing that could be done
In comparing the number of drug-positive drivers by time of day and BAC level (Tables 38 and 39) a statistically significant association was found between drug-positive and alcohol-positive drivers within the nighttime driving sample In other words the percentage of nighttime drivers with BAC gdL 08+ was significantly higher among drug-positive drivers than among drug-negative drivers (p lt 01)
The same association was observed with the ldquobetween zero and 08rdquo category among drug-positive nighttime drivers (p lt 01) relative to drug-negative drivers However for daytime drivers no statistical association was found largely because of the small number of alcohol-positive drivers in the daytime sample
Note that because of the small number of alcohol-positive drivers in the daytime sample (n = 23) comparisons involving drug-positive drivers for this group of drivers were not attempted in the remaining portion of this report
16 More complete information on the alcohol results (not including drug results) is available in Lacey et al (2009b)
53
2007 National Roadside Survey of Alcohol and Drug Use by Drivers Drug Results
Table 38 Drug Prevalence by Time of Day and BAC (Percentages Calculated by Row) (Oral Fluid)
BAC (gdL) Time of Drug N Between
Day Result (Unweighted) Zero Zero and 08 08+ Positive 246
Overall Daytime 1845
982 14 03 Daytime Negative 1599 992 06 02
07 02991 Positive 836
Overall Nighttime 5867
805 150 45 Nighttime Negative 5031 902 81 17
91 21888 In this table percentages are weighted
Table 39 Drug Prevalence by Time of Day and BAC (Percentages Calculated by Column) (Oral Fluid)
Time of Day
Drug Result
BAC (gdL)
Zero Between
Zero and 08 08+ All
Daytime Positive Negative
N=1822 109 891
N=18 222 778
N=5 171 829
N=1845 110 890
Nighttime Positive Negative
N=5207 131 869
N=530 239 761
N=130 306 694
N=5867 144 856
In this table ldquoNsrdquo are unweighted and percentages are weighted
Table 40 shows that within the daytime sample drug-positive drivers in the age groups 16-20 and 21-34 had the greatest percentage of alcohol-positive results however it should be noted that the sample size for the youngest group was only 11 Among nighttime drug-positive participants drivers aged 21-34 had the greatest percentage of alcohol positives (in both the categories BAC between zero and 08 and BAC 08+) (p lt 01) As noted earlier the number of years within age categories is not equivalent
54
2007 National Roadside Survey of Alcohol and Drug Use by Drivers Drug Results
Table 40 BAC Among Drug-Positive Drivers by Time of Day and Age (Oral Fluid)
Time of Day Age
N (Unweighted) Zero
BAC (gdL) Between
Zero and 08 08+ 16-2021-34
11 72
897 955
00 45
103 00
Daytime 35-4445-64
65+
51 90 20
992 998
1000
08 02 00
00 00 00
Overall Positive Daytime 244 982 14 03 16-2021-34
143 392
868 750
100 197
32 53
Nighttime 35-4445-64
65+
150 141
9
878 810 836
85 143 164
37 47 00
Overall Positive Nighttime 835 804 150 45 In this table percentages are weighted
Among both daytime and nighttime drivers there were fewer alcohol-positive drivers among drug-positive drivers with 2+ classes of drugs than among those with one class of drug (Tables 41 and 42) however due to the small sample size there was no statistical difference
Table 41 BAC Among Drug-Positive Drivers by Number of Drug Classes and Time of Day (Percentages Calculated by Column) (Oral Fluid)
Time of Day Number of Drug
Classes N
(Unweighted) Zero
BAC (gdL) Between
Zero and 08 08+ 1 206 860 951 1000
Daytime 2+ 40 140 49 00 Overall Daytime 246 1000 1000 1000
1 680 834 816 963 Nighttime 2+ 156 166 184 37
Overall Nighttime 836 1000 1000 1000 In this table percentages are weighted
55
2007 National Roadside Survey of Alcohol and Drug Use by Drivers Drug Results
Table 42 BAC Among Drug-Positive Drivers by Number of Drug Classes and Time of Day (Percentages Calculated by Row) (Oral Fluid)
Time of Day Number of Drug
Classes N
(Unweighted) Zero
BAC (gdL) Between
Zero and 08 08+ 1 206 980 16 04
Daytime 2+ 40 995 05 00 Overall Daytime 246 982 14 03
1 680 801 147 52 Nighttime 2+ 156 820 170 10
Overall Nighttime 836 805 150 45 In this table percentages are weighted
When oral fluid drug category findings were combined with BAC results we found that in both the daytime and nighttime samples the drug-positive drivers who were also alcohol-positive were more likely to be positive for ldquoIllegalrdquo drugs than ldquoMedicationsrdquo (Table 43) This was particularly true in the nighttime sample in which 173 percent had BACs between zero and 08 (compared to 63 in the ldquoMedicationsrdquo category) and 57 percent had BACs greater than 08 (compared to 12 in the ldquoMedicationsrdquo category) (p lt 01) In the daytime sample however the differences were statistically non-significant (p value = 05)
Table 43 BAC Among Drug-Positive Drivers by Drug Category and Time of Day (Oral Fluid)
Time of Day Drug Category
N (Unweighted)
BAC (gdL)
Zero Between
Zero and 08 08+
Daytime Illegal Medications Illegal amp Medications Negative
125 107 14
1604
971 996 983 992
23 04 17 06
06 00 00 02
Nighttime Illegal Medications Illegal amp Medications Negative
575 199 60
5033
770 925 814 902
173 63
177 81
57 12 09 17
ldquoMedicationsrdquo includes prescription and over-the-counter drugs In this table percentages are weighted
Table 44 presents the findings by drug category age and time of day Due to the number of groupings (and thus relatively small sample sizes in included cells) caution should be exercised in the interpretation of the findings especially among the daytime driving sample Overall among the nighttime driving sample the high alcohol-positive drivers (ie drivers registering greater than 08 BAC gdL) tested positive for drugs in the ldquoIllegalrdquo category more frequently than ldquoMedicationsrdquo across all age groups except 65+ (an age group producing a very small sample size for drug positives) Further the same pattern emerged among drivers with BACs
56
2007 National Roadside Survey of Alcohol and Drug Use by Drivers Drug Results
between zero and 08 across all age groups except for the age category 45-64 where a high proportion of drivers tested positive for both ldquoIllegal and Medicationsrdquo
Table 44 BAC of Drivers by Drug Category Age and Time of Day (Oral Fluid)
Time of Day Age Drug Category
N (Unweighted) Zero
BAC (gdL) Between
Zero and 08 08+
Daytime
16-20
Illegal Medications Illegal amp Medications Negative
9 2 0
88
861 1000
NA 993
00 00
NA 07
139 00
NA 00
Overall 99 987 07 06
21-34
Illegal Medications Illegal amp Medications Negative
54 14 4
364
957 932
1000 994
43 68 00 05
00 00 00 01
Overall 436 990 10 01
35-44
Illegal Medications Illegal amp Medications Negative
25 23 3
323
986 1000 1000
991
14 00 00 07
00 00 00 02
Overall 374 991 07 01
45-64
Illegal Medications Illegal amp Medications Negative
32 51 7
578
1000 1000 958 987
00 00 42 09
00 00 00 04
Overall 668 989 08 03
65+
Illegal Medications Illegal amp Medications Negative
3 17
0 225
1000 1000
NA 998
00 00
NA 01
00 00
NA 01
Overall 245 998 01 01 Nighttime
16-20
Illegal Medications Illegal amp Medications Negative
120 11 12
818
839 1000 990 944
121 00 10 51
40 00 00 05
Overall 961 931 59 10
21-34
Illegal Medications Illegal amp Medications Negative
308 55 28
2045
736 809 846 878
204 170 154
98
61 21 00 24
Overall 2436 856 115 29
35-44
Illegal Medications Illegal amp Medications Negative
82 57 11
892
777 985 927 919
159 04 73 67
64 11 00 14
Overall 1042 913 70 17
57
2007 National Roadside Survey of Alcohol and Drug Use by Drivers Drug Results
Time of Day Age Drug Category
N (Unweighted) Zero
BAC (gdL) Between
Zero and 08 08+ Illegal 64 808 126 66
45-64 Medications Illegal amp Medications
67 9
922 333
70 609
08 58
Negative 1075 901 87 13 Overall 1215 892 92 16 Illegal 0 NA NA NA
65+ Medications Illegal amp Medications
9 0
836 NA
164 NA
00 NA
Negative 139 887 66 47 Overall 148 886 68 46
ldquoMedicationsrdquo includes prescription and over-the-counter drugs In this table percentages are weighted
When examining drug category by gender and time of day (Table 45) male drivers who tested positive for ldquoIllegalrdquo drugs in both the daytime and nighttime samples also had greater percentages of alcohol-positive results than their female counterparts However the small sample size precluded valid statistical testing on the daytime sample Within the nighttime sample differences were statistically significant (p lt 01)
Table 45 BAC of Drivers by Drug Category Gender and Time of Day (Oral Fluid)
Time of Day Gender Drug Category
N (Unweighted) Zero
BAC (gdL) Between
Zero and 08 08+
Daytime
Males
Females
Illegal Medications Illegal amp Medications Negative
87 35 9
901
967 985 956 991
25 15 44 08
08 00 00 01
Overall 1032 989 09 02 Illegal Medications Illegal amp Medications Negative
38 72 5
696
984 1000 1000 993
16 00 00 05
00 00 00 03
Overall 811 993 05 02
Nighttime
Males
Illegal Medications Illegal amp Medications Negative
410 106 41
3048
743 960 766 900
180 31 223 79
76 10 11 21
Overall 3605 881 92 27
Females
Illegal Medications Illegal amp Medications Negative
164 95 19
1972
842 875 990 904
152 110 10 83
06 15 00 12
Overall 2250 899 89 12 ldquoMedicationsrdquo includes prescription and over-the-counter drugs In this table percentages are weighted
58
2007 National Roadside Survey of Alcohol and Drug Use by Drivers Drug Results
Drugs Oral Fluid Results and Agreement with Self-Reported Drug Use Table 46 compares the results of the oral fluid analyses with responses to the self-reported drug use questionnaire This questionnaire was administered to all drivers who provided an oral fluid sample and was completed while the oral fluid device was collecting the saliva
The cross tabulation results of self-reported drug use (in the past 24 hours past 2 days past month past year over a year and never) and oral fluid analysis results (by drug category) revealed interesting findings Note that this table only reports on drivers who were drug-positive Agreement between reported past 24-hour use and drug-positive analysis results for the nighttime driving sample was greatest (highest percentage) among antidepressants cough suppressants and pain killers
The lowest correspondence (lowest percentages) was found for amphetamines and barbiturates Interestingly approximately one-quarter of marijuana-positive nighttime drivers admitted to marijuana use in the previous 24 hours this increased to over one-third when combined within the past two days A smaller proportion (75 and 58 respectively) admitted to recent use of cocaine
Among nighttime drivers who tested positive for antidepressants the majority (664) indicated they in fact used the substance in the past 24 hours Thus in this example agreement between self-reports and oral fluid analysis results are fairly high However when we examine amphetamines (typically viewed as a recreational or illegal drug) agreement between self-report and a positive test analysis is low Here about 72 percent of nighttime positive drivers indicated they ldquoneverrdquo had used the substance yet the drug analysis revealed a positive result In some instances this may be related to a reluctance to disclose however in other instances a driver may not have been aware that the substance they were taking contained the drug being reported (for example some drivers may not be aware that some diet pills contain amphetamines) Similar results were obtained for nighttime drivers providing blood samples A table reflecting those results appears in Appendix A
59
2007 National Roadside Survey of Alcohol and Drug Use by Drivers Drug Results
Table 46 Oral Fluid Results and Agreement With Self-Reported by Drug Type (Oral Fluid)
Drug Category Self-Reported
Drug Use
Oral Fluid Positive for that Drug Daytime Nighttime
N (Unwtd)
(Weighted)
N (Unwtd)
(Weighted)
Antidepressants
Past 24 Hours Past 2 Days Past Month Past Year Over a Year Never
13 0 0 1 0 4
857 00 00 47 00 96
18 0 2 0 1 4
664 00 96 00
212 28
Overall 18 1000 25 1000
Amphetamines
Past 24 Hours Past 2 Days Past Month Past Year Over a Year Never
0 0 0 0 1
13
00 00 00 00 32
968
1 0 4 3
10 51
20 00 86 89 88
718 Overall 14 1000 69 1000
Barbiturates
Past 24 Hours Past 2 Days Past Month Past Year Over a Year Never
1 0 1 0 0 4
14 00 08 00 00
978
2 0 0 0 0 8
31 00 00 00 00
969 Overall 6 1000 10 1000
Benzodiazepines
Past 24 Hours Past 2 Days Past Month
Past Year Over a Year Never
11 0 0 0 3
20
158 00 00 00 38
804
14 4 2 0 5
37
244 34 26 00 22
674 Overall 34 1000 62 1000
Cocaine
Past 24 Hours Past 2 Days Past Month Past Year Over a Year Never
1 2 1 0 3
30
04 22 06 00
186 782
10 7
10 17 29
146
75 58 48 68
170 579
Overall 37 1000 219 1000
Cough Suppressants
Past 24 Hours
Past 2 Days
Past Month
Past Year
Over a Year
2
0
0
0
0
945
00
00
00
00
6
2
3
1
1
393
198
129
23
37
Never 1 55 2 220
Overall 3 1000 15 1000
60
2007 National Roadside Survey of Alcohol and Drug Use by Drivers Drug Results
Drug Category Self-Reported
Drug Use
Oral Fluid Positive for that Drug Daytime Nighttime
N (Unwtd)
(Weighted)
N (Unwtd)
(Weighted)
Ketamine
Past 24 hrs Past 2 days Past Month Past Year Over a Year Never
0 0 0 0 0 0
NA NA NA NA NA NA
0 0 0 0 0 1
00 00 00 00 00
1000 Overall 0 NA 1 1000
Marijuana
Past 24 hrs Past 2 days Past Month Past Year Over a Year Never
21 10 15 6
19 28
217 149 152
46 167 267
91 37 55 44 65
134
257 105 114
74 131 321
Overall 99 1000 426 1000
Methadone
Past 24 hrs Past 2 days Past Month Past Year Over a Year Never
1 0 1 0 0 1
966 00 29 00 00 04
6 0 0 0 0 4
298 00 00 00 00
702 Overall 3 1000 10 1000
Opiates
Past 24 hrs Past 2 days Past Month Past Year Over a Year Never
4 2 6 4 2
13
130 37
187 19
116 511
11 7 8
13 17 51
111 45
187 24
157 476
Overall 31 1000 107 1000
Pain Killers
Past 24 hrs Past 2 days Past Month Past Year Over a Year Never
13 5 6 4 2 4
275 129 131 65
309 92
24 11 8 7 7 9
599 129
46 29
138 58
Overall 34 1000 66 1000
PCP
Past 24 hrs Past 2 days Past Month Past Year Over a Year Never
1 0 0 0 0 0
1000 00 00 00 00 00
0 0 1 0 0 1
00 00
229 00 00
771 Overall 1 1000 2 1000
61
2007 National Roadside Survey of Alcohol and Drug Use by Drivers Drug Results
Observed Safety Measures of Daytime and Nighttime Drivers (Oral Fluid) In the 2007 NRS interviewers observed and recorded seat belt use of drivers and helmet use of motorcycle riders Additionally participating drivers were asked if they were acting as designated drivers (ldquoTonightToday are you or have you been a designated driverrdquo) The results of analyses of these variables by alcohol level are discussed in some detail in a previous report summarizing the alcohol results (Lacey et al 2009b) One issue that arose in that analysis was that many respondents appeared to not understand the lsquodesignated driverrsquo question Thus in this report we are not reporting on the designated driver results Additionally since the nighttime results are quite similar whether summarized by oral fluid results or blood results we are presenting these tables on observed seat belt and helmet use only in the oral fluid results section of the body of the report The nighttime blood results are presented in Appendix A
Information on seat belt and helmet use is presented by overall prevalence (daytime and nighttime) drug class (daytime and nighttime) and drug category (daytime and nighttime) in Tables 47-52 respectively
In Table 47 there was no statistically significant association between overall daytime drug prevalence among drivers and seat belt use in the daytime sample
Table 47 Daytime Seat Belt Observation By Drug Prevalence (Oral Fluid)
N (Unweighted)
Drug Negative
(Weighted)
Drug Positive
(Weighted) Driver Seat Belt Observation
Yes 1750 890 110 No 92 862 138
When examining nighttime drug use as measured in oral fluid by observed seat belt use (Table 48) drug prevalence among nighttime drivers was significantly higher among those who did not wear a seat belt than among those who did (p lt 01)
Table 48 Nighttime Seat Belt Observation by Drug Prevalence (Oral Fluid)
N (Unweighted)
Drug Negative
(Weighted)
Drug Positive
(Weighted) Driver Seat Belt Observation
Yes 5654 859 141 No 192 754 246
62
N
(Un
wei
gh
ted
)
An
tid
epre
ssa
nts
(W
eig
hte
d)
Mar
ijuan
a
(Wei
gh
ted
)
Nar
coti
c-A
nal
ge
sic
(W
eig
hte
d)
Sed
ativ
es
(W
eig
hte
d)
Sti
mu
lan
ts
(Wei
gh
ted
)
O
ther
(W
eig
hte
d)
gt1
Dru
g C
lass
(Wei
gh
ted
)
Neg
ativ
e
(Wei
gh
ted
)
Driver Seat Belt Observation Yes 1750 05 37 17 17 17 02 15 890 No 92 08 98 13 04 00 00 15 862
N
(Un
wei
gh
ted
)
An
tid
epre
ssa
nts
(W
eig
hte
d)
Mar
ijuan
a
(Wei
gh
ted
)
Nar
coti
c-A
nal
ge
sic
(W
eig
hte
d)
Sed
ativ
es
(W
eig
hte
d)
Sti
mu
lan
ts
(Wei
gh
ted
)
O
ther
(W
eig
hte
d)
gt1
Dru
g C
lass
(W
eig
hte
d)
Neg
ativ
e
(Wei
gh
ted
) Driver Seat Belt Observation
Yes 5654 No 192
01 23
61 63
16 21
07 00
31 79
03 06
22 53
859 754
2007 National Roadside Survey of Alcohol and Drug Use by Drivers Drug Results
Table 49 shows the daytime distribution of drug classes in oral fluid by observed seat belt use Most of the observed differences in this distribution were not statistically significant The exception was marijuana which was significantly more prevalent among daytime drivers who did not wear a seat belt than among drivers who did (p lt 01)
Table 49 Daytime Seat Belt Observation by Drug Class (Percentages Calculated by Row) (Oral Fluid)
Table 50 shows the nighttime distribution of drug classes by seat belt use Stimulants were significantly more prevalent among those drivers who did not wear a safety belt than those who did (p lt 01)
Table 50 Nighttime Seat Belt Observation by Drug Class (Percentages Calculated by Row) (Oral Fluid)
63
2007 National Roadside Survey of Alcohol and Drug Use by Drivers Drug Results
Table 51 shows the daytime distribution of drug categories by seat belt use Differences in daytime oral fluid drug category results involving seat belt use by the driver were not statistically significant
Table 51 Daytime Seat Belt Observation by Drug Category (Percentages Calculated by Row) (Oral Fluid)
N (Unwtd)
Illegal
(Weighted)
Medications (Weighted)
Illegal amp Medications (Weighted)
Negative
(Weighted) Driver Seat Belt Observation
Yes 1750 56 50 04 890 No 92 103 27 07 862
Table 52 shows the nighttime distribution of drug categories by seat belt use The prevalence of illegal (ldquoIllegalrdquo and ldquoIllegal and Medicationrdquo combined) drugs was higher among those who did not use a seat belt (p lt 01)
Table 52 Nighttime Belt Observation by Drug Category (Percentages Calculated by Row) (Oral Fluid)
N (Unwtd)
Illegal
(Weighted)
Medications (Weighted)
Illegal amp Medications (Weighted)
Negative (Weighted)
Driver Seat Belt Observation Yes 5353 102 30 09 859 No 192 181 50 15 754
The number of motorcyclists sampled in the daytime was very small thus limiting our ability to perform meaningful statistical comparisons However we display daytime and nighttime helmet use (for the operator) by overall drug use prevalence class and category in Tables 53-58 Note there were an extremely low number of motorcycle riders with passengers Thus these are excluded from our tables and our analyses
Table 53 Daytime Helmet Use for Motorcycle Riders (Operators) by Drug Positive (Oral Fluid)
N (Unweighted)
Drug Positive (Weighted)
Motorcycle Riders (Operators) 30 248 Helmet 23 238 No Helmet Use 6 299 Unknown 1 00
Small sample size precluded meaningful statistical comparisons
64
N
(Un
wei
gh
ted
)
An
tid
epre
ssa
nts
(Wei
gh
ted
)
Mar
ijuan
a (W
eig
hte
d)
Nar
coti
c-A
nal
ge
sic
(Wei
gh
ted
)
Sed
ativ
es
(Wei
gh
ted
)
Sti
mu
lan
ts
(Wei
gh
ted
)
Oth
er(W
eig
hte
d)
gt1
Dru
g C
lass
(
Wei
gh
ted
)
Neg
ativ
e (W
eig
hte
d)
Motorcycle Riders (Operators) 30 00 132 00 13 28 00 76 752
Helmet 23 00 169 00 17 36 00 17 762
No Helmet Use 6 00 00 00 00 00 00 299 701
Unknown 1 00 00 00 00 00 00 00 1000
Small sample size precluded meaningful statistical comparisons
N
(Un
wei
gh
ted
)
An
tid
epre
ssa
nts
(Wei
gh
ted
)
Mar
ijuan
a (W
eig
hte
d)
Nar
coti
c-A
nal
ge
sic
(Wei
gh
ted
)
Sed
ativ
es
(Wei
gh
ted
)
Sti
mu
lan
ts
(Wei
gh
ted
)
Oth
er(W
eig
hte
d)
gt1
Dru
g C
lass
(
Wei
gh
ted
)
Neg
ativ
e (W
eig
hte
d)
Motorcycle Riders (Operators) 73 63 45 00 00 83 05 128 676
Helmet 57 10 29 00 00 13 07 87 853
No Helmet Use 14 161 75 00 00 212 00 205 347
Unknown 2 00 00 00 00 00 00 00 1000
2007 National Roadside Survey of Alcohol and Drug Use by Drivers Drug Results
Table 54 shows a statistically significant difference in nighttime drug prevalence as measured in oral fluid among riders with and without helmets Drug prevalence was higher for riders who were not using helmets (p lt 01)
Table 54 Nighttime Helmet Use for Motorcycle Riders (Operators) by Drug Positive (Oral Fluid)
N (Unweighted)
Drug Positive (Weighted)
Motorcycle Riders (Operators) 73 324 Helmet 57 147 No Helmet Use 14 653 Unknown 2 00
Examining daytime and nighttime motorcycle riders by drug class as measured in oral fluid some classes had no positives perhaps due to the small sample size (Tables 55 and 56) thus rendering statistical tests inappropriate
Table 55 Daytime Helmet Use for Motorcycle Riders (Operators) by Drug Class (Oral Fluid)
Table 56 Nighttime Helmet Use for Motorcycle Riders (Operators) by Drug Class (Percentages Calculated by Row) (Oral Fluid)
Small sample size precluded meaningful statistical comparisons
65
2007 National Roadside Survey of Alcohol and Drug Use by Drivers Drug Results
The small sample size encountered when examining daytime motorcycle riders by drug category as measured in oral fluid (Table 57) rendered statistical tests inappropriate
Table 57 Daytime Helmet Use for Motorcycle Riders (Operators) by Drug Category (Oral Fluid)
N (Unwtd)
Illegal
(Weighted)
Medications (Weighted)
Illegal amp Medications (Weighted)
Negative
(Weighted)
Motorcycle Riders (Operators) 30 159 13 76 752 Helmet 23 204 17 17 762 No Helmet Use 6 00 00 299 701 Unknown 1 00 00 00 1000
Small sample size precluded meaningful statistical comparisons
Table 58 shows that overall drug prevalence was higher for riders who were not using a helmet (p lt 01) However no statistically significant difference was observed between riders who consumed ldquoIllegalrdquo and ldquoIllegal and Medicationsrdquo and those who consumed ldquoMedicationsrdquo alone
Table 58 Nighttime Helmet Use for Motorcycle Riders (Operators) by Drug Category (Percentages Calculated by Row) (Oral Fluid)
N (Unwtd)
Illegal
(Weighted)
Medications (Weighted)
Illegal amp Medications (Weighted)
Negative
(Weighted)
Motorcycle Riders (Operators) 73 200 68 56 676 Helmet 57 42 18 87 853 No Helmet Use 14 492 161 00 347 Unknown 2 00 00 00 00
Reported Contact with the Criminal Justice System (Oral Fluid) Of the 1790 daytime NRS participants who provided an oral fluid sample and responded to the question ldquoDuring the past 12 months were you arrested and booked for driving under the influence of alcohol or drugsrdquo about 3 percent indicated ldquoYesrdquo (n = 47 unweighted) Of these almost 29 percent were drug positive (Table 59) The difference between daytime drivers who indicated ldquoYesrdquo to this question and were drug positive is statistically different from those who indicated ldquoNordquo (p lt 01)
Table 59 Arrests and Drug Positives Daytime (Oral Fluid) ldquoDuring the past 12 months were you arrested and booked for driving under the influence of alcohol or drugsrdquo
N (Unweighted)
Drug Positive (Weighted)
Yes 47 289 No 1743 108 Total 1790 113
66
N
(Un
wei
gh
ted
)
An
tid
epre
ssa
nts
(W
eig
hte
d)
Mar
ijuan
a
(Wei
gh
ted
)
Nar
coti
c-A
nal
ge
sic
(W
eig
hte
d)
Sed
ativ
es
(W
eig
hte
d)
Sti
mu
lan
ts
(Wei
gh
ted
)
Oth
er
(Wei
gh
ted
)
gt1
Dru
g C
lass
(W
eig
hte
d)
Neg
ativ
e
(Wei
gh
ted
)
Yes 47 00 207 20 26 24 00 11 711 No 1743 16 36 17 16 16 02 16 892
Total 1790 16 40 17 16 16 02 16 887
2007 National Roadside Survey of Alcohol and Drug Use by Drivers Drug Results
Among the nighttime NRS participants who provided an oral fluid sample and responded to the question ldquoDuring the past 12 months were you arrested and booked for driving under the influence of alcohol or drugsrdquo (Table 60) approximately 4 percent indicated ldquoYesrdquo (n = 234 unweighted) Of these 29 percent were drug positive compared to the 14 percent who were drug positive and indicated ldquoNordquo (p lt 01)
Additionally since the nighttime results are quite similar whether summarized by oral fluid results or blood results we are presenting these tables on contact with the criminal justice system based on nighttime blood results in Appendix A
Table 60 Arrests and Drug Positives Nighttime (Oral Fluid) ldquoDuring the past 12 months were you arrested and booked for driving under the influence of alcohol or drugsrdquo
N (Unweighted)
Drug Positive (Weighted)
Yes 234 291 No 5458 140 Total 5692 145
Of the daytime drivers who were drug positive and responded to the question ldquoDuring the past 12 months were you arrested and booked for driving under the influence of alcohol or drugsrdquo (Table 61) the majority tested positive for marijuana (207)
Table 61 Arrests and Drug Class Daytime (Oral Fluid) ldquoDuring the past 12 months were you arrested and booked for driving under the influence of alcohol or drugsrdquo
Similar to results in the daytime sample the nighttime drivers who were drug positive and responded to the question ldquoDuring the past 12 months were you arrested and booked for driving under the influence of alcohol or drugsrdquo (Table 62) the majority tested positive for marijuana (118)
67
2007 National Roadside Survey of Alcohol and Drug Use by Drivers Drug Results
Table 62 Arrests and Drug Class Nighttime (Oral Fluid) ldquoDuring the past 12 months were you arrested and booked for driving under the influence of alcohol or drugsrdquo
N (Un
wei
gh
ted
)
An
tid
epre
ssa
nts
(Wei
gh
ted
)
Mar
ijuan
a(W
eig
hte
d)
Nar
coti
c-A
nal
ge
sic
(Wei
gh
ted
)
Sed
ativ
es
(Wei
gh
ted
)
Sti
mu
lan
ts
(Wei
gh
ted
)
Oth
er(W
eig
hte
d)
gt1
Dru
g C
lass
(
Wei
gh
ted
)
Neg
ativ
e (W
eig
hte
d)
Yes 234 00 118 02 02 108 00 60 709 No 5458 02 58 17 07 30 03 23 860 Total 5692 02 60 17 07 33 03 24 855
When examining the data by drug category among daytime participants who responded to the question ldquoDuring the past 12 months were you arrested and booked for driving under the influence of alcohol or drugsrdquo (Table 63) more participants tested positive for ldquoIllegalrdquo drugs than any other drug category (233)
Table 63 Arrests and Drug Categories Daytime (Oral Fluid) ldquoDuring the past 12 months were you arrested and booked for driving under the influence of alcohol or drugsrdquo
N (Unwtd)
Illegal
(Weighted)
Medications (Weighted)
Illegal amp Medications (Weighted)
Negative
(Weighted)
Yes 47 233 53 02 711 No 1743 54 49 05 892 Total 1790 59 49 05 887
Among nighttime participants who responded to the question ldquoDuring the past 12 months were you arrested and booked for driving under the influence of alcohol or drugsrdquo (Table 64) more tested positive for ldquoIllegalrdquo drugs than any other drug category (26) Although this was slightly higher than the daytime population the difference was not statistically different
Table 64 Arrests and Drug Categories Nighttime (Oral Fluid) ldquoDuring the past 12 months were you arrested and booked for driving under the influence of alcohol or drugrdquo
N (Unwtd)
Illegal
(Weighted)
Medications (Weighted)
Illegal amp Medications (Weighted)
Negative
(Weighted)
Yes 234 260 13 17 709 No 5458 99 31 09 860 Total 5692 105 31 09 855
68
2007 National Roadside Survey of Alcohol and Drug Use by Drivers Drug Results
Reported Contact with the Health System (Oral Fluid) As indicated in previous reports on the 2007 NRS questions relating to the criminal sanctions for drinking and drug use while driving were added to the survey items as well as questions related to treatment for drug and alcohol use These questions were added to the survey to investigate potential intervention opportunities
As shown in Table 65 less than 1 percent of daytime drivers responded ldquoYesrdquo to the question ldquoDuring the past 12 months did you ever stay at least overnight in an inpatient or residential drug or alcohol treatment programrdquo Of these almost 45 percent were drug positive
Table 65 Past Treatment Program and Drug Positive Daytime (Oral Fluid) ldquoDuring the past 12 months did you ever stay at least overnight in an inpatient or residential drug or alcohol
treatment programrdquo
N (Unweighted)
Drug Positive (Weighted)
Yes 7 447 No 1738 112 Total 1745 112
Among nighttime drivers less than 1 percent responded ldquoYesrdquo to the question ldquoDuring the past 12 months did you ever stay at least overnight in an inpatient or residential drug or alcohol treatment programrdquo (Table 66) Of these 37 percent were drug positive
The response patterns to these questions by nighttime drivers providing blood samples are quite similar to those reported here for nighttime oral fluid and are presented separately in Appendix A
Table 66 Past Treatment Program and Drug Positive Nighttime (Oral Fluid) ldquoDuring the past 12 months did you ever stay at least overnight in an inpatient or residential drug or alcohol
treatment programrdquo
N (Unweighted)
Drug Positive (Weighted)
Yes 51 370 No 5449 145 Total 5500 146
(p lt 01)
Of daytime drivers who responded to the question ldquoHave you ever been admitted to an outpatient drug or alcohol treatment program NOT including meetings like AA or NArdquo17
approximately 25 percent responded ldquoYesrdquo (Table 67) Of these 384 percent were drug positive
17 AA is Alcoholics Anonymous and NA is Narcotics Anonymous
69
2007 National Roadside Survey of Alcohol and Drug Use by Drivers Drug Results
Table 67 Outpatient and Drug Positive Daytime (Oral Fluid) ldquoHave you ever been admitted to an outpatient drug or alcohol treatment program NOT including meetings like AA or NArdquo
N (Unweighted)
Drug Positive (Weighted)
Yes 44 384 No 1754 107 Total 1798 112 (p lt 01)
Of nighttime drivers who responded to the question ldquoHave you ever been admitted to an outpatient drug or alcohol treatment program NOT including meetings like AA or NArdquo approximately 28 percent responded ldquoYesrdquo (Table 68) Of these 36 percent were drug positive
Table 68 Outpatient and Drug Positive Nighttime (Oral Fluid) ldquoHave you ever been admitted to an outpatient drug or alcohol treatment program NOT including meetings like AA or NArdquo
N (Unweighted)
Drug Positive (Weighted)
Yes 159 361 No 5541 141 Total 5700 145
(p lt 01)
Of daytime drivers who responded to the question ldquoDuring the past 12 months have you received treatment for your drug or alcohol use in a self-help group such as Alcoholics Anonymous or Narcotics Anonymousrdquo approximately 1 percent responded ldquoYesrdquo (Table 69) Of these 43 percent were drug positive Of the nighttime drivers who were asked the same question approximately 2 percent responded ldquoYesrdquo (Table 70) and approximately 18 percent of those were drug positive
Table 69 AA or NA and Drug Positives Daytime (Oral Fluid) ldquoDuring the past 12 months have you received treatment for your drug or alcohol use in a self-help group such as Alcoholics
Anonymous or Narcotics Anonymousrdquo
N (Unweighted)
Drug Positive (Weighted)
Yes 17 431 No 1778 109 Total 1795 112
70
N (Un
wei
gh
ted
)
An
tid
epre
ssa
nts
(Wei
gh
ted
)
Mar
ijuan
a(W
eig
hte
d)
Nar
coti
c-A
nal
ge
sic
(Wei
gh
ted
)
Sed
ativ
es
(Wei
gh
ted
)
Sti
mu
lan
ts
(Wei
gh
ted
)
Oth
er(W
eig
hte
d)
gt1
Dru
g C
lass
(
Wei
gh
ted
)
Neg
ativ
e (W
eig
hte
d)
Yes 7 00 203 00 00 00 00245 553 No 1738 05 39 17 17 16 02 16 888 Total 1745 05 39 17 17 16 02 16 888
2007 National Roadside Survey of Alcohol and Drug Use by Drivers Drug Results
Table 70 AA or NA and Drug Positives Nighttime (Oral Fluid) ldquoDuring the past 12 months have you received treatment for your drug or alcohol use in a self-help group such as Alcoholics
Anonymous of Narcotics Anonymousrdquo
N (Unweighted)
Drug Positive (Weighted)
Yes 107 183 No 5587 145 Total 5694 146
Of daytime drivers who responded to the question ldquoDuring the past 12 months did you ever stay at least overnight in an impatient or residential drug or alcohol treatment program for example detox rehab a therapeutic community or a hospitalrdquo less than 5 percent responded ldquoYesrdquo (Table 71) Of these approximately 20 percent tested positive for marijuana and nearly 25 percent tested positive for more than one drug
Table 71 Inpatient and Drug Class Daytime (Oral Fluid) ldquoDuring the past 12 months did you ever stay at least overnight in an impatient or residential drug or alcohol treatment program for
example detox rehab a therapeutic community or a hospitalrdquo
Of the nighttime drivers who were asked the same question approximately 1 percent responded ldquoYesrdquo (Table 72) Of those approximately 14 percent tested positive for marijuana and approximately 12 percent tested positive for more than one drug Although a higher percentage responded ldquoYesrdquo to the marijuana item during the day than at night this difference was not statistically significant
71
N
(Un
wei
gh
ted
)
An
tid
epre
ssa
nts
(W
eig
hte
d)
Mar
ijuan
a
(Wei
gh
ted
)
Nar
coti
c-A
nal
ge
sic
(W
eig
hte
d)
Sed
ativ
es
(W
eig
hte
d)
Sti
mu
lan
ts
(Wei
gh
ted
)
Oth
er
(Wei
gh
ted
)
gt1
Dru
g C
lass
(W
eig
hte
d)
Neg
ativ
e
(Wei
gh
ted
)
Yes 51 00 144 03 14 94 00115 630 No 5449 02 61 16 07 32 03 24 855 Total 5500 02 61 16 07 32 03 24 854
2007 National Roadside Survey of Alcohol and Drug Use by Drivers Drug Results
Table 72 Inpatient and Drug Class Nighttime (Oral Fluid) ldquoDuring the past 12 months did you ever stay at least overnight in an impatient or residential drug or alcohol treatment program for
example detox rehab a therapeutic community or a hospitalrdquo
Of daytime drivers who responded to the question ldquoDuring the past 12 months were you arrested and booked for driving under the influence of alcohol or drugsrdquo less than 5 percent responded ldquoYesrdquo (Table 73)
Table 73 Inpatients and Drug Category Daytime (Oral Fluid) ldquoDuring the past 12 months were you arrested and booked for driving under the influence of alcohol or drugsrdquo
N (Unwtd)
Illegal
(Weighted)
Medications (Weighted)
Illegal amp Medications (Weighted)
Negative
(Weighted)
Yes 7 447 00 00 553 No 1738 57 50 05 888 Total 1745 58 50 05 888
Of these nearly 45 percent tested positive for ldquoIllegalrdquo drugs Of the nighttime drivers who were asked the same question approximately 1 percent responded ldquoYesrdquo (Table 74) and approximately 23 percent of those tested positive for ldquoIllegalrdquo drugs The difference in ldquoIllegalrdquo drug use from daytime to nighttime was not significant
Table 74 Inpatients and Drug Category Nighttime (Oral Fluid) ldquoDuring the past 12 months were you arrested and booked for driving under the influence of alcohol or drugsrdquo
N (Unwtd)
Illegal
(Weighted)
Medications (Weighted)
Illegal amp Medications (Weighted)
Negative
(Weighted)
Yes 51 234 23 113 630 No 5449 106 30 09 855 Total 5500 106 30 10 854
Of daytime drivers who responded to the question ldquoHave you ever been admitted to an outpatient drug or alcohol treatment program NOT including meetings like AA or NArdquo
72
N
(Un
wei
gh
ted
)
An
tid
epre
ssa
nts
(Wei
gh
ted
)
Mar
ijuan
a (W
eig
hte
d)
Nar
coti
c-A
nal
ge
sic
(Wei
gh
ted
)
Sed
ativ
es
(Wei
gh
ted
)
Sti
mu
lan
ts
(Wei
gh
ted
)
Oth
er(W
eig
hte
d)
gt1
Dru
g C
lass
(
Wei
gh
ted
)
Neg
ativ
e (W
eig
hte
d)
Yes 44 34 154 147 00 37 00 11 616 No 1754 04 38 14 17 16 02 16 893 Total 1798 04 40 17 16 16 02 16 888
N
(Un
wei
gh
ted
)
An
tid
epre
ssa
nts
(Wei
gh
ted
)
Mar
ijuan
a (W
eig
hte
d)
Nar
coti
c-A
nal
ge
sic
(Wei
gh
ted
)
Sed
ativ
es
(Wei
gh
ted
)
Sti
mu
lan
ts
(Wei
gh
ted
)
Oth
er(W
eig
hte
d)
gt1
Dru
g C
lass
(
Wei
gh
ted
)
Neg
ativ
e (W
eig
hte
d)
Yes 159 16 101 65 17 138 00 23 639 No 5541 02 60 16 06 30 03 24 859 Total 5700 02 60 17 07 32 03 24 855
2007 National Roadside Survey of Alcohol and Drug Use by Drivers Drug Results
approximately 25 percent responded ldquoYesrdquo (Table 75) Of these the most prevalent drug was marijuana (154) Additionally nearly 15 percent tested positive for narcotic-analgesics
Table 75 Outpatient and Drug Class Daytime (Oral Fluid) ldquoHave you ever been admitted to an outpatient drug or alcohol treatment program NOT including meetings like AA or NArdquo
Of the nighttime drivers who were asked the same question nearly 3 percent responded ldquoYesrdquo (Table 76) and nearly 14 percent tested positive for stimulants which was more than any other drug category Approximately 10 percent of those tested positive for marijuana which was more than the daytime percentage however this difference was not statistically significant
Table 76 Outpatient and Drug Class Nighttime (Oral Fluid) ldquoHave you ever been admitted to an outpatient drug or alcohol treatment program NOT including meetings like AA or NArdquo
Of daytime drivers who responded to the question ldquoHave you ever been admitted to an outpatient drug or alcohol treatment program NOT including meetings like AA or NArdquo approximately 25 percent responded ldquoYesrdquo (Table 77) Of these approximately 38 percent were drug positive with nearly 20 percent testing positive for ldquoIllegalrdquo drugs
73
N
(Un
wei
gh
ted
)
An
tid
epre
ssa
nts
(W
eig
hte
d)
Mar
ijuan
a
(Wei
gh
ted
)
Nar
coti
c-A
nal
ge
sic
(W
eig
hte
d)
Sed
ativ
es
(W
eig
hte
d)
Sti
mu
lan
ts
(Wei
gh
ted
)
Oth
er
(Wei
gh
ted
)
gt1
Dru
g C
lass
(W
eig
hte
d)
Neg
ativ
e
(Wei
gh
ted
)
Yes 17 21 177 233 00 00 00 00 569 No 1778 04 39 15 17 16 02 16 891 Total 1795 04 40 17 16 16 02 16 888
2007 National Roadside Survey of Alcohol and Drug Use by Drivers Drug Results
Table 77 Outpatient and Categories Daytime (Oral Fluid) ldquoHave you ever been admitted to an outpatient drug or alcohol treatment program NOT including meetings like AA or NArdquo
N (Unwtd)
Illegal
(Weighted)
Medications (Weighted)
Illegal amp Medications (Weighted)
Negative
(Weighted)
Yes 44 199 181 04 616 No 1754 56 46 05 893 Total 1798 59 49 05 888
Of the nighttime drivers who were asked the same question nearly 3 percent responded ldquoYesrdquo (Table 78) and approximately 36 percent of those were drug positive with nearly 25 percent testing positive for ldquoIllegalrdquo drugs Although that percentage was higher for nighttime drivers than for daytime drivers there was no statistical difference in the number of people testing positive for ldquoIllegalrdquo drugs between daytime and nighttime
Table 78 Outpatient and Categories Nighttime (Oral Fluid) ldquoHave you ever been admitted to an outpatient drug or alcohol treatment program NOT including meetings like AA or NArdquo
N (Unwtd)
Illegal
(Weighted)
Medications (Weighted)
Illegal amp Medications (Weighted)
Negative
(Weighted)
Yes 159 249 100 12 639 No 5541 103 29 09 859 Total 5700 105 31 09 855
Of daytime drivers who responded to the question ldquoDuring the past 12 months have you received treatment for your drug or alcohol use in a self-help group such as AA or NArdquo approximately 1 percent responded ldquoYesrdquo (Table 79) Of these the most prevalent drug class was narcotic-analgesic (233)
Table 79 AA NA and Classes Daytime (Oral Fluid) ldquoDuring the past 12 months have you received treatment for your drug or alcohol use in a self-help group such as AA or NArdquo
74
N
(Un
wei
gh
ted
)
An
tid
epre
ssa
nts
(W
eig
hte
d)
Mar
ijuan
a
(Wei
gh
ted
)
Nar
coti
c-A
nal
ge
sic
(W
eig
hte
d)
Sed
ativ
es
(W
eig
hte
d)
Sti
mu
lan
ts
(Wei
gh
ted
)
Oth
er
(Wei
gh
ted
)
gt1
Dru
g C
lass
(W
eig
hte
d)
Neg
ativ
e
(Wei
gh
ted
)
Yes 107 04 53 04 05 95 00 22 817 No 5587 02 61 17 07 31 03 24 855 Total 5694 02 61 17 07 32 03 24 854
2007 National Roadside Survey of Alcohol and Drug Use by Drivers Drug Results
Of the nighttime drivers who were asked the same question nearly 2 percent responded ldquoYesrdquo (Table 80) and nearly 10 percent tested positive for stimulants which was more than any other drug category Approximately 5 percent of those tested positive for marijuana which was less than the daytime percentage of 18 percent however this difference was not statistically significant
Table 80 AA NA and Classes Nighttime (Oral Fluid) ldquoDuring the past 12 months have you received treatment for your drug or alcohol use in a self-help group such as AA or NArdquo
Of daytime drivers who responded to the question ldquoDuring the past 12 months have you received treatment for your drug or alcohol use in a self-help group such as AA or NArdquo approximately 1 percent responded ldquoYesrdquo (Table 81) Of these slightly more than 25 percent tested positive for ldquoMedicationsrdquo and nearly 18 percent tested positive for ldquoIllegalrdquo drugs
Table 81 NA AA and Drug Categories Daytime (Oral Fluid) ldquoDuring the past 12 months have you received treatment for your drug or alcohol use in a self-help group such as AA or NArdquo
N (Unwtd)
Illegal
(Weighted)
Medications (Weighted)
Illegal amp Medications (Weighted)
Negative
(Weighted)
Yes 17 177 254 00 569 No 1778 58 47 05 891 Total 1795 59 49 05 888
Of the nighttime drivers who were asked the same question nearly 2 percent responded ldquoYesrdquo (Table 82) and nearly 15 percent tested positive for ldquoIllegalrdquo drugs Although a greater percentage tested positive for ldquoIllegalrdquo drugs during the day than at night this difference was not statistically significant
75
2007 National Roadside Survey of Alcohol and Drug Use by Drivers Drug Results
Table 82 NA AA and Drug Categories Nighttime (Oral Fluid) ldquoDuring the past 12 months have you received treatment for your drug or alcohol use in a self-help group such as AA or NArdquo
N (Unwtd)
Illegal
(Weighted)
Medications (Weighted)
Illegal amp Medications (Weighted)
Negative
(Weighted)
Yes 107 149 30 04 817 No 5587 105 31 09 855 Total 5694 106 31 09 854
Blood Results (Nighttime Samples) Driver Drug Use Prevalence Based on Blood Results This section of the report presents the overall results of blood analyses for all of the drugs indicated in the introductory section of this report Blood samples were collected in addition to oral fluid samples because typically blood analyses are considered the ldquogold standard rdquoand is the more established technique for gathering information on drugs and their metabolites as oral fluid analyses are a more recently developed technique As expected the results between the oral fluid and blood results are very similar These blood results are presented to provide more complete results from our data analyses for those who are interested in seeing the results from both approaches
If a driver tested positive for one or more of the drugs for which we tested in blood she was categorized as drug positive Note that blood samples were only collected in the nighttime and that more drivers provided oral fluid samples than blood samples
About 14 percent of the 3276 nighttime drivers who provided blood samples were drug-positive (Table 83)
Table 83 Drug Prevalence by Time of Day (Blood)
Time of Day N
(Unweighted) Drug Positive
(Weighted) Daytime NA NA Nighttime 3276 138
NA = ldquoNot Applicablerdquo
Comparison of drug prevalence by session (Table 84) revealed that late-night (Sessions 3 and 5) drivers were significantly more likely to be drug-positive (179 and 168 respectively) as opposed to the earlier nighttime (Sessions 2 and 4) drivers (136 and 111 respectively) (p lt 01)
76
2007 National Roadside Survey of Alcohol and Drug Use by Drivers Drug Results
Table 84 Drug Prevalence by Session (Blood)
N Drug Positive Session (Unweighted) (Weighted)
2 Friday 10 pm ndash Midnight 857 136
3 Friday 1 am ndash 3 am 743 179
4 Saturday 10 pm ndash Midnight 986 111
5 Saturday 1 am ndash 3 am 690 168
Although the Northeast region had the greatest percentage of drug-positive findings in the nighttime driving sample (Table 85) such differences were not statistically significant Thus no clear pattern of drug prevalence by region emerged from the blood sample results
Table 85 Drug Prevalence by Region (Blood)
N Drug Positive Region (Unweighted) (Weighted)
Midwest 971 140 Northeast 584 145 South 862 134 West 859 135 Overall 3276 138
Comparison of blood samples by gender (Table 86) revealed that male drivers were more likely to be drug-positive (145) than female drivers (130) however such differences were not statistically significant
Table 86 Drug Prevalence by Gender (Blood)
Gender N
(Unweighted) Drug Positive
(Weighted) Males 1992 145 Females 1278 130 Overall 3270 139
When examining drug prevalence by age the prevalence of drug-positives was higher among young drivers (Table 87) Drivers aged 16-20 years showed a significantly higher prevalence than drivers aged 21-34 years and drivers aged 35-44 years (p lt 01) Drivers aged 35-44 45-64 and 65+ were significantly less likely to be drug positive than drivers in the combined age range of 16 to 34 years old (p lt 01)
77
2007 National Roadside Survey of Alcohol and Drug Use by Drivers Drug Results
Table 87 Drug Prevalence by Age (Blood)
N Drug Positive Age (Unweighted) (Weighted)
16-20 459 205 21-34 1372 152 35-44 625 107 45-64 697 112
65+ 91 60 Overall 3244 140
Comparisons between gender within age group (Table 88) showed that drug prevalence among male drivers ages 16-20 was significantly higher than female drivers ages 16-20 (p lt 01) Further drug prevalence among male drivers aged 21-34 was also significantly higher than the same-aged female counterparts (p lt 05)Among drivers aged 45-64 however drug prevalence was higher in females than in males (p lt 01)
Table 88 Drug Prevalence by Age and Gender (Blood)
N Drug Positive Gender Age (Unweighted) (Weighted)
Males
16-20 21-34 35-44 45-64
65+
301 825 368 413
61
228 169 112
83 60
Overall Males 1968 146
Females
16-20 21-34 35-44 45-64
65+
158 547 254 283
30
165 122 105 167
58 Overall Females 1272 130
Comparing drug prevalence between raceethnicity (Table 89) Asian drivers were significantly less likely to be drug positive (13) than drivers who identified themselves as African American Hispanic White or Other (p lt 01)
Table 89 Drug Prevalence by RaceEthnicity (Blood)
N Drug Positive RaceEthnicity (Unweighted) (Weighted)
African American 569 168 Asian 87 13 Hispanic 585 100 White 1836 155 Other 165 197 Overall 3242 140
RaceEthnic groups other than ldquoHispanicrdquo are always ldquonon-Hispanicrdquo
78
2007 National Roadside Survey of Alcohol and Drug Use by Drivers Drug Results
Looking at drug prevalence by education level (Table 90) drivers who identified themselves as college graduates or having some college experience were significantly less likely to be drug-positive (p lt 01) than drivers with other educational attainment
Table 90 Drug Prevalence by Education Level (Blood)
N Drug Positive Education Level (Unweighted) (Weighted)
Not a High School Graduate 289 203 High School Graduate 831 165 Some College 1318 125 College Graduate 594 108 Some Graduate Work 212 135 Overall Nighttime 3245 140
When examining drug prevalence by employment status (Table 91) drivers on disability showed drug prevalence that was significantly higher than employed drivers as well as homemakers students unemployed drivers and drivers who reported that they were retired (p lt 01) No statistical difference in drug prevalence was found between employed and unemployed drivers (p value = 06) ldquoRetiredrdquo drivers had significantly lower drug prevalence than employed drivers (p lt 05)
Table 91 Drug Prevalence by Employment Status (Blood)
N Drug Positive Gender (Unweighted) (Weighted)
EmployedSelf Employed 2592 136 Homemaker 67 120 Student 274 153 Unemployed 121 204 Retired 124 60 On Disability 47 414 Other 20 156 Overall 3245 140
79
2007 National Roadside Survey of Alcohol and Drug Use by Drivers Drug Results
Comparisons across vehicle type (Table 92) showed drug prevalence rates among drivers of passenger vehicles SUV and vanminivans were not statistically different (p value = 12) Note however that motorcyclists had the greatest percentage of drug-positive results (p lt 05) while pickup drivers had the smallest prevalence (p lt 05)
Table 92 Drug Prevalence by Vehicle Type (Blood)
N Drug Positive Vehicle Type (Unweighted) (Weighted)
Passenger Vehicle 1971 146 Pickup 401 93 SUV 586 116 Van amp Minivan 250 162 Motorcycle 48 240 Overall 3256 139
Driver Drug Use Prevalence by Drug Class Based on Blood Results In this section of the report we display driver drug use prevalence by class of drug based on blood results The classes of drugs tested for were antidepressants marijuana narcotic-analgesics sedatives stimulants and other (see Tables 94-96)
Drug Class
Two percent of the blood-sampled drivers tested positive for more than one drug class (Table 93)
Table 93 Number and Distribution of Drug Classes (Blood)
Number of N Drug Classes (Unweighted) (Weighted)
1 398 118 2+ 68 20 Negative 2810 862 Overall 3276 1000
80
2007 National Roadside Survey of Alcohol and Drug Use by Drivers Drug Results
In comparing prevalence of drug classes by region (Table 94) marijuana was the most common drug class across all of the regions (67) However drivers in the West region were less likely to test positive for marijuana than in the other regions (p lt 05)
Table 94 Drug Classes Distribution by Region (Blood)
Midwest Northeast South West All Drug Class
N=971 N=584 N=862 N=859 N=3276 Antidepressants 07 04 13 15 11 Marijuana 79 95 60 47 67 Narcotic-Analgesics 11 04 14 08 09 Sedatives 09 04 16 14 11 Stimulants 21 10 15 22 19 Other 00 00 02 05 02 More than 1 Class 13 29 13 24 20 Overall Drug Positive 140 145 134 135 138 Negative 860 855 866 865 862
ldquoMore than 1 Classrdquo ndash Drivers testing positive for more than one drug are only counted in this category In this table percentages are weighted
Comparison of drug class by gender (Table 95) revealed that male drivers were significantly more likely to test positive for marijuana than female drivers (74 males versus 56 females) (p lt 05)
Table 95 Drug Classes Distribution by Gender (Blood)
Males Females Total Drug Class
N=1992 N=1278 N=3270 Antidepressants 10 12 11 Marijuana 74 56 67 Narcotic-Analgesics 08 10 09 Sedatives 07 18 11 Stimulants 18 20 19 Other 04 00 02 More than 1 Class 24 14 20 Overall Drug Positive 145 130 139 Negative 855 870 861
In this table percentages are weighted ldquoMore than 1 Classrdquo ndash Drivers testing positive for more than one drug are only counted in this category
81
2007 National Roadside Survey of Alcohol and Drug Use by Drivers Drug Results
Comparison of drug class by age (Table 96) showed that drivers 34 or younger were more likely to test positive for marijuana than drives in other age groups (p lt 01) Among drivers aged 16shy34 drivers aged 16-20 years had the highest marijuana positives (152) The prevalence of narcotic-analgesics was higher among the 16-20 and 35-44 year age group (13 and 17) than among any other age group (p lt 01)
Table 96 Drug Classes Distribution by Age (Blood)
16-20 21-34 35-44 45-64 65+ Total Drug Class
N=459 N=1372 N=625 N=697 N=91 N=3244 Antidepressants 03 06 09 28 10 11 Marijuana 152 88 31 10 00 68 Narcotic-Analgesics 13 07 17 04 00 09 Sedatives 00 08 10 21 48 11 Stimulants 07 18 20 27 00 18 Other 02 04 02 00 00 02 More than 1 Class 27 19 18 23 01 20 Overall Drug Positive 205 152 107 112 60 140 Negative 795 848 893 888 940 860
ldquoMore than 1 Classrdquo ndash Drivers testing positive for more than one drug are only counted in this category In this table percentages are weighted
Driver Drug Use Prevalence by Drug Category Based on Blood Results In this section of the report we display drug use prevalence results from blood tests by drug category
About 9 percent of the nighttime drivers providing blood tested positive for drugs in the ldquoIllegalrdquo category (Table 97) Four percent were positive for ldquoMedicationsrdquo and 07 percent were positive for both ldquoIllegal and Medicationsrdquo
Table 97 Drug Categories Distribution (Blood)
N Drug Category (Unweighted) (Weighted)
Illegal 267 91 Medications 169 40 Illegal amp Medications 30 07 Negative 2810 862 Overall 3276 1000
ldquoMedicationsrdquo includes prescription and over-the-counter drugs
82
Table 98 Drug Categories Distribution by Region (Blood)
Region Drug Category N
(Unweighted)
(Weighted)
Midwest
Illegal Medications Illegal amp Medications Negative
81 52 8
830
102 32 06
860 Overall 971 1000
Northeast
Illegal Medications Illegal amp Medications Negative
57 26 4
497
110 27 08
855 Overall 584 1000
South
Illegal Medications Illegal amp Medications Negative
56 51 12
743
76 49 09
866 Overall 862 1000
West
Illegal Medications Illegal amp Medications Negative
73 40 6
740
82 49 05
865 Overall 859 1000
ldquoMedicationsrdquo includes prescription and over-the-counter drugs
2007 National Roadside Survey of Alcohol and Drug Use by Drivers Drug Results
The percentage of ldquoIllegalrdquo drug prevalence was slightly higher (p lt 05) in the Midwest and Northeast than in the remaining regions (Table 98)
When examining prevalence by drug category and gender (Table 99) we found that over 10 percent of male drivers had positive results for ldquoIllegalrdquo drugs as did about 7 percent of female drivers (p lt 01) The difference in percentage of positive results for ldquoMedicationsrdquo between male and female drivers was not statistically significant
83
2007 National Roadside Survey of Alcohol and Drug Use by Drivers Drug Results
Table 99 Drug Categories Distribution by Gender (Blood)
N Gender Drug Category (Unweighted) (Weighted)
Male
Illegal Medications Illegal amp Medications Negative
191 75 19
1707
104 33 08
855 Overall 1992 1000
Female
Illegal Medications Illegal amp Medications Negative
76 94 11
1097
72 54 04
870 Overall 1278 1000
ldquoMedicationsrdquo includes prescription and over-the-counter drugs
Examining drug use by age (Table 100) ldquoIllegalrdquo drug use was highest for drivers in the youngest age group (16-20 years) (p lt 01) followed by drivers aged 21-34 ldquoIllegalrdquo drug use among drivers 35 and older was significantly lower than among drivers younger than age 35 (p lt 01) ldquoMedicationrdquo usage followed the opposite trend with prevalence increasing with age Prevalence of ldquoMedicationrdquo was significantly higher for drivers aged 35 and older than for drivers younger than age 35 (p lt 01)
84
2007 National Roadside Survey of Alcohol and Drug Use by Drivers Drug Results
Table 100 Drug Categories Distribution by Age (Blood)
N Age Drug Category (Unweighted) (Weighted)
16-20
Illegal Medications Illegal amp Medications Negative
56 8 4
391
177 19 09
795 Overall 459 1000
21-34
Illegal Medications Illegal amp Medications Negative
141 48 13
1170
117 27 07
848 Overall 1372 1000
35-44
Illegal Medications Illegal amp Medications Negative
43 43 7
532
53 50 04
893 Overall 625 1000
45-64
Illegal Medications Illegal amp Medications Negative
26 61 6
604
31 73 08
888 Overall 697 1000
65+
Illegal Medications Illegal amp Medications Negative
0 9 0
82
00 60 00
940 Overall 91 1000
ldquoMedicationsrdquo includes prescription and over-the-counter drugs
Driver Drug Use Prevalence from Blood and BAC Results The following section presents the results of the blood drug analyses combined with the BAC results from breath tests
The numbers of drug-positive drivers by BAC level are shown in Tables 101 and 102 Table 101 shows BAC level with respect to the total number of drivers in each drug result category (positives negatives and overall) Table 102 shows drug prevalence with respect to the total number of drivers in each of the three BAC categories A statistically significant association was found between drug-positive and alcohol-positive drivers The percentage of drivers with BAC gdL 08+ was significantly higher among drug-positive drivers than among drug-negative drivers (p lt 01) The percentage of drivers with a BAC between zero and 08 was also significantly higher for drug-positive drivers (p lt 01)
85
2007 National Roadside Survey of Alcohol and Drug Use by Drivers Drug Results
Table 101 Drug Prevalence by BAC (Percentages Calculated by Row) (Blood)
BAC (gdL) Drug N Between
Result (Unweighted) Zero Zero and 08 08+ Positive 466 783 160 57 Negative 2810 937 52 11 Overall 3276 916 67 17
In this table percentages are weighted
Table 102 Drug Prevalence by BAC (Percentages Calculated by Column) (Blood)
BAC (gdL) Drug Between
Result Zero Zero and 08 08+ All N=2984 N=241 N=51 N=3276
Positive 118 332 453 138 Negative 882 668 547 862
In this table percentages are weighted
Examining BAC among drug-positive drivers by age (Table 103) a large percentage of alcohol-positives were found in drug-positive drivers aged 16-20 and 21-34 (p lt 01) Drivers aged 65 and older had the largest percentage of drivers at intermediate BAC (ie between zero and 08) however the sample size of this category was quite small
Table 103 BAC Among Drug-Positive Drivers by Age (Blood)
BAC (gdL) N Between Zero
Age (Unweighted) Zero and 08 08+ 16-2021-3435-4445-6465+
68 202
93 93
9
737 733 847 955 599
212 187
94 45
401
51 80 59 00 00
Overall Positive 465 786 158 57 In this table percentages are weighted
There were fewer alcohol-positive drivers among drug-positive drivers with 2+ classes of drugs than those with one class (Tables 104 and 105) however due to the small sample size this difference was statistically non-significant
86
2007 National Roadside Survey of Alcohol and Drug Use by Drivers Drug Results
Table 104 BAC Among Drug-Positive Drivers by Number of Drug Classes (Percentages Calculated by Column) (Blood)
BAC (gdL) No of Drug
Classes Zero Between
Zero and 08 08+ N=386 N=62 N=18
1 840 881 995 2+ 160 119 05
Overall 1000 1000 1000 In this table percentages are weighted
Table 105 BAC Among Drug-Positive Drivers by Number of Drug Classes (Percentages Calculated by Row) (Blood)
BAC (gdL) Number of N Between
Drug Classes (Unweighted) Zero Zero and 08 08+ 1 2+
398 68
769 867
165 131
66 02
Overall 466 783 160 57 In this table percentages are weighted
The majority of drug-positive drivers who were also alcohol-positive tested positive more often were positive for ldquoIllegalrdquo drugs (Tables 106 and 107) More than 90 percent of those drivers having a BAC between zero and 08 tested positive for ldquoIllegalrdquo drugs (either alone or in conjunction with ldquoMedicationsrdquo) This percentage was significantly higher than the approximately 65 percent of non-drinking (BAC = zero) drug-positive drivers who also had an ldquoIllegalrdquo drug in their system (alone or combined with ldquoMedicationsrdquo) (p lt 01)
Table 106 BAC Among Drug-Positive Drivers by Drug Category (Percentage by Row) (Blood)
BAC (gdL) N Between
Drug Category (Unweighted) Zero Zero and 08 08+ Illegal 267 717 204 79 Medications 169 936 49 15 Illegal amp Medications 30 768 232 00
ldquoMedicationsrdquo includes prescription and over-the-counter drugs In this table percentages are weighted
87
2007 National Roadside Survey of Alcohol and Drug Use by Drivers Drug Results
Table 107 BAC Among Drug-Positive Drivers by Drug Category (Percentage by Column) (Blood)
BAC (gdL) Between Zero
Drug Category Zero and 08 08+ N=386 N=62 N=18
Illegal 605 842 925 Medications 349 90 75 Illegal amp Medications 46 68 00
ldquoMedicationsrdquo includes prescription and over-the-counter drugs In this table percentages are weighted
High alcohol-positive drivers (ie drivers with a 08 BAC gdL or greater) who tested positive for ldquoIllegalrdquo drugs were more likely to be age 44 or younger (p lt 01) The sample size was very small for drivers aged 45 or older in particular those aged 65 or older (Note that due to the number of groupings in Table 108 and the small sample sizes caution should be exercised in interpretation of these findings)
Table 108 BAC of Drivers by Drug Category and Age (Blood)
BAC (gdL) N Between
Age Drug Category (Unweighted) Zero Zero and 08 08+
16-20
Illegal Medications Illegal amp Medications Negative
56 8 4
391
698 1000 956 978
243 00 44 19
59 00 00 03
Overall 459 929 59 13
21-34
Illegal Medications Illegal amp Medications Negative
141 48 13
1170
693 963 490 917
209 10
510 70
97 27 00 13
Overall 1372 889 87 23
35-44
Illegal Medications Illegal amp Medications Negative
43 43 7
532
781 906
1000 956
126 66 00 34
93 28 00 10
Overall 625 944 41 15
45-64
Illegal Medications Illegal amp Medications Negative
26 61 6
604
918 966
1000 925
82 34 00 60
00 00 00 15
Overall 697 928 58 13
65+
Illegal Medications Illegal amp Medications Negative
0 9 0
82
NA 599
NA 953
NA 401
NA 47
NA 00
NA 00
Overall 91 932 68 00 ldquoMedicationsrdquo includes prescription and over-the-counter drugs NA = ldquoNot Applicablerdquo In this table percentages are weighted
88
Gender Drug Category N
(Unweighted)
BAC (gdL)
Zero Between Zero
and 08 08+ Illegal 191 721 174 106Medications 75 905 84 11
Males Illegal amp Medications 19 708 292 00 Negative 1707 929 58 13Overall 1992 905 73 22 Illegal 76 707 278 15Medications 94 968 14 18
Females Illegal amp Medications 11 961 39 00 Negative 1097 950 42 08Overall 1278 933 57 09
2007 National Roadside Survey of Alcohol and Drug Use by Drivers Drug Results
Male drivers who tested positive for ldquoIllegalrdquo drugs (Table 109) had statistically greater percentages of alcohol-positive results than their female counterparts (p lt 05)
Table 109 BAC of Drivers by Drug Category and Gender (Blood)
ldquoMedicationsrdquo includes prescription and over-the-counter drugs In this table percentages are weighted
Oral Fluid andor Blood Results (Nighttime Samples) Driver Drug Use Prevalence Based on Oral Fluid andor Blood Results This section of the report presents the joint results of oral fluid and blood analyses for all of the drugs indicated in the introductory section (see Tables 17 and 18) for nighttime drivers As noted earlier blood was only obtained from nighttime drivers The tables in this section are based on the 5910 nighttime drivers from whom an oral fluid andor a blood sample was obtained and analyzed If a driver tested positive for one or more of the drugs in either the oral fluid andor in the blood analyses heshe was categorized as drug-positive Thus this section provides the most comprehensive nighttime drug prevalence estimates available using the biological specimens obtained in this study Again these are overall drug prevalence estimates including illegal prescription and over-the-counter drugs or their metabolites and do not necessarily imply impairment Within individual tables overall counts may not total 5910 because of missing values on some variables
When we examine the test results from nighttime drivers providing oral fluid andor blood 163 percent of drivers were drug-positive as indicated in Table 110
89
2007 National Roadside Survey of Alcohol and Drug Use by Drivers Drug Results
Table 110 Nighttime Drug Prevalence by Time of Day (Oral Fluid andor Blood)
N Drug Positive Time of Day (Unweighted) (Weighted)
Daytime NA NA Nighttime 5910 163
When we examined drug prevalence by time of day (Table 111) we found that late-night (Sessions 3 and 5) drivers were significantly more likely to be drug positive (191 and 183 respectively) than Friday and Saturday earlier in the night (Sessions 2 and 4) drivers (154 and 152 respectively) (p lt 01)
Table 111 Drug Prevalence by Session (Oral Fluid andor Blood)
N Drug Positive Session (Unweighted) (Weighted)
2 Friday 1000 pm ndash Midnight 1618 154
3 Friday 100 am ndash 300 am 1313 191
4 Saturday 1000 pm ndash Midnight 1695 152
5 Saturday 100 am ndash 300 am 1284 183 Overall 5910 163
Comparison of drug prevalence by region (Table 112) showed that the Northeast region had the greatest percentage of drug-positive findings at 183 percent However this difference was not statistically significant Thus no clear pattern by region emerged
Table 112 Drug Prevalence by Region (Oral Fluid andor Blood)
N Drug Positive Region (Unweighted) (Weighted)
Midwest 1708 169 Northeast 1119 183 South 1566 163 West 1517 150 Overall 5910 163
Examining drug prevalence by gender (Table 113) revealed that male drivers were significantly more likely to be drug-positive than female drivers (180 male versus 138 female) (p lt 01)
90
2007 National Roadside Survey of Alcohol and Drug Use by Drivers Drug Results
Table 113 Drug Prevalence by Gender (Oral Fluid andor Blood)
Gender N
(Unweighted) Drug Positive
(Weighted) Males 3634 180 Females 2262 138 Overall 5896 164
Comparison of drug prevalence by age (Table 114) indicated that drivers aged 16-44 showed statistically similar drug prevalence (ie no statistical difference among these age groups) Conversely drivers aged 45-64 and 65+ were significantly less likely to be drug-positive than drivers aged 16-44 (p lt 01)
Table 114 Drug Prevalence by Age (Oral Fluid andor Blood)
Age N
(Unweighted) Drug Positive
(Weighted) 16-20 974 188 21-34 2451 182 35-44 1046 170 45-64 1225 121 65+ 148 40 Overall Nighttime 5844 165
When examining drug prevalence by age and gender (Table 115) we found that drug prevalence among male drivers in the age categories 16-20 and 21-34 years was significantly higher than their same-aged female counterparts (p lt 01) Drug prevalence among male drivers in the age category 35-44 years was also significantly higher than their same-aged female counterparts (p lt 05) However drug prevalence among female drivers aged 45-64 (154) was significantly higher than male drivers of the same age group (100) (p lt 01)
91
2007 National Roadside Survey of Alcohol and Drug Use by Drivers Drug Results
Table 115 Drug Prevalence by Age and Gender (Oral Fluid andor Blood)
N Drug Positive Gender Age (Unweighted) (Weighted)
Males
16-20 21-34 35-44 45-64 65+
605 1502
634 741 101
221 211 194 100
40 Overall Males 3583 182
Females
16-20 21-34 35-44 45-64 65+
368 944 409 482
47
140 135 137 154
42 Overall Females 2250 138
Table 116 shows drug prevalence by raceethnicity Drivers who identified themselves as Asian were significantly less likely to be drug positive (19) than drivers who identified themselves as African American Hispanic White or Other (p lt 01) African American drivers were found to have the highest percentage of drug-positive results (224) which was a significantly higher rate than that of their Hispanic or White counterparts (p lt 01)
Table 116 Drug Prevalence by RaceEthnicity (Oral Fluid andor Blood)
N Drug Positive RaceEthnicity (Unweighted) (Weighted)
African American 980 224 Asian 191 19 Hispanic 1015 133 White 3378 172 Other 273 181 Overall 5837 165
RaceEthnic groups other than ldquoHispanicrdquo are always ldquonon-Hispanicrdquo
As shown in Table 117 drivers who identified themselves as having at least some college experience were statistically less likely to be drug-positive than those reporting being a high school graduate or less education (p lt 01)
92
2007 National Roadside Survey of Alcohol and Drug Use by Drivers Drug Results
Table 117 Drug Prevalence by Education Level (Oral Fluid andor Blood)
Education Level N
(Unweighted) Drug Positive
(Weighted) Not a High School Graduate 579 203 High School Graduate 1482 240 Some College 2234 140 College Graduate 1159 109 Some Graduate Work 389 169 Overall 5843 165
Comparison of drug prevalence by employment status (Table 118) indicated that drivers on disability showed a drug prevalence that was significantly higher than that of employed drivers (p lt 01) The prevalence of drug positives among employed drivers did not differ significantly from that of unemployed drivers Retired drivers had significantly lower drug prevalence than employed drivers (p lt 01)
Table 118 Drug Prevalence by Employment Status (Oral Fluid andor Blood)
N Drug Positive Employment Status (Unweighted) (Weighted)
EmployedSelf Employed 4646 167 Homemaker 104 85 Student 593 159 Unemployed 206 182 Retired 206 83 On Disability 67 447 Other 23 150 Overall 5845 165
Table 119 shows drug prevalence by vehicle type Drug prevalence rates among drivers of various vehicle types (passenger vehicle pickup SUV and vanminivans) were statistically different from motorcyclists who had the greatest percentage of drug-positive results (p lt01)
Table 119 Drug Prevalence by Vehicle Type (Oral Fluid andor Blood)
Vehicle Type N
(Unweighted) Drug Positive
(Weighted) Passenger Vehicle 3650 165 Pickup 703 159 SUV 1058 152 Van amp Minivan 381 174 Motorcycle 75 319 Overall 5867 164
93
2007 National Roadside Survey of Alcohol and Drug Use by Drivers Drug Results
Driver Drug Use Prevalence by Drug Class Based on Oral Fluid andor Blood Results In this section of the report we display driver drug use prevalence by class of drug The classes of drugs tested for were antidepressants marijuana narcotic-analgesics sedatives stimulants and other (see Tables 17-18)
Drug Class
As indicated in Table 120 135 percent of the drivers tested positive for one drug class and 28 percent tested positive for more than one drug class
Table 120 Number and Distribution of Drug Classes (Oral Fluid andor Blood)
Number of N Drug Classes (Unweighted) (Weighted)
1 792 135 2+ 184 28 Negative 4934 837 Overall 5910 1000
Further drivers testing positive for only one drug class constituted about 83 percent of drug-positive drivers (Table 121)
Table 121 Number and Distribution of Drug Classes (Drug Positives Only) (Oral Fluid andor Blood)
Number of Drug Classes
N (Unweighted)
Drug Positive (Weighted)
1 792 828 2+ 184 172 Overall 976 1000
94
2007 National Roadside Survey of Alcohol and Drug Use by Drivers Drug Results
Table 122 presents distribution of drug classes by region Generally marijuana was the most common drug class across all the regions (68) followed by stimulants (32) Drivers in the West were less likely to test positive for marijuana than drivers from the other regions (p lt 01)
Table 122 Drug Classes Distribution by Region (Oral Fluid andor Blood)
Midwest Northeast South West All Drug Class
N=1708 N=1119 N=1566 N=1517 N=5910 Antidepressants 07 04 07 07 07 Marijuana 88 78 72 47 68 Narcotic-Analgesics 10 29 16 16 16 Sedatives 12 03 08 08 08 Stimulants 31 18 26 42 32 Other 02 00 01 05 03 More than 1 Class 18 51 32 25 28 Overall Drug Positive 169 183 163 150 163 Negative 831 817 837 850 837
ldquoMore than 1 Classrdquo ndash Drivers testing positive for more than one drug are only counted in this category In this table percentages are weighted
As is shown in Table 123 males were significantly more likely to be positive for marijuana than females (80 males versus 50 females) (p lt 01)
Table 123 Drug Classes Distribution by Gender (Oral Fluid andor Blood)
Males Females Total Drug Class
N=3634 N=2262 N=5896 Antidepressants 07 07 07 Marijuana 80 50 69 Narcotic-Analgesics 17 15 16 Sedatives 06 12 08 Stimulants 31 35 33 Other 03 03 03 More than 1 Class 35 17 28 Overall Drug Positive 180 138 164 Negative 820 862 836
ldquoMore than 1 Classrdquo ndash Drivers testing positive for more than one drug are only counted in this category In this table percentages are weighted
When we examined drug class prevalence by age (Table 124) we found that drivers aged 16-20 were more likely to use marijuana (120) than drivers in the 21-34 age group (p lt 05) and any other age group (p lt 01) The age group with the second highest prevalence of marijuana was 21-34 the prevalence in this age group (92) was also significantly higher than in older age groups (p lt 01)
95
Drug Class 16-20
21-34
35-44
45-64
65+
Total
N=974 Antidepressants 04 Marijuana 120 Narcotic-Analgesics 12 Sedatives 00 Stimulants 22 Other 02
More than 1 Class 27
N=2451 03 92 08 06 33 05 36
N=1046 09 46 43 15 31 02 23
N=1225 15 11 14 12 47 01 22
N=148 06 00 04 30 00 00 01
N=5844 07 69 16 09 33 03 28
Overall Drug Positive 188 182 170 121 40 165 835 Negative 812 818 830 879 960
ldquoMore than 1 Classrdquo ndash Drivers testing positive for more than one drug are only counted in this category In this table percentages are weighted
2007 National Roadside Survey of Alcohol and Drug Use by Drivers Drug Results
Table 124 Drug Classes Distribution by Age (Oral Fluid andor Blood)
Driver Drug Use Prevalence by Drug Category Based on Oral Fluid andor Blood Results In this section of the report we display drug use prevalence results from the combined results of oral fluid and blood tests by drug category as described in Table 18
Table 125 shows that 113 percent of drivers tested positive for ldquoIllegalrdquo drugs and an additional 11 percent tested positive for ldquoIllegalrdquo drugs in conjunction with ldquoMedicationsrdquo Thus a total of 124 percent tested positive for ldquoIllegalrdquo drugs of which 11 percent also tested positive for a ldquoMedicationrdquo
Table 125 Drug Categories Distribution (Oral Fluid andor Blood)
N Drug Category (Unweighted) (Weighted)
Illegal 621 113 Medications 277 39 Illegal amp Medications 78 11 Negative 4934 837 Overall 5910 1000
ldquoMedicationsrdquo includes prescription and over-the-counter drugs
Table 126 displays the drug category results by region No statistically significant differences were found in the prevalence of ldquoIllegalrdquo drugs across regions
96
2007 National Roadside Survey of Alcohol and Drug Use by Drivers Drug Results
Table 126 Drug Categories Distribution by Region (Oral Fluid andor Blood)
N Region Drug Category (Unweighted) (Weighted)
Midwest
Illegal Medications Illegal amp Medications Negative
197 97 19
1395
127 35 06
831 Overall 1708 1000
Northeast
Illegal Medications Illegal amp Medications Negative
121 43 17
938
113 46 24
817 Overall 1119 1000
South
Illegal Medications Illegal amp Medications Negative
145 79 28
1314
109 38 16
837 Overall 1566 1000
West
Illegal Medications Illegal amp Medications Negative
158 58 14
1287
113 39 11
837 Overall 1517 1000
ldquoMedicationsrdquo includes prescription and over-the-counter drugs
When examining prevalence by drug category and gender (Table 127) we found that male drivers were more likely to be positive for ldquoIllegalrdquo drugs (combining the categories for ldquoIllegalrdquo and ldquoIllegal and Medicationsrdquo) than female drivers (144 male versus 85 female) (p lt 01)
Table 127 Drug Categories by Gender (Oral Fluid andor Blood)
N Gender Drug Category (Unweighted) (Weighted)
Male
Illegal
Medications
Illegal amp Medications
Negative
444
136
53
3001
131
35
13
820 Overall 3634 1000
Female
Illegal
Medications
Illegal amp Medications
Negative
176
141
25
1920
80
66
05
849
Overall 2262 1000 ldquoMedicationsrdquo includes prescription and over-the-counter drugs
97
2007 National Roadside Survey of Alcohol and Drug Use by Drivers Drug Results
Comparison of drug categories by age (Table 128) revealed that drivers aged 16-20 and 21-34 had the highest percentage of drug-positive results for ldquoIllegalrdquo (ldquoIllegalrdquo plus ldquoIllegal and Medicationsrdquo) drugs (p lt 01)
Table 128 Drug Categories Distribution by Age (Oral Fluid andor Blood)
N Age Drug Category (Unweighted) (Weighted)
16-20
Illegal Medications Illegal amp Medications Negative
131 15 14
814
155 19 14
812 Overall 974 1000
21-34
Illegal Medications Illegal amp Medications Negative
329 70 37
2015
148 22 12
818 Overall 2451 1000
35-44
Illegal Medications Illegal amp Medications Negative
91 78 15
862
82 81 08
830 Overall 1046 1000
45-64
Illegal Medications Illegal amp Medications Negative
68 101
12 1044
57 54 10
879 Overall 1225 1000
65+
Illegal
Medications
Illegal amp Medications
Negative
0
13
0
135
00
40
00
960
Overall 148 1000 ldquoMedicationsrdquo includes prescription and over-the-counter drugs
Driver Drug Use Prevalence from Oral Fluid andor Blood and BAC Results The following section presents the results of the oral fluid and blood analyses combined with the blood alcohol concentration (BAC) results obtained through breath tests
Tables 129 and 130 show the number of drug-positive drivers by BAC level As seen in Table 129 drug-positive drivers (41) were significantly more likely to have a BAC of 08 or higher than were drug negative drivers (17) (p lt 01)
98
2007 National Roadside Survey of Alcohol and Drug Use by Drivers Drug Results
Table 129 Drug Prevalence by BAC (Percentages Calculated by Row) (Oral Fluid andor Blood)
Drug Result
N (Unweighted) Zero
BAC (gdL) Between
Zero and 08 08+ Positive 976 795 164 41 Negative 4932 906 77 17 Overall 5908 888 91 21
In this table percentages are weighted
Table 130 provides another way of looking at this issue and indicates that among drivers with a BAC gdL 08+ almost a third (318) were also positive for drugs The difference in drug prevalence between BAC categories for drug positive drivers however was not statistically significant
Table 130 Drug Prevalence by BAC (Percentages Calculated by Column) (Oral Fluid andor Blood)
BAC (gdL) Drug Between Zero
Result Zero and 08 08+ All
N=5241 N=536 N=131 N=5908 Positive 146 293 318 163 Negative 854 707 682 837
In this table percentages are weighted
Table 131 shows that among participants who were drug positive drivers younger than 35 were the most likely to be alcohol-positive The prevalence of drivers with a BAC greater than zero among drivers less than 35-years-old was significantly higher than among older driver groups (p lt 01) Though a high proportion of drug-positive drivers 65+ were also alcohol positive that pattern is not statistically significant compared to the other age groups due to the small sample size
Table 131 BAC Among Drug-Positive Drivers by Age (Oral Fluid andor Blood)
BAC (gdL) N Zero Between Zero 08+
Age (Unweighted) and 08 16-20 160 799 174 28 21-34 436 750 200 50 35-44 184 876 87 379 45-64 181 842 122 36 65+ 13 587 413 00 Overall Positive 974 796 163 41
In this table percentages are weighted
99
2007 National Roadside Survey of Alcohol and Drug Use by Drivers Drug Results
As shown in Table 132 the majority of alcohol-positive drivers among drug-positive drivers were positive for only one class of drug
Table 132 BAC Among Drug-Positive Drivers by Number of Drug Classes (Percentages Calculated by Column) (Oral Fluid andor Blood)
Number of Drug Classes Zero
BAC (gdL) Between
Zero and 08 08+ N=468 N=71 N=20
1 2+
819 181
837 163
961 39
Overall 1000 1000 1000 In this table percentages are weighted
In Table 133 those drivers with 2+ classes of drugs were significantly less likely to be positive for alcohol than those drug-positive for one class (p lt 05)
Table 133 BAC Among Drug-Positive Drivers by Number of Drug Classes (Percentages Calculated by Row) (Oral Fluid andor Blood)
Number of Drug Classes
N (Unweighted) Zero
BAC (gdL) Between
Zero and 08 08+ 1 792 786 166 48 2+ 184 836 155 09 Overall 976 795 164 41
In this table percentages are weighted
As indicated in Table 134 drug-positive drivers who were also alcohol-positive were more likely to be positive for ldquoIllegalrdquo drugs than for ldquoMedicationsrdquo (p lt 01)
Table 134 BAC Among Drug-Positive Drivers by Drug Category (Oral Fluid andor Blood)
N BAC (gdL)
Between Drug Category (Unweighted) Zero Zero and 08 08+
Illegal 621 7521 1935 544 Medications 277 9140 731 129 Illegal amp Medications 78 8110 1816 075 Negative 4932 8879 909 212
ldquoMedicationsrdquo includes prescription and over-the-counter drugs In this table percentages are weighted
100
2007 National Roadside Survey of Alcohol and Drug Use by Drivers Drug Results
Table 135 presents the BACs of drivers by drug category and age Drivers with BAC a of 08 or higher who tested positive for drugs were more likely to test positive for ldquoIllegalrdquo drugs than those in the ldquoMedicationsrdquo category across all age groups However this difference was not statistically significant
Table 135 BAC of Drivers by Drug Category and Age (Oral Fluid andor Blood)
BAC (gdL) N Between Zero
Age Drug Category (Unweighted) Zero and 08 08+
16-20
Illegal Medications Illegal amp Medications Negative
131 15 14
814
759 1000 975 961
208 00 25 34
33 00 00 05
Overall 974 930 60 10
21-34
Illegal Medications Illegal amp Medications Negative
329 70 37
2014
731 837 812 880
209 146 188
96
60 17 00 24
Overall 2450 856 115 29
35-44
Illegal Medications Illegal amp Medications Negative
91 78 15
862
794 953 932 921
147 27 68 66
59 20 00 13
Overall 1046 913 70 17
45-64
Illegal Medications Illegal amp Medications Negative
68 101 12
1044
808 934 536 899
126 61
424 88
66 04 40 13
Overall 1225 892 92 16
65+
Illegal Medications Illegal amp Medications Negative
0 13
0 135
NA 587
NA 899
NA 413
NA 53
NA 00
NA 48
Overall 148 886 68 46 In this table percentages are weighted
When examining BAC by drug category by gender (Table 136) male drivers that tested positive for ldquoIllegalrdquo drugs were more likely to have a BAC at or above 08 gdL than their female counterparts (p lt 01)
101
2007 National Roadside Survey of Alcohol and Drug Use by Drivers Drug Results
Table 136 BAC of Drivers by Drug Category and Gender (Oral Fluid andor Blood)
BAC (gdL) N Between Zero
Gender Drug Category (Unweighted) Zero and 08 08+
Males
Illegal Medications Illegal amp Medications Negative
444 136
53 3001
749 928 760 902
179 64
231 78
72 08 10 21
Overall 3634 881 92 27
Females
Illegal Medications Illegal amp Medications Negative
176 141
25 1919
761 896 979 912
231 84 21 76
09 20 00 12
Overall 2261 899 89 12 In this table percentages are weighted
Individual Drug Prevalence Estimates from Oral Fluid and Oral Fluid andor Blood Combined In this section of the report we present prevalence estimates for individual drugs illegal prescription and over-the-counter drugs obtained from the analyses of oral fluid and blood specimens In Tables 137 and 139 there are three main columns The first column lists the individual drugs for which we tested and at least one driver tested positive in oral fluid The second main column presents the oral fluid results (unweighted N and weighted percentage) of samples obtained from daytime drivers on a drug-by-drug basis The third column presents results of oral fluid analyses from nighttime drivers in a similar manner Similarly tables 138 and 140 present the combined analyses of oral fluid andor blood samples provided by nighttime drivers Note in these tables there were 5910 nighttime drivers who provided either oral fluid blood or both oral fluid and blood for analysis If a driver tested positive for a specific drug or a metabolite of that drug in either oral fluid or blood or in both substances that driver was counted as positive for that drug once Thus these tables provide us with a robust estimate of nighttime drug prevalence available from the biological samples we collected because it takes advantage of the larger sample size of nighttime drivers providing oral fluid samples (5869) augmented with information obtained from analyses of blood samples obtained from 3276 nighttime drivers Most drivers who provided blood also provided oral fluid so including the blood results only increased the sample size by 41 drivers to 5910 However since in some cases specific drugs were found in oral fluid and not blood and conversely in blood but not oral fluid this dataset provides us with the most comprehensive estimates of individual drug prevalence
The Ns in the tables represent the actual unweighted number of positive tests for the listed drug or a metabolite of that drug The percentages are the weighted prevalence estimates for each drug Since individual drug use was the unit of analysis and some drivers were positive for more than one drug the sum of the individual drug prevalence estimates exceeds the overall prevalence estimates appearing elsewhere in this report
102
2007 National Roadside Survey of Alcohol and Drug Use by Drivers Drug Results
Of particular interest may be the prevalence estimates for relatively frequently encountered drugs such as marijuana Marijuana (and its metabolites) appears as a separate drug class in the typology presented in Table 17 and used in the subsequent tabulations of results by drug class However a number of drivers tested positive for more than one drug class (sometimes including marijuana) and were classified as such in the tabulations Thus drivers who were positive for marijuana were split between the mutually exclusive classifications of ldquomarijuanardquo and ldquomore than one drug classrdquo in those tables Here in these tables we present the prevalence estimates for a drug such as marijuana independent of whether other drugs were found in an individual driver Thus a driver for example who tested positive for marijuana and cocaine would appear twice in the tables in this section of the report Finally as indicated earlier in the report in many instances we tested both for the parent drug and its metabolites In cases where we found both the parent drug and its metabolite (for example THC and 11-OH-THC) we only counted that as one drug positive for the parent drug In the case in which a parent drug was identified alone which could also be a metabolite of another drug we only counted the observation as the parent drug itself and not again as the drug for which it could be a metabolite
Thus the values in the tables in this section of the report represent estimates of individual drug prevalence based on the analytic techniques available
Overall Individual Drug Prevalence in Daytime and Nighttime Review of Tables 137 and 138 reveals that the two highest prevalence drugs found in the 2007 NRS were in the ldquoIllegalrdquo drug category
The most frequently encountered single drug in oral fluid in both daytime and nighttime was THC (marijuana) Marijuana was detected in oral fluid in 446 percent of daytime drivers and 766 percent of nighttime drivers (Table 137) The results from nighttime drivers who provided oral fluid andor blood indicated that 865 percent of drivers were positive for marijuana or its metabolites (Table 138)
The second most frequently encountered drug was cocaine with either cocaine or a metabolite detected in oral fluid in 146 percent of daytime drivers and 390 percent of nighttime drivers The corresponding nighttime figure for oral fluid andor blood nighttime was 392 percent
During the daytime the next most frequently encountered drug was alprazolam at 112 percent Alprazolam (a benzodiazepine) exhibited a nighttime prevalence rate in oral fluid of 061 percent
Among opioids oxycodone exhibited a daytime prevalence rate of 037 percent Among the nighttime oral fluid samples oxycodone had a prevalence rate of 080 percent Another opioid hydrocodone had a 022 percent daytime and 061 percent nighttime oral fluid prevalence rate The atypical opioid propoxyphene was detected in 093 percent of daytime oral fluid samples and 046 percent of nighttime oral fluid samples
The daytime prevalence rate of methamphetamine was 032 percent and amphetamine was 023 percent Among nighttime drivers providing oral fluid samples methamphetamine had a prevalence rate of 080 percent Amphetamine had a prevalence rate of 036 percent
103
2007 National Roadside Survey of Alcohol and Drug Use by Drivers Drug Results
Table 137 Prevalence of Drugs in Daytime and Nighttime Drivers (Oral Fluid)
Drug
Oral Fluid Daytime Nighttime
N (Unweighted)
(Weighted)
N (Unweighted)
(Weighted)
Alprazolam 18 112 36 061 Amitriptyline 6 027 7 003 Amphetamine 4 023 19 036 Butalbital 5 026 8 017 Carisoprodol 2 005 5 003 Chlordiazepoxide 2 025 2 003 Clonazepam 2 003 7 012 Cocaine 38 146 222 390 Codeine 4 013 7 044 Dextromethorphan 3 023 16 022 Diazepam 3 010 10 014 Fluoxetine 11 034 14 023 Heroin 2 009 8 017 Hydrocodone 15 022 58 061 Hydromorphone 2 009 0 000 Ketamine 0 000 1 008 Lorazepam 0 000 1 001 MDMA 2 006 8 009 Meperidine 1 001 2 000 Meprobamate 0 000 1 001 Methadone 3 021 11 018 Methamphetamine 5 032 34 080 Methylphenidate 0 000 3 001 Morphine 0 000 1 000 Oxycodone 14 037 43 080 PCP 1 004 3 013 Phenobarbital 1 000 1 000 Phentermine 5 015 11 011 Propoxyphene 22 093 34 046 Sertraline 2 044 4 013 Temazepam 2 012 2 002 THC (Marijuana) 103 446 438 766 Tramadol 12 019 34 046 Zolpidem 2 012 1 001
All Tested Drivers dagger 1850 1100 5869 1440 dagger Number and percentages for All tested drivers indicate number of drivers providing samples and the percentage of those drivers who tested positive for at least one drug In this table percentages are weighted
104
2007 National Roadside Survey of Alcohol and Drug Use by Drivers Drug Results
Individual Drug Prevalence in Nighttime Oral Fluid andor Blood Results for drivers who provided oral fluid andor blood yielded an overall drug positive prevalence estimate of 163 percent (Table 138) Again marijuana (865) and cocaine (392) were the most frequently encountered drugs The next most frequently encountered drug was methamphetamine (084) Amphetamine was present in 045 percent of this nighttime driver population The opioids oxycodone (082) and hydrocodone (068) and the benzodiazepine alprazolam (064) were the next most frequently encountered drugs in this nighttime driver population The atypical opioid propoxyphene was present in 052 of these nighttime drivers Note however as indicated in the introduction of this section the unit of analysis in these tables is individual drug use Some drivers were positive for more than one drug thus the sum of the individual drug prevalence estimates exceed the overall prevalence estimates noted earlier in this report
105
2007 National Roadside Survey of Alcohol and Drug Use by Drivers Drug Results
Table 138 Prevalence of Drugs in All Drug-Tested Nighttime Drivers (Oral Fluid andor Blood)
Drug N
(Unweighted)
(Weighted)
Alprazolam 40 064 Amitriptyline 14 007 Amphetamine 25 045 Butalbital 9 017 Carisoprodol 5 003 Chlordiazepoxide 4 003 Clonazepam 10 014 Cocaine 225 392 Codeine 7 044 Dextromethorphan 16 022 Diazepam 30 038 Fluoxetine 25 037 Heroin 8 017 Hydrocodone 63 068 Hydromorphone 0 000 Imipramine 1 000 Ketamine 1 008 Lorazepam 2 003 MDMA 8 009 Meperidine 2 000 Meprobamate 1 001 Methadone 14 019 Methamphetamine 37 084 Methylphenidate 3 001 Morphine 8 006 Oxycodone 47 082 PCP 3 013 Phenobarbital 2 001 Phentermine 21 026 Propoxyphene 35 052 Sertraline 36 050 Temazepam 4 003 THC (Marijuana) 499 865 Tramadol 35 046 Zolpidem 4 003
All Tested Driversdagger 5910 1630 dagger Number and percentages for All tested drivers indicate number of drivers providing samples and percentage of those drivers who tested positive In this table percentages are weighted
106
2007 National Roadside Survey of Alcohol and Drug Use by Drivers Drug Results
Individual Drug Prevalence Sorted by Drug Type from Oral Fluid and Oral Fluid andor Blood Combined In Tables 139 and 140 we present prevalence estimates by drug within drug type for both daytime and nighttime drivers based on oral fluid analyses (Table 139) and for nighttime drivers based on the results of analyses of oral fluid andor blood (Table 140) These tables contain the same information provided in Tables 137 and 138 except that the drugs are sorted by drug type (Drug types are the subgrouping of similar drugs noted by class and category in Tables 17 and 18)
107
2007 National Roadside Survey of Alcohol and Drug Use by Drivers Drug Results Table 139 Prevalence of Drugs in Daytime and Nighttime Drivers (Oral Fluid)
Drug
Oral Fluid
Daytime Nighttime N
(Unweighted)
(Weighted) N
(Unweighted)
(Weighted)
THC (Marijuana) 103 446 438 766
Cocaine 38 146 222 390 Opioids
Codeine Heroin
Hydrocodone Hydromorphone Meperidine
Methadone Morphine Oxycodone Propoxyphene Tramadol
4 2
15 2 1 3 0
14 22 12
013 009 022 009 001 021 000 037 093 019
7 8
58 0 2
11 1
43 34 34
044 017 061 000 000 018 000 080 046 046
AmphetaminesStimulants MDMA Amphetamine
Methamphetamine Methylphenidate
Phentermine
2 4 5 0 5
006 023 032 000 015
8 19 34
3 11
009 036 080 001 011
Street Drugs Ketamine PCP
0 1
000 004
1 3
008 013
Benzodiazepines Alprazolam
Chlordiazepoxide Clonazepam Diazepam
Lorazepam Temazepam
18 2 2 3 0 2
112 025 003 010 000 012
36 2 7
10 1 2
061 003 012 014 001 002
Antidepressants Amitriptyline
Fluoxetine Imipramine Sertraline
6 11
0 2
027 034
0 044
7 14
0 4
003 023
0 013
Barbiturates Butalbital
Phenobarbital 5 1
026 000
8 1
017 000
Pain Drugs Carisoprodol Meprobamate
2 0
005 000
5 1
003 001
Sleep Aids Zolpidem 2 012 1 001
Cough Suppressants Dextromethorphan 3 023 16 022
All Tested Driversdagger 1850 1100 5869 1440 dagger Number and percentages for All tested drivers indicate number of drivers providing samples and percentage of those drivers who tested positive In this table percentages are weighted
108
2007 National Roadside Survey of Alcohol and Drug Use by Drivers Drug Results
Table 140 Prevalence of Drugs in All Drug-Tested Nighttime Drivers (Oral Fluid andor Blood)
Drug N
(Unweighted)
(Weighted) THC (Marijuana) 499 865 Cocaine 225 392 Opioids
Codeine 7 044 Heroin 8 017
Hydrocodone 63 068 Hydromorphone 0 000 Meperidine 2 000
Methadone 14 019 Morphine 8 006 Oxycodone 47 082 Propoxyphene 35 052 Tramadol 35 046
AmphetaminesStimulants MDMA 8 009 Amphetamine 25 045
Methamphetamine 37 084 Methylphenidate 3 001
Phentermine 21 026 Street Drugs
Ketamine PCP
1 3
008 013
Benzodiazepines Alprazolam 40 064
Chlordiazepoxide 4 003 Clonazepam 10 014 Diazepam 30 038
Lorazepam 2 003 Temazepam 4 003 Antidepressants Amitriptyline 14 007
Fluoxetine 25 037 Imipramine 1 000 Sertraline 36 050
Barbiturates Butalbital
Phenobarbital 9 2
017 001
Pain drugs Carisoprodol Meprobamate
5 1
003 001
Sleep Aids Zolpidem 4 003
Cough Suppressants Dextromethorphan 16 022
All Tested Driversdagger 5910 1630 dagger Number and percentages for All tested drivers indicate number of drivers providing samples and percentage of those drivers who tested positive In this table percentages are weighted
109
2007 National Roadside Survey of Alcohol and Drug Use by Drivers Drug Results
Drugs that were infrequently encountered in the study population included the sedative pain drugs carisoprodol and meprobamate the sleep aid zolpidem and the street drugs ketamine and PCP Barbiturates and cough suppressants were also infrequent in the studied driver population
Examination of the results of the daytime and the nighttime oral fluid analyses and the combination of oral fluid and or blood analyses (when either one or both types of samples were provided) indicates that similar relative patterns of prevalence estimates are realized in the daytime and nighttime Marijuana is the most frequently encountered drug whether compared with other drugs individually or with drug types Cocaine is the next most frequently encountered drug or drug type in the nighttime sample but during the daytime benzodiazepines and opioids exhibited higher prevalence rates as classes than cocaine
110
2007 National Roadside Survey of Alcohol and Drug Use by Drivers Drug Results
Discussion This report summarizes the results of the first US National Roadside Survey to estimate drug-involved driving prevalence based on biological measures It should be emphasized that this is a prevalence study and not a study that addresses the risk that may be presented by drug use among drivers For many drug types drug presence can be detected long after any impairment that might affect driving has passed However it is important to our understanding of drugs and driving to know the extent of the use of certain drugs in the driving population That was the intent of this study
As indicated earlier in the report we gathered data from drivers on US roadways during Friday daytime hours as well as during Friday nights and Saturday nights We obtained oral fluid samples (1850 during daytime and 5869 during nighttime) from drivers in each of those data collection periods and collected blood samples (3276) as well during the nighttime data collection periods (Table 10)
In this study analyses of the oral fluid and blood samples were conducted to identify the presence of some 75 drugs and metabolites (Tables 17 and 18) To make the presentation of results most useful we identified six classes of these drugs including antidepressants marijuana narcotic-analgesics sedatives stimulants and other plus a ldquomore than one drugrdquo class We also identified three broader categories illegal prescription and over-the-counter Because few overshythe-counter drugs were found the prescription and over-the-counter drugs were combined for many analyses and labeled ldquoMedicationsrdquo
Oral Fluid Analyses Analyses of the oral fluid samples obtained from daytime drivers indicated an overall drug use prevalence of 11 percent and for nighttime drivers 144 percent (Table 19) This includes illegal prescription and over-the-counter drugs combined This overall difference between day and night is statistically significant (p lt 01)
In examining the prevalence of drugs by class (Table 31) marijuana was identified in 39 percent of daytime drivers and 61 percent of nighttime drivers Sedatives were found in 16 percent of daytime drivers and in 06 percent of nighttime drivers Conversely stimulants were found in 16 percent of daytime drivers but in 32 percent of nighttime drivers
Comparison of drug classes by time of day indicated that nighttime drivers were significantly more likely to test positive for more than one drug class than daytime drivers (23 nighttime versus 15 daytime) (p lt 01) Comparison of drug categories by time of day (Table 34) revealed that almost 6 percent of daytime drivers tested positive for drugs in the ldquoIllegalrdquo category (primarily marijuana and cocaine) as did over 10 percent of nighttime drivers (there was a statistically significant difference between the two groups [p lt 01]) Positive results in the ldquoMedicationsrdquo category (prescription and over-the-counter drugs combined) were found to be slightly higher among the daytime drivers (almost 5) than nighttime drivers (3) although this difference was not statistically significant
When examining drug prevalence by time of day and gender (Table 22) the daytime driving sample showed no statistically significant difference in drug prevalence between males and
111
2007 National Roadside Survey of Alcohol and Drug Use by Drivers Drug Results
females however in the nighttime driving sample male drivers were significantly more likely to be drug-positive than female drivers (165 males versus 113 females) (p lt 01)
Further comparison of drug class by time and gender (Table 32) showed that males were significantly more likely to test positive for marijuana than females in both daytime (59 males versus 17 females) and nighttime samples (74 males versus 41 females) (p lt 01)
When examining prevalence by drug category by time of day and gender (Table 36) we found that in the daytime sample male drivers were more likely to test positive for ldquoIllegalrdquo drugs (82) than female drivers (30) (p lt 01) Conversely daytime female drivers were more likely to show positive results for ldquoMedicationsrdquo (76) than daytime male drivers (25) (p lt 01) This pattern was similar in the nighttime sample with 125 percent of male drivers testing positive for ldquoIllegalrdquo drugs as opposed to 75 percent of female drivers (p lt 01) The difference in percentage of positive results for ldquoMedicationsrdquo between male (28) and female (33) drivers was not as striking in the nighttime sample as in the daytime sample
Comparison of overall drug prevalence by time of day and age18 (Table 23) revealed that within the daytime driving sample drivers aged 45-64 showed the highest percentage of drug positives and drivers aged 16-20 and aged 65+ were significantly less likely to be positive than other ages of drivers (p lt 05) In the nighttime driving sample drivers aged 45-64 and 65+ were significantly less likely to be drug positive (p lt 01) while drivers aged 16-20 showed no difference in drug prevalence from drivers aged 21-34 years and drivers aged 35-44 years
When we examined drug classes by time of day and age (Table 33) we found that daytime drivers aged 21-34 were more likely to use marijuana (74) than daytime drivers in other age groups (p lt 01) However drivers aged 16-20 years had the highest marijuana use (98) in the nighttime sample followed by the 21-34 year age group (85) (p lt 01) The prevalence of narcotic-analgesics among daytime drivers was highest among drivers aged 45-64 (29) (p lt 01) however in the nighttime sample this changed to the age 35-44 group (42) (p lt 01)
In comparing drug categories by time of day and age (Table 37) it was clear that within the daytime sample ldquoIllegalrdquo drug use was highest for drivers aged 21-34 (99) followed by drivers aged 35-44 (65) The prevalence of ldquoIllegalrdquo drugs for these age groups differed significantly from that in the remaining age groups (p lt 01) In the nighttime sample drivers in the 21-34 year age group still maintained the highest percentage of positive results for ldquoIllegalrdquo drugs (142) however that group was then followed by the youngest age group (16-20 years) for ldquoIllegalrdquo drugs (131) (p lt 01) ldquoMedicationsrdquo usage was highest among the 45-64 year age group (88) in the daytime sample (non-significant) and in the 35-44 year old age group in the nighttime sample (69) (p lt 01)
In comparing the number of drug-positive drivers by time of day and BAC level (Tables 38 and 39) a statistically significant association was found between drug-positive and alcohol-positive drivers within the nighttime driving sample In other words the percentage of nighttime drivers with a BAC gdL of 08+ was significantly higher among drug-positive drivers than among drug-negative drivers (p lt 01) However for daytime drivers no such statistical association was found largely because of the small number of alcohol-positive drivers in the daytime sample
18 Age ranges between groups are not equivalent
112
2007 National Roadside Survey of Alcohol and Drug Use by Drivers Drug Results
In both the daytime and nighttime samples the majority of drug-positive drivers who were alcohol-positive were in the ldquoIllegalrdquo drug category (Table 43) This was particularly true in the nighttime sample in which 173 percent in the ldquoIllegalrdquo drug category had BACs between zero and 08 (compared to 63 in the ldquoMedicationsrdquo category) and 57 percent had BACs greater than 08 (compared to 12 in the ldquoMedicationsrdquo category [p lt 01]) In the daytime sample however the differences were statistically non-significant
Blood Analyses About 14 percent of the 3276 blood samples obtained from nighttime drivers were drug-positive (Table 83) Two percent of the blood-sampled drivers tested positive for more than one drug class (Table 93 and about 9 percent of driver tested positive for drugs in the ldquoIllegalrdquo category (Table 97)
Review of blood sample findings by gender (Table 86) revealed that male drivers were more likely to be drug-positive than female drivers (145 males versus 130 females) However such differences were not statistically significant Comparison of drug class by gender (Table 95) revealed that male drivers were significantly more likely to test positive for marijuana than female drivers (74 males versus 56 females) (p lt 05) When examining prevalence by drug category and gender (Table 99) we found that over 10 percent of male drivers had positive results for ldquordquoIllegalrdquo drugs as did about 7 percent of female drivers (p lt 01) The difference in percentage of positive results for ldquoMedicationsrdquo between male and female drivers was not statistically significant
When examining drug prevalence by age (Table 87) the prevalence of drug-positives was higher among young drivers Drivers aged 16-20 years showed a significantly higher prevalence than drivers aged 21-34 years and drivers aged 35-44 years (p lt 01) Drivers aged 45-64 and 65+ were significantly less likely to be drug positive than drivers ages 16 to 34 years old (p lt 01)
Comparison of drug class by age (Table 96) showed that drivers younger than 35-years-old were more likely to test positive for marijuana than drivers in other age groups (p lt 01) Among drivers aged 16-34 drivers aged 16-20 years had the highest marijuana use (152) The prevalence of narcotic-analgesics was higher among the 16-20 and 35-44 year age groups (13 and 17 respectively) than any other age group (p lt 01)
ldquoIllegalrdquo drug use was highest for drivers in the youngest age group (16-20 years) followed by drivers aged 21-34 years old (p lt 01) ldquoIllegalrdquo drug use among drivers older than 35-years-old was significantly lower than among drivers under the age of 35 (p lt 01) ldquoMedicationrdquo usage followed the opposite trend with prevalence increasing with age Prevalence of ldquoMedicationrdquo was higher for drivers aged 35 and older than for drivers younger than age 35 (p lt 01) (Table 100)
A statistically significant association was found between drug-positive and alcohol-positive drivers (Tables 101 and 102) The percentages of drivers with a BAC gdL between zero and 08 and with a BAC gdL 08+ were significantly higher among drug-positive drivers than among drug-negative drivers (p lt 01)
113
2007 National Roadside Survey of Alcohol and Drug Use by Drivers Drug Results
Oral Fluid andor Blood Analyses Combined Similar patterns of results were obtained when we examined the drug prevalence for the 5910 nighttime drivers who provided oral fluid andor blood samples If a driver tested positive for one or more of the drugs in either the oral fluid andor in the blood analyses heshe was categorized as drug-positive (Table 110) This yielded an overall drug positive rate of 163 percent
When we examined individual drugs and their metabolites (Tables 137 and 138) we found that the most frequently encountered drug was marijuana whether it was measured in oral fluid in the daytime (45) oral fluid at nighttime (77) or the combination of oral fluid andor blood at nighttime (87) The next most frequently encountered individual drug (again by all measures) was cocaine which was present in 15 percent of daytime oral fluid samples 39 percent of nighttime oral fluid samples and 39 percent of nighttime combined oral fluid andor blood analyses
During the daytime the next most frequently encountered drug was alprazolam at 112 percent Among nighttime drivers providing oral fluid samples the most frequently encountered drugs after marijuana and cocaine were methamphetamine and oxycodone each with a prevalence rate of 080percent The data collected during the 2007 National Roadside Survey provides new insight into the extent and patterns of drug use and the combination of drug and alcohol use among our Nationrsquos drivers As noted earlier the data collected can not determine whether the drug-use patterns we observed affected driver performance For example although all the drugs examined in this study can potentially impair driving skills some of the drug-positive drivers could drive better with the therapeutic effects of medicinal drugs they are taking What this study has provided is a careful estimate of the extent of alcohol-involved and drug-involved driving in the contiguous 48 States
The next step in this process is to conduct a study that attempts to quantify the risk that drug-involved driving may pose for crash involvement One way to establish that is to conduct a case control study where data including objective measures of drug use are gathered from crash-involved drivers and non-crash-involved drivers matched to the time location and direction of travel of the crash-involved drivers Those two sets of data can then be compared to estimate the risk posed by various drugs
114
2007 National Roadside Survey of Alcohol and Drug Use by Drivers Drug Results
References Bates M Brick J amp White H (1993) Correspondence between saliva and breath estimates of
blood alcohol concentration advantages and limitations of the saliva method Journal of Studies on Alcohol 54(1) 17-22
Beirness D Simpson H M amp Williams A F (2006) Role of Cannabis and Benzodiazepines in Motor Vehicle Crashes Transportation Research Circular No E-C096 Drugs and Traffic A Symposium June 20-21 2005 (pp 12-21) Woods Hole MA Transportation Research Board of the National Academies
Blomberg RD Peck RC Moskowitz H Burns M and Fiorentino D (2005) Crash risk of alcohol involved driving A case-control study Report Stanford CT Dunlap amp Associates Inc (p 117)
Brogan W C Kemp P M Bost R O Glamann D B Lange R A amp Hillis L D (1992) Collection and handling of clinical blood samples to assure the accurate measurement of cocaine concentration Journal of Analytic Toxicology 16 152-154
Burns M M (1993) Cocaine Effects on Performance In H Utzelmann G Berghause amp G Ktoj (Eds) 12th Proceedings of the International Conference on Alcohol Drugs and Traffic Safety Verlang TUumlV Rheinland GmbH (pp 612ndash619) Koumlln Germany Centers for Disease Control and Prevention (2006) Alcohol and other drug use among victims of motor vehicle crashes ndash West Virginia ndash 2004-2005 Morbidity and Mortality Weekly Report (MMWR) 55(48)1293-1296 Available online httpwwwcdcgovmmwrpreviewmmwrhtmlmm5548a2htm
Christophersen A S (1986) Tetrahydrocannabinol stability in whole blood plastic versus glass containers Journal of Analytic Toxicology 10 129-131
Cone E J Presley L Lehrer M Seiter W Smith M Kardos K Fritch D Salamone S J amp Niedbala R (2002) Oral fluid testing for drugs of abuse positive prevalence rates by Intercept immunoassay screening and GC-MS-MS confirmation and suggested cutoff concentrations Journal of Analytical Toxicology 26(8) 541-546
Coulter C Miller E Crompton K Moore C (2008) Tetrahydrocannabinol and two of its metabolites in whole blood using liquid chromatography-tandem mass spectrometry Journal of Analytical Toxicology 32 653-658
Coulter C Crompton K amp Moore C (2008) Detection of phencyclidine in human oral fluid using solid phase extraction and liquid chromatography with tandem mass spectrometric detection Journal of Chromatography B Biomedical Sciences and Applications 873 123 shy128
Couper F J amp Logan B K (2004) Drugs and human performance fact sheet DOT HS 809 725 Washington DC National Highway Traffic Safety Administration
de Gier H (2006 June 20-21) Medicinal Drugs Critical Review of Present Knowledge and Statements for Discussion Paper presented at the Drugs in Traffic A symposium Transportation Research Board Woods Hole MA
115
2007 National Roadside Survey of Alcohol and Drug Use by Drivers Drug Results
Drummer O H (2002) Benzodiazepines Effects on human performance and behavior Forensic Science Review 14 2ndash14
Federal Highway Administration (2006) Highway Statistics 2006 Retrieved June 25 2008 from wwwfhwadotgovpolicyohimhs06driver_licensinghtm
Gieringer D H (1988) Marijuana driving and accident safety Journal of Psychoactive Drugs 20(93) 101
Heishman S J Stitzer M L amp Yingling J E (1989) Effects of tetrahydrocannabinol content on marijuana smoking behavior subjective reports and performance Pharmacology Biochemistry and Behavior 34(1) 173ndash179
Hemmelgarn B Suissa S Huang A Boivin J-F amp Pinard G (1997) Benzodiazepine use and the risk of motor vehicle crash in the elderly Journal of the American Medical Association 278 27-31
Higgins S T Bickel W K Hughes J R Lynn M Capeless M A amp Fenwick J W (1990) Effects of intranasal cocaine on human learning performance and physiology Psychopharmacology 8 451ndash485
Hold K de Boer D Zuidema J amp Maes R (1999) Saliva as an analytical tool in toxicology International Journal of Drug Testing 1(1) 1-36
Hurst P M (1976) Amphetamines and driving behavior Accident Analysis and Prevention 8 9ndash13
Jones R K Shinar D amp Walsh J M (2003) State of knowledge of drug-impaired driving DOT HS 809 642 Washington DC National Highway Traffic Safety Administration
Kelly E Darke S amp Ross J (2004) A Review of drug use and driving Epidemiology impairment risk factors and risk perceptions Drug and Alcohol Review 23 319ndash344
Kiger S Lestina D amp Lund AK (1993) Passive alcohol sensors in law enforcement screening for alcohol-impaired drivers Alcohol Drugs and Driving 9 7-18
Kintz P Cirimele V amp Ludes B (2000) Detection of cannabis in oral fluid (saliva) and forehead wipes (sweat) from impaired drivers International Journal of Drug Testing 24(7) 557-561
Lacey J Kelley-Baker K Furr-Holden C Brainard K and Moore C (2007) Pilot Test of New Roadside Survey Methodology for Impaired Driving DOT HS 810 704 Washington DC National Highway Traffic Safety Administration
Lacey J H Kelley-Baker T Furr-Holden C D M Voas R Moore C Brainard K Tippetts A S Romano E Torres P amp Berning A (2009a) 2007 National Roadside Survey of Alcohol and Drug Use by Drivers Methodology Washington DC National Highway Traffic Safety Administration (in press)
Lacey J H Kelley-Baker T Furr-Holden C D M Voas Romano E Tippetts A S Brainard K amp Berning A (2009b) 2007 National Roadside Survey of Alcohol and Drug Use by Drivers Alcohol Results Washington DC National Highway Traffic Safety Administration (in press)
116
2007 National Roadside Survey of Alcohol and Drug Use by Drivers Drug Results
Lamers C T J amp Ramaekers J G (1999) Marijuana and alcohol effects on visual search and general driving proficiency Journal of Psychopharmacology 13(3 Suppl A) A53
Lestina D C Greene M Voas R B amp Wells J (1999) Sampling procedures and survey methodologies for the 1996 survey with comparisons to earlier National Roadside Surveys Evaluation Review 23(1) 28-46
Leveille S G Buchner D M Koepsell T D McCloskey L W Wolf M E amp Gagner E H (1994) Psychoactive medications and injurious motor vehicle collisions involving older drivers Epidemiology 5 591-598
Lucki I Rickels K amp Geller A (1985) Psychomotor performance following long-term use of benzodiazepines Psychopharmacology Bulletin 21 93-96
Lund A K Preusser D F Blomberg R D amp Williams A F (1988) Drug use by tractor-trailer drivers Journal of Forensic Sciences JFSCA 33(3) 648-661
Lund A K amp Wolfe A C (1991) Changes in the incidence of alcohol-impaired driving in the United States 1973-1986 Journal of Studies on Alcohol 52(4) 293-301
Mathijssen M P Movig K L de Gier J J Nagel P H van Egmond T amp Egberts A C (2002) Use of psychoactive medicines and drugs as a cause of road trauma In D R Mayhew amp C Dussault (Eds) Proceedings of Alcohol Drugs amp Traffic Safety - T 2002 16th International Conference on Alcohol Drugs amp Traffic Safety August 4-9 2002 Vol 2 (pp 451-457) Montreal Canada International Council on Alcohol Drugs and Traffic Safety (ICADTS) Centers for Disease Control and Prevention (2006) Alcohol and other drug use among victims of motor vehicle crashes ndash West Virginia ndash 2004-2005 Morbidity and Mortality Weekly Report (MMWR) 55(48)1293-1296 Available online httpwwwcdcgovmmwrpreviewmmwrhtmlmm5548a2htm
Moore C Coulter C amp Crompton K (2007) Achieving proposed Federal concentrations using reduced specimen volume for the extraction of amphetamines from oral fluid Journal of Analytic Toxicology 31(8) 442-446
Moore C Coulter C Crompton K amp Zumwalt M (2007) Determination of benzodiazepines in oral fluid using LCMSMS Journal of Analytic Toxicology 31(9) 596-600
Moore C Rana S amp Coulter C (2007a) Determination of meperidine tramadol and oxycodone in human oral fluid using solid phase extraction and gas chromatography-mass spectrometry Journal of Chromatography B Biomedical Sciences and Applications 850 370-375
Moore C Rana S amp Coulter C (2007b) Simultaneous identification of 2-carboxyshytetrahydrocannabinol tetrahydrocannabinol cannabinol and cannabidiol in oral fluid Journal of Chromatography B Biomedical Sciences and Applications 852 459-464
Moore C Vincent M Rana S Coulter C Agrawal A amp Soares J (2006) Stability of Delta(9)-tetrahydrocannabinol (THC) in oral fluid using the Quantisaltrade collection device Forensic Science International 164(2-3) 126-130
Moskowitz H (1985) Marijuana and driving Accident Analysis and Prevention 17 323ndash345
117
2007 National Roadside Survey of Alcohol and Drug Use by Drivers Drug Results
National Highway Traffic Safety Administration (1995) National automotive sampling system Crashworthiness data system 1991-1993 Washington DC National Highway Traffic Safety Administration
National Highway Traffic Safety Administration (2001) National Automotive Sampling System Crashworthiness Data System 1995-1997 Washington DC National Highway Traffic Safety Administration
National Highway Traffic Safety Administration (2005) Fatality Analysis Reporting System Fatal crash data overview DOT HS 809 726 Washington DC National Highway Traffic Safety Administration
Neutel C I (1998) Benzodiazepine-related traffic accidents in young and elderly drivers Human Psychopharmacology 13(Suppl 2) S115ndashS123
ONeal C L Crouch D J Rollins D E amp Fatah A A (2000) The effects of collection methods on oral fluid codeine concentrations Journal of Analytic Toxicology 24(7) 536shy542
Perez-Reyes M Hicks R E Bumberry J Jeffcoat A R amp Cook C E (1988) Interaction between marihuana and ethanol Effects on psychomotor performance Alcohol Clinical and Experimental Research 12(2) 268ndash276
Polkis A Maginn D amp Barr J L (1987) Drug findings in driving under the influence of drugs cases a problem of illicit drug use Drug and Alcohol Dependence 20(1) 57-62
Preusser D F Ulmer R G amp Preusser C W (1992 December) Evaluation of the impact of the drug evaluation and classification system on enforcement and adjudication DOT HS 808 058 Washington DC National Highway Traffic Safety Administration
Quintela O Crouch D J amp Andrenyak D M (2006) Recovery of drugs of abuse from the Immunalysis Quantisaltrade oral fluid collection device Journal of Analytic Toxicology 30(8) 614-616
Rana S Moore C Agrawal A Coulter C Vincent M amp Soares J (2006) Determination of propoxyphene in oral fluid Journal of Analytic Toxicology 30(8) 516-518
Ray W A Fought R L amp Decker M D (1992) Psychoactive drugs and the risk of injurious motor vehicle crashes in elderly drivers American Journal of Epidemiology 136 873-883
Robbe H amp OHanlon J (1993) Marijuana and actual driving performance DOT HS 808 078 Washington DC National Highway Traffic Safety Administration US Department of Transportation
Rodrigues W Wang G Moore C Agrawal A Vincent M amp Soares J (2008) Development and validation of ELISA and GC-MS procedures for the quantification of dextromethorphan and its main metabolite dextrorphan in urine and oral fluid Journal of Analytic Toxicology 32 1-7
Samyn N G de Boeck et al (2002) The use of oral fluid and sweat wipes for the detection of drugs of abuse in drivers Journal of Forensic Science 47(6) 1380-1387
118
2007 National Roadside Survey of Alcohol and Drug Use by Drivers Drug Results
Samyn N amp van Haeren C (2000) On-site testing of saliva and sweat with Drugwipe and determination of concentrations of drugs of abuse in saliva plasma and urine of suspected users International Journal of Legal Medicine 113(3) 150-154
Schramm W Smith R H Craig P A amp Kidwell D A (1992) Drugs of abuse in saliva A review Journal of Analytic Toxicology 16(1) 1ndash7
Shinar D (2006) Drug Effects and Their Significance for Traffic Safety Transportation Research Circular No E-C096 Drugs and Traffic A Symposium June 20-21 2005 (pp 52shy64) Woods Hole MA Transportation Research Board of the National Academies
Smiley A (1998) Marijuana On road and driving simulator studies Paper presented at the World Health Organization Geneva Switzerland
StataCorp (2006) Stata Data Analysis and Statistical Software (httpwwwstatacom)
Terhune K Ippolito C Hendricks D Michalovic J Bogema S Santinga P Blomberg R amp Preusser D (1992) The incidence and role of drugs in fatally injured drivers DOT HS 808 065 Washington DC National Highway Traffic Safety Administration
Toennes S amp Kauert G (2001) Importance of vacutainer selection in forensic toxicological analysis of drugs of abuse Journal of Analytic Toxicology 25(5) 339-343
US Department of Transportation (1968) Alcohol and highway safety Report to the US Congress Washington DC US Government Printing Office
Voas R B Wells J Lestina D Williams A amp Greene M (1998) Drinking and driving in the United States The 1996 National Roadside Survey Accident Analysis and Prevention 30(2) 267-275
Waller P Blow F Maio R Hill E Singer K and Schaefer (1995) Crash characteristics and injuries of drivers impaired by alcoholdrugs In TS-95 Proceedings of the 13th International Conference on Alcohol Drugs and Traffic Safety August 13-August 18 1995 Adelaide Australia NHMRC Road Accident Unit University of Adelaide Walsh J M Cangianelli L A Buchan B J amp Leaverton P E (2000) DUI Officer detection of illegal drugs in drivers using rapid immunoassay devices In the 15th International Council on Alcohol Drugs and Traffic Safety (ICADTS) May 22-26 2000 Stockholm Sweden ICADTS
Ward A S Kelly T H Foltin R G amp Fischman M W (1997) Effects of d-amphetamine on task performance and social behavior of humans in a residential laboratory Experimental and Clinical Psychopharmacology 5(2) 130ndash136
White J Z Clardy D O Graves M H Kuo M MacDonald B J Wiersema S J et al (1981) Testing for sedative-hypnotic drugs in the impaired driver A survey of 72000 arrests Clinical Toxicology 18(8) 945-957
Wolfe A C (1974) 1973 US National roadside breath testing survey procedures and results DOT HS 801 241 Washington DC National Highway Traffic Safety Administration
Yacoubian G Wish E D amp Peacuterez D M (2001) A comparison of saliva testing to urinalysis in an arrestee population Journal of Psychoactive Drugs 33(3) 289ndash294
119
2007 National Roadside Survey of Alcohol and Drug Use by Drivers Drug Results
120
2007 National Roadside Survey of Alcohol and Drug Use by Drivers Drug Results
Appendix A
2007 National Roadside Survey Additional Tables
121
2007 National Roadside Survey of Alcohol and Drug Use by Drivers Drug Results
122
2007 National Roadside Survey of Alcohol and Drug Use by Drivers Drug Results
Appendix A 2007 National Roadside Survey
Additional Tables
Table 141 Nighttime Blood Results and Agreement With Self-Reported by Drug Type (Blood)
Drug Category Self-Reported
Drug Use
Blood Positive for this Drug
N (Unweighted)
(Weighted)
Antidepressants
Past 24 Hours Past 2 Days Past Month Past Year Over a Year Never
41 814 1 08 1 02 0 00 1 24
13 152 Overall 57 1000
Amphetamines
Past 24 Hours Past 2 Days Past Month Past Year Over a Year Never
1 31 0 00 3 129 1 125 8 109
38 605 Overall 51 1000
Barbiturates
Past 24 Hours Past 2 Days Past Month Past Year Over a Year Never
2 13 0 00 0 00 0 00 0 00 6 987
Overall 8 1000
Benzodiazepines
Past 24 Hours Past 2 Days Past Month
Past Year Over a Year Never
11 215 4 38 4 80 3 20 5 21
36 626 Overall 63 1000
Cocaine Past 24 Hours 4 29 Past 2 Days 2 108 Past Month 5 170 Past Year 1 10 Over a Year 6 106
123
2007 National Roadside Survey of Alcohol and Drug Use by Drivers Drug Results
Drug Category Self-Reported
Drug Use
Never
Blood Positive for this Drug
N (Unweighted)
(Weighted)
23 577 Overall 41 1000
Cough Suppressants
Past 24 Hours
Past 2 Days
Past Month
Past Year
Over a Year
Never
2 157
1 222
1 606
0 00
0 00
1 14
Overall 5 1000
Ketamine
Past 24 hrs Past 2 days Past Month Past Year Over a Year Never
0 00 0 00 0 00 0 00 0 00 1 1000
Overall 1 1000
Marijuana
Past 24 hrs Past 2 days Past Month Past Year Over a Year Never
59 371 18 54 38 162 22 68 27 93 63 252
Overall 227 1000
Methadone
Past 24 hrs Past 2 days Past Month Past Year Over a Year Never
6 980 0 00 0 00 0 00 0 00 1 20
Overall 7 1000
Opiates
Past 24 hrs Past 2 days Past Month Past Year Over a Year Never
7 227 6 131 3 240 8 37 8 163
17 204 Overall 49 1000
Pain Killers
Past 24 hrs Past 2 days Past Month Past Year Over a Year Never
13 730 3 14 5 230 1 13 2 07 2 06
Overall 26 1000
124
2007 National Roadside Survey of Alcohol and Drug Use by Drivers Drug Results
Drug Category
PCP
Self-Reported Drug Use
Past 24 hrs Past 2 days Past Month Past Year Over a Year Never
Blood Positive for this Drug
N (Unweighted)
(Weighted)
0 NA 0 NA 0 NA 0 NA 0 NA 0 NA
Overall 0 NA
Table 142 Nighttime Seat Belt Observation by Drug Prevalence (Blood)
Drug Drug N Negative Positive
(Unweighted) (Weighted) (Weighted
Driver Seat Belt Observation Yes 3159 865 135 No 106 758 242
Table 143 Nighttime Seat Belt Observation by Drug Class (Percentages Calculated by Row) (Blood)
N (Un
wei
gh
ted
)
An
tid
epre
ssa
nts
(W
eig
hte
d)
Mar
ijuan
a (W
eig
hte
d)
Nar
coti
c-A
nal
ges
ic
(Wei
gh
ted
)
Sed
ativ
es
(Wei
gh
ted
)
Sti
mu
lan
ts(W
eig
hte
d)
Oth
er(W
eig
hte
d)
gt1
Dru
g C
lass
(W
eig
hte
d)
Neg
ativ
e (W
eig
hte
d)
Driver Seat Belt Observation Yes 3156 11 65 08 12 18 03 19 865 No 106 02 139 31 00 44 00 25 758
125
N
(Un
wei
gh
ted
)
An
tid
epre
ssa
nts
(W
eig
hte
d)
Mar
ijuan
a
(Wei
gh
ted
)
Nar
coti
c-A
nal
ge
sic
(W
eig
hte
d)
Sed
ativ
es
(W
eig
hte
d)
Sti
mu
lan
ts
(Wei
gh
ted
)
Oth
er
(Wei
gh
ted
)
gt1
Dru
g C
lass
(W
eig
hte
d)
Neg
ativ
e
(Wei
gh
ted
)
Motorcycle Riders (Operators) 48 085 473 000 713 1070 058 000 7600 Helmet 37 124 192 000 1034 156 084 000 8410 No Helmet Use 9 000 1152 000 000 3253 000 000 5595 Unknown 2 000 000 000 000 000 000 000 10000
2007 National Roadside Survey of Alcohol and Drug Use by Drivers Drug Results
Table 144 Nighttime Seat Belt Observation by Drug Category (Blood)
N (Unwtd)
Illegal
(Weighted)
Medications (Weighted)
Illegal amp Medications (Weighted)
Negative
(Weighted) Driver Seat Belt Observation
Yes 3156 881 400 066 8653 No 106 2025 339 055 7581
Table 145 Nighttime Helmet Use for Motorcycle Riders (Operators) by Drug Positive (Blood)
N (Unweighted)
Drug Positive (Weighted)
Motorcycle Riders (Operators) Helmet
48 37
2400 1590
No Helmet Use 9 4405 Unknown 2 000
Table 146 Nighttime Helmet Use for Motorcycle Riders (Operators) by Drug Class (Percentages Calculated by Row) (Blood)
Table 147 Nighttime Helmet Use for Motorcycle Riders (Operators) by Drug Category (Percentages Calculated by Row) (Blood)
N (Unwtd)
Illegal
(Weighted)
Medications (Weighted)
Illegal amp Medications (Weighted)
Negative
(Weighted)
Motorcycle Riders (Operators) 48 1543 857 000 7600 Helmet 37 348 1242 000 8410 No Helmet Use 9 4405 000 000 5595 Unknown 2 000 000 000 10000
126
N
(Un
wei
gh
ted
)
An
tid
epre
ssa
nts
(W
eig
hte
d)
Mar
ijuan
a
(Wei
gh
ted
)
Nar
coti
c-A
nal
ge
sic
(W
eig
hte
d)
Sed
ativ
es
(W
eig
hte
d)
Sti
mu
lan
ts
(Wei
gh
ted
)
Oth
er
(Wei
gh
ted
)
gt1
Dru
g C
lass
(W
eig
hte
d)
Neg
ativ
e
(Wei
gh
ted
)
Yes 122 16 109 04 02 104 00 82 683 No 3080 11 65 09 11 16 03 18 868 Total 3202 11 67 09 10 19 03 20 861
2007 National Roadside Survey of Alcohol and Drug Use by Drivers Drug Results
Table 148 Nighttime Arrests and Drug Positives (Blood) ldquoDuring the past 12 months were you arrested and booked for driving under the influence of alcohol or drugsrdquo
N Drug Positive (Unweighted) (Weighted)
Yes 122 317 No 3080 132 Total 3202 139
(p lt 01)
Table 149 Nighttime Arrests and Drug Class (Blood) ldquoDuring the past 12 months were you arrested and booked for driving under the influence of alcohol or drugsrdquo
Table 150 Nighttime Arrests and Drug Categories (Blood) ldquoDuring the past 12 months were you arrested and booked for driving under the influence of alcohol or drugsrdquo
N (Unwtd)
Illegal
(Weighted)
Medications (Weighted)
Illegal amp Medications (Weighted)
Negative
(Weighted) Yes 122 223 36 58 683 No 3080 87 41 04 868 Total 3202 92 41 06 861
Table 151 Nighttime Past Treatment Program and Drug Positive (Blood) ldquoDuring the past 12 months did you ever stay at least overnight in an inpatient or residential drug or alcohol
treatment programrdquo
N (Unweighted)
Drug Positive (Weighted)
Yes 31 220 No 3065 137 Total 3096 138
127
N (Un
wei
gh
ted
)
An
tid
epre
ssa
nts
(Wei
gh
ted
)
Mar
ijuan
a(W
eig
hte
d)
Nar
coti
c-A
nal
ge
sic
(Wei
gh
ted
)
Sed
ativ
es
(Wei
gh
ted
)
Sti
mu
lan
ts
(Wei
gh
ted
)
Oth
er(W
eig
hte
d)
gt1
Dru
g C
lass
(
Wei
gh
ted
)
Neg
ativ
e (W
eig
hte
d)
Yes 31 00 22 15 09 24 00 150 780 No 3065 11 68 09 11 17 03 18 863 Total 3096 11 68 09 11 17 03 19 862
2007 National Roadside Survey of Alcohol and Drug Use by Drivers Drug Results
Table 152 Nighttime Inpatient and Drug Class (Blood) ldquoDuring the past 12 months did you ever stay at least overnight in an impatient or residential drug or alcohol treatment program for
example detox rehab a therapeutic community or a hospitalrdquo
Table 153 Nighttime Inpatient and Drug Category (Blood) ldquoDuring the past 12 months did you ever stay at least overnight in an impatient or residential drug or alcohol treatment program for
example detox rehab a therapeutic community or a hospitalrdquo
N (Unwtd)
Illegal
(Weighted)
Medications (Weighted)
Illegal amp Medications (Weighted)
Negative
(Weighted) Yes 31 46 25 150 780 No 3065 93 39 04 863 Total 3096 93 39 06 862
Table 154 Nighttime Outpatient and Drug Positive (Blood) ldquoHave you ever been admitted to an outpatient drug or alcohol treatment program NOT including meetings like AA or NArdquo
Yes
N (Unweighted)
109
Drug Positive (Weighted)
223 No 3089 135 Total 3198 137
128
N
(Un
wei
gh
ted
)
An
tid
epre
ssa
nts
(W
eig
hte
d)
Mar
ijuan
a
(Wei
gh
ted
)
Nar
coti
c-A
nal
ge
sic
(W
eig
hte
d)
Sed
ativ
es
(W
eig
hte
d)
Sti
mu
lan
ts
(Wei
gh
ted
)
Oth
er
(Wei
gh
ted
)
gt1
Dru
g C
lass
(W
eig
hte
d)
Neg
ativ
e
(Wei
gh
ted
)
Yes 109 21 89 06 03 93 00 11 777 No 3089 11 66 09 11 15 03 20 865 Total 3198 11 67 09 10 17 03 20 863
N (Unweighted)
Drug Positive (Weighted)
Yes 74 262 No 3120 134 Total 3194 138
(p lt 01)
2007 National Roadside Survey of Alcohol and Drug Use by Drivers Drug Results
Table 155 Nighttime Outpatient and Drug Class (Blood) ldquoHave you ever been admitted to an outpatient drug or alcohol treatment program NOT including meetings like AA or NArdquo
Table 156 Nighttime Outpatient and Categories (Blood) ldquoHave you ever been admitted to an outpatient drug or alcohol treatment program NOT including meetings like AA or NArdquo
N (Unwtd)
Illegal
(Weighted)
Medications (Weighted)
Illegal amp Medications (Weighted)
Negative
(Weighted) Yes 109 185 30 08 777 No 3089 89 40 06 865 Total 3198 91 40 06 863
Table 157 Nighttime AA or NA and Drug Positives (Blood) ldquoDuring the past 12 months have you received treatment for your drug or alcohol use in a self-help group such as AA or NArdquo
129
N
(Un
wei
gh
ted
)
An
tid
epre
ssa
nts
(W
eig
hte
d)
Mar
ijuan
a
(Wei
gh
ted
)
Nar
coti
c-A
nal
ge
sic
(W
eig
hte
d)
Sed
ativ
es
(W
eig
hte
d)
Sti
mu
lan
ts
(Wei
gh
ted
)
Oth
er
(Wei
gh
ted
)
gt1
Dru
g C
lass
(W
eig
hte
d)
Neg
ativ
e
(Wei
gh
ted
)
Yes 74 00 171 11 03 53 00 23 738 No 3120 11 64 09 11 16 03 20 866
1 Total 3194 1 67 09 10 17 03 20 862
2007 National Roadside Survey of Alcohol and Drug Use by Drivers Drug Results
Table 158 Nighttime AA or NA and Class (Blood) ldquoDuring the past 12 months have you received treatment for your drug or alcohol use in a self-help group such as AA or NArdquo
Table 159 Nighttime AA or NA and Drug Categories (Blood) ldquoDuring the past 12 months have you received treatment for your drug or alcohol use in a self-help group such as AA or NArdquo
N (Unwtd)
Illegal
(Weighted)
Medications (Weighted)
Illegal amp Medications (Weighted)
Negative
(Weighted) Yes 74 225 33 04 738 No 3120 88 40 06 866 Total 3194 92 40 06 862
130
2007 National Roadside Survey of Alcohol and Drug Use by Drivers Drug Results
131
2007 National Roadside Survey of Alcohol and Drug Use by Drivers Drug Results
132
DOT HS 811 249December 2009

This publication is distributed by the US Department of Transportation National Highway Traffic Safety Administration in the interest of information exchange The opinions findings and conclusions expressed in this publication are those of the author(s) and not necessarily those of the Department of Transportation or the National Highway Traffic Safety Administration The United States Government assumes no liability for its content or use thereof If trade or manufacturersrsquo names or products are mentioned it is because they are considered essential to the object of the publication and should not be construed as an endorsement The United States Government does not endorse products or manufacturers
Technical Report Documentation Page 1 Report No
DOT HS 811 249 2 Government Accession No 3 Recipientrsquos Catalog No
4 Title and Subtitle
2007 National Roadside Survey of Alcohol and Drug Use by Drivers Drug Results
5 Report Date
December 2009 6 Performing Organization Code
7 Author(s)
John H Lacey Tara Kelley-Baker Debra Furr-Holden Robert B Voas Eduardo Romano Anthony Ramirez Katharine Brainard Christine Moore Pedro Torres and Amy Berning
8 Performing Organization Report No
9 Performing Organization Name and Address
Pacific Institute for Research and Evaluation 11720 Beltsville Drive Ste 900 Calverton MD 20705 Phone 301-755-2700 Fax 301-755-2799
10 Work Unit No (TRAIS)
11 Contract or Grant No
DTNH22-06-C-00040
12 Sponsoring Agency Name and Address
National Highway Traffic Safety Administration Office of Behavioral Safety Research 1200 New Jersey Avenue SE Washington DC 20590
13 Type of Report and Period Covered
Final Report 14 Sponsoring Agency Code
15 Supplementary Notes
Amy Berning served as the projectrsquos Contracting Officerrsquos Technical Representative The National Institute on Alcohol Abuse and Alcoholism (NIAAA) provided funding and support for the assessment of alcohol use disorders The National Institute on Drug Abuse (NIDA) provided funding for the collection of additional blood samples and the administration of the drug use disorders assessment The National Institute of Justice (NIJ) provided support for querying participants about interaction with the criminal justice system 16 Abstract
This report presents the first national prevalence estimates for drug-involved driving derived from the recently completed 2007 National Roadside Survey (NRS) The NRS is a national field survey of alcohol- and drug-involved driving conducted primarily among nighttime weekend drivers but also daytime Friday drivers The survey involved randomly stopping drivers at 300 locations across the continental United States sites were selected through a stratified random sampling procedure This included data that we collected during a two-hour Friday daytime session at 60 locations and during four 2-hour nighttime periods (10 pm to midnight and 1 am to 3 am on both Friday and Saturday) at 240 locations Both self-report and biological measures were taken Biological measures included breath alcohol measurements on 9413 respondents oral fluid from 7719 respondents and blood samples from 3276 respondents Oral fluid and blood samples were subjected to laboratory screening and LCMS-MS and GCMS confirmation for 75 drugs and metabolites including illegal prescription and over-the-counter drugs These data were analyzed to develop the first national prevalence estimate of alcohol- and drug-involved driving Two prior reports on the 2007 NRS described (1) the sampling plan and data collection methodology summarizing the response patterns to the various stages of the multi-part survey and (2) the prevalence estimates for alcohol-involved driving derived from the study and comparing them with the three previous National Roadside Surveys (NRS)
17 Key Words
Alcohol and driving drugs and driving roadside survey impaired driving drugged driving alcohol-involved driving drug-involved driving
18 Distribution Statement
Document is available to the public from the National Technical Information Service wwwntisgov
19 Security Classif (of this report)
Unclassified20 Security Classif (of this page)
Unclassified 21 No of Pages
148 22 Price
Form DOT F 17007 (872) Reproduction of completed page authorized
i
2007 National Roadside Survey of Alcohol and Drug Use by Drivers Drug Results
ii
2007 National Roadside Survey of Alcohol and Drug Use by Drivers Drug Results
Acknowledgements The authors received extensive assistance from State and local officials in the conduct of this project Our data collection procedures were not routine The willingness of officials to help us identify cooperating local law enforcement agencies and the willingness of agencies to participate in the project were essential to our success To all those who helped in conducting this study the authors express their sincere gratitude
iii
2007 National Roadside Survey of Alcohol and Drug Use by Drivers Drug Results
iv
Executive Summary 1
Methodology1 Results3 Summary 8
Introduction9 Background9 Prevalence of Drug-Involved Driving 10 Impact of Drugs on Driving Skills10
Laboratory Studies 10 Field Data11
Challenges in Measurement and Todayrsquos Drug Testing Opportunities13 Project Objectives 14
Methods17 Survey Sampling Procedures 17 Preparation for the 2007 NRS Survey 20 Driver Conversion23 Selection of Drugs for Screening and Analysis 24 Oral Fluid Collection Device 27 Blood Collection Procedures 29 Drug Questionnaire31
Oral Fluid Sample Analysis Procedures 32 Gas Chromatography-Mass Spectrometry (GCMS)32 Liquid Chromatography-Tandem Mass Spectrometry (LCMS-MS)32 Blood Sample Analysis Procedures 33 Ethanol (Oral Fluid and Blood) 33
Drug Classes and Categories 33 Results37
Oral Fluid Results (Daytime and Nighttime Samples) 37 Driver Drug Use Prevalence Based on Oral Fluid Results 37 Driver Drug Use Prevalence by Drug Class Based on Oral Fluid Results 44 Driver Drug Use Prevalence by Drug Category Based on Oral Fluid Results 48 Driver Drug Prevalence Based on Oral Fluid and BAC Results 53 Drugs Oral Fluid Results and Agreement With Self-Reported Drug Use59 Observed Safety Measures of Daytime and Nighttime Drivers (Oral Fluid) 62 Reported Contact With the Criminal Justice System (Oral Fluid) 66 Reported Contact With the Health System (Oral Fluid)69
Blood Results (Nighttime Samples)76 Driver Drug Use Prevalence Based on Blood Results76 Driver Drug Use Prevalence by Drug Class Based on Blood Results80 Driver Drug Use Prevalence by Drug Category Based on Blood Results82 Driver Drug Use Prevalence From Blood and BAC Results85
Oral Fluid andor Blood Results (Nighttime Samples)89 Driver Drug Use Prevalence Based on Oral Fluid andor Blood Results 89
2007 National Roadside Survey of Alcohol and Drug Use by Drivers Drug Results
Table of Contents
v
2007 National Roadside Survey of Alcohol and Drug Use by Drivers Drug Results
Driver Drug Use Prevalence by Drug Class Based on Oral Fluid andor Blood Results 94 Driver Drug Use Prevalence by Drug Category Based on Oral Fluid andor Blood Results 96 Driver Drug Use Prevalence From Oral Fluid andor Blood and BAC Results 98
Individual Drug Prevalence Estimates from Oral Fluid and Oral Fluid andor Blood Combined102
Overall Individual Drug Prevalence in Daytime and Nighttime 103 Individual Drug Prevalence in Nighttime Oral Fluid andor Blood 105 Individual Drug Prevalence Sorted by Drug Type from Oral Fluid and Oral Fluid andor Blood Combined107
Discussion111 Oral Fluid Analyses 111 Blood Analyses 113 Oral Fluid andor Blood Analyses Combined114
References115 Appendix A121
2007 National Roadside Survey Additional Tables122
Tables Table 1 Participating Drivers (Percentages in Parentheses) 3 Table 2 Drug Prevalence by Time of Day (Oral Fluid) 3 Table 3 Drug Categories Distribution by Time of Day (Oral Fluid) 4 Table 4 BAC Among Drug-Positive Drivers by Drug Category and Time of Day (Oral Fluid) 5 Table 5 Drug Classes by Time of Day and Region (Oral Fluid) 6 Table 6 Number and Distribution of Drug Classes by Time of Day (Oral Fluid) 6 Table 7 Drug Categories Distribution (Blood) 7 Table 8 BAC Among Drug-Positive Drivers by Drug Category (Percentage by Row) (Blood)7 Table 9 Comparison of Number of Nighttime Participants by Year in the National Roadside
Surveys21 Table 10 Participating Drivers (Percentages in Parentheses) 22 Table 11 Oral Fluid Analysis Results Among Converted Drivers 23 Table 12 Blood Analysis Results Among Converted Drivers 23 Table 13 Selected Drugs and Minimum Detection Concentrationsdagger24 Table 14 Extraction Efficiency of Quantisaltrade Oral Fluid Collection Device Over a Range of
Drugs Quintela29 Table 15 Extraction Efficiency of Quantisaltrade Oral Fluid Collection Device Over a Range of
Drugs Moore 29 Table 16 Drug Questionnaire Survey 31 Table 17 Drug Class CompositionmdashOral Fluid and Blood Combined 34 Table 18 Drug Category CompositionmdashOral Fluid and Blood Combined 35 Table 19 Drug Prevalence by Time of Day (Oral Fluid) 38 Table 20 Drug Prevalence by Time of DaySession (Oral Fluid)38 Table 21 Drug Prevalence by Time of Day and Region (Oral Fluid)39 Table 22 Drug Prevalence by Time of Day and Gender (Oral Fluid) 39 Table 23 Drug Prevalence by Time of Day and Age (Oral Fluid)40 Table 24 Drug Prevalence by Time of Day Age and Gender (Oral Fluid)41
vi
2007 National Roadside Survey of Alcohol and Drug Use by Drivers Drug Results
Table 25 Drug Prevalence by RaceEthnicity (Oral Fluid)42 Table 26 Drug Prevalence by Education Level (Oral Fluid) 42 Table 27 Drug Prevalence by Employment Status (Oral Fluid) 43 Table 28 Drug Prevalence by Vehicle Type (Oral Fluid)44 Table 29 Number and Distribution of Drug Classes by Time of Day (Oral Fluid) 44 Table 30 Number and Distribution of Drug Classes by Time of Day (Drug Positives Only)
(Oral Fluid) 45 Table 31 Drug Classes by Time of Day and Region (Oral Fluid) 46 Table 32 Drug Classes Distribution by Time of Day and Gender (Oral Fluid)47 Table 33 Drug Class Distribution by Time of Day and Age (Oral Fluid) 48 Table 34 Drug Categories Distribution by Time of Day (Oral Fluid) 49 Table 35 Drug Categories Distribution by Time of Day and Region (Oral Fluid)50 Table 36 Drug Categories Distribution by Time of Day and Gender (Oral Fluid)51 Table 37 Drug Categories Distribution by Time of Day and Age (Oral Fluid)52 Table 38 Drug Prevalence by Time of Day and BAC (Percentages Calculated by Row)
(Oral Fluid) 54 Table 39 Drug Prevalence by Time of Day and BAC
(Percentages Calculated by Column) (Oral Fluid)54 Table 40 BAC Among Drug-Positive Drivers by Time of Day and Age (Oral Fluid)55 Table 41 BAC Among Drug-Positive Drivers by Number of Drug Classes and Time of Day
(Percentages Calculated by Column) (Oral Fluid)55 Table 42 BAC Among Drug-Positive Drivers by Number of Drug Classes and Time of Day
(Percentages Calculated by Row) (Oral Fluid)56 Table 43 BAC Among Drug-Positive Drivers by Drug Category and Time of Day
(Oral Fluid) 56 Table 44 BAC of Drivers by Drug Category Age and Time of Day (Oral Fluid)57 Table 45 BAC of Drivers by Drug Category Gender and Time of Day (Oral Fluid)58 Table 46 Oral Fluid Results and Agreement With Self-Reported by Drug Type (Oral Fluid) 60 Table 47 Daytime Seat Belt Observation By Drug Prevalence (Oral Fluid)62 Table 48 Nighttime Seat Belt Observation by Drug Prevalence (Oral Fluid) 62 Table 49 Daytime Seat Belt Observation by Drug Class (Percentages Calculated by Row)
(Oral Fluid) 63 Table 50 Nighttime Seat Belt Observation by Drug Class (Percentages Calculated by Row)
(Oral Fluid) 63 Table 51 Daytime Seat Belt Observation by Drug Category (Percentages Calculated by Row)
(Oral Fluid) 64 Table 52 Nighttime Belt Observation by Drug Category (Percentages Calculated by Row)
(Oral Fluid) 64 Table 53 Daytime Helmet Use for Motorcycle Riders (Operators) by Drug Positive
(Oral Fluid) 64 Table 54 Nighttime Helmet Use for Motorcycle Riders (Operators) by Drug Positive
(Oral Fluid) 65 Table 55 Daytime Helmet Use for Motorcycle Riders (Operators) by Drug Class
(Oral Fluid) 65 Table 56 Nighttime Helmet Use for Motorcycle Riders (Operators) by Drug Class
(Percentages Calculated by Row) (Oral Fluid)65
vii
2007 National Roadside Survey of Alcohol and Drug Use by Drivers Drug Results
Table 57 Daytime Helmet Use for Motorcycle Riders (Operators) by Drug Category (Oral Fluid) 66
Table 58 Nighttime Helmet Use for Motorcycle Riders (Operators) by Drug Category (Percentages Calculated by Row) (Oral Fluid)66
Table 59 Arrests and Drug Positives Daytime (Oral Fluid) ldquoDuring the past 12 months were you arrested and booked for driving under the influence of alcohol or drugsrdquo66
Table 60 Arrests and Drug Positives Nighttime (Oral Fluid) ldquoDuring the past 12 months were you arrested and booked for driving under the influence of alcohol or drugsrdquo67
Table 61 Arrests and Drug Class Daytime (Oral Fluid) ldquoDuring the past 12 months were you arrested and booked for driving under the influence of alcohol or drugsrdquo67
Table 63 Arrests and Drug Categories Daytime (Oral Fluid) ldquoDuring the past 12 months were you arrested and booked for driving under the influence of alcohol or drugsrdquo68
Table 64 Arrests and Drug Categories Nighttime (Oral Fluid) ldquoDuring the past 12 months were you arrested and booked for driving under the influence of alcohol or drugrdquo 68
Table 65 Past Treatment Program and Drug Positive Daytime (Oral Fluid) ldquoDuring the past 12 months did you ever stay at least overnight in an inpatient or residential drug or alcohol treatment programrdquo 69
Table 66 Past Treatment Program and Drug Positive Nighttime (Oral Fluid) ldquoDuring the past 12 months did you ever stay at least overnight in an inpatient or residential drug or alcohol treatment programrdquo69
Table 67 Outpatient and Drug Positive Daytime (Oral Fluid) ldquoHave you ever been admitted to an outpatient drug or alcohol treatment program NOT including meetings like AA or NArdquo 70
Table 68 Outpatient and Drug Positive Nighttime (Oral Fluid) ldquoHave you ever been admitted to an outpatient drug or alcohol treatment program NOT including meetings like AA or NArdquo 70
Table 69 AA or NA and Drug Positives Daytime (Oral Fluid) ldquoDuring the past 12 months have you received treatment for your drug or alcohol use in a self-help group such as Alcoholics Anonymous or Narcotics Anonymousrdquo70
Table 70 AA or NA and Drug Positives Nighttime (Oral Fluid) ldquoDuring the past 12 months have you received treatment for your drug or alcohol use in a self-help group such as Alcoholics Anonymous of Narcotics Anonymousrdquo71
Table 71 Inpatient and Drug Class Daytime (Oral Fluid) ldquoDuring the past 12 months did you ever stay at least overnight in an impatient or residential drug or alcohol treatment program for example detox rehab a therapeutic community or a hospitalrdquo71
Table 72 Inpatient and Drug Class Nighttime (Oral Fluid) ldquoDuring the past 12 months did you ever stay at least overnight in an impatient or residential drug or alcohol treatment program for example detox rehab a therapeutic community or a hospitalrdquo72
Table 73 Inpatients and Drug Category Daytime (Oral Fluid) ldquoDuring the past 12 months were you arrested and booked for driving under the influence of alcohol or drugsrdquo72
Table 74 Inpatients and Drug Category Nighttime (Oral Fluid) ldquoDuring the past 12 months were you arrested and booked for driving under the influence of alcohol or drugsrdquo72
Table 75 Outpatient and Drug Class Daytime (Oral Fluid) ldquoHave you ever been admitted to an outpatient drug or alcohol treatment program NOT including meetings like AA or NArdquo 73
viii
2007 National Roadside Survey of Alcohol and Drug Use by Drivers Drug Results
Table 76 Outpatient and Drug Class Nighttime (Oral Fluid) ldquoHave you ever been admitted to an outpatient drug or alcohol treatment program NOT including meetings like AA or NArdquo 73
Table 77 Outpatient and Categories Daytime (Oral Fluid) ldquoHave you ever been admitted to an outpatient drug or alcohol treatment program NOT including meetings like AA or NArdquo 74
Table 78 Outpatient and Categories Nighttime (Oral Fluid) ldquoHave you ever been admitted to an outpatient drug or alcohol treatment program NOT including meetings like AA or NArdquo 74
Table 79 AA NA and Classes Daytime (Oral Fluid) ldquoDuring the past 12 months have you received treatment for your drug or alcohol use in a self-help group such as AA or NArdquo74
Table 80 AA NA and Classes Nighttime (Oral Fluid) ldquoDuring the past 12 months have you received treatment for your drug or alcohol use in a self-help group such as AA or NArdquo75
Table 81 NA AA and Drug Categories Daytime (Oral Fluid) ldquoDuring the past 12 months have you received treatment for your drug or alcohol use in a self-help group such as AA or NArdquo 75
Table 82 NA AA and Drug Categories Nighttime (Oral Fluid) ldquoDuring the past 12 months have you received treatment for your drug or alcohol use in a self-help group such as AA or NArdquo 76
Table 83 Drug Prevalence by Time of Day (Blood)76 Table 84 Drug Prevalence by Session (Blood) 77 Table 85 Drug Prevalence by Region (Blood)77 Table 86 Drug Prevalence by Gender (Blood) 77 Table 87 Drug Prevalence by Age (Blood)78 Table 88 Drug Prevalence by Age and Gender (Blood) 78 Table 89 Drug Prevalence by RaceEthnicity (Blood) 78 Table 90 Drug Prevalence by Education Level (Blood)79 Table 91 Drug Prevalence by Employment Status (Blood)79 Table 92 Drug Prevalence by Vehicle Type (Blood)80 Table 93 Number and Distribution of Drug Classes (Blood) 80 Table 94 Drug Classes Distribution by Region (Blood)81 Table 95 Drug Classes Distribution by Gender (Blood)81 Table 96 Drug Classes Distribution by Age (Blood)82 Table 97 Drug Categories Distribution (Blood) 82 Table 98 Drug Categories Distribution by Region (Blood)83 Table 99 Drug Categories Distribution by Gender (Blood)84 Table 100 Drug Categories Distribution by Age (Blood)85 Table 101 Drug Prevalence by BAC (Percentages Calculated by Row) (Blood)86 Table 102 Drug Prevalence by BAC (Percentages Calculated by Column) (Blood) 86 Table 103 BAC Among Drug-Positive Drivers by Age (Blood)86 Table 104 BAC Among Drug-Positive Drivers by Number of Drug Classes
(Percentages Calculated by Column) (Blood) 87 Table 105 BAC Among Drug-Positive Drivers by Number of Drug Classes
(Percentages Calculated by Row) (Blood)87 Table 106 BAC Among Drug-Positive Drivers by Drug Category
(Percentage by Row) (Blood) 87 Table 107 BAC Among Drug-Positive Drivers by Drug Category
(Percentage by Column) (Blood) 88
ix
2007 National Roadside Survey of Alcohol and Drug Use by Drivers Drug Results
Table 108 BAC of Drivers by Drug Category and Age (Blood) 88 Table 109 BAC of Drivers by Drug Category and Gender (Blood) 89 Table 110 Nighttime Drug Prevalence by Time of Day (Oral Fluid andor Blood)90 Table 111 Drug Prevalence by Session (Oral Fluid andor Blood) 90 Table 112 Drug Prevalence by Region (Oral Fluid andor Blood)90 Table 113 Drug Prevalence by Gender (Oral Fluid andor Blood)91 Table 114 Drug Prevalence by Age (Oral Fluid andor Blood)91 Table 115 Drug Prevalence by Age and Gender (Oral Fluid andor Blood) 92 Table 116 Drug Prevalence by RaceEthnicity (Oral Fluid andor Blood)92 Table 117 Drug Prevalence by Education Level (Oral Fluid andor Blood) 93 Table 118 Drug Prevalence by Employment Status (Oral Fluid andor Blood) 93 Table 119 Drug Prevalence by Vehicle Type (Oral Fluid andor Blood)93 Table 120 Number and Distribution of Drug Classes (Oral Fluid andor Blood) 94 Table 121 Number and Distribution of Drug Classes (Drug Positives Only)
(Oral Fluid andor Blood) 94 Table 122 Drug Classes Distribution by Region (Oral Fluid andor Blood) 95 Table 123 Drug Classes Distribution by Gender (Oral Fluid andor Blood)95 Table 124 Drug Classes Distribution by Age (Oral Fluid andor Blood) 96 Table 125 Drug Categories Distribution (Oral Fluid andor Blood)96 Table 126 Drug Categories Distribution by Region (Oral Fluid andor Blood) 97 Table 127 Drug Categories by Gender (Oral Fluid andor Blood) 97 Table 128 Drug Categories Distribution by Age (Oral Fluid andor Blood)98 Table 129 Drug Prevalence by BAC (Percentages Calculated by Row)
(Oral Fluid andor Blood) 99 Table 130 Drug Prevalence by BAC (Percentages Calculated by Column)
(Oral Fluid andor Blood) 99 Table 131 BAC Among Drug-Positive Drivers by Age (Oral Fluid andor Blood)99 Table 132 BAC Among Drug-Positive Drivers by Number of Drug Classes
(Percentages Calculated by Column) (Oral Fluid andor Blood)100 Table 133 BAC Among Drug-Positive Drivers by Number of Drug Classes
(Percentages Calculated by Row) (Oral Fluid andor Blood)100 Table 134 BAC Among Drug-Positive Drivers by Drug Category
(Oral Fluid andor Blood) 100 Table 135 BAC of Drivers by Drug Category and Age (Oral Fluid andor Blood) 101 Table 136 BAC of Drivers by Drug Category and Gender (Oral Fluid andor Blood) 102 Table 137 Prevalence of Drugs in Daytime and Nighttime Drivers (Oral Fluid)104 Table 138 Prevalence of Drugs in All Drug-Tested Nighttime Drivers
(Oral Fluid andor Blood) 106 Table 139 Prevalence of Drugs in Daytime and Nighttime Drivers (Oral Fluid)108 Table 140 Prevalence of Drugs in All Drug-Tested Nighttime Drivers (Oral Fluid andor Blood) 109 Table 141 Nighttime Blood Results and Agreement With Self-Reported by
Drug Type (Blood)123 Table 142 Nighttime Seat Belt Observation by Drug Prevalence (Blood)125 Table 143 Nighttime Seat Belt Observation by Drug Class
(Percentages Calculated by Row) (Blood)125
x
2007 National Roadside Survey of Alcohol and Drug Use by Drivers Drug Results
Table 144 Nighttime Seat Belt Observation by Drug Category (Blood)126 Table 145 Nighttime Helmet Use for Motorcycle Riders (Operators)
by Drug Positive (Blood) 126 Table 146 Nighttime Helmet Use for Motorcycle Riders (Operators) by Drug Class
(Percentages Calculated by Row) (Blood)126 Table 147 Nighttime Helmet Use for Motorcycle Riders (Operators) by Drug Category
(Percentages Calculated by Row) (Blood)126 Table 148 Nighttime Arrests and Drug Positives (Blood) ldquoDuring the past 12 months
were you arrested and booked for driving under the influence of alcohol or drugsrdquo127 Table 149 Nighttime Arrests and Drug Class (Blood) ldquoDuring the past 12 months
were you arrested and booked for driving under the influence of alcohol or drugsrdquo127 Table 150 Nighttime Arrests and Drug Categories (Blood) ldquoDuring the past 12 months
were you arrested and booked for driving under the influence of alcohol or drugsrdquo127 Table 151 Nighttime Past Treatment Program and Drug Positive (Blood)
ldquoDuring the past 12 months did you ever stay at least overnight in an inpatient or residential drug or alcohol treatment programrdquo 127
Table 152 Nighttime Inpatient and Drug Class (Blood) ldquoDuring the past 12 months did you ever stay at least overnight in an impatient or residential drug or alcohol treatment program for example detox rehab a therapeutic community or a hospitalrdquo128
Table 153 Nighttime Inpatient and Drug Category (Blood) ldquoDuring the past 12 months did you ever stay at least overnight in an impatient or residential drug or alcohol treatment program for example detox rehab a therapeutic community or a hospitalrdquo128
Table 154 Nighttime Outpatient and Drug Positive (Blood) ldquoHave you ever been admitted to an outpatient drug or alcohol treatment program NOT including meetings like AA or NArdquo128
Table 155 Nighttime Outpatient and Drug Class (Blood) ldquoHave you ever been admitted to an outpatient drug or alcohol treatment program NOT including meetings like AA or NArdquo 129
Table 156 Nighttime Outpatient and Categories (Blood) ldquoHave you ever been admitted to an outpatient drug or alcohol treatment program NOT including meetings like AA or NArdquo 129
Table 157 Nighttime AA or NA and Drug Positives (Blood) ldquoDuring the past 12 months have you received treatment for your drug or alcohol use in a self-help group such as AA or NArdquo129
Table 158 Nighttime AA or NA and Class (Blood) ldquoDuring the past 12 months have you received treatment for your drug or alcohol use in a self-help group such as AA or NArdquo 130
Table 159 Nighttime AA or NA and Drug Categories (Blood) ldquoDuring the past 12 months have you received treatment for your drug or alcohol use in a self-help group such as AA or NArdquo 130
Figures Figure 1 Map of Sixty 2007 National Roadside Survey Sites 19 Figure 2 Collecting an Oral Fluid Sample with the Quantisaltrade Oral Fluid Collection Device 28
xi
2007 National Roadside Survey of Alcohol and Drug Use by Drivers Drug Results
xii
2007 National Roadside Survey of Alcohol and Drug Use by Drivers Drug Results
Executive Summary This report presents the first US national prevalence estimate of drug-involved driving It is based on the results of analyses of oral fluid blood and breath specimens collected during the 2007 National Roadside Survey of Alcohol and Drug Use by Drivers It is one of the three reports that summarize the results of a 2007 study conducted by the Pacific Institute for Research and Evaluation (PIRE) for the National Highway Traffic Safety Administration (NHTSA) under Contract DTNH22-06-C-00040 ldquo2007 Roadside Survey of Alcohol and Drugged Drivingrdquo There are two prior reports on the 2007 National Roadside Survey (NRS) (1) ldquo2007 National Roadside Survey of Alcohol and Drug Use by Drivers Methodologyrdquo (Lacey Kelley-Baker Furr-Holden Voas Moore Brainard Tippetts Romano Torres amp Berning 2009a) which describes the sampling plan and data collection methodology and summarizes the response patterns to the various stages of the multi-part survey and (2) ldquo2007 National Roadside Survey of Alcohol and Drug Use by Drivers Alcohol Resultsrdquo (Lacey Kelley-Baker Furr-Holden Voas Romano Tippetts Ramirez Brainard amp Berning 2009b) which presents the prevalence estimates for alcohol-involved driving derived from the study and compares those estimates with data from the three previous National Roadside Surveys
Methodology Three prior national roadside surveys of drivers to estimate prevalence of drinking and driving and determine changes over time have been conducted in the United States These surveys which included a brief interview and a breath sample to determine blood alcohol concentration (BAC) were conducted on a stratified random sample of weekend nighttime drivers in the 48 contiguous States The first National Roadside Survey (NRS) sponsored by NHTSA was conducted in 1973 (Wolfe 1974) The second NRS was sponsored by the Insurance Institute for Highway Safety (IIHS) and conducted in 1986 (Lund amp Wolfe 1991) and the third jointly funded by IIHS and NHTSA was conducted in 1996 (Voas Wells Lestina Williams amp Greene 1998) NHTSA sponsored the 2007 NRS described in this report with additional funding from the National Institute on Alcohol Abuse and Alcoholism (NIAAA) the National Institute on Drug Abuse (NIDA) and the National Institute of Justice (NIJ) Like its predecessors the 2007 NRS covered the 48 contiguous States
As in previous NRS studies the 2007 NRS data were collected during the following periods on both Friday and Saturday nights 10 pm to midnight and 1 am to 3 am1 In addition the 2007 survey also included a Friday daytime data collection period either from 930 am to 1130 am or from 130 pm to 330 pm The prior three surveys did not include commercial vehicles and motorcycles in the sample this survey however included motorcycles In addition to a daytime survey and the inclusion of motorcycles the 2007 NRS included other features that the prior surveys did not (1) more data collectors per survey site to achieve a larger sample size (2) the collection of biological samples (oral fluid and blood) to determine the presence of drugs other than alcohol in the driving population (3) a questionnaire to allow an estimation of alcohol use disorders (AUDs) among drinking drivers (4) a questionnaire to study driversrsquo patterns of drug
1 In this report a ldquoFriday nightrdquo or a ldquoSaturday nightrdquo includes the early hours of the following day
1
2007 National Roadside Survey of Alcohol and Drug Use by Drivers Drug Results
consumption (5) questions about interaction with the criminal justice system and the treatment system and (6) collection of information on passengers
In all four NRS studies police officers directed vehicles to a safe location where an interviewer approached the driver and requested participation in a survey followed by a breath test Random selection of drivers was insured by selecting the next vehicle when an interviewer became available Any driver suspected of impairment was subjected to a safety protocol designed to dissuade hisher continued driving on that trip See the Methodology Report for details (Lacey et al 2009a)
As noted above the original 1973 survey used a four-stage sampling plan and the 1986 NRS attempted to replicate the 1973 locations In the 1996 and 2007 surveys the first stage was taken from the NHTSArsquos National Automotive Sampling SystemCrashworthiness Data System (NASSCDS 1995) The second stage involved the selection of police jurisdictions within the NASSCDS primary sampling units The third stage of the sampling design involved the selection of survey sites within police jurisdictions and the fourth stage consisted of selecting drivers at random from the traffic flow at these sites Details regarding the sampling plan can be found in the Methodology Report (Lacey et al 2009a)
New to the 2007 survey was the collection of additional types of biological samples (oral fluid and blood) to determine the presence of drugs other than alcohol in the driving population Oral fluid and blood samples were analyzed in a laboratory using enzyme-linked immunosorbent assay (ELISA) screening followed by a confirmatory analysis by Liquid Chromatography-Tandem Mass Spectrometry (LCMS-MS) or Gas ChromatographyMass Spectrometry (GCMS) This 2007 NRS is more extensive than any previous NRS study and provides a much broader perspective on alcohol and drug use in the driving population than previously available These data are essential to developing more precise estimates of the presence of alcohol and other drugs in drivers and in measuring the prevalence of alcohol- and drug-involved driving
This report summarizes the drug-involved driving prevalence estimates obtained through analyses of oral fluid and blood specimen results and combined with alcohol using breath alcohol measurements It should be emphasized that prevalence estimates do not necessarily imply ldquoimpairmentrdquo but rather in this case the presence of drugs and alcohol in the driver population For many drug types drug presence can be detected long after any impairment that might affect driving has passed2 Other studies are required to assess whether that presence implies an increased risk of crash involvement In this study we developed driver-prevalence estimates for illegal prescription and over-the-counter drugs which were determined by a panel of experts to possibly cause impairment It should be noted that prescription and over-the-counter drugs can be used according to medical advice or extra-medicinally Again the prevalence estimates indicate the presence of the drugs in drivers but do not necessarily indicate that the drivers were impaired Alcohol presence above the legal limit implies impairment alcohol below the legal limit may not imply impairment
2 For example traces of metabolites of marijuana can be detected in blood samples several days after chronic users stop ingestion Also whereas the impairment effects for various concentration levels of alcohol is well understood little evidence is available to link concentrations of other drug types to driver performance
2
2007 National Roadside Survey of Alcohol and Drug Use by Drivers Drug Results
As discussed earlier we gathered data from drivers on US roadways during Friday daytime hours and Friday nights and Saturday nights As indicated in Table 1 we obtained oral fluid samples from drivers in each of those data collection periods (1850 during daytime and 5869 during nighttime) We also collected blood samples during the nighttime data collection periods (3276)
Table 1 Participating Drivers (Percentages in Parentheses)
2007 Daytime Nighttime Total
Signaled to enter site 3516 9553 13069 Did not enter site 933 1016 1949 Entered site 2583 8537 11120 Eligible 2525 8384 10909
Entered site and interviewed 2174 (861) dagger 6920 (825) dagger 9094 (834) dagger
Valid breath sample 2254 (893) dagger 7159 (854) dagger 9413 (863) dagger
Oral Fluid sample 1850(733) dagger 5869 (700) dagger 7719 (707) dagger
Blood sample NA 3276 (391) dagger NA
AUD ampor Drug Questionnaire 1889 (752) dagger 5983 (714) dagger 7882 (722) dagger
NA (not applicable) Blood samples were not collected during daytime sessions In this table percentages are unweighted dagger Percent of eligible
Results In this study analyses of the oral fluid and blood samples were conducted to identify the presence of some 75 drugs and metabolites including illegal prescription and over-the-counter drugs
Comparison of overall drug prevalence by time of day (Table 2) indicates that 11 percent of drivers in the daytime sample were drug-positive This level was significantly lower than the 144 percent of nighttime drivers who tested positive for drugs (p lt 01)3
Table 2 Drug Prevalence by Time of Day (Oral Fluid)
Time of Day N
(Unweighted) Drug Positive
(Weighted) Daytime 1850 110 Nighttime 5869 144
To make the presentation of results most useful we identified three broad categories of drugs illegal prescription and over-the-counter Because few over-the-counter drugs were found the prescription and over-the-counter drugs were combined for many analyses and labeled
3 p lt 01 indicates that under the null hypothesis the probability of encountering this difference by chance is less than 1 percent p lt 05 indicates that the probability of encountering this difference by chance is less than 5 percent
3
2007 National Roadside Survey of Alcohol and Drug Use by Drivers Drug Results
ldquoMedicationsrdquo Additionally some respondents tested positive for more than one category of drug Thus tables presenting drug categories present four mutually exclusive categories Illegal Medications Illegal and Medications and Negative So as not to double count individual positive results an individualrsquos result appears in only one of these categories However for example in Table 3 to determine the proportion of daytime drivers who tested positive for illegal drugs one could sum the daytime values for the ldquoIllegalrdquo category (58) and for the rdquo Illegal amp Medicationsrdquo category (05) to arrive at a prevalence estimate of 63 of daytime drivers who were positive for at least one illegal drug Detailed summaries of prevalence estimates for individual drugs appear in Tables 137-140 later in the report As indicated in Table 3 comparison of drug categories by time of day revealed that based on oral fluid analyses almost 6 percent of daytime drivers tested positive for drugs in the ldquoIllegalrdquo category (primarily marijuana and cocaine) as opposed to over 10 percent of nighttime drivers There was a statistically significant difference between daytime and nighttime drivers (p lt 01)
Table 3 Drug Categories Distribution by Time of Day (Oral Fluid)
N Time of Day Drug Category (Unweighted) (Weighted)
Daytime
Illegal Medications Illegal amp Medications Negative
125 107 14
1604
58 48 05
890 Overall Daytime 1850 1000
Nighttime
Illegal Medications Illegal amp Medications Negative
575 201 60
5033
105 30 09
856 Overall Nighttime 5869 1000
ldquoMedicationsrdquo includes prescription and over-the-counter drugs
Positive results in the ldquoMedicationsrdquo category though not statistically significant were found to be slightly higher among the daytime drivers (almost 5) than nighttime drivers (3) Additionally some drivers tested positive for both ldquoIllegal drugs and Medicationsrdquo (05 of daytime drivers and 09 of nighttime drivers) This indicates that drugs were not detected in 890 percent of daytime drivers and 856 percent of nighttime drivers
When oral fluid drug category findings were combined with BAC results we found that in both the daytime and nighttime samples the drug-positive drivers who were also alcohol-positive were more likely to be positive for ldquoIllegalrdquo drugs than ldquoMedicationsrdquo (Table 4) This was particularly true in the nighttime sample in which 173 percent of drivers in the illegal category had BACs between zero and 08 grams per deciliter (gdL) (compared to 63 in the ldquoMedicationsrdquo category) and 57 percent had BACs greater than 08 (compared to 12 in the ldquoMedicationsrdquo category) (p lt 01) In the daytime sample however the differences were statistically non-significant (p value = 05)
4
2007 National Roadside Survey of Alcohol and Drug Use by Drivers Drug Results
Table 4 BAC Among Drug-Positive Drivers by Drug Category and Time of Day (Oral Fluid)
Time of Day Drug Category
N (Unweighted)
BAC (gdL)
Zero Between
Zero and 08 08+
Daytime Illegal Medications Illegal amp Medications Negative
125 107 14
1604
971 996 983 992
23 04 17 06
06 00 00 02
Nighttime Illegal Medications Illegal amp Medications Negative
575 199 60
5033
770 925 814 902
173 63
177 81
57 12 09 17
ldquoMedicationsrdquo includes prescription and over-the-counter drugs In this table percentages are weighted
In addition to the three drug categories we also examined drug class (Table 5) The drug classes were antidepressants marijuana narcotic-analgesics sedatives stimulants and other plus a ldquomore than one drugrdquo class To avoid double counting individual positive results the classes were mutually exclusive Thus for example since marijuana is both a class by itself and could appear in the ldquoMore than 1 classrdquo cell as well (as could other classes of drugs) from this table one cannot arrive at an overall prevalence estimate for marijuana alone However detailed summaries of prevalence estimates for individual drugs appear in Tables 137-140 later in the report In comparing prevalence of drug classes by time and region4 we found that marijuana was generally the most common drug class across all the regions both in daytime (39) and nighttime (61) samples Among the nighttime sample drivers in the Midwest and Northeast regions were more likely to test positive for marijuana than daytime drivers (p lt 05) In the South and West regions however there was little difference between daytime and nighttime drivers with respect to marijuana For stimulants a higher percentage of nighttime drivers in all regions tested positive than did daytime drivers However the difference was statistically significant only in the Midwest (p lt 01) and West (p lt 05)
When one examines the ldquoAllrdquo column of Table 5 one finds that overall sedatives were found in 16 percent of daytime drivers and in 06 percent of nighttime drivers Stimulants were found in 16 percent of daytime drivers and in 32 percent of nighttime drivers
4 Regions are defined by the NASSGES system according to US Census Regions (Midwest includes the West North Central and East North Central States Northeast includes New England and Middle Atlantic States South includes the West South Central East South Central and South Atlantic States and West includes West and Mountain States
5
2007 National Roadside Survey of Alcohol and Drug Use by Drivers Drug Results
Table 5 Drug Classes by Time of Day and Region (Oral Fluid)
Time of Midwest Northeast South West All Day Drug Class
Daytime
Antidepressants
Marijuana
Narcotic-Analgesics
Sedatives
Stimulants
Other
More than 1 Class
N=546
04
34
27
19
08
00
22
N=379
06
30
21
26
17
13
10
N=472
05
55
13
21
22
00
14
N=453
05
40
06
07
20
00
12
N=1850
05
39
16
16
16
02
15
Overall Drug Positive Daytime 115 125 131 89 110
Negative 885 875 869 911 890
Nighttime
Antidepressants
Marijuana
Narcotic-Analgesics
Sedatives
Stimulants
Other
More than 1 Class
N=1694
05
77
10
11
30
02
16
N=1111
02
76
28
02
23
00
41
N=1559
00
63
12
07
27
01
29
N=1505
01
41
18
04
40
05
20
N=5869
02
61
16
06
32
03
23
Overall Drug Positive Nighttime 150 173 140 129 144
Negative 850 827 860 871 856
In this table percentages are weighted ldquoMore than 1 Classrdquo ndash Drivers testing positive for more than one drug class are counted only in this category
Further as indicated in Table 6 comparison of number of drug classes by time of day indicated that nighttime drivers (23) were significantly more likely to test positive for more than one drug class than daytime drivers (15) (p lt 01)
Table 6 Number and Distribution of Drug Classes by Time of Day (Oral Fluid)
Number of N Time of Day Drug Classes (Unweighted) (Weighted)
1 206 95 2+ 40 15Daytime
Negative 1604 890 1850 1000
1 680 121 2+ 156 23
Overall Daytime
Nighttime Negative 5033 856
5869 1000Overall Nighttime
6
2007 National Roadside Survey of Alcohol and Drug Use by Drivers Drug Results
As mentioned earlier 3276 blood samples were obtained from nighttime drivers As expected the results of the blood analyses were quite close to those obtained by the nighttime driver oral fluid analyses For example (Table 7) among nighttime drivers 91 percent tested positive for ldquoIllegalrdquo drugs 4 percent for ldquoMedicationsrdquo and 07 percent for the combination of both ldquoIllegal and Medicationsrdquo
Table 7 Drug Categories Distribution (Blood)
N Drug Category (Unweighted) (Weighted)
Illegal 267 91 Medications 169 40 Illegal amp Medications 30 07 Negative 2810 862 Overall 3276 1000
ldquoMedicationsrdquo includes prescription and over-the-counter drugs
Additionally as indicated in Table 8 283 percent of nighttime drivers testing positive for ldquoIllegalrdquo drugs in blood also tested positive for alcohol as did 64 percent of drivers who tested positive for ldquoMedicationsrdquo and 232 percent of those testing positive for both ldquoIllegal drugs and Medicationsrdquo
Table 8 BAC Among Drug-Positive Drivers by Drug Category (Percentage by Row) (Blood)
Drug Category N
(Unweighted)
BAC (gdL)
Zero Between
Zero and 08 08+ Illegal 267 717 204 79 Medications 169 936 49 15 Illegal amp Medications 30 768 232 00
ldquoMedicationsrdquo includes prescription and over-the-counter drugs In this table percentages are weighted
As indicated in Table 6 some individuals tested positive for more than one drug Thus we also present the drug analysis results by individual drug where drug is the unit of analysis (Tables 137-140) Those results indicate that the most prevalent drug other than alcohol was marijuana The overall marijuana prevalence rate in oral fluid was 45 percent daytime and 77 percent nighttime
When we examined the analysis results of the combination of oral fluid andor blood in the nighttime driver population we found that the marijuana prevalence rate was 87 percent The next most frequently encountered individual drug was cocaine with a daytime oral fluid prevalence rate of 15 percent and a nighttime rate of 39 percent
7
2007 National Roadside Survey of Alcohol and Drug Use by Drivers Drug Results
Summary Overall analyses of the oral fluid samples obtained indicated a drug use prevalence rate of 11 percent for daytime drivers and 144 percent for nighttime drivers This difference between day and night is statistically significant (p lt 01) Among nighttime drivers providing blood samples 138 percent overall tested positive for at least one of the drugs in our panel This includes all drugs for which we tested whether illegal prescription or over-the-counter Additionally of the 98 percent of drivers testing positive for ldquoIllegalrdquo drugs in blood 28 percent also tested positive for alcohol as did 64 percent who tested positive for ldquoMedicationsrdquo and 232 percent for those testing for both ldquoIllegal drugs and Medicationsrdquo The most frequently encountered individual drug other than alcohol was marijuana
Again it is important to emphasize that the results presented in this report are estimates of the prevalence of drug use among drivers Further research is needed to determine the effect of drug prevalence on crash risk This report provides detailed displays of the data discussed above
8
2007 National Roadside Survey of Alcohol and Drug Use by Drivers Drug Results
Introduction This report presents prevalence estimates for drug-involved driving obtained from the 2007 National Roadside Survey of alcohol- and drug-involved driving Though national roadside surveys of alcohol-involved driving have been conducted on a decennial basis since the midshy1970s this is the first US national roadside survey where biological measures of drugs other than alcohol were obtained
Background Forty years ago when the Department of Transportation (DOT) was established it was well understood that alcohol was an important factor in traffic crashes In 1968 a new agency that was to become the National Highway Traffic Safety Administration (NHTSA) delivered its Report to the Congress on Alcohol and Highway Safety pointing to the need for improved data on drinking and driving (USDOT 1968) This need led to the establishment of incentives for States to conduct blood alcohol concentration (BAC) tests on all fatally injured drivers and pedestrians and eventually to the establishment of the Fatality Analysis Reporting System5
(FARS) in 1975 Initially this data file was limited by the low level of testing for alcohol by the States but since 1982 through the use of an imputation system and increased testing by states it has provided a reliable means of assessing the Nationrsquos progress in reducing crashes in which drivers have been drinking It is important to note however that FARS provides very limited information related to drugs While States routinely test drivers involved in fatal vehicle crashes for alcohol only a few also routinely test for other drugs According to the Centers for Disease Control and Prevention less than half of the fatalities in the 2005 FARS had drug test results available (CDC 2006) In our review of the FARS data we identified a lack of information related to drug use
In addition to FARS the national roadside survey (NRS) series estimates the prevalence of drinking and driving on weekends in the 48 contiguous States and assesses changes in prevalence over time The first NRS was conducted in 1973 (Wolfe 1974) the second in 1986 (Lund amp Wolfe 1991) and the third in 1996 (Voas Wells Lestina Williams amp Greene 1998) Each of these surveys included a brief verbal survey and a breath sample to determine BAC Together the first three national surveys and FARS (1995) document reductions in the number of drinking drivers on US roadways and alcohol-related fatalities over three decades The fourth NRS conducted in 2007 followed the general methodology of the three prior surveys in obtaining BACs to enable comparison with the earlier surveys but also incorporated several new features These included questionnaires on drug and alcohol use disorders and biological sampling of oral fluid and blood to determine the extent of the presence of drugs other than alcohol (ie illegal prescription and over-the-counter) among drivers
In 2005 NHTSA conducted a pilot study as a precursor to this full decennial 2007 NRS (Lacey et al 2007) The primary objective of the pilot study was to determine whether it was feasible to collect data for drugs other than alcohol through oral fluid and blood samples The pilot study consisted of six rounds of nighttime data collection with over 800 drivers participating in the survey Approximately 78 percent of the drivers participating in the survey agreed to provide an
5 FARS was originally called the Fatal Accident Reporting System
9
2007 National Roadside Survey of Alcohol and Drug Use by Drivers Drug Results
oral fluid sample and almost 50 percent of the drivers participating in the survey provided blood samples The pilot study showed that it was clearly feasible to conduct a survey that included drugs other than alcohol Such data are essential to developing more precise estimates of the presence of alcohol and other drugs in drivers and for estimating the prevalence of alcohol- and drug-involved driving
Prevalence of Drug-Involved Driving In their review of the research literature Kelly Darke and Ross (2004) cite the 2001 National Household Survey to report that 4 percent of US residents reported driving while under the influence of drugs in the preceding 12 months These data based on self-report did not distinguish between legal and illegal drugs Using data collected in Tennessee in December 1986 Lund Preusser Blomberg and Williams (1988) studied a sample of truck drivers to report prevalence of marijuana (15) cocaine (2) prescription stimulants (5) and nonprescription stimulants (12) among the drivers According to a literature review by Jones Shinar and Walsh (2003) the Lund et al study (1988) was at that time the only US study that had performed chemical tests of drivers stopped at a roadside location
With respect to prescription drugs Jones et al (2003) reported that benzodiazepines (tranquilizers) were found in four percent of non-crash-involved drivers De Gier (2006) reviewed the literature and reported that benzodiazepines were more commonly found in middle-aged to older drivers ldquopresumably due to the high rates of benzodiazepine prescriptions among these age groupsrdquo Neutel (1998) estimated a lower crash risk for older persons (OR = 28) after benzodiazepine use than younger persons (OR = 32)
Impact of Drugs on Driving Skills Laboratory Studies A number of laboratory studies have been conducted on the impact of both legal and illegal drugs on driving-related skills Still results from these experimental studies are not straightforward and are sometimes contradictory One confounding factor is that different drugs have different effects on driving-related skills with the thresholds at which those different effects occur varying as a function of the measure used (Shinar 2006) Additionally Shinar found that because of the large individual variation in human response to drug consumption attempts to define a ldquonormrdquo for the behavioral response to drugs is difficult
Some studies have found that drugs that stimulate the central nervous system (eg amphetamines cocaine caffeine) sometimes may improve laboratory driving performance (Ward Kelly Foltin amp Fischman 1997 Burns 1993 Higgins et al 1990 Hurst 1976) However in the Jones et al (2003) literature review it is reported that amphetamines are not usually associated with easily observable behavioral impairments
There is considerable evidence from laboratory studies that cannabis (marijuana) impairs reaction time attention tracking hand-eye coordination and concentration although not all of these impairments were equally detected by all studies (Couper amp Logan 2004a Heishman Stitzer amp Yingling 1989 Gieringer 1988 Moskowitz 1985) In reviewing the literature on marijuana Smiley (1998) concluded that marijuana impairs performance in divided attention tasks (ie a poorer performance on subsidiary tasks) Jones et al (2003) adds that Smileyrsquos finding is relevant to the multitasking essence of driving in particular by making marijuanashy
10
2007 National Roadside Survey of Alcohol and Drug Use by Drivers Drug Results
impaired drivers perhaps less able to handle unexpected events Interestingly there is also evidence showing that unlike alcohol marijuana enhances rather than mitigates the individualrsquos perception of impairment (Lamers amp Ramaekers 1999 Robbe amp OHanlon 1993 Perez-Reyes Hicks Bumberry Jeffcoat amp Cook 1988) Robbe and OHanlon (1993) reported that in laboratory conditions drivers under the influence of marijuana were aware of their impairment which led them to decrease speed avoid passing other vehicles and reduce other risk-taking behaviors Such was not the case with alcohol for the authors reported that alcohol-impaired drivers were generally not aware of impairment and therefore did not adjust their driving accordingly
There is laboratory evidence that benzodiazepines impair some driving skills (Drummer 2002) However there are some contradictory results Mathijssen et al (2002) reported on a case-control study conducted in the Netherlands that found there is an increased risk for benzodiazepine and alcohol use together but no increased risk for benzodiazepine use alone Additionally there is evidence that the impairing effects of benzodiazepine might be circumscribed to the first days of benzodiazepine use before tolerance develops (Lucki Rickels amp Geller 1985) leading some to conclude that the extent to which benzodiazepines increase crash risk has to be balanced against the health benefits for those taking these drugs for medicinal purposes (Beirness Simpson amp Williams 2006)
Laboratory reports are not necessarily the best indicators of the impact of drugs on driving skills As Beirness et al (2006 pages 16-17) stated ldquoan impairment or skill enhancement identified in a laboratory test may not show up on the road because the drugs may lead to other changes in driver behavior Additionally laboratory tests can address the effects of drugs only on skills not judgment and the latter may be as important when it comes to driving Thus even if drugs are found to affect driving skills in laboratory tests actual crash risk may or may not be affectedrdquo
Field Data Data from drivers apprehended for impaired driving have been used to estimate the prevalence of drug use Jones et al (2003) reviewed the literature on drug involvement among arrested drivers and reported a variety of drug prevalence levels based on the location and the population under study White et al (1981) reported the following prevalence of drugs among drivers arrested for impaired driving in California in the 1970s with BACs lower than 10 gdL sedativehypnotic (30 to 47) phencyclidine or PCP (79) and morphine (62) In contrast Polkis Maginn and Barr (1987) reported the following prevalence rates among drivers arrested in St Louis Missouri in the 1980s phencyclidine or PCP (47) marijuana (47) benzodiazepines (22) barbiturates (15) opiates (11) and cocaine (9) Walsh et al (2000) reported that marijuana and cocaine were the primary drugs detected (19 and 16 respectively) among arrested drivers in Tampa Florida with narcotics and amphetamines found in less than 1 percent of the drivers Thus as studies of drug-use patterns in the United States have shown the types of substances consumed vary across locations and time making it difficult to characterize the drug involvement of drivers
As part of the Drug Evaluation and Classification (DEC) Program trained drug recognition experts are used to determine drug usage by looking for relevant signs and symptoms Preusser Ulmer and Preusser (1992) evaluated DEC programs in Arizona California Colorado New York and Texas from 1986 to 1991 reported that about 1 to 3 percent of the drivers arrested for driving while intoxicated (DWI) were classified as drug-impaired by Drug Recognition Experts
11
2007 National Roadside Survey of Alcohol and Drug Use by Drivers Drug Results
trained in the DEC Program The most prevalent substances found were marijuana (42) stimulants (36) depressants (16) narcotic analgesics (13) and PCP (5) As Jones et al (2003) pointed out these estimates apply only to the restricted group of driving-under-theshyinfluence-of-drugs (DUID) suspects that were evaluated by officers who participated in the DEC program rather than to all drivers arrested for DWI or all drivers on the road
Other studies have been conducted using crash data to estimate the prevalence of drugs among injured drivers and their role in crashes Terhune et al (1992) used a responsibility-analysis approach6 in studying fatally injured drivers and reported no increase in crash risk due to marijuana or cocaine use alone although multiple drug use could be associated with increased responsibility They also reported that ldquodrivers with alcohol in their systems had the highest crash responsibility ratesrdquo and ldquoan alcohol-drug combined impairment effect was suggested by the responsibility analysisrdquo (pg ix) Leveille et al (1994) used a small matched-case control study design to study crash risk among drivers aged 65 or older in Seattle Washington The authors did not find an association between crash risk and benzodiazepine or sedating antihistamines among this group although they acknowledged that the sample size (234 drivers) might have been too small for significance Ray Fought and Decker (1992) also studied crash risk for drivers aged 65 years or older using data from the Tennessee Medicaid program With this larger sample (16262 drivers) they found an association between presence of benzodiazepines or tricyclic antidepressants and crash risk However they did not find a correlation for people taking oral opioid analgesics Other studies of drug over-involvement in crashes report contradictory results (eg Hemmelgarn Suissa Huang Boivin amp Pinard 1997) These results should be considered cautiously due to data limitations such as small sample size
In summary Jones et al (2003 pp 85-86) stated ldquoThe role of drugs as a causal factor in traffic crashes involving drug-positive drivers is still not understood Drug risk factors are still not known with acceptable precision with some evidence suggesting little or no increase in crash risk at drug levels being detected by current chemical test procedures Further current research does not enable one to predict whether a driver testing positive for a drug even at some measured level of concentration was actually impaired by that drug at the time of crash This is in sharp contrast to alcohol where BAC measurements can provide a good estimate of impairmentrdquo
Jones et al (2003 p 86) also stated ldquoAnother complicating factor is the role of drugs taken in combination with alcohol For many drugs a drug in combination with alcohol accounts for a significant percentage of the occurrences of that drug in crash victims Waller et al (1995) found that roughly one-half of the occurrences of drivers positive for marijuana cocaine and or opiates had elevated BACs and that the crashes of drivers testing positive for drugs alone were very similar to the crashes of drivers testing negative for both alcohol and drugs This adds further doubts about the role of drugs in the impairment of crash-involved drivers and suggests that it may be much smaller than had been suspectedrdquo
6 Responsibility-analysis was used to suggest which drugs contributed to the occurrence of the crashes This method involves examining crash reports which have no indication of driver drug use and rating each driverrsquos crash responsibility If proportionately more drug-present drivers are judged responsible than are those free of drugs this is considered evidence of drug impairment effects
12
2007 National Roadside Survey of Alcohol and Drug Use by Drivers Drug Results
Challenges in Measurement and Todayrsquos Drug Testing Opportunities According to the review of the drug impaired literature conducted by Jones et al (2003) blood is usually the ldquogold standardrdquo for linking drug concentration to behavioral impairment However the collection of other types of biological fluids (eg sweat oral fluid urine) is less invasive and easier to collect in both field studies and law enforcement operations and thus oral fluid has emerged as a valid alternative to blood collection for field use Oral fluids normally contain the parent drug substance rather than drug metabolites that are present in urine Additionally Jones et al (2003) concluded that collection of oral fluid is generally considered less invasive than either blood or urine and ldquocould be an excellent matrix to tie recent drug use with behavioral impairmentrdquo
In some applications oral fluid samples are collected and then subjected to a screening analysis in the field or at the police station to develop a basis for more definitive collection of and laboratory analysis of urine or blood In the application used for this study the oral fluid sample was collected and then sent to a laboratory for a more refined enzyme-linked immunosorbent assay (ELISA) screening followed by a confirmatory analysis by Liquid Chromatography-Tandem Mass Spectrometry (LCMS-MS) or Gas ChromatographyMass Spectrometry (GCMS)
In a recent study conducted by Cone et al (2002) oral fluid testing of 77218 subjects in private industry showed a 5 percent positive rate for any of the five Substance Abuse and Mental Health Services Administration drug categories (marijuana cocaine opiates phencyclidine and amphetamines) The pattern and frequency of drug positives was remarkably similar to urine drug prevalence rates in the general workplace from other surveys (Cone et al 2002) Further in a study of 180 drivers given blood urine and oral fluid tests which were analyzed using quantitative Gas ChromatographyMass Spectrometry (GCMS) the positive predictive value of oral fluids was 98 percent for amphetamines 92 percent for cocaine and 90 percent for cannabinoids (Samyn et al 2002)
However in an analysis of blood urine saliva and sweat from 198 injured drivers admitted to a hospital saliva detected only 14 positives for cannabinoids while 22 positives were detected in the urine (Klintz et al 2000) According to the study authors the amount of matrix (body fluid) collected in saliva appears to be smaller when compared to urine and the levels of drugs are typically higher in urine than in saliva In a study of saliva and sweat Samyn and van Haeren (2000) concluded that saliva should be considered a useful analytical matrix for the detection of recent drug use when analyzed using GCMS This finding indicates oral fluid testing would be desirable in the roadside testing of drivers
Yacoubian et al (2001) tested 114 adult arrestees using saliva and urine and concluded that saliva testing may have certain advantages over urine testing for drugs including (1) ease of sample collection (2) subject preference for giving saliva over urine (3) less vulnerability of adulteration in saliva (4) little concern for subjects producing an adequate sample with saliva and (5) saliva storage is easier than urine The authors found a sensitivity of 100 percent and a specificity7 of 99 percent for cocaine in saliva and a sensitivity of 88 percent and specificity of
7 Sensitivity Sensitivity is the ability of a test to measure what it purports to measure or in this case the ability of the oral fluid tests to correctly identify active drug users It is operationalized as a proportion represented by the true
13
2007 National Roadside Survey of Alcohol and Drug Use by Drivers Drug Results
100 percent for heroin However saliva results only had a sensitivity of five percent for marijuana likely reflecting only detection of very recent smoking as marijuana does not migrate from the blood supply to the oral fluid Thus some positives may indicate residual marijuana remaining in the mouth after ingestion This may well be a positive factor for this study in that when marijuana is detected in saliva it is more likely to be in its active phase in the body rather than simply evidence the marijuana has been consumed during a ldquolook-backrdquo period that could be as long as two weeks and may no longer have a potential impairing effect
Hold et al (1999) conducted a review of the literature concerning using oral fluid for drug testing the review included 135 references and provided guidelines for techniques for collecting and measuring drugs in saliva In an earlier review of drug use evidence found in oral fluid Schramm et al (1992) concluded that initial studies with cocaine and phencyclidine or PCP suggested a correlation between oral fluid and blood concentration but that tetrahydrocannabinol (THC) does not appear to be transferred from blood to saliva Recent marijuana smoking however can be detected in saliva from the buccal cavity8
With regard to oral fluid and BAC Bates et al (1993) found a high correlation between saliva strips and breath tester results for alcohol (r = 89-90) Blood sample analyses however still remain the ldquogold standardrdquo measurement of drugs in the human body because evidence supporting accuracy is best established for that approach
Project Objectives New to the 2007 National Roadside Survey was the collection of biological samples that could be used to determine the extent of the presence of drugs other than alcohol in the nighttime driving population These additional data are essential to estimating the national progress in reducing the prevalence of alcohol- and drug-involved driving
The objective of this report is to present the first US national prevalence estimates of drug-involved driving The first report stemming from this study described the methods used in the sampling data collection and biological specimen analysis portions of the 2007 NRS (Lacey et al 2009a) The second report describes the studyrsquos analytic approach and summarizes the alcohol data we place the set of descriptive estimates of alcohol use within the context of societal trends by comparing these measures with similar ones from the prior surveys over the
positives (ie those who are drug positive and actually test positive) divided by all persons who are drug positive (ie those who are positive and test positive [ie true positives] plus those who are positive and test negative [false negatives]) The formula for sensitivity is Sn = TP (TP + FN) where TP and FN are the number of true positive and false negative results respectively Sensitivity can also be thought of as 1 minus the false negative rate Notice that the denominator for sensitivity is the number of drug positive persons Specificity Specificity is the ability of a test to correctly identify non-cases of disease or in this case the ability of
the oral fluid tests to correctly identify non-drug users It is operationalized as a proportion represented by the true negatives (ie those who are drug negative and test negative) divided by all persons who are drug negative (ie those who are negative and test negative [true negatives] plus those who are negative but falsely test positive [false positives]) The formula for specificity is Sp = TN (TN + FP) where TN and FP are the number of true negative and false positive results respectively Specificity can be thought of as 1 minus the false-positive rate Notice that the denominator for specificity is the number of nondrug users
8 The buccal cavity includes that part of the mouth bounded anteriorly and laterally by the lips and the cheeks posteriorly and medially by the teeth andor gums and above and below by the reflections of the mucosa from the lips and cheeks to the gums
14
2007 National Roadside Survey of Alcohol and Drug Use by Drivers Drug Results
last four decades These trend analyses enable detection of changes in our populations rates and degree of alcohol-involved driving over time (Lacey et al 2009b) The current report provides insight into the use of drugs other than alcohol (illegal prescription and over the counter) in the driving population and will provide a baseline for future studies to assess trends and changes
The report will first present a summary of the methods and procedures used in survey sampling and biological sampling This is followed by a description of the drugs selected for analysis and then a description of the actual drug-collection instruments and how they were administered
The results of our analyses are divided into three sections The first presents the analyses of the oral fluid results with BAC measurement obtained through breath tests These data include both daytime and nighttime drivers The second section will report the results of the blood analysis again with the BAC measurements from breath tests In both of these sections we also contrast the results obtained from the biological specimens with driversrsquo self-report drug use Additionally we present drug prevalence estimates for nighttime weekend drivers based on the combination of results of analyses of both oral fluid and blood combined Finally we discuss the implications of these analyses in terms of estimating the prevalence of drug use among Friday daytime drivers and weekend nighttime drivers Additional tables with further blood results are included in Appendix A These analyses include results of self-reported drug use by drug type safety observation measures (seatbelt helmet use etc) as well as the results on items relating to interaction with the criminal justice and treatment systems The presence of drugs in these drivers does not necessarily imply that they are impaired and at greater risk of crash involvement Indication of impairment and increased risk will be addressed in an upcoming study of the potential contribution of drugs to crash risk
15
2007 National Roadside Survey of Alcohol and Drug Use by Drivers Drug Results
16
2007 National Roadside Survey of Alcohol and Drug Use by Drivers Drug Results
Methods This section of the report briefly summarizes the methodology used in conducting the 2007 NRS with special emphasis on sampling procedures A separate Methodology Report (Lacey et al 2009a) provides detailed descriptions of the multiple components of the data collection process
Survey Sampling Procedures This section presents an abridged description of the sampling approach we followed in conducting the 2007 NRS Because it is infeasible to conduct surveys on all the roads in the United States we constructed a sampling system for the 2007 NRS that represented the whole Nation but required interviewing only a practical portion of the almost 203 million drivers on US roads (FHWA 2006) As in the three prior surveys the area covered in this study was limited to the 48 contiguous States
For practicality we limited locations to roadways where surveys could be performed safely and with sufficient traffic to recruit the number of participants required for valid estimates of the national prevalence of drinking and drug involved-drivers as did prior NRS studies
The past three national surveys provided information on private four-wheel vehicle operators at representative then randomly selected locations during weekend nighttime periods when drinking and driving is most prevalent The 2007 NRS covered the same time periods and added two Friday daytime periods As in the three earlier surveys the 2007 NRS excluded commercial vehicles but unlike previous practice included motorcycles
The 2007 NRS followed the practice of the 1973 1986 and 1996 national surveys by using a multistage sampling system that represented the drivers at risk for crash involvement in the 48 contiguous States In this process the initial sample structure was taken from NHTSArsquos National Automotive Sampling SystemGeneral Estimates System (NASSGES) (NHTSA 1995) which was constructed to provide a basis for making nationally representative estimates of highway crashes The four steps included
1 Selecting the primary sampling units (PSUs) which are cities large counties or groups of counties from within four regions of the United States and three levels of population density
2 Randomly selecting 30 specific square-mile-grid areas within each PSU and randomly numbering them to form an order of priority from among the total of all the square mile sectors comprising the PSU area Then we attempted to recruit the cooperation of local law enforcement agencies that had jurisdiction over the selected grids One law enforcement agency often would cover several of the selected square mile areas
3 Identifying appropriate survey sites within the square-mile-grid areas Appropriate sites had a safe area large enough to accommodate the survey operation and had sufficient traffic flow to generate an adequate number of subjects In some cases more than one such location was available within a square mile grid In this case the survey manager exercised herhis judgment to select the optimal location for safe data collection This resulted in selection of five data collection or survey sites within each PSU
17
2007 National Roadside Survey of Alcohol and Drug Use by Drivers Drug Results
4 Selecting at random drivers to be interviewed from the traffic passing by the survey site The total number of eligible vehicles was counted to determine the proportion of the traffic passing by each survey site that was sampled
These sampling procedures were followed to ensure that the probability of selecting a PSU a survey location within the PSU and a driver at a survey location was known at each of the sample design stages Knowing these probabilities permitted the computation of the probability that a given driver would be interviewed in the survey This was done by multiplying the sampling probabilities at each of the four steps to obtain the final overall probability of being sampled The weight given to each case in the final totals (sampling weight) was computed as the inverse of the sampling probability This statistical procedure accounts for differences among PSUs in the size of the driver population In other words although we sampled approximately the same number of drivers at each PSU the actual number of individuals driving at each sampling site was not uniform To make the sample of drivers at each site representative of the actual number of drivers we applied the above-described weights As a result drivers interviewed at sites with a relatively heavy traffic flow (ie a relatively large pool of actual drivers) carry a larger weight than drivers sampled from sites with less traffic loads This ensured that the basic requirement of sampling theorymdashthat every driver has an equal chance of being interviewedmdashwas met by adjusting for the biases inherent in the selection of locations within the sampling frame
The major barrier to carrying out this staged sampling system was obtaining law enforcement support for the survey In some localities city attorneys or law enforcement leadership with concerns such as potential liability and scare resources declined to participate In these cases substitution PSUs were obtained Although this process was time-consuming similar difficulties had also been experienced in all three previous NRS studies Replacement PSUs were chosen from within the same GES geographic region9 and the same GES PSU type (city large suburban area all others) as the unavailable PSU For more information on PSU replacement see Lacey et al (2009a) The 60 PSUs used in the 2007 NRS are shown in Figure 1
9 GES defines four geographic strata
18
2007 National Roadside Survey of Alcohol and Drug Use by Drivers Drug Results
Figure 1 Map of Sixty 2007 National Roadside Survey Sites
As mentioned the roadside survey procedures used in the 2007 NRS followed as closely as possible those used in the previous three surveys (see Lacey et al 2009a Lestina et al 1999) However the 2007 NRS departed from the earlier surveys in several important ways The earlier surveys included only a brief questionnaire and a breath test that generally required less than 5 minutes of a participantrsquos time The 2007 NRS included a more extensive set of questions (base survey a drug questionnaire questions about interaction with the criminal justice and treatment systems an alcohol-use disorder and a drug-use disorder survey) The 2007 survey protocol also attempted to collect two biological samples (oral fluid and blood) from participants as well as a breath test Data collection for the earlier surveys was conducted by three teams of three interviewers the 2007 NRS consisted of 6 teams of 10 to 12 members The earlier surveys were conducted at 24 PSUs whereas the 2007 survey was conducted at 60 PSUs This increase in the number of PSUs allowed us to maximize the use of all possible PSUs defined by the NASSGES and increase the representativeness of the sample The earlier surveys had four 2-hour data collection periods on weekend nights the 2007 survey added a 2-hour data collection period during the daytime on Fridays for a total of five 2-hour survey periods during the weekend Finally the number of participants in the 2007 survey was about three times as many as in the 1973 study
PIRE employed and trained six specialized teams of interviewers from both the east and west coasts of the United States All staff was trained during the summer of 2007 Surveys began the weekend of July 20 and 21 2007 and concluded 20 weeks later on December 1 2007 As in the three previous NRS studies nighttime surveys were conducted between 10 pm and midnight and between 1 am and 3 am on both Friday and Saturday For the 2007 survey a 2-hour Friday daytime data collection period was added either between 930 am and 1130 am or between 130 pm and 330 pm The daytime data collection period was randomly selected for each PSU The daytime periods were added to determine the extent of alcohol- and drugshy
19
2007 National Roadside Survey of Alcohol and Drug Use by Drivers Drug Results
involved driving during the day and whether the number of drivers using drugs and the types of drugs used differed between day and night Each component used in the roadside survey is thoroughly described in the Methodology Report (Lacey et al 2009a)
Preparation for the 2007 NRS Survey The size and complexity of the 2007 NRS required extensive preparation that NHTSA began years before the actual survey was initiated including a pilot test of survey procedures (Lacey Kelley-Baker Furr-Holden Voas Brainard amp Moore 2007) The preparation activitiesmdash selection and testing of equipment for collecting biological samples recording and organizing the self-report and observational data at the roadside recruiting and training of survey staff pretesting of survey procedures developing procedures for protection of survey respondents and the publicmdashare fully described in the Methodology Report (Lacey et al 2009a) Only a brief overview of this work is described here
Survey equipment Interviewers recorded the responses to the traditional NRS interview on a handheld portable digital assistant (PDA) Through a special program developed for the 2007 NRS the PDA provided a means of prompting the interviewer through each step of the data collection process
As part of the program to protect survey participants and the public it was important to know the extent of the driversrsquo drinking To this end a passive alcohol sensor (PAS) attached to the PDA with Velcrotrade was used to collect mixed expired air from approximately 6 inches in front of the driverrsquos face (we used the PAS Vrtrade manufactured by PAS International Inc of Fredericksburg Virginia) This small handheld unit was used because it was less obvious and intimidating than the larger flashlight-based passive sensors We researched three available styles of PAS models (1) the handheld unit that was used in the pilot study (2) the flashlight PAS and (3) a clipboard device with an alcohol sensor built into one corner We tested the devices for accuracy ease of use and reliability and found that the PAS Vrtrade was best suited to the needs of this study The PAS unit can detect alcohol in emitted breath around the face (Kiger Lestina amp Lund 1993) The PAS was held within 6 inches of the participantrsquos face and when the subject spoke the interviewer activated the small electrical pump which pulled in the exhaled breath from the participant and produced an estimate of the participantrsquos breath alcohol level
Data collection To compare results from the 2007 survey to prior surveys a strong effort was made to follow the same data collection protocol employed in the three prior NRS studies despite the addition of a large number of questions and new biological specimen collections following the traditional questionnaire and breath test As described in the Methodology Report (Lacey et al 2009a) we placed the traditional NRS interview and breath-test collection before the new NRS questions and the specimen collections We believed that by structuring data collection in this way the additions to the basic survey would not affect our ability to compare the responses to the basic survey with responses from the three earlier surveys Nevertheless the 2007 NRS experienced a somewhat larger refusal rate than the 1996 NRS (see Table 9)
To determine whether the 2007 survey procedure accounted for producing the lower response rate we conducted a replica of the 1996 NRS procedure in one of our 2007 sites (Knox County Tennessee) The simpler protocol followed that used in the 1996 and earlier surveys collecting the traditional interview and a breath sample only About 16 percent of all drivers signaled to stop by the officer during this ldquoreplica surveyrdquo failed to stop andor enter the site This is similar
20
2007 National Roadside Survey of Alcohol and Drug Use by Drivers Drug Results
to the 15 percent that failed to stop (when the police signaled) in the 2007 NRS study Among those who entered the research bay and were eligible for the survey the proportion of refusals in the replica survey was similar to the full 2007 NRS (163 and 175 respectively) Thus it appears that the lower response rate in the 2007 NRS reflects a change in the driving publicrsquos willingness to be interviewed rather than an effect of the more elaborate survey procedures implemented in 2007
Table 9 Comparison of Number of Nighttime Participants by Year in the National Roadside Surveys
1973 1986 1996 2007 Signaled to enter site Not reported 3260 6480 9553 Did not enter site Not reported 217 182 1016 Entered site 3698 3043 6298 8537 Eligible for survey Not reported Not reported Not reported 8384dagger
Entered site and interviewed
Valid breath sampledaggerdaggerdagger 3353 (907) 3192 (863)
2971 (976) 2850 (937)
6045 (960) 6028 (957)
6920 (825)daggerdagger
7159 (854)daggerdagger
dagger Commercial vehicles not eligible daggerdagger Because previous surveys did not inform about the eligibility of the drivers percentages for the years 1973 1986 and 1996 are based on drivers who stopped and entered the site Percentages for 2007 are based on drivers who not only were stopped and entered site but also were eligible for the survey (ie noncommercial drivers drivers aged 16 and older and not constrained by language barriers) Percentages are based on nighttime drivers daggerdaggerdagger Some drivers provided breath samples but declined to be interviewed In this table percentages are unweighted
The basic procedure in the 2007 NRS as well as in the prior three surveys was for the law enforcement officer working with the survey team to direct the potential respondent into the survey site without speaking to the driver Once in the site the driver was directed into a research bay and was approached by an interviewer and recruited to participate in the interview Prospective participants were informed that they had done nothing wrong and that the interview concerned traffic safety and was anonymous A PAS reading was also taken at this point If the individual agreed to participate the interviewer asked the 22 questions on the traditional NRS protocol and requested a breath sample Only after the completion of the standard NRS procedure did the additional data collection for the 2007 NRS begin A detailed description of the survey procedures is provided in the Methodology Report (Lacey et al 2009a)
As indicated in Table 10 which presents response patterns for both the daytime and nighttime data collection periods over 13000 vehicles were selected to participate in the 2007 NRS of these 10909 entered the data collection site and the drivers were determined to be eligible for survey participation (for example commercial vehicles such as pizza delivery vehicles drivers under the age of 16 and drivers who could not communicate with us either in English or Spanish were not eligible to participate) Eighty-three percent of eligible drivers participated in the survey and because some of those that refused the survey did agree to provide a breath sample BACs from the PBTs were available on 86 percent of the eligible drivers Among eligible drivers 71 percent provided an oral fluid sample 72 percent completed a drug questionnaire
21
2007 National Roadside Survey of Alcohol and Drug Use by Drivers Drug Results
andor the AUD questionnaire and 39 percent of eligible nighttime drivers provided a blood sample10
Table 10 Participating Drivers (Percentages in Parentheses)
2007 Daytime Nighttime Total
Signaled to enter site 3516 9553 13069 Did not enter site 933 1016 1949 Entered site 2583 8537 11120 Eligible 2525 8384 10909 Entered site and interviewed Valid breath sample Oral Fluid sample Blood sample AUD ampor Drug Questionnaire
2174 (861)dagger
2254 (893)dagger
1850(733)dagger
NA
1889 (752)dagger
6920 (825)dagger
7159 (854)dagger
5869 (700)dagger
3276 (391)dagger
5983 (714)dagger
9094 (834)dagger
9413 (863)dagger
7719 (707)dagger
NA
7882 (722)dagger
NA (not applicable) Blood samples were not collected during daytime sessions In this table percentages are unweighted dagger Percent of eligible
To prevent impaired drivers from continuing to drive a special ldquoImpaired Driver Protocolrdquo was developed to ensure the safety of both the drivers and the public Impairment was determined by the interviewerrsquos observation of the driverrsquos behavior and by the use of a PAS If there was any sign of possible impairment the interviewer signaled the survey manager who administered a breath test with a preliminary breath test (PBT) device that displayed the actual BAC If the driverrsquos BAC was 05 gdL (grams per deciliter) or higher the survey manager provided the participant with several options for getting home without driving11 This system has been successful in preventing identified impaired drivers from returning to the road where they could be a danger to themselves or others A full description of the Impaired Driver Protocol is provided in Appendix E of the Methodology Report (Lacey et al 2009a)
A significant concern for all four NRS studies was that high BAC drivers might be less likely to agree to participate resulting in an underestimate of the number of risky drinking drivers on the road Data from the 1996 NRS and from relative risk studies such as that of Blomberg Peck Moskowitz Burns and Fiorentino (2001 p 117) have suggested that drivers who refuse the breath test are likely to have higher BACs than those who agree to participate This was corrected somewhat in the 1996 and 2007 NRS studies by using the PAS data collected as part of the consent process During the data collection process a PAS was used when the driver was first approached to participate in the survey The PAS provides a nine-unit estimate of what a true BAC measure collected by the PBT device would be We correlated the PAS and other measures (specifically gender and time of night) to impute the BACs of drivers who entered the site but refused to provide a breath sample Thus the actual BACs collected in both the 1996 and the 2007 NRS studies were corrected for nonparticipating drivers
10 Typically only drivers who had completed the oral fluid step provided a blood sample 11 Our threshold of 05 gdL was more conservative than the legal per se limit of 08 gdL
22
2007 National Roadside Survey of Alcohol and Drug Use by Drivers Drug Results
Driver Conversion As presented in the Methodology Report (Lacey et al 2009a) there were 444 attempts to convert drivers who had initially declined to participate in our study (ie to change their minds and provide us with at least a breath sample) This was done to develop an understanding of whether drivers who refused to participate were more or less likely to be alcohol or drug positive than those who initially agreed to participate Drivers who refused were offered a $100 incentive as an inducement to convert Of the 444 total attempts 50 percent were successfully converted (ie provided a breath sample) Among those converted drivers 156 (70) also provided an oral fluid sample and 49 drivers (22) also provided a blood sample
Tables 11 and 12 show the outcome of the Oral Fluid and Blood analyses (respectively) performed on the converted drivers Among converted drivers who provided an oral fluid sample the distribution of drivers who were drug positive appears to be somewhat higher than that of the total sample of daytime and nighttime participants where 110 percent of the general daytime samples were positive (as compared to 162 of converted drivers) and 144 percent of the general nighttime samples were positive (compared to the 170 of converted drivers) These differences however were not statistically significant
Table 11 Oral Fluid Analysis Results Among Converted Drivers
Daytime Nighttime Presence of Drugs N N in Oral Fluid (Unweighted) (Weighted) (Unweighted) (Weighted) Negative 27 838 107 831 Positive 6 162 16 170 All 33 100 123 100
Among drivers who were converted and provided a blood sample 127 percent were drug positive This distribution is very similar to that of the total nighttime participants who provided blood where 138 percent were drug positive (blood was not collected in the daytime sample) Given the low sample size statistical tests were not performed
Table 12 Blood Analysis Results Among Converted Drivers
Presence of Drugs in Blood
Negative Positive
Nighttime N
(Unweighted)
(Weighted) 43 873
6 127 All 49 100
23
2007 National Roadside Survey of Alcohol and Drug Use by Drivers Drug Results
Selection of Drugs for Screening and Analysis PIRE and NHTSA jointly developed an initial list of drugs to be detected based on the literature (eg Jones Shinar amp Walsh 2003 Couper amp Logan 2004) and experience with drug-involved driving research The drugs were selected because of a combination of their potential impaired-driving effects their likelihood of appearing in drivers and in the case of oral fluid the availability of scientific techniques to analyze oral fluid to detect and quantify the drug NHTSA then provided this list to experts in the field of epidemiology of drug use driving and toxicology both in the United States and abroad The experts responded to the list with additions and deletions
The list of selected drugs is shown in Table 13 The first five categories of drugs listed constitute the National Institute on Drug Abuse (NIDA)-5 which are prevalent drugs of abuse and of universal interest in the study of drug involvement The NIDA-5 are routine components of a drug-screening panel The other drugs on the list (with the exception of barbiturates) appear in the NHTSA publication titled ldquoDrugs and Human Performance Fact Sheetsrdquo (Couper amp Logan 2004) and are of interest because the expert panel for that effort believed those drugs presented potential traffic safety risks The drugs we tested for represented illegal prescription and overshythe-counter drugs that (1) have the potential to impair driving performance and (2) could reasonably be expected to appear in the driver population
Table 13 Selected Drugs and Minimum Detection Concentrationsdagger
Drug Class Minimum Concentration
Oral Fluid (ngmL) Minimum Concentration
Blood (ngmL) Self-report Item
Screen Confirm Screen Confirm
Cocaine (Cocaine benzoylecgonine)
20 8 25 10 Cocaine (eg crack or coke)
Opiates (6-AM codeine morphine hydrocodone hydromorphone)
40 10 25 10
Heroin Morphine or Codeine (eg Tylenolreg with codeine)
Amphetamine Methamphetamine (MDMA MDA MDEA Ephedrine Psuedoephedrine)
50 50
50 20 20
10
Amphetamine or Methamphetamine (eg speed crank crystal meth) Ecstasy
Cannabinoids (THC THC-COO[THCA])
4 2 10 1 Marijuana (eg pot hash weed)
Phencyclidine 10 10 10 10 PCP (eg angeldust) Benzodiazepines (oxazepam nordiazepam bromazepam flurazepam
10 5 20 10 Benzodiazepines (eg Valiumreg or tranquilizers)
24
2007 National Roadside Survey of Alcohol and Drug Use by Drivers Drug Results
Drug Class Minimum Concentration
Oral Fluid (ngmL) Minimum Concentration
Blood (ngmL) Self-report Item
Screen Confirm Screen Confirm
flunitrazepam lorazepam chlordiazepoxide temazepam diazepam clonazepam alprazolam triazolam midazolam nitrazepam) Barbiturates (Phenobarbital pentobarb secobarbital butalbital)
50 50 500 500 Barbiturates (eg phenobarbital)
Methadone 50 25 50 10 Methadone Ethyl alcohol 02 02 02 02 Alcohol Oxycodone (Percocetreg) 25 10 25 10 Prescription pain
killers (eg Percocetreg OxyContinreg oxycodone Demerolreg Darvonreg)
Propoxyphene (Darvonreg)
10 10 10 10
Tramadol (Ultramreg) 50 25 50 10 Carisoprodol (Somareg) 100 50 500 500 Meperidine (Demerolreg) Sertraline (Zoloftreg) 50 25 50 10
Antidepressants (eg Prozacreg Zoloftreg)
Fluoxetine (Prozacreg) 50 25 50 10 Tricyclic Antidepressants (amitryptiline nortriptyline)
25 25 25 10
Zolpidem (Ambienreg) 10 10 10 10 Ambienreg or other sleep aids
Methylphenidate (Ritalinreg)
10 10 10 10 ADHD medications (eg Ritalinreg)
Dextromethorphan 50 20 50 20 Cough medicines (eg Robitussinreg Vicks 44reg etc)
Ketamine 10 10 10 10 KetamineSpecial K daggerScreening utilizes ELISA micro-plate and confirmation utilizes GCMS or LCMSMS technology
We screened using ELISA micro-plate technology Confirmation was performed using GCMS or LCMSMS technology Our toxicological laboratory Immunalysis Corporation provided all necessary confirmations
Cocaine which can be used as a local anesthetic is often abused because of its stimulating effects on the central nervous system (CNS) At low doses cocaine might actually have performance enhancing effects however little is known about its effects on human performance at higher levels and in conjunction with alcohol It is clearly a drug of abuse in the United States and worthy of study in drivers
Opiates are narcotic analgesics used both medicinally and as drugs of abuse After an initial rush opiates act as CNS depressants and certainly could have performance-decreasing effects
25
2007 National Roadside Survey of Alcohol and Drug Use by Drivers Drug Results
Amphetamines are CNS stimulants and are used both medicinally and as drugs of abuse Amphetamines are generally taken recreationally and to enhance performance (eg truck drivers staying awake) Ecstasy falls within this category and as a methylated amphetamine derivative it also has hallucinogenic properties Amphetamines have been associated with crash occurrence and could logically be associated with driving impairment both in the stimulation and withdrawal stages in the latter case especially as the drug interacts with fatigue The analytical methodology is described in an article by Moore Coulter and Crompton (2007)
Cannabinoids have a variety of effects on humans and can be associated with stimulant sedative and hallucinogenic effects Both the experimental and epidemiologic evidence on cannabinoidsrsquo effects on driving are mixed When marijuana is found in drivers however it is often in conjunction with alcohol where an impairing effect is more likely The most prevalent drug detected in the pilot study was marijuana (Lacey et al 2007) There appeared to be a strong positive correlation between the oral fluid and blood tests and the only discrepancies found in the pilot study (negative oral fluid and a positive blood) were from 10 cases in which the inactive metabolites were detected in blood but not the active tetrahydrocannabinol (THC) A positive metabolite result (THCA) with a negative parent compound (THC) is consistent with less recent use (eg in the days before sample was taken) A positive oral fluid for the parent compound is likely to be associated with very recent THC use the timeframe consistent with potential impairing effects Thus such oral fluid results can be very informative The laboratory procedures for testing the oral fluid results have been previously published in several articles (Moore et al 2006 Moore Rana amp Coulter 2007c Coulter Miller Crompton amp Moore 2008)
Phencyclidine (PCP) is related to veterinary tranquilizers such as ketamine that impair motor ability but it also has hallucinogenic effects and is used as a recreational drug PCP has serious performance diminishing effects and has been found in impaired-driving cases Its determination in oral fluid has recently been published in Coulter Crompton and Moore (2008)
Benzodiazepines include many widely prescribed drugs (eg Valiumreg Xanaxreg) to reduce anxiety These drugs act as CNS depressants show cross-tolerance to ethanol and are potentially associated with driver impairment Different types of benzodiazepines have very short to very long half-lives For example the desiredtherapeutic effect of lorazepam (Ativanreg) is sedation which would obviously have a detrimental effect on driving a motor vehicle The most common benzodiazepine is diazepam (Valiumreg) andor its metabolites nordiazepam oxazepam and temazepam The confirmation procedure for the 2007 study included LCMSMS confirmation using the method described in Moore Coulter Crompton and Zumwalt (2007)
Barbiturates are still widely prescribed CNS depressants and in some cases as anti-epileptic medications Because of their depressive effects barbiturates are associated with delayed reaction times and possibly loss of concentration both effects likely to affect driving performance
Methadone a narcotic analgesic is used both medicinally for opiate detoxification and maintenance and for pain relief It has also been used as a drug of abuse It may have differential performance effects in naiumlve or recreational users versus tolerant therapeutic users and certainly deserves study
Painkillers are a class of drugs that may lead to driving impairment Commonly used painkillers include oxycodone (an opioid) Oxycodone has similar effects to morphine and heroin If used in
26
2007 National Roadside Survey of Alcohol and Drug Use by Drivers Drug Results
combination with other depressants of the CNS such as alcohol or benzodiazepines it can cause severe impairment or lead to death Tramadol an opiate analgesic has similar effects to oxycodone Propoxyphene and meperidine also atypical opiates are included in the panel The methods used for their analysis are described (Rana et al 2006 Moore Rana et al 2007b) Other painkillers such as carisoprodol a CNS depressant and muscle relaxant (Somareg also called Miltownreg) are used as prescription drugs but can lead to abuse Even at therapeutic concentrations carisoprodol and its metabolite meprobamate may cause driving impairment as the desired effect is sedation
Antidepressants are most commonly in the form of selective serotonin uptake inhibitors (SSRIs) such as fluoxetine (Prozacreg) and sertraline (Zoloftreg) They can cause impairment especially in circumstances where extremely high blood concentrations are measured or if they are taken outside of medical need or therapeutic treatment There is also an additional risk of impairment associated with combined use with alcohol
Sleep aids such as Ambienreg cause drowsiness and may cause dizziness If consumed with alcohol there is an increased likelihood of these symptoms Sleep aids alone or in combination with alcohol could have a detrimental effect on driving ability
Other stimulants such as methylphenidate (sold as Ritalinreg) are amphetamine-like prescription drugs commonly used to treat Attention Deficit Hyperactivity Disorder (ADHD) in children and adults They are CNS stimulants Some people abuse these drugs by crushing the tablets and snorting them The effect of this other stimulant abuse is similar to that of cocaine or amphetamine
Dextromethorphan a synthetic analog of codeine is an antitussive widely used in cough medicines (eg Robitussinreg Sucretsreg Vicks Formula 44reg) When consumed in high doses in recreational use it is a CNS depressant and may have driving impairment effects at those levels The analytical method has recently been published in Rodrigues et al (2008)
Ketamine (Special K) is used medicinally as a veterinary tranquilizer but it is also abused as a recreational drug for its psychedelic effects Ketamine use by humans would likely be associated with decrements in skills related to driving
Oral Fluid Collection Device Following the NRS interview and collection of the breath test the interviewer requested an oral fluid sample and offered a $10 incentive for providing one We used the Quantisaltrade (manufactured by Immunalysis Corporation) oral fluid collection device (see Appendix F of the Methodology Report [Lacey et al 2009a]) The subject placed this device under hisher tongue and its pad changed color (blue) when 1 mL of oral fluid (the necessary sample volume) was collected The collection device was then placed into a tube containing 3 mL of a stabilizing buffer solution and capped for storage and transport to the laboratory The steps are illustrated in Figure 2
27
2007 National Roadside Survey of Alcohol and Drug Use by Drivers Drug Results
Figure 2 Collecting an Oral Fluid Sample With the Quantisaltrade Oral Fluid Collection Device Distributed by Immunalysis Inc Pomona CA
httpwwwimmunalysiscomquantisal_procedurehtm
The oral fluid samples were labeled with pre-printed Chain-of-Custody (CoC) labels to be linked with the subject and additional data collected This allowed the specimen to be tracked throughout the project The CoC labels contained a unique identifier that corresponded to that sample This number was also entered into the PDA CoC numbers were preprinted by the laboratory and were used to maintain a documented link between each sample collected and the respondent who provided it A different CoC number was assigned to the oral fluid and blood sample for an individual subject and the laboratory was blinded to any link between them This assured the oral fluid and blood analyses and results were independent of one another
The collection of oral fluid while less invasive than the collection of blood or urine has some associated difficulties (ONeal Crouch Rollins amp Fatah 2000) Various researchers have noted that the method of collection and the medium itself (oral fluid) significantly affect drug concentration in the specimen and consequently whether some drugs can be detected at all However while some collection devices give no indication of the amount of oral fluid actually collected (rendering a quantitative result meaningless) the Quantisaltrade oral fluid collection device collects 1 mL (+10) of clear oral fluid from the donor Researchers have studied the device to assess the efficiency of drug release from the collection pad (Quintela Crouch amp Andrenyak 2006 Moore et al 2006 Moore Rana amp Coulter 2007b) and have found a high rate of extraction efficiency Tables 14 and 15 summarize the effectiveness of the Quantisaltrade oral fluid collection device across a range of drugs by two different research groups Findings above 100 percent are due to slight variations in the amount of the substances actually added to the scientific control samples (scientific error)
28
2007 National Roadside Survey of Alcohol and Drug Use by Drivers Drug Results
Table 14 Extraction Efficiency of Quantisaltrade Oral Fluid Collection Device Over a Range of Drugs Quintela
Drug Target Value (ngmL) Mean Recovery from the Pad () Amphetamine 50 943
Methamphetamine 50 1038
Cocaine 20 912
Benzoylecgonine 20 869
Codeine 40 956
Morphine 40 926
6-acetylmorphine 4 922
THC 4 914
Methadone 50 997
Oxazepam 20 1013
Source Quintela et al 2006
Table 15 Extraction Efficiency of Quantisaltrade Oral Fluid Collection Device Over a Range of Drugs Moore
Drug Target Value (ngmL) Mean Recovery from the Pad () Meperidine 25 867
Tramadol 25 877
Oxycodone 20 966
Source Moore Rana amp Coulter 2007a Moore et al 2006 THC recovery from the pad gt 80
For a more thorough discussion of the Quantisal device see the pilot study report (Lacey et al 2007)
Blood Collection Procedures After completion of the oral fluid sample and the drug questionnaire the interviewer requested that the subject provide a blood sample in exchange for an additional $50 incentive The incentives were given as money orders so subjects could not spend the money immediately especially on items such as alcohol and other drugs
Licensed phlebotomists conducted the blood draws The phlebotomist set up the blood draw station in the rear seat of a rental van The subject sat in the back seat of the van and the phlebotomist stood just outside the van or sat in the adjoining seat
During blood draws one gray-top tube (10 mL) of the subjectrsquos blood was drawn There are several types of tubes available for the collection of blood specimens with different color tops The choice of tube is dependent upon the type of test to be performed on the blood The Federal Aviation Administration (FAA) recommends the gray-topped tube for drug and alcohol testing of blood specimens The gray-top tube contains two preservatives potassium oxalate and sodium fluoride The oxalate is an anti-coagulant and the sodium fluoride is an anti-bacterial stabilizer These preservatives reduce the need for refrigeration but do not affect the ability to detect and quantify drugs Both additives are inorganic therefore they oxidize very slowly and are extremely stable The preservative helps inhibit the degradation of cocaine in storage to its
29
2007 National Roadside Survey of Alcohol and Drug Use by Drivers Drug Results
metabolite benzoylecgonine (Toennes amp Kauert 2001) The presence of sodium fluoride with or without refrigeration and potassium oxalate effectively inhibits cocaine degradation with 86 to 91 percent of the drug present after 48 hours In contrast substantial degradation of cocaine occurs in the samples stored without sodium fluoride (Brogan et al 1992) The presence of the parent drug is particularly useful in the determination of recent use since more cocaine per se (prior to its transformation to benzoylecgonine) indicates more recent drug use Additionally gray-top tubes are helpful in conducting ethanol analysis because the sodium fluoride is an effective antibacterial agent that helps inhibit endogenous alcohol production
For this study glass tubing was used as opposed to plastic to better maintain reliable drug results For example in a study by Christophersen (1986) on the stability of THC in whole blood during storage THC concentration in blood stored in glass vials for four weeks at -20 C remained unchanged however blood stored in plastic vials lost 60 to 100 percent of its THC content during storage Thus glass vials are recommended for collection of blood samples where marijuana content is suspected In this study approximately 10 percent of the blood samples were analyzed immediately upon receipt by the laboratory However the remaining samples were stored at 4 degrees Centigrade until additional funding was obtained for their analyses approximately one year later As a check on 13 samples which had been analyzed initially and were found to be positive for THC andor its metabolites reanalysis for THC and its metabolites one year later revealed that though values obtained were generally lower than in the initial analyses each specimen tested positive for THC andor a metabolite at the retest Additionally six samples which initially had been found to be positive for cocaine andor its metabolites were reanalyzed and though parent drug values had eroded metabolite values had increased and all were still positive for cocaine at retest For eight opiate samples and six amphetamine samples the results at retest remained positive after one year
The blood sample tubes were labeled with pre-printed Chain-of-Custody (CoC) labels that linked the blood sample to the oral fluid sample to the subject so the specimen could be tracked throughout the project The CoC labels contained a unique identifier that corresponded to that sample thus there was no identifying information traceable to the subject This number was also entered into the PDA CoC numbers were preprinted by the laboratory and were used to maintain a documented link between each sample collected and the respondent who provided it As noted above a different CoC number was assigned to the oral fluid and blood sample for an individual subject and the laboratory was blinded to any link between them
In the few cases where phlebotomists were not able to draw a full tube for a subject because some individuals had small andor difficult-to-locate veins the laboratory was able to conduct an initial screening test however it was not able to conduct a confirmatory analysis by GCMS due to the insufficient volume
At the conclusion of the blood draw procedure the subject received the $50 incentive and sat for a moment in the blood draw station The subject was offered a piece of candy before being directed safely out of the survey site and back onto the roadway
Once collected blood samples were stored either in refrigerators or in coolers with blue ice packs if no refrigeration was available The samples were subsequently shipped to the laboratory with blue ice as an additional precaution
Spanish-speaking participants were escorted to the phlebotomist by the Spanish-speaking interviewer and a Spanish consent form was given to the participant The interviewer read the
30
2007 National Roadside Survey of Alcohol and Drug Use by Drivers Drug Results
consent form to them and stayed with the participant to answer any questions and provide translation between the phlebotomist and participant
Drug Questionnaire While they provided an oral fluid sample drivers were asked to complete a drug questionnaire The 27-item questionnaire (Table 16) included a list of drugs including tobacco cough medicine other illegal prescription and over-the-counter drugs For items 1-23 subjects indicated when they last used a particular medicationdrug by responding ldquoTonightrdquo ldquoPast 2 daysrdquo ldquoPast monthrdquo Past yearrdquo ldquoOver a year agordquo or ldquoNeverrdquo
Table 16 Drug Questionnaire Survey
Item Drugs
1 Tobacco (eg cigarettes cigars)
2 Cough medicines (eg Robitussin Vicks 44 etc)
3 Other over-the-counter medicines
4 Prescription Pain Killers (eg Percocet OxyContin Oxycodone Demerol Darvon)
5 Ambien or other sleep aids
6 ADHD medications (eg Ritalin Aderall Concerta)
7 Muscle relaxants (eg Soma Miltown)
8 Prescription dietary supplements (eg Phentermine)
9 Antidepressants (eg Prozac Zoloft)
10 Marijuana (eg pot hash weed)
11 Cocaine (eg crack or coke)
12 Heroin
13 Methadone
14 LSD (acid)
15 Morphine or Codeine (eg Tylenol with Codeine)
16 Ecstasy (eg ldquoErdquo Extc MDMA ldquoXrdquo)
17 Amphetamine or Methamphetamine ( eg speed crank crystal meth)
18 GHB
19 PCP (eg Angeldust)
20 Rohypnol (Ruffies)
21 Ketamine (Special K)
22 Benzodiazepines (eg Valium or tranquilizers)
23 Barbiturates (eg Phenobarbital) Do you believe any of the medicationsdrugs you have taken (or are taking) could affect your 24 driving Have you taken any medications or drugs in the past YEAR that you think may have affected your 25 driving
26 Have you taken any medications or drugs TODAY that you think may affect your driving
27 Have you ever NOT driven because you were on a medicationdrug
31
2007 National Roadside Survey of Alcohol and Drug Use by Drivers Drug Results
Biological Sample Analysis Procedures The following sections briefly describe the analytic techniques used in the analyses of oral fluid and blood samples to determine the presence of the drugs of interest in this study
Oral Fluid Sample Analysis Procedures Each weekend the tubes from each data-collection period were packaged together and sent overnight to a laboratory for analysis Upon receipt of the specimens in the testing facility screening analysis was carried out using enzyme-linked immunosorbent assays (ELISA) at the cut-off concentrations described in Table 13 Screen positive specimens were then reanalyzed using a separate sample of the fluid using gas chromatography-mass spectrometry (GCMS) or liquid chromatography with tandem mass spectral detection (LCMSMS) according to standard operating procedures All methods were fully validated according to good laboratory practices and all standard operating procedures are on file at Immunalysis Corporation
Gas Chromatography-Mass Spectrometry (GCMS) Instrumentation
Agilent 6890 gas chromatography - 5973 or 5975 mass selective detector (GCMSD) electron impact (EI) mode
Extraction
Oral fluid (1 mL) of diluted specimen (13 buffer) was extracted using mixed mode solid phase methods with drug specific column phases
Derivatization
Drug specific derivatives used for maximum detectability and stability
Drugs included in the confirmation profile are shown in Table 13
Liquid Chromatography-Tandem Mass Spectrometry (LCMS-MS) Instrumentation
Agilent LCMS-MS System 1200 Series LC pump 6410 Triple Quadropole
Zorbax Eclipse XDB C18 (46 x 50mm x 18 μm) column
Extraction
Blood (1 mL) protein precipitate with cold acetonitrile mixed mode solid phase extraction using drug specific column phases
32
2007 National Roadside Survey of Alcohol and Drug Use by Drivers Drug Results
Blood Sample Analysis Procedures Upon receipt of the specimens by the testing facility screening analysis for 10 percent of the sample was carried out using enzyme-linked immunosorbent assays (ELISA) at the cut-off concentrations described in Table 13 The remaining 90 percent of the sample was stored at 4deg centigrade until funding was provided for their analysis Again specific drugs tested are shown in Table 13 Screen positive specimens were confirmed using either gas chromatography with mass spectral detection (GCMS) or liquid chromatography with tandem mass spectral detection (LCMSMS) All methods were fully validated according to good laboratory practices See above for instrumentation
Ethanol (Oral Fluid and Blood) Screen positive alcohol specimens were sent for confirmation to BioTox Laboratories or Immunalysis Corporation
Instrumentation
Perkin-Elmer Model F-45 Gas Chromatograph
Flame ionization detector (FID)
02 percent Carbowax 1500 Graphpac-GC 80100 column (6 ft x 18 in ID)
Extraction
Whole blood or 13 buffered oral fluid (01 mL) add 1 mL double deionized water containing 01 percent propanol
Analyzed using headspace GCFID
Drug Classes and Categories Due to the large number of drugs tested results were consolidated into drug classes and categories Drug classes are defined according to potential drug effects and include stimulants sedatives marijuana antidepressants narcotic analgesics and other Drugs were separately categorized as illegal prescription and over-the-counter12 13 Though some drugs could logically fall into more than one category we made the categories mutually exclusive and assigned each drug to only one category This approach facilitates clear presentation of results
Tables 17 and 18 present drug classes and categories In the tables the shaded entries indicate drugs that were identified only through blood analyses The non-shaded entries are drugs that were identified through both oral fluid and blood analyses
12 Drugs may be classified in different ways depending on the use of the classification system For example in NHTSArsquos drug evaluation and classification (DEC) program the categories CNS Depressants CNS Stimulants Hallucinogens Dissociative Anesthetic (PCP) Narcotic Analgesics Inhalants and Cannabis are used 13 Due to relative small sample sizes and for analytical purposes the over-the-counter and prescription categories were further collapsed into a single category (ldquoMedicationsrdquo)
33
20
07 N
atio
nal R
oads
ide
Sur
vey
of A
lcoh
ol a
nd D
rug
Use
by
Driv
ers
Dru
g R
esul
ts
34
Tab
le 1
7 D
rug
Cla
ss C
om
po
siti
on
mdashO
ral F
luid
an
d B
loo
d C
om
bin
ed
Sti
mu
lan
ts
Sed
ativ
es
Mar
ijuan
a A
nti
dep
ress
ants
N
arco
tic
An
alg
esic
s O
ther
Am
ph
etam
ines
B
arb
itu
rate
s C
ann
abin
oid
s S
SR
Is
Met
had
on
e
C
ou
gh
Su
pp
ress
ants
Am
phet
amin
e
But
albi
tal
TH
C
Flu
oxet
ine
Met
hado
ne
Dex
trom
etho
rpha
nM
DA
P
heno
barb
ital
11-O
H-T
HC
D
esm
ethy
lser
tral
ine
ED
DP
MD
EA
Pen
toba
rbita
l T
HC
-CO
OH
S
ertr
alin
e
S
tree
t D
rug
s M
DM
A
Sec
obar
bita
l
N
orflu
oxet
ine
O
pia
tes
Ket
amin
e M
etha
mph
etam
ine
6-A
M (
Her
oin)
N
orke
tam
ine
P
hent
erm
ine
B
enzo
dia
zep
ines
Tri
cyc
lics
6-
AC
(H
eroi
n im
purit
y)
PC
P
Pse
udoe
phed
rine
Alp
razo
lam
Am
itrip
tylin
e C
odei
ne
P
heny
lpro
pano
lam
ine
Alp
ha-h
ydro
xyal
praz
olam
Nor
trip
tylin
e M
orph
ine
C
hlor
diaz
epox
ide
D
oxep
in
H
ydro
codo
ne
Co
cain
e D
iaze
pam
Des
met
hyld
oxep
in
Hyd
rom
orph
one
Coc
aine
Lo
raze
pam
Im
ipra
min
e O
xyco
done
Ben
zoyl
ecgo
nine
O
xaze
pam
Des
ipra
min
e O
xym
orph
one
Coc
aeth
ylen
e T
emaz
epam
Trim
ipra
min
e
Nor
coca
ine
Tria
zola
m
C
lom
ipra
min
e
Aty
pic
al O
pio
ids
Alp
ha-h
ydro
xytr
iazo
lam
Am
oxap
ine
Tra
mad
ol
AD
HD
Med
icat
ion
s
C
lona
zepa
m
P
rotr
ipty
line
Mep
erid
ine
M
ethy
lphe
nida
te
Flu
nitr
azep
am
M
apro
tilin
e N
orm
eper
idin
e
7-
amin
oflu
nitr
azep
am
P
ropo
xyph
ene
Bro
maz
epam
Sle
ep A
ids
N
orpr
opox
yphe
ne
Nitr
azep
am
Z
olpi
dem
Est
azol
am
M
idaz
olam
Flu
raze
pam
N
ordi
azep
am
Car
iso
pro
do
l
C
aris
opro
dol
M
epro
bam
ate
Not
e S
had
ed e
ntrie
s in
dica
te d
rugs
iden
tifie
d th
roug
h bl
ood
ana
lyse
s o
nly
N
on-s
had
ed e
ntrie
s ar
e dr
ugs
ide
ntifi
ed
thro
ugh
both
blo
od
and
oral
flu
id a
naly
ses
Sel
ectiv
e S
erot
onin
Upt
ake
Inhi
bito
rs (
SS
RIs
)
20
07 N
atio
nal R
oads
ide
Sur
vey
of A
lcoh
ol a
nd D
rug
Use
by
Driv
ers
Dru
g R
esul
ts
35
Tab
le 1
8 D
rug
Cat
ego
ry C
om
po
siti
on
mdashO
ral F
luid
an
d B
loo
d C
om
bin
ed
Illeg
al
P
resc
rip
tio
n
Pre
scri
pti
on
(co
nt
) P
resc
rip
tio
n (
con
t)
Ove
r-th
e-C
ou
nte
r
Co
cain
e B
enzo
dia
zep
ines
T
ric
yclic
s A
nti
dep
ress
ants
M
eth
ado
ne
Co
ug
h S
up
pre
ssan
t C
ocai
ne
Alp
razo
lam
A
mitr
ipty
line
Met
hado
ne
Dex
trom
etho
rpha
nB
enzo
ylec
goni
ne
Alp
ha-h
ydro
xyal
praz
olam
N
ortr
ipty
line
ED
DP
C
ocae
thyl
ene
Nor
diaz
epam
D
oxep
in
C
old
Med
icin
e N
orco
cain
e C
hlor
diaz
epox
ide
Des
met
hyld
oxep
in
O
pia
tes
P
seud
oeph
edrin
e
D
iaze
pam
Im
ipra
min
e
C
odei
ne
C
ann
abin
oid
s Lo
raze
pam
D
esip
ram
ine
Mor
phin
e
T
HC
O
xaze
pam
T
rimip
ram
ine
Hyd
roco
done
11-O
H-T
HC
T
emaz
epam
C
lom
ipra
min
e H
ydro
mor
phon
e
T
HC
-CO
OH
T
riazo
lam
A
mox
apin
e O
xyco
done
Alp
ha-h
ydro
xytr
iazo
lam
P
rotr
ipty
line
Oxy
mor
phon
e
S
tree
t D
rug
s F
lura
zepa
m
Map
rotil
ine
Ket
amin
e F
luni
traz
epam
A
typ
ical
Op
ioid
s
Nor
keta
min
e 7-
amin
oflu
nitr
azep
am
S
tim
ula
nts
T
ram
adol
PC
P
Nitr
azep
am
Met
hylp
heni
date
M
eper
idin
e
M
idaz
olam
Phe
nter
min
e N
orm
eper
idin
e
Str
eet
Am
ph
etam
ines
B
rom
azep
am
Pro
poxy
phen
e
Am
phet
amin
e
C
lona
zepa
m
B
arb
itu
rate
s N
orpr
opox
yphe
ne
MD
A
Est
azol
am
But
albi
tal
MD
MA
Phe
noba
rbita
l S
leep
Aid
s
M
DE
A
SS
RIs
P
ento
barb
ital
Zol
pide
m
M
etha
mph
etam
ine
F
luox
etin
e S
ecob
arbi
tal
Phe
nylp
ropa
nola
min
e D
esm
ethy
lser
tral
ine
Car
iso
pro
do
l
S
ertr
alin
e
C
aris
opro
dol
O
pia
tes
Nor
fluox
etin
e
Mep
roba
mat
e
6-
AM
(H
eroi
n)
6-A
C (
Her
oin
impu
rity)
Not
e S
had
ed e
ntrie
s in
dica
te d
rugs
iden
tifie
d th
roug
h bl
ood
ana
lyse
s o
nly
N
on-s
had
ed e
ntrie
s ar
e dr
ugs
ide
ntifi
ed
thro
ugh
both
blo
od
and
oral
flu
id a
naly
ses
Sel
ectiv
e S
erot
onin
Upt
ake
Inhi
bito
rs (
SS
RIs
)
2007 National Roadside Survey of Alcohol and Drug Use by Drivers Drug Results
36
2007 National Roadside Survey of Alcohol and Drug Use by Drivers Drug Results
Results Since two different biological matrices (oral fluid and blood) were gathered to be analyzed for the presence of drugs we present prevalence estimates in three different ways in this report
1) We present both daytime and nighttime drug prevalence estimates based on the analyses of the oral fluid samples alone and then in combination with alcohol using breath alcohol test results Tables reporting self-report drug use observed safety measures and reports with contact with the criminal justice system and the health care system follow these results
2) We next present nighttime drug prevalence estimates based on analyses of blood14
and then in combination with alcohol using breath alcohol test results
3) The third section presents nighttime prevalence results based on the combination of the results of the oral fluid blood analyses and subsequently in combination with alcohol using breath alcohol test results We conclude this section by presenting prevalence estimates for specific drugs from oral fluid andor blood combined In each of the sections the results are presented first in terms of drivers who were positive for any drug then by class followed by category as described in Tables 17 and 18
Throughout this report we do not combine results for daytime and nighttime survey respondents but display the two groups separately because the sampling frame is different for the two groups The daytime drivers were sampled during a single Friday two-hour period in each PSU while the nighttime drivers were sampled during four two-hour periods (two on Friday night and two on Saturday night in each PSU) Thus combining the daytime and nighttime samples would not result in a meaningful representation of driver drug use overall
Each of the various sampling stages (or frames) required a separate calculation of probability which then became a component of the final probability computation reflecting all levels or frames The total weighted number of the sample was identical to the total number of eligible drivers entering the survey bays including refusers but was adjusted to reflect the estimated distribution of those drivers in the 48 contiguous States Error terms for the analyses were computed by STATA (Stat Corp 2006) to account for the differential weights and the amount of variance attributable to the various sampling frames Further information on the weighting of the data can be found in the Methodology Report (Lacey et al 2009a)
Oral Fluid Results (Daytime and Nighttime Samples) Driver Drug Use Prevalence Based on Oral Fluid Results This section of the report presents the overall results of oral fluid analyses for all of the drugs indicated in the introductory section Drivers who tested positive for one or more of the drugs we tested in oral fluid are categorized as drug-positive It should be emphasized that this set of tables aggregates over-the-counter prescription and illegal drugs and metabolites of drugs in each category indicating only that those who tested positive have recently consumed at least one of the tested drugs and not that they were necessarily impaired by the substance
14 Daytime data collection did not include requests for blood samples
37
2007 National Roadside Survey of Alcohol and Drug Use by Drivers Drug Results
Unless explicitly indicated sample size (N) refers to the actual unweighted number of respondents Percentages are weighted Sample size may vary between tables because of missing values
Comparison of drug prevalence by time of day (Table 19) indicates that 11 percent of drivers in the daytime sample were drug-positive This level was significantly lower than the 144 percent of nighttime drivers who tested positive for drugs (p lt 01)
Table 19 Drug Prevalence by Time of Day (Oral Fluid)
Time of Day N
(Unweighted) Drug Positive
(Weighted) Daytime 1850 110
Nighttime 5869 144
Further when we examined drug prevalence by time of daysession (Table 20) we found that late night (Sessions 3 and 5) drivers were significantly more likely to be drug-positive (172 and 174 respectively) than Friday daytime (Session 1) drivers (11) or Friday and Saturday early evening (Sessions 2 and 4) drivers (129 and 136 respectively) (p lt 01)
Table 20 Drug Prevalence by Time of DaySession (Oral Fluid)
Session N
(Unweighted) Drug Positive
(Weighted)
1 Friday 930 am ndash 1130 am or 130 pm ndash 330 pm
1850 110
2 Friday 1000 pm ndash Midnight 1610 129
3 Friday 100 am ndash 300 am 1299 172
4 Saturday 1000 pm ndash Midnight 1684 136
5 Saturday 100 am ndash 300 am 1276 174
Comparison of drug prevalence by time and region (Table 21) revealed that the Northeast region had the greatest percentage of drug-positive findings in the nighttime driving sample at 173 percent (p lt 05) The Northeast region also had the second highest percentage in the daytime driving sample at 125 percent (although there were no statistical differences by region during the daytime) In spite of the Northeast regionsrsquo relatively high prevalence of drug-positives no clear pattern by region emerged
38
2007 National Roadside Survey of Alcohol and Drug Use by Drivers Drug Results
Table 21 Drug Prevalence by Time of Day and Region15 (Oral Fluid)
N Drug Positive Time of Day Region (Unweighted) (Weighted)
Daytime
Midwest Northeast South West
546 379 472 453
115
125
131
89
Overall Daytime 1850 110
Nighttime
Midwest
Northeast
South
West
1694
1111
1559
1505
150
173
140
129
Overall Nighttime 5869 144
Although the daytime driving sample showed no statistically significant difference in drug prevalence between males and females (Table 22) in the nighttime driving sample male drivers were significantly more likely to be drug-positive (165) than female drivers (113) (p lt 01)
Table 22 Drug Prevalence by Time of Day and Gender (Oral Fluid)
N Drug Positive Time of Day Gender (Unweighted) (Weighted)
Daytime Males Females
1032 811
110
113
Overall Daytime 1843 110
Nighttime
Males
Females
3605
2250
165
113
Overall Nighttime 5855 144
Comparison of drug prevalence by time of day and age (Table 23) showed that within the daytime driving sample drivers aged 45-64 showed the highest percentage of drug positives and drivers aged 16-20 and aged 65+ were significantly less likely to be positive than other ages of drivers (p lt 05) In the nighttime driving sample drivers aged 45-64 and 65+ were significantly less likely to be drug positive (p lt 01) Drivers aged 16-20 21-34 years and 35-44 years all had results similar to each other Age was self-reported by respondent Note that in Table 23 as well as upcoming tables the age ranges are not of equal intervals but were developed to roughly
15 Regions are defined by the NASSGES system according to US Census Regions (Midwest includes the West North Central and East North Central States Northeast includes New England and Middle Atlantic States South includes the West South Central East South Central and South Atlantic States and West includes West and Mountain States
39
2007 National Roadside Survey of Alcohol and Drug Use by Drivers Drug Results
categorize underage drivers (16-20) young drivers (21-34) followed by middle age and late middle age (35-44 and 45-64) and finally by senior drivers (65+ years)
Table 23 Drug Prevalence by Time of Day and Age (Oral Fluid)
N Drug Positive Time of Day Age (Unweighted) (Weighted)
Daytime
16-20 21-34 35-44 45-64 65+
99 436 374 668 245
62
112
116
133
64
Overall Daytime 1822 111
Nighttime
16-20 21-34 35-44 45-64 65+
961 2437 1042 1216
148
161
171
152
95
20
Overall Nighttime 5804 146
Gender comparisons within age groups (Table 24) revealed that within the daytime sample drug prevalence among female daytime drivers aged 45-64 (168) was significantly higher than male drivers of the same age group (97) (p lt 05) The same was true of the nighttime sample with drug prevalence among female drivers aged 45-64 (131) being significantly higher than male drivers of the same age group (72) (p lt 01)
Within the daytime sample drug prevalence among male drivers aged 21-34 years was statistically higher than among female drivers of the same age group (139 versus 75) (p lt 05) Additionally in the nighttime sample drug prevalence among male drivers in age categories 16-20 years 21-34 years and 35-44 years was significantly higher than the same-aged female counterparts (p lt 01)
40
2007 National Roadside Survey of Alcohol and Drug Use by Drivers Drug Results
Table 24 Drug Prevalence by Time of Day Age and Gender (Oral Fluid)
N Drug Positive Time of Day Gender Age (Unweighted) (Weighted)
Daytime
Males
16-20
21-34
35-44
45-64
65+
59
243
192
362
161
45
139
137
97
71
Overall Males ndash Daytime 1017 110
Females
16-20
21-34
35-44
45-64
65+
39
192
181
304
84
103
75
101
168
48
Overall Females ndash Daytime 800 114
Nighttime
Males
16-20
21-34
35-44
45-64
65+
598
1492
630
734
101
207
202
182
72
19
Overall Males ndash Nighttime 3555 167
Females
16-20
21-34
35-44
45-64
65+
362
940
409
480
47
95
119
109
131
23
Overall Females ndash Daytime 2238 113
Comparisons by self-reported race and ethnicity (Table 25) showed that in both the daytime and nighttime samples drivers who identified themselves as Asian were significantly less likely to be drug-positive (41 and 18 respectively) than drivers who identified themselves as African American Hispanic White or Other (p lt 05 at daytime p lt 01 at nighttime) Although statistically non-significant African American drivers were found to have the highest percentage of drug-positive results in both daytime (144) and nighttime (205) samples followed by Other (128 daytime and 162 nighttime) and White (116 daytime and 15 nighttime)
41
2007 National Roadside Survey of Alcohol and Drug Use by Drivers Drug Results
Table 25 Drug Prevalence by RaceEthnicity (Oral Fluid)
N Drug Positive Time of Day RaceEthnicity (Unweighted) (Weighted)
Daytime
African American Asian Hispanic White Other
267 46
253 1192
59
144
41
89
116
128
Overall Daytime 1817 112
Nighttime
African American Asian Hispanic White Other
973 191
1006 3355
272
205
18
118
150
162
Overall Nighttime 5797 146
RaceEthnic groups other than ldquoHispanicrdquo are always ldquonon-Hispanicrdquo
Comparisons of drug prevalence by education level (Table 26) revealed that prevalence of drug use increased from the daytime sample to the nighttime sample across all education levels except ldquosome collegerdquo Daytime drivers who identified themselves as college graduates or having some graduate experience were statistically less likely to be drug-positive than those with less education (p lt 01) This remained the case within the nighttime sample but only for drivers who identified themselves as college graduates (p lt 01)
Table 26 Drug Prevalence by Education Level (Oral Fluid)
N Drug Positive Time of Day Education Level (Unweighted) (Weighted)
Daytime
Not a High School Graduate High School Graduate Some College College Graduate Some Graduate Work
162 476 593 419 173
154
150
139
55
41
Overall Daytime 1823 111
Nighttime
Not a High School Graduate High School Graduate Some College College Graduate Some Graduate Work
573 1470 2218 1156
387
184
224
116
95
157
Overall Nighttime 5804 146
Comparing drug prevalence by employment status (Table 27) showed that in the daytime sample drug prevalence among unemployed drivers and drivers on disability was significantly higher than that of employed drivers or homemakers students and those who reported they were
42
2007 National Roadside Survey of Alcohol and Drug Use by Drivers Drug Results
retired (p lt 01) In the nighttime sample drug prevalence among drivers on disability was again significantly higher than employed drivers (p lt 01) while no statistical difference in drug prevalence was found in the nighttime sample between unemployed and employed drivers Within the nighttime sample employed drivers had significantly higher drug prevalence than ldquohomemakerrdquo and ldquoretiredrdquo drivers (p lt 01)
Table 27 Drug Prevalence by Employment Status (Oral Fluid)
N Drug Positive Time of Day Gender (Unweighted) (Weighted)
Daytime
EmployedSelf Employed Homemaker Student UnemployedRetired On Disability Other
1240 90 73 78
286 45 11
104
42
72
213
139
387
307
Overall Daytime 1823 111
Nighttime
EmployedSelf Employed Homemaker Student UnemployedRetired On Disability Other
4618 104 585 204 205
67 22
150
59
132
168
74
412
43
Overall Nighttime 5805 146
Drug prevalence rates among drivers of various vehicle types (passenger vehicle pickup sports utility vehicles (SUV) vanminivan and motorcycles) (Table 28) were not statistically different in the daytime sample Note however that motorcyclists had the greatest percentage of drug-positive results in both the daytime and nighttime samples although this difference was found to be statistically significant only in the nighttime sample (p lt 01)
43
2007 National Roadside Survey of Alcohol and Drug Use by Drivers Drug Results
Table 28 Drug Prevalence by Vehicle Type (Oral Fluid)
Drug Time of N Positive
Day Vehicle Type (Unweighted) (Weighted)
Passenger Vehicle 952 121
Pickup 285 66
SUV 394 97Daytime Van amp Minivan 177 126
Motorcycle 30 248
1838 110
Passenger Vehicle 3623 151
Pickup 695 144
SUV 1055 121
Overall Daytime
Nighttime Van amp Minivan 381 130
Motorcycle 73 324
5827 145Overall Nighttime
Driver Drug Use Prevalence by Drug Class Based on Oral Fluid Results In this section of the report we display driver drug use prevalence by class of drug The classes of drugs for which we tested were antidepressants marijuana narcotic-analgesics sedatives stimulants and other (see Table 17) Because some drivers tested positive for drugs in more than one class an additional mutually exclusive category ldquoMore than 1 Classrdquo appears in the drug class tables This was done to avoid double counting individual positive results Thus for example since marijuana is both a class by itself and could appear in the ldquoMore than 1 classrdquo cell as well (as could other classes of drugs) from these tables one cannot arrive at an overall prevalence estimate for marijuana alone Detailed summaries of prevalence estimates for individual drugs appear in Tables 137-140 later in the report
Drug Class
Comparison of drug classes by time of day (Table 29) indicated that when examining all drivers nighttime drivers were significantly more likely to test positive for more than one drug class (23) than daytime drivers (15) (p lt 01)
Table 29 Number and Distribution of Drug Classes by Time of Day (Oral Fluid)
Number of N Time of Day Drug Classes (Unweighted) (Weighted)
1 206 95
2+ 40 15Daytime Negative 1604 890
1850 1000
1 680 121
2+ 156 23
Overall Daytime
Nighttime Negative 5033 856
5869 1000Overall Nighttime
44
2007 National Roadside Survey of Alcohol and Drug Use by Drivers Drug Results
However when examining only drug-positive drivers (Table 30) there were no significant differences between daytime and nighttime drivers in the percentage of single-drug users (862 versus 837) or multi-drug users (138 versus 163)
Table 30 Number and Distribution of Drug Classes by Time of Day (Drug Positives Only) (Oral Fluid)
Number of N Time of Day Drug Classes (Unweighted) (Weighted)
Daytime 1 2+
206 40
862 138
Overall Daytime 246 1000
Nighttime 1 2+
680 156
837 163
Overall Nighttime 836 1000
In comparing prevalence of drug classes by time and region (Table 31) it was found that marijuana was generally the most common drug class across all the regions both in daytime (39) and nighttime (61) samples Nighttime drivers in the Midwest and Northeast regions were more likely to test positive for marijuana than daytime drivers (p lt 05) However marijuana results in the South and West regions did not differ between daytime and nighttime drivers For stimulants a higher percentage of nighttime drivers in all regions tested positive than did daytime drivers However the difference was statistically significant only in the Midwest (p lt 01) and West (p lt 05)
45
2007 National Roadside Survey of Alcohol and Drug Use by Drivers Drug Results
Table 31 Drug Classes by Time of Day and Region (Oral Fluid)
Time of Midwest Northeast South West All Day Drug Class
N=546 N=379 N=472 N=453 N=1850
Antidepressants 04 06 05 05 05
Marijuana 34 30 55 40 39
Narcotic-Analgesics 27 21 13 06 16
Sedatives 19 26 21 07 16Daytime Stimulants 08 17 22 20 16
Other 00 13 00 00 02
More than 1 Class 22 10 14 12 15
115 125 131 89 110
885 875 869 911 890
Overall Drug Positive Daytime
Negative
N=1694 N=1111 N=1559 N=1505 N=5869
Antidepressants 05 02 00 01 02
Marijuana 77 76 63 41 61
Narcotic-Analgesics 10 28 12 18 16
Sedatives 11 02 07 04 06Nighttime Stimulants 30 23 27 40 32
Other 02 00 01 05 03
More than 1 Class 16 41 29 20 23
150 173 140 129 144
850 827 860 871 856
Overall Drug Positive Nighttime
Negative
ldquoMore than 1 Classrdquo ndash Drivers testing positive for more than one drug are only counted in this category In this table percentages are weighted
Comparison of drug class by time and gender (Table 32) showed that males were significantly more likely to test positive for marijuana than females in samples of both daytime (59 males versus17 females) and nighttime (74 males versus 41 females) drivers (p lt 01) In the daytime sample females were more likely to test positive for narcotic-analgesics and sedatives than were males (p lt 01) however a statistical difference of this kind was not detected in the nighttime sample
46
2007 National Roadside Survey of Alcohol and Drug Use by Drivers Drug Results
Table 32 Drug Classes Distribution by Time of Day and Gender (Oral Fluid)
Time of Males Females Total Day Drug Class
Daytime
Antidepressants Marijuana Narcotic-Analgesics Sedatives Stimulants Other More than 1 Class
N=1032 01 59 10 12 18 00 10
N=811 09 17 25 22 14 05 21
N=1843 05 40 17 16 16 02 15
Overall Drug Positive Daytime 110 113 111 Negative 890 887 889
Nighttime
Antidepressants Marijuana Narcotic-Analgesics Sedatives Stimulants Other More than 1 Class
N=3605 03 74 18 04 33 03 30
N=2250 01 41 13 10 31 03 14
N=5855 02 61 16 06 32 03 24
Overall Drug Positive Nighttime 165 113 145 Negative 835 887 855
ldquoMore than 1 Classrdquo ndash Drivers testing positive for more than one drug are only counted in this category In this table percentages are weighted
When we examined drug classes by time of day and age (Table 33) we found that daytime drivers aged 21-34 were more likely to use marijuana (74) than daytime drivers in other age groups (p lt 01) However drivers aged 16-20 years had the highest marijuana use (98) in the nighttime sample followed by the 21-34 year age group (85) both of which were statistically higher than the other age groups (p lt 01) The prevalence of narcotic-analgesics was highest among daytime drivers aged 44-64 (29) (p lt 01) however in the nighttime sample the 35-44 age group recorded the highest prevalence of narcotic-analgesics (42) (p lt 01)
47
Table 33 Drug Class Distribution by Time of Day and Age (Oral Fluid)
Time of 16-20 21-34 35-44 45-64 65+ Total Day Drug Class
N=99 N=436 N=374 N=668 N=245 N=1822 Antidepressants 09 02 03 08 03 05 Marijuana 44 74 48 17 07 40 Narcotic-Analgesics 00 07 19 29 08 17 Sedatives 07 02 14 23 40 16
Daytime Stimulants 03 22 12 22 01 16 Other 00 00 00 07 00 02 More than 1 Class 00 06 21 26 03 15 Overall Drug Positive
62 112 116 133 64 111 Daytime
Negative 938 888 884 867 936 889 N=961 N=2437 N=1042 N=1216 N=148 N=5804
Antidepressants 03 01 04 01 03 02 Marijuana 98 85 41 11 00 62 Narcotic-Analgesics 11 08 42 14 04 16 Sedatives 00 06 12 07 13 07
Nighttime Stimulants 20 36 28 45 00 33 Other 02 05 02 01 00 03 More than 1 Class 27 29 22 15 00 24 Overall Drug Positive
161 171 152 95 20 146 Nighttime
Negative 839 829 848 905 980 854 ldquoMore than 1 Classrdquo ndash Drivers testing positive for more than one drug are only counted in this category In this table percentages are weighted
2007 National Roadside Survey of Alcohol and Drug Use by Drivers Drug Results
Driver Drug Use Prevalence by Drug Category Based on Oral Fluid Results In this section of the report we display drug use prevalence results from oral fluid tests by drug category The three drug categories were illegal prescription and over-the-counter Because there were very few positive results for over-the-counter drugs the prescription and over-theshycounter categories are combined in these tables into a single category (ldquoMedicationsrdquo) Additionally some respondents tested positive for more than one category of drug Thus tables presenting drug categories present four mutually exclusive categories Illegal Medications Illegal and Medications and Negative So as not to double count individual positive results an individualrsquos result appears in only one of these categories However for example in Table 34 to determine the proportion of daytime drivers who tested positive for illegal drugs one could sum the daytime values for the ldquoIllegalrdquo category (58) and for the rdquo Illegal amp Medicationsrdquo category (05) to arrive at a prevalence estimate of 63 of daytime drivers who were positive for at least one illegal drug Detailed summaries of prevalence estimates for individual drugs appear in Tables 137-140 later in the report
As previously noted drugs may be classified in different ways depending on the use of the classification system For example in NHTSArsquos drug evaluation and classification (DEC)
48
2007 National Roadside Survey of Alcohol and Drug Use by Drivers Drug Results
program the categories CNS Depressants CNS Stimulants Hallucinogens Dissociative Anesthetic (PCP) Narcotic Analgesics Inhalants and Cannabis are used
Comparison of drug categories by time of day (Table 34) reveal that almost 6 percent of daytime drivers tested positive for drugs in the ldquoIllegalrdquo category as opposed to over 10 percent of nighttime drivers This was a statistically significant difference between the two groups (p lt 01) Positive results in the ldquoMedicationsrdquo category although not statistically significant were found to be slightly higher among the daytime drivers (almost 5) than nighttime drivers (3)
Table 34 Drug Categories Distribution by Time of Day (Oral Fluid)
N Time of Day Drug Category (Unweighted) (Weighted)
Daytime
Illegal Medications Illegal amp Medications Negative
125 107 14
1604
58 48 05
890 Overall Daytime 1850 1000
Nighttime
Illegal Medications Illegal amp Medications Negative
575 201 60
5033
105 30 09
856 Overall Nighttime 5869 1000
ldquoMedicationsrdquo includes prescription and over-the-counter drugs
Comparison of drug categories by time of day and region (Table 35) showed that of daytime drivers the South region had the highest percentage of positive results for ldquoIllegalrdquo followed by the West region however these differences were not statistically significant In the nighttime sample the Midwest region had the highest percentage of ldquoIllegalrdquo drug prevalence although this difference was not statistically significant
49
2007 National Roadside Survey of Alcohol and Drug Use by Drivers Drug Results
Table 35 Drug Categories Distribution by Time of Day and Region (Oral Fluid)
N Time Region Drug Category (Unweighted) (Weighted)
Daytime
Midwest
Illegal Medications Illegal amp Medications Negative
38 47 5
456
42 67 05
885 Overall 546 1000
Northeast
Illegal Medications Illegal amp Medications Negative
20 20 2
337
49 75 01
875 Overall 379 1000
South
Illegal Medications Illegal amp Medications Negative
35 22 5
410
82 46 03
869 Overall 472 1000
West
Illegal Medications Illegal amp Medications Negative
32 18 2
401
63 20 07
911 Overall 453 1000
Nighttime
Midwest
Illegal Medications Illegal amp Medications Negative
185 68 14
1427
115 30 04
850 Overall 1694 1000
Northeast
Illegal Medications Illegal amp Medications Negative
112 32 14
953
108 42 23
827 Overall 1111 1000
South
Illegal Medications Illegal amp Medications Negative
131 59 22
1347
102 25 13
860 Overall 1559 1000
West
Illegal Medications Illegal amp Medications Negative Overall
147 42 10
1306 1505
98 26 05
871 1000
ldquoMedicationsrdquo includes prescription and over-the-counter drugs
50
2007 National Roadside Survey of Alcohol and Drug Use by Drivers Drug Results
When examining prevalence by drug category and gender (Table 36) we found that in the daytime sample male drivers were more likely to test positive for ldquoIllegalrdquo drugs (82) than female drivers (30) (p lt 01) Conversely daytime female drivers were more likely to show positive results for ldquoMedicationsrdquo (76) than daytime male drivers (25) (p lt 01) In the nighttime sample 125 percent of male drivers tested positive for ldquoIllegalrdquo drugs as opposed to 75 percent of female drivers (p lt 01) The difference in percentage of positive results for ldquoMedicationsrdquo between male and female drivers was not as striking in the nighttime sample as in the daytime sample and was not statistically significant
Table 36 Drug Categories Distribution by Time of Day and Gender (Oral Fluid)
N Time of Day Gender Drug Category (Unweighted) (Weighted)
Illegal 87 82 Medications 35 25
Daytime
Male Illegal amp Medications Negative
9 901
03 890
Overall 1032 1000 Illegal 38 30 Medications 72 76
Female Illegal amp Medications Negative
5 696
06 887
Overall 811 1000 Illegal 410 125 Medications 106 28
Male Illegal amp Medications Negative
41 3048
11 835
Nighttime Overall 3605 1000 Illegal 164 75 Medications 95 33
Female Illegal amp Medications Negative
19 1972
05 887
Overall 2250 1000 ldquoMedicationsrdquo includes prescription and over-the-counter drugs In this table percentages are weighted
In comparing drug categories by time of day and age (Table 37) it was clear that within the daytime sample ldquoIllegalrdquo drug use was highest for drivers aged 21-34 (99) followed by drivers aged 35-44 (65) The prevalence of ldquoIllegalrdquo drugs for these age groups differed significantly from that in the remaining age groups (p lt 01) In the nighttime sample drivers in the 21-34 year age group still maintained the highest percentage (142) of positive results for ldquoIllegalrdquo drugs however that group was followed by the youngest age group (16-20 years) for ldquoIllegalrdquo drugs (131) (p lt 01) The use of ldquoMedicationsrdquo was highest among the 45-64 year age group (88) in the daytime sample (non-significant) and in the 35-44 year old age group the nighttime sample (69) (p lt 01)
51
2007 National Roadside Survey of Alcohol and Drug Use by Drivers Drug Results
Table 37 Drug Categories Distribution by Time of Day and Age (Oral Fluid)
N Time of Day Age Drug Category (Unweighted) (Weighted)
Daytime
16-20
Illegal
Medications
Illegal amp Medications
Negative
9
2
0
88
46
16
00
938
Overall 99 1000
21-34
Illegal
Medications
Illegal amp Medications
Negative
54
14
4
364
99
12
01
888
Overall 436 1000
35-44
Illegal
Medications
Illegal amp Medications
Negative
25
23
3
323
65
42
10
884
Overall 374 1000
45-64
Illegal
Medications
Illegal amp Medications
Negative
32
51
7
578
39
88
06
867
Overall 668 1000
65+
Illegal
Medications
Illegal amp Medications
Negative
3
17
0
225
08
56
00
936
Overall 245 1000 Nighttime
16-20
Illegal Medications Illegal amp Medications Negative
120 11 12
818
131 16 14
839 Overall 961 1000
21-34
Illegal
Medications
Illegal amp Medications
Negative
308
55
28
2045
142
19
10
829
Overall 2436 1000 35-44 Illegal
Medications Illegal amp Medications Negative
82 57 11
892
76 69 07
848
52
2007 National Roadside Survey of Alcohol and Drug Use by Drivers Drug Results
N Time of Day Age Drug Category (Unweighted) (Weighted)
Overall 1042 1000
45-64
Illegal
Medications
Illegal amp Medications
Negative
64
67
9
1075
57
30
07
905
Overall 1215 1000
65+
Illegal Medications Illegal amp Medications Negative
0 9 0
139
00 20 00
980 Overall 148 1000
ldquoMedicationsrdquo includes prescription and over-the-counter drugs In this table percentages are weighted
Driver Drug Prevalence Based on Oral Fluid and BAC Results The following section presents the results of the oral fluid drug analyses combined with the blood alcohol concentration (BAC) results obtained from breath tests16 Categories for BAC by grams per deciliter (gdL) are indicated as ldquozerordquo (BAC less than 005 gdL) ldquobetween zero and 08rdquo (greater than 005 up to 08 gdL) and ldquo08+rdquo (BAC greater than 08 gdL) Note that the daytime sample consisted of very few drug positive drivers with alcohol positive results which limited the statistical testing that could be done
In comparing the number of drug-positive drivers by time of day and BAC level (Tables 38 and 39) a statistically significant association was found between drug-positive and alcohol-positive drivers within the nighttime driving sample In other words the percentage of nighttime drivers with BAC gdL 08+ was significantly higher among drug-positive drivers than among drug-negative drivers (p lt 01)
The same association was observed with the ldquobetween zero and 08rdquo category among drug-positive nighttime drivers (p lt 01) relative to drug-negative drivers However for daytime drivers no statistical association was found largely because of the small number of alcohol-positive drivers in the daytime sample
Note that because of the small number of alcohol-positive drivers in the daytime sample (n = 23) comparisons involving drug-positive drivers for this group of drivers were not attempted in the remaining portion of this report
16 More complete information on the alcohol results (not including drug results) is available in Lacey et al (2009b)
53
2007 National Roadside Survey of Alcohol and Drug Use by Drivers Drug Results
Table 38 Drug Prevalence by Time of Day and BAC (Percentages Calculated by Row) (Oral Fluid)
BAC (gdL) Time of Drug N Between
Day Result (Unweighted) Zero Zero and 08 08+ Positive 246
Overall Daytime 1845
982 14 03 Daytime Negative 1599 992 06 02
07 02991 Positive 836
Overall Nighttime 5867
805 150 45 Nighttime Negative 5031 902 81 17
91 21888 In this table percentages are weighted
Table 39 Drug Prevalence by Time of Day and BAC (Percentages Calculated by Column) (Oral Fluid)
Time of Day
Drug Result
BAC (gdL)
Zero Between
Zero and 08 08+ All
Daytime Positive Negative
N=1822 109 891
N=18 222 778
N=5 171 829
N=1845 110 890
Nighttime Positive Negative
N=5207 131 869
N=530 239 761
N=130 306 694
N=5867 144 856
In this table ldquoNsrdquo are unweighted and percentages are weighted
Table 40 shows that within the daytime sample drug-positive drivers in the age groups 16-20 and 21-34 had the greatest percentage of alcohol-positive results however it should be noted that the sample size for the youngest group was only 11 Among nighttime drug-positive participants drivers aged 21-34 had the greatest percentage of alcohol positives (in both the categories BAC between zero and 08 and BAC 08+) (p lt 01) As noted earlier the number of years within age categories is not equivalent
54
2007 National Roadside Survey of Alcohol and Drug Use by Drivers Drug Results
Table 40 BAC Among Drug-Positive Drivers by Time of Day and Age (Oral Fluid)
Time of Day Age
N (Unweighted) Zero
BAC (gdL) Between
Zero and 08 08+ 16-2021-34
11 72
897 955
00 45
103 00
Daytime 35-4445-64
65+
51 90 20
992 998
1000
08 02 00
00 00 00
Overall Positive Daytime 244 982 14 03 16-2021-34
143 392
868 750
100 197
32 53
Nighttime 35-4445-64
65+
150 141
9
878 810 836
85 143 164
37 47 00
Overall Positive Nighttime 835 804 150 45 In this table percentages are weighted
Among both daytime and nighttime drivers there were fewer alcohol-positive drivers among drug-positive drivers with 2+ classes of drugs than among those with one class of drug (Tables 41 and 42) however due to the small sample size there was no statistical difference
Table 41 BAC Among Drug-Positive Drivers by Number of Drug Classes and Time of Day (Percentages Calculated by Column) (Oral Fluid)
Time of Day Number of Drug
Classes N
(Unweighted) Zero
BAC (gdL) Between
Zero and 08 08+ 1 206 860 951 1000
Daytime 2+ 40 140 49 00 Overall Daytime 246 1000 1000 1000
1 680 834 816 963 Nighttime 2+ 156 166 184 37
Overall Nighttime 836 1000 1000 1000 In this table percentages are weighted
55
2007 National Roadside Survey of Alcohol and Drug Use by Drivers Drug Results
Table 42 BAC Among Drug-Positive Drivers by Number of Drug Classes and Time of Day (Percentages Calculated by Row) (Oral Fluid)
Time of Day Number of Drug
Classes N
(Unweighted) Zero
BAC (gdL) Between
Zero and 08 08+ 1 206 980 16 04
Daytime 2+ 40 995 05 00 Overall Daytime 246 982 14 03
1 680 801 147 52 Nighttime 2+ 156 820 170 10
Overall Nighttime 836 805 150 45 In this table percentages are weighted
When oral fluid drug category findings were combined with BAC results we found that in both the daytime and nighttime samples the drug-positive drivers who were also alcohol-positive were more likely to be positive for ldquoIllegalrdquo drugs than ldquoMedicationsrdquo (Table 43) This was particularly true in the nighttime sample in which 173 percent had BACs between zero and 08 (compared to 63 in the ldquoMedicationsrdquo category) and 57 percent had BACs greater than 08 (compared to 12 in the ldquoMedicationsrdquo category) (p lt 01) In the daytime sample however the differences were statistically non-significant (p value = 05)
Table 43 BAC Among Drug-Positive Drivers by Drug Category and Time of Day (Oral Fluid)
Time of Day Drug Category
N (Unweighted)
BAC (gdL)
Zero Between
Zero and 08 08+
Daytime Illegal Medications Illegal amp Medications Negative
125 107 14
1604
971 996 983 992
23 04 17 06
06 00 00 02
Nighttime Illegal Medications Illegal amp Medications Negative
575 199 60
5033
770 925 814 902
173 63
177 81
57 12 09 17
ldquoMedicationsrdquo includes prescription and over-the-counter drugs In this table percentages are weighted
Table 44 presents the findings by drug category age and time of day Due to the number of groupings (and thus relatively small sample sizes in included cells) caution should be exercised in the interpretation of the findings especially among the daytime driving sample Overall among the nighttime driving sample the high alcohol-positive drivers (ie drivers registering greater than 08 BAC gdL) tested positive for drugs in the ldquoIllegalrdquo category more frequently than ldquoMedicationsrdquo across all age groups except 65+ (an age group producing a very small sample size for drug positives) Further the same pattern emerged among drivers with BACs
56
2007 National Roadside Survey of Alcohol and Drug Use by Drivers Drug Results
between zero and 08 across all age groups except for the age category 45-64 where a high proportion of drivers tested positive for both ldquoIllegal and Medicationsrdquo
Table 44 BAC of Drivers by Drug Category Age and Time of Day (Oral Fluid)
Time of Day Age Drug Category
N (Unweighted) Zero
BAC (gdL) Between
Zero and 08 08+
Daytime
16-20
Illegal Medications Illegal amp Medications Negative
9 2 0
88
861 1000
NA 993
00 00
NA 07
139 00
NA 00
Overall 99 987 07 06
21-34
Illegal Medications Illegal amp Medications Negative
54 14 4
364
957 932
1000 994
43 68 00 05
00 00 00 01
Overall 436 990 10 01
35-44
Illegal Medications Illegal amp Medications Negative
25 23 3
323
986 1000 1000
991
14 00 00 07
00 00 00 02
Overall 374 991 07 01
45-64
Illegal Medications Illegal amp Medications Negative
32 51 7
578
1000 1000 958 987
00 00 42 09
00 00 00 04
Overall 668 989 08 03
65+
Illegal Medications Illegal amp Medications Negative
3 17
0 225
1000 1000
NA 998
00 00
NA 01
00 00
NA 01
Overall 245 998 01 01 Nighttime
16-20
Illegal Medications Illegal amp Medications Negative
120 11 12
818
839 1000 990 944
121 00 10 51
40 00 00 05
Overall 961 931 59 10
21-34
Illegal Medications Illegal amp Medications Negative
308 55 28
2045
736 809 846 878
204 170 154
98
61 21 00 24
Overall 2436 856 115 29
35-44
Illegal Medications Illegal amp Medications Negative
82 57 11
892
777 985 927 919
159 04 73 67
64 11 00 14
Overall 1042 913 70 17
57
2007 National Roadside Survey of Alcohol and Drug Use by Drivers Drug Results
Time of Day Age Drug Category
N (Unweighted) Zero
BAC (gdL) Between
Zero and 08 08+ Illegal 64 808 126 66
45-64 Medications Illegal amp Medications
67 9
922 333
70 609
08 58
Negative 1075 901 87 13 Overall 1215 892 92 16 Illegal 0 NA NA NA
65+ Medications Illegal amp Medications
9 0
836 NA
164 NA
00 NA
Negative 139 887 66 47 Overall 148 886 68 46
ldquoMedicationsrdquo includes prescription and over-the-counter drugs In this table percentages are weighted
When examining drug category by gender and time of day (Table 45) male drivers who tested positive for ldquoIllegalrdquo drugs in both the daytime and nighttime samples also had greater percentages of alcohol-positive results than their female counterparts However the small sample size precluded valid statistical testing on the daytime sample Within the nighttime sample differences were statistically significant (p lt 01)
Table 45 BAC of Drivers by Drug Category Gender and Time of Day (Oral Fluid)
Time of Day Gender Drug Category
N (Unweighted) Zero
BAC (gdL) Between
Zero and 08 08+
Daytime
Males
Females
Illegal Medications Illegal amp Medications Negative
87 35 9
901
967 985 956 991
25 15 44 08
08 00 00 01
Overall 1032 989 09 02 Illegal Medications Illegal amp Medications Negative
38 72 5
696
984 1000 1000 993
16 00 00 05
00 00 00 03
Overall 811 993 05 02
Nighttime
Males
Illegal Medications Illegal amp Medications Negative
410 106 41
3048
743 960 766 900
180 31 223 79
76 10 11 21
Overall 3605 881 92 27
Females
Illegal Medications Illegal amp Medications Negative
164 95 19
1972
842 875 990 904
152 110 10 83
06 15 00 12
Overall 2250 899 89 12 ldquoMedicationsrdquo includes prescription and over-the-counter drugs In this table percentages are weighted
58
2007 National Roadside Survey of Alcohol and Drug Use by Drivers Drug Results
Drugs Oral Fluid Results and Agreement with Self-Reported Drug Use Table 46 compares the results of the oral fluid analyses with responses to the self-reported drug use questionnaire This questionnaire was administered to all drivers who provided an oral fluid sample and was completed while the oral fluid device was collecting the saliva
The cross tabulation results of self-reported drug use (in the past 24 hours past 2 days past month past year over a year and never) and oral fluid analysis results (by drug category) revealed interesting findings Note that this table only reports on drivers who were drug-positive Agreement between reported past 24-hour use and drug-positive analysis results for the nighttime driving sample was greatest (highest percentage) among antidepressants cough suppressants and pain killers
The lowest correspondence (lowest percentages) was found for amphetamines and barbiturates Interestingly approximately one-quarter of marijuana-positive nighttime drivers admitted to marijuana use in the previous 24 hours this increased to over one-third when combined within the past two days A smaller proportion (75 and 58 respectively) admitted to recent use of cocaine
Among nighttime drivers who tested positive for antidepressants the majority (664) indicated they in fact used the substance in the past 24 hours Thus in this example agreement between self-reports and oral fluid analysis results are fairly high However when we examine amphetamines (typically viewed as a recreational or illegal drug) agreement between self-report and a positive test analysis is low Here about 72 percent of nighttime positive drivers indicated they ldquoneverrdquo had used the substance yet the drug analysis revealed a positive result In some instances this may be related to a reluctance to disclose however in other instances a driver may not have been aware that the substance they were taking contained the drug being reported (for example some drivers may not be aware that some diet pills contain amphetamines) Similar results were obtained for nighttime drivers providing blood samples A table reflecting those results appears in Appendix A
59
2007 National Roadside Survey of Alcohol and Drug Use by Drivers Drug Results
Table 46 Oral Fluid Results and Agreement With Self-Reported by Drug Type (Oral Fluid)
Drug Category Self-Reported
Drug Use
Oral Fluid Positive for that Drug Daytime Nighttime
N (Unwtd)
(Weighted)
N (Unwtd)
(Weighted)
Antidepressants
Past 24 Hours Past 2 Days Past Month Past Year Over a Year Never
13 0 0 1 0 4
857 00 00 47 00 96
18 0 2 0 1 4
664 00 96 00
212 28
Overall 18 1000 25 1000
Amphetamines
Past 24 Hours Past 2 Days Past Month Past Year Over a Year Never
0 0 0 0 1
13
00 00 00 00 32
968
1 0 4 3
10 51
20 00 86 89 88
718 Overall 14 1000 69 1000
Barbiturates
Past 24 Hours Past 2 Days Past Month Past Year Over a Year Never
1 0 1 0 0 4
14 00 08 00 00
978
2 0 0 0 0 8
31 00 00 00 00
969 Overall 6 1000 10 1000
Benzodiazepines
Past 24 Hours Past 2 Days Past Month
Past Year Over a Year Never
11 0 0 0 3
20
158 00 00 00 38
804
14 4 2 0 5
37
244 34 26 00 22
674 Overall 34 1000 62 1000
Cocaine
Past 24 Hours Past 2 Days Past Month Past Year Over a Year Never
1 2 1 0 3
30
04 22 06 00
186 782
10 7
10 17 29
146
75 58 48 68
170 579
Overall 37 1000 219 1000
Cough Suppressants
Past 24 Hours
Past 2 Days
Past Month
Past Year
Over a Year
2
0
0
0
0
945
00
00
00
00
6
2
3
1
1
393
198
129
23
37
Never 1 55 2 220
Overall 3 1000 15 1000
60
2007 National Roadside Survey of Alcohol and Drug Use by Drivers Drug Results
Drug Category Self-Reported
Drug Use
Oral Fluid Positive for that Drug Daytime Nighttime
N (Unwtd)
(Weighted)
N (Unwtd)
(Weighted)
Ketamine
Past 24 hrs Past 2 days Past Month Past Year Over a Year Never
0 0 0 0 0 0
NA NA NA NA NA NA
0 0 0 0 0 1
00 00 00 00 00
1000 Overall 0 NA 1 1000
Marijuana
Past 24 hrs Past 2 days Past Month Past Year Over a Year Never
21 10 15 6
19 28
217 149 152
46 167 267
91 37 55 44 65
134
257 105 114
74 131 321
Overall 99 1000 426 1000
Methadone
Past 24 hrs Past 2 days Past Month Past Year Over a Year Never
1 0 1 0 0 1
966 00 29 00 00 04
6 0 0 0 0 4
298 00 00 00 00
702 Overall 3 1000 10 1000
Opiates
Past 24 hrs Past 2 days Past Month Past Year Over a Year Never
4 2 6 4 2
13
130 37
187 19
116 511
11 7 8
13 17 51
111 45
187 24
157 476
Overall 31 1000 107 1000
Pain Killers
Past 24 hrs Past 2 days Past Month Past Year Over a Year Never
13 5 6 4 2 4
275 129 131 65
309 92
24 11 8 7 7 9
599 129
46 29
138 58
Overall 34 1000 66 1000
PCP
Past 24 hrs Past 2 days Past Month Past Year Over a Year Never
1 0 0 0 0 0
1000 00 00 00 00 00
0 0 1 0 0 1
00 00
229 00 00
771 Overall 1 1000 2 1000
61
2007 National Roadside Survey of Alcohol and Drug Use by Drivers Drug Results
Observed Safety Measures of Daytime and Nighttime Drivers (Oral Fluid) In the 2007 NRS interviewers observed and recorded seat belt use of drivers and helmet use of motorcycle riders Additionally participating drivers were asked if they were acting as designated drivers (ldquoTonightToday are you or have you been a designated driverrdquo) The results of analyses of these variables by alcohol level are discussed in some detail in a previous report summarizing the alcohol results (Lacey et al 2009b) One issue that arose in that analysis was that many respondents appeared to not understand the lsquodesignated driverrsquo question Thus in this report we are not reporting on the designated driver results Additionally since the nighttime results are quite similar whether summarized by oral fluid results or blood results we are presenting these tables on observed seat belt and helmet use only in the oral fluid results section of the body of the report The nighttime blood results are presented in Appendix A
Information on seat belt and helmet use is presented by overall prevalence (daytime and nighttime) drug class (daytime and nighttime) and drug category (daytime and nighttime) in Tables 47-52 respectively
In Table 47 there was no statistically significant association between overall daytime drug prevalence among drivers and seat belt use in the daytime sample
Table 47 Daytime Seat Belt Observation By Drug Prevalence (Oral Fluid)
N (Unweighted)
Drug Negative
(Weighted)
Drug Positive
(Weighted) Driver Seat Belt Observation
Yes 1750 890 110 No 92 862 138
When examining nighttime drug use as measured in oral fluid by observed seat belt use (Table 48) drug prevalence among nighttime drivers was significantly higher among those who did not wear a seat belt than among those who did (p lt 01)
Table 48 Nighttime Seat Belt Observation by Drug Prevalence (Oral Fluid)
N (Unweighted)
Drug Negative
(Weighted)
Drug Positive
(Weighted) Driver Seat Belt Observation
Yes 5654 859 141 No 192 754 246
62
N
(Un
wei
gh
ted
)
An
tid
epre
ssa
nts
(W
eig
hte
d)
Mar
ijuan
a
(Wei
gh
ted
)
Nar
coti
c-A
nal
ge
sic
(W
eig
hte
d)
Sed
ativ
es
(W
eig
hte
d)
Sti
mu
lan
ts
(Wei
gh
ted
)
O
ther
(W
eig
hte
d)
gt1
Dru
g C
lass
(Wei
gh
ted
)
Neg
ativ
e
(Wei
gh
ted
)
Driver Seat Belt Observation Yes 1750 05 37 17 17 17 02 15 890 No 92 08 98 13 04 00 00 15 862
N
(Un
wei
gh
ted
)
An
tid
epre
ssa
nts
(W
eig
hte
d)
Mar
ijuan
a
(Wei
gh
ted
)
Nar
coti
c-A
nal
ge
sic
(W
eig
hte
d)
Sed
ativ
es
(W
eig
hte
d)
Sti
mu
lan
ts
(Wei
gh
ted
)
O
ther
(W
eig
hte
d)
gt1
Dru
g C
lass
(W
eig
hte
d)
Neg
ativ
e
(Wei
gh
ted
) Driver Seat Belt Observation
Yes 5654 No 192
01 23
61 63
16 21
07 00
31 79
03 06
22 53
859 754
2007 National Roadside Survey of Alcohol and Drug Use by Drivers Drug Results
Table 49 shows the daytime distribution of drug classes in oral fluid by observed seat belt use Most of the observed differences in this distribution were not statistically significant The exception was marijuana which was significantly more prevalent among daytime drivers who did not wear a seat belt than among drivers who did (p lt 01)
Table 49 Daytime Seat Belt Observation by Drug Class (Percentages Calculated by Row) (Oral Fluid)
Table 50 shows the nighttime distribution of drug classes by seat belt use Stimulants were significantly more prevalent among those drivers who did not wear a safety belt than those who did (p lt 01)
Table 50 Nighttime Seat Belt Observation by Drug Class (Percentages Calculated by Row) (Oral Fluid)
63
2007 National Roadside Survey of Alcohol and Drug Use by Drivers Drug Results
Table 51 shows the daytime distribution of drug categories by seat belt use Differences in daytime oral fluid drug category results involving seat belt use by the driver were not statistically significant
Table 51 Daytime Seat Belt Observation by Drug Category (Percentages Calculated by Row) (Oral Fluid)
N (Unwtd)
Illegal
(Weighted)
Medications (Weighted)
Illegal amp Medications (Weighted)
Negative
(Weighted) Driver Seat Belt Observation
Yes 1750 56 50 04 890 No 92 103 27 07 862
Table 52 shows the nighttime distribution of drug categories by seat belt use The prevalence of illegal (ldquoIllegalrdquo and ldquoIllegal and Medicationrdquo combined) drugs was higher among those who did not use a seat belt (p lt 01)
Table 52 Nighttime Belt Observation by Drug Category (Percentages Calculated by Row) (Oral Fluid)
N (Unwtd)
Illegal
(Weighted)
Medications (Weighted)
Illegal amp Medications (Weighted)
Negative (Weighted)
Driver Seat Belt Observation Yes 5353 102 30 09 859 No 192 181 50 15 754
The number of motorcyclists sampled in the daytime was very small thus limiting our ability to perform meaningful statistical comparisons However we display daytime and nighttime helmet use (for the operator) by overall drug use prevalence class and category in Tables 53-58 Note there were an extremely low number of motorcycle riders with passengers Thus these are excluded from our tables and our analyses
Table 53 Daytime Helmet Use for Motorcycle Riders (Operators) by Drug Positive (Oral Fluid)
N (Unweighted)
Drug Positive (Weighted)
Motorcycle Riders (Operators) 30 248 Helmet 23 238 No Helmet Use 6 299 Unknown 1 00
Small sample size precluded meaningful statistical comparisons
64
N
(Un
wei
gh
ted
)
An
tid
epre
ssa
nts
(Wei
gh
ted
)
Mar
ijuan
a (W
eig
hte
d)
Nar
coti
c-A
nal
ge
sic
(Wei
gh
ted
)
Sed
ativ
es
(Wei
gh
ted
)
Sti
mu
lan
ts
(Wei
gh
ted
)
Oth
er(W
eig
hte
d)
gt1
Dru
g C
lass
(
Wei
gh
ted
)
Neg
ativ
e (W
eig
hte
d)
Motorcycle Riders (Operators) 30 00 132 00 13 28 00 76 752
Helmet 23 00 169 00 17 36 00 17 762
No Helmet Use 6 00 00 00 00 00 00 299 701
Unknown 1 00 00 00 00 00 00 00 1000
Small sample size precluded meaningful statistical comparisons
N
(Un
wei
gh
ted
)
An
tid
epre
ssa
nts
(Wei
gh
ted
)
Mar
ijuan
a (W
eig
hte
d)
Nar
coti
c-A
nal
ge
sic
(Wei
gh
ted
)
Sed
ativ
es
(Wei
gh
ted
)
Sti
mu
lan
ts
(Wei
gh
ted
)
Oth
er(W
eig
hte
d)
gt1
Dru
g C
lass
(
Wei
gh
ted
)
Neg
ativ
e (W
eig
hte
d)
Motorcycle Riders (Operators) 73 63 45 00 00 83 05 128 676
Helmet 57 10 29 00 00 13 07 87 853
No Helmet Use 14 161 75 00 00 212 00 205 347
Unknown 2 00 00 00 00 00 00 00 1000
2007 National Roadside Survey of Alcohol and Drug Use by Drivers Drug Results
Table 54 shows a statistically significant difference in nighttime drug prevalence as measured in oral fluid among riders with and without helmets Drug prevalence was higher for riders who were not using helmets (p lt 01)
Table 54 Nighttime Helmet Use for Motorcycle Riders (Operators) by Drug Positive (Oral Fluid)
N (Unweighted)
Drug Positive (Weighted)
Motorcycle Riders (Operators) 73 324 Helmet 57 147 No Helmet Use 14 653 Unknown 2 00
Examining daytime and nighttime motorcycle riders by drug class as measured in oral fluid some classes had no positives perhaps due to the small sample size (Tables 55 and 56) thus rendering statistical tests inappropriate
Table 55 Daytime Helmet Use for Motorcycle Riders (Operators) by Drug Class (Oral Fluid)
Table 56 Nighttime Helmet Use for Motorcycle Riders (Operators) by Drug Class (Percentages Calculated by Row) (Oral Fluid)
Small sample size precluded meaningful statistical comparisons
65
2007 National Roadside Survey of Alcohol and Drug Use by Drivers Drug Results
The small sample size encountered when examining daytime motorcycle riders by drug category as measured in oral fluid (Table 57) rendered statistical tests inappropriate
Table 57 Daytime Helmet Use for Motorcycle Riders (Operators) by Drug Category (Oral Fluid)
N (Unwtd)
Illegal
(Weighted)
Medications (Weighted)
Illegal amp Medications (Weighted)
Negative
(Weighted)
Motorcycle Riders (Operators) 30 159 13 76 752 Helmet 23 204 17 17 762 No Helmet Use 6 00 00 299 701 Unknown 1 00 00 00 1000
Small sample size precluded meaningful statistical comparisons
Table 58 shows that overall drug prevalence was higher for riders who were not using a helmet (p lt 01) However no statistically significant difference was observed between riders who consumed ldquoIllegalrdquo and ldquoIllegal and Medicationsrdquo and those who consumed ldquoMedicationsrdquo alone
Table 58 Nighttime Helmet Use for Motorcycle Riders (Operators) by Drug Category (Percentages Calculated by Row) (Oral Fluid)
N (Unwtd)
Illegal
(Weighted)
Medications (Weighted)
Illegal amp Medications (Weighted)
Negative
(Weighted)
Motorcycle Riders (Operators) 73 200 68 56 676 Helmet 57 42 18 87 853 No Helmet Use 14 492 161 00 347 Unknown 2 00 00 00 00
Reported Contact with the Criminal Justice System (Oral Fluid) Of the 1790 daytime NRS participants who provided an oral fluid sample and responded to the question ldquoDuring the past 12 months were you arrested and booked for driving under the influence of alcohol or drugsrdquo about 3 percent indicated ldquoYesrdquo (n = 47 unweighted) Of these almost 29 percent were drug positive (Table 59) The difference between daytime drivers who indicated ldquoYesrdquo to this question and were drug positive is statistically different from those who indicated ldquoNordquo (p lt 01)
Table 59 Arrests and Drug Positives Daytime (Oral Fluid) ldquoDuring the past 12 months were you arrested and booked for driving under the influence of alcohol or drugsrdquo
N (Unweighted)
Drug Positive (Weighted)
Yes 47 289 No 1743 108 Total 1790 113
66
N
(Un
wei
gh
ted
)
An
tid
epre
ssa
nts
(W
eig
hte
d)
Mar
ijuan
a
(Wei
gh
ted
)
Nar
coti
c-A
nal
ge
sic
(W
eig
hte
d)
Sed
ativ
es
(W
eig
hte
d)
Sti
mu
lan
ts
(Wei
gh
ted
)
Oth
er
(Wei
gh
ted
)
gt1
Dru
g C
lass
(W
eig
hte
d)
Neg
ativ
e
(Wei
gh
ted
)
Yes 47 00 207 20 26 24 00 11 711 No 1743 16 36 17 16 16 02 16 892
Total 1790 16 40 17 16 16 02 16 887
2007 National Roadside Survey of Alcohol and Drug Use by Drivers Drug Results
Among the nighttime NRS participants who provided an oral fluid sample and responded to the question ldquoDuring the past 12 months were you arrested and booked for driving under the influence of alcohol or drugsrdquo (Table 60) approximately 4 percent indicated ldquoYesrdquo (n = 234 unweighted) Of these 29 percent were drug positive compared to the 14 percent who were drug positive and indicated ldquoNordquo (p lt 01)
Additionally since the nighttime results are quite similar whether summarized by oral fluid results or blood results we are presenting these tables on contact with the criminal justice system based on nighttime blood results in Appendix A
Table 60 Arrests and Drug Positives Nighttime (Oral Fluid) ldquoDuring the past 12 months were you arrested and booked for driving under the influence of alcohol or drugsrdquo
N (Unweighted)
Drug Positive (Weighted)
Yes 234 291 No 5458 140 Total 5692 145
Of the daytime drivers who were drug positive and responded to the question ldquoDuring the past 12 months were you arrested and booked for driving under the influence of alcohol or drugsrdquo (Table 61) the majority tested positive for marijuana (207)
Table 61 Arrests and Drug Class Daytime (Oral Fluid) ldquoDuring the past 12 months were you arrested and booked for driving under the influence of alcohol or drugsrdquo
Similar to results in the daytime sample the nighttime drivers who were drug positive and responded to the question ldquoDuring the past 12 months were you arrested and booked for driving under the influence of alcohol or drugsrdquo (Table 62) the majority tested positive for marijuana (118)
67
2007 National Roadside Survey of Alcohol and Drug Use by Drivers Drug Results
Table 62 Arrests and Drug Class Nighttime (Oral Fluid) ldquoDuring the past 12 months were you arrested and booked for driving under the influence of alcohol or drugsrdquo
N (Un
wei
gh
ted
)
An
tid
epre
ssa
nts
(Wei
gh
ted
)
Mar
ijuan
a(W
eig
hte
d)
Nar
coti
c-A
nal
ge
sic
(Wei
gh
ted
)
Sed
ativ
es
(Wei
gh
ted
)
Sti
mu
lan
ts
(Wei
gh
ted
)
Oth
er(W
eig
hte
d)
gt1
Dru
g C
lass
(
Wei
gh
ted
)
Neg
ativ
e (W
eig
hte
d)
Yes 234 00 118 02 02 108 00 60 709 No 5458 02 58 17 07 30 03 23 860 Total 5692 02 60 17 07 33 03 24 855
When examining the data by drug category among daytime participants who responded to the question ldquoDuring the past 12 months were you arrested and booked for driving under the influence of alcohol or drugsrdquo (Table 63) more participants tested positive for ldquoIllegalrdquo drugs than any other drug category (233)
Table 63 Arrests and Drug Categories Daytime (Oral Fluid) ldquoDuring the past 12 months were you arrested and booked for driving under the influence of alcohol or drugsrdquo
N (Unwtd)
Illegal
(Weighted)
Medications (Weighted)
Illegal amp Medications (Weighted)
Negative
(Weighted)
Yes 47 233 53 02 711 No 1743 54 49 05 892 Total 1790 59 49 05 887
Among nighttime participants who responded to the question ldquoDuring the past 12 months were you arrested and booked for driving under the influence of alcohol or drugsrdquo (Table 64) more tested positive for ldquoIllegalrdquo drugs than any other drug category (26) Although this was slightly higher than the daytime population the difference was not statistically different
Table 64 Arrests and Drug Categories Nighttime (Oral Fluid) ldquoDuring the past 12 months were you arrested and booked for driving under the influence of alcohol or drugrdquo
N (Unwtd)
Illegal
(Weighted)
Medications (Weighted)
Illegal amp Medications (Weighted)
Negative
(Weighted)
Yes 234 260 13 17 709 No 5458 99 31 09 860 Total 5692 105 31 09 855
68
2007 National Roadside Survey of Alcohol and Drug Use by Drivers Drug Results
Reported Contact with the Health System (Oral Fluid) As indicated in previous reports on the 2007 NRS questions relating to the criminal sanctions for drinking and drug use while driving were added to the survey items as well as questions related to treatment for drug and alcohol use These questions were added to the survey to investigate potential intervention opportunities
As shown in Table 65 less than 1 percent of daytime drivers responded ldquoYesrdquo to the question ldquoDuring the past 12 months did you ever stay at least overnight in an inpatient or residential drug or alcohol treatment programrdquo Of these almost 45 percent were drug positive
Table 65 Past Treatment Program and Drug Positive Daytime (Oral Fluid) ldquoDuring the past 12 months did you ever stay at least overnight in an inpatient or residential drug or alcohol
treatment programrdquo
N (Unweighted)
Drug Positive (Weighted)
Yes 7 447 No 1738 112 Total 1745 112
Among nighttime drivers less than 1 percent responded ldquoYesrdquo to the question ldquoDuring the past 12 months did you ever stay at least overnight in an inpatient or residential drug or alcohol treatment programrdquo (Table 66) Of these 37 percent were drug positive
The response patterns to these questions by nighttime drivers providing blood samples are quite similar to those reported here for nighttime oral fluid and are presented separately in Appendix A
Table 66 Past Treatment Program and Drug Positive Nighttime (Oral Fluid) ldquoDuring the past 12 months did you ever stay at least overnight in an inpatient or residential drug or alcohol
treatment programrdquo
N (Unweighted)
Drug Positive (Weighted)
Yes 51 370 No 5449 145 Total 5500 146
(p lt 01)
Of daytime drivers who responded to the question ldquoHave you ever been admitted to an outpatient drug or alcohol treatment program NOT including meetings like AA or NArdquo17
approximately 25 percent responded ldquoYesrdquo (Table 67) Of these 384 percent were drug positive
17 AA is Alcoholics Anonymous and NA is Narcotics Anonymous
69
2007 National Roadside Survey of Alcohol and Drug Use by Drivers Drug Results
Table 67 Outpatient and Drug Positive Daytime (Oral Fluid) ldquoHave you ever been admitted to an outpatient drug or alcohol treatment program NOT including meetings like AA or NArdquo
N (Unweighted)
Drug Positive (Weighted)
Yes 44 384 No 1754 107 Total 1798 112 (p lt 01)
Of nighttime drivers who responded to the question ldquoHave you ever been admitted to an outpatient drug or alcohol treatment program NOT including meetings like AA or NArdquo approximately 28 percent responded ldquoYesrdquo (Table 68) Of these 36 percent were drug positive
Table 68 Outpatient and Drug Positive Nighttime (Oral Fluid) ldquoHave you ever been admitted to an outpatient drug or alcohol treatment program NOT including meetings like AA or NArdquo
N (Unweighted)
Drug Positive (Weighted)
Yes 159 361 No 5541 141 Total 5700 145
(p lt 01)
Of daytime drivers who responded to the question ldquoDuring the past 12 months have you received treatment for your drug or alcohol use in a self-help group such as Alcoholics Anonymous or Narcotics Anonymousrdquo approximately 1 percent responded ldquoYesrdquo (Table 69) Of these 43 percent were drug positive Of the nighttime drivers who were asked the same question approximately 2 percent responded ldquoYesrdquo (Table 70) and approximately 18 percent of those were drug positive
Table 69 AA or NA and Drug Positives Daytime (Oral Fluid) ldquoDuring the past 12 months have you received treatment for your drug or alcohol use in a self-help group such as Alcoholics
Anonymous or Narcotics Anonymousrdquo
N (Unweighted)
Drug Positive (Weighted)
Yes 17 431 No 1778 109 Total 1795 112
70
N (Un
wei
gh
ted
)
An
tid
epre
ssa
nts
(Wei
gh
ted
)
Mar
ijuan
a(W
eig
hte
d)
Nar
coti
c-A
nal
ge
sic
(Wei
gh
ted
)
Sed
ativ
es
(Wei
gh
ted
)
Sti
mu
lan
ts
(Wei
gh
ted
)
Oth
er(W
eig
hte
d)
gt1
Dru
g C
lass
(
Wei
gh
ted
)
Neg
ativ
e (W
eig
hte
d)
Yes 7 00 203 00 00 00 00245 553 No 1738 05 39 17 17 16 02 16 888 Total 1745 05 39 17 17 16 02 16 888
2007 National Roadside Survey of Alcohol and Drug Use by Drivers Drug Results
Table 70 AA or NA and Drug Positives Nighttime (Oral Fluid) ldquoDuring the past 12 months have you received treatment for your drug or alcohol use in a self-help group such as Alcoholics
Anonymous of Narcotics Anonymousrdquo
N (Unweighted)
Drug Positive (Weighted)
Yes 107 183 No 5587 145 Total 5694 146
Of daytime drivers who responded to the question ldquoDuring the past 12 months did you ever stay at least overnight in an impatient or residential drug or alcohol treatment program for example detox rehab a therapeutic community or a hospitalrdquo less than 5 percent responded ldquoYesrdquo (Table 71) Of these approximately 20 percent tested positive for marijuana and nearly 25 percent tested positive for more than one drug
Table 71 Inpatient and Drug Class Daytime (Oral Fluid) ldquoDuring the past 12 months did you ever stay at least overnight in an impatient or residential drug or alcohol treatment program for
example detox rehab a therapeutic community or a hospitalrdquo
Of the nighttime drivers who were asked the same question approximately 1 percent responded ldquoYesrdquo (Table 72) Of those approximately 14 percent tested positive for marijuana and approximately 12 percent tested positive for more than one drug Although a higher percentage responded ldquoYesrdquo to the marijuana item during the day than at night this difference was not statistically significant
71
N
(Un
wei
gh
ted
)
An
tid
epre
ssa
nts
(W
eig
hte
d)
Mar
ijuan
a
(Wei
gh
ted
)
Nar
coti
c-A
nal
ge
sic
(W
eig
hte
d)
Sed
ativ
es
(W
eig
hte
d)
Sti
mu
lan
ts
(Wei
gh
ted
)
Oth
er
(Wei
gh
ted
)
gt1
Dru
g C
lass
(W
eig
hte
d)
Neg
ativ
e
(Wei
gh
ted
)
Yes 51 00 144 03 14 94 00115 630 No 5449 02 61 16 07 32 03 24 855 Total 5500 02 61 16 07 32 03 24 854
2007 National Roadside Survey of Alcohol and Drug Use by Drivers Drug Results
Table 72 Inpatient and Drug Class Nighttime (Oral Fluid) ldquoDuring the past 12 months did you ever stay at least overnight in an impatient or residential drug or alcohol treatment program for
example detox rehab a therapeutic community or a hospitalrdquo
Of daytime drivers who responded to the question ldquoDuring the past 12 months were you arrested and booked for driving under the influence of alcohol or drugsrdquo less than 5 percent responded ldquoYesrdquo (Table 73)
Table 73 Inpatients and Drug Category Daytime (Oral Fluid) ldquoDuring the past 12 months were you arrested and booked for driving under the influence of alcohol or drugsrdquo
N (Unwtd)
Illegal
(Weighted)
Medications (Weighted)
Illegal amp Medications (Weighted)
Negative
(Weighted)
Yes 7 447 00 00 553 No 1738 57 50 05 888 Total 1745 58 50 05 888
Of these nearly 45 percent tested positive for ldquoIllegalrdquo drugs Of the nighttime drivers who were asked the same question approximately 1 percent responded ldquoYesrdquo (Table 74) and approximately 23 percent of those tested positive for ldquoIllegalrdquo drugs The difference in ldquoIllegalrdquo drug use from daytime to nighttime was not significant
Table 74 Inpatients and Drug Category Nighttime (Oral Fluid) ldquoDuring the past 12 months were you arrested and booked for driving under the influence of alcohol or drugsrdquo
N (Unwtd)
Illegal
(Weighted)
Medications (Weighted)
Illegal amp Medications (Weighted)
Negative
(Weighted)
Yes 51 234 23 113 630 No 5449 106 30 09 855 Total 5500 106 30 10 854
Of daytime drivers who responded to the question ldquoHave you ever been admitted to an outpatient drug or alcohol treatment program NOT including meetings like AA or NArdquo
72
N
(Un
wei
gh
ted
)
An
tid
epre
ssa
nts
(Wei
gh
ted
)
Mar
ijuan
a (W
eig
hte
d)
Nar
coti
c-A
nal
ge
sic
(Wei
gh
ted
)
Sed
ativ
es
(Wei
gh
ted
)
Sti
mu
lan
ts
(Wei
gh
ted
)
Oth
er(W
eig
hte
d)
gt1
Dru
g C
lass
(
Wei
gh
ted
)
Neg
ativ
e (W
eig
hte
d)
Yes 44 34 154 147 00 37 00 11 616 No 1754 04 38 14 17 16 02 16 893 Total 1798 04 40 17 16 16 02 16 888
N
(Un
wei
gh
ted
)
An
tid
epre
ssa
nts
(Wei
gh
ted
)
Mar
ijuan
a (W
eig
hte
d)
Nar
coti
c-A
nal
ge
sic
(Wei
gh
ted
)
Sed
ativ
es
(Wei
gh
ted
)
Sti
mu
lan
ts
(Wei
gh
ted
)
Oth
er(W
eig
hte
d)
gt1
Dru
g C
lass
(
Wei
gh
ted
)
Neg
ativ
e (W
eig
hte
d)
Yes 159 16 101 65 17 138 00 23 639 No 5541 02 60 16 06 30 03 24 859 Total 5700 02 60 17 07 32 03 24 855
2007 National Roadside Survey of Alcohol and Drug Use by Drivers Drug Results
approximately 25 percent responded ldquoYesrdquo (Table 75) Of these the most prevalent drug was marijuana (154) Additionally nearly 15 percent tested positive for narcotic-analgesics
Table 75 Outpatient and Drug Class Daytime (Oral Fluid) ldquoHave you ever been admitted to an outpatient drug or alcohol treatment program NOT including meetings like AA or NArdquo
Of the nighttime drivers who were asked the same question nearly 3 percent responded ldquoYesrdquo (Table 76) and nearly 14 percent tested positive for stimulants which was more than any other drug category Approximately 10 percent of those tested positive for marijuana which was more than the daytime percentage however this difference was not statistically significant
Table 76 Outpatient and Drug Class Nighttime (Oral Fluid) ldquoHave you ever been admitted to an outpatient drug or alcohol treatment program NOT including meetings like AA or NArdquo
Of daytime drivers who responded to the question ldquoHave you ever been admitted to an outpatient drug or alcohol treatment program NOT including meetings like AA or NArdquo approximately 25 percent responded ldquoYesrdquo (Table 77) Of these approximately 38 percent were drug positive with nearly 20 percent testing positive for ldquoIllegalrdquo drugs
73
N
(Un
wei
gh
ted
)
An
tid
epre
ssa
nts
(W
eig
hte
d)
Mar
ijuan
a
(Wei
gh
ted
)
Nar
coti
c-A
nal
ge
sic
(W
eig
hte
d)
Sed
ativ
es
(W
eig
hte
d)
Sti
mu
lan
ts
(Wei
gh
ted
)
Oth
er
(Wei
gh
ted
)
gt1
Dru
g C
lass
(W
eig
hte
d)
Neg
ativ
e
(Wei
gh
ted
)
Yes 17 21 177 233 00 00 00 00 569 No 1778 04 39 15 17 16 02 16 891 Total 1795 04 40 17 16 16 02 16 888
2007 National Roadside Survey of Alcohol and Drug Use by Drivers Drug Results
Table 77 Outpatient and Categories Daytime (Oral Fluid) ldquoHave you ever been admitted to an outpatient drug or alcohol treatment program NOT including meetings like AA or NArdquo
N (Unwtd)
Illegal
(Weighted)
Medications (Weighted)
Illegal amp Medications (Weighted)
Negative
(Weighted)
Yes 44 199 181 04 616 No 1754 56 46 05 893 Total 1798 59 49 05 888
Of the nighttime drivers who were asked the same question nearly 3 percent responded ldquoYesrdquo (Table 78) and approximately 36 percent of those were drug positive with nearly 25 percent testing positive for ldquoIllegalrdquo drugs Although that percentage was higher for nighttime drivers than for daytime drivers there was no statistical difference in the number of people testing positive for ldquoIllegalrdquo drugs between daytime and nighttime
Table 78 Outpatient and Categories Nighttime (Oral Fluid) ldquoHave you ever been admitted to an outpatient drug or alcohol treatment program NOT including meetings like AA or NArdquo
N (Unwtd)
Illegal
(Weighted)
Medications (Weighted)
Illegal amp Medications (Weighted)
Negative
(Weighted)
Yes 159 249 100 12 639 No 5541 103 29 09 859 Total 5700 105 31 09 855
Of daytime drivers who responded to the question ldquoDuring the past 12 months have you received treatment for your drug or alcohol use in a self-help group such as AA or NArdquo approximately 1 percent responded ldquoYesrdquo (Table 79) Of these the most prevalent drug class was narcotic-analgesic (233)
Table 79 AA NA and Classes Daytime (Oral Fluid) ldquoDuring the past 12 months have you received treatment for your drug or alcohol use in a self-help group such as AA or NArdquo
74
N
(Un
wei
gh
ted
)
An
tid
epre
ssa
nts
(W
eig
hte
d)
Mar
ijuan
a
(Wei
gh
ted
)
Nar
coti
c-A
nal
ge
sic
(W
eig
hte
d)
Sed
ativ
es
(W
eig
hte
d)
Sti
mu
lan
ts
(Wei
gh
ted
)
Oth
er
(Wei
gh
ted
)
gt1
Dru
g C
lass
(W
eig
hte
d)
Neg
ativ
e
(Wei
gh
ted
)
Yes 107 04 53 04 05 95 00 22 817 No 5587 02 61 17 07 31 03 24 855 Total 5694 02 61 17 07 32 03 24 854
2007 National Roadside Survey of Alcohol and Drug Use by Drivers Drug Results
Of the nighttime drivers who were asked the same question nearly 2 percent responded ldquoYesrdquo (Table 80) and nearly 10 percent tested positive for stimulants which was more than any other drug category Approximately 5 percent of those tested positive for marijuana which was less than the daytime percentage of 18 percent however this difference was not statistically significant
Table 80 AA NA and Classes Nighttime (Oral Fluid) ldquoDuring the past 12 months have you received treatment for your drug or alcohol use in a self-help group such as AA or NArdquo
Of daytime drivers who responded to the question ldquoDuring the past 12 months have you received treatment for your drug or alcohol use in a self-help group such as AA or NArdquo approximately 1 percent responded ldquoYesrdquo (Table 81) Of these slightly more than 25 percent tested positive for ldquoMedicationsrdquo and nearly 18 percent tested positive for ldquoIllegalrdquo drugs
Table 81 NA AA and Drug Categories Daytime (Oral Fluid) ldquoDuring the past 12 months have you received treatment for your drug or alcohol use in a self-help group such as AA or NArdquo
N (Unwtd)
Illegal
(Weighted)
Medications (Weighted)
Illegal amp Medications (Weighted)
Negative
(Weighted)
Yes 17 177 254 00 569 No 1778 58 47 05 891 Total 1795 59 49 05 888
Of the nighttime drivers who were asked the same question nearly 2 percent responded ldquoYesrdquo (Table 82) and nearly 15 percent tested positive for ldquoIllegalrdquo drugs Although a greater percentage tested positive for ldquoIllegalrdquo drugs during the day than at night this difference was not statistically significant
75
2007 National Roadside Survey of Alcohol and Drug Use by Drivers Drug Results
Table 82 NA AA and Drug Categories Nighttime (Oral Fluid) ldquoDuring the past 12 months have you received treatment for your drug or alcohol use in a self-help group such as AA or NArdquo
N (Unwtd)
Illegal
(Weighted)
Medications (Weighted)
Illegal amp Medications (Weighted)
Negative
(Weighted)
Yes 107 149 30 04 817 No 5587 105 31 09 855 Total 5694 106 31 09 854
Blood Results (Nighttime Samples) Driver Drug Use Prevalence Based on Blood Results This section of the report presents the overall results of blood analyses for all of the drugs indicated in the introductory section of this report Blood samples were collected in addition to oral fluid samples because typically blood analyses are considered the ldquogold standard rdquoand is the more established technique for gathering information on drugs and their metabolites as oral fluid analyses are a more recently developed technique As expected the results between the oral fluid and blood results are very similar These blood results are presented to provide more complete results from our data analyses for those who are interested in seeing the results from both approaches
If a driver tested positive for one or more of the drugs for which we tested in blood she was categorized as drug positive Note that blood samples were only collected in the nighttime and that more drivers provided oral fluid samples than blood samples
About 14 percent of the 3276 nighttime drivers who provided blood samples were drug-positive (Table 83)
Table 83 Drug Prevalence by Time of Day (Blood)
Time of Day N
(Unweighted) Drug Positive
(Weighted) Daytime NA NA Nighttime 3276 138
NA = ldquoNot Applicablerdquo
Comparison of drug prevalence by session (Table 84) revealed that late-night (Sessions 3 and 5) drivers were significantly more likely to be drug-positive (179 and 168 respectively) as opposed to the earlier nighttime (Sessions 2 and 4) drivers (136 and 111 respectively) (p lt 01)
76
2007 National Roadside Survey of Alcohol and Drug Use by Drivers Drug Results
Table 84 Drug Prevalence by Session (Blood)
N Drug Positive Session (Unweighted) (Weighted)
2 Friday 10 pm ndash Midnight 857 136
3 Friday 1 am ndash 3 am 743 179
4 Saturday 10 pm ndash Midnight 986 111
5 Saturday 1 am ndash 3 am 690 168
Although the Northeast region had the greatest percentage of drug-positive findings in the nighttime driving sample (Table 85) such differences were not statistically significant Thus no clear pattern of drug prevalence by region emerged from the blood sample results
Table 85 Drug Prevalence by Region (Blood)
N Drug Positive Region (Unweighted) (Weighted)
Midwest 971 140 Northeast 584 145 South 862 134 West 859 135 Overall 3276 138
Comparison of blood samples by gender (Table 86) revealed that male drivers were more likely to be drug-positive (145) than female drivers (130) however such differences were not statistically significant
Table 86 Drug Prevalence by Gender (Blood)
Gender N
(Unweighted) Drug Positive
(Weighted) Males 1992 145 Females 1278 130 Overall 3270 139
When examining drug prevalence by age the prevalence of drug-positives was higher among young drivers (Table 87) Drivers aged 16-20 years showed a significantly higher prevalence than drivers aged 21-34 years and drivers aged 35-44 years (p lt 01) Drivers aged 35-44 45-64 and 65+ were significantly less likely to be drug positive than drivers in the combined age range of 16 to 34 years old (p lt 01)
77
2007 National Roadside Survey of Alcohol and Drug Use by Drivers Drug Results
Table 87 Drug Prevalence by Age (Blood)
N Drug Positive Age (Unweighted) (Weighted)
16-20 459 205 21-34 1372 152 35-44 625 107 45-64 697 112
65+ 91 60 Overall 3244 140
Comparisons between gender within age group (Table 88) showed that drug prevalence among male drivers ages 16-20 was significantly higher than female drivers ages 16-20 (p lt 01) Further drug prevalence among male drivers aged 21-34 was also significantly higher than the same-aged female counterparts (p lt 05)Among drivers aged 45-64 however drug prevalence was higher in females than in males (p lt 01)
Table 88 Drug Prevalence by Age and Gender (Blood)
N Drug Positive Gender Age (Unweighted) (Weighted)
Males
16-20 21-34 35-44 45-64
65+
301 825 368 413
61
228 169 112
83 60
Overall Males 1968 146
Females
16-20 21-34 35-44 45-64
65+
158 547 254 283
30
165 122 105 167
58 Overall Females 1272 130
Comparing drug prevalence between raceethnicity (Table 89) Asian drivers were significantly less likely to be drug positive (13) than drivers who identified themselves as African American Hispanic White or Other (p lt 01)
Table 89 Drug Prevalence by RaceEthnicity (Blood)
N Drug Positive RaceEthnicity (Unweighted) (Weighted)
African American 569 168 Asian 87 13 Hispanic 585 100 White 1836 155 Other 165 197 Overall 3242 140
RaceEthnic groups other than ldquoHispanicrdquo are always ldquonon-Hispanicrdquo
78
2007 National Roadside Survey of Alcohol and Drug Use by Drivers Drug Results
Looking at drug prevalence by education level (Table 90) drivers who identified themselves as college graduates or having some college experience were significantly less likely to be drug-positive (p lt 01) than drivers with other educational attainment
Table 90 Drug Prevalence by Education Level (Blood)
N Drug Positive Education Level (Unweighted) (Weighted)
Not a High School Graduate 289 203 High School Graduate 831 165 Some College 1318 125 College Graduate 594 108 Some Graduate Work 212 135 Overall Nighttime 3245 140
When examining drug prevalence by employment status (Table 91) drivers on disability showed drug prevalence that was significantly higher than employed drivers as well as homemakers students unemployed drivers and drivers who reported that they were retired (p lt 01) No statistical difference in drug prevalence was found between employed and unemployed drivers (p value = 06) ldquoRetiredrdquo drivers had significantly lower drug prevalence than employed drivers (p lt 05)
Table 91 Drug Prevalence by Employment Status (Blood)
N Drug Positive Gender (Unweighted) (Weighted)
EmployedSelf Employed 2592 136 Homemaker 67 120 Student 274 153 Unemployed 121 204 Retired 124 60 On Disability 47 414 Other 20 156 Overall 3245 140
79
2007 National Roadside Survey of Alcohol and Drug Use by Drivers Drug Results
Comparisons across vehicle type (Table 92) showed drug prevalence rates among drivers of passenger vehicles SUV and vanminivans were not statistically different (p value = 12) Note however that motorcyclists had the greatest percentage of drug-positive results (p lt 05) while pickup drivers had the smallest prevalence (p lt 05)
Table 92 Drug Prevalence by Vehicle Type (Blood)
N Drug Positive Vehicle Type (Unweighted) (Weighted)
Passenger Vehicle 1971 146 Pickup 401 93 SUV 586 116 Van amp Minivan 250 162 Motorcycle 48 240 Overall 3256 139
Driver Drug Use Prevalence by Drug Class Based on Blood Results In this section of the report we display driver drug use prevalence by class of drug based on blood results The classes of drugs tested for were antidepressants marijuana narcotic-analgesics sedatives stimulants and other (see Tables 94-96)
Drug Class
Two percent of the blood-sampled drivers tested positive for more than one drug class (Table 93)
Table 93 Number and Distribution of Drug Classes (Blood)
Number of N Drug Classes (Unweighted) (Weighted)
1 398 118 2+ 68 20 Negative 2810 862 Overall 3276 1000
80
2007 National Roadside Survey of Alcohol and Drug Use by Drivers Drug Results
In comparing prevalence of drug classes by region (Table 94) marijuana was the most common drug class across all of the regions (67) However drivers in the West region were less likely to test positive for marijuana than in the other regions (p lt 05)
Table 94 Drug Classes Distribution by Region (Blood)
Midwest Northeast South West All Drug Class
N=971 N=584 N=862 N=859 N=3276 Antidepressants 07 04 13 15 11 Marijuana 79 95 60 47 67 Narcotic-Analgesics 11 04 14 08 09 Sedatives 09 04 16 14 11 Stimulants 21 10 15 22 19 Other 00 00 02 05 02 More than 1 Class 13 29 13 24 20 Overall Drug Positive 140 145 134 135 138 Negative 860 855 866 865 862
ldquoMore than 1 Classrdquo ndash Drivers testing positive for more than one drug are only counted in this category In this table percentages are weighted
Comparison of drug class by gender (Table 95) revealed that male drivers were significantly more likely to test positive for marijuana than female drivers (74 males versus 56 females) (p lt 05)
Table 95 Drug Classes Distribution by Gender (Blood)
Males Females Total Drug Class
N=1992 N=1278 N=3270 Antidepressants 10 12 11 Marijuana 74 56 67 Narcotic-Analgesics 08 10 09 Sedatives 07 18 11 Stimulants 18 20 19 Other 04 00 02 More than 1 Class 24 14 20 Overall Drug Positive 145 130 139 Negative 855 870 861
In this table percentages are weighted ldquoMore than 1 Classrdquo ndash Drivers testing positive for more than one drug are only counted in this category
81
2007 National Roadside Survey of Alcohol and Drug Use by Drivers Drug Results
Comparison of drug class by age (Table 96) showed that drivers 34 or younger were more likely to test positive for marijuana than drives in other age groups (p lt 01) Among drivers aged 16shy34 drivers aged 16-20 years had the highest marijuana positives (152) The prevalence of narcotic-analgesics was higher among the 16-20 and 35-44 year age group (13 and 17) than among any other age group (p lt 01)
Table 96 Drug Classes Distribution by Age (Blood)
16-20 21-34 35-44 45-64 65+ Total Drug Class
N=459 N=1372 N=625 N=697 N=91 N=3244 Antidepressants 03 06 09 28 10 11 Marijuana 152 88 31 10 00 68 Narcotic-Analgesics 13 07 17 04 00 09 Sedatives 00 08 10 21 48 11 Stimulants 07 18 20 27 00 18 Other 02 04 02 00 00 02 More than 1 Class 27 19 18 23 01 20 Overall Drug Positive 205 152 107 112 60 140 Negative 795 848 893 888 940 860
ldquoMore than 1 Classrdquo ndash Drivers testing positive for more than one drug are only counted in this category In this table percentages are weighted
Driver Drug Use Prevalence by Drug Category Based on Blood Results In this section of the report we display drug use prevalence results from blood tests by drug category
About 9 percent of the nighttime drivers providing blood tested positive for drugs in the ldquoIllegalrdquo category (Table 97) Four percent were positive for ldquoMedicationsrdquo and 07 percent were positive for both ldquoIllegal and Medicationsrdquo
Table 97 Drug Categories Distribution (Blood)
N Drug Category (Unweighted) (Weighted)
Illegal 267 91 Medications 169 40 Illegal amp Medications 30 07 Negative 2810 862 Overall 3276 1000
ldquoMedicationsrdquo includes prescription and over-the-counter drugs
82
Table 98 Drug Categories Distribution by Region (Blood)
Region Drug Category N
(Unweighted)
(Weighted)
Midwest
Illegal Medications Illegal amp Medications Negative
81 52 8
830
102 32 06
860 Overall 971 1000
Northeast
Illegal Medications Illegal amp Medications Negative
57 26 4
497
110 27 08
855 Overall 584 1000
South
Illegal Medications Illegal amp Medications Negative
56 51 12
743
76 49 09
866 Overall 862 1000
West
Illegal Medications Illegal amp Medications Negative
73 40 6
740
82 49 05
865 Overall 859 1000
ldquoMedicationsrdquo includes prescription and over-the-counter drugs
2007 National Roadside Survey of Alcohol and Drug Use by Drivers Drug Results
The percentage of ldquoIllegalrdquo drug prevalence was slightly higher (p lt 05) in the Midwest and Northeast than in the remaining regions (Table 98)
When examining prevalence by drug category and gender (Table 99) we found that over 10 percent of male drivers had positive results for ldquoIllegalrdquo drugs as did about 7 percent of female drivers (p lt 01) The difference in percentage of positive results for ldquoMedicationsrdquo between male and female drivers was not statistically significant
83
2007 National Roadside Survey of Alcohol and Drug Use by Drivers Drug Results
Table 99 Drug Categories Distribution by Gender (Blood)
N Gender Drug Category (Unweighted) (Weighted)
Male
Illegal Medications Illegal amp Medications Negative
191 75 19
1707
104 33 08
855 Overall 1992 1000
Female
Illegal Medications Illegal amp Medications Negative
76 94 11
1097
72 54 04
870 Overall 1278 1000
ldquoMedicationsrdquo includes prescription and over-the-counter drugs
Examining drug use by age (Table 100) ldquoIllegalrdquo drug use was highest for drivers in the youngest age group (16-20 years) (p lt 01) followed by drivers aged 21-34 ldquoIllegalrdquo drug use among drivers 35 and older was significantly lower than among drivers younger than age 35 (p lt 01) ldquoMedicationrdquo usage followed the opposite trend with prevalence increasing with age Prevalence of ldquoMedicationrdquo was significantly higher for drivers aged 35 and older than for drivers younger than age 35 (p lt 01)
84
2007 National Roadside Survey of Alcohol and Drug Use by Drivers Drug Results
Table 100 Drug Categories Distribution by Age (Blood)
N Age Drug Category (Unweighted) (Weighted)
16-20
Illegal Medications Illegal amp Medications Negative
56 8 4
391
177 19 09
795 Overall 459 1000
21-34
Illegal Medications Illegal amp Medications Negative
141 48 13
1170
117 27 07
848 Overall 1372 1000
35-44
Illegal Medications Illegal amp Medications Negative
43 43 7
532
53 50 04
893 Overall 625 1000
45-64
Illegal Medications Illegal amp Medications Negative
26 61 6
604
31 73 08
888 Overall 697 1000
65+
Illegal Medications Illegal amp Medications Negative
0 9 0
82
00 60 00
940 Overall 91 1000
ldquoMedicationsrdquo includes prescription and over-the-counter drugs
Driver Drug Use Prevalence from Blood and BAC Results The following section presents the results of the blood drug analyses combined with the BAC results from breath tests
The numbers of drug-positive drivers by BAC level are shown in Tables 101 and 102 Table 101 shows BAC level with respect to the total number of drivers in each drug result category (positives negatives and overall) Table 102 shows drug prevalence with respect to the total number of drivers in each of the three BAC categories A statistically significant association was found between drug-positive and alcohol-positive drivers The percentage of drivers with BAC gdL 08+ was significantly higher among drug-positive drivers than among drug-negative drivers (p lt 01) The percentage of drivers with a BAC between zero and 08 was also significantly higher for drug-positive drivers (p lt 01)
85
2007 National Roadside Survey of Alcohol and Drug Use by Drivers Drug Results
Table 101 Drug Prevalence by BAC (Percentages Calculated by Row) (Blood)
BAC (gdL) Drug N Between
Result (Unweighted) Zero Zero and 08 08+ Positive 466 783 160 57 Negative 2810 937 52 11 Overall 3276 916 67 17
In this table percentages are weighted
Table 102 Drug Prevalence by BAC (Percentages Calculated by Column) (Blood)
BAC (gdL) Drug Between
Result Zero Zero and 08 08+ All N=2984 N=241 N=51 N=3276
Positive 118 332 453 138 Negative 882 668 547 862
In this table percentages are weighted
Examining BAC among drug-positive drivers by age (Table 103) a large percentage of alcohol-positives were found in drug-positive drivers aged 16-20 and 21-34 (p lt 01) Drivers aged 65 and older had the largest percentage of drivers at intermediate BAC (ie between zero and 08) however the sample size of this category was quite small
Table 103 BAC Among Drug-Positive Drivers by Age (Blood)
BAC (gdL) N Between Zero
Age (Unweighted) Zero and 08 08+ 16-2021-3435-4445-6465+
68 202
93 93
9
737 733 847 955 599
212 187
94 45
401
51 80 59 00 00
Overall Positive 465 786 158 57 In this table percentages are weighted
There were fewer alcohol-positive drivers among drug-positive drivers with 2+ classes of drugs than those with one class (Tables 104 and 105) however due to the small sample size this difference was statistically non-significant
86
2007 National Roadside Survey of Alcohol and Drug Use by Drivers Drug Results
Table 104 BAC Among Drug-Positive Drivers by Number of Drug Classes (Percentages Calculated by Column) (Blood)
BAC (gdL) No of Drug
Classes Zero Between
Zero and 08 08+ N=386 N=62 N=18
1 840 881 995 2+ 160 119 05
Overall 1000 1000 1000 In this table percentages are weighted
Table 105 BAC Among Drug-Positive Drivers by Number of Drug Classes (Percentages Calculated by Row) (Blood)
BAC (gdL) Number of N Between
Drug Classes (Unweighted) Zero Zero and 08 08+ 1 2+
398 68
769 867
165 131
66 02
Overall 466 783 160 57 In this table percentages are weighted
The majority of drug-positive drivers who were also alcohol-positive tested positive more often were positive for ldquoIllegalrdquo drugs (Tables 106 and 107) More than 90 percent of those drivers having a BAC between zero and 08 tested positive for ldquoIllegalrdquo drugs (either alone or in conjunction with ldquoMedicationsrdquo) This percentage was significantly higher than the approximately 65 percent of non-drinking (BAC = zero) drug-positive drivers who also had an ldquoIllegalrdquo drug in their system (alone or combined with ldquoMedicationsrdquo) (p lt 01)
Table 106 BAC Among Drug-Positive Drivers by Drug Category (Percentage by Row) (Blood)
BAC (gdL) N Between
Drug Category (Unweighted) Zero Zero and 08 08+ Illegal 267 717 204 79 Medications 169 936 49 15 Illegal amp Medications 30 768 232 00
ldquoMedicationsrdquo includes prescription and over-the-counter drugs In this table percentages are weighted
87
2007 National Roadside Survey of Alcohol and Drug Use by Drivers Drug Results
Table 107 BAC Among Drug-Positive Drivers by Drug Category (Percentage by Column) (Blood)
BAC (gdL) Between Zero
Drug Category Zero and 08 08+ N=386 N=62 N=18
Illegal 605 842 925 Medications 349 90 75 Illegal amp Medications 46 68 00
ldquoMedicationsrdquo includes prescription and over-the-counter drugs In this table percentages are weighted
High alcohol-positive drivers (ie drivers with a 08 BAC gdL or greater) who tested positive for ldquoIllegalrdquo drugs were more likely to be age 44 or younger (p lt 01) The sample size was very small for drivers aged 45 or older in particular those aged 65 or older (Note that due to the number of groupings in Table 108 and the small sample sizes caution should be exercised in interpretation of these findings)
Table 108 BAC of Drivers by Drug Category and Age (Blood)
BAC (gdL) N Between
Age Drug Category (Unweighted) Zero Zero and 08 08+
16-20
Illegal Medications Illegal amp Medications Negative
56 8 4
391
698 1000 956 978
243 00 44 19
59 00 00 03
Overall 459 929 59 13
21-34
Illegal Medications Illegal amp Medications Negative
141 48 13
1170
693 963 490 917
209 10
510 70
97 27 00 13
Overall 1372 889 87 23
35-44
Illegal Medications Illegal amp Medications Negative
43 43 7
532
781 906
1000 956
126 66 00 34
93 28 00 10
Overall 625 944 41 15
45-64
Illegal Medications Illegal amp Medications Negative
26 61 6
604
918 966
1000 925
82 34 00 60
00 00 00 15
Overall 697 928 58 13
65+
Illegal Medications Illegal amp Medications Negative
0 9 0
82
NA 599
NA 953
NA 401
NA 47
NA 00
NA 00
Overall 91 932 68 00 ldquoMedicationsrdquo includes prescription and over-the-counter drugs NA = ldquoNot Applicablerdquo In this table percentages are weighted
88
Gender Drug Category N
(Unweighted)
BAC (gdL)
Zero Between Zero
and 08 08+ Illegal 191 721 174 106Medications 75 905 84 11
Males Illegal amp Medications 19 708 292 00 Negative 1707 929 58 13Overall 1992 905 73 22 Illegal 76 707 278 15Medications 94 968 14 18
Females Illegal amp Medications 11 961 39 00 Negative 1097 950 42 08Overall 1278 933 57 09
2007 National Roadside Survey of Alcohol and Drug Use by Drivers Drug Results
Male drivers who tested positive for ldquoIllegalrdquo drugs (Table 109) had statistically greater percentages of alcohol-positive results than their female counterparts (p lt 05)
Table 109 BAC of Drivers by Drug Category and Gender (Blood)
ldquoMedicationsrdquo includes prescription and over-the-counter drugs In this table percentages are weighted
Oral Fluid andor Blood Results (Nighttime Samples) Driver Drug Use Prevalence Based on Oral Fluid andor Blood Results This section of the report presents the joint results of oral fluid and blood analyses for all of the drugs indicated in the introductory section (see Tables 17 and 18) for nighttime drivers As noted earlier blood was only obtained from nighttime drivers The tables in this section are based on the 5910 nighttime drivers from whom an oral fluid andor a blood sample was obtained and analyzed If a driver tested positive for one or more of the drugs in either the oral fluid andor in the blood analyses heshe was categorized as drug-positive Thus this section provides the most comprehensive nighttime drug prevalence estimates available using the biological specimens obtained in this study Again these are overall drug prevalence estimates including illegal prescription and over-the-counter drugs or their metabolites and do not necessarily imply impairment Within individual tables overall counts may not total 5910 because of missing values on some variables
When we examine the test results from nighttime drivers providing oral fluid andor blood 163 percent of drivers were drug-positive as indicated in Table 110
89
2007 National Roadside Survey of Alcohol and Drug Use by Drivers Drug Results
Table 110 Nighttime Drug Prevalence by Time of Day (Oral Fluid andor Blood)
N Drug Positive Time of Day (Unweighted) (Weighted)
Daytime NA NA Nighttime 5910 163
When we examined drug prevalence by time of day (Table 111) we found that late-night (Sessions 3 and 5) drivers were significantly more likely to be drug positive (191 and 183 respectively) than Friday and Saturday earlier in the night (Sessions 2 and 4) drivers (154 and 152 respectively) (p lt 01)
Table 111 Drug Prevalence by Session (Oral Fluid andor Blood)
N Drug Positive Session (Unweighted) (Weighted)
2 Friday 1000 pm ndash Midnight 1618 154
3 Friday 100 am ndash 300 am 1313 191
4 Saturday 1000 pm ndash Midnight 1695 152
5 Saturday 100 am ndash 300 am 1284 183 Overall 5910 163
Comparison of drug prevalence by region (Table 112) showed that the Northeast region had the greatest percentage of drug-positive findings at 183 percent However this difference was not statistically significant Thus no clear pattern by region emerged
Table 112 Drug Prevalence by Region (Oral Fluid andor Blood)
N Drug Positive Region (Unweighted) (Weighted)
Midwest 1708 169 Northeast 1119 183 South 1566 163 West 1517 150 Overall 5910 163
Examining drug prevalence by gender (Table 113) revealed that male drivers were significantly more likely to be drug-positive than female drivers (180 male versus 138 female) (p lt 01)
90
2007 National Roadside Survey of Alcohol and Drug Use by Drivers Drug Results
Table 113 Drug Prevalence by Gender (Oral Fluid andor Blood)
Gender N
(Unweighted) Drug Positive
(Weighted) Males 3634 180 Females 2262 138 Overall 5896 164
Comparison of drug prevalence by age (Table 114) indicated that drivers aged 16-44 showed statistically similar drug prevalence (ie no statistical difference among these age groups) Conversely drivers aged 45-64 and 65+ were significantly less likely to be drug-positive than drivers aged 16-44 (p lt 01)
Table 114 Drug Prevalence by Age (Oral Fluid andor Blood)
Age N
(Unweighted) Drug Positive
(Weighted) 16-20 974 188 21-34 2451 182 35-44 1046 170 45-64 1225 121 65+ 148 40 Overall Nighttime 5844 165
When examining drug prevalence by age and gender (Table 115) we found that drug prevalence among male drivers in the age categories 16-20 and 21-34 years was significantly higher than their same-aged female counterparts (p lt 01) Drug prevalence among male drivers in the age category 35-44 years was also significantly higher than their same-aged female counterparts (p lt 05) However drug prevalence among female drivers aged 45-64 (154) was significantly higher than male drivers of the same age group (100) (p lt 01)
91
2007 National Roadside Survey of Alcohol and Drug Use by Drivers Drug Results
Table 115 Drug Prevalence by Age and Gender (Oral Fluid andor Blood)
N Drug Positive Gender Age (Unweighted) (Weighted)
Males
16-20 21-34 35-44 45-64 65+
605 1502
634 741 101
221 211 194 100
40 Overall Males 3583 182
Females
16-20 21-34 35-44 45-64 65+
368 944 409 482
47
140 135 137 154
42 Overall Females 2250 138
Table 116 shows drug prevalence by raceethnicity Drivers who identified themselves as Asian were significantly less likely to be drug positive (19) than drivers who identified themselves as African American Hispanic White or Other (p lt 01) African American drivers were found to have the highest percentage of drug-positive results (224) which was a significantly higher rate than that of their Hispanic or White counterparts (p lt 01)
Table 116 Drug Prevalence by RaceEthnicity (Oral Fluid andor Blood)
N Drug Positive RaceEthnicity (Unweighted) (Weighted)
African American 980 224 Asian 191 19 Hispanic 1015 133 White 3378 172 Other 273 181 Overall 5837 165
RaceEthnic groups other than ldquoHispanicrdquo are always ldquonon-Hispanicrdquo
As shown in Table 117 drivers who identified themselves as having at least some college experience were statistically less likely to be drug-positive than those reporting being a high school graduate or less education (p lt 01)
92
2007 National Roadside Survey of Alcohol and Drug Use by Drivers Drug Results
Table 117 Drug Prevalence by Education Level (Oral Fluid andor Blood)
Education Level N
(Unweighted) Drug Positive
(Weighted) Not a High School Graduate 579 203 High School Graduate 1482 240 Some College 2234 140 College Graduate 1159 109 Some Graduate Work 389 169 Overall 5843 165
Comparison of drug prevalence by employment status (Table 118) indicated that drivers on disability showed a drug prevalence that was significantly higher than that of employed drivers (p lt 01) The prevalence of drug positives among employed drivers did not differ significantly from that of unemployed drivers Retired drivers had significantly lower drug prevalence than employed drivers (p lt 01)
Table 118 Drug Prevalence by Employment Status (Oral Fluid andor Blood)
N Drug Positive Employment Status (Unweighted) (Weighted)
EmployedSelf Employed 4646 167 Homemaker 104 85 Student 593 159 Unemployed 206 182 Retired 206 83 On Disability 67 447 Other 23 150 Overall 5845 165
Table 119 shows drug prevalence by vehicle type Drug prevalence rates among drivers of various vehicle types (passenger vehicle pickup SUV and vanminivans) were statistically different from motorcyclists who had the greatest percentage of drug-positive results (p lt01)
Table 119 Drug Prevalence by Vehicle Type (Oral Fluid andor Blood)
Vehicle Type N
(Unweighted) Drug Positive
(Weighted) Passenger Vehicle 3650 165 Pickup 703 159 SUV 1058 152 Van amp Minivan 381 174 Motorcycle 75 319 Overall 5867 164
93
2007 National Roadside Survey of Alcohol and Drug Use by Drivers Drug Results
Driver Drug Use Prevalence by Drug Class Based on Oral Fluid andor Blood Results In this section of the report we display driver drug use prevalence by class of drug The classes of drugs tested for were antidepressants marijuana narcotic-analgesics sedatives stimulants and other (see Tables 17-18)
Drug Class
As indicated in Table 120 135 percent of the drivers tested positive for one drug class and 28 percent tested positive for more than one drug class
Table 120 Number and Distribution of Drug Classes (Oral Fluid andor Blood)
Number of N Drug Classes (Unweighted) (Weighted)
1 792 135 2+ 184 28 Negative 4934 837 Overall 5910 1000
Further drivers testing positive for only one drug class constituted about 83 percent of drug-positive drivers (Table 121)
Table 121 Number and Distribution of Drug Classes (Drug Positives Only) (Oral Fluid andor Blood)
Number of Drug Classes
N (Unweighted)
Drug Positive (Weighted)
1 792 828 2+ 184 172 Overall 976 1000
94
2007 National Roadside Survey of Alcohol and Drug Use by Drivers Drug Results
Table 122 presents distribution of drug classes by region Generally marijuana was the most common drug class across all the regions (68) followed by stimulants (32) Drivers in the West were less likely to test positive for marijuana than drivers from the other regions (p lt 01)
Table 122 Drug Classes Distribution by Region (Oral Fluid andor Blood)
Midwest Northeast South West All Drug Class
N=1708 N=1119 N=1566 N=1517 N=5910 Antidepressants 07 04 07 07 07 Marijuana 88 78 72 47 68 Narcotic-Analgesics 10 29 16 16 16 Sedatives 12 03 08 08 08 Stimulants 31 18 26 42 32 Other 02 00 01 05 03 More than 1 Class 18 51 32 25 28 Overall Drug Positive 169 183 163 150 163 Negative 831 817 837 850 837
ldquoMore than 1 Classrdquo ndash Drivers testing positive for more than one drug are only counted in this category In this table percentages are weighted
As is shown in Table 123 males were significantly more likely to be positive for marijuana than females (80 males versus 50 females) (p lt 01)
Table 123 Drug Classes Distribution by Gender (Oral Fluid andor Blood)
Males Females Total Drug Class
N=3634 N=2262 N=5896 Antidepressants 07 07 07 Marijuana 80 50 69 Narcotic-Analgesics 17 15 16 Sedatives 06 12 08 Stimulants 31 35 33 Other 03 03 03 More than 1 Class 35 17 28 Overall Drug Positive 180 138 164 Negative 820 862 836
ldquoMore than 1 Classrdquo ndash Drivers testing positive for more than one drug are only counted in this category In this table percentages are weighted
When we examined drug class prevalence by age (Table 124) we found that drivers aged 16-20 were more likely to use marijuana (120) than drivers in the 21-34 age group (p lt 05) and any other age group (p lt 01) The age group with the second highest prevalence of marijuana was 21-34 the prevalence in this age group (92) was also significantly higher than in older age groups (p lt 01)
95
Drug Class 16-20
21-34
35-44
45-64
65+
Total
N=974 Antidepressants 04 Marijuana 120 Narcotic-Analgesics 12 Sedatives 00 Stimulants 22 Other 02
More than 1 Class 27
N=2451 03 92 08 06 33 05 36
N=1046 09 46 43 15 31 02 23
N=1225 15 11 14 12 47 01 22
N=148 06 00 04 30 00 00 01
N=5844 07 69 16 09 33 03 28
Overall Drug Positive 188 182 170 121 40 165 835 Negative 812 818 830 879 960
ldquoMore than 1 Classrdquo ndash Drivers testing positive for more than one drug are only counted in this category In this table percentages are weighted
2007 National Roadside Survey of Alcohol and Drug Use by Drivers Drug Results
Table 124 Drug Classes Distribution by Age (Oral Fluid andor Blood)
Driver Drug Use Prevalence by Drug Category Based on Oral Fluid andor Blood Results In this section of the report we display drug use prevalence results from the combined results of oral fluid and blood tests by drug category as described in Table 18
Table 125 shows that 113 percent of drivers tested positive for ldquoIllegalrdquo drugs and an additional 11 percent tested positive for ldquoIllegalrdquo drugs in conjunction with ldquoMedicationsrdquo Thus a total of 124 percent tested positive for ldquoIllegalrdquo drugs of which 11 percent also tested positive for a ldquoMedicationrdquo
Table 125 Drug Categories Distribution (Oral Fluid andor Blood)
N Drug Category (Unweighted) (Weighted)
Illegal 621 113 Medications 277 39 Illegal amp Medications 78 11 Negative 4934 837 Overall 5910 1000
ldquoMedicationsrdquo includes prescription and over-the-counter drugs
Table 126 displays the drug category results by region No statistically significant differences were found in the prevalence of ldquoIllegalrdquo drugs across regions
96
2007 National Roadside Survey of Alcohol and Drug Use by Drivers Drug Results
Table 126 Drug Categories Distribution by Region (Oral Fluid andor Blood)
N Region Drug Category (Unweighted) (Weighted)
Midwest
Illegal Medications Illegal amp Medications Negative
197 97 19
1395
127 35 06
831 Overall 1708 1000
Northeast
Illegal Medications Illegal amp Medications Negative
121 43 17
938
113 46 24
817 Overall 1119 1000
South
Illegal Medications Illegal amp Medications Negative
145 79 28
1314
109 38 16
837 Overall 1566 1000
West
Illegal Medications Illegal amp Medications Negative
158 58 14
1287
113 39 11
837 Overall 1517 1000
ldquoMedicationsrdquo includes prescription and over-the-counter drugs
When examining prevalence by drug category and gender (Table 127) we found that male drivers were more likely to be positive for ldquoIllegalrdquo drugs (combining the categories for ldquoIllegalrdquo and ldquoIllegal and Medicationsrdquo) than female drivers (144 male versus 85 female) (p lt 01)
Table 127 Drug Categories by Gender (Oral Fluid andor Blood)
N Gender Drug Category (Unweighted) (Weighted)
Male
Illegal
Medications
Illegal amp Medications
Negative
444
136
53
3001
131
35
13
820 Overall 3634 1000
Female
Illegal
Medications
Illegal amp Medications
Negative
176
141
25
1920
80
66
05
849
Overall 2262 1000 ldquoMedicationsrdquo includes prescription and over-the-counter drugs
97
2007 National Roadside Survey of Alcohol and Drug Use by Drivers Drug Results
Comparison of drug categories by age (Table 128) revealed that drivers aged 16-20 and 21-34 had the highest percentage of drug-positive results for ldquoIllegalrdquo (ldquoIllegalrdquo plus ldquoIllegal and Medicationsrdquo) drugs (p lt 01)
Table 128 Drug Categories Distribution by Age (Oral Fluid andor Blood)
N Age Drug Category (Unweighted) (Weighted)
16-20
Illegal Medications Illegal amp Medications Negative
131 15 14
814
155 19 14
812 Overall 974 1000
21-34
Illegal Medications Illegal amp Medications Negative
329 70 37
2015
148 22 12
818 Overall 2451 1000
35-44
Illegal Medications Illegal amp Medications Negative
91 78 15
862
82 81 08
830 Overall 1046 1000
45-64
Illegal Medications Illegal amp Medications Negative
68 101
12 1044
57 54 10
879 Overall 1225 1000
65+
Illegal
Medications
Illegal amp Medications
Negative
0
13
0
135
00
40
00
960
Overall 148 1000 ldquoMedicationsrdquo includes prescription and over-the-counter drugs
Driver Drug Use Prevalence from Oral Fluid andor Blood and BAC Results The following section presents the results of the oral fluid and blood analyses combined with the blood alcohol concentration (BAC) results obtained through breath tests
Tables 129 and 130 show the number of drug-positive drivers by BAC level As seen in Table 129 drug-positive drivers (41) were significantly more likely to have a BAC of 08 or higher than were drug negative drivers (17) (p lt 01)
98
2007 National Roadside Survey of Alcohol and Drug Use by Drivers Drug Results
Table 129 Drug Prevalence by BAC (Percentages Calculated by Row) (Oral Fluid andor Blood)
Drug Result
N (Unweighted) Zero
BAC (gdL) Between
Zero and 08 08+ Positive 976 795 164 41 Negative 4932 906 77 17 Overall 5908 888 91 21
In this table percentages are weighted
Table 130 provides another way of looking at this issue and indicates that among drivers with a BAC gdL 08+ almost a third (318) were also positive for drugs The difference in drug prevalence between BAC categories for drug positive drivers however was not statistically significant
Table 130 Drug Prevalence by BAC (Percentages Calculated by Column) (Oral Fluid andor Blood)
BAC (gdL) Drug Between Zero
Result Zero and 08 08+ All
N=5241 N=536 N=131 N=5908 Positive 146 293 318 163 Negative 854 707 682 837
In this table percentages are weighted
Table 131 shows that among participants who were drug positive drivers younger than 35 were the most likely to be alcohol-positive The prevalence of drivers with a BAC greater than zero among drivers less than 35-years-old was significantly higher than among older driver groups (p lt 01) Though a high proportion of drug-positive drivers 65+ were also alcohol positive that pattern is not statistically significant compared to the other age groups due to the small sample size
Table 131 BAC Among Drug-Positive Drivers by Age (Oral Fluid andor Blood)
BAC (gdL) N Zero Between Zero 08+
Age (Unweighted) and 08 16-20 160 799 174 28 21-34 436 750 200 50 35-44 184 876 87 379 45-64 181 842 122 36 65+ 13 587 413 00 Overall Positive 974 796 163 41
In this table percentages are weighted
99
2007 National Roadside Survey of Alcohol and Drug Use by Drivers Drug Results
As shown in Table 132 the majority of alcohol-positive drivers among drug-positive drivers were positive for only one class of drug
Table 132 BAC Among Drug-Positive Drivers by Number of Drug Classes (Percentages Calculated by Column) (Oral Fluid andor Blood)
Number of Drug Classes Zero
BAC (gdL) Between
Zero and 08 08+ N=468 N=71 N=20
1 2+
819 181
837 163
961 39
Overall 1000 1000 1000 In this table percentages are weighted
In Table 133 those drivers with 2+ classes of drugs were significantly less likely to be positive for alcohol than those drug-positive for one class (p lt 05)
Table 133 BAC Among Drug-Positive Drivers by Number of Drug Classes (Percentages Calculated by Row) (Oral Fluid andor Blood)
Number of Drug Classes
N (Unweighted) Zero
BAC (gdL) Between
Zero and 08 08+ 1 792 786 166 48 2+ 184 836 155 09 Overall 976 795 164 41
In this table percentages are weighted
As indicated in Table 134 drug-positive drivers who were also alcohol-positive were more likely to be positive for ldquoIllegalrdquo drugs than for ldquoMedicationsrdquo (p lt 01)
Table 134 BAC Among Drug-Positive Drivers by Drug Category (Oral Fluid andor Blood)
N BAC (gdL)
Between Drug Category (Unweighted) Zero Zero and 08 08+
Illegal 621 7521 1935 544 Medications 277 9140 731 129 Illegal amp Medications 78 8110 1816 075 Negative 4932 8879 909 212
ldquoMedicationsrdquo includes prescription and over-the-counter drugs In this table percentages are weighted
100
2007 National Roadside Survey of Alcohol and Drug Use by Drivers Drug Results
Table 135 presents the BACs of drivers by drug category and age Drivers with BAC a of 08 or higher who tested positive for drugs were more likely to test positive for ldquoIllegalrdquo drugs than those in the ldquoMedicationsrdquo category across all age groups However this difference was not statistically significant
Table 135 BAC of Drivers by Drug Category and Age (Oral Fluid andor Blood)
BAC (gdL) N Between Zero
Age Drug Category (Unweighted) Zero and 08 08+
16-20
Illegal Medications Illegal amp Medications Negative
131 15 14
814
759 1000 975 961
208 00 25 34
33 00 00 05
Overall 974 930 60 10
21-34
Illegal Medications Illegal amp Medications Negative
329 70 37
2014
731 837 812 880
209 146 188
96
60 17 00 24
Overall 2450 856 115 29
35-44
Illegal Medications Illegal amp Medications Negative
91 78 15
862
794 953 932 921
147 27 68 66
59 20 00 13
Overall 1046 913 70 17
45-64
Illegal Medications Illegal amp Medications Negative
68 101 12
1044
808 934 536 899
126 61
424 88
66 04 40 13
Overall 1225 892 92 16
65+
Illegal Medications Illegal amp Medications Negative
0 13
0 135
NA 587
NA 899
NA 413
NA 53
NA 00
NA 48
Overall 148 886 68 46 In this table percentages are weighted
When examining BAC by drug category by gender (Table 136) male drivers that tested positive for ldquoIllegalrdquo drugs were more likely to have a BAC at or above 08 gdL than their female counterparts (p lt 01)
101
2007 National Roadside Survey of Alcohol and Drug Use by Drivers Drug Results
Table 136 BAC of Drivers by Drug Category and Gender (Oral Fluid andor Blood)
BAC (gdL) N Between Zero
Gender Drug Category (Unweighted) Zero and 08 08+
Males
Illegal Medications Illegal amp Medications Negative
444 136
53 3001
749 928 760 902
179 64
231 78
72 08 10 21
Overall 3634 881 92 27
Females
Illegal Medications Illegal amp Medications Negative
176 141
25 1919
761 896 979 912
231 84 21 76
09 20 00 12
Overall 2261 899 89 12 In this table percentages are weighted
Individual Drug Prevalence Estimates from Oral Fluid and Oral Fluid andor Blood Combined In this section of the report we present prevalence estimates for individual drugs illegal prescription and over-the-counter drugs obtained from the analyses of oral fluid and blood specimens In Tables 137 and 139 there are three main columns The first column lists the individual drugs for which we tested and at least one driver tested positive in oral fluid The second main column presents the oral fluid results (unweighted N and weighted percentage) of samples obtained from daytime drivers on a drug-by-drug basis The third column presents results of oral fluid analyses from nighttime drivers in a similar manner Similarly tables 138 and 140 present the combined analyses of oral fluid andor blood samples provided by nighttime drivers Note in these tables there were 5910 nighttime drivers who provided either oral fluid blood or both oral fluid and blood for analysis If a driver tested positive for a specific drug or a metabolite of that drug in either oral fluid or blood or in both substances that driver was counted as positive for that drug once Thus these tables provide us with a robust estimate of nighttime drug prevalence available from the biological samples we collected because it takes advantage of the larger sample size of nighttime drivers providing oral fluid samples (5869) augmented with information obtained from analyses of blood samples obtained from 3276 nighttime drivers Most drivers who provided blood also provided oral fluid so including the blood results only increased the sample size by 41 drivers to 5910 However since in some cases specific drugs were found in oral fluid and not blood and conversely in blood but not oral fluid this dataset provides us with the most comprehensive estimates of individual drug prevalence
The Ns in the tables represent the actual unweighted number of positive tests for the listed drug or a metabolite of that drug The percentages are the weighted prevalence estimates for each drug Since individual drug use was the unit of analysis and some drivers were positive for more than one drug the sum of the individual drug prevalence estimates exceeds the overall prevalence estimates appearing elsewhere in this report
102
2007 National Roadside Survey of Alcohol and Drug Use by Drivers Drug Results
Of particular interest may be the prevalence estimates for relatively frequently encountered drugs such as marijuana Marijuana (and its metabolites) appears as a separate drug class in the typology presented in Table 17 and used in the subsequent tabulations of results by drug class However a number of drivers tested positive for more than one drug class (sometimes including marijuana) and were classified as such in the tabulations Thus drivers who were positive for marijuana were split between the mutually exclusive classifications of ldquomarijuanardquo and ldquomore than one drug classrdquo in those tables Here in these tables we present the prevalence estimates for a drug such as marijuana independent of whether other drugs were found in an individual driver Thus a driver for example who tested positive for marijuana and cocaine would appear twice in the tables in this section of the report Finally as indicated earlier in the report in many instances we tested both for the parent drug and its metabolites In cases where we found both the parent drug and its metabolite (for example THC and 11-OH-THC) we only counted that as one drug positive for the parent drug In the case in which a parent drug was identified alone which could also be a metabolite of another drug we only counted the observation as the parent drug itself and not again as the drug for which it could be a metabolite
Thus the values in the tables in this section of the report represent estimates of individual drug prevalence based on the analytic techniques available
Overall Individual Drug Prevalence in Daytime and Nighttime Review of Tables 137 and 138 reveals that the two highest prevalence drugs found in the 2007 NRS were in the ldquoIllegalrdquo drug category
The most frequently encountered single drug in oral fluid in both daytime and nighttime was THC (marijuana) Marijuana was detected in oral fluid in 446 percent of daytime drivers and 766 percent of nighttime drivers (Table 137) The results from nighttime drivers who provided oral fluid andor blood indicated that 865 percent of drivers were positive for marijuana or its metabolites (Table 138)
The second most frequently encountered drug was cocaine with either cocaine or a metabolite detected in oral fluid in 146 percent of daytime drivers and 390 percent of nighttime drivers The corresponding nighttime figure for oral fluid andor blood nighttime was 392 percent
During the daytime the next most frequently encountered drug was alprazolam at 112 percent Alprazolam (a benzodiazepine) exhibited a nighttime prevalence rate in oral fluid of 061 percent
Among opioids oxycodone exhibited a daytime prevalence rate of 037 percent Among the nighttime oral fluid samples oxycodone had a prevalence rate of 080 percent Another opioid hydrocodone had a 022 percent daytime and 061 percent nighttime oral fluid prevalence rate The atypical opioid propoxyphene was detected in 093 percent of daytime oral fluid samples and 046 percent of nighttime oral fluid samples
The daytime prevalence rate of methamphetamine was 032 percent and amphetamine was 023 percent Among nighttime drivers providing oral fluid samples methamphetamine had a prevalence rate of 080 percent Amphetamine had a prevalence rate of 036 percent
103
2007 National Roadside Survey of Alcohol and Drug Use by Drivers Drug Results
Table 137 Prevalence of Drugs in Daytime and Nighttime Drivers (Oral Fluid)
Drug
Oral Fluid Daytime Nighttime
N (Unweighted)
(Weighted)
N (Unweighted)
(Weighted)
Alprazolam 18 112 36 061 Amitriptyline 6 027 7 003 Amphetamine 4 023 19 036 Butalbital 5 026 8 017 Carisoprodol 2 005 5 003 Chlordiazepoxide 2 025 2 003 Clonazepam 2 003 7 012 Cocaine 38 146 222 390 Codeine 4 013 7 044 Dextromethorphan 3 023 16 022 Diazepam 3 010 10 014 Fluoxetine 11 034 14 023 Heroin 2 009 8 017 Hydrocodone 15 022 58 061 Hydromorphone 2 009 0 000 Ketamine 0 000 1 008 Lorazepam 0 000 1 001 MDMA 2 006 8 009 Meperidine 1 001 2 000 Meprobamate 0 000 1 001 Methadone 3 021 11 018 Methamphetamine 5 032 34 080 Methylphenidate 0 000 3 001 Morphine 0 000 1 000 Oxycodone 14 037 43 080 PCP 1 004 3 013 Phenobarbital 1 000 1 000 Phentermine 5 015 11 011 Propoxyphene 22 093 34 046 Sertraline 2 044 4 013 Temazepam 2 012 2 002 THC (Marijuana) 103 446 438 766 Tramadol 12 019 34 046 Zolpidem 2 012 1 001
All Tested Drivers dagger 1850 1100 5869 1440 dagger Number and percentages for All tested drivers indicate number of drivers providing samples and the percentage of those drivers who tested positive for at least one drug In this table percentages are weighted
104
2007 National Roadside Survey of Alcohol and Drug Use by Drivers Drug Results
Individual Drug Prevalence in Nighttime Oral Fluid andor Blood Results for drivers who provided oral fluid andor blood yielded an overall drug positive prevalence estimate of 163 percent (Table 138) Again marijuana (865) and cocaine (392) were the most frequently encountered drugs The next most frequently encountered drug was methamphetamine (084) Amphetamine was present in 045 percent of this nighttime driver population The opioids oxycodone (082) and hydrocodone (068) and the benzodiazepine alprazolam (064) were the next most frequently encountered drugs in this nighttime driver population The atypical opioid propoxyphene was present in 052 of these nighttime drivers Note however as indicated in the introduction of this section the unit of analysis in these tables is individual drug use Some drivers were positive for more than one drug thus the sum of the individual drug prevalence estimates exceed the overall prevalence estimates noted earlier in this report
105
2007 National Roadside Survey of Alcohol and Drug Use by Drivers Drug Results
Table 138 Prevalence of Drugs in All Drug-Tested Nighttime Drivers (Oral Fluid andor Blood)
Drug N
(Unweighted)
(Weighted)
Alprazolam 40 064 Amitriptyline 14 007 Amphetamine 25 045 Butalbital 9 017 Carisoprodol 5 003 Chlordiazepoxide 4 003 Clonazepam 10 014 Cocaine 225 392 Codeine 7 044 Dextromethorphan 16 022 Diazepam 30 038 Fluoxetine 25 037 Heroin 8 017 Hydrocodone 63 068 Hydromorphone 0 000 Imipramine 1 000 Ketamine 1 008 Lorazepam 2 003 MDMA 8 009 Meperidine 2 000 Meprobamate 1 001 Methadone 14 019 Methamphetamine 37 084 Methylphenidate 3 001 Morphine 8 006 Oxycodone 47 082 PCP 3 013 Phenobarbital 2 001 Phentermine 21 026 Propoxyphene 35 052 Sertraline 36 050 Temazepam 4 003 THC (Marijuana) 499 865 Tramadol 35 046 Zolpidem 4 003
All Tested Driversdagger 5910 1630 dagger Number and percentages for All tested drivers indicate number of drivers providing samples and percentage of those drivers who tested positive In this table percentages are weighted
106
2007 National Roadside Survey of Alcohol and Drug Use by Drivers Drug Results
Individual Drug Prevalence Sorted by Drug Type from Oral Fluid and Oral Fluid andor Blood Combined In Tables 139 and 140 we present prevalence estimates by drug within drug type for both daytime and nighttime drivers based on oral fluid analyses (Table 139) and for nighttime drivers based on the results of analyses of oral fluid andor blood (Table 140) These tables contain the same information provided in Tables 137 and 138 except that the drugs are sorted by drug type (Drug types are the subgrouping of similar drugs noted by class and category in Tables 17 and 18)
107
2007 National Roadside Survey of Alcohol and Drug Use by Drivers Drug Results Table 139 Prevalence of Drugs in Daytime and Nighttime Drivers (Oral Fluid)
Drug
Oral Fluid
Daytime Nighttime N
(Unweighted)
(Weighted) N
(Unweighted)
(Weighted)
THC (Marijuana) 103 446 438 766
Cocaine 38 146 222 390 Opioids
Codeine Heroin
Hydrocodone Hydromorphone Meperidine
Methadone Morphine Oxycodone Propoxyphene Tramadol
4 2
15 2 1 3 0
14 22 12
013 009 022 009 001 021 000 037 093 019
7 8
58 0 2
11 1
43 34 34
044 017 061 000 000 018 000 080 046 046
AmphetaminesStimulants MDMA Amphetamine
Methamphetamine Methylphenidate
Phentermine
2 4 5 0 5
006 023 032 000 015
8 19 34
3 11
009 036 080 001 011
Street Drugs Ketamine PCP
0 1
000 004
1 3
008 013
Benzodiazepines Alprazolam
Chlordiazepoxide Clonazepam Diazepam
Lorazepam Temazepam
18 2 2 3 0 2
112 025 003 010 000 012
36 2 7
10 1 2
061 003 012 014 001 002
Antidepressants Amitriptyline
Fluoxetine Imipramine Sertraline
6 11
0 2
027 034
0 044
7 14
0 4
003 023
0 013
Barbiturates Butalbital
Phenobarbital 5 1
026 000
8 1
017 000
Pain Drugs Carisoprodol Meprobamate
2 0
005 000
5 1
003 001
Sleep Aids Zolpidem 2 012 1 001
Cough Suppressants Dextromethorphan 3 023 16 022
All Tested Driversdagger 1850 1100 5869 1440 dagger Number and percentages for All tested drivers indicate number of drivers providing samples and percentage of those drivers who tested positive In this table percentages are weighted
108
2007 National Roadside Survey of Alcohol and Drug Use by Drivers Drug Results
Table 140 Prevalence of Drugs in All Drug-Tested Nighttime Drivers (Oral Fluid andor Blood)
Drug N
(Unweighted)
(Weighted) THC (Marijuana) 499 865 Cocaine 225 392 Opioids
Codeine 7 044 Heroin 8 017
Hydrocodone 63 068 Hydromorphone 0 000 Meperidine 2 000
Methadone 14 019 Morphine 8 006 Oxycodone 47 082 Propoxyphene 35 052 Tramadol 35 046
AmphetaminesStimulants MDMA 8 009 Amphetamine 25 045
Methamphetamine 37 084 Methylphenidate 3 001
Phentermine 21 026 Street Drugs
Ketamine PCP
1 3
008 013
Benzodiazepines Alprazolam 40 064
Chlordiazepoxide 4 003 Clonazepam 10 014 Diazepam 30 038
Lorazepam 2 003 Temazepam 4 003 Antidepressants Amitriptyline 14 007
Fluoxetine 25 037 Imipramine 1 000 Sertraline 36 050
Barbiturates Butalbital
Phenobarbital 9 2
017 001
Pain drugs Carisoprodol Meprobamate
5 1
003 001
Sleep Aids Zolpidem 4 003
Cough Suppressants Dextromethorphan 16 022
All Tested Driversdagger 5910 1630 dagger Number and percentages for All tested drivers indicate number of drivers providing samples and percentage of those drivers who tested positive In this table percentages are weighted
109
2007 National Roadside Survey of Alcohol and Drug Use by Drivers Drug Results
Drugs that were infrequently encountered in the study population included the sedative pain drugs carisoprodol and meprobamate the sleep aid zolpidem and the street drugs ketamine and PCP Barbiturates and cough suppressants were also infrequent in the studied driver population
Examination of the results of the daytime and the nighttime oral fluid analyses and the combination of oral fluid and or blood analyses (when either one or both types of samples were provided) indicates that similar relative patterns of prevalence estimates are realized in the daytime and nighttime Marijuana is the most frequently encountered drug whether compared with other drugs individually or with drug types Cocaine is the next most frequently encountered drug or drug type in the nighttime sample but during the daytime benzodiazepines and opioids exhibited higher prevalence rates as classes than cocaine
110
2007 National Roadside Survey of Alcohol and Drug Use by Drivers Drug Results
Discussion This report summarizes the results of the first US National Roadside Survey to estimate drug-involved driving prevalence based on biological measures It should be emphasized that this is a prevalence study and not a study that addresses the risk that may be presented by drug use among drivers For many drug types drug presence can be detected long after any impairment that might affect driving has passed However it is important to our understanding of drugs and driving to know the extent of the use of certain drugs in the driving population That was the intent of this study
As indicated earlier in the report we gathered data from drivers on US roadways during Friday daytime hours as well as during Friday nights and Saturday nights We obtained oral fluid samples (1850 during daytime and 5869 during nighttime) from drivers in each of those data collection periods and collected blood samples (3276) as well during the nighttime data collection periods (Table 10)
In this study analyses of the oral fluid and blood samples were conducted to identify the presence of some 75 drugs and metabolites (Tables 17 and 18) To make the presentation of results most useful we identified six classes of these drugs including antidepressants marijuana narcotic-analgesics sedatives stimulants and other plus a ldquomore than one drugrdquo class We also identified three broader categories illegal prescription and over-the-counter Because few overshythe-counter drugs were found the prescription and over-the-counter drugs were combined for many analyses and labeled ldquoMedicationsrdquo
Oral Fluid Analyses Analyses of the oral fluid samples obtained from daytime drivers indicated an overall drug use prevalence of 11 percent and for nighttime drivers 144 percent (Table 19) This includes illegal prescription and over-the-counter drugs combined This overall difference between day and night is statistically significant (p lt 01)
In examining the prevalence of drugs by class (Table 31) marijuana was identified in 39 percent of daytime drivers and 61 percent of nighttime drivers Sedatives were found in 16 percent of daytime drivers and in 06 percent of nighttime drivers Conversely stimulants were found in 16 percent of daytime drivers but in 32 percent of nighttime drivers
Comparison of drug classes by time of day indicated that nighttime drivers were significantly more likely to test positive for more than one drug class than daytime drivers (23 nighttime versus 15 daytime) (p lt 01) Comparison of drug categories by time of day (Table 34) revealed that almost 6 percent of daytime drivers tested positive for drugs in the ldquoIllegalrdquo category (primarily marijuana and cocaine) as did over 10 percent of nighttime drivers (there was a statistically significant difference between the two groups [p lt 01]) Positive results in the ldquoMedicationsrdquo category (prescription and over-the-counter drugs combined) were found to be slightly higher among the daytime drivers (almost 5) than nighttime drivers (3) although this difference was not statistically significant
When examining drug prevalence by time of day and gender (Table 22) the daytime driving sample showed no statistically significant difference in drug prevalence between males and
111
2007 National Roadside Survey of Alcohol and Drug Use by Drivers Drug Results
females however in the nighttime driving sample male drivers were significantly more likely to be drug-positive than female drivers (165 males versus 113 females) (p lt 01)
Further comparison of drug class by time and gender (Table 32) showed that males were significantly more likely to test positive for marijuana than females in both daytime (59 males versus 17 females) and nighttime samples (74 males versus 41 females) (p lt 01)
When examining prevalence by drug category by time of day and gender (Table 36) we found that in the daytime sample male drivers were more likely to test positive for ldquoIllegalrdquo drugs (82) than female drivers (30) (p lt 01) Conversely daytime female drivers were more likely to show positive results for ldquoMedicationsrdquo (76) than daytime male drivers (25) (p lt 01) This pattern was similar in the nighttime sample with 125 percent of male drivers testing positive for ldquoIllegalrdquo drugs as opposed to 75 percent of female drivers (p lt 01) The difference in percentage of positive results for ldquoMedicationsrdquo between male (28) and female (33) drivers was not as striking in the nighttime sample as in the daytime sample
Comparison of overall drug prevalence by time of day and age18 (Table 23) revealed that within the daytime driving sample drivers aged 45-64 showed the highest percentage of drug positives and drivers aged 16-20 and aged 65+ were significantly less likely to be positive than other ages of drivers (p lt 05) In the nighttime driving sample drivers aged 45-64 and 65+ were significantly less likely to be drug positive (p lt 01) while drivers aged 16-20 showed no difference in drug prevalence from drivers aged 21-34 years and drivers aged 35-44 years
When we examined drug classes by time of day and age (Table 33) we found that daytime drivers aged 21-34 were more likely to use marijuana (74) than daytime drivers in other age groups (p lt 01) However drivers aged 16-20 years had the highest marijuana use (98) in the nighttime sample followed by the 21-34 year age group (85) (p lt 01) The prevalence of narcotic-analgesics among daytime drivers was highest among drivers aged 45-64 (29) (p lt 01) however in the nighttime sample this changed to the age 35-44 group (42) (p lt 01)
In comparing drug categories by time of day and age (Table 37) it was clear that within the daytime sample ldquoIllegalrdquo drug use was highest for drivers aged 21-34 (99) followed by drivers aged 35-44 (65) The prevalence of ldquoIllegalrdquo drugs for these age groups differed significantly from that in the remaining age groups (p lt 01) In the nighttime sample drivers in the 21-34 year age group still maintained the highest percentage of positive results for ldquoIllegalrdquo drugs (142) however that group was then followed by the youngest age group (16-20 years) for ldquoIllegalrdquo drugs (131) (p lt 01) ldquoMedicationsrdquo usage was highest among the 45-64 year age group (88) in the daytime sample (non-significant) and in the 35-44 year old age group in the nighttime sample (69) (p lt 01)
In comparing the number of drug-positive drivers by time of day and BAC level (Tables 38 and 39) a statistically significant association was found between drug-positive and alcohol-positive drivers within the nighttime driving sample In other words the percentage of nighttime drivers with a BAC gdL of 08+ was significantly higher among drug-positive drivers than among drug-negative drivers (p lt 01) However for daytime drivers no such statistical association was found largely because of the small number of alcohol-positive drivers in the daytime sample
18 Age ranges between groups are not equivalent
112
2007 National Roadside Survey of Alcohol and Drug Use by Drivers Drug Results
In both the daytime and nighttime samples the majority of drug-positive drivers who were alcohol-positive were in the ldquoIllegalrdquo drug category (Table 43) This was particularly true in the nighttime sample in which 173 percent in the ldquoIllegalrdquo drug category had BACs between zero and 08 (compared to 63 in the ldquoMedicationsrdquo category) and 57 percent had BACs greater than 08 (compared to 12 in the ldquoMedicationsrdquo category [p lt 01]) In the daytime sample however the differences were statistically non-significant
Blood Analyses About 14 percent of the 3276 blood samples obtained from nighttime drivers were drug-positive (Table 83) Two percent of the blood-sampled drivers tested positive for more than one drug class (Table 93 and about 9 percent of driver tested positive for drugs in the ldquoIllegalrdquo category (Table 97)
Review of blood sample findings by gender (Table 86) revealed that male drivers were more likely to be drug-positive than female drivers (145 males versus 130 females) However such differences were not statistically significant Comparison of drug class by gender (Table 95) revealed that male drivers were significantly more likely to test positive for marijuana than female drivers (74 males versus 56 females) (p lt 05) When examining prevalence by drug category and gender (Table 99) we found that over 10 percent of male drivers had positive results for ldquordquoIllegalrdquo drugs as did about 7 percent of female drivers (p lt 01) The difference in percentage of positive results for ldquoMedicationsrdquo between male and female drivers was not statistically significant
When examining drug prevalence by age (Table 87) the prevalence of drug-positives was higher among young drivers Drivers aged 16-20 years showed a significantly higher prevalence than drivers aged 21-34 years and drivers aged 35-44 years (p lt 01) Drivers aged 45-64 and 65+ were significantly less likely to be drug positive than drivers ages 16 to 34 years old (p lt 01)
Comparison of drug class by age (Table 96) showed that drivers younger than 35-years-old were more likely to test positive for marijuana than drivers in other age groups (p lt 01) Among drivers aged 16-34 drivers aged 16-20 years had the highest marijuana use (152) The prevalence of narcotic-analgesics was higher among the 16-20 and 35-44 year age groups (13 and 17 respectively) than any other age group (p lt 01)
ldquoIllegalrdquo drug use was highest for drivers in the youngest age group (16-20 years) followed by drivers aged 21-34 years old (p lt 01) ldquoIllegalrdquo drug use among drivers older than 35-years-old was significantly lower than among drivers under the age of 35 (p lt 01) ldquoMedicationrdquo usage followed the opposite trend with prevalence increasing with age Prevalence of ldquoMedicationrdquo was higher for drivers aged 35 and older than for drivers younger than age 35 (p lt 01) (Table 100)
A statistically significant association was found between drug-positive and alcohol-positive drivers (Tables 101 and 102) The percentages of drivers with a BAC gdL between zero and 08 and with a BAC gdL 08+ were significantly higher among drug-positive drivers than among drug-negative drivers (p lt 01)
113
2007 National Roadside Survey of Alcohol and Drug Use by Drivers Drug Results
Oral Fluid andor Blood Analyses Combined Similar patterns of results were obtained when we examined the drug prevalence for the 5910 nighttime drivers who provided oral fluid andor blood samples If a driver tested positive for one or more of the drugs in either the oral fluid andor in the blood analyses heshe was categorized as drug-positive (Table 110) This yielded an overall drug positive rate of 163 percent
When we examined individual drugs and their metabolites (Tables 137 and 138) we found that the most frequently encountered drug was marijuana whether it was measured in oral fluid in the daytime (45) oral fluid at nighttime (77) or the combination of oral fluid andor blood at nighttime (87) The next most frequently encountered individual drug (again by all measures) was cocaine which was present in 15 percent of daytime oral fluid samples 39 percent of nighttime oral fluid samples and 39 percent of nighttime combined oral fluid andor blood analyses
During the daytime the next most frequently encountered drug was alprazolam at 112 percent Among nighttime drivers providing oral fluid samples the most frequently encountered drugs after marijuana and cocaine were methamphetamine and oxycodone each with a prevalence rate of 080percent The data collected during the 2007 National Roadside Survey provides new insight into the extent and patterns of drug use and the combination of drug and alcohol use among our Nationrsquos drivers As noted earlier the data collected can not determine whether the drug-use patterns we observed affected driver performance For example although all the drugs examined in this study can potentially impair driving skills some of the drug-positive drivers could drive better with the therapeutic effects of medicinal drugs they are taking What this study has provided is a careful estimate of the extent of alcohol-involved and drug-involved driving in the contiguous 48 States
The next step in this process is to conduct a study that attempts to quantify the risk that drug-involved driving may pose for crash involvement One way to establish that is to conduct a case control study where data including objective measures of drug use are gathered from crash-involved drivers and non-crash-involved drivers matched to the time location and direction of travel of the crash-involved drivers Those two sets of data can then be compared to estimate the risk posed by various drugs
114
2007 National Roadside Survey of Alcohol and Drug Use by Drivers Drug Results
References Bates M Brick J amp White H (1993) Correspondence between saliva and breath estimates of
blood alcohol concentration advantages and limitations of the saliva method Journal of Studies on Alcohol 54(1) 17-22
Beirness D Simpson H M amp Williams A F (2006) Role of Cannabis and Benzodiazepines in Motor Vehicle Crashes Transportation Research Circular No E-C096 Drugs and Traffic A Symposium June 20-21 2005 (pp 12-21) Woods Hole MA Transportation Research Board of the National Academies
Blomberg RD Peck RC Moskowitz H Burns M and Fiorentino D (2005) Crash risk of alcohol involved driving A case-control study Report Stanford CT Dunlap amp Associates Inc (p 117)
Brogan W C Kemp P M Bost R O Glamann D B Lange R A amp Hillis L D (1992) Collection and handling of clinical blood samples to assure the accurate measurement of cocaine concentration Journal of Analytic Toxicology 16 152-154
Burns M M (1993) Cocaine Effects on Performance In H Utzelmann G Berghause amp G Ktoj (Eds) 12th Proceedings of the International Conference on Alcohol Drugs and Traffic Safety Verlang TUumlV Rheinland GmbH (pp 612ndash619) Koumlln Germany Centers for Disease Control and Prevention (2006) Alcohol and other drug use among victims of motor vehicle crashes ndash West Virginia ndash 2004-2005 Morbidity and Mortality Weekly Report (MMWR) 55(48)1293-1296 Available online httpwwwcdcgovmmwrpreviewmmwrhtmlmm5548a2htm
Christophersen A S (1986) Tetrahydrocannabinol stability in whole blood plastic versus glass containers Journal of Analytic Toxicology 10 129-131
Cone E J Presley L Lehrer M Seiter W Smith M Kardos K Fritch D Salamone S J amp Niedbala R (2002) Oral fluid testing for drugs of abuse positive prevalence rates by Intercept immunoassay screening and GC-MS-MS confirmation and suggested cutoff concentrations Journal of Analytical Toxicology 26(8) 541-546
Coulter C Miller E Crompton K Moore C (2008) Tetrahydrocannabinol and two of its metabolites in whole blood using liquid chromatography-tandem mass spectrometry Journal of Analytical Toxicology 32 653-658
Coulter C Crompton K amp Moore C (2008) Detection of phencyclidine in human oral fluid using solid phase extraction and liquid chromatography with tandem mass spectrometric detection Journal of Chromatography B Biomedical Sciences and Applications 873 123 shy128
Couper F J amp Logan B K (2004) Drugs and human performance fact sheet DOT HS 809 725 Washington DC National Highway Traffic Safety Administration
de Gier H (2006 June 20-21) Medicinal Drugs Critical Review of Present Knowledge and Statements for Discussion Paper presented at the Drugs in Traffic A symposium Transportation Research Board Woods Hole MA
115
2007 National Roadside Survey of Alcohol and Drug Use by Drivers Drug Results
Drummer O H (2002) Benzodiazepines Effects on human performance and behavior Forensic Science Review 14 2ndash14
Federal Highway Administration (2006) Highway Statistics 2006 Retrieved June 25 2008 from wwwfhwadotgovpolicyohimhs06driver_licensinghtm
Gieringer D H (1988) Marijuana driving and accident safety Journal of Psychoactive Drugs 20(93) 101
Heishman S J Stitzer M L amp Yingling J E (1989) Effects of tetrahydrocannabinol content on marijuana smoking behavior subjective reports and performance Pharmacology Biochemistry and Behavior 34(1) 173ndash179
Hemmelgarn B Suissa S Huang A Boivin J-F amp Pinard G (1997) Benzodiazepine use and the risk of motor vehicle crash in the elderly Journal of the American Medical Association 278 27-31
Higgins S T Bickel W K Hughes J R Lynn M Capeless M A amp Fenwick J W (1990) Effects of intranasal cocaine on human learning performance and physiology Psychopharmacology 8 451ndash485
Hold K de Boer D Zuidema J amp Maes R (1999) Saliva as an analytical tool in toxicology International Journal of Drug Testing 1(1) 1-36
Hurst P M (1976) Amphetamines and driving behavior Accident Analysis and Prevention 8 9ndash13
Jones R K Shinar D amp Walsh J M (2003) State of knowledge of drug-impaired driving DOT HS 809 642 Washington DC National Highway Traffic Safety Administration
Kelly E Darke S amp Ross J (2004) A Review of drug use and driving Epidemiology impairment risk factors and risk perceptions Drug and Alcohol Review 23 319ndash344
Kiger S Lestina D amp Lund AK (1993) Passive alcohol sensors in law enforcement screening for alcohol-impaired drivers Alcohol Drugs and Driving 9 7-18
Kintz P Cirimele V amp Ludes B (2000) Detection of cannabis in oral fluid (saliva) and forehead wipes (sweat) from impaired drivers International Journal of Drug Testing 24(7) 557-561
Lacey J Kelley-Baker K Furr-Holden C Brainard K and Moore C (2007) Pilot Test of New Roadside Survey Methodology for Impaired Driving DOT HS 810 704 Washington DC National Highway Traffic Safety Administration
Lacey J H Kelley-Baker T Furr-Holden C D M Voas R Moore C Brainard K Tippetts A S Romano E Torres P amp Berning A (2009a) 2007 National Roadside Survey of Alcohol and Drug Use by Drivers Methodology Washington DC National Highway Traffic Safety Administration (in press)
Lacey J H Kelley-Baker T Furr-Holden C D M Voas Romano E Tippetts A S Brainard K amp Berning A (2009b) 2007 National Roadside Survey of Alcohol and Drug Use by Drivers Alcohol Results Washington DC National Highway Traffic Safety Administration (in press)
116
2007 National Roadside Survey of Alcohol and Drug Use by Drivers Drug Results
Lamers C T J amp Ramaekers J G (1999) Marijuana and alcohol effects on visual search and general driving proficiency Journal of Psychopharmacology 13(3 Suppl A) A53
Lestina D C Greene M Voas R B amp Wells J (1999) Sampling procedures and survey methodologies for the 1996 survey with comparisons to earlier National Roadside Surveys Evaluation Review 23(1) 28-46
Leveille S G Buchner D M Koepsell T D McCloskey L W Wolf M E amp Gagner E H (1994) Psychoactive medications and injurious motor vehicle collisions involving older drivers Epidemiology 5 591-598
Lucki I Rickels K amp Geller A (1985) Psychomotor performance following long-term use of benzodiazepines Psychopharmacology Bulletin 21 93-96
Lund A K Preusser D F Blomberg R D amp Williams A F (1988) Drug use by tractor-trailer drivers Journal of Forensic Sciences JFSCA 33(3) 648-661
Lund A K amp Wolfe A C (1991) Changes in the incidence of alcohol-impaired driving in the United States 1973-1986 Journal of Studies on Alcohol 52(4) 293-301
Mathijssen M P Movig K L de Gier J J Nagel P H van Egmond T amp Egberts A C (2002) Use of psychoactive medicines and drugs as a cause of road trauma In D R Mayhew amp C Dussault (Eds) Proceedings of Alcohol Drugs amp Traffic Safety - T 2002 16th International Conference on Alcohol Drugs amp Traffic Safety August 4-9 2002 Vol 2 (pp 451-457) Montreal Canada International Council on Alcohol Drugs and Traffic Safety (ICADTS) Centers for Disease Control and Prevention (2006) Alcohol and other drug use among victims of motor vehicle crashes ndash West Virginia ndash 2004-2005 Morbidity and Mortality Weekly Report (MMWR) 55(48)1293-1296 Available online httpwwwcdcgovmmwrpreviewmmwrhtmlmm5548a2htm
Moore C Coulter C amp Crompton K (2007) Achieving proposed Federal concentrations using reduced specimen volume for the extraction of amphetamines from oral fluid Journal of Analytic Toxicology 31(8) 442-446
Moore C Coulter C Crompton K amp Zumwalt M (2007) Determination of benzodiazepines in oral fluid using LCMSMS Journal of Analytic Toxicology 31(9) 596-600
Moore C Rana S amp Coulter C (2007a) Determination of meperidine tramadol and oxycodone in human oral fluid using solid phase extraction and gas chromatography-mass spectrometry Journal of Chromatography B Biomedical Sciences and Applications 850 370-375
Moore C Rana S amp Coulter C (2007b) Simultaneous identification of 2-carboxyshytetrahydrocannabinol tetrahydrocannabinol cannabinol and cannabidiol in oral fluid Journal of Chromatography B Biomedical Sciences and Applications 852 459-464
Moore C Vincent M Rana S Coulter C Agrawal A amp Soares J (2006) Stability of Delta(9)-tetrahydrocannabinol (THC) in oral fluid using the Quantisaltrade collection device Forensic Science International 164(2-3) 126-130
Moskowitz H (1985) Marijuana and driving Accident Analysis and Prevention 17 323ndash345
117
2007 National Roadside Survey of Alcohol and Drug Use by Drivers Drug Results
National Highway Traffic Safety Administration (1995) National automotive sampling system Crashworthiness data system 1991-1993 Washington DC National Highway Traffic Safety Administration
National Highway Traffic Safety Administration (2001) National Automotive Sampling System Crashworthiness Data System 1995-1997 Washington DC National Highway Traffic Safety Administration
National Highway Traffic Safety Administration (2005) Fatality Analysis Reporting System Fatal crash data overview DOT HS 809 726 Washington DC National Highway Traffic Safety Administration
Neutel C I (1998) Benzodiazepine-related traffic accidents in young and elderly drivers Human Psychopharmacology 13(Suppl 2) S115ndashS123
ONeal C L Crouch D J Rollins D E amp Fatah A A (2000) The effects of collection methods on oral fluid codeine concentrations Journal of Analytic Toxicology 24(7) 536shy542
Perez-Reyes M Hicks R E Bumberry J Jeffcoat A R amp Cook C E (1988) Interaction between marihuana and ethanol Effects on psychomotor performance Alcohol Clinical and Experimental Research 12(2) 268ndash276
Polkis A Maginn D amp Barr J L (1987) Drug findings in driving under the influence of drugs cases a problem of illicit drug use Drug and Alcohol Dependence 20(1) 57-62
Preusser D F Ulmer R G amp Preusser C W (1992 December) Evaluation of the impact of the drug evaluation and classification system on enforcement and adjudication DOT HS 808 058 Washington DC National Highway Traffic Safety Administration
Quintela O Crouch D J amp Andrenyak D M (2006) Recovery of drugs of abuse from the Immunalysis Quantisaltrade oral fluid collection device Journal of Analytic Toxicology 30(8) 614-616
Rana S Moore C Agrawal A Coulter C Vincent M amp Soares J (2006) Determination of propoxyphene in oral fluid Journal of Analytic Toxicology 30(8) 516-518
Ray W A Fought R L amp Decker M D (1992) Psychoactive drugs and the risk of injurious motor vehicle crashes in elderly drivers American Journal of Epidemiology 136 873-883
Robbe H amp OHanlon J (1993) Marijuana and actual driving performance DOT HS 808 078 Washington DC National Highway Traffic Safety Administration US Department of Transportation
Rodrigues W Wang G Moore C Agrawal A Vincent M amp Soares J (2008) Development and validation of ELISA and GC-MS procedures for the quantification of dextromethorphan and its main metabolite dextrorphan in urine and oral fluid Journal of Analytic Toxicology 32 1-7
Samyn N G de Boeck et al (2002) The use of oral fluid and sweat wipes for the detection of drugs of abuse in drivers Journal of Forensic Science 47(6) 1380-1387
118
2007 National Roadside Survey of Alcohol and Drug Use by Drivers Drug Results
Samyn N amp van Haeren C (2000) On-site testing of saliva and sweat with Drugwipe and determination of concentrations of drugs of abuse in saliva plasma and urine of suspected users International Journal of Legal Medicine 113(3) 150-154
Schramm W Smith R H Craig P A amp Kidwell D A (1992) Drugs of abuse in saliva A review Journal of Analytic Toxicology 16(1) 1ndash7
Shinar D (2006) Drug Effects and Their Significance for Traffic Safety Transportation Research Circular No E-C096 Drugs and Traffic A Symposium June 20-21 2005 (pp 52shy64) Woods Hole MA Transportation Research Board of the National Academies
Smiley A (1998) Marijuana On road and driving simulator studies Paper presented at the World Health Organization Geneva Switzerland
StataCorp (2006) Stata Data Analysis and Statistical Software (httpwwwstatacom)
Terhune K Ippolito C Hendricks D Michalovic J Bogema S Santinga P Blomberg R amp Preusser D (1992) The incidence and role of drugs in fatally injured drivers DOT HS 808 065 Washington DC National Highway Traffic Safety Administration
Toennes S amp Kauert G (2001) Importance of vacutainer selection in forensic toxicological analysis of drugs of abuse Journal of Analytic Toxicology 25(5) 339-343
US Department of Transportation (1968) Alcohol and highway safety Report to the US Congress Washington DC US Government Printing Office
Voas R B Wells J Lestina D Williams A amp Greene M (1998) Drinking and driving in the United States The 1996 National Roadside Survey Accident Analysis and Prevention 30(2) 267-275
Waller P Blow F Maio R Hill E Singer K and Schaefer (1995) Crash characteristics and injuries of drivers impaired by alcoholdrugs In TS-95 Proceedings of the 13th International Conference on Alcohol Drugs and Traffic Safety August 13-August 18 1995 Adelaide Australia NHMRC Road Accident Unit University of Adelaide Walsh J M Cangianelli L A Buchan B J amp Leaverton P E (2000) DUI Officer detection of illegal drugs in drivers using rapid immunoassay devices In the 15th International Council on Alcohol Drugs and Traffic Safety (ICADTS) May 22-26 2000 Stockholm Sweden ICADTS
Ward A S Kelly T H Foltin R G amp Fischman M W (1997) Effects of d-amphetamine on task performance and social behavior of humans in a residential laboratory Experimental and Clinical Psychopharmacology 5(2) 130ndash136
White J Z Clardy D O Graves M H Kuo M MacDonald B J Wiersema S J et al (1981) Testing for sedative-hypnotic drugs in the impaired driver A survey of 72000 arrests Clinical Toxicology 18(8) 945-957
Wolfe A C (1974) 1973 US National roadside breath testing survey procedures and results DOT HS 801 241 Washington DC National Highway Traffic Safety Administration
Yacoubian G Wish E D amp Peacuterez D M (2001) A comparison of saliva testing to urinalysis in an arrestee population Journal of Psychoactive Drugs 33(3) 289ndash294
119
2007 National Roadside Survey of Alcohol and Drug Use by Drivers Drug Results
120
2007 National Roadside Survey of Alcohol and Drug Use by Drivers Drug Results
Appendix A
2007 National Roadside Survey Additional Tables
121
2007 National Roadside Survey of Alcohol and Drug Use by Drivers Drug Results
122
2007 National Roadside Survey of Alcohol and Drug Use by Drivers Drug Results
Appendix A 2007 National Roadside Survey
Additional Tables
Table 141 Nighttime Blood Results and Agreement With Self-Reported by Drug Type (Blood)
Drug Category Self-Reported
Drug Use
Blood Positive for this Drug
N (Unweighted)
(Weighted)
Antidepressants
Past 24 Hours Past 2 Days Past Month Past Year Over a Year Never
41 814 1 08 1 02 0 00 1 24
13 152 Overall 57 1000
Amphetamines
Past 24 Hours Past 2 Days Past Month Past Year Over a Year Never
1 31 0 00 3 129 1 125 8 109
38 605 Overall 51 1000
Barbiturates
Past 24 Hours Past 2 Days Past Month Past Year Over a Year Never
2 13 0 00 0 00 0 00 0 00 6 987
Overall 8 1000
Benzodiazepines
Past 24 Hours Past 2 Days Past Month
Past Year Over a Year Never
11 215 4 38 4 80 3 20 5 21
36 626 Overall 63 1000
Cocaine Past 24 Hours 4 29 Past 2 Days 2 108 Past Month 5 170 Past Year 1 10 Over a Year 6 106
123
2007 National Roadside Survey of Alcohol and Drug Use by Drivers Drug Results
Drug Category Self-Reported
Drug Use
Never
Blood Positive for this Drug
N (Unweighted)
(Weighted)
23 577 Overall 41 1000
Cough Suppressants
Past 24 Hours
Past 2 Days
Past Month
Past Year
Over a Year
Never
2 157
1 222
1 606
0 00
0 00
1 14
Overall 5 1000
Ketamine
Past 24 hrs Past 2 days Past Month Past Year Over a Year Never
0 00 0 00 0 00 0 00 0 00 1 1000
Overall 1 1000
Marijuana
Past 24 hrs Past 2 days Past Month Past Year Over a Year Never
59 371 18 54 38 162 22 68 27 93 63 252
Overall 227 1000
Methadone
Past 24 hrs Past 2 days Past Month Past Year Over a Year Never
6 980 0 00 0 00 0 00 0 00 1 20
Overall 7 1000
Opiates
Past 24 hrs Past 2 days Past Month Past Year Over a Year Never
7 227 6 131 3 240 8 37 8 163
17 204 Overall 49 1000
Pain Killers
Past 24 hrs Past 2 days Past Month Past Year Over a Year Never
13 730 3 14 5 230 1 13 2 07 2 06
Overall 26 1000
124
2007 National Roadside Survey of Alcohol and Drug Use by Drivers Drug Results
Drug Category
PCP
Self-Reported Drug Use
Past 24 hrs Past 2 days Past Month Past Year Over a Year Never
Blood Positive for this Drug
N (Unweighted)
(Weighted)
0 NA 0 NA 0 NA 0 NA 0 NA 0 NA
Overall 0 NA
Table 142 Nighttime Seat Belt Observation by Drug Prevalence (Blood)
Drug Drug N Negative Positive
(Unweighted) (Weighted) (Weighted
Driver Seat Belt Observation Yes 3159 865 135 No 106 758 242
Table 143 Nighttime Seat Belt Observation by Drug Class (Percentages Calculated by Row) (Blood)
N (Un
wei
gh
ted
)
An
tid
epre
ssa
nts
(W
eig
hte
d)
Mar
ijuan
a (W
eig
hte
d)
Nar
coti
c-A
nal
ges
ic
(Wei
gh
ted
)
Sed
ativ
es
(Wei
gh
ted
)
Sti
mu
lan
ts(W
eig
hte
d)
Oth
er(W
eig
hte
d)
gt1
Dru
g C
lass
(W
eig
hte
d)
Neg
ativ
e (W
eig
hte
d)
Driver Seat Belt Observation Yes 3156 11 65 08 12 18 03 19 865 No 106 02 139 31 00 44 00 25 758
125
N
(Un
wei
gh
ted
)
An
tid
epre
ssa
nts
(W
eig
hte
d)
Mar
ijuan
a
(Wei
gh
ted
)
Nar
coti
c-A
nal
ge
sic
(W
eig
hte
d)
Sed
ativ
es
(W
eig
hte
d)
Sti
mu
lan
ts
(Wei
gh
ted
)
Oth
er
(Wei
gh
ted
)
gt1
Dru
g C
lass
(W
eig
hte
d)
Neg
ativ
e
(Wei
gh
ted
)
Motorcycle Riders (Operators) 48 085 473 000 713 1070 058 000 7600 Helmet 37 124 192 000 1034 156 084 000 8410 No Helmet Use 9 000 1152 000 000 3253 000 000 5595 Unknown 2 000 000 000 000 000 000 000 10000
2007 National Roadside Survey of Alcohol and Drug Use by Drivers Drug Results
Table 144 Nighttime Seat Belt Observation by Drug Category (Blood)
N (Unwtd)
Illegal
(Weighted)
Medications (Weighted)
Illegal amp Medications (Weighted)
Negative
(Weighted) Driver Seat Belt Observation
Yes 3156 881 400 066 8653 No 106 2025 339 055 7581
Table 145 Nighttime Helmet Use for Motorcycle Riders (Operators) by Drug Positive (Blood)
N (Unweighted)
Drug Positive (Weighted)
Motorcycle Riders (Operators) Helmet
48 37
2400 1590
No Helmet Use 9 4405 Unknown 2 000
Table 146 Nighttime Helmet Use for Motorcycle Riders (Operators) by Drug Class (Percentages Calculated by Row) (Blood)
Table 147 Nighttime Helmet Use for Motorcycle Riders (Operators) by Drug Category (Percentages Calculated by Row) (Blood)
N (Unwtd)
Illegal
(Weighted)
Medications (Weighted)
Illegal amp Medications (Weighted)
Negative
(Weighted)
Motorcycle Riders (Operators) 48 1543 857 000 7600 Helmet 37 348 1242 000 8410 No Helmet Use 9 4405 000 000 5595 Unknown 2 000 000 000 10000
126
N
(Un
wei
gh
ted
)
An
tid
epre
ssa
nts
(W
eig
hte
d)
Mar
ijuan
a
(Wei
gh
ted
)
Nar
coti
c-A
nal
ge
sic
(W
eig
hte
d)
Sed
ativ
es
(W
eig
hte
d)
Sti
mu
lan
ts
(Wei
gh
ted
)
Oth
er
(Wei
gh
ted
)
gt1
Dru
g C
lass
(W
eig
hte
d)
Neg
ativ
e
(Wei
gh
ted
)
Yes 122 16 109 04 02 104 00 82 683 No 3080 11 65 09 11 16 03 18 868 Total 3202 11 67 09 10 19 03 20 861
2007 National Roadside Survey of Alcohol and Drug Use by Drivers Drug Results
Table 148 Nighttime Arrests and Drug Positives (Blood) ldquoDuring the past 12 months were you arrested and booked for driving under the influence of alcohol or drugsrdquo
N Drug Positive (Unweighted) (Weighted)
Yes 122 317 No 3080 132 Total 3202 139
(p lt 01)
Table 149 Nighttime Arrests and Drug Class (Blood) ldquoDuring the past 12 months were you arrested and booked for driving under the influence of alcohol or drugsrdquo
Table 150 Nighttime Arrests and Drug Categories (Blood) ldquoDuring the past 12 months were you arrested and booked for driving under the influence of alcohol or drugsrdquo
N (Unwtd)
Illegal
(Weighted)
Medications (Weighted)
Illegal amp Medications (Weighted)
Negative
(Weighted) Yes 122 223 36 58 683 No 3080 87 41 04 868 Total 3202 92 41 06 861
Table 151 Nighttime Past Treatment Program and Drug Positive (Blood) ldquoDuring the past 12 months did you ever stay at least overnight in an inpatient or residential drug or alcohol
treatment programrdquo
N (Unweighted)
Drug Positive (Weighted)
Yes 31 220 No 3065 137 Total 3096 138
127
N (Un
wei
gh
ted
)
An
tid
epre
ssa
nts
(Wei
gh
ted
)
Mar
ijuan
a(W
eig
hte
d)
Nar
coti
c-A
nal
ge
sic
(Wei
gh
ted
)
Sed
ativ
es
(Wei
gh
ted
)
Sti
mu
lan
ts
(Wei
gh
ted
)
Oth
er(W
eig
hte
d)
gt1
Dru
g C
lass
(
Wei
gh
ted
)
Neg
ativ
e (W
eig
hte
d)
Yes 31 00 22 15 09 24 00 150 780 No 3065 11 68 09 11 17 03 18 863 Total 3096 11 68 09 11 17 03 19 862
2007 National Roadside Survey of Alcohol and Drug Use by Drivers Drug Results
Table 152 Nighttime Inpatient and Drug Class (Blood) ldquoDuring the past 12 months did you ever stay at least overnight in an impatient or residential drug or alcohol treatment program for
example detox rehab a therapeutic community or a hospitalrdquo
Table 153 Nighttime Inpatient and Drug Category (Blood) ldquoDuring the past 12 months did you ever stay at least overnight in an impatient or residential drug or alcohol treatment program for
example detox rehab a therapeutic community or a hospitalrdquo
N (Unwtd)
Illegal
(Weighted)
Medications (Weighted)
Illegal amp Medications (Weighted)
Negative
(Weighted) Yes 31 46 25 150 780 No 3065 93 39 04 863 Total 3096 93 39 06 862
Table 154 Nighttime Outpatient and Drug Positive (Blood) ldquoHave you ever been admitted to an outpatient drug or alcohol treatment program NOT including meetings like AA or NArdquo
Yes
N (Unweighted)
109
Drug Positive (Weighted)
223 No 3089 135 Total 3198 137
128
N
(Un
wei
gh
ted
)
An
tid
epre
ssa
nts
(W
eig
hte
d)
Mar
ijuan
a
(Wei
gh
ted
)
Nar
coti
c-A
nal
ge
sic
(W
eig
hte
d)
Sed
ativ
es
(W
eig
hte
d)
Sti
mu
lan
ts
(Wei
gh
ted
)
Oth
er
(Wei
gh
ted
)
gt1
Dru
g C
lass
(W
eig
hte
d)
Neg
ativ
e
(Wei
gh
ted
)
Yes 109 21 89 06 03 93 00 11 777 No 3089 11 66 09 11 15 03 20 865 Total 3198 11 67 09 10 17 03 20 863
N (Unweighted)
Drug Positive (Weighted)
Yes 74 262 No 3120 134 Total 3194 138
(p lt 01)
2007 National Roadside Survey of Alcohol and Drug Use by Drivers Drug Results
Table 155 Nighttime Outpatient and Drug Class (Blood) ldquoHave you ever been admitted to an outpatient drug or alcohol treatment program NOT including meetings like AA or NArdquo
Table 156 Nighttime Outpatient and Categories (Blood) ldquoHave you ever been admitted to an outpatient drug or alcohol treatment program NOT including meetings like AA or NArdquo
N (Unwtd)
Illegal
(Weighted)
Medications (Weighted)
Illegal amp Medications (Weighted)
Negative
(Weighted) Yes 109 185 30 08 777 No 3089 89 40 06 865 Total 3198 91 40 06 863
Table 157 Nighttime AA or NA and Drug Positives (Blood) ldquoDuring the past 12 months have you received treatment for your drug or alcohol use in a self-help group such as AA or NArdquo
129
N
(Un
wei
gh
ted
)
An
tid
epre
ssa
nts
(W
eig
hte
d)
Mar
ijuan
a
(Wei
gh
ted
)
Nar
coti
c-A
nal
ge
sic
(W
eig
hte
d)
Sed
ativ
es
(W
eig
hte
d)
Sti
mu
lan
ts
(Wei
gh
ted
)
Oth
er
(Wei
gh
ted
)
gt1
Dru
g C
lass
(W
eig
hte
d)
Neg
ativ
e
(Wei
gh
ted
)
Yes 74 00 171 11 03 53 00 23 738 No 3120 11 64 09 11 16 03 20 866
1 Total 3194 1 67 09 10 17 03 20 862
2007 National Roadside Survey of Alcohol and Drug Use by Drivers Drug Results
Table 158 Nighttime AA or NA and Class (Blood) ldquoDuring the past 12 months have you received treatment for your drug or alcohol use in a self-help group such as AA or NArdquo
Table 159 Nighttime AA or NA and Drug Categories (Blood) ldquoDuring the past 12 months have you received treatment for your drug or alcohol use in a self-help group such as AA or NArdquo
N (Unwtd)
Illegal
(Weighted)
Medications (Weighted)
Illegal amp Medications (Weighted)
Negative
(Weighted) Yes 74 225 33 04 738 No 3120 88 40 06 866 Total 3194 92 40 06 862
130
2007 National Roadside Survey of Alcohol and Drug Use by Drivers Drug Results
131
2007 National Roadside Survey of Alcohol and Drug Use by Drivers Drug Results
132
DOT HS 811 249December 2009
2007 National Roadside Survey of Alcohol and Drug Use by Drivers Drug Results
ii
2007 National Roadside Survey of Alcohol and Drug Use by Drivers Drug Results
Acknowledgements The authors received extensive assistance from State and local officials in the conduct of this project Our data collection procedures were not routine The willingness of officials to help us identify cooperating local law enforcement agencies and the willingness of agencies to participate in the project were essential to our success To all those who helped in conducting this study the authors express their sincere gratitude
iii
2007 National Roadside Survey of Alcohol and Drug Use by Drivers Drug Results
iv
Executive Summary 1
Methodology1 Results3 Summary 8
Introduction9 Background9 Prevalence of Drug-Involved Driving 10 Impact of Drugs on Driving Skills10
Laboratory Studies 10 Field Data11
Challenges in Measurement and Todayrsquos Drug Testing Opportunities13 Project Objectives 14
Methods17 Survey Sampling Procedures 17 Preparation for the 2007 NRS Survey 20 Driver Conversion23 Selection of Drugs for Screening and Analysis 24 Oral Fluid Collection Device 27 Blood Collection Procedures 29 Drug Questionnaire31
Oral Fluid Sample Analysis Procedures 32 Gas Chromatography-Mass Spectrometry (GCMS)32 Liquid Chromatography-Tandem Mass Spectrometry (LCMS-MS)32 Blood Sample Analysis Procedures 33 Ethanol (Oral Fluid and Blood) 33
Drug Classes and Categories 33 Results37
Oral Fluid Results (Daytime and Nighttime Samples) 37 Driver Drug Use Prevalence Based on Oral Fluid Results 37 Driver Drug Use Prevalence by Drug Class Based on Oral Fluid Results 44 Driver Drug Use Prevalence by Drug Category Based on Oral Fluid Results 48 Driver Drug Prevalence Based on Oral Fluid and BAC Results 53 Drugs Oral Fluid Results and Agreement With Self-Reported Drug Use59 Observed Safety Measures of Daytime and Nighttime Drivers (Oral Fluid) 62 Reported Contact With the Criminal Justice System (Oral Fluid) 66 Reported Contact With the Health System (Oral Fluid)69
Blood Results (Nighttime Samples)76 Driver Drug Use Prevalence Based on Blood Results76 Driver Drug Use Prevalence by Drug Class Based on Blood Results80 Driver Drug Use Prevalence by Drug Category Based on Blood Results82 Driver Drug Use Prevalence From Blood and BAC Results85
Oral Fluid andor Blood Results (Nighttime Samples)89 Driver Drug Use Prevalence Based on Oral Fluid andor Blood Results 89
2007 National Roadside Survey of Alcohol and Drug Use by Drivers Drug Results
Table of Contents
v
2007 National Roadside Survey of Alcohol and Drug Use by Drivers Drug Results
Driver Drug Use Prevalence by Drug Class Based on Oral Fluid andor Blood Results 94 Driver Drug Use Prevalence by Drug Category Based on Oral Fluid andor Blood Results 96 Driver Drug Use Prevalence From Oral Fluid andor Blood and BAC Results 98
Individual Drug Prevalence Estimates from Oral Fluid and Oral Fluid andor Blood Combined102
Overall Individual Drug Prevalence in Daytime and Nighttime 103 Individual Drug Prevalence in Nighttime Oral Fluid andor Blood 105 Individual Drug Prevalence Sorted by Drug Type from Oral Fluid and Oral Fluid andor Blood Combined107
Discussion111 Oral Fluid Analyses 111 Blood Analyses 113 Oral Fluid andor Blood Analyses Combined114
References115 Appendix A121
2007 National Roadside Survey Additional Tables122
Tables Table 1 Participating Drivers (Percentages in Parentheses) 3 Table 2 Drug Prevalence by Time of Day (Oral Fluid) 3 Table 3 Drug Categories Distribution by Time of Day (Oral Fluid) 4 Table 4 BAC Among Drug-Positive Drivers by Drug Category and Time of Day (Oral Fluid) 5 Table 5 Drug Classes by Time of Day and Region (Oral Fluid) 6 Table 6 Number and Distribution of Drug Classes by Time of Day (Oral Fluid) 6 Table 7 Drug Categories Distribution (Blood) 7 Table 8 BAC Among Drug-Positive Drivers by Drug Category (Percentage by Row) (Blood)7 Table 9 Comparison of Number of Nighttime Participants by Year in the National Roadside
Surveys21 Table 10 Participating Drivers (Percentages in Parentheses) 22 Table 11 Oral Fluid Analysis Results Among Converted Drivers 23 Table 12 Blood Analysis Results Among Converted Drivers 23 Table 13 Selected Drugs and Minimum Detection Concentrationsdagger24 Table 14 Extraction Efficiency of Quantisaltrade Oral Fluid Collection Device Over a Range of
Drugs Quintela29 Table 15 Extraction Efficiency of Quantisaltrade Oral Fluid Collection Device Over a Range of
Drugs Moore 29 Table 16 Drug Questionnaire Survey 31 Table 17 Drug Class CompositionmdashOral Fluid and Blood Combined 34 Table 18 Drug Category CompositionmdashOral Fluid and Blood Combined 35 Table 19 Drug Prevalence by Time of Day (Oral Fluid) 38 Table 20 Drug Prevalence by Time of DaySession (Oral Fluid)38 Table 21 Drug Prevalence by Time of Day and Region (Oral Fluid)39 Table 22 Drug Prevalence by Time of Day and Gender (Oral Fluid) 39 Table 23 Drug Prevalence by Time of Day and Age (Oral Fluid)40 Table 24 Drug Prevalence by Time of Day Age and Gender (Oral Fluid)41
vi
2007 National Roadside Survey of Alcohol and Drug Use by Drivers Drug Results
Table 25 Drug Prevalence by RaceEthnicity (Oral Fluid)42 Table 26 Drug Prevalence by Education Level (Oral Fluid) 42 Table 27 Drug Prevalence by Employment Status (Oral Fluid) 43 Table 28 Drug Prevalence by Vehicle Type (Oral Fluid)44 Table 29 Number and Distribution of Drug Classes by Time of Day (Oral Fluid) 44 Table 30 Number and Distribution of Drug Classes by Time of Day (Drug Positives Only)
(Oral Fluid) 45 Table 31 Drug Classes by Time of Day and Region (Oral Fluid) 46 Table 32 Drug Classes Distribution by Time of Day and Gender (Oral Fluid)47 Table 33 Drug Class Distribution by Time of Day and Age (Oral Fluid) 48 Table 34 Drug Categories Distribution by Time of Day (Oral Fluid) 49 Table 35 Drug Categories Distribution by Time of Day and Region (Oral Fluid)50 Table 36 Drug Categories Distribution by Time of Day and Gender (Oral Fluid)51 Table 37 Drug Categories Distribution by Time of Day and Age (Oral Fluid)52 Table 38 Drug Prevalence by Time of Day and BAC (Percentages Calculated by Row)
(Oral Fluid) 54 Table 39 Drug Prevalence by Time of Day and BAC
(Percentages Calculated by Column) (Oral Fluid)54 Table 40 BAC Among Drug-Positive Drivers by Time of Day and Age (Oral Fluid)55 Table 41 BAC Among Drug-Positive Drivers by Number of Drug Classes and Time of Day
(Percentages Calculated by Column) (Oral Fluid)55 Table 42 BAC Among Drug-Positive Drivers by Number of Drug Classes and Time of Day
(Percentages Calculated by Row) (Oral Fluid)56 Table 43 BAC Among Drug-Positive Drivers by Drug Category and Time of Day
(Oral Fluid) 56 Table 44 BAC of Drivers by Drug Category Age and Time of Day (Oral Fluid)57 Table 45 BAC of Drivers by Drug Category Gender and Time of Day (Oral Fluid)58 Table 46 Oral Fluid Results and Agreement With Self-Reported by Drug Type (Oral Fluid) 60 Table 47 Daytime Seat Belt Observation By Drug Prevalence (Oral Fluid)62 Table 48 Nighttime Seat Belt Observation by Drug Prevalence (Oral Fluid) 62 Table 49 Daytime Seat Belt Observation by Drug Class (Percentages Calculated by Row)
(Oral Fluid) 63 Table 50 Nighttime Seat Belt Observation by Drug Class (Percentages Calculated by Row)
(Oral Fluid) 63 Table 51 Daytime Seat Belt Observation by Drug Category (Percentages Calculated by Row)
(Oral Fluid) 64 Table 52 Nighttime Belt Observation by Drug Category (Percentages Calculated by Row)
(Oral Fluid) 64 Table 53 Daytime Helmet Use for Motorcycle Riders (Operators) by Drug Positive
(Oral Fluid) 64 Table 54 Nighttime Helmet Use for Motorcycle Riders (Operators) by Drug Positive
(Oral Fluid) 65 Table 55 Daytime Helmet Use for Motorcycle Riders (Operators) by Drug Class
(Oral Fluid) 65 Table 56 Nighttime Helmet Use for Motorcycle Riders (Operators) by Drug Class
(Percentages Calculated by Row) (Oral Fluid)65
vii
2007 National Roadside Survey of Alcohol and Drug Use by Drivers Drug Results
Table 57 Daytime Helmet Use for Motorcycle Riders (Operators) by Drug Category (Oral Fluid) 66
Table 58 Nighttime Helmet Use for Motorcycle Riders (Operators) by Drug Category (Percentages Calculated by Row) (Oral Fluid)66
Table 59 Arrests and Drug Positives Daytime (Oral Fluid) ldquoDuring the past 12 months were you arrested and booked for driving under the influence of alcohol or drugsrdquo66
Table 60 Arrests and Drug Positives Nighttime (Oral Fluid) ldquoDuring the past 12 months were you arrested and booked for driving under the influence of alcohol or drugsrdquo67
Table 61 Arrests and Drug Class Daytime (Oral Fluid) ldquoDuring the past 12 months were you arrested and booked for driving under the influence of alcohol or drugsrdquo67
Table 63 Arrests and Drug Categories Daytime (Oral Fluid) ldquoDuring the past 12 months were you arrested and booked for driving under the influence of alcohol or drugsrdquo68
Table 64 Arrests and Drug Categories Nighttime (Oral Fluid) ldquoDuring the past 12 months were you arrested and booked for driving under the influence of alcohol or drugrdquo 68
Table 65 Past Treatment Program and Drug Positive Daytime (Oral Fluid) ldquoDuring the past 12 months did you ever stay at least overnight in an inpatient or residential drug or alcohol treatment programrdquo 69
Table 66 Past Treatment Program and Drug Positive Nighttime (Oral Fluid) ldquoDuring the past 12 months did you ever stay at least overnight in an inpatient or residential drug or alcohol treatment programrdquo69
Table 67 Outpatient and Drug Positive Daytime (Oral Fluid) ldquoHave you ever been admitted to an outpatient drug or alcohol treatment program NOT including meetings like AA or NArdquo 70
Table 68 Outpatient and Drug Positive Nighttime (Oral Fluid) ldquoHave you ever been admitted to an outpatient drug or alcohol treatment program NOT including meetings like AA or NArdquo 70
Table 69 AA or NA and Drug Positives Daytime (Oral Fluid) ldquoDuring the past 12 months have you received treatment for your drug or alcohol use in a self-help group such as Alcoholics Anonymous or Narcotics Anonymousrdquo70
Table 70 AA or NA and Drug Positives Nighttime (Oral Fluid) ldquoDuring the past 12 months have you received treatment for your drug or alcohol use in a self-help group such as Alcoholics Anonymous of Narcotics Anonymousrdquo71
Table 71 Inpatient and Drug Class Daytime (Oral Fluid) ldquoDuring the past 12 months did you ever stay at least overnight in an impatient or residential drug or alcohol treatment program for example detox rehab a therapeutic community or a hospitalrdquo71
Table 72 Inpatient and Drug Class Nighttime (Oral Fluid) ldquoDuring the past 12 months did you ever stay at least overnight in an impatient or residential drug or alcohol treatment program for example detox rehab a therapeutic community or a hospitalrdquo72
Table 73 Inpatients and Drug Category Daytime (Oral Fluid) ldquoDuring the past 12 months were you arrested and booked for driving under the influence of alcohol or drugsrdquo72
Table 74 Inpatients and Drug Category Nighttime (Oral Fluid) ldquoDuring the past 12 months were you arrested and booked for driving under the influence of alcohol or drugsrdquo72
Table 75 Outpatient and Drug Class Daytime (Oral Fluid) ldquoHave you ever been admitted to an outpatient drug or alcohol treatment program NOT including meetings like AA or NArdquo 73
viii
2007 National Roadside Survey of Alcohol and Drug Use by Drivers Drug Results
Table 76 Outpatient and Drug Class Nighttime (Oral Fluid) ldquoHave you ever been admitted to an outpatient drug or alcohol treatment program NOT including meetings like AA or NArdquo 73
Table 77 Outpatient and Categories Daytime (Oral Fluid) ldquoHave you ever been admitted to an outpatient drug or alcohol treatment program NOT including meetings like AA or NArdquo 74
Table 78 Outpatient and Categories Nighttime (Oral Fluid) ldquoHave you ever been admitted to an outpatient drug or alcohol treatment program NOT including meetings like AA or NArdquo 74
Table 79 AA NA and Classes Daytime (Oral Fluid) ldquoDuring the past 12 months have you received treatment for your drug or alcohol use in a self-help group such as AA or NArdquo74
Table 80 AA NA and Classes Nighttime (Oral Fluid) ldquoDuring the past 12 months have you received treatment for your drug or alcohol use in a self-help group such as AA or NArdquo75
Table 81 NA AA and Drug Categories Daytime (Oral Fluid) ldquoDuring the past 12 months have you received treatment for your drug or alcohol use in a self-help group such as AA or NArdquo 75
Table 82 NA AA and Drug Categories Nighttime (Oral Fluid) ldquoDuring the past 12 months have you received treatment for your drug or alcohol use in a self-help group such as AA or NArdquo 76
Table 83 Drug Prevalence by Time of Day (Blood)76 Table 84 Drug Prevalence by Session (Blood) 77 Table 85 Drug Prevalence by Region (Blood)77 Table 86 Drug Prevalence by Gender (Blood) 77 Table 87 Drug Prevalence by Age (Blood)78 Table 88 Drug Prevalence by Age and Gender (Blood) 78 Table 89 Drug Prevalence by RaceEthnicity (Blood) 78 Table 90 Drug Prevalence by Education Level (Blood)79 Table 91 Drug Prevalence by Employment Status (Blood)79 Table 92 Drug Prevalence by Vehicle Type (Blood)80 Table 93 Number and Distribution of Drug Classes (Blood) 80 Table 94 Drug Classes Distribution by Region (Blood)81 Table 95 Drug Classes Distribution by Gender (Blood)81 Table 96 Drug Classes Distribution by Age (Blood)82 Table 97 Drug Categories Distribution (Blood) 82 Table 98 Drug Categories Distribution by Region (Blood)83 Table 99 Drug Categories Distribution by Gender (Blood)84 Table 100 Drug Categories Distribution by Age (Blood)85 Table 101 Drug Prevalence by BAC (Percentages Calculated by Row) (Blood)86 Table 102 Drug Prevalence by BAC (Percentages Calculated by Column) (Blood) 86 Table 103 BAC Among Drug-Positive Drivers by Age (Blood)86 Table 104 BAC Among Drug-Positive Drivers by Number of Drug Classes
(Percentages Calculated by Column) (Blood) 87 Table 105 BAC Among Drug-Positive Drivers by Number of Drug Classes
(Percentages Calculated by Row) (Blood)87 Table 106 BAC Among Drug-Positive Drivers by Drug Category
(Percentage by Row) (Blood) 87 Table 107 BAC Among Drug-Positive Drivers by Drug Category
(Percentage by Column) (Blood) 88
ix
2007 National Roadside Survey of Alcohol and Drug Use by Drivers Drug Results
Table 108 BAC of Drivers by Drug Category and Age (Blood) 88 Table 109 BAC of Drivers by Drug Category and Gender (Blood) 89 Table 110 Nighttime Drug Prevalence by Time of Day (Oral Fluid andor Blood)90 Table 111 Drug Prevalence by Session (Oral Fluid andor Blood) 90 Table 112 Drug Prevalence by Region (Oral Fluid andor Blood)90 Table 113 Drug Prevalence by Gender (Oral Fluid andor Blood)91 Table 114 Drug Prevalence by Age (Oral Fluid andor Blood)91 Table 115 Drug Prevalence by Age and Gender (Oral Fluid andor Blood) 92 Table 116 Drug Prevalence by RaceEthnicity (Oral Fluid andor Blood)92 Table 117 Drug Prevalence by Education Level (Oral Fluid andor Blood) 93 Table 118 Drug Prevalence by Employment Status (Oral Fluid andor Blood) 93 Table 119 Drug Prevalence by Vehicle Type (Oral Fluid andor Blood)93 Table 120 Number and Distribution of Drug Classes (Oral Fluid andor Blood) 94 Table 121 Number and Distribution of Drug Classes (Drug Positives Only)
(Oral Fluid andor Blood) 94 Table 122 Drug Classes Distribution by Region (Oral Fluid andor Blood) 95 Table 123 Drug Classes Distribution by Gender (Oral Fluid andor Blood)95 Table 124 Drug Classes Distribution by Age (Oral Fluid andor Blood) 96 Table 125 Drug Categories Distribution (Oral Fluid andor Blood)96 Table 126 Drug Categories Distribution by Region (Oral Fluid andor Blood) 97 Table 127 Drug Categories by Gender (Oral Fluid andor Blood) 97 Table 128 Drug Categories Distribution by Age (Oral Fluid andor Blood)98 Table 129 Drug Prevalence by BAC (Percentages Calculated by Row)
(Oral Fluid andor Blood) 99 Table 130 Drug Prevalence by BAC (Percentages Calculated by Column)
(Oral Fluid andor Blood) 99 Table 131 BAC Among Drug-Positive Drivers by Age (Oral Fluid andor Blood)99 Table 132 BAC Among Drug-Positive Drivers by Number of Drug Classes
(Percentages Calculated by Column) (Oral Fluid andor Blood)100 Table 133 BAC Among Drug-Positive Drivers by Number of Drug Classes
(Percentages Calculated by Row) (Oral Fluid andor Blood)100 Table 134 BAC Among Drug-Positive Drivers by Drug Category
(Oral Fluid andor Blood) 100 Table 135 BAC of Drivers by Drug Category and Age (Oral Fluid andor Blood) 101 Table 136 BAC of Drivers by Drug Category and Gender (Oral Fluid andor Blood) 102 Table 137 Prevalence of Drugs in Daytime and Nighttime Drivers (Oral Fluid)104 Table 138 Prevalence of Drugs in All Drug-Tested Nighttime Drivers
(Oral Fluid andor Blood) 106 Table 139 Prevalence of Drugs in Daytime and Nighttime Drivers (Oral Fluid)108 Table 140 Prevalence of Drugs in All Drug-Tested Nighttime Drivers (Oral Fluid andor Blood) 109 Table 141 Nighttime Blood Results and Agreement With Self-Reported by
Drug Type (Blood)123 Table 142 Nighttime Seat Belt Observation by Drug Prevalence (Blood)125 Table 143 Nighttime Seat Belt Observation by Drug Class
(Percentages Calculated by Row) (Blood)125
x
2007 National Roadside Survey of Alcohol and Drug Use by Drivers Drug Results
Table 144 Nighttime Seat Belt Observation by Drug Category (Blood)126 Table 145 Nighttime Helmet Use for Motorcycle Riders (Operators)
by Drug Positive (Blood) 126 Table 146 Nighttime Helmet Use for Motorcycle Riders (Operators) by Drug Class
(Percentages Calculated by Row) (Blood)126 Table 147 Nighttime Helmet Use for Motorcycle Riders (Operators) by Drug Category
(Percentages Calculated by Row) (Blood)126 Table 148 Nighttime Arrests and Drug Positives (Blood) ldquoDuring the past 12 months
were you arrested and booked for driving under the influence of alcohol or drugsrdquo127 Table 149 Nighttime Arrests and Drug Class (Blood) ldquoDuring the past 12 months
were you arrested and booked for driving under the influence of alcohol or drugsrdquo127 Table 150 Nighttime Arrests and Drug Categories (Blood) ldquoDuring the past 12 months
were you arrested and booked for driving under the influence of alcohol or drugsrdquo127 Table 151 Nighttime Past Treatment Program and Drug Positive (Blood)
ldquoDuring the past 12 months did you ever stay at least overnight in an inpatient or residential drug or alcohol treatment programrdquo 127
Table 152 Nighttime Inpatient and Drug Class (Blood) ldquoDuring the past 12 months did you ever stay at least overnight in an impatient or residential drug or alcohol treatment program for example detox rehab a therapeutic community or a hospitalrdquo128
Table 153 Nighttime Inpatient and Drug Category (Blood) ldquoDuring the past 12 months did you ever stay at least overnight in an impatient or residential drug or alcohol treatment program for example detox rehab a therapeutic community or a hospitalrdquo128
Table 154 Nighttime Outpatient and Drug Positive (Blood) ldquoHave you ever been admitted to an outpatient drug or alcohol treatment program NOT including meetings like AA or NArdquo128
Table 155 Nighttime Outpatient and Drug Class (Blood) ldquoHave you ever been admitted to an outpatient drug or alcohol treatment program NOT including meetings like AA or NArdquo 129
Table 156 Nighttime Outpatient and Categories (Blood) ldquoHave you ever been admitted to an outpatient drug or alcohol treatment program NOT including meetings like AA or NArdquo 129
Table 157 Nighttime AA or NA and Drug Positives (Blood) ldquoDuring the past 12 months have you received treatment for your drug or alcohol use in a self-help group such as AA or NArdquo129
Table 158 Nighttime AA or NA and Class (Blood) ldquoDuring the past 12 months have you received treatment for your drug or alcohol use in a self-help group such as AA or NArdquo 130
Table 159 Nighttime AA or NA and Drug Categories (Blood) ldquoDuring the past 12 months have you received treatment for your drug or alcohol use in a self-help group such as AA or NArdquo 130
Figures Figure 1 Map of Sixty 2007 National Roadside Survey Sites 19 Figure 2 Collecting an Oral Fluid Sample with the Quantisaltrade Oral Fluid Collection Device 28
xi
2007 National Roadside Survey of Alcohol and Drug Use by Drivers Drug Results
xii
2007 National Roadside Survey of Alcohol and Drug Use by Drivers Drug Results
Executive Summary This report presents the first US national prevalence estimate of drug-involved driving It is based on the results of analyses of oral fluid blood and breath specimens collected during the 2007 National Roadside Survey of Alcohol and Drug Use by Drivers It is one of the three reports that summarize the results of a 2007 study conducted by the Pacific Institute for Research and Evaluation (PIRE) for the National Highway Traffic Safety Administration (NHTSA) under Contract DTNH22-06-C-00040 ldquo2007 Roadside Survey of Alcohol and Drugged Drivingrdquo There are two prior reports on the 2007 National Roadside Survey (NRS) (1) ldquo2007 National Roadside Survey of Alcohol and Drug Use by Drivers Methodologyrdquo (Lacey Kelley-Baker Furr-Holden Voas Moore Brainard Tippetts Romano Torres amp Berning 2009a) which describes the sampling plan and data collection methodology and summarizes the response patterns to the various stages of the multi-part survey and (2) ldquo2007 National Roadside Survey of Alcohol and Drug Use by Drivers Alcohol Resultsrdquo (Lacey Kelley-Baker Furr-Holden Voas Romano Tippetts Ramirez Brainard amp Berning 2009b) which presents the prevalence estimates for alcohol-involved driving derived from the study and compares those estimates with data from the three previous National Roadside Surveys
Methodology Three prior national roadside surveys of drivers to estimate prevalence of drinking and driving and determine changes over time have been conducted in the United States These surveys which included a brief interview and a breath sample to determine blood alcohol concentration (BAC) were conducted on a stratified random sample of weekend nighttime drivers in the 48 contiguous States The first National Roadside Survey (NRS) sponsored by NHTSA was conducted in 1973 (Wolfe 1974) The second NRS was sponsored by the Insurance Institute for Highway Safety (IIHS) and conducted in 1986 (Lund amp Wolfe 1991) and the third jointly funded by IIHS and NHTSA was conducted in 1996 (Voas Wells Lestina Williams amp Greene 1998) NHTSA sponsored the 2007 NRS described in this report with additional funding from the National Institute on Alcohol Abuse and Alcoholism (NIAAA) the National Institute on Drug Abuse (NIDA) and the National Institute of Justice (NIJ) Like its predecessors the 2007 NRS covered the 48 contiguous States
As in previous NRS studies the 2007 NRS data were collected during the following periods on both Friday and Saturday nights 10 pm to midnight and 1 am to 3 am1 In addition the 2007 survey also included a Friday daytime data collection period either from 930 am to 1130 am or from 130 pm to 330 pm The prior three surveys did not include commercial vehicles and motorcycles in the sample this survey however included motorcycles In addition to a daytime survey and the inclusion of motorcycles the 2007 NRS included other features that the prior surveys did not (1) more data collectors per survey site to achieve a larger sample size (2) the collection of biological samples (oral fluid and blood) to determine the presence of drugs other than alcohol in the driving population (3) a questionnaire to allow an estimation of alcohol use disorders (AUDs) among drinking drivers (4) a questionnaire to study driversrsquo patterns of drug
1 In this report a ldquoFriday nightrdquo or a ldquoSaturday nightrdquo includes the early hours of the following day
1
2007 National Roadside Survey of Alcohol and Drug Use by Drivers Drug Results
consumption (5) questions about interaction with the criminal justice system and the treatment system and (6) collection of information on passengers
In all four NRS studies police officers directed vehicles to a safe location where an interviewer approached the driver and requested participation in a survey followed by a breath test Random selection of drivers was insured by selecting the next vehicle when an interviewer became available Any driver suspected of impairment was subjected to a safety protocol designed to dissuade hisher continued driving on that trip See the Methodology Report for details (Lacey et al 2009a)
As noted above the original 1973 survey used a four-stage sampling plan and the 1986 NRS attempted to replicate the 1973 locations In the 1996 and 2007 surveys the first stage was taken from the NHTSArsquos National Automotive Sampling SystemCrashworthiness Data System (NASSCDS 1995) The second stage involved the selection of police jurisdictions within the NASSCDS primary sampling units The third stage of the sampling design involved the selection of survey sites within police jurisdictions and the fourth stage consisted of selecting drivers at random from the traffic flow at these sites Details regarding the sampling plan can be found in the Methodology Report (Lacey et al 2009a)
New to the 2007 survey was the collection of additional types of biological samples (oral fluid and blood) to determine the presence of drugs other than alcohol in the driving population Oral fluid and blood samples were analyzed in a laboratory using enzyme-linked immunosorbent assay (ELISA) screening followed by a confirmatory analysis by Liquid Chromatography-Tandem Mass Spectrometry (LCMS-MS) or Gas ChromatographyMass Spectrometry (GCMS) This 2007 NRS is more extensive than any previous NRS study and provides a much broader perspective on alcohol and drug use in the driving population than previously available These data are essential to developing more precise estimates of the presence of alcohol and other drugs in drivers and in measuring the prevalence of alcohol- and drug-involved driving
This report summarizes the drug-involved driving prevalence estimates obtained through analyses of oral fluid and blood specimen results and combined with alcohol using breath alcohol measurements It should be emphasized that prevalence estimates do not necessarily imply ldquoimpairmentrdquo but rather in this case the presence of drugs and alcohol in the driver population For many drug types drug presence can be detected long after any impairment that might affect driving has passed2 Other studies are required to assess whether that presence implies an increased risk of crash involvement In this study we developed driver-prevalence estimates for illegal prescription and over-the-counter drugs which were determined by a panel of experts to possibly cause impairment It should be noted that prescription and over-the-counter drugs can be used according to medical advice or extra-medicinally Again the prevalence estimates indicate the presence of the drugs in drivers but do not necessarily indicate that the drivers were impaired Alcohol presence above the legal limit implies impairment alcohol below the legal limit may not imply impairment
2 For example traces of metabolites of marijuana can be detected in blood samples several days after chronic users stop ingestion Also whereas the impairment effects for various concentration levels of alcohol is well understood little evidence is available to link concentrations of other drug types to driver performance
2
2007 National Roadside Survey of Alcohol and Drug Use by Drivers Drug Results
As discussed earlier we gathered data from drivers on US roadways during Friday daytime hours and Friday nights and Saturday nights As indicated in Table 1 we obtained oral fluid samples from drivers in each of those data collection periods (1850 during daytime and 5869 during nighttime) We also collected blood samples during the nighttime data collection periods (3276)
Table 1 Participating Drivers (Percentages in Parentheses)
2007 Daytime Nighttime Total
Signaled to enter site 3516 9553 13069 Did not enter site 933 1016 1949 Entered site 2583 8537 11120 Eligible 2525 8384 10909
Entered site and interviewed 2174 (861) dagger 6920 (825) dagger 9094 (834) dagger
Valid breath sample 2254 (893) dagger 7159 (854) dagger 9413 (863) dagger
Oral Fluid sample 1850(733) dagger 5869 (700) dagger 7719 (707) dagger
Blood sample NA 3276 (391) dagger NA
AUD ampor Drug Questionnaire 1889 (752) dagger 5983 (714) dagger 7882 (722) dagger
NA (not applicable) Blood samples were not collected during daytime sessions In this table percentages are unweighted dagger Percent of eligible
Results In this study analyses of the oral fluid and blood samples were conducted to identify the presence of some 75 drugs and metabolites including illegal prescription and over-the-counter drugs
Comparison of overall drug prevalence by time of day (Table 2) indicates that 11 percent of drivers in the daytime sample were drug-positive This level was significantly lower than the 144 percent of nighttime drivers who tested positive for drugs (p lt 01)3
Table 2 Drug Prevalence by Time of Day (Oral Fluid)
Time of Day N
(Unweighted) Drug Positive
(Weighted) Daytime 1850 110 Nighttime 5869 144
To make the presentation of results most useful we identified three broad categories of drugs illegal prescription and over-the-counter Because few over-the-counter drugs were found the prescription and over-the-counter drugs were combined for many analyses and labeled
3 p lt 01 indicates that under the null hypothesis the probability of encountering this difference by chance is less than 1 percent p lt 05 indicates that the probability of encountering this difference by chance is less than 5 percent
3
2007 National Roadside Survey of Alcohol and Drug Use by Drivers Drug Results
ldquoMedicationsrdquo Additionally some respondents tested positive for more than one category of drug Thus tables presenting drug categories present four mutually exclusive categories Illegal Medications Illegal and Medications and Negative So as not to double count individual positive results an individualrsquos result appears in only one of these categories However for example in Table 3 to determine the proportion of daytime drivers who tested positive for illegal drugs one could sum the daytime values for the ldquoIllegalrdquo category (58) and for the rdquo Illegal amp Medicationsrdquo category (05) to arrive at a prevalence estimate of 63 of daytime drivers who were positive for at least one illegal drug Detailed summaries of prevalence estimates for individual drugs appear in Tables 137-140 later in the report As indicated in Table 3 comparison of drug categories by time of day revealed that based on oral fluid analyses almost 6 percent of daytime drivers tested positive for drugs in the ldquoIllegalrdquo category (primarily marijuana and cocaine) as opposed to over 10 percent of nighttime drivers There was a statistically significant difference between daytime and nighttime drivers (p lt 01)
Table 3 Drug Categories Distribution by Time of Day (Oral Fluid)
N Time of Day Drug Category (Unweighted) (Weighted)
Daytime
Illegal Medications Illegal amp Medications Negative
125 107 14
1604
58 48 05
890 Overall Daytime 1850 1000
Nighttime
Illegal Medications Illegal amp Medications Negative
575 201 60
5033
105 30 09
856 Overall Nighttime 5869 1000
ldquoMedicationsrdquo includes prescription and over-the-counter drugs
Positive results in the ldquoMedicationsrdquo category though not statistically significant were found to be slightly higher among the daytime drivers (almost 5) than nighttime drivers (3) Additionally some drivers tested positive for both ldquoIllegal drugs and Medicationsrdquo (05 of daytime drivers and 09 of nighttime drivers) This indicates that drugs were not detected in 890 percent of daytime drivers and 856 percent of nighttime drivers
When oral fluid drug category findings were combined with BAC results we found that in both the daytime and nighttime samples the drug-positive drivers who were also alcohol-positive were more likely to be positive for ldquoIllegalrdquo drugs than ldquoMedicationsrdquo (Table 4) This was particularly true in the nighttime sample in which 173 percent of drivers in the illegal category had BACs between zero and 08 grams per deciliter (gdL) (compared to 63 in the ldquoMedicationsrdquo category) and 57 percent had BACs greater than 08 (compared to 12 in the ldquoMedicationsrdquo category) (p lt 01) In the daytime sample however the differences were statistically non-significant (p value = 05)
4
2007 National Roadside Survey of Alcohol and Drug Use by Drivers Drug Results
Table 4 BAC Among Drug-Positive Drivers by Drug Category and Time of Day (Oral Fluid)
Time of Day Drug Category
N (Unweighted)
BAC (gdL)
Zero Between
Zero and 08 08+
Daytime Illegal Medications Illegal amp Medications Negative
125 107 14
1604
971 996 983 992
23 04 17 06
06 00 00 02
Nighttime Illegal Medications Illegal amp Medications Negative
575 199 60
5033
770 925 814 902
173 63
177 81
57 12 09 17
ldquoMedicationsrdquo includes prescription and over-the-counter drugs In this table percentages are weighted
In addition to the three drug categories we also examined drug class (Table 5) The drug classes were antidepressants marijuana narcotic-analgesics sedatives stimulants and other plus a ldquomore than one drugrdquo class To avoid double counting individual positive results the classes were mutually exclusive Thus for example since marijuana is both a class by itself and could appear in the ldquoMore than 1 classrdquo cell as well (as could other classes of drugs) from this table one cannot arrive at an overall prevalence estimate for marijuana alone However detailed summaries of prevalence estimates for individual drugs appear in Tables 137-140 later in the report In comparing prevalence of drug classes by time and region4 we found that marijuana was generally the most common drug class across all the regions both in daytime (39) and nighttime (61) samples Among the nighttime sample drivers in the Midwest and Northeast regions were more likely to test positive for marijuana than daytime drivers (p lt 05) In the South and West regions however there was little difference between daytime and nighttime drivers with respect to marijuana For stimulants a higher percentage of nighttime drivers in all regions tested positive than did daytime drivers However the difference was statistically significant only in the Midwest (p lt 01) and West (p lt 05)
When one examines the ldquoAllrdquo column of Table 5 one finds that overall sedatives were found in 16 percent of daytime drivers and in 06 percent of nighttime drivers Stimulants were found in 16 percent of daytime drivers and in 32 percent of nighttime drivers
4 Regions are defined by the NASSGES system according to US Census Regions (Midwest includes the West North Central and East North Central States Northeast includes New England and Middle Atlantic States South includes the West South Central East South Central and South Atlantic States and West includes West and Mountain States
5
2007 National Roadside Survey of Alcohol and Drug Use by Drivers Drug Results
Table 5 Drug Classes by Time of Day and Region (Oral Fluid)
Time of Midwest Northeast South West All Day Drug Class
Daytime
Antidepressants
Marijuana
Narcotic-Analgesics
Sedatives
Stimulants
Other
More than 1 Class
N=546
04
34
27
19
08
00
22
N=379
06
30
21
26
17
13
10
N=472
05
55
13
21
22
00
14
N=453
05
40
06
07
20
00
12
N=1850
05
39
16
16
16
02
15
Overall Drug Positive Daytime 115 125 131 89 110
Negative 885 875 869 911 890
Nighttime
Antidepressants
Marijuana
Narcotic-Analgesics
Sedatives
Stimulants
Other
More than 1 Class
N=1694
05
77
10
11
30
02
16
N=1111
02
76
28
02
23
00
41
N=1559
00
63
12
07
27
01
29
N=1505
01
41
18
04
40
05
20
N=5869
02
61
16
06
32
03
23
Overall Drug Positive Nighttime 150 173 140 129 144
Negative 850 827 860 871 856
In this table percentages are weighted ldquoMore than 1 Classrdquo ndash Drivers testing positive for more than one drug class are counted only in this category
Further as indicated in Table 6 comparison of number of drug classes by time of day indicated that nighttime drivers (23) were significantly more likely to test positive for more than one drug class than daytime drivers (15) (p lt 01)
Table 6 Number and Distribution of Drug Classes by Time of Day (Oral Fluid)
Number of N Time of Day Drug Classes (Unweighted) (Weighted)
1 206 95 2+ 40 15Daytime
Negative 1604 890 1850 1000
1 680 121 2+ 156 23
Overall Daytime
Nighttime Negative 5033 856
5869 1000Overall Nighttime
6
2007 National Roadside Survey of Alcohol and Drug Use by Drivers Drug Results
As mentioned earlier 3276 blood samples were obtained from nighttime drivers As expected the results of the blood analyses were quite close to those obtained by the nighttime driver oral fluid analyses For example (Table 7) among nighttime drivers 91 percent tested positive for ldquoIllegalrdquo drugs 4 percent for ldquoMedicationsrdquo and 07 percent for the combination of both ldquoIllegal and Medicationsrdquo
Table 7 Drug Categories Distribution (Blood)
N Drug Category (Unweighted) (Weighted)
Illegal 267 91 Medications 169 40 Illegal amp Medications 30 07 Negative 2810 862 Overall 3276 1000
ldquoMedicationsrdquo includes prescription and over-the-counter drugs
Additionally as indicated in Table 8 283 percent of nighttime drivers testing positive for ldquoIllegalrdquo drugs in blood also tested positive for alcohol as did 64 percent of drivers who tested positive for ldquoMedicationsrdquo and 232 percent of those testing positive for both ldquoIllegal drugs and Medicationsrdquo
Table 8 BAC Among Drug-Positive Drivers by Drug Category (Percentage by Row) (Blood)
Drug Category N
(Unweighted)
BAC (gdL)
Zero Between
Zero and 08 08+ Illegal 267 717 204 79 Medications 169 936 49 15 Illegal amp Medications 30 768 232 00
ldquoMedicationsrdquo includes prescription and over-the-counter drugs In this table percentages are weighted
As indicated in Table 6 some individuals tested positive for more than one drug Thus we also present the drug analysis results by individual drug where drug is the unit of analysis (Tables 137-140) Those results indicate that the most prevalent drug other than alcohol was marijuana The overall marijuana prevalence rate in oral fluid was 45 percent daytime and 77 percent nighttime
When we examined the analysis results of the combination of oral fluid andor blood in the nighttime driver population we found that the marijuana prevalence rate was 87 percent The next most frequently encountered individual drug was cocaine with a daytime oral fluid prevalence rate of 15 percent and a nighttime rate of 39 percent
7
2007 National Roadside Survey of Alcohol and Drug Use by Drivers Drug Results
Summary Overall analyses of the oral fluid samples obtained indicated a drug use prevalence rate of 11 percent for daytime drivers and 144 percent for nighttime drivers This difference between day and night is statistically significant (p lt 01) Among nighttime drivers providing blood samples 138 percent overall tested positive for at least one of the drugs in our panel This includes all drugs for which we tested whether illegal prescription or over-the-counter Additionally of the 98 percent of drivers testing positive for ldquoIllegalrdquo drugs in blood 28 percent also tested positive for alcohol as did 64 percent who tested positive for ldquoMedicationsrdquo and 232 percent for those testing for both ldquoIllegal drugs and Medicationsrdquo The most frequently encountered individual drug other than alcohol was marijuana
Again it is important to emphasize that the results presented in this report are estimates of the prevalence of drug use among drivers Further research is needed to determine the effect of drug prevalence on crash risk This report provides detailed displays of the data discussed above
8
2007 National Roadside Survey of Alcohol and Drug Use by Drivers Drug Results
Introduction This report presents prevalence estimates for drug-involved driving obtained from the 2007 National Roadside Survey of alcohol- and drug-involved driving Though national roadside surveys of alcohol-involved driving have been conducted on a decennial basis since the midshy1970s this is the first US national roadside survey where biological measures of drugs other than alcohol were obtained
Background Forty years ago when the Department of Transportation (DOT) was established it was well understood that alcohol was an important factor in traffic crashes In 1968 a new agency that was to become the National Highway Traffic Safety Administration (NHTSA) delivered its Report to the Congress on Alcohol and Highway Safety pointing to the need for improved data on drinking and driving (USDOT 1968) This need led to the establishment of incentives for States to conduct blood alcohol concentration (BAC) tests on all fatally injured drivers and pedestrians and eventually to the establishment of the Fatality Analysis Reporting System5
(FARS) in 1975 Initially this data file was limited by the low level of testing for alcohol by the States but since 1982 through the use of an imputation system and increased testing by states it has provided a reliable means of assessing the Nationrsquos progress in reducing crashes in which drivers have been drinking It is important to note however that FARS provides very limited information related to drugs While States routinely test drivers involved in fatal vehicle crashes for alcohol only a few also routinely test for other drugs According to the Centers for Disease Control and Prevention less than half of the fatalities in the 2005 FARS had drug test results available (CDC 2006) In our review of the FARS data we identified a lack of information related to drug use
In addition to FARS the national roadside survey (NRS) series estimates the prevalence of drinking and driving on weekends in the 48 contiguous States and assesses changes in prevalence over time The first NRS was conducted in 1973 (Wolfe 1974) the second in 1986 (Lund amp Wolfe 1991) and the third in 1996 (Voas Wells Lestina Williams amp Greene 1998) Each of these surveys included a brief verbal survey and a breath sample to determine BAC Together the first three national surveys and FARS (1995) document reductions in the number of drinking drivers on US roadways and alcohol-related fatalities over three decades The fourth NRS conducted in 2007 followed the general methodology of the three prior surveys in obtaining BACs to enable comparison with the earlier surveys but also incorporated several new features These included questionnaires on drug and alcohol use disorders and biological sampling of oral fluid and blood to determine the extent of the presence of drugs other than alcohol (ie illegal prescription and over-the-counter) among drivers
In 2005 NHTSA conducted a pilot study as a precursor to this full decennial 2007 NRS (Lacey et al 2007) The primary objective of the pilot study was to determine whether it was feasible to collect data for drugs other than alcohol through oral fluid and blood samples The pilot study consisted of six rounds of nighttime data collection with over 800 drivers participating in the survey Approximately 78 percent of the drivers participating in the survey agreed to provide an
5 FARS was originally called the Fatal Accident Reporting System
9
2007 National Roadside Survey of Alcohol and Drug Use by Drivers Drug Results
oral fluid sample and almost 50 percent of the drivers participating in the survey provided blood samples The pilot study showed that it was clearly feasible to conduct a survey that included drugs other than alcohol Such data are essential to developing more precise estimates of the presence of alcohol and other drugs in drivers and for estimating the prevalence of alcohol- and drug-involved driving
Prevalence of Drug-Involved Driving In their review of the research literature Kelly Darke and Ross (2004) cite the 2001 National Household Survey to report that 4 percent of US residents reported driving while under the influence of drugs in the preceding 12 months These data based on self-report did not distinguish between legal and illegal drugs Using data collected in Tennessee in December 1986 Lund Preusser Blomberg and Williams (1988) studied a sample of truck drivers to report prevalence of marijuana (15) cocaine (2) prescription stimulants (5) and nonprescription stimulants (12) among the drivers According to a literature review by Jones Shinar and Walsh (2003) the Lund et al study (1988) was at that time the only US study that had performed chemical tests of drivers stopped at a roadside location
With respect to prescription drugs Jones et al (2003) reported that benzodiazepines (tranquilizers) were found in four percent of non-crash-involved drivers De Gier (2006) reviewed the literature and reported that benzodiazepines were more commonly found in middle-aged to older drivers ldquopresumably due to the high rates of benzodiazepine prescriptions among these age groupsrdquo Neutel (1998) estimated a lower crash risk for older persons (OR = 28) after benzodiazepine use than younger persons (OR = 32)
Impact of Drugs on Driving Skills Laboratory Studies A number of laboratory studies have been conducted on the impact of both legal and illegal drugs on driving-related skills Still results from these experimental studies are not straightforward and are sometimes contradictory One confounding factor is that different drugs have different effects on driving-related skills with the thresholds at which those different effects occur varying as a function of the measure used (Shinar 2006) Additionally Shinar found that because of the large individual variation in human response to drug consumption attempts to define a ldquonormrdquo for the behavioral response to drugs is difficult
Some studies have found that drugs that stimulate the central nervous system (eg amphetamines cocaine caffeine) sometimes may improve laboratory driving performance (Ward Kelly Foltin amp Fischman 1997 Burns 1993 Higgins et al 1990 Hurst 1976) However in the Jones et al (2003) literature review it is reported that amphetamines are not usually associated with easily observable behavioral impairments
There is considerable evidence from laboratory studies that cannabis (marijuana) impairs reaction time attention tracking hand-eye coordination and concentration although not all of these impairments were equally detected by all studies (Couper amp Logan 2004a Heishman Stitzer amp Yingling 1989 Gieringer 1988 Moskowitz 1985) In reviewing the literature on marijuana Smiley (1998) concluded that marijuana impairs performance in divided attention tasks (ie a poorer performance on subsidiary tasks) Jones et al (2003) adds that Smileyrsquos finding is relevant to the multitasking essence of driving in particular by making marijuanashy
10
2007 National Roadside Survey of Alcohol and Drug Use by Drivers Drug Results
impaired drivers perhaps less able to handle unexpected events Interestingly there is also evidence showing that unlike alcohol marijuana enhances rather than mitigates the individualrsquos perception of impairment (Lamers amp Ramaekers 1999 Robbe amp OHanlon 1993 Perez-Reyes Hicks Bumberry Jeffcoat amp Cook 1988) Robbe and OHanlon (1993) reported that in laboratory conditions drivers under the influence of marijuana were aware of their impairment which led them to decrease speed avoid passing other vehicles and reduce other risk-taking behaviors Such was not the case with alcohol for the authors reported that alcohol-impaired drivers were generally not aware of impairment and therefore did not adjust their driving accordingly
There is laboratory evidence that benzodiazepines impair some driving skills (Drummer 2002) However there are some contradictory results Mathijssen et al (2002) reported on a case-control study conducted in the Netherlands that found there is an increased risk for benzodiazepine and alcohol use together but no increased risk for benzodiazepine use alone Additionally there is evidence that the impairing effects of benzodiazepine might be circumscribed to the first days of benzodiazepine use before tolerance develops (Lucki Rickels amp Geller 1985) leading some to conclude that the extent to which benzodiazepines increase crash risk has to be balanced against the health benefits for those taking these drugs for medicinal purposes (Beirness Simpson amp Williams 2006)
Laboratory reports are not necessarily the best indicators of the impact of drugs on driving skills As Beirness et al (2006 pages 16-17) stated ldquoan impairment or skill enhancement identified in a laboratory test may not show up on the road because the drugs may lead to other changes in driver behavior Additionally laboratory tests can address the effects of drugs only on skills not judgment and the latter may be as important when it comes to driving Thus even if drugs are found to affect driving skills in laboratory tests actual crash risk may or may not be affectedrdquo
Field Data Data from drivers apprehended for impaired driving have been used to estimate the prevalence of drug use Jones et al (2003) reviewed the literature on drug involvement among arrested drivers and reported a variety of drug prevalence levels based on the location and the population under study White et al (1981) reported the following prevalence of drugs among drivers arrested for impaired driving in California in the 1970s with BACs lower than 10 gdL sedativehypnotic (30 to 47) phencyclidine or PCP (79) and morphine (62) In contrast Polkis Maginn and Barr (1987) reported the following prevalence rates among drivers arrested in St Louis Missouri in the 1980s phencyclidine or PCP (47) marijuana (47) benzodiazepines (22) barbiturates (15) opiates (11) and cocaine (9) Walsh et al (2000) reported that marijuana and cocaine were the primary drugs detected (19 and 16 respectively) among arrested drivers in Tampa Florida with narcotics and amphetamines found in less than 1 percent of the drivers Thus as studies of drug-use patterns in the United States have shown the types of substances consumed vary across locations and time making it difficult to characterize the drug involvement of drivers
As part of the Drug Evaluation and Classification (DEC) Program trained drug recognition experts are used to determine drug usage by looking for relevant signs and symptoms Preusser Ulmer and Preusser (1992) evaluated DEC programs in Arizona California Colorado New York and Texas from 1986 to 1991 reported that about 1 to 3 percent of the drivers arrested for driving while intoxicated (DWI) were classified as drug-impaired by Drug Recognition Experts
11
2007 National Roadside Survey of Alcohol and Drug Use by Drivers Drug Results
trained in the DEC Program The most prevalent substances found were marijuana (42) stimulants (36) depressants (16) narcotic analgesics (13) and PCP (5) As Jones et al (2003) pointed out these estimates apply only to the restricted group of driving-under-theshyinfluence-of-drugs (DUID) suspects that were evaluated by officers who participated in the DEC program rather than to all drivers arrested for DWI or all drivers on the road
Other studies have been conducted using crash data to estimate the prevalence of drugs among injured drivers and their role in crashes Terhune et al (1992) used a responsibility-analysis approach6 in studying fatally injured drivers and reported no increase in crash risk due to marijuana or cocaine use alone although multiple drug use could be associated with increased responsibility They also reported that ldquodrivers with alcohol in their systems had the highest crash responsibility ratesrdquo and ldquoan alcohol-drug combined impairment effect was suggested by the responsibility analysisrdquo (pg ix) Leveille et al (1994) used a small matched-case control study design to study crash risk among drivers aged 65 or older in Seattle Washington The authors did not find an association between crash risk and benzodiazepine or sedating antihistamines among this group although they acknowledged that the sample size (234 drivers) might have been too small for significance Ray Fought and Decker (1992) also studied crash risk for drivers aged 65 years or older using data from the Tennessee Medicaid program With this larger sample (16262 drivers) they found an association between presence of benzodiazepines or tricyclic antidepressants and crash risk However they did not find a correlation for people taking oral opioid analgesics Other studies of drug over-involvement in crashes report contradictory results (eg Hemmelgarn Suissa Huang Boivin amp Pinard 1997) These results should be considered cautiously due to data limitations such as small sample size
In summary Jones et al (2003 pp 85-86) stated ldquoThe role of drugs as a causal factor in traffic crashes involving drug-positive drivers is still not understood Drug risk factors are still not known with acceptable precision with some evidence suggesting little or no increase in crash risk at drug levels being detected by current chemical test procedures Further current research does not enable one to predict whether a driver testing positive for a drug even at some measured level of concentration was actually impaired by that drug at the time of crash This is in sharp contrast to alcohol where BAC measurements can provide a good estimate of impairmentrdquo
Jones et al (2003 p 86) also stated ldquoAnother complicating factor is the role of drugs taken in combination with alcohol For many drugs a drug in combination with alcohol accounts for a significant percentage of the occurrences of that drug in crash victims Waller et al (1995) found that roughly one-half of the occurrences of drivers positive for marijuana cocaine and or opiates had elevated BACs and that the crashes of drivers testing positive for drugs alone were very similar to the crashes of drivers testing negative for both alcohol and drugs This adds further doubts about the role of drugs in the impairment of crash-involved drivers and suggests that it may be much smaller than had been suspectedrdquo
6 Responsibility-analysis was used to suggest which drugs contributed to the occurrence of the crashes This method involves examining crash reports which have no indication of driver drug use and rating each driverrsquos crash responsibility If proportionately more drug-present drivers are judged responsible than are those free of drugs this is considered evidence of drug impairment effects
12
2007 National Roadside Survey of Alcohol and Drug Use by Drivers Drug Results
Challenges in Measurement and Todayrsquos Drug Testing Opportunities According to the review of the drug impaired literature conducted by Jones et al (2003) blood is usually the ldquogold standardrdquo for linking drug concentration to behavioral impairment However the collection of other types of biological fluids (eg sweat oral fluid urine) is less invasive and easier to collect in both field studies and law enforcement operations and thus oral fluid has emerged as a valid alternative to blood collection for field use Oral fluids normally contain the parent drug substance rather than drug metabolites that are present in urine Additionally Jones et al (2003) concluded that collection of oral fluid is generally considered less invasive than either blood or urine and ldquocould be an excellent matrix to tie recent drug use with behavioral impairmentrdquo
In some applications oral fluid samples are collected and then subjected to a screening analysis in the field or at the police station to develop a basis for more definitive collection of and laboratory analysis of urine or blood In the application used for this study the oral fluid sample was collected and then sent to a laboratory for a more refined enzyme-linked immunosorbent assay (ELISA) screening followed by a confirmatory analysis by Liquid Chromatography-Tandem Mass Spectrometry (LCMS-MS) or Gas ChromatographyMass Spectrometry (GCMS)
In a recent study conducted by Cone et al (2002) oral fluid testing of 77218 subjects in private industry showed a 5 percent positive rate for any of the five Substance Abuse and Mental Health Services Administration drug categories (marijuana cocaine opiates phencyclidine and amphetamines) The pattern and frequency of drug positives was remarkably similar to urine drug prevalence rates in the general workplace from other surveys (Cone et al 2002) Further in a study of 180 drivers given blood urine and oral fluid tests which were analyzed using quantitative Gas ChromatographyMass Spectrometry (GCMS) the positive predictive value of oral fluids was 98 percent for amphetamines 92 percent for cocaine and 90 percent for cannabinoids (Samyn et al 2002)
However in an analysis of blood urine saliva and sweat from 198 injured drivers admitted to a hospital saliva detected only 14 positives for cannabinoids while 22 positives were detected in the urine (Klintz et al 2000) According to the study authors the amount of matrix (body fluid) collected in saliva appears to be smaller when compared to urine and the levels of drugs are typically higher in urine than in saliva In a study of saliva and sweat Samyn and van Haeren (2000) concluded that saliva should be considered a useful analytical matrix for the detection of recent drug use when analyzed using GCMS This finding indicates oral fluid testing would be desirable in the roadside testing of drivers
Yacoubian et al (2001) tested 114 adult arrestees using saliva and urine and concluded that saliva testing may have certain advantages over urine testing for drugs including (1) ease of sample collection (2) subject preference for giving saliva over urine (3) less vulnerability of adulteration in saliva (4) little concern for subjects producing an adequate sample with saliva and (5) saliva storage is easier than urine The authors found a sensitivity of 100 percent and a specificity7 of 99 percent for cocaine in saliva and a sensitivity of 88 percent and specificity of
7 Sensitivity Sensitivity is the ability of a test to measure what it purports to measure or in this case the ability of the oral fluid tests to correctly identify active drug users It is operationalized as a proportion represented by the true
13
2007 National Roadside Survey of Alcohol and Drug Use by Drivers Drug Results
100 percent for heroin However saliva results only had a sensitivity of five percent for marijuana likely reflecting only detection of very recent smoking as marijuana does not migrate from the blood supply to the oral fluid Thus some positives may indicate residual marijuana remaining in the mouth after ingestion This may well be a positive factor for this study in that when marijuana is detected in saliva it is more likely to be in its active phase in the body rather than simply evidence the marijuana has been consumed during a ldquolook-backrdquo period that could be as long as two weeks and may no longer have a potential impairing effect
Hold et al (1999) conducted a review of the literature concerning using oral fluid for drug testing the review included 135 references and provided guidelines for techniques for collecting and measuring drugs in saliva In an earlier review of drug use evidence found in oral fluid Schramm et al (1992) concluded that initial studies with cocaine and phencyclidine or PCP suggested a correlation between oral fluid and blood concentration but that tetrahydrocannabinol (THC) does not appear to be transferred from blood to saliva Recent marijuana smoking however can be detected in saliva from the buccal cavity8
With regard to oral fluid and BAC Bates et al (1993) found a high correlation between saliva strips and breath tester results for alcohol (r = 89-90) Blood sample analyses however still remain the ldquogold standardrdquo measurement of drugs in the human body because evidence supporting accuracy is best established for that approach
Project Objectives New to the 2007 National Roadside Survey was the collection of biological samples that could be used to determine the extent of the presence of drugs other than alcohol in the nighttime driving population These additional data are essential to estimating the national progress in reducing the prevalence of alcohol- and drug-involved driving
The objective of this report is to present the first US national prevalence estimates of drug-involved driving The first report stemming from this study described the methods used in the sampling data collection and biological specimen analysis portions of the 2007 NRS (Lacey et al 2009a) The second report describes the studyrsquos analytic approach and summarizes the alcohol data we place the set of descriptive estimates of alcohol use within the context of societal trends by comparing these measures with similar ones from the prior surveys over the
positives (ie those who are drug positive and actually test positive) divided by all persons who are drug positive (ie those who are positive and test positive [ie true positives] plus those who are positive and test negative [false negatives]) The formula for sensitivity is Sn = TP (TP + FN) where TP and FN are the number of true positive and false negative results respectively Sensitivity can also be thought of as 1 minus the false negative rate Notice that the denominator for sensitivity is the number of drug positive persons Specificity Specificity is the ability of a test to correctly identify non-cases of disease or in this case the ability of
the oral fluid tests to correctly identify non-drug users It is operationalized as a proportion represented by the true negatives (ie those who are drug negative and test negative) divided by all persons who are drug negative (ie those who are negative and test negative [true negatives] plus those who are negative but falsely test positive [false positives]) The formula for specificity is Sp = TN (TN + FP) where TN and FP are the number of true negative and false positive results respectively Specificity can be thought of as 1 minus the false-positive rate Notice that the denominator for specificity is the number of nondrug users
8 The buccal cavity includes that part of the mouth bounded anteriorly and laterally by the lips and the cheeks posteriorly and medially by the teeth andor gums and above and below by the reflections of the mucosa from the lips and cheeks to the gums
14
2007 National Roadside Survey of Alcohol and Drug Use by Drivers Drug Results
last four decades These trend analyses enable detection of changes in our populations rates and degree of alcohol-involved driving over time (Lacey et al 2009b) The current report provides insight into the use of drugs other than alcohol (illegal prescription and over the counter) in the driving population and will provide a baseline for future studies to assess trends and changes
The report will first present a summary of the methods and procedures used in survey sampling and biological sampling This is followed by a description of the drugs selected for analysis and then a description of the actual drug-collection instruments and how they were administered
The results of our analyses are divided into three sections The first presents the analyses of the oral fluid results with BAC measurement obtained through breath tests These data include both daytime and nighttime drivers The second section will report the results of the blood analysis again with the BAC measurements from breath tests In both of these sections we also contrast the results obtained from the biological specimens with driversrsquo self-report drug use Additionally we present drug prevalence estimates for nighttime weekend drivers based on the combination of results of analyses of both oral fluid and blood combined Finally we discuss the implications of these analyses in terms of estimating the prevalence of drug use among Friday daytime drivers and weekend nighttime drivers Additional tables with further blood results are included in Appendix A These analyses include results of self-reported drug use by drug type safety observation measures (seatbelt helmet use etc) as well as the results on items relating to interaction with the criminal justice and treatment systems The presence of drugs in these drivers does not necessarily imply that they are impaired and at greater risk of crash involvement Indication of impairment and increased risk will be addressed in an upcoming study of the potential contribution of drugs to crash risk
15
2007 National Roadside Survey of Alcohol and Drug Use by Drivers Drug Results
16
2007 National Roadside Survey of Alcohol and Drug Use by Drivers Drug Results
Methods This section of the report briefly summarizes the methodology used in conducting the 2007 NRS with special emphasis on sampling procedures A separate Methodology Report (Lacey et al 2009a) provides detailed descriptions of the multiple components of the data collection process
Survey Sampling Procedures This section presents an abridged description of the sampling approach we followed in conducting the 2007 NRS Because it is infeasible to conduct surveys on all the roads in the United States we constructed a sampling system for the 2007 NRS that represented the whole Nation but required interviewing only a practical portion of the almost 203 million drivers on US roads (FHWA 2006) As in the three prior surveys the area covered in this study was limited to the 48 contiguous States
For practicality we limited locations to roadways where surveys could be performed safely and with sufficient traffic to recruit the number of participants required for valid estimates of the national prevalence of drinking and drug involved-drivers as did prior NRS studies
The past three national surveys provided information on private four-wheel vehicle operators at representative then randomly selected locations during weekend nighttime periods when drinking and driving is most prevalent The 2007 NRS covered the same time periods and added two Friday daytime periods As in the three earlier surveys the 2007 NRS excluded commercial vehicles but unlike previous practice included motorcycles
The 2007 NRS followed the practice of the 1973 1986 and 1996 national surveys by using a multistage sampling system that represented the drivers at risk for crash involvement in the 48 contiguous States In this process the initial sample structure was taken from NHTSArsquos National Automotive Sampling SystemGeneral Estimates System (NASSGES) (NHTSA 1995) which was constructed to provide a basis for making nationally representative estimates of highway crashes The four steps included
1 Selecting the primary sampling units (PSUs) which are cities large counties or groups of counties from within four regions of the United States and three levels of population density
2 Randomly selecting 30 specific square-mile-grid areas within each PSU and randomly numbering them to form an order of priority from among the total of all the square mile sectors comprising the PSU area Then we attempted to recruit the cooperation of local law enforcement agencies that had jurisdiction over the selected grids One law enforcement agency often would cover several of the selected square mile areas
3 Identifying appropriate survey sites within the square-mile-grid areas Appropriate sites had a safe area large enough to accommodate the survey operation and had sufficient traffic flow to generate an adequate number of subjects In some cases more than one such location was available within a square mile grid In this case the survey manager exercised herhis judgment to select the optimal location for safe data collection This resulted in selection of five data collection or survey sites within each PSU
17
2007 National Roadside Survey of Alcohol and Drug Use by Drivers Drug Results
4 Selecting at random drivers to be interviewed from the traffic passing by the survey site The total number of eligible vehicles was counted to determine the proportion of the traffic passing by each survey site that was sampled
These sampling procedures were followed to ensure that the probability of selecting a PSU a survey location within the PSU and a driver at a survey location was known at each of the sample design stages Knowing these probabilities permitted the computation of the probability that a given driver would be interviewed in the survey This was done by multiplying the sampling probabilities at each of the four steps to obtain the final overall probability of being sampled The weight given to each case in the final totals (sampling weight) was computed as the inverse of the sampling probability This statistical procedure accounts for differences among PSUs in the size of the driver population In other words although we sampled approximately the same number of drivers at each PSU the actual number of individuals driving at each sampling site was not uniform To make the sample of drivers at each site representative of the actual number of drivers we applied the above-described weights As a result drivers interviewed at sites with a relatively heavy traffic flow (ie a relatively large pool of actual drivers) carry a larger weight than drivers sampled from sites with less traffic loads This ensured that the basic requirement of sampling theorymdashthat every driver has an equal chance of being interviewedmdashwas met by adjusting for the biases inherent in the selection of locations within the sampling frame
The major barrier to carrying out this staged sampling system was obtaining law enforcement support for the survey In some localities city attorneys or law enforcement leadership with concerns such as potential liability and scare resources declined to participate In these cases substitution PSUs were obtained Although this process was time-consuming similar difficulties had also been experienced in all three previous NRS studies Replacement PSUs were chosen from within the same GES geographic region9 and the same GES PSU type (city large suburban area all others) as the unavailable PSU For more information on PSU replacement see Lacey et al (2009a) The 60 PSUs used in the 2007 NRS are shown in Figure 1
9 GES defines four geographic strata
18
2007 National Roadside Survey of Alcohol and Drug Use by Drivers Drug Results
Figure 1 Map of Sixty 2007 National Roadside Survey Sites
As mentioned the roadside survey procedures used in the 2007 NRS followed as closely as possible those used in the previous three surveys (see Lacey et al 2009a Lestina et al 1999) However the 2007 NRS departed from the earlier surveys in several important ways The earlier surveys included only a brief questionnaire and a breath test that generally required less than 5 minutes of a participantrsquos time The 2007 NRS included a more extensive set of questions (base survey a drug questionnaire questions about interaction with the criminal justice and treatment systems an alcohol-use disorder and a drug-use disorder survey) The 2007 survey protocol also attempted to collect two biological samples (oral fluid and blood) from participants as well as a breath test Data collection for the earlier surveys was conducted by three teams of three interviewers the 2007 NRS consisted of 6 teams of 10 to 12 members The earlier surveys were conducted at 24 PSUs whereas the 2007 survey was conducted at 60 PSUs This increase in the number of PSUs allowed us to maximize the use of all possible PSUs defined by the NASSGES and increase the representativeness of the sample The earlier surveys had four 2-hour data collection periods on weekend nights the 2007 survey added a 2-hour data collection period during the daytime on Fridays for a total of five 2-hour survey periods during the weekend Finally the number of participants in the 2007 survey was about three times as many as in the 1973 study
PIRE employed and trained six specialized teams of interviewers from both the east and west coasts of the United States All staff was trained during the summer of 2007 Surveys began the weekend of July 20 and 21 2007 and concluded 20 weeks later on December 1 2007 As in the three previous NRS studies nighttime surveys were conducted between 10 pm and midnight and between 1 am and 3 am on both Friday and Saturday For the 2007 survey a 2-hour Friday daytime data collection period was added either between 930 am and 1130 am or between 130 pm and 330 pm The daytime data collection period was randomly selected for each PSU The daytime periods were added to determine the extent of alcohol- and drugshy
19
2007 National Roadside Survey of Alcohol and Drug Use by Drivers Drug Results
involved driving during the day and whether the number of drivers using drugs and the types of drugs used differed between day and night Each component used in the roadside survey is thoroughly described in the Methodology Report (Lacey et al 2009a)
Preparation for the 2007 NRS Survey The size and complexity of the 2007 NRS required extensive preparation that NHTSA began years before the actual survey was initiated including a pilot test of survey procedures (Lacey Kelley-Baker Furr-Holden Voas Brainard amp Moore 2007) The preparation activitiesmdash selection and testing of equipment for collecting biological samples recording and organizing the self-report and observational data at the roadside recruiting and training of survey staff pretesting of survey procedures developing procedures for protection of survey respondents and the publicmdashare fully described in the Methodology Report (Lacey et al 2009a) Only a brief overview of this work is described here
Survey equipment Interviewers recorded the responses to the traditional NRS interview on a handheld portable digital assistant (PDA) Through a special program developed for the 2007 NRS the PDA provided a means of prompting the interviewer through each step of the data collection process
As part of the program to protect survey participants and the public it was important to know the extent of the driversrsquo drinking To this end a passive alcohol sensor (PAS) attached to the PDA with Velcrotrade was used to collect mixed expired air from approximately 6 inches in front of the driverrsquos face (we used the PAS Vrtrade manufactured by PAS International Inc of Fredericksburg Virginia) This small handheld unit was used because it was less obvious and intimidating than the larger flashlight-based passive sensors We researched three available styles of PAS models (1) the handheld unit that was used in the pilot study (2) the flashlight PAS and (3) a clipboard device with an alcohol sensor built into one corner We tested the devices for accuracy ease of use and reliability and found that the PAS Vrtrade was best suited to the needs of this study The PAS unit can detect alcohol in emitted breath around the face (Kiger Lestina amp Lund 1993) The PAS was held within 6 inches of the participantrsquos face and when the subject spoke the interviewer activated the small electrical pump which pulled in the exhaled breath from the participant and produced an estimate of the participantrsquos breath alcohol level
Data collection To compare results from the 2007 survey to prior surveys a strong effort was made to follow the same data collection protocol employed in the three prior NRS studies despite the addition of a large number of questions and new biological specimen collections following the traditional questionnaire and breath test As described in the Methodology Report (Lacey et al 2009a) we placed the traditional NRS interview and breath-test collection before the new NRS questions and the specimen collections We believed that by structuring data collection in this way the additions to the basic survey would not affect our ability to compare the responses to the basic survey with responses from the three earlier surveys Nevertheless the 2007 NRS experienced a somewhat larger refusal rate than the 1996 NRS (see Table 9)
To determine whether the 2007 survey procedure accounted for producing the lower response rate we conducted a replica of the 1996 NRS procedure in one of our 2007 sites (Knox County Tennessee) The simpler protocol followed that used in the 1996 and earlier surveys collecting the traditional interview and a breath sample only About 16 percent of all drivers signaled to stop by the officer during this ldquoreplica surveyrdquo failed to stop andor enter the site This is similar
20
2007 National Roadside Survey of Alcohol and Drug Use by Drivers Drug Results
to the 15 percent that failed to stop (when the police signaled) in the 2007 NRS study Among those who entered the research bay and were eligible for the survey the proportion of refusals in the replica survey was similar to the full 2007 NRS (163 and 175 respectively) Thus it appears that the lower response rate in the 2007 NRS reflects a change in the driving publicrsquos willingness to be interviewed rather than an effect of the more elaborate survey procedures implemented in 2007
Table 9 Comparison of Number of Nighttime Participants by Year in the National Roadside Surveys
1973 1986 1996 2007 Signaled to enter site Not reported 3260 6480 9553 Did not enter site Not reported 217 182 1016 Entered site 3698 3043 6298 8537 Eligible for survey Not reported Not reported Not reported 8384dagger
Entered site and interviewed
Valid breath sampledaggerdaggerdagger 3353 (907) 3192 (863)
2971 (976) 2850 (937)
6045 (960) 6028 (957)
6920 (825)daggerdagger
7159 (854)daggerdagger
dagger Commercial vehicles not eligible daggerdagger Because previous surveys did not inform about the eligibility of the drivers percentages for the years 1973 1986 and 1996 are based on drivers who stopped and entered the site Percentages for 2007 are based on drivers who not only were stopped and entered site but also were eligible for the survey (ie noncommercial drivers drivers aged 16 and older and not constrained by language barriers) Percentages are based on nighttime drivers daggerdaggerdagger Some drivers provided breath samples but declined to be interviewed In this table percentages are unweighted
The basic procedure in the 2007 NRS as well as in the prior three surveys was for the law enforcement officer working with the survey team to direct the potential respondent into the survey site without speaking to the driver Once in the site the driver was directed into a research bay and was approached by an interviewer and recruited to participate in the interview Prospective participants were informed that they had done nothing wrong and that the interview concerned traffic safety and was anonymous A PAS reading was also taken at this point If the individual agreed to participate the interviewer asked the 22 questions on the traditional NRS protocol and requested a breath sample Only after the completion of the standard NRS procedure did the additional data collection for the 2007 NRS begin A detailed description of the survey procedures is provided in the Methodology Report (Lacey et al 2009a)
As indicated in Table 10 which presents response patterns for both the daytime and nighttime data collection periods over 13000 vehicles were selected to participate in the 2007 NRS of these 10909 entered the data collection site and the drivers were determined to be eligible for survey participation (for example commercial vehicles such as pizza delivery vehicles drivers under the age of 16 and drivers who could not communicate with us either in English or Spanish were not eligible to participate) Eighty-three percent of eligible drivers participated in the survey and because some of those that refused the survey did agree to provide a breath sample BACs from the PBTs were available on 86 percent of the eligible drivers Among eligible drivers 71 percent provided an oral fluid sample 72 percent completed a drug questionnaire
21
2007 National Roadside Survey of Alcohol and Drug Use by Drivers Drug Results
andor the AUD questionnaire and 39 percent of eligible nighttime drivers provided a blood sample10
Table 10 Participating Drivers (Percentages in Parentheses)
2007 Daytime Nighttime Total
Signaled to enter site 3516 9553 13069 Did not enter site 933 1016 1949 Entered site 2583 8537 11120 Eligible 2525 8384 10909 Entered site and interviewed Valid breath sample Oral Fluid sample Blood sample AUD ampor Drug Questionnaire
2174 (861)dagger
2254 (893)dagger
1850(733)dagger
NA
1889 (752)dagger
6920 (825)dagger
7159 (854)dagger
5869 (700)dagger
3276 (391)dagger
5983 (714)dagger
9094 (834)dagger
9413 (863)dagger
7719 (707)dagger
NA
7882 (722)dagger
NA (not applicable) Blood samples were not collected during daytime sessions In this table percentages are unweighted dagger Percent of eligible
To prevent impaired drivers from continuing to drive a special ldquoImpaired Driver Protocolrdquo was developed to ensure the safety of both the drivers and the public Impairment was determined by the interviewerrsquos observation of the driverrsquos behavior and by the use of a PAS If there was any sign of possible impairment the interviewer signaled the survey manager who administered a breath test with a preliminary breath test (PBT) device that displayed the actual BAC If the driverrsquos BAC was 05 gdL (grams per deciliter) or higher the survey manager provided the participant with several options for getting home without driving11 This system has been successful in preventing identified impaired drivers from returning to the road where they could be a danger to themselves or others A full description of the Impaired Driver Protocol is provided in Appendix E of the Methodology Report (Lacey et al 2009a)
A significant concern for all four NRS studies was that high BAC drivers might be less likely to agree to participate resulting in an underestimate of the number of risky drinking drivers on the road Data from the 1996 NRS and from relative risk studies such as that of Blomberg Peck Moskowitz Burns and Fiorentino (2001 p 117) have suggested that drivers who refuse the breath test are likely to have higher BACs than those who agree to participate This was corrected somewhat in the 1996 and 2007 NRS studies by using the PAS data collected as part of the consent process During the data collection process a PAS was used when the driver was first approached to participate in the survey The PAS provides a nine-unit estimate of what a true BAC measure collected by the PBT device would be We correlated the PAS and other measures (specifically gender and time of night) to impute the BACs of drivers who entered the site but refused to provide a breath sample Thus the actual BACs collected in both the 1996 and the 2007 NRS studies were corrected for nonparticipating drivers
10 Typically only drivers who had completed the oral fluid step provided a blood sample 11 Our threshold of 05 gdL was more conservative than the legal per se limit of 08 gdL
22
2007 National Roadside Survey of Alcohol and Drug Use by Drivers Drug Results
Driver Conversion As presented in the Methodology Report (Lacey et al 2009a) there were 444 attempts to convert drivers who had initially declined to participate in our study (ie to change their minds and provide us with at least a breath sample) This was done to develop an understanding of whether drivers who refused to participate were more or less likely to be alcohol or drug positive than those who initially agreed to participate Drivers who refused were offered a $100 incentive as an inducement to convert Of the 444 total attempts 50 percent were successfully converted (ie provided a breath sample) Among those converted drivers 156 (70) also provided an oral fluid sample and 49 drivers (22) also provided a blood sample
Tables 11 and 12 show the outcome of the Oral Fluid and Blood analyses (respectively) performed on the converted drivers Among converted drivers who provided an oral fluid sample the distribution of drivers who were drug positive appears to be somewhat higher than that of the total sample of daytime and nighttime participants where 110 percent of the general daytime samples were positive (as compared to 162 of converted drivers) and 144 percent of the general nighttime samples were positive (compared to the 170 of converted drivers) These differences however were not statistically significant
Table 11 Oral Fluid Analysis Results Among Converted Drivers
Daytime Nighttime Presence of Drugs N N in Oral Fluid (Unweighted) (Weighted) (Unweighted) (Weighted) Negative 27 838 107 831 Positive 6 162 16 170 All 33 100 123 100
Among drivers who were converted and provided a blood sample 127 percent were drug positive This distribution is very similar to that of the total nighttime participants who provided blood where 138 percent were drug positive (blood was not collected in the daytime sample) Given the low sample size statistical tests were not performed
Table 12 Blood Analysis Results Among Converted Drivers
Presence of Drugs in Blood
Negative Positive
Nighttime N
(Unweighted)
(Weighted) 43 873
6 127 All 49 100
23
2007 National Roadside Survey of Alcohol and Drug Use by Drivers Drug Results
Selection of Drugs for Screening and Analysis PIRE and NHTSA jointly developed an initial list of drugs to be detected based on the literature (eg Jones Shinar amp Walsh 2003 Couper amp Logan 2004) and experience with drug-involved driving research The drugs were selected because of a combination of their potential impaired-driving effects their likelihood of appearing in drivers and in the case of oral fluid the availability of scientific techniques to analyze oral fluid to detect and quantify the drug NHTSA then provided this list to experts in the field of epidemiology of drug use driving and toxicology both in the United States and abroad The experts responded to the list with additions and deletions
The list of selected drugs is shown in Table 13 The first five categories of drugs listed constitute the National Institute on Drug Abuse (NIDA)-5 which are prevalent drugs of abuse and of universal interest in the study of drug involvement The NIDA-5 are routine components of a drug-screening panel The other drugs on the list (with the exception of barbiturates) appear in the NHTSA publication titled ldquoDrugs and Human Performance Fact Sheetsrdquo (Couper amp Logan 2004) and are of interest because the expert panel for that effort believed those drugs presented potential traffic safety risks The drugs we tested for represented illegal prescription and overshythe-counter drugs that (1) have the potential to impair driving performance and (2) could reasonably be expected to appear in the driver population
Table 13 Selected Drugs and Minimum Detection Concentrationsdagger
Drug Class Minimum Concentration
Oral Fluid (ngmL) Minimum Concentration
Blood (ngmL) Self-report Item
Screen Confirm Screen Confirm
Cocaine (Cocaine benzoylecgonine)
20 8 25 10 Cocaine (eg crack or coke)
Opiates (6-AM codeine morphine hydrocodone hydromorphone)
40 10 25 10
Heroin Morphine or Codeine (eg Tylenolreg with codeine)
Amphetamine Methamphetamine (MDMA MDA MDEA Ephedrine Psuedoephedrine)
50 50
50 20 20
10
Amphetamine or Methamphetamine (eg speed crank crystal meth) Ecstasy
Cannabinoids (THC THC-COO[THCA])
4 2 10 1 Marijuana (eg pot hash weed)
Phencyclidine 10 10 10 10 PCP (eg angeldust) Benzodiazepines (oxazepam nordiazepam bromazepam flurazepam
10 5 20 10 Benzodiazepines (eg Valiumreg or tranquilizers)
24
2007 National Roadside Survey of Alcohol and Drug Use by Drivers Drug Results
Drug Class Minimum Concentration
Oral Fluid (ngmL) Minimum Concentration
Blood (ngmL) Self-report Item
Screen Confirm Screen Confirm
flunitrazepam lorazepam chlordiazepoxide temazepam diazepam clonazepam alprazolam triazolam midazolam nitrazepam) Barbiturates (Phenobarbital pentobarb secobarbital butalbital)
50 50 500 500 Barbiturates (eg phenobarbital)
Methadone 50 25 50 10 Methadone Ethyl alcohol 02 02 02 02 Alcohol Oxycodone (Percocetreg) 25 10 25 10 Prescription pain
killers (eg Percocetreg OxyContinreg oxycodone Demerolreg Darvonreg)
Propoxyphene (Darvonreg)
10 10 10 10
Tramadol (Ultramreg) 50 25 50 10 Carisoprodol (Somareg) 100 50 500 500 Meperidine (Demerolreg) Sertraline (Zoloftreg) 50 25 50 10
Antidepressants (eg Prozacreg Zoloftreg)
Fluoxetine (Prozacreg) 50 25 50 10 Tricyclic Antidepressants (amitryptiline nortriptyline)
25 25 25 10
Zolpidem (Ambienreg) 10 10 10 10 Ambienreg or other sleep aids
Methylphenidate (Ritalinreg)
10 10 10 10 ADHD medications (eg Ritalinreg)
Dextromethorphan 50 20 50 20 Cough medicines (eg Robitussinreg Vicks 44reg etc)
Ketamine 10 10 10 10 KetamineSpecial K daggerScreening utilizes ELISA micro-plate and confirmation utilizes GCMS or LCMSMS technology
We screened using ELISA micro-plate technology Confirmation was performed using GCMS or LCMSMS technology Our toxicological laboratory Immunalysis Corporation provided all necessary confirmations
Cocaine which can be used as a local anesthetic is often abused because of its stimulating effects on the central nervous system (CNS) At low doses cocaine might actually have performance enhancing effects however little is known about its effects on human performance at higher levels and in conjunction with alcohol It is clearly a drug of abuse in the United States and worthy of study in drivers
Opiates are narcotic analgesics used both medicinally and as drugs of abuse After an initial rush opiates act as CNS depressants and certainly could have performance-decreasing effects
25
2007 National Roadside Survey of Alcohol and Drug Use by Drivers Drug Results
Amphetamines are CNS stimulants and are used both medicinally and as drugs of abuse Amphetamines are generally taken recreationally and to enhance performance (eg truck drivers staying awake) Ecstasy falls within this category and as a methylated amphetamine derivative it also has hallucinogenic properties Amphetamines have been associated with crash occurrence and could logically be associated with driving impairment both in the stimulation and withdrawal stages in the latter case especially as the drug interacts with fatigue The analytical methodology is described in an article by Moore Coulter and Crompton (2007)
Cannabinoids have a variety of effects on humans and can be associated with stimulant sedative and hallucinogenic effects Both the experimental and epidemiologic evidence on cannabinoidsrsquo effects on driving are mixed When marijuana is found in drivers however it is often in conjunction with alcohol where an impairing effect is more likely The most prevalent drug detected in the pilot study was marijuana (Lacey et al 2007) There appeared to be a strong positive correlation between the oral fluid and blood tests and the only discrepancies found in the pilot study (negative oral fluid and a positive blood) were from 10 cases in which the inactive metabolites were detected in blood but not the active tetrahydrocannabinol (THC) A positive metabolite result (THCA) with a negative parent compound (THC) is consistent with less recent use (eg in the days before sample was taken) A positive oral fluid for the parent compound is likely to be associated with very recent THC use the timeframe consistent with potential impairing effects Thus such oral fluid results can be very informative The laboratory procedures for testing the oral fluid results have been previously published in several articles (Moore et al 2006 Moore Rana amp Coulter 2007c Coulter Miller Crompton amp Moore 2008)
Phencyclidine (PCP) is related to veterinary tranquilizers such as ketamine that impair motor ability but it also has hallucinogenic effects and is used as a recreational drug PCP has serious performance diminishing effects and has been found in impaired-driving cases Its determination in oral fluid has recently been published in Coulter Crompton and Moore (2008)
Benzodiazepines include many widely prescribed drugs (eg Valiumreg Xanaxreg) to reduce anxiety These drugs act as CNS depressants show cross-tolerance to ethanol and are potentially associated with driver impairment Different types of benzodiazepines have very short to very long half-lives For example the desiredtherapeutic effect of lorazepam (Ativanreg) is sedation which would obviously have a detrimental effect on driving a motor vehicle The most common benzodiazepine is diazepam (Valiumreg) andor its metabolites nordiazepam oxazepam and temazepam The confirmation procedure for the 2007 study included LCMSMS confirmation using the method described in Moore Coulter Crompton and Zumwalt (2007)
Barbiturates are still widely prescribed CNS depressants and in some cases as anti-epileptic medications Because of their depressive effects barbiturates are associated with delayed reaction times and possibly loss of concentration both effects likely to affect driving performance
Methadone a narcotic analgesic is used both medicinally for opiate detoxification and maintenance and for pain relief It has also been used as a drug of abuse It may have differential performance effects in naiumlve or recreational users versus tolerant therapeutic users and certainly deserves study
Painkillers are a class of drugs that may lead to driving impairment Commonly used painkillers include oxycodone (an opioid) Oxycodone has similar effects to morphine and heroin If used in
26
2007 National Roadside Survey of Alcohol and Drug Use by Drivers Drug Results
combination with other depressants of the CNS such as alcohol or benzodiazepines it can cause severe impairment or lead to death Tramadol an opiate analgesic has similar effects to oxycodone Propoxyphene and meperidine also atypical opiates are included in the panel The methods used for their analysis are described (Rana et al 2006 Moore Rana et al 2007b) Other painkillers such as carisoprodol a CNS depressant and muscle relaxant (Somareg also called Miltownreg) are used as prescription drugs but can lead to abuse Even at therapeutic concentrations carisoprodol and its metabolite meprobamate may cause driving impairment as the desired effect is sedation
Antidepressants are most commonly in the form of selective serotonin uptake inhibitors (SSRIs) such as fluoxetine (Prozacreg) and sertraline (Zoloftreg) They can cause impairment especially in circumstances where extremely high blood concentrations are measured or if they are taken outside of medical need or therapeutic treatment There is also an additional risk of impairment associated with combined use with alcohol
Sleep aids such as Ambienreg cause drowsiness and may cause dizziness If consumed with alcohol there is an increased likelihood of these symptoms Sleep aids alone or in combination with alcohol could have a detrimental effect on driving ability
Other stimulants such as methylphenidate (sold as Ritalinreg) are amphetamine-like prescription drugs commonly used to treat Attention Deficit Hyperactivity Disorder (ADHD) in children and adults They are CNS stimulants Some people abuse these drugs by crushing the tablets and snorting them The effect of this other stimulant abuse is similar to that of cocaine or amphetamine
Dextromethorphan a synthetic analog of codeine is an antitussive widely used in cough medicines (eg Robitussinreg Sucretsreg Vicks Formula 44reg) When consumed in high doses in recreational use it is a CNS depressant and may have driving impairment effects at those levels The analytical method has recently been published in Rodrigues et al (2008)
Ketamine (Special K) is used medicinally as a veterinary tranquilizer but it is also abused as a recreational drug for its psychedelic effects Ketamine use by humans would likely be associated with decrements in skills related to driving
Oral Fluid Collection Device Following the NRS interview and collection of the breath test the interviewer requested an oral fluid sample and offered a $10 incentive for providing one We used the Quantisaltrade (manufactured by Immunalysis Corporation) oral fluid collection device (see Appendix F of the Methodology Report [Lacey et al 2009a]) The subject placed this device under hisher tongue and its pad changed color (blue) when 1 mL of oral fluid (the necessary sample volume) was collected The collection device was then placed into a tube containing 3 mL of a stabilizing buffer solution and capped for storage and transport to the laboratory The steps are illustrated in Figure 2
27
2007 National Roadside Survey of Alcohol and Drug Use by Drivers Drug Results
Figure 2 Collecting an Oral Fluid Sample With the Quantisaltrade Oral Fluid Collection Device Distributed by Immunalysis Inc Pomona CA
httpwwwimmunalysiscomquantisal_procedurehtm
The oral fluid samples were labeled with pre-printed Chain-of-Custody (CoC) labels to be linked with the subject and additional data collected This allowed the specimen to be tracked throughout the project The CoC labels contained a unique identifier that corresponded to that sample This number was also entered into the PDA CoC numbers were preprinted by the laboratory and were used to maintain a documented link between each sample collected and the respondent who provided it A different CoC number was assigned to the oral fluid and blood sample for an individual subject and the laboratory was blinded to any link between them This assured the oral fluid and blood analyses and results were independent of one another
The collection of oral fluid while less invasive than the collection of blood or urine has some associated difficulties (ONeal Crouch Rollins amp Fatah 2000) Various researchers have noted that the method of collection and the medium itself (oral fluid) significantly affect drug concentration in the specimen and consequently whether some drugs can be detected at all However while some collection devices give no indication of the amount of oral fluid actually collected (rendering a quantitative result meaningless) the Quantisaltrade oral fluid collection device collects 1 mL (+10) of clear oral fluid from the donor Researchers have studied the device to assess the efficiency of drug release from the collection pad (Quintela Crouch amp Andrenyak 2006 Moore et al 2006 Moore Rana amp Coulter 2007b) and have found a high rate of extraction efficiency Tables 14 and 15 summarize the effectiveness of the Quantisaltrade oral fluid collection device across a range of drugs by two different research groups Findings above 100 percent are due to slight variations in the amount of the substances actually added to the scientific control samples (scientific error)
28
2007 National Roadside Survey of Alcohol and Drug Use by Drivers Drug Results
Table 14 Extraction Efficiency of Quantisaltrade Oral Fluid Collection Device Over a Range of Drugs Quintela
Drug Target Value (ngmL) Mean Recovery from the Pad () Amphetamine 50 943
Methamphetamine 50 1038
Cocaine 20 912
Benzoylecgonine 20 869
Codeine 40 956
Morphine 40 926
6-acetylmorphine 4 922
THC 4 914
Methadone 50 997
Oxazepam 20 1013
Source Quintela et al 2006
Table 15 Extraction Efficiency of Quantisaltrade Oral Fluid Collection Device Over a Range of Drugs Moore
Drug Target Value (ngmL) Mean Recovery from the Pad () Meperidine 25 867
Tramadol 25 877
Oxycodone 20 966
Source Moore Rana amp Coulter 2007a Moore et al 2006 THC recovery from the pad gt 80
For a more thorough discussion of the Quantisal device see the pilot study report (Lacey et al 2007)
Blood Collection Procedures After completion of the oral fluid sample and the drug questionnaire the interviewer requested that the subject provide a blood sample in exchange for an additional $50 incentive The incentives were given as money orders so subjects could not spend the money immediately especially on items such as alcohol and other drugs
Licensed phlebotomists conducted the blood draws The phlebotomist set up the blood draw station in the rear seat of a rental van The subject sat in the back seat of the van and the phlebotomist stood just outside the van or sat in the adjoining seat
During blood draws one gray-top tube (10 mL) of the subjectrsquos blood was drawn There are several types of tubes available for the collection of blood specimens with different color tops The choice of tube is dependent upon the type of test to be performed on the blood The Federal Aviation Administration (FAA) recommends the gray-topped tube for drug and alcohol testing of blood specimens The gray-top tube contains two preservatives potassium oxalate and sodium fluoride The oxalate is an anti-coagulant and the sodium fluoride is an anti-bacterial stabilizer These preservatives reduce the need for refrigeration but do not affect the ability to detect and quantify drugs Both additives are inorganic therefore they oxidize very slowly and are extremely stable The preservative helps inhibit the degradation of cocaine in storage to its
29
2007 National Roadside Survey of Alcohol and Drug Use by Drivers Drug Results
metabolite benzoylecgonine (Toennes amp Kauert 2001) The presence of sodium fluoride with or without refrigeration and potassium oxalate effectively inhibits cocaine degradation with 86 to 91 percent of the drug present after 48 hours In contrast substantial degradation of cocaine occurs in the samples stored without sodium fluoride (Brogan et al 1992) The presence of the parent drug is particularly useful in the determination of recent use since more cocaine per se (prior to its transformation to benzoylecgonine) indicates more recent drug use Additionally gray-top tubes are helpful in conducting ethanol analysis because the sodium fluoride is an effective antibacterial agent that helps inhibit endogenous alcohol production
For this study glass tubing was used as opposed to plastic to better maintain reliable drug results For example in a study by Christophersen (1986) on the stability of THC in whole blood during storage THC concentration in blood stored in glass vials for four weeks at -20 C remained unchanged however blood stored in plastic vials lost 60 to 100 percent of its THC content during storage Thus glass vials are recommended for collection of blood samples where marijuana content is suspected In this study approximately 10 percent of the blood samples were analyzed immediately upon receipt by the laboratory However the remaining samples were stored at 4 degrees Centigrade until additional funding was obtained for their analyses approximately one year later As a check on 13 samples which had been analyzed initially and were found to be positive for THC andor its metabolites reanalysis for THC and its metabolites one year later revealed that though values obtained were generally lower than in the initial analyses each specimen tested positive for THC andor a metabolite at the retest Additionally six samples which initially had been found to be positive for cocaine andor its metabolites were reanalyzed and though parent drug values had eroded metabolite values had increased and all were still positive for cocaine at retest For eight opiate samples and six amphetamine samples the results at retest remained positive after one year
The blood sample tubes were labeled with pre-printed Chain-of-Custody (CoC) labels that linked the blood sample to the oral fluid sample to the subject so the specimen could be tracked throughout the project The CoC labels contained a unique identifier that corresponded to that sample thus there was no identifying information traceable to the subject This number was also entered into the PDA CoC numbers were preprinted by the laboratory and were used to maintain a documented link between each sample collected and the respondent who provided it As noted above a different CoC number was assigned to the oral fluid and blood sample for an individual subject and the laboratory was blinded to any link between them
In the few cases where phlebotomists were not able to draw a full tube for a subject because some individuals had small andor difficult-to-locate veins the laboratory was able to conduct an initial screening test however it was not able to conduct a confirmatory analysis by GCMS due to the insufficient volume
At the conclusion of the blood draw procedure the subject received the $50 incentive and sat for a moment in the blood draw station The subject was offered a piece of candy before being directed safely out of the survey site and back onto the roadway
Once collected blood samples were stored either in refrigerators or in coolers with blue ice packs if no refrigeration was available The samples were subsequently shipped to the laboratory with blue ice as an additional precaution
Spanish-speaking participants were escorted to the phlebotomist by the Spanish-speaking interviewer and a Spanish consent form was given to the participant The interviewer read the
30
2007 National Roadside Survey of Alcohol and Drug Use by Drivers Drug Results
consent form to them and stayed with the participant to answer any questions and provide translation between the phlebotomist and participant
Drug Questionnaire While they provided an oral fluid sample drivers were asked to complete a drug questionnaire The 27-item questionnaire (Table 16) included a list of drugs including tobacco cough medicine other illegal prescription and over-the-counter drugs For items 1-23 subjects indicated when they last used a particular medicationdrug by responding ldquoTonightrdquo ldquoPast 2 daysrdquo ldquoPast monthrdquo Past yearrdquo ldquoOver a year agordquo or ldquoNeverrdquo
Table 16 Drug Questionnaire Survey
Item Drugs
1 Tobacco (eg cigarettes cigars)
2 Cough medicines (eg Robitussin Vicks 44 etc)
3 Other over-the-counter medicines
4 Prescription Pain Killers (eg Percocet OxyContin Oxycodone Demerol Darvon)
5 Ambien or other sleep aids
6 ADHD medications (eg Ritalin Aderall Concerta)
7 Muscle relaxants (eg Soma Miltown)
8 Prescription dietary supplements (eg Phentermine)
9 Antidepressants (eg Prozac Zoloft)
10 Marijuana (eg pot hash weed)
11 Cocaine (eg crack or coke)
12 Heroin
13 Methadone
14 LSD (acid)
15 Morphine or Codeine (eg Tylenol with Codeine)
16 Ecstasy (eg ldquoErdquo Extc MDMA ldquoXrdquo)
17 Amphetamine or Methamphetamine ( eg speed crank crystal meth)
18 GHB
19 PCP (eg Angeldust)
20 Rohypnol (Ruffies)
21 Ketamine (Special K)
22 Benzodiazepines (eg Valium or tranquilizers)
23 Barbiturates (eg Phenobarbital) Do you believe any of the medicationsdrugs you have taken (or are taking) could affect your 24 driving Have you taken any medications or drugs in the past YEAR that you think may have affected your 25 driving
26 Have you taken any medications or drugs TODAY that you think may affect your driving
27 Have you ever NOT driven because you were on a medicationdrug
31
2007 National Roadside Survey of Alcohol and Drug Use by Drivers Drug Results
Biological Sample Analysis Procedures The following sections briefly describe the analytic techniques used in the analyses of oral fluid and blood samples to determine the presence of the drugs of interest in this study
Oral Fluid Sample Analysis Procedures Each weekend the tubes from each data-collection period were packaged together and sent overnight to a laboratory for analysis Upon receipt of the specimens in the testing facility screening analysis was carried out using enzyme-linked immunosorbent assays (ELISA) at the cut-off concentrations described in Table 13 Screen positive specimens were then reanalyzed using a separate sample of the fluid using gas chromatography-mass spectrometry (GCMS) or liquid chromatography with tandem mass spectral detection (LCMSMS) according to standard operating procedures All methods were fully validated according to good laboratory practices and all standard operating procedures are on file at Immunalysis Corporation
Gas Chromatography-Mass Spectrometry (GCMS) Instrumentation
Agilent 6890 gas chromatography - 5973 or 5975 mass selective detector (GCMSD) electron impact (EI) mode
Extraction
Oral fluid (1 mL) of diluted specimen (13 buffer) was extracted using mixed mode solid phase methods with drug specific column phases
Derivatization
Drug specific derivatives used for maximum detectability and stability
Drugs included in the confirmation profile are shown in Table 13
Liquid Chromatography-Tandem Mass Spectrometry (LCMS-MS) Instrumentation
Agilent LCMS-MS System 1200 Series LC pump 6410 Triple Quadropole
Zorbax Eclipse XDB C18 (46 x 50mm x 18 μm) column
Extraction
Blood (1 mL) protein precipitate with cold acetonitrile mixed mode solid phase extraction using drug specific column phases
32
2007 National Roadside Survey of Alcohol and Drug Use by Drivers Drug Results
Blood Sample Analysis Procedures Upon receipt of the specimens by the testing facility screening analysis for 10 percent of the sample was carried out using enzyme-linked immunosorbent assays (ELISA) at the cut-off concentrations described in Table 13 The remaining 90 percent of the sample was stored at 4deg centigrade until funding was provided for their analysis Again specific drugs tested are shown in Table 13 Screen positive specimens were confirmed using either gas chromatography with mass spectral detection (GCMS) or liquid chromatography with tandem mass spectral detection (LCMSMS) All methods were fully validated according to good laboratory practices See above for instrumentation
Ethanol (Oral Fluid and Blood) Screen positive alcohol specimens were sent for confirmation to BioTox Laboratories or Immunalysis Corporation
Instrumentation
Perkin-Elmer Model F-45 Gas Chromatograph
Flame ionization detector (FID)
02 percent Carbowax 1500 Graphpac-GC 80100 column (6 ft x 18 in ID)
Extraction
Whole blood or 13 buffered oral fluid (01 mL) add 1 mL double deionized water containing 01 percent propanol
Analyzed using headspace GCFID
Drug Classes and Categories Due to the large number of drugs tested results were consolidated into drug classes and categories Drug classes are defined according to potential drug effects and include stimulants sedatives marijuana antidepressants narcotic analgesics and other Drugs were separately categorized as illegal prescription and over-the-counter12 13 Though some drugs could logically fall into more than one category we made the categories mutually exclusive and assigned each drug to only one category This approach facilitates clear presentation of results
Tables 17 and 18 present drug classes and categories In the tables the shaded entries indicate drugs that were identified only through blood analyses The non-shaded entries are drugs that were identified through both oral fluid and blood analyses
12 Drugs may be classified in different ways depending on the use of the classification system For example in NHTSArsquos drug evaluation and classification (DEC) program the categories CNS Depressants CNS Stimulants Hallucinogens Dissociative Anesthetic (PCP) Narcotic Analgesics Inhalants and Cannabis are used 13 Due to relative small sample sizes and for analytical purposes the over-the-counter and prescription categories were further collapsed into a single category (ldquoMedicationsrdquo)
33
20
07 N
atio
nal R
oads
ide
Sur
vey
of A
lcoh
ol a
nd D
rug
Use
by
Driv
ers
Dru
g R
esul
ts
34
Tab
le 1
7 D
rug
Cla
ss C
om
po
siti
on
mdashO
ral F
luid
an
d B
loo
d C
om
bin
ed
Sti
mu
lan
ts
Sed
ativ
es
Mar
ijuan
a A
nti
dep
ress
ants
N
arco
tic
An
alg
esic
s O
ther
Am
ph
etam
ines
B
arb
itu
rate
s C
ann
abin
oid
s S
SR
Is
Met
had
on
e
C
ou
gh
Su
pp
ress
ants
Am
phet
amin
e
But
albi
tal
TH
C
Flu
oxet
ine
Met
hado
ne
Dex
trom
etho
rpha
nM
DA
P
heno
barb
ital
11-O
H-T
HC
D
esm
ethy
lser
tral
ine
ED
DP
MD
EA
Pen
toba
rbita
l T
HC
-CO
OH
S
ertr
alin
e
S
tree
t D
rug
s M
DM
A
Sec
obar
bita
l
N
orflu
oxet
ine
O
pia
tes
Ket
amin
e M
etha
mph
etam
ine
6-A
M (
Her
oin)
N
orke
tam
ine
P
hent
erm
ine
B
enzo
dia
zep
ines
Tri
cyc
lics
6-
AC
(H
eroi
n im
purit
y)
PC
P
Pse
udoe
phed
rine
Alp
razo
lam
Am
itrip
tylin
e C
odei
ne
P
heny
lpro
pano
lam
ine
Alp
ha-h
ydro
xyal
praz
olam
Nor
trip
tylin
e M
orph
ine
C
hlor
diaz
epox
ide
D
oxep
in
H
ydro
codo
ne
Co
cain
e D
iaze
pam
Des
met
hyld
oxep
in
Hyd
rom
orph
one
Coc
aine
Lo
raze
pam
Im
ipra
min
e O
xyco
done
Ben
zoyl
ecgo
nine
O
xaze
pam
Des
ipra
min
e O
xym
orph
one
Coc
aeth
ylen
e T
emaz
epam
Trim
ipra
min
e
Nor
coca
ine
Tria
zola
m
C
lom
ipra
min
e
Aty
pic
al O
pio
ids
Alp
ha-h
ydro
xytr
iazo
lam
Am
oxap
ine
Tra
mad
ol
AD
HD
Med
icat
ion
s
C
lona
zepa
m
P
rotr
ipty
line
Mep
erid
ine
M
ethy
lphe
nida
te
Flu
nitr
azep
am
M
apro
tilin
e N
orm
eper
idin
e
7-
amin
oflu
nitr
azep
am
P
ropo
xyph
ene
Bro
maz
epam
Sle
ep A
ids
N
orpr
opox
yphe
ne
Nitr
azep
am
Z
olpi
dem
Est
azol
am
M
idaz
olam
Flu
raze
pam
N
ordi
azep
am
Car
iso
pro
do
l
C
aris
opro
dol
M
epro
bam
ate
Not
e S
had
ed e
ntrie
s in
dica
te d
rugs
iden
tifie
d th
roug
h bl
ood
ana
lyse
s o
nly
N
on-s
had
ed e
ntrie
s ar
e dr
ugs
ide
ntifi
ed
thro
ugh
both
blo
od
and
oral
flu
id a
naly
ses
Sel
ectiv
e S
erot
onin
Upt
ake
Inhi
bito
rs (
SS
RIs
)
20
07 N
atio
nal R
oads
ide
Sur
vey
of A
lcoh
ol a
nd D
rug
Use
by
Driv
ers
Dru
g R
esul
ts
35
Tab
le 1
8 D
rug
Cat
ego
ry C
om
po
siti
on
mdashO
ral F
luid
an
d B
loo
d C
om
bin
ed
Illeg
al
P
resc
rip
tio
n
Pre
scri
pti
on
(co
nt
) P
resc
rip
tio
n (
con
t)
Ove
r-th
e-C
ou
nte
r
Co
cain
e B
enzo
dia
zep
ines
T
ric
yclic
s A
nti
dep
ress
ants
M
eth
ado
ne
Co
ug
h S
up
pre
ssan
t C
ocai
ne
Alp
razo
lam
A
mitr
ipty
line
Met
hado
ne
Dex
trom
etho
rpha
nB
enzo
ylec
goni
ne
Alp
ha-h
ydro
xyal
praz
olam
N
ortr
ipty
line
ED
DP
C
ocae
thyl
ene
Nor
diaz
epam
D
oxep
in
C
old
Med
icin
e N
orco
cain
e C
hlor
diaz
epox
ide
Des
met
hyld
oxep
in
O
pia
tes
P
seud
oeph
edrin
e
D
iaze
pam
Im
ipra
min
e
C
odei
ne
C
ann
abin
oid
s Lo
raze
pam
D
esip
ram
ine
Mor
phin
e
T
HC
O
xaze
pam
T
rimip
ram
ine
Hyd
roco
done
11-O
H-T
HC
T
emaz
epam
C
lom
ipra
min
e H
ydro
mor
phon
e
T
HC
-CO
OH
T
riazo
lam
A
mox
apin
e O
xyco
done
Alp
ha-h
ydro
xytr
iazo
lam
P
rotr
ipty
line
Oxy
mor
phon
e
S
tree
t D
rug
s F
lura
zepa
m
Map
rotil
ine
Ket
amin
e F
luni
traz
epam
A
typ
ical
Op
ioid
s
Nor
keta
min
e 7-
amin
oflu
nitr
azep
am
S
tim
ula
nts
T
ram
adol
PC
P
Nitr
azep
am
Met
hylp
heni
date
M
eper
idin
e
M
idaz
olam
Phe
nter
min
e N
orm
eper
idin
e
Str
eet
Am
ph
etam
ines
B
rom
azep
am
Pro
poxy
phen
e
Am
phet
amin
e
C
lona
zepa
m
B
arb
itu
rate
s N
orpr
opox
yphe
ne
MD
A
Est
azol
am
But
albi
tal
MD
MA
Phe
noba
rbita
l S
leep
Aid
s
M
DE
A
SS
RIs
P
ento
barb
ital
Zol
pide
m
M
etha
mph
etam
ine
F
luox
etin
e S
ecob
arbi
tal
Phe
nylp
ropa
nola
min
e D
esm
ethy
lser
tral
ine
Car
iso
pro
do
l
S
ertr
alin
e
C
aris
opro
dol
O
pia
tes
Nor
fluox
etin
e
Mep
roba
mat
e
6-
AM
(H
eroi
n)
6-A
C (
Her
oin
impu
rity)
Not
e S
had
ed e
ntrie
s in
dica
te d
rugs
iden
tifie
d th
roug
h bl
ood
ana
lyse
s o
nly
N
on-s
had
ed e
ntrie
s ar
e dr
ugs
ide
ntifi
ed
thro
ugh
both
blo
od
and
oral
flu
id a
naly
ses
Sel
ectiv
e S
erot
onin
Upt
ake
Inhi
bito
rs (
SS
RIs
)
2007 National Roadside Survey of Alcohol and Drug Use by Drivers Drug Results
36
2007 National Roadside Survey of Alcohol and Drug Use by Drivers Drug Results
Results Since two different biological matrices (oral fluid and blood) were gathered to be analyzed for the presence of drugs we present prevalence estimates in three different ways in this report
1) We present both daytime and nighttime drug prevalence estimates based on the analyses of the oral fluid samples alone and then in combination with alcohol using breath alcohol test results Tables reporting self-report drug use observed safety measures and reports with contact with the criminal justice system and the health care system follow these results
2) We next present nighttime drug prevalence estimates based on analyses of blood14
and then in combination with alcohol using breath alcohol test results
3) The third section presents nighttime prevalence results based on the combination of the results of the oral fluid blood analyses and subsequently in combination with alcohol using breath alcohol test results We conclude this section by presenting prevalence estimates for specific drugs from oral fluid andor blood combined In each of the sections the results are presented first in terms of drivers who were positive for any drug then by class followed by category as described in Tables 17 and 18
Throughout this report we do not combine results for daytime and nighttime survey respondents but display the two groups separately because the sampling frame is different for the two groups The daytime drivers were sampled during a single Friday two-hour period in each PSU while the nighttime drivers were sampled during four two-hour periods (two on Friday night and two on Saturday night in each PSU) Thus combining the daytime and nighttime samples would not result in a meaningful representation of driver drug use overall
Each of the various sampling stages (or frames) required a separate calculation of probability which then became a component of the final probability computation reflecting all levels or frames The total weighted number of the sample was identical to the total number of eligible drivers entering the survey bays including refusers but was adjusted to reflect the estimated distribution of those drivers in the 48 contiguous States Error terms for the analyses were computed by STATA (Stat Corp 2006) to account for the differential weights and the amount of variance attributable to the various sampling frames Further information on the weighting of the data can be found in the Methodology Report (Lacey et al 2009a)
Oral Fluid Results (Daytime and Nighttime Samples) Driver Drug Use Prevalence Based on Oral Fluid Results This section of the report presents the overall results of oral fluid analyses for all of the drugs indicated in the introductory section Drivers who tested positive for one or more of the drugs we tested in oral fluid are categorized as drug-positive It should be emphasized that this set of tables aggregates over-the-counter prescription and illegal drugs and metabolites of drugs in each category indicating only that those who tested positive have recently consumed at least one of the tested drugs and not that they were necessarily impaired by the substance
14 Daytime data collection did not include requests for blood samples
37
2007 National Roadside Survey of Alcohol and Drug Use by Drivers Drug Results
Unless explicitly indicated sample size (N) refers to the actual unweighted number of respondents Percentages are weighted Sample size may vary between tables because of missing values
Comparison of drug prevalence by time of day (Table 19) indicates that 11 percent of drivers in the daytime sample were drug-positive This level was significantly lower than the 144 percent of nighttime drivers who tested positive for drugs (p lt 01)
Table 19 Drug Prevalence by Time of Day (Oral Fluid)
Time of Day N
(Unweighted) Drug Positive
(Weighted) Daytime 1850 110
Nighttime 5869 144
Further when we examined drug prevalence by time of daysession (Table 20) we found that late night (Sessions 3 and 5) drivers were significantly more likely to be drug-positive (172 and 174 respectively) than Friday daytime (Session 1) drivers (11) or Friday and Saturday early evening (Sessions 2 and 4) drivers (129 and 136 respectively) (p lt 01)
Table 20 Drug Prevalence by Time of DaySession (Oral Fluid)
Session N
(Unweighted) Drug Positive
(Weighted)
1 Friday 930 am ndash 1130 am or 130 pm ndash 330 pm
1850 110
2 Friday 1000 pm ndash Midnight 1610 129
3 Friday 100 am ndash 300 am 1299 172
4 Saturday 1000 pm ndash Midnight 1684 136
5 Saturday 100 am ndash 300 am 1276 174
Comparison of drug prevalence by time and region (Table 21) revealed that the Northeast region had the greatest percentage of drug-positive findings in the nighttime driving sample at 173 percent (p lt 05) The Northeast region also had the second highest percentage in the daytime driving sample at 125 percent (although there were no statistical differences by region during the daytime) In spite of the Northeast regionsrsquo relatively high prevalence of drug-positives no clear pattern by region emerged
38
2007 National Roadside Survey of Alcohol and Drug Use by Drivers Drug Results
Table 21 Drug Prevalence by Time of Day and Region15 (Oral Fluid)
N Drug Positive Time of Day Region (Unweighted) (Weighted)
Daytime
Midwest Northeast South West
546 379 472 453
115
125
131
89
Overall Daytime 1850 110
Nighttime
Midwest
Northeast
South
West
1694
1111
1559
1505
150
173
140
129
Overall Nighttime 5869 144
Although the daytime driving sample showed no statistically significant difference in drug prevalence between males and females (Table 22) in the nighttime driving sample male drivers were significantly more likely to be drug-positive (165) than female drivers (113) (p lt 01)
Table 22 Drug Prevalence by Time of Day and Gender (Oral Fluid)
N Drug Positive Time of Day Gender (Unweighted) (Weighted)
Daytime Males Females
1032 811
110
113
Overall Daytime 1843 110
Nighttime
Males
Females
3605
2250
165
113
Overall Nighttime 5855 144
Comparison of drug prevalence by time of day and age (Table 23) showed that within the daytime driving sample drivers aged 45-64 showed the highest percentage of drug positives and drivers aged 16-20 and aged 65+ were significantly less likely to be positive than other ages of drivers (p lt 05) In the nighttime driving sample drivers aged 45-64 and 65+ were significantly less likely to be drug positive (p lt 01) Drivers aged 16-20 21-34 years and 35-44 years all had results similar to each other Age was self-reported by respondent Note that in Table 23 as well as upcoming tables the age ranges are not of equal intervals but were developed to roughly
15 Regions are defined by the NASSGES system according to US Census Regions (Midwest includes the West North Central and East North Central States Northeast includes New England and Middle Atlantic States South includes the West South Central East South Central and South Atlantic States and West includes West and Mountain States
39
2007 National Roadside Survey of Alcohol and Drug Use by Drivers Drug Results
categorize underage drivers (16-20) young drivers (21-34) followed by middle age and late middle age (35-44 and 45-64) and finally by senior drivers (65+ years)
Table 23 Drug Prevalence by Time of Day and Age (Oral Fluid)
N Drug Positive Time of Day Age (Unweighted) (Weighted)
Daytime
16-20 21-34 35-44 45-64 65+
99 436 374 668 245
62
112
116
133
64
Overall Daytime 1822 111
Nighttime
16-20 21-34 35-44 45-64 65+
961 2437 1042 1216
148
161
171
152
95
20
Overall Nighttime 5804 146
Gender comparisons within age groups (Table 24) revealed that within the daytime sample drug prevalence among female daytime drivers aged 45-64 (168) was significantly higher than male drivers of the same age group (97) (p lt 05) The same was true of the nighttime sample with drug prevalence among female drivers aged 45-64 (131) being significantly higher than male drivers of the same age group (72) (p lt 01)
Within the daytime sample drug prevalence among male drivers aged 21-34 years was statistically higher than among female drivers of the same age group (139 versus 75) (p lt 05) Additionally in the nighttime sample drug prevalence among male drivers in age categories 16-20 years 21-34 years and 35-44 years was significantly higher than the same-aged female counterparts (p lt 01)
40
2007 National Roadside Survey of Alcohol and Drug Use by Drivers Drug Results
Table 24 Drug Prevalence by Time of Day Age and Gender (Oral Fluid)
N Drug Positive Time of Day Gender Age (Unweighted) (Weighted)
Daytime
Males
16-20
21-34
35-44
45-64
65+
59
243
192
362
161
45
139
137
97
71
Overall Males ndash Daytime 1017 110
Females
16-20
21-34
35-44
45-64
65+
39
192
181
304
84
103
75
101
168
48
Overall Females ndash Daytime 800 114
Nighttime
Males
16-20
21-34
35-44
45-64
65+
598
1492
630
734
101
207
202
182
72
19
Overall Males ndash Nighttime 3555 167
Females
16-20
21-34
35-44
45-64
65+
362
940
409
480
47
95
119
109
131
23
Overall Females ndash Daytime 2238 113
Comparisons by self-reported race and ethnicity (Table 25) showed that in both the daytime and nighttime samples drivers who identified themselves as Asian were significantly less likely to be drug-positive (41 and 18 respectively) than drivers who identified themselves as African American Hispanic White or Other (p lt 05 at daytime p lt 01 at nighttime) Although statistically non-significant African American drivers were found to have the highest percentage of drug-positive results in both daytime (144) and nighttime (205) samples followed by Other (128 daytime and 162 nighttime) and White (116 daytime and 15 nighttime)
41
2007 National Roadside Survey of Alcohol and Drug Use by Drivers Drug Results
Table 25 Drug Prevalence by RaceEthnicity (Oral Fluid)
N Drug Positive Time of Day RaceEthnicity (Unweighted) (Weighted)
Daytime
African American Asian Hispanic White Other
267 46
253 1192
59
144
41
89
116
128
Overall Daytime 1817 112
Nighttime
African American Asian Hispanic White Other
973 191
1006 3355
272
205
18
118
150
162
Overall Nighttime 5797 146
RaceEthnic groups other than ldquoHispanicrdquo are always ldquonon-Hispanicrdquo
Comparisons of drug prevalence by education level (Table 26) revealed that prevalence of drug use increased from the daytime sample to the nighttime sample across all education levels except ldquosome collegerdquo Daytime drivers who identified themselves as college graduates or having some graduate experience were statistically less likely to be drug-positive than those with less education (p lt 01) This remained the case within the nighttime sample but only for drivers who identified themselves as college graduates (p lt 01)
Table 26 Drug Prevalence by Education Level (Oral Fluid)
N Drug Positive Time of Day Education Level (Unweighted) (Weighted)
Daytime
Not a High School Graduate High School Graduate Some College College Graduate Some Graduate Work
162 476 593 419 173
154
150
139
55
41
Overall Daytime 1823 111
Nighttime
Not a High School Graduate High School Graduate Some College College Graduate Some Graduate Work
573 1470 2218 1156
387
184
224
116
95
157
Overall Nighttime 5804 146
Comparing drug prevalence by employment status (Table 27) showed that in the daytime sample drug prevalence among unemployed drivers and drivers on disability was significantly higher than that of employed drivers or homemakers students and those who reported they were
42
2007 National Roadside Survey of Alcohol and Drug Use by Drivers Drug Results
retired (p lt 01) In the nighttime sample drug prevalence among drivers on disability was again significantly higher than employed drivers (p lt 01) while no statistical difference in drug prevalence was found in the nighttime sample between unemployed and employed drivers Within the nighttime sample employed drivers had significantly higher drug prevalence than ldquohomemakerrdquo and ldquoretiredrdquo drivers (p lt 01)
Table 27 Drug Prevalence by Employment Status (Oral Fluid)
N Drug Positive Time of Day Gender (Unweighted) (Weighted)
Daytime
EmployedSelf Employed Homemaker Student UnemployedRetired On Disability Other
1240 90 73 78
286 45 11
104
42
72
213
139
387
307
Overall Daytime 1823 111
Nighttime
EmployedSelf Employed Homemaker Student UnemployedRetired On Disability Other
4618 104 585 204 205
67 22
150
59
132
168
74
412
43
Overall Nighttime 5805 146
Drug prevalence rates among drivers of various vehicle types (passenger vehicle pickup sports utility vehicles (SUV) vanminivan and motorcycles) (Table 28) were not statistically different in the daytime sample Note however that motorcyclists had the greatest percentage of drug-positive results in both the daytime and nighttime samples although this difference was found to be statistically significant only in the nighttime sample (p lt 01)
43
2007 National Roadside Survey of Alcohol and Drug Use by Drivers Drug Results
Table 28 Drug Prevalence by Vehicle Type (Oral Fluid)
Drug Time of N Positive
Day Vehicle Type (Unweighted) (Weighted)
Passenger Vehicle 952 121
Pickup 285 66
SUV 394 97Daytime Van amp Minivan 177 126
Motorcycle 30 248
1838 110
Passenger Vehicle 3623 151
Pickup 695 144
SUV 1055 121
Overall Daytime
Nighttime Van amp Minivan 381 130
Motorcycle 73 324
5827 145Overall Nighttime
Driver Drug Use Prevalence by Drug Class Based on Oral Fluid Results In this section of the report we display driver drug use prevalence by class of drug The classes of drugs for which we tested were antidepressants marijuana narcotic-analgesics sedatives stimulants and other (see Table 17) Because some drivers tested positive for drugs in more than one class an additional mutually exclusive category ldquoMore than 1 Classrdquo appears in the drug class tables This was done to avoid double counting individual positive results Thus for example since marijuana is both a class by itself and could appear in the ldquoMore than 1 classrdquo cell as well (as could other classes of drugs) from these tables one cannot arrive at an overall prevalence estimate for marijuana alone Detailed summaries of prevalence estimates for individual drugs appear in Tables 137-140 later in the report
Drug Class
Comparison of drug classes by time of day (Table 29) indicated that when examining all drivers nighttime drivers were significantly more likely to test positive for more than one drug class (23) than daytime drivers (15) (p lt 01)
Table 29 Number and Distribution of Drug Classes by Time of Day (Oral Fluid)
Number of N Time of Day Drug Classes (Unweighted) (Weighted)
1 206 95
2+ 40 15Daytime Negative 1604 890
1850 1000
1 680 121
2+ 156 23
Overall Daytime
Nighttime Negative 5033 856
5869 1000Overall Nighttime
44
2007 National Roadside Survey of Alcohol and Drug Use by Drivers Drug Results
However when examining only drug-positive drivers (Table 30) there were no significant differences between daytime and nighttime drivers in the percentage of single-drug users (862 versus 837) or multi-drug users (138 versus 163)
Table 30 Number and Distribution of Drug Classes by Time of Day (Drug Positives Only) (Oral Fluid)
Number of N Time of Day Drug Classes (Unweighted) (Weighted)
Daytime 1 2+
206 40
862 138
Overall Daytime 246 1000
Nighttime 1 2+
680 156
837 163
Overall Nighttime 836 1000
In comparing prevalence of drug classes by time and region (Table 31) it was found that marijuana was generally the most common drug class across all the regions both in daytime (39) and nighttime (61) samples Nighttime drivers in the Midwest and Northeast regions were more likely to test positive for marijuana than daytime drivers (p lt 05) However marijuana results in the South and West regions did not differ between daytime and nighttime drivers For stimulants a higher percentage of nighttime drivers in all regions tested positive than did daytime drivers However the difference was statistically significant only in the Midwest (p lt 01) and West (p lt 05)
45
2007 National Roadside Survey of Alcohol and Drug Use by Drivers Drug Results
Table 31 Drug Classes by Time of Day and Region (Oral Fluid)
Time of Midwest Northeast South West All Day Drug Class
N=546 N=379 N=472 N=453 N=1850
Antidepressants 04 06 05 05 05
Marijuana 34 30 55 40 39
Narcotic-Analgesics 27 21 13 06 16
Sedatives 19 26 21 07 16Daytime Stimulants 08 17 22 20 16
Other 00 13 00 00 02
More than 1 Class 22 10 14 12 15
115 125 131 89 110
885 875 869 911 890
Overall Drug Positive Daytime
Negative
N=1694 N=1111 N=1559 N=1505 N=5869
Antidepressants 05 02 00 01 02
Marijuana 77 76 63 41 61
Narcotic-Analgesics 10 28 12 18 16
Sedatives 11 02 07 04 06Nighttime Stimulants 30 23 27 40 32
Other 02 00 01 05 03
More than 1 Class 16 41 29 20 23
150 173 140 129 144
850 827 860 871 856
Overall Drug Positive Nighttime
Negative
ldquoMore than 1 Classrdquo ndash Drivers testing positive for more than one drug are only counted in this category In this table percentages are weighted
Comparison of drug class by time and gender (Table 32) showed that males were significantly more likely to test positive for marijuana than females in samples of both daytime (59 males versus17 females) and nighttime (74 males versus 41 females) drivers (p lt 01) In the daytime sample females were more likely to test positive for narcotic-analgesics and sedatives than were males (p lt 01) however a statistical difference of this kind was not detected in the nighttime sample
46
2007 National Roadside Survey of Alcohol and Drug Use by Drivers Drug Results
Table 32 Drug Classes Distribution by Time of Day and Gender (Oral Fluid)
Time of Males Females Total Day Drug Class
Daytime
Antidepressants Marijuana Narcotic-Analgesics Sedatives Stimulants Other More than 1 Class
N=1032 01 59 10 12 18 00 10
N=811 09 17 25 22 14 05 21
N=1843 05 40 17 16 16 02 15
Overall Drug Positive Daytime 110 113 111 Negative 890 887 889
Nighttime
Antidepressants Marijuana Narcotic-Analgesics Sedatives Stimulants Other More than 1 Class
N=3605 03 74 18 04 33 03 30
N=2250 01 41 13 10 31 03 14
N=5855 02 61 16 06 32 03 24
Overall Drug Positive Nighttime 165 113 145 Negative 835 887 855
ldquoMore than 1 Classrdquo ndash Drivers testing positive for more than one drug are only counted in this category In this table percentages are weighted
When we examined drug classes by time of day and age (Table 33) we found that daytime drivers aged 21-34 were more likely to use marijuana (74) than daytime drivers in other age groups (p lt 01) However drivers aged 16-20 years had the highest marijuana use (98) in the nighttime sample followed by the 21-34 year age group (85) both of which were statistically higher than the other age groups (p lt 01) The prevalence of narcotic-analgesics was highest among daytime drivers aged 44-64 (29) (p lt 01) however in the nighttime sample the 35-44 age group recorded the highest prevalence of narcotic-analgesics (42) (p lt 01)
47
Table 33 Drug Class Distribution by Time of Day and Age (Oral Fluid)
Time of 16-20 21-34 35-44 45-64 65+ Total Day Drug Class
N=99 N=436 N=374 N=668 N=245 N=1822 Antidepressants 09 02 03 08 03 05 Marijuana 44 74 48 17 07 40 Narcotic-Analgesics 00 07 19 29 08 17 Sedatives 07 02 14 23 40 16
Daytime Stimulants 03 22 12 22 01 16 Other 00 00 00 07 00 02 More than 1 Class 00 06 21 26 03 15 Overall Drug Positive
62 112 116 133 64 111 Daytime
Negative 938 888 884 867 936 889 N=961 N=2437 N=1042 N=1216 N=148 N=5804
Antidepressants 03 01 04 01 03 02 Marijuana 98 85 41 11 00 62 Narcotic-Analgesics 11 08 42 14 04 16 Sedatives 00 06 12 07 13 07
Nighttime Stimulants 20 36 28 45 00 33 Other 02 05 02 01 00 03 More than 1 Class 27 29 22 15 00 24 Overall Drug Positive
161 171 152 95 20 146 Nighttime
Negative 839 829 848 905 980 854 ldquoMore than 1 Classrdquo ndash Drivers testing positive for more than one drug are only counted in this category In this table percentages are weighted
2007 National Roadside Survey of Alcohol and Drug Use by Drivers Drug Results
Driver Drug Use Prevalence by Drug Category Based on Oral Fluid Results In this section of the report we display drug use prevalence results from oral fluid tests by drug category The three drug categories were illegal prescription and over-the-counter Because there were very few positive results for over-the-counter drugs the prescription and over-theshycounter categories are combined in these tables into a single category (ldquoMedicationsrdquo) Additionally some respondents tested positive for more than one category of drug Thus tables presenting drug categories present four mutually exclusive categories Illegal Medications Illegal and Medications and Negative So as not to double count individual positive results an individualrsquos result appears in only one of these categories However for example in Table 34 to determine the proportion of daytime drivers who tested positive for illegal drugs one could sum the daytime values for the ldquoIllegalrdquo category (58) and for the rdquo Illegal amp Medicationsrdquo category (05) to arrive at a prevalence estimate of 63 of daytime drivers who were positive for at least one illegal drug Detailed summaries of prevalence estimates for individual drugs appear in Tables 137-140 later in the report
As previously noted drugs may be classified in different ways depending on the use of the classification system For example in NHTSArsquos drug evaluation and classification (DEC)
48
2007 National Roadside Survey of Alcohol and Drug Use by Drivers Drug Results
program the categories CNS Depressants CNS Stimulants Hallucinogens Dissociative Anesthetic (PCP) Narcotic Analgesics Inhalants and Cannabis are used
Comparison of drug categories by time of day (Table 34) reveal that almost 6 percent of daytime drivers tested positive for drugs in the ldquoIllegalrdquo category as opposed to over 10 percent of nighttime drivers This was a statistically significant difference between the two groups (p lt 01) Positive results in the ldquoMedicationsrdquo category although not statistically significant were found to be slightly higher among the daytime drivers (almost 5) than nighttime drivers (3)
Table 34 Drug Categories Distribution by Time of Day (Oral Fluid)
N Time of Day Drug Category (Unweighted) (Weighted)
Daytime
Illegal Medications Illegal amp Medications Negative
125 107 14
1604
58 48 05
890 Overall Daytime 1850 1000
Nighttime
Illegal Medications Illegal amp Medications Negative
575 201 60
5033
105 30 09
856 Overall Nighttime 5869 1000
ldquoMedicationsrdquo includes prescription and over-the-counter drugs
Comparison of drug categories by time of day and region (Table 35) showed that of daytime drivers the South region had the highest percentage of positive results for ldquoIllegalrdquo followed by the West region however these differences were not statistically significant In the nighttime sample the Midwest region had the highest percentage of ldquoIllegalrdquo drug prevalence although this difference was not statistically significant
49
2007 National Roadside Survey of Alcohol and Drug Use by Drivers Drug Results
Table 35 Drug Categories Distribution by Time of Day and Region (Oral Fluid)
N Time Region Drug Category (Unweighted) (Weighted)
Daytime
Midwest
Illegal Medications Illegal amp Medications Negative
38 47 5
456
42 67 05
885 Overall 546 1000
Northeast
Illegal Medications Illegal amp Medications Negative
20 20 2
337
49 75 01
875 Overall 379 1000
South
Illegal Medications Illegal amp Medications Negative
35 22 5
410
82 46 03
869 Overall 472 1000
West
Illegal Medications Illegal amp Medications Negative
32 18 2
401
63 20 07
911 Overall 453 1000
Nighttime
Midwest
Illegal Medications Illegal amp Medications Negative
185 68 14
1427
115 30 04
850 Overall 1694 1000
Northeast
Illegal Medications Illegal amp Medications Negative
112 32 14
953
108 42 23
827 Overall 1111 1000
South
Illegal Medications Illegal amp Medications Negative
131 59 22
1347
102 25 13
860 Overall 1559 1000
West
Illegal Medications Illegal amp Medications Negative Overall
147 42 10
1306 1505
98 26 05
871 1000
ldquoMedicationsrdquo includes prescription and over-the-counter drugs
50
2007 National Roadside Survey of Alcohol and Drug Use by Drivers Drug Results
When examining prevalence by drug category and gender (Table 36) we found that in the daytime sample male drivers were more likely to test positive for ldquoIllegalrdquo drugs (82) than female drivers (30) (p lt 01) Conversely daytime female drivers were more likely to show positive results for ldquoMedicationsrdquo (76) than daytime male drivers (25) (p lt 01) In the nighttime sample 125 percent of male drivers tested positive for ldquoIllegalrdquo drugs as opposed to 75 percent of female drivers (p lt 01) The difference in percentage of positive results for ldquoMedicationsrdquo between male and female drivers was not as striking in the nighttime sample as in the daytime sample and was not statistically significant
Table 36 Drug Categories Distribution by Time of Day and Gender (Oral Fluid)
N Time of Day Gender Drug Category (Unweighted) (Weighted)
Illegal 87 82 Medications 35 25
Daytime
Male Illegal amp Medications Negative
9 901
03 890
Overall 1032 1000 Illegal 38 30 Medications 72 76
Female Illegal amp Medications Negative
5 696
06 887
Overall 811 1000 Illegal 410 125 Medications 106 28
Male Illegal amp Medications Negative
41 3048
11 835
Nighttime Overall 3605 1000 Illegal 164 75 Medications 95 33
Female Illegal amp Medications Negative
19 1972
05 887
Overall 2250 1000 ldquoMedicationsrdquo includes prescription and over-the-counter drugs In this table percentages are weighted
In comparing drug categories by time of day and age (Table 37) it was clear that within the daytime sample ldquoIllegalrdquo drug use was highest for drivers aged 21-34 (99) followed by drivers aged 35-44 (65) The prevalence of ldquoIllegalrdquo drugs for these age groups differed significantly from that in the remaining age groups (p lt 01) In the nighttime sample drivers in the 21-34 year age group still maintained the highest percentage (142) of positive results for ldquoIllegalrdquo drugs however that group was followed by the youngest age group (16-20 years) for ldquoIllegalrdquo drugs (131) (p lt 01) The use of ldquoMedicationsrdquo was highest among the 45-64 year age group (88) in the daytime sample (non-significant) and in the 35-44 year old age group the nighttime sample (69) (p lt 01)
51
2007 National Roadside Survey of Alcohol and Drug Use by Drivers Drug Results
Table 37 Drug Categories Distribution by Time of Day and Age (Oral Fluid)
N Time of Day Age Drug Category (Unweighted) (Weighted)
Daytime
16-20
Illegal
Medications
Illegal amp Medications
Negative
9
2
0
88
46
16
00
938
Overall 99 1000
21-34
Illegal
Medications
Illegal amp Medications
Negative
54
14
4
364
99
12
01
888
Overall 436 1000
35-44
Illegal
Medications
Illegal amp Medications
Negative
25
23
3
323
65
42
10
884
Overall 374 1000
45-64
Illegal
Medications
Illegal amp Medications
Negative
32
51
7
578
39
88
06
867
Overall 668 1000
65+
Illegal
Medications
Illegal amp Medications
Negative
3
17
0
225
08
56
00
936
Overall 245 1000 Nighttime
16-20
Illegal Medications Illegal amp Medications Negative
120 11 12
818
131 16 14
839 Overall 961 1000
21-34
Illegal
Medications
Illegal amp Medications
Negative
308
55
28
2045
142
19
10
829
Overall 2436 1000 35-44 Illegal
Medications Illegal amp Medications Negative
82 57 11
892
76 69 07
848
52
2007 National Roadside Survey of Alcohol and Drug Use by Drivers Drug Results
N Time of Day Age Drug Category (Unweighted) (Weighted)
Overall 1042 1000
45-64
Illegal
Medications
Illegal amp Medications
Negative
64
67
9
1075
57
30
07
905
Overall 1215 1000
65+
Illegal Medications Illegal amp Medications Negative
0 9 0
139
00 20 00
980 Overall 148 1000
ldquoMedicationsrdquo includes prescription and over-the-counter drugs In this table percentages are weighted
Driver Drug Prevalence Based on Oral Fluid and BAC Results The following section presents the results of the oral fluid drug analyses combined with the blood alcohol concentration (BAC) results obtained from breath tests16 Categories for BAC by grams per deciliter (gdL) are indicated as ldquozerordquo (BAC less than 005 gdL) ldquobetween zero and 08rdquo (greater than 005 up to 08 gdL) and ldquo08+rdquo (BAC greater than 08 gdL) Note that the daytime sample consisted of very few drug positive drivers with alcohol positive results which limited the statistical testing that could be done
In comparing the number of drug-positive drivers by time of day and BAC level (Tables 38 and 39) a statistically significant association was found between drug-positive and alcohol-positive drivers within the nighttime driving sample In other words the percentage of nighttime drivers with BAC gdL 08+ was significantly higher among drug-positive drivers than among drug-negative drivers (p lt 01)
The same association was observed with the ldquobetween zero and 08rdquo category among drug-positive nighttime drivers (p lt 01) relative to drug-negative drivers However for daytime drivers no statistical association was found largely because of the small number of alcohol-positive drivers in the daytime sample
Note that because of the small number of alcohol-positive drivers in the daytime sample (n = 23) comparisons involving drug-positive drivers for this group of drivers were not attempted in the remaining portion of this report
16 More complete information on the alcohol results (not including drug results) is available in Lacey et al (2009b)
53
2007 National Roadside Survey of Alcohol and Drug Use by Drivers Drug Results
Table 38 Drug Prevalence by Time of Day and BAC (Percentages Calculated by Row) (Oral Fluid)
BAC (gdL) Time of Drug N Between
Day Result (Unweighted) Zero Zero and 08 08+ Positive 246
Overall Daytime 1845
982 14 03 Daytime Negative 1599 992 06 02
07 02991 Positive 836
Overall Nighttime 5867
805 150 45 Nighttime Negative 5031 902 81 17
91 21888 In this table percentages are weighted
Table 39 Drug Prevalence by Time of Day and BAC (Percentages Calculated by Column) (Oral Fluid)
Time of Day
Drug Result
BAC (gdL)
Zero Between
Zero and 08 08+ All
Daytime Positive Negative
N=1822 109 891
N=18 222 778
N=5 171 829
N=1845 110 890
Nighttime Positive Negative
N=5207 131 869
N=530 239 761
N=130 306 694
N=5867 144 856
In this table ldquoNsrdquo are unweighted and percentages are weighted
Table 40 shows that within the daytime sample drug-positive drivers in the age groups 16-20 and 21-34 had the greatest percentage of alcohol-positive results however it should be noted that the sample size for the youngest group was only 11 Among nighttime drug-positive participants drivers aged 21-34 had the greatest percentage of alcohol positives (in both the categories BAC between zero and 08 and BAC 08+) (p lt 01) As noted earlier the number of years within age categories is not equivalent
54
2007 National Roadside Survey of Alcohol and Drug Use by Drivers Drug Results
Table 40 BAC Among Drug-Positive Drivers by Time of Day and Age (Oral Fluid)
Time of Day Age
N (Unweighted) Zero
BAC (gdL) Between
Zero and 08 08+ 16-2021-34
11 72
897 955
00 45
103 00
Daytime 35-4445-64
65+
51 90 20
992 998
1000
08 02 00
00 00 00
Overall Positive Daytime 244 982 14 03 16-2021-34
143 392
868 750
100 197
32 53
Nighttime 35-4445-64
65+
150 141
9
878 810 836
85 143 164
37 47 00
Overall Positive Nighttime 835 804 150 45 In this table percentages are weighted
Among both daytime and nighttime drivers there were fewer alcohol-positive drivers among drug-positive drivers with 2+ classes of drugs than among those with one class of drug (Tables 41 and 42) however due to the small sample size there was no statistical difference
Table 41 BAC Among Drug-Positive Drivers by Number of Drug Classes and Time of Day (Percentages Calculated by Column) (Oral Fluid)
Time of Day Number of Drug
Classes N
(Unweighted) Zero
BAC (gdL) Between
Zero and 08 08+ 1 206 860 951 1000
Daytime 2+ 40 140 49 00 Overall Daytime 246 1000 1000 1000
1 680 834 816 963 Nighttime 2+ 156 166 184 37
Overall Nighttime 836 1000 1000 1000 In this table percentages are weighted
55
2007 National Roadside Survey of Alcohol and Drug Use by Drivers Drug Results
Table 42 BAC Among Drug-Positive Drivers by Number of Drug Classes and Time of Day (Percentages Calculated by Row) (Oral Fluid)
Time of Day Number of Drug
Classes N
(Unweighted) Zero
BAC (gdL) Between
Zero and 08 08+ 1 206 980 16 04
Daytime 2+ 40 995 05 00 Overall Daytime 246 982 14 03
1 680 801 147 52 Nighttime 2+ 156 820 170 10
Overall Nighttime 836 805 150 45 In this table percentages are weighted
When oral fluid drug category findings were combined with BAC results we found that in both the daytime and nighttime samples the drug-positive drivers who were also alcohol-positive were more likely to be positive for ldquoIllegalrdquo drugs than ldquoMedicationsrdquo (Table 43) This was particularly true in the nighttime sample in which 173 percent had BACs between zero and 08 (compared to 63 in the ldquoMedicationsrdquo category) and 57 percent had BACs greater than 08 (compared to 12 in the ldquoMedicationsrdquo category) (p lt 01) In the daytime sample however the differences were statistically non-significant (p value = 05)
Table 43 BAC Among Drug-Positive Drivers by Drug Category and Time of Day (Oral Fluid)
Time of Day Drug Category
N (Unweighted)
BAC (gdL)
Zero Between
Zero and 08 08+
Daytime Illegal Medications Illegal amp Medications Negative
125 107 14
1604
971 996 983 992
23 04 17 06
06 00 00 02
Nighttime Illegal Medications Illegal amp Medications Negative
575 199 60
5033
770 925 814 902
173 63
177 81
57 12 09 17
ldquoMedicationsrdquo includes prescription and over-the-counter drugs In this table percentages are weighted
Table 44 presents the findings by drug category age and time of day Due to the number of groupings (and thus relatively small sample sizes in included cells) caution should be exercised in the interpretation of the findings especially among the daytime driving sample Overall among the nighttime driving sample the high alcohol-positive drivers (ie drivers registering greater than 08 BAC gdL) tested positive for drugs in the ldquoIllegalrdquo category more frequently than ldquoMedicationsrdquo across all age groups except 65+ (an age group producing a very small sample size for drug positives) Further the same pattern emerged among drivers with BACs
56
2007 National Roadside Survey of Alcohol and Drug Use by Drivers Drug Results
between zero and 08 across all age groups except for the age category 45-64 where a high proportion of drivers tested positive for both ldquoIllegal and Medicationsrdquo
Table 44 BAC of Drivers by Drug Category Age and Time of Day (Oral Fluid)
Time of Day Age Drug Category
N (Unweighted) Zero
BAC (gdL) Between
Zero and 08 08+
Daytime
16-20
Illegal Medications Illegal amp Medications Negative
9 2 0
88
861 1000
NA 993
00 00
NA 07
139 00
NA 00
Overall 99 987 07 06
21-34
Illegal Medications Illegal amp Medications Negative
54 14 4
364
957 932
1000 994
43 68 00 05
00 00 00 01
Overall 436 990 10 01
35-44
Illegal Medications Illegal amp Medications Negative
25 23 3
323
986 1000 1000
991
14 00 00 07
00 00 00 02
Overall 374 991 07 01
45-64
Illegal Medications Illegal amp Medications Negative
32 51 7
578
1000 1000 958 987
00 00 42 09
00 00 00 04
Overall 668 989 08 03
65+
Illegal Medications Illegal amp Medications Negative
3 17
0 225
1000 1000
NA 998
00 00
NA 01
00 00
NA 01
Overall 245 998 01 01 Nighttime
16-20
Illegal Medications Illegal amp Medications Negative
120 11 12
818
839 1000 990 944
121 00 10 51
40 00 00 05
Overall 961 931 59 10
21-34
Illegal Medications Illegal amp Medications Negative
308 55 28
2045
736 809 846 878
204 170 154
98
61 21 00 24
Overall 2436 856 115 29
35-44
Illegal Medications Illegal amp Medications Negative
82 57 11
892
777 985 927 919
159 04 73 67
64 11 00 14
Overall 1042 913 70 17
57
2007 National Roadside Survey of Alcohol and Drug Use by Drivers Drug Results
Time of Day Age Drug Category
N (Unweighted) Zero
BAC (gdL) Between
Zero and 08 08+ Illegal 64 808 126 66
45-64 Medications Illegal amp Medications
67 9
922 333
70 609
08 58
Negative 1075 901 87 13 Overall 1215 892 92 16 Illegal 0 NA NA NA
65+ Medications Illegal amp Medications
9 0
836 NA
164 NA
00 NA
Negative 139 887 66 47 Overall 148 886 68 46
ldquoMedicationsrdquo includes prescription and over-the-counter drugs In this table percentages are weighted
When examining drug category by gender and time of day (Table 45) male drivers who tested positive for ldquoIllegalrdquo drugs in both the daytime and nighttime samples also had greater percentages of alcohol-positive results than their female counterparts However the small sample size precluded valid statistical testing on the daytime sample Within the nighttime sample differences were statistically significant (p lt 01)
Table 45 BAC of Drivers by Drug Category Gender and Time of Day (Oral Fluid)
Time of Day Gender Drug Category
N (Unweighted) Zero
BAC (gdL) Between
Zero and 08 08+
Daytime
Males
Females
Illegal Medications Illegal amp Medications Negative
87 35 9
901
967 985 956 991
25 15 44 08
08 00 00 01
Overall 1032 989 09 02 Illegal Medications Illegal amp Medications Negative
38 72 5
696
984 1000 1000 993
16 00 00 05
00 00 00 03
Overall 811 993 05 02
Nighttime
Males
Illegal Medications Illegal amp Medications Negative
410 106 41
3048
743 960 766 900
180 31 223 79
76 10 11 21
Overall 3605 881 92 27
Females
Illegal Medications Illegal amp Medications Negative
164 95 19
1972
842 875 990 904
152 110 10 83
06 15 00 12
Overall 2250 899 89 12 ldquoMedicationsrdquo includes prescription and over-the-counter drugs In this table percentages are weighted
58
2007 National Roadside Survey of Alcohol and Drug Use by Drivers Drug Results
Drugs Oral Fluid Results and Agreement with Self-Reported Drug Use Table 46 compares the results of the oral fluid analyses with responses to the self-reported drug use questionnaire This questionnaire was administered to all drivers who provided an oral fluid sample and was completed while the oral fluid device was collecting the saliva
The cross tabulation results of self-reported drug use (in the past 24 hours past 2 days past month past year over a year and never) and oral fluid analysis results (by drug category) revealed interesting findings Note that this table only reports on drivers who were drug-positive Agreement between reported past 24-hour use and drug-positive analysis results for the nighttime driving sample was greatest (highest percentage) among antidepressants cough suppressants and pain killers
The lowest correspondence (lowest percentages) was found for amphetamines and barbiturates Interestingly approximately one-quarter of marijuana-positive nighttime drivers admitted to marijuana use in the previous 24 hours this increased to over one-third when combined within the past two days A smaller proportion (75 and 58 respectively) admitted to recent use of cocaine
Among nighttime drivers who tested positive for antidepressants the majority (664) indicated they in fact used the substance in the past 24 hours Thus in this example agreement between self-reports and oral fluid analysis results are fairly high However when we examine amphetamines (typically viewed as a recreational or illegal drug) agreement between self-report and a positive test analysis is low Here about 72 percent of nighttime positive drivers indicated they ldquoneverrdquo had used the substance yet the drug analysis revealed a positive result In some instances this may be related to a reluctance to disclose however in other instances a driver may not have been aware that the substance they were taking contained the drug being reported (for example some drivers may not be aware that some diet pills contain amphetamines) Similar results were obtained for nighttime drivers providing blood samples A table reflecting those results appears in Appendix A
59
2007 National Roadside Survey of Alcohol and Drug Use by Drivers Drug Results
Table 46 Oral Fluid Results and Agreement With Self-Reported by Drug Type (Oral Fluid)
Drug Category Self-Reported
Drug Use
Oral Fluid Positive for that Drug Daytime Nighttime
N (Unwtd)
(Weighted)
N (Unwtd)
(Weighted)
Antidepressants
Past 24 Hours Past 2 Days Past Month Past Year Over a Year Never
13 0 0 1 0 4
857 00 00 47 00 96
18 0 2 0 1 4
664 00 96 00
212 28
Overall 18 1000 25 1000
Amphetamines
Past 24 Hours Past 2 Days Past Month Past Year Over a Year Never
0 0 0 0 1
13
00 00 00 00 32
968
1 0 4 3
10 51
20 00 86 89 88
718 Overall 14 1000 69 1000
Barbiturates
Past 24 Hours Past 2 Days Past Month Past Year Over a Year Never
1 0 1 0 0 4
14 00 08 00 00
978
2 0 0 0 0 8
31 00 00 00 00
969 Overall 6 1000 10 1000
Benzodiazepines
Past 24 Hours Past 2 Days Past Month
Past Year Over a Year Never
11 0 0 0 3
20
158 00 00 00 38
804
14 4 2 0 5
37
244 34 26 00 22
674 Overall 34 1000 62 1000
Cocaine
Past 24 Hours Past 2 Days Past Month Past Year Over a Year Never
1 2 1 0 3
30
04 22 06 00
186 782
10 7
10 17 29
146
75 58 48 68
170 579
Overall 37 1000 219 1000
Cough Suppressants
Past 24 Hours
Past 2 Days
Past Month
Past Year
Over a Year
2
0
0
0
0
945
00
00
00
00
6
2
3
1
1
393
198
129
23
37
Never 1 55 2 220
Overall 3 1000 15 1000
60
2007 National Roadside Survey of Alcohol and Drug Use by Drivers Drug Results
Drug Category Self-Reported
Drug Use
Oral Fluid Positive for that Drug Daytime Nighttime
N (Unwtd)
(Weighted)
N (Unwtd)
(Weighted)
Ketamine
Past 24 hrs Past 2 days Past Month Past Year Over a Year Never
0 0 0 0 0 0
NA NA NA NA NA NA
0 0 0 0 0 1
00 00 00 00 00
1000 Overall 0 NA 1 1000
Marijuana
Past 24 hrs Past 2 days Past Month Past Year Over a Year Never
21 10 15 6
19 28
217 149 152
46 167 267
91 37 55 44 65
134
257 105 114
74 131 321
Overall 99 1000 426 1000
Methadone
Past 24 hrs Past 2 days Past Month Past Year Over a Year Never
1 0 1 0 0 1
966 00 29 00 00 04
6 0 0 0 0 4
298 00 00 00 00
702 Overall 3 1000 10 1000
Opiates
Past 24 hrs Past 2 days Past Month Past Year Over a Year Never
4 2 6 4 2
13
130 37
187 19
116 511
11 7 8
13 17 51
111 45
187 24
157 476
Overall 31 1000 107 1000
Pain Killers
Past 24 hrs Past 2 days Past Month Past Year Over a Year Never
13 5 6 4 2 4
275 129 131 65
309 92
24 11 8 7 7 9
599 129
46 29
138 58
Overall 34 1000 66 1000
PCP
Past 24 hrs Past 2 days Past Month Past Year Over a Year Never
1 0 0 0 0 0
1000 00 00 00 00 00
0 0 1 0 0 1
00 00
229 00 00
771 Overall 1 1000 2 1000
61
2007 National Roadside Survey of Alcohol and Drug Use by Drivers Drug Results
Observed Safety Measures of Daytime and Nighttime Drivers (Oral Fluid) In the 2007 NRS interviewers observed and recorded seat belt use of drivers and helmet use of motorcycle riders Additionally participating drivers were asked if they were acting as designated drivers (ldquoTonightToday are you or have you been a designated driverrdquo) The results of analyses of these variables by alcohol level are discussed in some detail in a previous report summarizing the alcohol results (Lacey et al 2009b) One issue that arose in that analysis was that many respondents appeared to not understand the lsquodesignated driverrsquo question Thus in this report we are not reporting on the designated driver results Additionally since the nighttime results are quite similar whether summarized by oral fluid results or blood results we are presenting these tables on observed seat belt and helmet use only in the oral fluid results section of the body of the report The nighttime blood results are presented in Appendix A
Information on seat belt and helmet use is presented by overall prevalence (daytime and nighttime) drug class (daytime and nighttime) and drug category (daytime and nighttime) in Tables 47-52 respectively
In Table 47 there was no statistically significant association between overall daytime drug prevalence among drivers and seat belt use in the daytime sample
Table 47 Daytime Seat Belt Observation By Drug Prevalence (Oral Fluid)
N (Unweighted)
Drug Negative
(Weighted)
Drug Positive
(Weighted) Driver Seat Belt Observation
Yes 1750 890 110 No 92 862 138
When examining nighttime drug use as measured in oral fluid by observed seat belt use (Table 48) drug prevalence among nighttime drivers was significantly higher among those who did not wear a seat belt than among those who did (p lt 01)
Table 48 Nighttime Seat Belt Observation by Drug Prevalence (Oral Fluid)
N (Unweighted)
Drug Negative
(Weighted)
Drug Positive
(Weighted) Driver Seat Belt Observation
Yes 5654 859 141 No 192 754 246
62
N
(Un
wei
gh
ted
)
An
tid
epre
ssa
nts
(W
eig
hte
d)
Mar
ijuan
a
(Wei
gh
ted
)
Nar
coti
c-A
nal
ge
sic
(W
eig
hte
d)
Sed
ativ
es
(W
eig
hte
d)
Sti
mu
lan
ts
(Wei
gh
ted
)
O
ther
(W
eig
hte
d)
gt1
Dru
g C
lass
(Wei
gh
ted
)
Neg
ativ
e
(Wei
gh
ted
)
Driver Seat Belt Observation Yes 1750 05 37 17 17 17 02 15 890 No 92 08 98 13 04 00 00 15 862
N
(Un
wei
gh
ted
)
An
tid
epre
ssa
nts
(W
eig
hte
d)
Mar
ijuan
a
(Wei
gh
ted
)
Nar
coti
c-A
nal
ge
sic
(W
eig
hte
d)
Sed
ativ
es
(W
eig
hte
d)
Sti
mu
lan
ts
(Wei
gh
ted
)
O
ther
(W
eig
hte
d)
gt1
Dru
g C
lass
(W
eig
hte
d)
Neg
ativ
e
(Wei
gh
ted
) Driver Seat Belt Observation
Yes 5654 No 192
01 23
61 63
16 21
07 00
31 79
03 06
22 53
859 754
2007 National Roadside Survey of Alcohol and Drug Use by Drivers Drug Results
Table 49 shows the daytime distribution of drug classes in oral fluid by observed seat belt use Most of the observed differences in this distribution were not statistically significant The exception was marijuana which was significantly more prevalent among daytime drivers who did not wear a seat belt than among drivers who did (p lt 01)
Table 49 Daytime Seat Belt Observation by Drug Class (Percentages Calculated by Row) (Oral Fluid)
Table 50 shows the nighttime distribution of drug classes by seat belt use Stimulants were significantly more prevalent among those drivers who did not wear a safety belt than those who did (p lt 01)
Table 50 Nighttime Seat Belt Observation by Drug Class (Percentages Calculated by Row) (Oral Fluid)
63
2007 National Roadside Survey of Alcohol and Drug Use by Drivers Drug Results
Table 51 shows the daytime distribution of drug categories by seat belt use Differences in daytime oral fluid drug category results involving seat belt use by the driver were not statistically significant
Table 51 Daytime Seat Belt Observation by Drug Category (Percentages Calculated by Row) (Oral Fluid)
N (Unwtd)
Illegal
(Weighted)
Medications (Weighted)
Illegal amp Medications (Weighted)
Negative
(Weighted) Driver Seat Belt Observation
Yes 1750 56 50 04 890 No 92 103 27 07 862
Table 52 shows the nighttime distribution of drug categories by seat belt use The prevalence of illegal (ldquoIllegalrdquo and ldquoIllegal and Medicationrdquo combined) drugs was higher among those who did not use a seat belt (p lt 01)
Table 52 Nighttime Belt Observation by Drug Category (Percentages Calculated by Row) (Oral Fluid)
N (Unwtd)
Illegal
(Weighted)
Medications (Weighted)
Illegal amp Medications (Weighted)
Negative (Weighted)
Driver Seat Belt Observation Yes 5353 102 30 09 859 No 192 181 50 15 754
The number of motorcyclists sampled in the daytime was very small thus limiting our ability to perform meaningful statistical comparisons However we display daytime and nighttime helmet use (for the operator) by overall drug use prevalence class and category in Tables 53-58 Note there were an extremely low number of motorcycle riders with passengers Thus these are excluded from our tables and our analyses
Table 53 Daytime Helmet Use for Motorcycle Riders (Operators) by Drug Positive (Oral Fluid)
N (Unweighted)
Drug Positive (Weighted)
Motorcycle Riders (Operators) 30 248 Helmet 23 238 No Helmet Use 6 299 Unknown 1 00
Small sample size precluded meaningful statistical comparisons
64
N
(Un
wei
gh
ted
)
An
tid
epre
ssa
nts
(Wei
gh
ted
)
Mar
ijuan
a (W
eig
hte
d)
Nar
coti
c-A
nal
ge
sic
(Wei
gh
ted
)
Sed
ativ
es
(Wei
gh
ted
)
Sti
mu
lan
ts
(Wei
gh
ted
)
Oth
er(W
eig
hte
d)
gt1
Dru
g C
lass
(
Wei
gh
ted
)
Neg
ativ
e (W
eig
hte
d)
Motorcycle Riders (Operators) 30 00 132 00 13 28 00 76 752
Helmet 23 00 169 00 17 36 00 17 762
No Helmet Use 6 00 00 00 00 00 00 299 701
Unknown 1 00 00 00 00 00 00 00 1000
Small sample size precluded meaningful statistical comparisons
N
(Un
wei
gh
ted
)
An
tid
epre
ssa
nts
(Wei
gh
ted
)
Mar
ijuan
a (W
eig
hte
d)
Nar
coti
c-A
nal
ge
sic
(Wei
gh
ted
)
Sed
ativ
es
(Wei
gh
ted
)
Sti
mu
lan
ts
(Wei
gh
ted
)
Oth
er(W
eig
hte
d)
gt1
Dru
g C
lass
(
Wei
gh
ted
)
Neg
ativ
e (W
eig
hte
d)
Motorcycle Riders (Operators) 73 63 45 00 00 83 05 128 676
Helmet 57 10 29 00 00 13 07 87 853
No Helmet Use 14 161 75 00 00 212 00 205 347
Unknown 2 00 00 00 00 00 00 00 1000
2007 National Roadside Survey of Alcohol and Drug Use by Drivers Drug Results
Table 54 shows a statistically significant difference in nighttime drug prevalence as measured in oral fluid among riders with and without helmets Drug prevalence was higher for riders who were not using helmets (p lt 01)
Table 54 Nighttime Helmet Use for Motorcycle Riders (Operators) by Drug Positive (Oral Fluid)
N (Unweighted)
Drug Positive (Weighted)
Motorcycle Riders (Operators) 73 324 Helmet 57 147 No Helmet Use 14 653 Unknown 2 00
Examining daytime and nighttime motorcycle riders by drug class as measured in oral fluid some classes had no positives perhaps due to the small sample size (Tables 55 and 56) thus rendering statistical tests inappropriate
Table 55 Daytime Helmet Use for Motorcycle Riders (Operators) by Drug Class (Oral Fluid)
Table 56 Nighttime Helmet Use for Motorcycle Riders (Operators) by Drug Class (Percentages Calculated by Row) (Oral Fluid)
Small sample size precluded meaningful statistical comparisons
65
2007 National Roadside Survey of Alcohol and Drug Use by Drivers Drug Results
The small sample size encountered when examining daytime motorcycle riders by drug category as measured in oral fluid (Table 57) rendered statistical tests inappropriate
Table 57 Daytime Helmet Use for Motorcycle Riders (Operators) by Drug Category (Oral Fluid)
N (Unwtd)
Illegal
(Weighted)
Medications (Weighted)
Illegal amp Medications (Weighted)
Negative
(Weighted)
Motorcycle Riders (Operators) 30 159 13 76 752 Helmet 23 204 17 17 762 No Helmet Use 6 00 00 299 701 Unknown 1 00 00 00 1000
Small sample size precluded meaningful statistical comparisons
Table 58 shows that overall drug prevalence was higher for riders who were not using a helmet (p lt 01) However no statistically significant difference was observed between riders who consumed ldquoIllegalrdquo and ldquoIllegal and Medicationsrdquo and those who consumed ldquoMedicationsrdquo alone
Table 58 Nighttime Helmet Use for Motorcycle Riders (Operators) by Drug Category (Percentages Calculated by Row) (Oral Fluid)
N (Unwtd)
Illegal
(Weighted)
Medications (Weighted)
Illegal amp Medications (Weighted)
Negative
(Weighted)
Motorcycle Riders (Operators) 73 200 68 56 676 Helmet 57 42 18 87 853 No Helmet Use 14 492 161 00 347 Unknown 2 00 00 00 00
Reported Contact with the Criminal Justice System (Oral Fluid) Of the 1790 daytime NRS participants who provided an oral fluid sample and responded to the question ldquoDuring the past 12 months were you arrested and booked for driving under the influence of alcohol or drugsrdquo about 3 percent indicated ldquoYesrdquo (n = 47 unweighted) Of these almost 29 percent were drug positive (Table 59) The difference between daytime drivers who indicated ldquoYesrdquo to this question and were drug positive is statistically different from those who indicated ldquoNordquo (p lt 01)
Table 59 Arrests and Drug Positives Daytime (Oral Fluid) ldquoDuring the past 12 months were you arrested and booked for driving under the influence of alcohol or drugsrdquo
N (Unweighted)
Drug Positive (Weighted)
Yes 47 289 No 1743 108 Total 1790 113
66
N
(Un
wei
gh
ted
)
An
tid
epre
ssa
nts
(W
eig
hte
d)
Mar
ijuan
a
(Wei
gh
ted
)
Nar
coti
c-A
nal
ge
sic
(W
eig
hte
d)
Sed
ativ
es
(W
eig
hte
d)
Sti
mu
lan
ts
(Wei
gh
ted
)
Oth
er
(Wei
gh
ted
)
gt1
Dru
g C
lass
(W
eig
hte
d)
Neg
ativ
e
(Wei
gh
ted
)
Yes 47 00 207 20 26 24 00 11 711 No 1743 16 36 17 16 16 02 16 892
Total 1790 16 40 17 16 16 02 16 887
2007 National Roadside Survey of Alcohol and Drug Use by Drivers Drug Results
Among the nighttime NRS participants who provided an oral fluid sample and responded to the question ldquoDuring the past 12 months were you arrested and booked for driving under the influence of alcohol or drugsrdquo (Table 60) approximately 4 percent indicated ldquoYesrdquo (n = 234 unweighted) Of these 29 percent were drug positive compared to the 14 percent who were drug positive and indicated ldquoNordquo (p lt 01)
Additionally since the nighttime results are quite similar whether summarized by oral fluid results or blood results we are presenting these tables on contact with the criminal justice system based on nighttime blood results in Appendix A
Table 60 Arrests and Drug Positives Nighttime (Oral Fluid) ldquoDuring the past 12 months were you arrested and booked for driving under the influence of alcohol or drugsrdquo
N (Unweighted)
Drug Positive (Weighted)
Yes 234 291 No 5458 140 Total 5692 145
Of the daytime drivers who were drug positive and responded to the question ldquoDuring the past 12 months were you arrested and booked for driving under the influence of alcohol or drugsrdquo (Table 61) the majority tested positive for marijuana (207)
Table 61 Arrests and Drug Class Daytime (Oral Fluid) ldquoDuring the past 12 months were you arrested and booked for driving under the influence of alcohol or drugsrdquo
Similar to results in the daytime sample the nighttime drivers who were drug positive and responded to the question ldquoDuring the past 12 months were you arrested and booked for driving under the influence of alcohol or drugsrdquo (Table 62) the majority tested positive for marijuana (118)
67
2007 National Roadside Survey of Alcohol and Drug Use by Drivers Drug Results
Table 62 Arrests and Drug Class Nighttime (Oral Fluid) ldquoDuring the past 12 months were you arrested and booked for driving under the influence of alcohol or drugsrdquo
N (Un
wei
gh
ted
)
An
tid
epre
ssa
nts
(Wei
gh
ted
)
Mar
ijuan
a(W
eig
hte
d)
Nar
coti
c-A
nal
ge
sic
(Wei
gh
ted
)
Sed
ativ
es
(Wei
gh
ted
)
Sti
mu
lan
ts
(Wei
gh
ted
)
Oth
er(W
eig
hte
d)
gt1
Dru
g C
lass
(
Wei
gh
ted
)
Neg
ativ
e (W
eig
hte
d)
Yes 234 00 118 02 02 108 00 60 709 No 5458 02 58 17 07 30 03 23 860 Total 5692 02 60 17 07 33 03 24 855
When examining the data by drug category among daytime participants who responded to the question ldquoDuring the past 12 months were you arrested and booked for driving under the influence of alcohol or drugsrdquo (Table 63) more participants tested positive for ldquoIllegalrdquo drugs than any other drug category (233)
Table 63 Arrests and Drug Categories Daytime (Oral Fluid) ldquoDuring the past 12 months were you arrested and booked for driving under the influence of alcohol or drugsrdquo
N (Unwtd)
Illegal
(Weighted)
Medications (Weighted)
Illegal amp Medications (Weighted)
Negative
(Weighted)
Yes 47 233 53 02 711 No 1743 54 49 05 892 Total 1790 59 49 05 887
Among nighttime participants who responded to the question ldquoDuring the past 12 months were you arrested and booked for driving under the influence of alcohol or drugsrdquo (Table 64) more tested positive for ldquoIllegalrdquo drugs than any other drug category (26) Although this was slightly higher than the daytime population the difference was not statistically different
Table 64 Arrests and Drug Categories Nighttime (Oral Fluid) ldquoDuring the past 12 months were you arrested and booked for driving under the influence of alcohol or drugrdquo
N (Unwtd)
Illegal
(Weighted)
Medications (Weighted)
Illegal amp Medications (Weighted)
Negative
(Weighted)
Yes 234 260 13 17 709 No 5458 99 31 09 860 Total 5692 105 31 09 855
68
2007 National Roadside Survey of Alcohol and Drug Use by Drivers Drug Results
Reported Contact with the Health System (Oral Fluid) As indicated in previous reports on the 2007 NRS questions relating to the criminal sanctions for drinking and drug use while driving were added to the survey items as well as questions related to treatment for drug and alcohol use These questions were added to the survey to investigate potential intervention opportunities
As shown in Table 65 less than 1 percent of daytime drivers responded ldquoYesrdquo to the question ldquoDuring the past 12 months did you ever stay at least overnight in an inpatient or residential drug or alcohol treatment programrdquo Of these almost 45 percent were drug positive
Table 65 Past Treatment Program and Drug Positive Daytime (Oral Fluid) ldquoDuring the past 12 months did you ever stay at least overnight in an inpatient or residential drug or alcohol
treatment programrdquo
N (Unweighted)
Drug Positive (Weighted)
Yes 7 447 No 1738 112 Total 1745 112
Among nighttime drivers less than 1 percent responded ldquoYesrdquo to the question ldquoDuring the past 12 months did you ever stay at least overnight in an inpatient or residential drug or alcohol treatment programrdquo (Table 66) Of these 37 percent were drug positive
The response patterns to these questions by nighttime drivers providing blood samples are quite similar to those reported here for nighttime oral fluid and are presented separately in Appendix A
Table 66 Past Treatment Program and Drug Positive Nighttime (Oral Fluid) ldquoDuring the past 12 months did you ever stay at least overnight in an inpatient or residential drug or alcohol
treatment programrdquo
N (Unweighted)
Drug Positive (Weighted)
Yes 51 370 No 5449 145 Total 5500 146
(p lt 01)
Of daytime drivers who responded to the question ldquoHave you ever been admitted to an outpatient drug or alcohol treatment program NOT including meetings like AA or NArdquo17
approximately 25 percent responded ldquoYesrdquo (Table 67) Of these 384 percent were drug positive
17 AA is Alcoholics Anonymous and NA is Narcotics Anonymous
69
2007 National Roadside Survey of Alcohol and Drug Use by Drivers Drug Results
Table 67 Outpatient and Drug Positive Daytime (Oral Fluid) ldquoHave you ever been admitted to an outpatient drug or alcohol treatment program NOT including meetings like AA or NArdquo
N (Unweighted)
Drug Positive (Weighted)
Yes 44 384 No 1754 107 Total 1798 112 (p lt 01)
Of nighttime drivers who responded to the question ldquoHave you ever been admitted to an outpatient drug or alcohol treatment program NOT including meetings like AA or NArdquo approximately 28 percent responded ldquoYesrdquo (Table 68) Of these 36 percent were drug positive
Table 68 Outpatient and Drug Positive Nighttime (Oral Fluid) ldquoHave you ever been admitted to an outpatient drug or alcohol treatment program NOT including meetings like AA or NArdquo
N (Unweighted)
Drug Positive (Weighted)
Yes 159 361 No 5541 141 Total 5700 145
(p lt 01)
Of daytime drivers who responded to the question ldquoDuring the past 12 months have you received treatment for your drug or alcohol use in a self-help group such as Alcoholics Anonymous or Narcotics Anonymousrdquo approximately 1 percent responded ldquoYesrdquo (Table 69) Of these 43 percent were drug positive Of the nighttime drivers who were asked the same question approximately 2 percent responded ldquoYesrdquo (Table 70) and approximately 18 percent of those were drug positive
Table 69 AA or NA and Drug Positives Daytime (Oral Fluid) ldquoDuring the past 12 months have you received treatment for your drug or alcohol use in a self-help group such as Alcoholics
Anonymous or Narcotics Anonymousrdquo
N (Unweighted)
Drug Positive (Weighted)
Yes 17 431 No 1778 109 Total 1795 112
70
N (Un
wei
gh
ted
)
An
tid
epre
ssa
nts
(Wei
gh
ted
)
Mar
ijuan
a(W
eig
hte
d)
Nar
coti
c-A
nal
ge
sic
(Wei
gh
ted
)
Sed
ativ
es
(Wei
gh
ted
)
Sti
mu
lan
ts
(Wei
gh
ted
)
Oth
er(W
eig
hte
d)
gt1
Dru
g C
lass
(
Wei
gh
ted
)
Neg
ativ
e (W
eig
hte
d)
Yes 7 00 203 00 00 00 00245 553 No 1738 05 39 17 17 16 02 16 888 Total 1745 05 39 17 17 16 02 16 888
2007 National Roadside Survey of Alcohol and Drug Use by Drivers Drug Results
Table 70 AA or NA and Drug Positives Nighttime (Oral Fluid) ldquoDuring the past 12 months have you received treatment for your drug or alcohol use in a self-help group such as Alcoholics
Anonymous of Narcotics Anonymousrdquo
N (Unweighted)
Drug Positive (Weighted)
Yes 107 183 No 5587 145 Total 5694 146
Of daytime drivers who responded to the question ldquoDuring the past 12 months did you ever stay at least overnight in an impatient or residential drug or alcohol treatment program for example detox rehab a therapeutic community or a hospitalrdquo less than 5 percent responded ldquoYesrdquo (Table 71) Of these approximately 20 percent tested positive for marijuana and nearly 25 percent tested positive for more than one drug
Table 71 Inpatient and Drug Class Daytime (Oral Fluid) ldquoDuring the past 12 months did you ever stay at least overnight in an impatient or residential drug or alcohol treatment program for
example detox rehab a therapeutic community or a hospitalrdquo
Of the nighttime drivers who were asked the same question approximately 1 percent responded ldquoYesrdquo (Table 72) Of those approximately 14 percent tested positive for marijuana and approximately 12 percent tested positive for more than one drug Although a higher percentage responded ldquoYesrdquo to the marijuana item during the day than at night this difference was not statistically significant
71
N
(Un
wei
gh
ted
)
An
tid
epre
ssa
nts
(W
eig
hte
d)
Mar
ijuan
a
(Wei
gh
ted
)
Nar
coti
c-A
nal
ge
sic
(W
eig
hte
d)
Sed
ativ
es
(W
eig
hte
d)
Sti
mu
lan
ts
(Wei
gh
ted
)
Oth
er
(Wei
gh
ted
)
gt1
Dru
g C
lass
(W
eig
hte
d)
Neg
ativ
e
(Wei
gh
ted
)
Yes 51 00 144 03 14 94 00115 630 No 5449 02 61 16 07 32 03 24 855 Total 5500 02 61 16 07 32 03 24 854
2007 National Roadside Survey of Alcohol and Drug Use by Drivers Drug Results
Table 72 Inpatient and Drug Class Nighttime (Oral Fluid) ldquoDuring the past 12 months did you ever stay at least overnight in an impatient or residential drug or alcohol treatment program for
example detox rehab a therapeutic community or a hospitalrdquo
Of daytime drivers who responded to the question ldquoDuring the past 12 months were you arrested and booked for driving under the influence of alcohol or drugsrdquo less than 5 percent responded ldquoYesrdquo (Table 73)
Table 73 Inpatients and Drug Category Daytime (Oral Fluid) ldquoDuring the past 12 months were you arrested and booked for driving under the influence of alcohol or drugsrdquo
N (Unwtd)
Illegal
(Weighted)
Medications (Weighted)
Illegal amp Medications (Weighted)
Negative
(Weighted)
Yes 7 447 00 00 553 No 1738 57 50 05 888 Total 1745 58 50 05 888
Of these nearly 45 percent tested positive for ldquoIllegalrdquo drugs Of the nighttime drivers who were asked the same question approximately 1 percent responded ldquoYesrdquo (Table 74) and approximately 23 percent of those tested positive for ldquoIllegalrdquo drugs The difference in ldquoIllegalrdquo drug use from daytime to nighttime was not significant
Table 74 Inpatients and Drug Category Nighttime (Oral Fluid) ldquoDuring the past 12 months were you arrested and booked for driving under the influence of alcohol or drugsrdquo
N (Unwtd)
Illegal
(Weighted)
Medications (Weighted)
Illegal amp Medications (Weighted)
Negative
(Weighted)
Yes 51 234 23 113 630 No 5449 106 30 09 855 Total 5500 106 30 10 854
Of daytime drivers who responded to the question ldquoHave you ever been admitted to an outpatient drug or alcohol treatment program NOT including meetings like AA or NArdquo
72
N
(Un
wei
gh
ted
)
An
tid
epre
ssa
nts
(Wei
gh
ted
)
Mar
ijuan
a (W
eig
hte
d)
Nar
coti
c-A
nal
ge
sic
(Wei
gh
ted
)
Sed
ativ
es
(Wei
gh
ted
)
Sti
mu
lan
ts
(Wei
gh
ted
)
Oth
er(W
eig
hte
d)
gt1
Dru
g C
lass
(
Wei
gh
ted
)
Neg
ativ
e (W
eig
hte
d)
Yes 44 34 154 147 00 37 00 11 616 No 1754 04 38 14 17 16 02 16 893 Total 1798 04 40 17 16 16 02 16 888
N
(Un
wei
gh
ted
)
An
tid
epre
ssa
nts
(Wei
gh
ted
)
Mar
ijuan
a (W
eig
hte
d)
Nar
coti
c-A
nal
ge
sic
(Wei
gh
ted
)
Sed
ativ
es
(Wei
gh
ted
)
Sti
mu
lan
ts
(Wei
gh
ted
)
Oth
er(W
eig
hte
d)
gt1
Dru
g C
lass
(
Wei
gh
ted
)
Neg
ativ
e (W
eig
hte
d)
Yes 159 16 101 65 17 138 00 23 639 No 5541 02 60 16 06 30 03 24 859 Total 5700 02 60 17 07 32 03 24 855
2007 National Roadside Survey of Alcohol and Drug Use by Drivers Drug Results
approximately 25 percent responded ldquoYesrdquo (Table 75) Of these the most prevalent drug was marijuana (154) Additionally nearly 15 percent tested positive for narcotic-analgesics
Table 75 Outpatient and Drug Class Daytime (Oral Fluid) ldquoHave you ever been admitted to an outpatient drug or alcohol treatment program NOT including meetings like AA or NArdquo
Of the nighttime drivers who were asked the same question nearly 3 percent responded ldquoYesrdquo (Table 76) and nearly 14 percent tested positive for stimulants which was more than any other drug category Approximately 10 percent of those tested positive for marijuana which was more than the daytime percentage however this difference was not statistically significant
Table 76 Outpatient and Drug Class Nighttime (Oral Fluid) ldquoHave you ever been admitted to an outpatient drug or alcohol treatment program NOT including meetings like AA or NArdquo
Of daytime drivers who responded to the question ldquoHave you ever been admitted to an outpatient drug or alcohol treatment program NOT including meetings like AA or NArdquo approximately 25 percent responded ldquoYesrdquo (Table 77) Of these approximately 38 percent were drug positive with nearly 20 percent testing positive for ldquoIllegalrdquo drugs
73
N
(Un
wei
gh
ted
)
An
tid
epre
ssa
nts
(W
eig
hte
d)
Mar
ijuan
a
(Wei
gh
ted
)
Nar
coti
c-A
nal
ge
sic
(W
eig
hte
d)
Sed
ativ
es
(W
eig
hte
d)
Sti
mu
lan
ts
(Wei
gh
ted
)
Oth
er
(Wei
gh
ted
)
gt1
Dru
g C
lass
(W
eig
hte
d)
Neg
ativ
e
(Wei
gh
ted
)
Yes 17 21 177 233 00 00 00 00 569 No 1778 04 39 15 17 16 02 16 891 Total 1795 04 40 17 16 16 02 16 888
2007 National Roadside Survey of Alcohol and Drug Use by Drivers Drug Results
Table 77 Outpatient and Categories Daytime (Oral Fluid) ldquoHave you ever been admitted to an outpatient drug or alcohol treatment program NOT including meetings like AA or NArdquo
N (Unwtd)
Illegal
(Weighted)
Medications (Weighted)
Illegal amp Medications (Weighted)
Negative
(Weighted)
Yes 44 199 181 04 616 No 1754 56 46 05 893 Total 1798 59 49 05 888
Of the nighttime drivers who were asked the same question nearly 3 percent responded ldquoYesrdquo (Table 78) and approximately 36 percent of those were drug positive with nearly 25 percent testing positive for ldquoIllegalrdquo drugs Although that percentage was higher for nighttime drivers than for daytime drivers there was no statistical difference in the number of people testing positive for ldquoIllegalrdquo drugs between daytime and nighttime
Table 78 Outpatient and Categories Nighttime (Oral Fluid) ldquoHave you ever been admitted to an outpatient drug or alcohol treatment program NOT including meetings like AA or NArdquo
N (Unwtd)
Illegal
(Weighted)
Medications (Weighted)
Illegal amp Medications (Weighted)
Negative
(Weighted)
Yes 159 249 100 12 639 No 5541 103 29 09 859 Total 5700 105 31 09 855
Of daytime drivers who responded to the question ldquoDuring the past 12 months have you received treatment for your drug or alcohol use in a self-help group such as AA or NArdquo approximately 1 percent responded ldquoYesrdquo (Table 79) Of these the most prevalent drug class was narcotic-analgesic (233)
Table 79 AA NA and Classes Daytime (Oral Fluid) ldquoDuring the past 12 months have you received treatment for your drug or alcohol use in a self-help group such as AA or NArdquo
74
N
(Un
wei
gh
ted
)
An
tid
epre
ssa
nts
(W
eig
hte
d)
Mar
ijuan
a
(Wei
gh
ted
)
Nar
coti
c-A
nal
ge
sic
(W
eig
hte
d)
Sed
ativ
es
(W
eig
hte
d)
Sti
mu
lan
ts
(Wei
gh
ted
)
Oth
er
(Wei
gh
ted
)
gt1
Dru
g C
lass
(W
eig
hte
d)
Neg
ativ
e
(Wei
gh
ted
)
Yes 107 04 53 04 05 95 00 22 817 No 5587 02 61 17 07 31 03 24 855 Total 5694 02 61 17 07 32 03 24 854
2007 National Roadside Survey of Alcohol and Drug Use by Drivers Drug Results
Of the nighttime drivers who were asked the same question nearly 2 percent responded ldquoYesrdquo (Table 80) and nearly 10 percent tested positive for stimulants which was more than any other drug category Approximately 5 percent of those tested positive for marijuana which was less than the daytime percentage of 18 percent however this difference was not statistically significant
Table 80 AA NA and Classes Nighttime (Oral Fluid) ldquoDuring the past 12 months have you received treatment for your drug or alcohol use in a self-help group such as AA or NArdquo
Of daytime drivers who responded to the question ldquoDuring the past 12 months have you received treatment for your drug or alcohol use in a self-help group such as AA or NArdquo approximately 1 percent responded ldquoYesrdquo (Table 81) Of these slightly more than 25 percent tested positive for ldquoMedicationsrdquo and nearly 18 percent tested positive for ldquoIllegalrdquo drugs
Table 81 NA AA and Drug Categories Daytime (Oral Fluid) ldquoDuring the past 12 months have you received treatment for your drug or alcohol use in a self-help group such as AA or NArdquo
N (Unwtd)
Illegal
(Weighted)
Medications (Weighted)
Illegal amp Medications (Weighted)
Negative
(Weighted)
Yes 17 177 254 00 569 No 1778 58 47 05 891 Total 1795 59 49 05 888
Of the nighttime drivers who were asked the same question nearly 2 percent responded ldquoYesrdquo (Table 82) and nearly 15 percent tested positive for ldquoIllegalrdquo drugs Although a greater percentage tested positive for ldquoIllegalrdquo drugs during the day than at night this difference was not statistically significant
75
2007 National Roadside Survey of Alcohol and Drug Use by Drivers Drug Results
Table 82 NA AA and Drug Categories Nighttime (Oral Fluid) ldquoDuring the past 12 months have you received treatment for your drug or alcohol use in a self-help group such as AA or NArdquo
N (Unwtd)
Illegal
(Weighted)
Medications (Weighted)
Illegal amp Medications (Weighted)
Negative
(Weighted)
Yes 107 149 30 04 817 No 5587 105 31 09 855 Total 5694 106 31 09 854
Blood Results (Nighttime Samples) Driver Drug Use Prevalence Based on Blood Results This section of the report presents the overall results of blood analyses for all of the drugs indicated in the introductory section of this report Blood samples were collected in addition to oral fluid samples because typically blood analyses are considered the ldquogold standard rdquoand is the more established technique for gathering information on drugs and their metabolites as oral fluid analyses are a more recently developed technique As expected the results between the oral fluid and blood results are very similar These blood results are presented to provide more complete results from our data analyses for those who are interested in seeing the results from both approaches
If a driver tested positive for one or more of the drugs for which we tested in blood she was categorized as drug positive Note that blood samples were only collected in the nighttime and that more drivers provided oral fluid samples than blood samples
About 14 percent of the 3276 nighttime drivers who provided blood samples were drug-positive (Table 83)
Table 83 Drug Prevalence by Time of Day (Blood)
Time of Day N
(Unweighted) Drug Positive
(Weighted) Daytime NA NA Nighttime 3276 138
NA = ldquoNot Applicablerdquo
Comparison of drug prevalence by session (Table 84) revealed that late-night (Sessions 3 and 5) drivers were significantly more likely to be drug-positive (179 and 168 respectively) as opposed to the earlier nighttime (Sessions 2 and 4) drivers (136 and 111 respectively) (p lt 01)
76
2007 National Roadside Survey of Alcohol and Drug Use by Drivers Drug Results
Table 84 Drug Prevalence by Session (Blood)
N Drug Positive Session (Unweighted) (Weighted)
2 Friday 10 pm ndash Midnight 857 136
3 Friday 1 am ndash 3 am 743 179
4 Saturday 10 pm ndash Midnight 986 111
5 Saturday 1 am ndash 3 am 690 168
Although the Northeast region had the greatest percentage of drug-positive findings in the nighttime driving sample (Table 85) such differences were not statistically significant Thus no clear pattern of drug prevalence by region emerged from the blood sample results
Table 85 Drug Prevalence by Region (Blood)
N Drug Positive Region (Unweighted) (Weighted)
Midwest 971 140 Northeast 584 145 South 862 134 West 859 135 Overall 3276 138
Comparison of blood samples by gender (Table 86) revealed that male drivers were more likely to be drug-positive (145) than female drivers (130) however such differences were not statistically significant
Table 86 Drug Prevalence by Gender (Blood)
Gender N
(Unweighted) Drug Positive
(Weighted) Males 1992 145 Females 1278 130 Overall 3270 139
When examining drug prevalence by age the prevalence of drug-positives was higher among young drivers (Table 87) Drivers aged 16-20 years showed a significantly higher prevalence than drivers aged 21-34 years and drivers aged 35-44 years (p lt 01) Drivers aged 35-44 45-64 and 65+ were significantly less likely to be drug positive than drivers in the combined age range of 16 to 34 years old (p lt 01)
77
2007 National Roadside Survey of Alcohol and Drug Use by Drivers Drug Results
Table 87 Drug Prevalence by Age (Blood)
N Drug Positive Age (Unweighted) (Weighted)
16-20 459 205 21-34 1372 152 35-44 625 107 45-64 697 112
65+ 91 60 Overall 3244 140
Comparisons between gender within age group (Table 88) showed that drug prevalence among male drivers ages 16-20 was significantly higher than female drivers ages 16-20 (p lt 01) Further drug prevalence among male drivers aged 21-34 was also significantly higher than the same-aged female counterparts (p lt 05)Among drivers aged 45-64 however drug prevalence was higher in females than in males (p lt 01)
Table 88 Drug Prevalence by Age and Gender (Blood)
N Drug Positive Gender Age (Unweighted) (Weighted)
Males
16-20 21-34 35-44 45-64
65+
301 825 368 413
61
228 169 112
83 60
Overall Males 1968 146
Females
16-20 21-34 35-44 45-64
65+
158 547 254 283
30
165 122 105 167
58 Overall Females 1272 130
Comparing drug prevalence between raceethnicity (Table 89) Asian drivers were significantly less likely to be drug positive (13) than drivers who identified themselves as African American Hispanic White or Other (p lt 01)
Table 89 Drug Prevalence by RaceEthnicity (Blood)
N Drug Positive RaceEthnicity (Unweighted) (Weighted)
African American 569 168 Asian 87 13 Hispanic 585 100 White 1836 155 Other 165 197 Overall 3242 140
RaceEthnic groups other than ldquoHispanicrdquo are always ldquonon-Hispanicrdquo
78
2007 National Roadside Survey of Alcohol and Drug Use by Drivers Drug Results
Looking at drug prevalence by education level (Table 90) drivers who identified themselves as college graduates or having some college experience were significantly less likely to be drug-positive (p lt 01) than drivers with other educational attainment
Table 90 Drug Prevalence by Education Level (Blood)
N Drug Positive Education Level (Unweighted) (Weighted)
Not a High School Graduate 289 203 High School Graduate 831 165 Some College 1318 125 College Graduate 594 108 Some Graduate Work 212 135 Overall Nighttime 3245 140
When examining drug prevalence by employment status (Table 91) drivers on disability showed drug prevalence that was significantly higher than employed drivers as well as homemakers students unemployed drivers and drivers who reported that they were retired (p lt 01) No statistical difference in drug prevalence was found between employed and unemployed drivers (p value = 06) ldquoRetiredrdquo drivers had significantly lower drug prevalence than employed drivers (p lt 05)
Table 91 Drug Prevalence by Employment Status (Blood)
N Drug Positive Gender (Unweighted) (Weighted)
EmployedSelf Employed 2592 136 Homemaker 67 120 Student 274 153 Unemployed 121 204 Retired 124 60 On Disability 47 414 Other 20 156 Overall 3245 140
79
2007 National Roadside Survey of Alcohol and Drug Use by Drivers Drug Results
Comparisons across vehicle type (Table 92) showed drug prevalence rates among drivers of passenger vehicles SUV and vanminivans were not statistically different (p value = 12) Note however that motorcyclists had the greatest percentage of drug-positive results (p lt 05) while pickup drivers had the smallest prevalence (p lt 05)
Table 92 Drug Prevalence by Vehicle Type (Blood)
N Drug Positive Vehicle Type (Unweighted) (Weighted)
Passenger Vehicle 1971 146 Pickup 401 93 SUV 586 116 Van amp Minivan 250 162 Motorcycle 48 240 Overall 3256 139
Driver Drug Use Prevalence by Drug Class Based on Blood Results In this section of the report we display driver drug use prevalence by class of drug based on blood results The classes of drugs tested for were antidepressants marijuana narcotic-analgesics sedatives stimulants and other (see Tables 94-96)
Drug Class
Two percent of the blood-sampled drivers tested positive for more than one drug class (Table 93)
Table 93 Number and Distribution of Drug Classes (Blood)
Number of N Drug Classes (Unweighted) (Weighted)
1 398 118 2+ 68 20 Negative 2810 862 Overall 3276 1000
80
2007 National Roadside Survey of Alcohol and Drug Use by Drivers Drug Results
In comparing prevalence of drug classes by region (Table 94) marijuana was the most common drug class across all of the regions (67) However drivers in the West region were less likely to test positive for marijuana than in the other regions (p lt 05)
Table 94 Drug Classes Distribution by Region (Blood)
Midwest Northeast South West All Drug Class
N=971 N=584 N=862 N=859 N=3276 Antidepressants 07 04 13 15 11 Marijuana 79 95 60 47 67 Narcotic-Analgesics 11 04 14 08 09 Sedatives 09 04 16 14 11 Stimulants 21 10 15 22 19 Other 00 00 02 05 02 More than 1 Class 13 29 13 24 20 Overall Drug Positive 140 145 134 135 138 Negative 860 855 866 865 862
ldquoMore than 1 Classrdquo ndash Drivers testing positive for more than one drug are only counted in this category In this table percentages are weighted
Comparison of drug class by gender (Table 95) revealed that male drivers were significantly more likely to test positive for marijuana than female drivers (74 males versus 56 females) (p lt 05)
Table 95 Drug Classes Distribution by Gender (Blood)
Males Females Total Drug Class
N=1992 N=1278 N=3270 Antidepressants 10 12 11 Marijuana 74 56 67 Narcotic-Analgesics 08 10 09 Sedatives 07 18 11 Stimulants 18 20 19 Other 04 00 02 More than 1 Class 24 14 20 Overall Drug Positive 145 130 139 Negative 855 870 861
In this table percentages are weighted ldquoMore than 1 Classrdquo ndash Drivers testing positive for more than one drug are only counted in this category
81
2007 National Roadside Survey of Alcohol and Drug Use by Drivers Drug Results
Comparison of drug class by age (Table 96) showed that drivers 34 or younger were more likely to test positive for marijuana than drives in other age groups (p lt 01) Among drivers aged 16shy34 drivers aged 16-20 years had the highest marijuana positives (152) The prevalence of narcotic-analgesics was higher among the 16-20 and 35-44 year age group (13 and 17) than among any other age group (p lt 01)
Table 96 Drug Classes Distribution by Age (Blood)
16-20 21-34 35-44 45-64 65+ Total Drug Class
N=459 N=1372 N=625 N=697 N=91 N=3244 Antidepressants 03 06 09 28 10 11 Marijuana 152 88 31 10 00 68 Narcotic-Analgesics 13 07 17 04 00 09 Sedatives 00 08 10 21 48 11 Stimulants 07 18 20 27 00 18 Other 02 04 02 00 00 02 More than 1 Class 27 19 18 23 01 20 Overall Drug Positive 205 152 107 112 60 140 Negative 795 848 893 888 940 860
ldquoMore than 1 Classrdquo ndash Drivers testing positive for more than one drug are only counted in this category In this table percentages are weighted
Driver Drug Use Prevalence by Drug Category Based on Blood Results In this section of the report we display drug use prevalence results from blood tests by drug category
About 9 percent of the nighttime drivers providing blood tested positive for drugs in the ldquoIllegalrdquo category (Table 97) Four percent were positive for ldquoMedicationsrdquo and 07 percent were positive for both ldquoIllegal and Medicationsrdquo
Table 97 Drug Categories Distribution (Blood)
N Drug Category (Unweighted) (Weighted)
Illegal 267 91 Medications 169 40 Illegal amp Medications 30 07 Negative 2810 862 Overall 3276 1000
ldquoMedicationsrdquo includes prescription and over-the-counter drugs
82
Table 98 Drug Categories Distribution by Region (Blood)
Region Drug Category N
(Unweighted)
(Weighted)
Midwest
Illegal Medications Illegal amp Medications Negative
81 52 8
830
102 32 06
860 Overall 971 1000
Northeast
Illegal Medications Illegal amp Medications Negative
57 26 4
497
110 27 08
855 Overall 584 1000
South
Illegal Medications Illegal amp Medications Negative
56 51 12
743
76 49 09
866 Overall 862 1000
West
Illegal Medications Illegal amp Medications Negative
73 40 6
740
82 49 05
865 Overall 859 1000
ldquoMedicationsrdquo includes prescription and over-the-counter drugs
2007 National Roadside Survey of Alcohol and Drug Use by Drivers Drug Results
The percentage of ldquoIllegalrdquo drug prevalence was slightly higher (p lt 05) in the Midwest and Northeast than in the remaining regions (Table 98)
When examining prevalence by drug category and gender (Table 99) we found that over 10 percent of male drivers had positive results for ldquoIllegalrdquo drugs as did about 7 percent of female drivers (p lt 01) The difference in percentage of positive results for ldquoMedicationsrdquo between male and female drivers was not statistically significant
83
2007 National Roadside Survey of Alcohol and Drug Use by Drivers Drug Results
Table 99 Drug Categories Distribution by Gender (Blood)
N Gender Drug Category (Unweighted) (Weighted)
Male
Illegal Medications Illegal amp Medications Negative
191 75 19
1707
104 33 08
855 Overall 1992 1000
Female
Illegal Medications Illegal amp Medications Negative
76 94 11
1097
72 54 04
870 Overall 1278 1000
ldquoMedicationsrdquo includes prescription and over-the-counter drugs
Examining drug use by age (Table 100) ldquoIllegalrdquo drug use was highest for drivers in the youngest age group (16-20 years) (p lt 01) followed by drivers aged 21-34 ldquoIllegalrdquo drug use among drivers 35 and older was significantly lower than among drivers younger than age 35 (p lt 01) ldquoMedicationrdquo usage followed the opposite trend with prevalence increasing with age Prevalence of ldquoMedicationrdquo was significantly higher for drivers aged 35 and older than for drivers younger than age 35 (p lt 01)
84
2007 National Roadside Survey of Alcohol and Drug Use by Drivers Drug Results
Table 100 Drug Categories Distribution by Age (Blood)
N Age Drug Category (Unweighted) (Weighted)
16-20
Illegal Medications Illegal amp Medications Negative
56 8 4
391
177 19 09
795 Overall 459 1000
21-34
Illegal Medications Illegal amp Medications Negative
141 48 13
1170
117 27 07
848 Overall 1372 1000
35-44
Illegal Medications Illegal amp Medications Negative
43 43 7
532
53 50 04
893 Overall 625 1000
45-64
Illegal Medications Illegal amp Medications Negative
26 61 6
604
31 73 08
888 Overall 697 1000
65+
Illegal Medications Illegal amp Medications Negative
0 9 0
82
00 60 00
940 Overall 91 1000
ldquoMedicationsrdquo includes prescription and over-the-counter drugs
Driver Drug Use Prevalence from Blood and BAC Results The following section presents the results of the blood drug analyses combined with the BAC results from breath tests
The numbers of drug-positive drivers by BAC level are shown in Tables 101 and 102 Table 101 shows BAC level with respect to the total number of drivers in each drug result category (positives negatives and overall) Table 102 shows drug prevalence with respect to the total number of drivers in each of the three BAC categories A statistically significant association was found between drug-positive and alcohol-positive drivers The percentage of drivers with BAC gdL 08+ was significantly higher among drug-positive drivers than among drug-negative drivers (p lt 01) The percentage of drivers with a BAC between zero and 08 was also significantly higher for drug-positive drivers (p lt 01)
85
2007 National Roadside Survey of Alcohol and Drug Use by Drivers Drug Results
Table 101 Drug Prevalence by BAC (Percentages Calculated by Row) (Blood)
BAC (gdL) Drug N Between
Result (Unweighted) Zero Zero and 08 08+ Positive 466 783 160 57 Negative 2810 937 52 11 Overall 3276 916 67 17
In this table percentages are weighted
Table 102 Drug Prevalence by BAC (Percentages Calculated by Column) (Blood)
BAC (gdL) Drug Between
Result Zero Zero and 08 08+ All N=2984 N=241 N=51 N=3276
Positive 118 332 453 138 Negative 882 668 547 862
In this table percentages are weighted
Examining BAC among drug-positive drivers by age (Table 103) a large percentage of alcohol-positives were found in drug-positive drivers aged 16-20 and 21-34 (p lt 01) Drivers aged 65 and older had the largest percentage of drivers at intermediate BAC (ie between zero and 08) however the sample size of this category was quite small
Table 103 BAC Among Drug-Positive Drivers by Age (Blood)
BAC (gdL) N Between Zero
Age (Unweighted) Zero and 08 08+ 16-2021-3435-4445-6465+
68 202
93 93
9
737 733 847 955 599
212 187
94 45
401
51 80 59 00 00
Overall Positive 465 786 158 57 In this table percentages are weighted
There were fewer alcohol-positive drivers among drug-positive drivers with 2+ classes of drugs than those with one class (Tables 104 and 105) however due to the small sample size this difference was statistically non-significant
86
2007 National Roadside Survey of Alcohol and Drug Use by Drivers Drug Results
Table 104 BAC Among Drug-Positive Drivers by Number of Drug Classes (Percentages Calculated by Column) (Blood)
BAC (gdL) No of Drug
Classes Zero Between
Zero and 08 08+ N=386 N=62 N=18
1 840 881 995 2+ 160 119 05
Overall 1000 1000 1000 In this table percentages are weighted
Table 105 BAC Among Drug-Positive Drivers by Number of Drug Classes (Percentages Calculated by Row) (Blood)
BAC (gdL) Number of N Between
Drug Classes (Unweighted) Zero Zero and 08 08+ 1 2+
398 68
769 867
165 131
66 02
Overall 466 783 160 57 In this table percentages are weighted
The majority of drug-positive drivers who were also alcohol-positive tested positive more often were positive for ldquoIllegalrdquo drugs (Tables 106 and 107) More than 90 percent of those drivers having a BAC between zero and 08 tested positive for ldquoIllegalrdquo drugs (either alone or in conjunction with ldquoMedicationsrdquo) This percentage was significantly higher than the approximately 65 percent of non-drinking (BAC = zero) drug-positive drivers who also had an ldquoIllegalrdquo drug in their system (alone or combined with ldquoMedicationsrdquo) (p lt 01)
Table 106 BAC Among Drug-Positive Drivers by Drug Category (Percentage by Row) (Blood)
BAC (gdL) N Between
Drug Category (Unweighted) Zero Zero and 08 08+ Illegal 267 717 204 79 Medications 169 936 49 15 Illegal amp Medications 30 768 232 00
ldquoMedicationsrdquo includes prescription and over-the-counter drugs In this table percentages are weighted
87
2007 National Roadside Survey of Alcohol and Drug Use by Drivers Drug Results
Table 107 BAC Among Drug-Positive Drivers by Drug Category (Percentage by Column) (Blood)
BAC (gdL) Between Zero
Drug Category Zero and 08 08+ N=386 N=62 N=18
Illegal 605 842 925 Medications 349 90 75 Illegal amp Medications 46 68 00
ldquoMedicationsrdquo includes prescription and over-the-counter drugs In this table percentages are weighted
High alcohol-positive drivers (ie drivers with a 08 BAC gdL or greater) who tested positive for ldquoIllegalrdquo drugs were more likely to be age 44 or younger (p lt 01) The sample size was very small for drivers aged 45 or older in particular those aged 65 or older (Note that due to the number of groupings in Table 108 and the small sample sizes caution should be exercised in interpretation of these findings)
Table 108 BAC of Drivers by Drug Category and Age (Blood)
BAC (gdL) N Between
Age Drug Category (Unweighted) Zero Zero and 08 08+
16-20
Illegal Medications Illegal amp Medications Negative
56 8 4
391
698 1000 956 978
243 00 44 19
59 00 00 03
Overall 459 929 59 13
21-34
Illegal Medications Illegal amp Medications Negative
141 48 13
1170
693 963 490 917
209 10
510 70
97 27 00 13
Overall 1372 889 87 23
35-44
Illegal Medications Illegal amp Medications Negative
43 43 7
532
781 906
1000 956
126 66 00 34
93 28 00 10
Overall 625 944 41 15
45-64
Illegal Medications Illegal amp Medications Negative
26 61 6
604
918 966
1000 925
82 34 00 60
00 00 00 15
Overall 697 928 58 13
65+
Illegal Medications Illegal amp Medications Negative
0 9 0
82
NA 599
NA 953
NA 401
NA 47
NA 00
NA 00
Overall 91 932 68 00 ldquoMedicationsrdquo includes prescription and over-the-counter drugs NA = ldquoNot Applicablerdquo In this table percentages are weighted
88
Gender Drug Category N
(Unweighted)
BAC (gdL)
Zero Between Zero
and 08 08+ Illegal 191 721 174 106Medications 75 905 84 11
Males Illegal amp Medications 19 708 292 00 Negative 1707 929 58 13Overall 1992 905 73 22 Illegal 76 707 278 15Medications 94 968 14 18
Females Illegal amp Medications 11 961 39 00 Negative 1097 950 42 08Overall 1278 933 57 09
2007 National Roadside Survey of Alcohol and Drug Use by Drivers Drug Results
Male drivers who tested positive for ldquoIllegalrdquo drugs (Table 109) had statistically greater percentages of alcohol-positive results than their female counterparts (p lt 05)
Table 109 BAC of Drivers by Drug Category and Gender (Blood)
ldquoMedicationsrdquo includes prescription and over-the-counter drugs In this table percentages are weighted
Oral Fluid andor Blood Results (Nighttime Samples) Driver Drug Use Prevalence Based on Oral Fluid andor Blood Results This section of the report presents the joint results of oral fluid and blood analyses for all of the drugs indicated in the introductory section (see Tables 17 and 18) for nighttime drivers As noted earlier blood was only obtained from nighttime drivers The tables in this section are based on the 5910 nighttime drivers from whom an oral fluid andor a blood sample was obtained and analyzed If a driver tested positive for one or more of the drugs in either the oral fluid andor in the blood analyses heshe was categorized as drug-positive Thus this section provides the most comprehensive nighttime drug prevalence estimates available using the biological specimens obtained in this study Again these are overall drug prevalence estimates including illegal prescription and over-the-counter drugs or their metabolites and do not necessarily imply impairment Within individual tables overall counts may not total 5910 because of missing values on some variables
When we examine the test results from nighttime drivers providing oral fluid andor blood 163 percent of drivers were drug-positive as indicated in Table 110
89
2007 National Roadside Survey of Alcohol and Drug Use by Drivers Drug Results
Table 110 Nighttime Drug Prevalence by Time of Day (Oral Fluid andor Blood)
N Drug Positive Time of Day (Unweighted) (Weighted)
Daytime NA NA Nighttime 5910 163
When we examined drug prevalence by time of day (Table 111) we found that late-night (Sessions 3 and 5) drivers were significantly more likely to be drug positive (191 and 183 respectively) than Friday and Saturday earlier in the night (Sessions 2 and 4) drivers (154 and 152 respectively) (p lt 01)
Table 111 Drug Prevalence by Session (Oral Fluid andor Blood)
N Drug Positive Session (Unweighted) (Weighted)
2 Friday 1000 pm ndash Midnight 1618 154
3 Friday 100 am ndash 300 am 1313 191
4 Saturday 1000 pm ndash Midnight 1695 152
5 Saturday 100 am ndash 300 am 1284 183 Overall 5910 163
Comparison of drug prevalence by region (Table 112) showed that the Northeast region had the greatest percentage of drug-positive findings at 183 percent However this difference was not statistically significant Thus no clear pattern by region emerged
Table 112 Drug Prevalence by Region (Oral Fluid andor Blood)
N Drug Positive Region (Unweighted) (Weighted)
Midwest 1708 169 Northeast 1119 183 South 1566 163 West 1517 150 Overall 5910 163
Examining drug prevalence by gender (Table 113) revealed that male drivers were significantly more likely to be drug-positive than female drivers (180 male versus 138 female) (p lt 01)
90
2007 National Roadside Survey of Alcohol and Drug Use by Drivers Drug Results
Table 113 Drug Prevalence by Gender (Oral Fluid andor Blood)
Gender N
(Unweighted) Drug Positive
(Weighted) Males 3634 180 Females 2262 138 Overall 5896 164
Comparison of drug prevalence by age (Table 114) indicated that drivers aged 16-44 showed statistically similar drug prevalence (ie no statistical difference among these age groups) Conversely drivers aged 45-64 and 65+ were significantly less likely to be drug-positive than drivers aged 16-44 (p lt 01)
Table 114 Drug Prevalence by Age (Oral Fluid andor Blood)
Age N
(Unweighted) Drug Positive
(Weighted) 16-20 974 188 21-34 2451 182 35-44 1046 170 45-64 1225 121 65+ 148 40 Overall Nighttime 5844 165
When examining drug prevalence by age and gender (Table 115) we found that drug prevalence among male drivers in the age categories 16-20 and 21-34 years was significantly higher than their same-aged female counterparts (p lt 01) Drug prevalence among male drivers in the age category 35-44 years was also significantly higher than their same-aged female counterparts (p lt 05) However drug prevalence among female drivers aged 45-64 (154) was significantly higher than male drivers of the same age group (100) (p lt 01)
91
2007 National Roadside Survey of Alcohol and Drug Use by Drivers Drug Results
Table 115 Drug Prevalence by Age and Gender (Oral Fluid andor Blood)
N Drug Positive Gender Age (Unweighted) (Weighted)
Males
16-20 21-34 35-44 45-64 65+
605 1502
634 741 101
221 211 194 100
40 Overall Males 3583 182
Females
16-20 21-34 35-44 45-64 65+
368 944 409 482
47
140 135 137 154
42 Overall Females 2250 138
Table 116 shows drug prevalence by raceethnicity Drivers who identified themselves as Asian were significantly less likely to be drug positive (19) than drivers who identified themselves as African American Hispanic White or Other (p lt 01) African American drivers were found to have the highest percentage of drug-positive results (224) which was a significantly higher rate than that of their Hispanic or White counterparts (p lt 01)
Table 116 Drug Prevalence by RaceEthnicity (Oral Fluid andor Blood)
N Drug Positive RaceEthnicity (Unweighted) (Weighted)
African American 980 224 Asian 191 19 Hispanic 1015 133 White 3378 172 Other 273 181 Overall 5837 165
RaceEthnic groups other than ldquoHispanicrdquo are always ldquonon-Hispanicrdquo
As shown in Table 117 drivers who identified themselves as having at least some college experience were statistically less likely to be drug-positive than those reporting being a high school graduate or less education (p lt 01)
92
2007 National Roadside Survey of Alcohol and Drug Use by Drivers Drug Results
Table 117 Drug Prevalence by Education Level (Oral Fluid andor Blood)
Education Level N
(Unweighted) Drug Positive
(Weighted) Not a High School Graduate 579 203 High School Graduate 1482 240 Some College 2234 140 College Graduate 1159 109 Some Graduate Work 389 169 Overall 5843 165
Comparison of drug prevalence by employment status (Table 118) indicated that drivers on disability showed a drug prevalence that was significantly higher than that of employed drivers (p lt 01) The prevalence of drug positives among employed drivers did not differ significantly from that of unemployed drivers Retired drivers had significantly lower drug prevalence than employed drivers (p lt 01)
Table 118 Drug Prevalence by Employment Status (Oral Fluid andor Blood)
N Drug Positive Employment Status (Unweighted) (Weighted)
EmployedSelf Employed 4646 167 Homemaker 104 85 Student 593 159 Unemployed 206 182 Retired 206 83 On Disability 67 447 Other 23 150 Overall 5845 165
Table 119 shows drug prevalence by vehicle type Drug prevalence rates among drivers of various vehicle types (passenger vehicle pickup SUV and vanminivans) were statistically different from motorcyclists who had the greatest percentage of drug-positive results (p lt01)
Table 119 Drug Prevalence by Vehicle Type (Oral Fluid andor Blood)
Vehicle Type N
(Unweighted) Drug Positive
(Weighted) Passenger Vehicle 3650 165 Pickup 703 159 SUV 1058 152 Van amp Minivan 381 174 Motorcycle 75 319 Overall 5867 164
93
2007 National Roadside Survey of Alcohol and Drug Use by Drivers Drug Results
Driver Drug Use Prevalence by Drug Class Based on Oral Fluid andor Blood Results In this section of the report we display driver drug use prevalence by class of drug The classes of drugs tested for were antidepressants marijuana narcotic-analgesics sedatives stimulants and other (see Tables 17-18)
Drug Class
As indicated in Table 120 135 percent of the drivers tested positive for one drug class and 28 percent tested positive for more than one drug class
Table 120 Number and Distribution of Drug Classes (Oral Fluid andor Blood)
Number of N Drug Classes (Unweighted) (Weighted)
1 792 135 2+ 184 28 Negative 4934 837 Overall 5910 1000
Further drivers testing positive for only one drug class constituted about 83 percent of drug-positive drivers (Table 121)
Table 121 Number and Distribution of Drug Classes (Drug Positives Only) (Oral Fluid andor Blood)
Number of Drug Classes
N (Unweighted)
Drug Positive (Weighted)
1 792 828 2+ 184 172 Overall 976 1000
94
2007 National Roadside Survey of Alcohol and Drug Use by Drivers Drug Results
Table 122 presents distribution of drug classes by region Generally marijuana was the most common drug class across all the regions (68) followed by stimulants (32) Drivers in the West were less likely to test positive for marijuana than drivers from the other regions (p lt 01)
Table 122 Drug Classes Distribution by Region (Oral Fluid andor Blood)
Midwest Northeast South West All Drug Class
N=1708 N=1119 N=1566 N=1517 N=5910 Antidepressants 07 04 07 07 07 Marijuana 88 78 72 47 68 Narcotic-Analgesics 10 29 16 16 16 Sedatives 12 03 08 08 08 Stimulants 31 18 26 42 32 Other 02 00 01 05 03 More than 1 Class 18 51 32 25 28 Overall Drug Positive 169 183 163 150 163 Negative 831 817 837 850 837
ldquoMore than 1 Classrdquo ndash Drivers testing positive for more than one drug are only counted in this category In this table percentages are weighted
As is shown in Table 123 males were significantly more likely to be positive for marijuana than females (80 males versus 50 females) (p lt 01)
Table 123 Drug Classes Distribution by Gender (Oral Fluid andor Blood)
Males Females Total Drug Class
N=3634 N=2262 N=5896 Antidepressants 07 07 07 Marijuana 80 50 69 Narcotic-Analgesics 17 15 16 Sedatives 06 12 08 Stimulants 31 35 33 Other 03 03 03 More than 1 Class 35 17 28 Overall Drug Positive 180 138 164 Negative 820 862 836
ldquoMore than 1 Classrdquo ndash Drivers testing positive for more than one drug are only counted in this category In this table percentages are weighted
When we examined drug class prevalence by age (Table 124) we found that drivers aged 16-20 were more likely to use marijuana (120) than drivers in the 21-34 age group (p lt 05) and any other age group (p lt 01) The age group with the second highest prevalence of marijuana was 21-34 the prevalence in this age group (92) was also significantly higher than in older age groups (p lt 01)
95
Drug Class 16-20
21-34
35-44
45-64
65+
Total
N=974 Antidepressants 04 Marijuana 120 Narcotic-Analgesics 12 Sedatives 00 Stimulants 22 Other 02
More than 1 Class 27
N=2451 03 92 08 06 33 05 36
N=1046 09 46 43 15 31 02 23
N=1225 15 11 14 12 47 01 22
N=148 06 00 04 30 00 00 01
N=5844 07 69 16 09 33 03 28
Overall Drug Positive 188 182 170 121 40 165 835 Negative 812 818 830 879 960
ldquoMore than 1 Classrdquo ndash Drivers testing positive for more than one drug are only counted in this category In this table percentages are weighted
2007 National Roadside Survey of Alcohol and Drug Use by Drivers Drug Results
Table 124 Drug Classes Distribution by Age (Oral Fluid andor Blood)
Driver Drug Use Prevalence by Drug Category Based on Oral Fluid andor Blood Results In this section of the report we display drug use prevalence results from the combined results of oral fluid and blood tests by drug category as described in Table 18
Table 125 shows that 113 percent of drivers tested positive for ldquoIllegalrdquo drugs and an additional 11 percent tested positive for ldquoIllegalrdquo drugs in conjunction with ldquoMedicationsrdquo Thus a total of 124 percent tested positive for ldquoIllegalrdquo drugs of which 11 percent also tested positive for a ldquoMedicationrdquo
Table 125 Drug Categories Distribution (Oral Fluid andor Blood)
N Drug Category (Unweighted) (Weighted)
Illegal 621 113 Medications 277 39 Illegal amp Medications 78 11 Negative 4934 837 Overall 5910 1000
ldquoMedicationsrdquo includes prescription and over-the-counter drugs
Table 126 displays the drug category results by region No statistically significant differences were found in the prevalence of ldquoIllegalrdquo drugs across regions
96
2007 National Roadside Survey of Alcohol and Drug Use by Drivers Drug Results
Table 126 Drug Categories Distribution by Region (Oral Fluid andor Blood)
N Region Drug Category (Unweighted) (Weighted)
Midwest
Illegal Medications Illegal amp Medications Negative
197 97 19
1395
127 35 06
831 Overall 1708 1000
Northeast
Illegal Medications Illegal amp Medications Negative
121 43 17
938
113 46 24
817 Overall 1119 1000
South
Illegal Medications Illegal amp Medications Negative
145 79 28
1314
109 38 16
837 Overall 1566 1000
West
Illegal Medications Illegal amp Medications Negative
158 58 14
1287
113 39 11
837 Overall 1517 1000
ldquoMedicationsrdquo includes prescription and over-the-counter drugs
When examining prevalence by drug category and gender (Table 127) we found that male drivers were more likely to be positive for ldquoIllegalrdquo drugs (combining the categories for ldquoIllegalrdquo and ldquoIllegal and Medicationsrdquo) than female drivers (144 male versus 85 female) (p lt 01)
Table 127 Drug Categories by Gender (Oral Fluid andor Blood)
N Gender Drug Category (Unweighted) (Weighted)
Male
Illegal
Medications
Illegal amp Medications
Negative
444
136
53
3001
131
35
13
820 Overall 3634 1000
Female
Illegal
Medications
Illegal amp Medications
Negative
176
141
25
1920
80
66
05
849
Overall 2262 1000 ldquoMedicationsrdquo includes prescription and over-the-counter drugs
97
2007 National Roadside Survey of Alcohol and Drug Use by Drivers Drug Results
Comparison of drug categories by age (Table 128) revealed that drivers aged 16-20 and 21-34 had the highest percentage of drug-positive results for ldquoIllegalrdquo (ldquoIllegalrdquo plus ldquoIllegal and Medicationsrdquo) drugs (p lt 01)
Table 128 Drug Categories Distribution by Age (Oral Fluid andor Blood)
N Age Drug Category (Unweighted) (Weighted)
16-20
Illegal Medications Illegal amp Medications Negative
131 15 14
814
155 19 14
812 Overall 974 1000
21-34
Illegal Medications Illegal amp Medications Negative
329 70 37
2015
148 22 12
818 Overall 2451 1000
35-44
Illegal Medications Illegal amp Medications Negative
91 78 15
862
82 81 08
830 Overall 1046 1000
45-64
Illegal Medications Illegal amp Medications Negative
68 101
12 1044
57 54 10
879 Overall 1225 1000
65+
Illegal
Medications
Illegal amp Medications
Negative
0
13
0
135
00
40
00
960
Overall 148 1000 ldquoMedicationsrdquo includes prescription and over-the-counter drugs
Driver Drug Use Prevalence from Oral Fluid andor Blood and BAC Results The following section presents the results of the oral fluid and blood analyses combined with the blood alcohol concentration (BAC) results obtained through breath tests
Tables 129 and 130 show the number of drug-positive drivers by BAC level As seen in Table 129 drug-positive drivers (41) were significantly more likely to have a BAC of 08 or higher than were drug negative drivers (17) (p lt 01)
98
2007 National Roadside Survey of Alcohol and Drug Use by Drivers Drug Results
Table 129 Drug Prevalence by BAC (Percentages Calculated by Row) (Oral Fluid andor Blood)
Drug Result
N (Unweighted) Zero
BAC (gdL) Between
Zero and 08 08+ Positive 976 795 164 41 Negative 4932 906 77 17 Overall 5908 888 91 21
In this table percentages are weighted
Table 130 provides another way of looking at this issue and indicates that among drivers with a BAC gdL 08+ almost a third (318) were also positive for drugs The difference in drug prevalence between BAC categories for drug positive drivers however was not statistically significant
Table 130 Drug Prevalence by BAC (Percentages Calculated by Column) (Oral Fluid andor Blood)
BAC (gdL) Drug Between Zero
Result Zero and 08 08+ All
N=5241 N=536 N=131 N=5908 Positive 146 293 318 163 Negative 854 707 682 837
In this table percentages are weighted
Table 131 shows that among participants who were drug positive drivers younger than 35 were the most likely to be alcohol-positive The prevalence of drivers with a BAC greater than zero among drivers less than 35-years-old was significantly higher than among older driver groups (p lt 01) Though a high proportion of drug-positive drivers 65+ were also alcohol positive that pattern is not statistically significant compared to the other age groups due to the small sample size
Table 131 BAC Among Drug-Positive Drivers by Age (Oral Fluid andor Blood)
BAC (gdL) N Zero Between Zero 08+
Age (Unweighted) and 08 16-20 160 799 174 28 21-34 436 750 200 50 35-44 184 876 87 379 45-64 181 842 122 36 65+ 13 587 413 00 Overall Positive 974 796 163 41
In this table percentages are weighted
99
2007 National Roadside Survey of Alcohol and Drug Use by Drivers Drug Results
As shown in Table 132 the majority of alcohol-positive drivers among drug-positive drivers were positive for only one class of drug
Table 132 BAC Among Drug-Positive Drivers by Number of Drug Classes (Percentages Calculated by Column) (Oral Fluid andor Blood)
Number of Drug Classes Zero
BAC (gdL) Between
Zero and 08 08+ N=468 N=71 N=20
1 2+
819 181
837 163
961 39
Overall 1000 1000 1000 In this table percentages are weighted
In Table 133 those drivers with 2+ classes of drugs were significantly less likely to be positive for alcohol than those drug-positive for one class (p lt 05)
Table 133 BAC Among Drug-Positive Drivers by Number of Drug Classes (Percentages Calculated by Row) (Oral Fluid andor Blood)
Number of Drug Classes
N (Unweighted) Zero
BAC (gdL) Between
Zero and 08 08+ 1 792 786 166 48 2+ 184 836 155 09 Overall 976 795 164 41
In this table percentages are weighted
As indicated in Table 134 drug-positive drivers who were also alcohol-positive were more likely to be positive for ldquoIllegalrdquo drugs than for ldquoMedicationsrdquo (p lt 01)
Table 134 BAC Among Drug-Positive Drivers by Drug Category (Oral Fluid andor Blood)
N BAC (gdL)
Between Drug Category (Unweighted) Zero Zero and 08 08+
Illegal 621 7521 1935 544 Medications 277 9140 731 129 Illegal amp Medications 78 8110 1816 075 Negative 4932 8879 909 212
ldquoMedicationsrdquo includes prescription and over-the-counter drugs In this table percentages are weighted
100
2007 National Roadside Survey of Alcohol and Drug Use by Drivers Drug Results
Table 135 presents the BACs of drivers by drug category and age Drivers with BAC a of 08 or higher who tested positive for drugs were more likely to test positive for ldquoIllegalrdquo drugs than those in the ldquoMedicationsrdquo category across all age groups However this difference was not statistically significant
Table 135 BAC of Drivers by Drug Category and Age (Oral Fluid andor Blood)
BAC (gdL) N Between Zero
Age Drug Category (Unweighted) Zero and 08 08+
16-20
Illegal Medications Illegal amp Medications Negative
131 15 14
814
759 1000 975 961
208 00 25 34
33 00 00 05
Overall 974 930 60 10
21-34
Illegal Medications Illegal amp Medications Negative
329 70 37
2014
731 837 812 880
209 146 188
96
60 17 00 24
Overall 2450 856 115 29
35-44
Illegal Medications Illegal amp Medications Negative
91 78 15
862
794 953 932 921
147 27 68 66
59 20 00 13
Overall 1046 913 70 17
45-64
Illegal Medications Illegal amp Medications Negative
68 101 12
1044
808 934 536 899
126 61
424 88
66 04 40 13
Overall 1225 892 92 16
65+
Illegal Medications Illegal amp Medications Negative
0 13
0 135
NA 587
NA 899
NA 413
NA 53
NA 00
NA 48
Overall 148 886 68 46 In this table percentages are weighted
When examining BAC by drug category by gender (Table 136) male drivers that tested positive for ldquoIllegalrdquo drugs were more likely to have a BAC at or above 08 gdL than their female counterparts (p lt 01)
101
2007 National Roadside Survey of Alcohol and Drug Use by Drivers Drug Results
Table 136 BAC of Drivers by Drug Category and Gender (Oral Fluid andor Blood)
BAC (gdL) N Between Zero
Gender Drug Category (Unweighted) Zero and 08 08+
Males
Illegal Medications Illegal amp Medications Negative
444 136
53 3001
749 928 760 902
179 64
231 78
72 08 10 21
Overall 3634 881 92 27
Females
Illegal Medications Illegal amp Medications Negative
176 141
25 1919
761 896 979 912
231 84 21 76
09 20 00 12
Overall 2261 899 89 12 In this table percentages are weighted
Individual Drug Prevalence Estimates from Oral Fluid and Oral Fluid andor Blood Combined In this section of the report we present prevalence estimates for individual drugs illegal prescription and over-the-counter drugs obtained from the analyses of oral fluid and blood specimens In Tables 137 and 139 there are three main columns The first column lists the individual drugs for which we tested and at least one driver tested positive in oral fluid The second main column presents the oral fluid results (unweighted N and weighted percentage) of samples obtained from daytime drivers on a drug-by-drug basis The third column presents results of oral fluid analyses from nighttime drivers in a similar manner Similarly tables 138 and 140 present the combined analyses of oral fluid andor blood samples provided by nighttime drivers Note in these tables there were 5910 nighttime drivers who provided either oral fluid blood or both oral fluid and blood for analysis If a driver tested positive for a specific drug or a metabolite of that drug in either oral fluid or blood or in both substances that driver was counted as positive for that drug once Thus these tables provide us with a robust estimate of nighttime drug prevalence available from the biological samples we collected because it takes advantage of the larger sample size of nighttime drivers providing oral fluid samples (5869) augmented with information obtained from analyses of blood samples obtained from 3276 nighttime drivers Most drivers who provided blood also provided oral fluid so including the blood results only increased the sample size by 41 drivers to 5910 However since in some cases specific drugs were found in oral fluid and not blood and conversely in blood but not oral fluid this dataset provides us with the most comprehensive estimates of individual drug prevalence
The Ns in the tables represent the actual unweighted number of positive tests for the listed drug or a metabolite of that drug The percentages are the weighted prevalence estimates for each drug Since individual drug use was the unit of analysis and some drivers were positive for more than one drug the sum of the individual drug prevalence estimates exceeds the overall prevalence estimates appearing elsewhere in this report
102
2007 National Roadside Survey of Alcohol and Drug Use by Drivers Drug Results
Of particular interest may be the prevalence estimates for relatively frequently encountered drugs such as marijuana Marijuana (and its metabolites) appears as a separate drug class in the typology presented in Table 17 and used in the subsequent tabulations of results by drug class However a number of drivers tested positive for more than one drug class (sometimes including marijuana) and were classified as such in the tabulations Thus drivers who were positive for marijuana were split between the mutually exclusive classifications of ldquomarijuanardquo and ldquomore than one drug classrdquo in those tables Here in these tables we present the prevalence estimates for a drug such as marijuana independent of whether other drugs were found in an individual driver Thus a driver for example who tested positive for marijuana and cocaine would appear twice in the tables in this section of the report Finally as indicated earlier in the report in many instances we tested both for the parent drug and its metabolites In cases where we found both the parent drug and its metabolite (for example THC and 11-OH-THC) we only counted that as one drug positive for the parent drug In the case in which a parent drug was identified alone which could also be a metabolite of another drug we only counted the observation as the parent drug itself and not again as the drug for which it could be a metabolite
Thus the values in the tables in this section of the report represent estimates of individual drug prevalence based on the analytic techniques available
Overall Individual Drug Prevalence in Daytime and Nighttime Review of Tables 137 and 138 reveals that the two highest prevalence drugs found in the 2007 NRS were in the ldquoIllegalrdquo drug category
The most frequently encountered single drug in oral fluid in both daytime and nighttime was THC (marijuana) Marijuana was detected in oral fluid in 446 percent of daytime drivers and 766 percent of nighttime drivers (Table 137) The results from nighttime drivers who provided oral fluid andor blood indicated that 865 percent of drivers were positive for marijuana or its metabolites (Table 138)
The second most frequently encountered drug was cocaine with either cocaine or a metabolite detected in oral fluid in 146 percent of daytime drivers and 390 percent of nighttime drivers The corresponding nighttime figure for oral fluid andor blood nighttime was 392 percent
During the daytime the next most frequently encountered drug was alprazolam at 112 percent Alprazolam (a benzodiazepine) exhibited a nighttime prevalence rate in oral fluid of 061 percent
Among opioids oxycodone exhibited a daytime prevalence rate of 037 percent Among the nighttime oral fluid samples oxycodone had a prevalence rate of 080 percent Another opioid hydrocodone had a 022 percent daytime and 061 percent nighttime oral fluid prevalence rate The atypical opioid propoxyphene was detected in 093 percent of daytime oral fluid samples and 046 percent of nighttime oral fluid samples
The daytime prevalence rate of methamphetamine was 032 percent and amphetamine was 023 percent Among nighttime drivers providing oral fluid samples methamphetamine had a prevalence rate of 080 percent Amphetamine had a prevalence rate of 036 percent
103
2007 National Roadside Survey of Alcohol and Drug Use by Drivers Drug Results
Table 137 Prevalence of Drugs in Daytime and Nighttime Drivers (Oral Fluid)
Drug
Oral Fluid Daytime Nighttime
N (Unweighted)
(Weighted)
N (Unweighted)
(Weighted)
Alprazolam 18 112 36 061 Amitriptyline 6 027 7 003 Amphetamine 4 023 19 036 Butalbital 5 026 8 017 Carisoprodol 2 005 5 003 Chlordiazepoxide 2 025 2 003 Clonazepam 2 003 7 012 Cocaine 38 146 222 390 Codeine 4 013 7 044 Dextromethorphan 3 023 16 022 Diazepam 3 010 10 014 Fluoxetine 11 034 14 023 Heroin 2 009 8 017 Hydrocodone 15 022 58 061 Hydromorphone 2 009 0 000 Ketamine 0 000 1 008 Lorazepam 0 000 1 001 MDMA 2 006 8 009 Meperidine 1 001 2 000 Meprobamate 0 000 1 001 Methadone 3 021 11 018 Methamphetamine 5 032 34 080 Methylphenidate 0 000 3 001 Morphine 0 000 1 000 Oxycodone 14 037 43 080 PCP 1 004 3 013 Phenobarbital 1 000 1 000 Phentermine 5 015 11 011 Propoxyphene 22 093 34 046 Sertraline 2 044 4 013 Temazepam 2 012 2 002 THC (Marijuana) 103 446 438 766 Tramadol 12 019 34 046 Zolpidem 2 012 1 001
All Tested Drivers dagger 1850 1100 5869 1440 dagger Number and percentages for All tested drivers indicate number of drivers providing samples and the percentage of those drivers who tested positive for at least one drug In this table percentages are weighted
104
2007 National Roadside Survey of Alcohol and Drug Use by Drivers Drug Results
Individual Drug Prevalence in Nighttime Oral Fluid andor Blood Results for drivers who provided oral fluid andor blood yielded an overall drug positive prevalence estimate of 163 percent (Table 138) Again marijuana (865) and cocaine (392) were the most frequently encountered drugs The next most frequently encountered drug was methamphetamine (084) Amphetamine was present in 045 percent of this nighttime driver population The opioids oxycodone (082) and hydrocodone (068) and the benzodiazepine alprazolam (064) were the next most frequently encountered drugs in this nighttime driver population The atypical opioid propoxyphene was present in 052 of these nighttime drivers Note however as indicated in the introduction of this section the unit of analysis in these tables is individual drug use Some drivers were positive for more than one drug thus the sum of the individual drug prevalence estimates exceed the overall prevalence estimates noted earlier in this report
105
2007 National Roadside Survey of Alcohol and Drug Use by Drivers Drug Results
Table 138 Prevalence of Drugs in All Drug-Tested Nighttime Drivers (Oral Fluid andor Blood)
Drug N
(Unweighted)
(Weighted)
Alprazolam 40 064 Amitriptyline 14 007 Amphetamine 25 045 Butalbital 9 017 Carisoprodol 5 003 Chlordiazepoxide 4 003 Clonazepam 10 014 Cocaine 225 392 Codeine 7 044 Dextromethorphan 16 022 Diazepam 30 038 Fluoxetine 25 037 Heroin 8 017 Hydrocodone 63 068 Hydromorphone 0 000 Imipramine 1 000 Ketamine 1 008 Lorazepam 2 003 MDMA 8 009 Meperidine 2 000 Meprobamate 1 001 Methadone 14 019 Methamphetamine 37 084 Methylphenidate 3 001 Morphine 8 006 Oxycodone 47 082 PCP 3 013 Phenobarbital 2 001 Phentermine 21 026 Propoxyphene 35 052 Sertraline 36 050 Temazepam 4 003 THC (Marijuana) 499 865 Tramadol 35 046 Zolpidem 4 003
All Tested Driversdagger 5910 1630 dagger Number and percentages for All tested drivers indicate number of drivers providing samples and percentage of those drivers who tested positive In this table percentages are weighted
106
2007 National Roadside Survey of Alcohol and Drug Use by Drivers Drug Results
Individual Drug Prevalence Sorted by Drug Type from Oral Fluid and Oral Fluid andor Blood Combined In Tables 139 and 140 we present prevalence estimates by drug within drug type for both daytime and nighttime drivers based on oral fluid analyses (Table 139) and for nighttime drivers based on the results of analyses of oral fluid andor blood (Table 140) These tables contain the same information provided in Tables 137 and 138 except that the drugs are sorted by drug type (Drug types are the subgrouping of similar drugs noted by class and category in Tables 17 and 18)
107
2007 National Roadside Survey of Alcohol and Drug Use by Drivers Drug Results Table 139 Prevalence of Drugs in Daytime and Nighttime Drivers (Oral Fluid)
Drug
Oral Fluid
Daytime Nighttime N
(Unweighted)
(Weighted) N
(Unweighted)
(Weighted)
THC (Marijuana) 103 446 438 766
Cocaine 38 146 222 390 Opioids
Codeine Heroin
Hydrocodone Hydromorphone Meperidine
Methadone Morphine Oxycodone Propoxyphene Tramadol
4 2
15 2 1 3 0
14 22 12
013 009 022 009 001 021 000 037 093 019
7 8
58 0 2
11 1
43 34 34
044 017 061 000 000 018 000 080 046 046
AmphetaminesStimulants MDMA Amphetamine
Methamphetamine Methylphenidate
Phentermine
2 4 5 0 5
006 023 032 000 015
8 19 34
3 11
009 036 080 001 011
Street Drugs Ketamine PCP
0 1
000 004
1 3
008 013
Benzodiazepines Alprazolam
Chlordiazepoxide Clonazepam Diazepam
Lorazepam Temazepam
18 2 2 3 0 2
112 025 003 010 000 012
36 2 7
10 1 2
061 003 012 014 001 002
Antidepressants Amitriptyline
Fluoxetine Imipramine Sertraline
6 11
0 2
027 034
0 044
7 14
0 4
003 023
0 013
Barbiturates Butalbital
Phenobarbital 5 1
026 000
8 1
017 000
Pain Drugs Carisoprodol Meprobamate
2 0
005 000
5 1
003 001
Sleep Aids Zolpidem 2 012 1 001
Cough Suppressants Dextromethorphan 3 023 16 022
All Tested Driversdagger 1850 1100 5869 1440 dagger Number and percentages for All tested drivers indicate number of drivers providing samples and percentage of those drivers who tested positive In this table percentages are weighted
108
2007 National Roadside Survey of Alcohol and Drug Use by Drivers Drug Results
Table 140 Prevalence of Drugs in All Drug-Tested Nighttime Drivers (Oral Fluid andor Blood)
Drug N
(Unweighted)
(Weighted) THC (Marijuana) 499 865 Cocaine 225 392 Opioids
Codeine 7 044 Heroin 8 017
Hydrocodone 63 068 Hydromorphone 0 000 Meperidine 2 000
Methadone 14 019 Morphine 8 006 Oxycodone 47 082 Propoxyphene 35 052 Tramadol 35 046
AmphetaminesStimulants MDMA 8 009 Amphetamine 25 045
Methamphetamine 37 084 Methylphenidate 3 001
Phentermine 21 026 Street Drugs
Ketamine PCP
1 3
008 013
Benzodiazepines Alprazolam 40 064
Chlordiazepoxide 4 003 Clonazepam 10 014 Diazepam 30 038
Lorazepam 2 003 Temazepam 4 003 Antidepressants Amitriptyline 14 007
Fluoxetine 25 037 Imipramine 1 000 Sertraline 36 050
Barbiturates Butalbital
Phenobarbital 9 2
017 001
Pain drugs Carisoprodol Meprobamate
5 1
003 001
Sleep Aids Zolpidem 4 003
Cough Suppressants Dextromethorphan 16 022
All Tested Driversdagger 5910 1630 dagger Number and percentages for All tested drivers indicate number of drivers providing samples and percentage of those drivers who tested positive In this table percentages are weighted
109
2007 National Roadside Survey of Alcohol and Drug Use by Drivers Drug Results
Drugs that were infrequently encountered in the study population included the sedative pain drugs carisoprodol and meprobamate the sleep aid zolpidem and the street drugs ketamine and PCP Barbiturates and cough suppressants were also infrequent in the studied driver population
Examination of the results of the daytime and the nighttime oral fluid analyses and the combination of oral fluid and or blood analyses (when either one or both types of samples were provided) indicates that similar relative patterns of prevalence estimates are realized in the daytime and nighttime Marijuana is the most frequently encountered drug whether compared with other drugs individually or with drug types Cocaine is the next most frequently encountered drug or drug type in the nighttime sample but during the daytime benzodiazepines and opioids exhibited higher prevalence rates as classes than cocaine
110
2007 National Roadside Survey of Alcohol and Drug Use by Drivers Drug Results
Discussion This report summarizes the results of the first US National Roadside Survey to estimate drug-involved driving prevalence based on biological measures It should be emphasized that this is a prevalence study and not a study that addresses the risk that may be presented by drug use among drivers For many drug types drug presence can be detected long after any impairment that might affect driving has passed However it is important to our understanding of drugs and driving to know the extent of the use of certain drugs in the driving population That was the intent of this study
As indicated earlier in the report we gathered data from drivers on US roadways during Friday daytime hours as well as during Friday nights and Saturday nights We obtained oral fluid samples (1850 during daytime and 5869 during nighttime) from drivers in each of those data collection periods and collected blood samples (3276) as well during the nighttime data collection periods (Table 10)
In this study analyses of the oral fluid and blood samples were conducted to identify the presence of some 75 drugs and metabolites (Tables 17 and 18) To make the presentation of results most useful we identified six classes of these drugs including antidepressants marijuana narcotic-analgesics sedatives stimulants and other plus a ldquomore than one drugrdquo class We also identified three broader categories illegal prescription and over-the-counter Because few overshythe-counter drugs were found the prescription and over-the-counter drugs were combined for many analyses and labeled ldquoMedicationsrdquo
Oral Fluid Analyses Analyses of the oral fluid samples obtained from daytime drivers indicated an overall drug use prevalence of 11 percent and for nighttime drivers 144 percent (Table 19) This includes illegal prescription and over-the-counter drugs combined This overall difference between day and night is statistically significant (p lt 01)
In examining the prevalence of drugs by class (Table 31) marijuana was identified in 39 percent of daytime drivers and 61 percent of nighttime drivers Sedatives were found in 16 percent of daytime drivers and in 06 percent of nighttime drivers Conversely stimulants were found in 16 percent of daytime drivers but in 32 percent of nighttime drivers
Comparison of drug classes by time of day indicated that nighttime drivers were significantly more likely to test positive for more than one drug class than daytime drivers (23 nighttime versus 15 daytime) (p lt 01) Comparison of drug categories by time of day (Table 34) revealed that almost 6 percent of daytime drivers tested positive for drugs in the ldquoIllegalrdquo category (primarily marijuana and cocaine) as did over 10 percent of nighttime drivers (there was a statistically significant difference between the two groups [p lt 01]) Positive results in the ldquoMedicationsrdquo category (prescription and over-the-counter drugs combined) were found to be slightly higher among the daytime drivers (almost 5) than nighttime drivers (3) although this difference was not statistically significant
When examining drug prevalence by time of day and gender (Table 22) the daytime driving sample showed no statistically significant difference in drug prevalence between males and
111
2007 National Roadside Survey of Alcohol and Drug Use by Drivers Drug Results
females however in the nighttime driving sample male drivers were significantly more likely to be drug-positive than female drivers (165 males versus 113 females) (p lt 01)
Further comparison of drug class by time and gender (Table 32) showed that males were significantly more likely to test positive for marijuana than females in both daytime (59 males versus 17 females) and nighttime samples (74 males versus 41 females) (p lt 01)
When examining prevalence by drug category by time of day and gender (Table 36) we found that in the daytime sample male drivers were more likely to test positive for ldquoIllegalrdquo drugs (82) than female drivers (30) (p lt 01) Conversely daytime female drivers were more likely to show positive results for ldquoMedicationsrdquo (76) than daytime male drivers (25) (p lt 01) This pattern was similar in the nighttime sample with 125 percent of male drivers testing positive for ldquoIllegalrdquo drugs as opposed to 75 percent of female drivers (p lt 01) The difference in percentage of positive results for ldquoMedicationsrdquo between male (28) and female (33) drivers was not as striking in the nighttime sample as in the daytime sample
Comparison of overall drug prevalence by time of day and age18 (Table 23) revealed that within the daytime driving sample drivers aged 45-64 showed the highest percentage of drug positives and drivers aged 16-20 and aged 65+ were significantly less likely to be positive than other ages of drivers (p lt 05) In the nighttime driving sample drivers aged 45-64 and 65+ were significantly less likely to be drug positive (p lt 01) while drivers aged 16-20 showed no difference in drug prevalence from drivers aged 21-34 years and drivers aged 35-44 years
When we examined drug classes by time of day and age (Table 33) we found that daytime drivers aged 21-34 were more likely to use marijuana (74) than daytime drivers in other age groups (p lt 01) However drivers aged 16-20 years had the highest marijuana use (98) in the nighttime sample followed by the 21-34 year age group (85) (p lt 01) The prevalence of narcotic-analgesics among daytime drivers was highest among drivers aged 45-64 (29) (p lt 01) however in the nighttime sample this changed to the age 35-44 group (42) (p lt 01)
In comparing drug categories by time of day and age (Table 37) it was clear that within the daytime sample ldquoIllegalrdquo drug use was highest for drivers aged 21-34 (99) followed by drivers aged 35-44 (65) The prevalence of ldquoIllegalrdquo drugs for these age groups differed significantly from that in the remaining age groups (p lt 01) In the nighttime sample drivers in the 21-34 year age group still maintained the highest percentage of positive results for ldquoIllegalrdquo drugs (142) however that group was then followed by the youngest age group (16-20 years) for ldquoIllegalrdquo drugs (131) (p lt 01) ldquoMedicationsrdquo usage was highest among the 45-64 year age group (88) in the daytime sample (non-significant) and in the 35-44 year old age group in the nighttime sample (69) (p lt 01)
In comparing the number of drug-positive drivers by time of day and BAC level (Tables 38 and 39) a statistically significant association was found between drug-positive and alcohol-positive drivers within the nighttime driving sample In other words the percentage of nighttime drivers with a BAC gdL of 08+ was significantly higher among drug-positive drivers than among drug-negative drivers (p lt 01) However for daytime drivers no such statistical association was found largely because of the small number of alcohol-positive drivers in the daytime sample
18 Age ranges between groups are not equivalent
112
2007 National Roadside Survey of Alcohol and Drug Use by Drivers Drug Results
In both the daytime and nighttime samples the majority of drug-positive drivers who were alcohol-positive were in the ldquoIllegalrdquo drug category (Table 43) This was particularly true in the nighttime sample in which 173 percent in the ldquoIllegalrdquo drug category had BACs between zero and 08 (compared to 63 in the ldquoMedicationsrdquo category) and 57 percent had BACs greater than 08 (compared to 12 in the ldquoMedicationsrdquo category [p lt 01]) In the daytime sample however the differences were statistically non-significant
Blood Analyses About 14 percent of the 3276 blood samples obtained from nighttime drivers were drug-positive (Table 83) Two percent of the blood-sampled drivers tested positive for more than one drug class (Table 93 and about 9 percent of driver tested positive for drugs in the ldquoIllegalrdquo category (Table 97)
Review of blood sample findings by gender (Table 86) revealed that male drivers were more likely to be drug-positive than female drivers (145 males versus 130 females) However such differences were not statistically significant Comparison of drug class by gender (Table 95) revealed that male drivers were significantly more likely to test positive for marijuana than female drivers (74 males versus 56 females) (p lt 05) When examining prevalence by drug category and gender (Table 99) we found that over 10 percent of male drivers had positive results for ldquordquoIllegalrdquo drugs as did about 7 percent of female drivers (p lt 01) The difference in percentage of positive results for ldquoMedicationsrdquo between male and female drivers was not statistically significant
When examining drug prevalence by age (Table 87) the prevalence of drug-positives was higher among young drivers Drivers aged 16-20 years showed a significantly higher prevalence than drivers aged 21-34 years and drivers aged 35-44 years (p lt 01) Drivers aged 45-64 and 65+ were significantly less likely to be drug positive than drivers ages 16 to 34 years old (p lt 01)
Comparison of drug class by age (Table 96) showed that drivers younger than 35-years-old were more likely to test positive for marijuana than drivers in other age groups (p lt 01) Among drivers aged 16-34 drivers aged 16-20 years had the highest marijuana use (152) The prevalence of narcotic-analgesics was higher among the 16-20 and 35-44 year age groups (13 and 17 respectively) than any other age group (p lt 01)
ldquoIllegalrdquo drug use was highest for drivers in the youngest age group (16-20 years) followed by drivers aged 21-34 years old (p lt 01) ldquoIllegalrdquo drug use among drivers older than 35-years-old was significantly lower than among drivers under the age of 35 (p lt 01) ldquoMedicationrdquo usage followed the opposite trend with prevalence increasing with age Prevalence of ldquoMedicationrdquo was higher for drivers aged 35 and older than for drivers younger than age 35 (p lt 01) (Table 100)
A statistically significant association was found between drug-positive and alcohol-positive drivers (Tables 101 and 102) The percentages of drivers with a BAC gdL between zero and 08 and with a BAC gdL 08+ were significantly higher among drug-positive drivers than among drug-negative drivers (p lt 01)
113
2007 National Roadside Survey of Alcohol and Drug Use by Drivers Drug Results
Oral Fluid andor Blood Analyses Combined Similar patterns of results were obtained when we examined the drug prevalence for the 5910 nighttime drivers who provided oral fluid andor blood samples If a driver tested positive for one or more of the drugs in either the oral fluid andor in the blood analyses heshe was categorized as drug-positive (Table 110) This yielded an overall drug positive rate of 163 percent
When we examined individual drugs and their metabolites (Tables 137 and 138) we found that the most frequently encountered drug was marijuana whether it was measured in oral fluid in the daytime (45) oral fluid at nighttime (77) or the combination of oral fluid andor blood at nighttime (87) The next most frequently encountered individual drug (again by all measures) was cocaine which was present in 15 percent of daytime oral fluid samples 39 percent of nighttime oral fluid samples and 39 percent of nighttime combined oral fluid andor blood analyses
During the daytime the next most frequently encountered drug was alprazolam at 112 percent Among nighttime drivers providing oral fluid samples the most frequently encountered drugs after marijuana and cocaine were methamphetamine and oxycodone each with a prevalence rate of 080percent The data collected during the 2007 National Roadside Survey provides new insight into the extent and patterns of drug use and the combination of drug and alcohol use among our Nationrsquos drivers As noted earlier the data collected can not determine whether the drug-use patterns we observed affected driver performance For example although all the drugs examined in this study can potentially impair driving skills some of the drug-positive drivers could drive better with the therapeutic effects of medicinal drugs they are taking What this study has provided is a careful estimate of the extent of alcohol-involved and drug-involved driving in the contiguous 48 States
The next step in this process is to conduct a study that attempts to quantify the risk that drug-involved driving may pose for crash involvement One way to establish that is to conduct a case control study where data including objective measures of drug use are gathered from crash-involved drivers and non-crash-involved drivers matched to the time location and direction of travel of the crash-involved drivers Those two sets of data can then be compared to estimate the risk posed by various drugs
114
2007 National Roadside Survey of Alcohol and Drug Use by Drivers Drug Results
References Bates M Brick J amp White H (1993) Correspondence between saliva and breath estimates of
blood alcohol concentration advantages and limitations of the saliva method Journal of Studies on Alcohol 54(1) 17-22
Beirness D Simpson H M amp Williams A F (2006) Role of Cannabis and Benzodiazepines in Motor Vehicle Crashes Transportation Research Circular No E-C096 Drugs and Traffic A Symposium June 20-21 2005 (pp 12-21) Woods Hole MA Transportation Research Board of the National Academies
Blomberg RD Peck RC Moskowitz H Burns M and Fiorentino D (2005) Crash risk of alcohol involved driving A case-control study Report Stanford CT Dunlap amp Associates Inc (p 117)
Brogan W C Kemp P M Bost R O Glamann D B Lange R A amp Hillis L D (1992) Collection and handling of clinical blood samples to assure the accurate measurement of cocaine concentration Journal of Analytic Toxicology 16 152-154
Burns M M (1993) Cocaine Effects on Performance In H Utzelmann G Berghause amp G Ktoj (Eds) 12th Proceedings of the International Conference on Alcohol Drugs and Traffic Safety Verlang TUumlV Rheinland GmbH (pp 612ndash619) Koumlln Germany Centers for Disease Control and Prevention (2006) Alcohol and other drug use among victims of motor vehicle crashes ndash West Virginia ndash 2004-2005 Morbidity and Mortality Weekly Report (MMWR) 55(48)1293-1296 Available online httpwwwcdcgovmmwrpreviewmmwrhtmlmm5548a2htm
Christophersen A S (1986) Tetrahydrocannabinol stability in whole blood plastic versus glass containers Journal of Analytic Toxicology 10 129-131
Cone E J Presley L Lehrer M Seiter W Smith M Kardos K Fritch D Salamone S J amp Niedbala R (2002) Oral fluid testing for drugs of abuse positive prevalence rates by Intercept immunoassay screening and GC-MS-MS confirmation and suggested cutoff concentrations Journal of Analytical Toxicology 26(8) 541-546
Coulter C Miller E Crompton K Moore C (2008) Tetrahydrocannabinol and two of its metabolites in whole blood using liquid chromatography-tandem mass spectrometry Journal of Analytical Toxicology 32 653-658
Coulter C Crompton K amp Moore C (2008) Detection of phencyclidine in human oral fluid using solid phase extraction and liquid chromatography with tandem mass spectrometric detection Journal of Chromatography B Biomedical Sciences and Applications 873 123 shy128
Couper F J amp Logan B K (2004) Drugs and human performance fact sheet DOT HS 809 725 Washington DC National Highway Traffic Safety Administration
de Gier H (2006 June 20-21) Medicinal Drugs Critical Review of Present Knowledge and Statements for Discussion Paper presented at the Drugs in Traffic A symposium Transportation Research Board Woods Hole MA
115
2007 National Roadside Survey of Alcohol and Drug Use by Drivers Drug Results
Drummer O H (2002) Benzodiazepines Effects on human performance and behavior Forensic Science Review 14 2ndash14
Federal Highway Administration (2006) Highway Statistics 2006 Retrieved June 25 2008 from wwwfhwadotgovpolicyohimhs06driver_licensinghtm
Gieringer D H (1988) Marijuana driving and accident safety Journal of Psychoactive Drugs 20(93) 101
Heishman S J Stitzer M L amp Yingling J E (1989) Effects of tetrahydrocannabinol content on marijuana smoking behavior subjective reports and performance Pharmacology Biochemistry and Behavior 34(1) 173ndash179
Hemmelgarn B Suissa S Huang A Boivin J-F amp Pinard G (1997) Benzodiazepine use and the risk of motor vehicle crash in the elderly Journal of the American Medical Association 278 27-31
Higgins S T Bickel W K Hughes J R Lynn M Capeless M A amp Fenwick J W (1990) Effects of intranasal cocaine on human learning performance and physiology Psychopharmacology 8 451ndash485
Hold K de Boer D Zuidema J amp Maes R (1999) Saliva as an analytical tool in toxicology International Journal of Drug Testing 1(1) 1-36
Hurst P M (1976) Amphetamines and driving behavior Accident Analysis and Prevention 8 9ndash13
Jones R K Shinar D amp Walsh J M (2003) State of knowledge of drug-impaired driving DOT HS 809 642 Washington DC National Highway Traffic Safety Administration
Kelly E Darke S amp Ross J (2004) A Review of drug use and driving Epidemiology impairment risk factors and risk perceptions Drug and Alcohol Review 23 319ndash344
Kiger S Lestina D amp Lund AK (1993) Passive alcohol sensors in law enforcement screening for alcohol-impaired drivers Alcohol Drugs and Driving 9 7-18
Kintz P Cirimele V amp Ludes B (2000) Detection of cannabis in oral fluid (saliva) and forehead wipes (sweat) from impaired drivers International Journal of Drug Testing 24(7) 557-561
Lacey J Kelley-Baker K Furr-Holden C Brainard K and Moore C (2007) Pilot Test of New Roadside Survey Methodology for Impaired Driving DOT HS 810 704 Washington DC National Highway Traffic Safety Administration
Lacey J H Kelley-Baker T Furr-Holden C D M Voas R Moore C Brainard K Tippetts A S Romano E Torres P amp Berning A (2009a) 2007 National Roadside Survey of Alcohol and Drug Use by Drivers Methodology Washington DC National Highway Traffic Safety Administration (in press)
Lacey J H Kelley-Baker T Furr-Holden C D M Voas Romano E Tippetts A S Brainard K amp Berning A (2009b) 2007 National Roadside Survey of Alcohol and Drug Use by Drivers Alcohol Results Washington DC National Highway Traffic Safety Administration (in press)
116
2007 National Roadside Survey of Alcohol and Drug Use by Drivers Drug Results
Lamers C T J amp Ramaekers J G (1999) Marijuana and alcohol effects on visual search and general driving proficiency Journal of Psychopharmacology 13(3 Suppl A) A53
Lestina D C Greene M Voas R B amp Wells J (1999) Sampling procedures and survey methodologies for the 1996 survey with comparisons to earlier National Roadside Surveys Evaluation Review 23(1) 28-46
Leveille S G Buchner D M Koepsell T D McCloskey L W Wolf M E amp Gagner E H (1994) Psychoactive medications and injurious motor vehicle collisions involving older drivers Epidemiology 5 591-598
Lucki I Rickels K amp Geller A (1985) Psychomotor performance following long-term use of benzodiazepines Psychopharmacology Bulletin 21 93-96
Lund A K Preusser D F Blomberg R D amp Williams A F (1988) Drug use by tractor-trailer drivers Journal of Forensic Sciences JFSCA 33(3) 648-661
Lund A K amp Wolfe A C (1991) Changes in the incidence of alcohol-impaired driving in the United States 1973-1986 Journal of Studies on Alcohol 52(4) 293-301
Mathijssen M P Movig K L de Gier J J Nagel P H van Egmond T amp Egberts A C (2002) Use of psychoactive medicines and drugs as a cause of road trauma In D R Mayhew amp C Dussault (Eds) Proceedings of Alcohol Drugs amp Traffic Safety - T 2002 16th International Conference on Alcohol Drugs amp Traffic Safety August 4-9 2002 Vol 2 (pp 451-457) Montreal Canada International Council on Alcohol Drugs and Traffic Safety (ICADTS) Centers for Disease Control and Prevention (2006) Alcohol and other drug use among victims of motor vehicle crashes ndash West Virginia ndash 2004-2005 Morbidity and Mortality Weekly Report (MMWR) 55(48)1293-1296 Available online httpwwwcdcgovmmwrpreviewmmwrhtmlmm5548a2htm
Moore C Coulter C amp Crompton K (2007) Achieving proposed Federal concentrations using reduced specimen volume for the extraction of amphetamines from oral fluid Journal of Analytic Toxicology 31(8) 442-446
Moore C Coulter C Crompton K amp Zumwalt M (2007) Determination of benzodiazepines in oral fluid using LCMSMS Journal of Analytic Toxicology 31(9) 596-600
Moore C Rana S amp Coulter C (2007a) Determination of meperidine tramadol and oxycodone in human oral fluid using solid phase extraction and gas chromatography-mass spectrometry Journal of Chromatography B Biomedical Sciences and Applications 850 370-375
Moore C Rana S amp Coulter C (2007b) Simultaneous identification of 2-carboxyshytetrahydrocannabinol tetrahydrocannabinol cannabinol and cannabidiol in oral fluid Journal of Chromatography B Biomedical Sciences and Applications 852 459-464
Moore C Vincent M Rana S Coulter C Agrawal A amp Soares J (2006) Stability of Delta(9)-tetrahydrocannabinol (THC) in oral fluid using the Quantisaltrade collection device Forensic Science International 164(2-3) 126-130
Moskowitz H (1985) Marijuana and driving Accident Analysis and Prevention 17 323ndash345
117
2007 National Roadside Survey of Alcohol and Drug Use by Drivers Drug Results
National Highway Traffic Safety Administration (1995) National automotive sampling system Crashworthiness data system 1991-1993 Washington DC National Highway Traffic Safety Administration
National Highway Traffic Safety Administration (2001) National Automotive Sampling System Crashworthiness Data System 1995-1997 Washington DC National Highway Traffic Safety Administration
National Highway Traffic Safety Administration (2005) Fatality Analysis Reporting System Fatal crash data overview DOT HS 809 726 Washington DC National Highway Traffic Safety Administration
Neutel C I (1998) Benzodiazepine-related traffic accidents in young and elderly drivers Human Psychopharmacology 13(Suppl 2) S115ndashS123
ONeal C L Crouch D J Rollins D E amp Fatah A A (2000) The effects of collection methods on oral fluid codeine concentrations Journal of Analytic Toxicology 24(7) 536shy542
Perez-Reyes M Hicks R E Bumberry J Jeffcoat A R amp Cook C E (1988) Interaction between marihuana and ethanol Effects on psychomotor performance Alcohol Clinical and Experimental Research 12(2) 268ndash276
Polkis A Maginn D amp Barr J L (1987) Drug findings in driving under the influence of drugs cases a problem of illicit drug use Drug and Alcohol Dependence 20(1) 57-62
Preusser D F Ulmer R G amp Preusser C W (1992 December) Evaluation of the impact of the drug evaluation and classification system on enforcement and adjudication DOT HS 808 058 Washington DC National Highway Traffic Safety Administration
Quintela O Crouch D J amp Andrenyak D M (2006) Recovery of drugs of abuse from the Immunalysis Quantisaltrade oral fluid collection device Journal of Analytic Toxicology 30(8) 614-616
Rana S Moore C Agrawal A Coulter C Vincent M amp Soares J (2006) Determination of propoxyphene in oral fluid Journal of Analytic Toxicology 30(8) 516-518
Ray W A Fought R L amp Decker M D (1992) Psychoactive drugs and the risk of injurious motor vehicle crashes in elderly drivers American Journal of Epidemiology 136 873-883
Robbe H amp OHanlon J (1993) Marijuana and actual driving performance DOT HS 808 078 Washington DC National Highway Traffic Safety Administration US Department of Transportation
Rodrigues W Wang G Moore C Agrawal A Vincent M amp Soares J (2008) Development and validation of ELISA and GC-MS procedures for the quantification of dextromethorphan and its main metabolite dextrorphan in urine and oral fluid Journal of Analytic Toxicology 32 1-7
Samyn N G de Boeck et al (2002) The use of oral fluid and sweat wipes for the detection of drugs of abuse in drivers Journal of Forensic Science 47(6) 1380-1387
118
2007 National Roadside Survey of Alcohol and Drug Use by Drivers Drug Results
Samyn N amp van Haeren C (2000) On-site testing of saliva and sweat with Drugwipe and determination of concentrations of drugs of abuse in saliva plasma and urine of suspected users International Journal of Legal Medicine 113(3) 150-154
Schramm W Smith R H Craig P A amp Kidwell D A (1992) Drugs of abuse in saliva A review Journal of Analytic Toxicology 16(1) 1ndash7
Shinar D (2006) Drug Effects and Their Significance for Traffic Safety Transportation Research Circular No E-C096 Drugs and Traffic A Symposium June 20-21 2005 (pp 52shy64) Woods Hole MA Transportation Research Board of the National Academies
Smiley A (1998) Marijuana On road and driving simulator studies Paper presented at the World Health Organization Geneva Switzerland
StataCorp (2006) Stata Data Analysis and Statistical Software (httpwwwstatacom)
Terhune K Ippolito C Hendricks D Michalovic J Bogema S Santinga P Blomberg R amp Preusser D (1992) The incidence and role of drugs in fatally injured drivers DOT HS 808 065 Washington DC National Highway Traffic Safety Administration
Toennes S amp Kauert G (2001) Importance of vacutainer selection in forensic toxicological analysis of drugs of abuse Journal of Analytic Toxicology 25(5) 339-343
US Department of Transportation (1968) Alcohol and highway safety Report to the US Congress Washington DC US Government Printing Office
Voas R B Wells J Lestina D Williams A amp Greene M (1998) Drinking and driving in the United States The 1996 National Roadside Survey Accident Analysis and Prevention 30(2) 267-275
Waller P Blow F Maio R Hill E Singer K and Schaefer (1995) Crash characteristics and injuries of drivers impaired by alcoholdrugs In TS-95 Proceedings of the 13th International Conference on Alcohol Drugs and Traffic Safety August 13-August 18 1995 Adelaide Australia NHMRC Road Accident Unit University of Adelaide Walsh J M Cangianelli L A Buchan B J amp Leaverton P E (2000) DUI Officer detection of illegal drugs in drivers using rapid immunoassay devices In the 15th International Council on Alcohol Drugs and Traffic Safety (ICADTS) May 22-26 2000 Stockholm Sweden ICADTS
Ward A S Kelly T H Foltin R G amp Fischman M W (1997) Effects of d-amphetamine on task performance and social behavior of humans in a residential laboratory Experimental and Clinical Psychopharmacology 5(2) 130ndash136
White J Z Clardy D O Graves M H Kuo M MacDonald B J Wiersema S J et al (1981) Testing for sedative-hypnotic drugs in the impaired driver A survey of 72000 arrests Clinical Toxicology 18(8) 945-957
Wolfe A C (1974) 1973 US National roadside breath testing survey procedures and results DOT HS 801 241 Washington DC National Highway Traffic Safety Administration
Yacoubian G Wish E D amp Peacuterez D M (2001) A comparison of saliva testing to urinalysis in an arrestee population Journal of Psychoactive Drugs 33(3) 289ndash294
119
2007 National Roadside Survey of Alcohol and Drug Use by Drivers Drug Results
120
2007 National Roadside Survey of Alcohol and Drug Use by Drivers Drug Results
Appendix A
2007 National Roadside Survey Additional Tables
121
2007 National Roadside Survey of Alcohol and Drug Use by Drivers Drug Results
122
2007 National Roadside Survey of Alcohol and Drug Use by Drivers Drug Results
Appendix A 2007 National Roadside Survey
Additional Tables
Table 141 Nighttime Blood Results and Agreement With Self-Reported by Drug Type (Blood)
Drug Category Self-Reported
Drug Use
Blood Positive for this Drug
N (Unweighted)
(Weighted)
Antidepressants
Past 24 Hours Past 2 Days Past Month Past Year Over a Year Never
41 814 1 08 1 02 0 00 1 24
13 152 Overall 57 1000
Amphetamines
Past 24 Hours Past 2 Days Past Month Past Year Over a Year Never
1 31 0 00 3 129 1 125 8 109
38 605 Overall 51 1000
Barbiturates
Past 24 Hours Past 2 Days Past Month Past Year Over a Year Never
2 13 0 00 0 00 0 00 0 00 6 987
Overall 8 1000
Benzodiazepines
Past 24 Hours Past 2 Days Past Month
Past Year Over a Year Never
11 215 4 38 4 80 3 20 5 21
36 626 Overall 63 1000
Cocaine Past 24 Hours 4 29 Past 2 Days 2 108 Past Month 5 170 Past Year 1 10 Over a Year 6 106
123
2007 National Roadside Survey of Alcohol and Drug Use by Drivers Drug Results
Drug Category Self-Reported
Drug Use
Never
Blood Positive for this Drug
N (Unweighted)
(Weighted)
23 577 Overall 41 1000
Cough Suppressants
Past 24 Hours
Past 2 Days
Past Month
Past Year
Over a Year
Never
2 157
1 222
1 606
0 00
0 00
1 14
Overall 5 1000
Ketamine
Past 24 hrs Past 2 days Past Month Past Year Over a Year Never
0 00 0 00 0 00 0 00 0 00 1 1000
Overall 1 1000
Marijuana
Past 24 hrs Past 2 days Past Month Past Year Over a Year Never
59 371 18 54 38 162 22 68 27 93 63 252
Overall 227 1000
Methadone
Past 24 hrs Past 2 days Past Month Past Year Over a Year Never
6 980 0 00 0 00 0 00 0 00 1 20
Overall 7 1000
Opiates
Past 24 hrs Past 2 days Past Month Past Year Over a Year Never
7 227 6 131 3 240 8 37 8 163
17 204 Overall 49 1000
Pain Killers
Past 24 hrs Past 2 days Past Month Past Year Over a Year Never
13 730 3 14 5 230 1 13 2 07 2 06
Overall 26 1000
124
2007 National Roadside Survey of Alcohol and Drug Use by Drivers Drug Results
Drug Category
PCP
Self-Reported Drug Use
Past 24 hrs Past 2 days Past Month Past Year Over a Year Never
Blood Positive for this Drug
N (Unweighted)
(Weighted)
0 NA 0 NA 0 NA 0 NA 0 NA 0 NA
Overall 0 NA
Table 142 Nighttime Seat Belt Observation by Drug Prevalence (Blood)
Drug Drug N Negative Positive
(Unweighted) (Weighted) (Weighted
Driver Seat Belt Observation Yes 3159 865 135 No 106 758 242
Table 143 Nighttime Seat Belt Observation by Drug Class (Percentages Calculated by Row) (Blood)
N (Un
wei
gh
ted
)
An
tid
epre
ssa
nts
(W
eig
hte
d)
Mar
ijuan
a (W
eig
hte
d)
Nar
coti
c-A
nal
ges
ic
(Wei
gh
ted
)
Sed
ativ
es
(Wei
gh
ted
)
Sti
mu
lan
ts(W
eig
hte
d)
Oth
er(W
eig
hte
d)
gt1
Dru
g C
lass
(W
eig
hte
d)
Neg
ativ
e (W
eig
hte
d)
Driver Seat Belt Observation Yes 3156 11 65 08 12 18 03 19 865 No 106 02 139 31 00 44 00 25 758
125
N
(Un
wei
gh
ted
)
An
tid
epre
ssa
nts
(W
eig
hte
d)
Mar
ijuan
a
(Wei
gh
ted
)
Nar
coti
c-A
nal
ge
sic
(W
eig
hte
d)
Sed
ativ
es
(W
eig
hte
d)
Sti
mu
lan
ts
(Wei
gh
ted
)
Oth
er
(Wei
gh
ted
)
gt1
Dru
g C
lass
(W
eig
hte
d)
Neg
ativ
e
(Wei
gh
ted
)
Motorcycle Riders (Operators) 48 085 473 000 713 1070 058 000 7600 Helmet 37 124 192 000 1034 156 084 000 8410 No Helmet Use 9 000 1152 000 000 3253 000 000 5595 Unknown 2 000 000 000 000 000 000 000 10000
2007 National Roadside Survey of Alcohol and Drug Use by Drivers Drug Results
Table 144 Nighttime Seat Belt Observation by Drug Category (Blood)
N (Unwtd)
Illegal
(Weighted)
Medications (Weighted)
Illegal amp Medications (Weighted)
Negative
(Weighted) Driver Seat Belt Observation
Yes 3156 881 400 066 8653 No 106 2025 339 055 7581
Table 145 Nighttime Helmet Use for Motorcycle Riders (Operators) by Drug Positive (Blood)
N (Unweighted)
Drug Positive (Weighted)
Motorcycle Riders (Operators) Helmet
48 37
2400 1590
No Helmet Use 9 4405 Unknown 2 000
Table 146 Nighttime Helmet Use for Motorcycle Riders (Operators) by Drug Class (Percentages Calculated by Row) (Blood)
Table 147 Nighttime Helmet Use for Motorcycle Riders (Operators) by Drug Category (Percentages Calculated by Row) (Blood)
N (Unwtd)
Illegal
(Weighted)
Medications (Weighted)
Illegal amp Medications (Weighted)
Negative
(Weighted)
Motorcycle Riders (Operators) 48 1543 857 000 7600 Helmet 37 348 1242 000 8410 No Helmet Use 9 4405 000 000 5595 Unknown 2 000 000 000 10000
126
N
(Un
wei
gh
ted
)
An
tid
epre
ssa
nts
(W
eig
hte
d)
Mar
ijuan
a
(Wei
gh
ted
)
Nar
coti
c-A
nal
ge
sic
(W
eig
hte
d)
Sed
ativ
es
(W
eig
hte
d)
Sti
mu
lan
ts
(Wei
gh
ted
)
Oth
er
(Wei
gh
ted
)
gt1
Dru
g C
lass
(W
eig
hte
d)
Neg
ativ
e
(Wei
gh
ted
)
Yes 122 16 109 04 02 104 00 82 683 No 3080 11 65 09 11 16 03 18 868 Total 3202 11 67 09 10 19 03 20 861
2007 National Roadside Survey of Alcohol and Drug Use by Drivers Drug Results
Table 148 Nighttime Arrests and Drug Positives (Blood) ldquoDuring the past 12 months were you arrested and booked for driving under the influence of alcohol or drugsrdquo
N Drug Positive (Unweighted) (Weighted)
Yes 122 317 No 3080 132 Total 3202 139
(p lt 01)
Table 149 Nighttime Arrests and Drug Class (Blood) ldquoDuring the past 12 months were you arrested and booked for driving under the influence of alcohol or drugsrdquo
Table 150 Nighttime Arrests and Drug Categories (Blood) ldquoDuring the past 12 months were you arrested and booked for driving under the influence of alcohol or drugsrdquo
N (Unwtd)
Illegal
(Weighted)
Medications (Weighted)
Illegal amp Medications (Weighted)
Negative
(Weighted) Yes 122 223 36 58 683 No 3080 87 41 04 868 Total 3202 92 41 06 861
Table 151 Nighttime Past Treatment Program and Drug Positive (Blood) ldquoDuring the past 12 months did you ever stay at least overnight in an inpatient or residential drug or alcohol
treatment programrdquo
N (Unweighted)
Drug Positive (Weighted)
Yes 31 220 No 3065 137 Total 3096 138
127
N (Un
wei
gh
ted
)
An
tid
epre
ssa
nts
(Wei
gh
ted
)
Mar
ijuan
a(W
eig
hte
d)
Nar
coti
c-A
nal
ge
sic
(Wei
gh
ted
)
Sed
ativ
es
(Wei
gh
ted
)
Sti
mu
lan
ts
(Wei
gh
ted
)
Oth
er(W
eig
hte
d)
gt1
Dru
g C
lass
(
Wei
gh
ted
)
Neg
ativ
e (W
eig
hte
d)
Yes 31 00 22 15 09 24 00 150 780 No 3065 11 68 09 11 17 03 18 863 Total 3096 11 68 09 11 17 03 19 862
2007 National Roadside Survey of Alcohol and Drug Use by Drivers Drug Results
Table 152 Nighttime Inpatient and Drug Class (Blood) ldquoDuring the past 12 months did you ever stay at least overnight in an impatient or residential drug or alcohol treatment program for
example detox rehab a therapeutic community or a hospitalrdquo
Table 153 Nighttime Inpatient and Drug Category (Blood) ldquoDuring the past 12 months did you ever stay at least overnight in an impatient or residential drug or alcohol treatment program for
example detox rehab a therapeutic community or a hospitalrdquo
N (Unwtd)
Illegal
(Weighted)
Medications (Weighted)
Illegal amp Medications (Weighted)
Negative
(Weighted) Yes 31 46 25 150 780 No 3065 93 39 04 863 Total 3096 93 39 06 862
Table 154 Nighttime Outpatient and Drug Positive (Blood) ldquoHave you ever been admitted to an outpatient drug or alcohol treatment program NOT including meetings like AA or NArdquo
Yes
N (Unweighted)
109
Drug Positive (Weighted)
223 No 3089 135 Total 3198 137
128
N
(Un
wei
gh
ted
)
An
tid
epre
ssa
nts
(W
eig
hte
d)
Mar
ijuan
a
(Wei
gh
ted
)
Nar
coti
c-A
nal
ge
sic
(W
eig
hte
d)
Sed
ativ
es
(W
eig
hte
d)
Sti
mu
lan
ts
(Wei
gh
ted
)
Oth
er
(Wei
gh
ted
)
gt1
Dru
g C
lass
(W
eig
hte
d)
Neg
ativ
e
(Wei
gh
ted
)
Yes 109 21 89 06 03 93 00 11 777 No 3089 11 66 09 11 15 03 20 865 Total 3198 11 67 09 10 17 03 20 863
N (Unweighted)
Drug Positive (Weighted)
Yes 74 262 No 3120 134 Total 3194 138
(p lt 01)
2007 National Roadside Survey of Alcohol and Drug Use by Drivers Drug Results
Table 155 Nighttime Outpatient and Drug Class (Blood) ldquoHave you ever been admitted to an outpatient drug or alcohol treatment program NOT including meetings like AA or NArdquo
Table 156 Nighttime Outpatient and Categories (Blood) ldquoHave you ever been admitted to an outpatient drug or alcohol treatment program NOT including meetings like AA or NArdquo
N (Unwtd)
Illegal
(Weighted)
Medications (Weighted)
Illegal amp Medications (Weighted)
Negative
(Weighted) Yes 109 185 30 08 777 No 3089 89 40 06 865 Total 3198 91 40 06 863
Table 157 Nighttime AA or NA and Drug Positives (Blood) ldquoDuring the past 12 months have you received treatment for your drug or alcohol use in a self-help group such as AA or NArdquo
129
N
(Un
wei
gh
ted
)
An
tid
epre
ssa
nts
(W
eig
hte
d)
Mar
ijuan
a
(Wei
gh
ted
)
Nar
coti
c-A
nal
ge
sic
(W
eig
hte
d)
Sed
ativ
es
(W
eig
hte
d)
Sti
mu
lan
ts
(Wei
gh
ted
)
Oth
er
(Wei
gh
ted
)
gt1
Dru
g C
lass
(W
eig
hte
d)
Neg
ativ
e
(Wei
gh
ted
)
Yes 74 00 171 11 03 53 00 23 738 No 3120 11 64 09 11 16 03 20 866
1 Total 3194 1 67 09 10 17 03 20 862
2007 National Roadside Survey of Alcohol and Drug Use by Drivers Drug Results
Table 158 Nighttime AA or NA and Class (Blood) ldquoDuring the past 12 months have you received treatment for your drug or alcohol use in a self-help group such as AA or NArdquo
Table 159 Nighttime AA or NA and Drug Categories (Blood) ldquoDuring the past 12 months have you received treatment for your drug or alcohol use in a self-help group such as AA or NArdquo
N (Unwtd)
Illegal
(Weighted)
Medications (Weighted)
Illegal amp Medications (Weighted)
Negative
(Weighted) Yes 74 225 33 04 738 No 3120 88 40 06 866 Total 3194 92 40 06 862
130
2007 National Roadside Survey of Alcohol and Drug Use by Drivers Drug Results
131
2007 National Roadside Survey of Alcohol and Drug Use by Drivers Drug Results
132
DOT HS 811 249December 2009

2007 National Roadside Survey of Alcohol and Drug Use by Drivers Drug Results
iv
Executive Summary 1
Methodology1 Results3 Summary 8
Introduction9 Background9 Prevalence of Drug-Involved Driving 10 Impact of Drugs on Driving Skills10
Laboratory Studies 10 Field Data11
Challenges in Measurement and Todayrsquos Drug Testing Opportunities13 Project Objectives 14
Methods17 Survey Sampling Procedures 17 Preparation for the 2007 NRS Survey 20 Driver Conversion23 Selection of Drugs for Screening and Analysis 24 Oral Fluid Collection Device 27 Blood Collection Procedures 29 Drug Questionnaire31
Oral Fluid Sample Analysis Procedures 32 Gas Chromatography-Mass Spectrometry (GCMS)32 Liquid Chromatography-Tandem Mass Spectrometry (LCMS-MS)32 Blood Sample Analysis Procedures 33 Ethanol (Oral Fluid and Blood) 33
Drug Classes and Categories 33 Results37
Oral Fluid Results (Daytime and Nighttime Samples) 37 Driver Drug Use Prevalence Based on Oral Fluid Results 37 Driver Drug Use Prevalence by Drug Class Based on Oral Fluid Results 44 Driver Drug Use Prevalence by Drug Category Based on Oral Fluid Results 48 Driver Drug Prevalence Based on Oral Fluid and BAC Results 53 Drugs Oral Fluid Results and Agreement With Self-Reported Drug Use59 Observed Safety Measures of Daytime and Nighttime Drivers (Oral Fluid) 62 Reported Contact With the Criminal Justice System (Oral Fluid) 66 Reported Contact With the Health System (Oral Fluid)69
Blood Results (Nighttime Samples)76 Driver Drug Use Prevalence Based on Blood Results76 Driver Drug Use Prevalence by Drug Class Based on Blood Results80 Driver Drug Use Prevalence by Drug Category Based on Blood Results82 Driver Drug Use Prevalence From Blood and BAC Results85
Oral Fluid andor Blood Results (Nighttime Samples)89 Driver Drug Use Prevalence Based on Oral Fluid andor Blood Results 89
2007 National Roadside Survey of Alcohol and Drug Use by Drivers Drug Results
Table of Contents
v
2007 National Roadside Survey of Alcohol and Drug Use by Drivers Drug Results
Driver Drug Use Prevalence by Drug Class Based on Oral Fluid andor Blood Results 94 Driver Drug Use Prevalence by Drug Category Based on Oral Fluid andor Blood Results 96 Driver Drug Use Prevalence From Oral Fluid andor Blood and BAC Results 98
Individual Drug Prevalence Estimates from Oral Fluid and Oral Fluid andor Blood Combined102
Overall Individual Drug Prevalence in Daytime and Nighttime 103 Individual Drug Prevalence in Nighttime Oral Fluid andor Blood 105 Individual Drug Prevalence Sorted by Drug Type from Oral Fluid and Oral Fluid andor Blood Combined107
Discussion111 Oral Fluid Analyses 111 Blood Analyses 113 Oral Fluid andor Blood Analyses Combined114
References115 Appendix A121
2007 National Roadside Survey Additional Tables122
Tables Table 1 Participating Drivers (Percentages in Parentheses) 3 Table 2 Drug Prevalence by Time of Day (Oral Fluid) 3 Table 3 Drug Categories Distribution by Time of Day (Oral Fluid) 4 Table 4 BAC Among Drug-Positive Drivers by Drug Category and Time of Day (Oral Fluid) 5 Table 5 Drug Classes by Time of Day and Region (Oral Fluid) 6 Table 6 Number and Distribution of Drug Classes by Time of Day (Oral Fluid) 6 Table 7 Drug Categories Distribution (Blood) 7 Table 8 BAC Among Drug-Positive Drivers by Drug Category (Percentage by Row) (Blood)7 Table 9 Comparison of Number of Nighttime Participants by Year in the National Roadside
Surveys21 Table 10 Participating Drivers (Percentages in Parentheses) 22 Table 11 Oral Fluid Analysis Results Among Converted Drivers 23 Table 12 Blood Analysis Results Among Converted Drivers 23 Table 13 Selected Drugs and Minimum Detection Concentrationsdagger24 Table 14 Extraction Efficiency of Quantisaltrade Oral Fluid Collection Device Over a Range of
Drugs Quintela29 Table 15 Extraction Efficiency of Quantisaltrade Oral Fluid Collection Device Over a Range of
Drugs Moore 29 Table 16 Drug Questionnaire Survey 31 Table 17 Drug Class CompositionmdashOral Fluid and Blood Combined 34 Table 18 Drug Category CompositionmdashOral Fluid and Blood Combined 35 Table 19 Drug Prevalence by Time of Day (Oral Fluid) 38 Table 20 Drug Prevalence by Time of DaySession (Oral Fluid)38 Table 21 Drug Prevalence by Time of Day and Region (Oral Fluid)39 Table 22 Drug Prevalence by Time of Day and Gender (Oral Fluid) 39 Table 23 Drug Prevalence by Time of Day and Age (Oral Fluid)40 Table 24 Drug Prevalence by Time of Day Age and Gender (Oral Fluid)41
vi
2007 National Roadside Survey of Alcohol and Drug Use by Drivers Drug Results
Table 25 Drug Prevalence by RaceEthnicity (Oral Fluid)42 Table 26 Drug Prevalence by Education Level (Oral Fluid) 42 Table 27 Drug Prevalence by Employment Status (Oral Fluid) 43 Table 28 Drug Prevalence by Vehicle Type (Oral Fluid)44 Table 29 Number and Distribution of Drug Classes by Time of Day (Oral Fluid) 44 Table 30 Number and Distribution of Drug Classes by Time of Day (Drug Positives Only)
(Oral Fluid) 45 Table 31 Drug Classes by Time of Day and Region (Oral Fluid) 46 Table 32 Drug Classes Distribution by Time of Day and Gender (Oral Fluid)47 Table 33 Drug Class Distribution by Time of Day and Age (Oral Fluid) 48 Table 34 Drug Categories Distribution by Time of Day (Oral Fluid) 49 Table 35 Drug Categories Distribution by Time of Day and Region (Oral Fluid)50 Table 36 Drug Categories Distribution by Time of Day and Gender (Oral Fluid)51 Table 37 Drug Categories Distribution by Time of Day and Age (Oral Fluid)52 Table 38 Drug Prevalence by Time of Day and BAC (Percentages Calculated by Row)
(Oral Fluid) 54 Table 39 Drug Prevalence by Time of Day and BAC
(Percentages Calculated by Column) (Oral Fluid)54 Table 40 BAC Among Drug-Positive Drivers by Time of Day and Age (Oral Fluid)55 Table 41 BAC Among Drug-Positive Drivers by Number of Drug Classes and Time of Day
(Percentages Calculated by Column) (Oral Fluid)55 Table 42 BAC Among Drug-Positive Drivers by Number of Drug Classes and Time of Day
(Percentages Calculated by Row) (Oral Fluid)56 Table 43 BAC Among Drug-Positive Drivers by Drug Category and Time of Day
(Oral Fluid) 56 Table 44 BAC of Drivers by Drug Category Age and Time of Day (Oral Fluid)57 Table 45 BAC of Drivers by Drug Category Gender and Time of Day (Oral Fluid)58 Table 46 Oral Fluid Results and Agreement With Self-Reported by Drug Type (Oral Fluid) 60 Table 47 Daytime Seat Belt Observation By Drug Prevalence (Oral Fluid)62 Table 48 Nighttime Seat Belt Observation by Drug Prevalence (Oral Fluid) 62 Table 49 Daytime Seat Belt Observation by Drug Class (Percentages Calculated by Row)
(Oral Fluid) 63 Table 50 Nighttime Seat Belt Observation by Drug Class (Percentages Calculated by Row)
(Oral Fluid) 63 Table 51 Daytime Seat Belt Observation by Drug Category (Percentages Calculated by Row)
(Oral Fluid) 64 Table 52 Nighttime Belt Observation by Drug Category (Percentages Calculated by Row)
(Oral Fluid) 64 Table 53 Daytime Helmet Use for Motorcycle Riders (Operators) by Drug Positive
(Oral Fluid) 64 Table 54 Nighttime Helmet Use for Motorcycle Riders (Operators) by Drug Positive
(Oral Fluid) 65 Table 55 Daytime Helmet Use for Motorcycle Riders (Operators) by Drug Class
(Oral Fluid) 65 Table 56 Nighttime Helmet Use for Motorcycle Riders (Operators) by Drug Class
(Percentages Calculated by Row) (Oral Fluid)65
vii
2007 National Roadside Survey of Alcohol and Drug Use by Drivers Drug Results
Table 57 Daytime Helmet Use for Motorcycle Riders (Operators) by Drug Category (Oral Fluid) 66
Table 58 Nighttime Helmet Use for Motorcycle Riders (Operators) by Drug Category (Percentages Calculated by Row) (Oral Fluid)66
Table 59 Arrests and Drug Positives Daytime (Oral Fluid) ldquoDuring the past 12 months were you arrested and booked for driving under the influence of alcohol or drugsrdquo66
Table 60 Arrests and Drug Positives Nighttime (Oral Fluid) ldquoDuring the past 12 months were you arrested and booked for driving under the influence of alcohol or drugsrdquo67
Table 61 Arrests and Drug Class Daytime (Oral Fluid) ldquoDuring the past 12 months were you arrested and booked for driving under the influence of alcohol or drugsrdquo67
Table 63 Arrests and Drug Categories Daytime (Oral Fluid) ldquoDuring the past 12 months were you arrested and booked for driving under the influence of alcohol or drugsrdquo68
Table 64 Arrests and Drug Categories Nighttime (Oral Fluid) ldquoDuring the past 12 months were you arrested and booked for driving under the influence of alcohol or drugrdquo 68
Table 65 Past Treatment Program and Drug Positive Daytime (Oral Fluid) ldquoDuring the past 12 months did you ever stay at least overnight in an inpatient or residential drug or alcohol treatment programrdquo 69
Table 66 Past Treatment Program and Drug Positive Nighttime (Oral Fluid) ldquoDuring the past 12 months did you ever stay at least overnight in an inpatient or residential drug or alcohol treatment programrdquo69
Table 67 Outpatient and Drug Positive Daytime (Oral Fluid) ldquoHave you ever been admitted to an outpatient drug or alcohol treatment program NOT including meetings like AA or NArdquo 70
Table 68 Outpatient and Drug Positive Nighttime (Oral Fluid) ldquoHave you ever been admitted to an outpatient drug or alcohol treatment program NOT including meetings like AA or NArdquo 70
Table 69 AA or NA and Drug Positives Daytime (Oral Fluid) ldquoDuring the past 12 months have you received treatment for your drug or alcohol use in a self-help group such as Alcoholics Anonymous or Narcotics Anonymousrdquo70
Table 70 AA or NA and Drug Positives Nighttime (Oral Fluid) ldquoDuring the past 12 months have you received treatment for your drug or alcohol use in a self-help group such as Alcoholics Anonymous of Narcotics Anonymousrdquo71
Table 71 Inpatient and Drug Class Daytime (Oral Fluid) ldquoDuring the past 12 months did you ever stay at least overnight in an impatient or residential drug or alcohol treatment program for example detox rehab a therapeutic community or a hospitalrdquo71
Table 72 Inpatient and Drug Class Nighttime (Oral Fluid) ldquoDuring the past 12 months did you ever stay at least overnight in an impatient or residential drug or alcohol treatment program for example detox rehab a therapeutic community or a hospitalrdquo72
Table 73 Inpatients and Drug Category Daytime (Oral Fluid) ldquoDuring the past 12 months were you arrested and booked for driving under the influence of alcohol or drugsrdquo72
Table 74 Inpatients and Drug Category Nighttime (Oral Fluid) ldquoDuring the past 12 months were you arrested and booked for driving under the influence of alcohol or drugsrdquo72
Table 75 Outpatient and Drug Class Daytime (Oral Fluid) ldquoHave you ever been admitted to an outpatient drug or alcohol treatment program NOT including meetings like AA or NArdquo 73
viii
2007 National Roadside Survey of Alcohol and Drug Use by Drivers Drug Results
Table 76 Outpatient and Drug Class Nighttime (Oral Fluid) ldquoHave you ever been admitted to an outpatient drug or alcohol treatment program NOT including meetings like AA or NArdquo 73
Table 77 Outpatient and Categories Daytime (Oral Fluid) ldquoHave you ever been admitted to an outpatient drug or alcohol treatment program NOT including meetings like AA or NArdquo 74
Table 78 Outpatient and Categories Nighttime (Oral Fluid) ldquoHave you ever been admitted to an outpatient drug or alcohol treatment program NOT including meetings like AA or NArdquo 74
Table 79 AA NA and Classes Daytime (Oral Fluid) ldquoDuring the past 12 months have you received treatment for your drug or alcohol use in a self-help group such as AA or NArdquo74
Table 80 AA NA and Classes Nighttime (Oral Fluid) ldquoDuring the past 12 months have you received treatment for your drug or alcohol use in a self-help group such as AA or NArdquo75
Table 81 NA AA and Drug Categories Daytime (Oral Fluid) ldquoDuring the past 12 months have you received treatment for your drug or alcohol use in a self-help group such as AA or NArdquo 75
Table 82 NA AA and Drug Categories Nighttime (Oral Fluid) ldquoDuring the past 12 months have you received treatment for your drug or alcohol use in a self-help group such as AA or NArdquo 76
Table 83 Drug Prevalence by Time of Day (Blood)76 Table 84 Drug Prevalence by Session (Blood) 77 Table 85 Drug Prevalence by Region (Blood)77 Table 86 Drug Prevalence by Gender (Blood) 77 Table 87 Drug Prevalence by Age (Blood)78 Table 88 Drug Prevalence by Age and Gender (Blood) 78 Table 89 Drug Prevalence by RaceEthnicity (Blood) 78 Table 90 Drug Prevalence by Education Level (Blood)79 Table 91 Drug Prevalence by Employment Status (Blood)79 Table 92 Drug Prevalence by Vehicle Type (Blood)80 Table 93 Number and Distribution of Drug Classes (Blood) 80 Table 94 Drug Classes Distribution by Region (Blood)81 Table 95 Drug Classes Distribution by Gender (Blood)81 Table 96 Drug Classes Distribution by Age (Blood)82 Table 97 Drug Categories Distribution (Blood) 82 Table 98 Drug Categories Distribution by Region (Blood)83 Table 99 Drug Categories Distribution by Gender (Blood)84 Table 100 Drug Categories Distribution by Age (Blood)85 Table 101 Drug Prevalence by BAC (Percentages Calculated by Row) (Blood)86 Table 102 Drug Prevalence by BAC (Percentages Calculated by Column) (Blood) 86 Table 103 BAC Among Drug-Positive Drivers by Age (Blood)86 Table 104 BAC Among Drug-Positive Drivers by Number of Drug Classes
(Percentages Calculated by Column) (Blood) 87 Table 105 BAC Among Drug-Positive Drivers by Number of Drug Classes
(Percentages Calculated by Row) (Blood)87 Table 106 BAC Among Drug-Positive Drivers by Drug Category
(Percentage by Row) (Blood) 87 Table 107 BAC Among Drug-Positive Drivers by Drug Category
(Percentage by Column) (Blood) 88
ix
2007 National Roadside Survey of Alcohol and Drug Use by Drivers Drug Results
Table 108 BAC of Drivers by Drug Category and Age (Blood) 88 Table 109 BAC of Drivers by Drug Category and Gender (Blood) 89 Table 110 Nighttime Drug Prevalence by Time of Day (Oral Fluid andor Blood)90 Table 111 Drug Prevalence by Session (Oral Fluid andor Blood) 90 Table 112 Drug Prevalence by Region (Oral Fluid andor Blood)90 Table 113 Drug Prevalence by Gender (Oral Fluid andor Blood)91 Table 114 Drug Prevalence by Age (Oral Fluid andor Blood)91 Table 115 Drug Prevalence by Age and Gender (Oral Fluid andor Blood) 92 Table 116 Drug Prevalence by RaceEthnicity (Oral Fluid andor Blood)92 Table 117 Drug Prevalence by Education Level (Oral Fluid andor Blood) 93 Table 118 Drug Prevalence by Employment Status (Oral Fluid andor Blood) 93 Table 119 Drug Prevalence by Vehicle Type (Oral Fluid andor Blood)93 Table 120 Number and Distribution of Drug Classes (Oral Fluid andor Blood) 94 Table 121 Number and Distribution of Drug Classes (Drug Positives Only)
(Oral Fluid andor Blood) 94 Table 122 Drug Classes Distribution by Region (Oral Fluid andor Blood) 95 Table 123 Drug Classes Distribution by Gender (Oral Fluid andor Blood)95 Table 124 Drug Classes Distribution by Age (Oral Fluid andor Blood) 96 Table 125 Drug Categories Distribution (Oral Fluid andor Blood)96 Table 126 Drug Categories Distribution by Region (Oral Fluid andor Blood) 97 Table 127 Drug Categories by Gender (Oral Fluid andor Blood) 97 Table 128 Drug Categories Distribution by Age (Oral Fluid andor Blood)98 Table 129 Drug Prevalence by BAC (Percentages Calculated by Row)
(Oral Fluid andor Blood) 99 Table 130 Drug Prevalence by BAC (Percentages Calculated by Column)
(Oral Fluid andor Blood) 99 Table 131 BAC Among Drug-Positive Drivers by Age (Oral Fluid andor Blood)99 Table 132 BAC Among Drug-Positive Drivers by Number of Drug Classes
(Percentages Calculated by Column) (Oral Fluid andor Blood)100 Table 133 BAC Among Drug-Positive Drivers by Number of Drug Classes
(Percentages Calculated by Row) (Oral Fluid andor Blood)100 Table 134 BAC Among Drug-Positive Drivers by Drug Category
(Oral Fluid andor Blood) 100 Table 135 BAC of Drivers by Drug Category and Age (Oral Fluid andor Blood) 101 Table 136 BAC of Drivers by Drug Category and Gender (Oral Fluid andor Blood) 102 Table 137 Prevalence of Drugs in Daytime and Nighttime Drivers (Oral Fluid)104 Table 138 Prevalence of Drugs in All Drug-Tested Nighttime Drivers
(Oral Fluid andor Blood) 106 Table 139 Prevalence of Drugs in Daytime and Nighttime Drivers (Oral Fluid)108 Table 140 Prevalence of Drugs in All Drug-Tested Nighttime Drivers (Oral Fluid andor Blood) 109 Table 141 Nighttime Blood Results and Agreement With Self-Reported by
Drug Type (Blood)123 Table 142 Nighttime Seat Belt Observation by Drug Prevalence (Blood)125 Table 143 Nighttime Seat Belt Observation by Drug Class
(Percentages Calculated by Row) (Blood)125
x
2007 National Roadside Survey of Alcohol and Drug Use by Drivers Drug Results
Table 144 Nighttime Seat Belt Observation by Drug Category (Blood)126 Table 145 Nighttime Helmet Use for Motorcycle Riders (Operators)
by Drug Positive (Blood) 126 Table 146 Nighttime Helmet Use for Motorcycle Riders (Operators) by Drug Class
(Percentages Calculated by Row) (Blood)126 Table 147 Nighttime Helmet Use for Motorcycle Riders (Operators) by Drug Category
(Percentages Calculated by Row) (Blood)126 Table 148 Nighttime Arrests and Drug Positives (Blood) ldquoDuring the past 12 months
were you arrested and booked for driving under the influence of alcohol or drugsrdquo127 Table 149 Nighttime Arrests and Drug Class (Blood) ldquoDuring the past 12 months
were you arrested and booked for driving under the influence of alcohol or drugsrdquo127 Table 150 Nighttime Arrests and Drug Categories (Blood) ldquoDuring the past 12 months
were you arrested and booked for driving under the influence of alcohol or drugsrdquo127 Table 151 Nighttime Past Treatment Program and Drug Positive (Blood)
ldquoDuring the past 12 months did you ever stay at least overnight in an inpatient or residential drug or alcohol treatment programrdquo 127
Table 152 Nighttime Inpatient and Drug Class (Blood) ldquoDuring the past 12 months did you ever stay at least overnight in an impatient or residential drug or alcohol treatment program for example detox rehab a therapeutic community or a hospitalrdquo128
Table 153 Nighttime Inpatient and Drug Category (Blood) ldquoDuring the past 12 months did you ever stay at least overnight in an impatient or residential drug or alcohol treatment program for example detox rehab a therapeutic community or a hospitalrdquo128
Table 154 Nighttime Outpatient and Drug Positive (Blood) ldquoHave you ever been admitted to an outpatient drug or alcohol treatment program NOT including meetings like AA or NArdquo128
Table 155 Nighttime Outpatient and Drug Class (Blood) ldquoHave you ever been admitted to an outpatient drug or alcohol treatment program NOT including meetings like AA or NArdquo 129
Table 156 Nighttime Outpatient and Categories (Blood) ldquoHave you ever been admitted to an outpatient drug or alcohol treatment program NOT including meetings like AA or NArdquo 129
Table 157 Nighttime AA or NA and Drug Positives (Blood) ldquoDuring the past 12 months have you received treatment for your drug or alcohol use in a self-help group such as AA or NArdquo129
Table 158 Nighttime AA or NA and Class (Blood) ldquoDuring the past 12 months have you received treatment for your drug or alcohol use in a self-help group such as AA or NArdquo 130
Table 159 Nighttime AA or NA and Drug Categories (Blood) ldquoDuring the past 12 months have you received treatment for your drug or alcohol use in a self-help group such as AA or NArdquo 130
Figures Figure 1 Map of Sixty 2007 National Roadside Survey Sites 19 Figure 2 Collecting an Oral Fluid Sample with the Quantisaltrade Oral Fluid Collection Device 28
xi
2007 National Roadside Survey of Alcohol and Drug Use by Drivers Drug Results
xii
2007 National Roadside Survey of Alcohol and Drug Use by Drivers Drug Results
Executive Summary This report presents the first US national prevalence estimate of drug-involved driving It is based on the results of analyses of oral fluid blood and breath specimens collected during the 2007 National Roadside Survey of Alcohol and Drug Use by Drivers It is one of the three reports that summarize the results of a 2007 study conducted by the Pacific Institute for Research and Evaluation (PIRE) for the National Highway Traffic Safety Administration (NHTSA) under Contract DTNH22-06-C-00040 ldquo2007 Roadside Survey of Alcohol and Drugged Drivingrdquo There are two prior reports on the 2007 National Roadside Survey (NRS) (1) ldquo2007 National Roadside Survey of Alcohol and Drug Use by Drivers Methodologyrdquo (Lacey Kelley-Baker Furr-Holden Voas Moore Brainard Tippetts Romano Torres amp Berning 2009a) which describes the sampling plan and data collection methodology and summarizes the response patterns to the various stages of the multi-part survey and (2) ldquo2007 National Roadside Survey of Alcohol and Drug Use by Drivers Alcohol Resultsrdquo (Lacey Kelley-Baker Furr-Holden Voas Romano Tippetts Ramirez Brainard amp Berning 2009b) which presents the prevalence estimates for alcohol-involved driving derived from the study and compares those estimates with data from the three previous National Roadside Surveys
Methodology Three prior national roadside surveys of drivers to estimate prevalence of drinking and driving and determine changes over time have been conducted in the United States These surveys which included a brief interview and a breath sample to determine blood alcohol concentration (BAC) were conducted on a stratified random sample of weekend nighttime drivers in the 48 contiguous States The first National Roadside Survey (NRS) sponsored by NHTSA was conducted in 1973 (Wolfe 1974) The second NRS was sponsored by the Insurance Institute for Highway Safety (IIHS) and conducted in 1986 (Lund amp Wolfe 1991) and the third jointly funded by IIHS and NHTSA was conducted in 1996 (Voas Wells Lestina Williams amp Greene 1998) NHTSA sponsored the 2007 NRS described in this report with additional funding from the National Institute on Alcohol Abuse and Alcoholism (NIAAA) the National Institute on Drug Abuse (NIDA) and the National Institute of Justice (NIJ) Like its predecessors the 2007 NRS covered the 48 contiguous States
As in previous NRS studies the 2007 NRS data were collected during the following periods on both Friday and Saturday nights 10 pm to midnight and 1 am to 3 am1 In addition the 2007 survey also included a Friday daytime data collection period either from 930 am to 1130 am or from 130 pm to 330 pm The prior three surveys did not include commercial vehicles and motorcycles in the sample this survey however included motorcycles In addition to a daytime survey and the inclusion of motorcycles the 2007 NRS included other features that the prior surveys did not (1) more data collectors per survey site to achieve a larger sample size (2) the collection of biological samples (oral fluid and blood) to determine the presence of drugs other than alcohol in the driving population (3) a questionnaire to allow an estimation of alcohol use disorders (AUDs) among drinking drivers (4) a questionnaire to study driversrsquo patterns of drug
1 In this report a ldquoFriday nightrdquo or a ldquoSaturday nightrdquo includes the early hours of the following day
1
2007 National Roadside Survey of Alcohol and Drug Use by Drivers Drug Results
consumption (5) questions about interaction with the criminal justice system and the treatment system and (6) collection of information on passengers
In all four NRS studies police officers directed vehicles to a safe location where an interviewer approached the driver and requested participation in a survey followed by a breath test Random selection of drivers was insured by selecting the next vehicle when an interviewer became available Any driver suspected of impairment was subjected to a safety protocol designed to dissuade hisher continued driving on that trip See the Methodology Report for details (Lacey et al 2009a)
As noted above the original 1973 survey used a four-stage sampling plan and the 1986 NRS attempted to replicate the 1973 locations In the 1996 and 2007 surveys the first stage was taken from the NHTSArsquos National Automotive Sampling SystemCrashworthiness Data System (NASSCDS 1995) The second stage involved the selection of police jurisdictions within the NASSCDS primary sampling units The third stage of the sampling design involved the selection of survey sites within police jurisdictions and the fourth stage consisted of selecting drivers at random from the traffic flow at these sites Details regarding the sampling plan can be found in the Methodology Report (Lacey et al 2009a)
New to the 2007 survey was the collection of additional types of biological samples (oral fluid and blood) to determine the presence of drugs other than alcohol in the driving population Oral fluid and blood samples were analyzed in a laboratory using enzyme-linked immunosorbent assay (ELISA) screening followed by a confirmatory analysis by Liquid Chromatography-Tandem Mass Spectrometry (LCMS-MS) or Gas ChromatographyMass Spectrometry (GCMS) This 2007 NRS is more extensive than any previous NRS study and provides a much broader perspective on alcohol and drug use in the driving population than previously available These data are essential to developing more precise estimates of the presence of alcohol and other drugs in drivers and in measuring the prevalence of alcohol- and drug-involved driving
This report summarizes the drug-involved driving prevalence estimates obtained through analyses of oral fluid and blood specimen results and combined with alcohol using breath alcohol measurements It should be emphasized that prevalence estimates do not necessarily imply ldquoimpairmentrdquo but rather in this case the presence of drugs and alcohol in the driver population For many drug types drug presence can be detected long after any impairment that might affect driving has passed2 Other studies are required to assess whether that presence implies an increased risk of crash involvement In this study we developed driver-prevalence estimates for illegal prescription and over-the-counter drugs which were determined by a panel of experts to possibly cause impairment It should be noted that prescription and over-the-counter drugs can be used according to medical advice or extra-medicinally Again the prevalence estimates indicate the presence of the drugs in drivers but do not necessarily indicate that the drivers were impaired Alcohol presence above the legal limit implies impairment alcohol below the legal limit may not imply impairment
2 For example traces of metabolites of marijuana can be detected in blood samples several days after chronic users stop ingestion Also whereas the impairment effects for various concentration levels of alcohol is well understood little evidence is available to link concentrations of other drug types to driver performance
2
2007 National Roadside Survey of Alcohol and Drug Use by Drivers Drug Results
As discussed earlier we gathered data from drivers on US roadways during Friday daytime hours and Friday nights and Saturday nights As indicated in Table 1 we obtained oral fluid samples from drivers in each of those data collection periods (1850 during daytime and 5869 during nighttime) We also collected blood samples during the nighttime data collection periods (3276)
Table 1 Participating Drivers (Percentages in Parentheses)
2007 Daytime Nighttime Total
Signaled to enter site 3516 9553 13069 Did not enter site 933 1016 1949 Entered site 2583 8537 11120 Eligible 2525 8384 10909
Entered site and interviewed 2174 (861) dagger 6920 (825) dagger 9094 (834) dagger
Valid breath sample 2254 (893) dagger 7159 (854) dagger 9413 (863) dagger
Oral Fluid sample 1850(733) dagger 5869 (700) dagger 7719 (707) dagger
Blood sample NA 3276 (391) dagger NA
AUD ampor Drug Questionnaire 1889 (752) dagger 5983 (714) dagger 7882 (722) dagger
NA (not applicable) Blood samples were not collected during daytime sessions In this table percentages are unweighted dagger Percent of eligible
Results In this study analyses of the oral fluid and blood samples were conducted to identify the presence of some 75 drugs and metabolites including illegal prescription and over-the-counter drugs
Comparison of overall drug prevalence by time of day (Table 2) indicates that 11 percent of drivers in the daytime sample were drug-positive This level was significantly lower than the 144 percent of nighttime drivers who tested positive for drugs (p lt 01)3
Table 2 Drug Prevalence by Time of Day (Oral Fluid)
Time of Day N
(Unweighted) Drug Positive
(Weighted) Daytime 1850 110 Nighttime 5869 144
To make the presentation of results most useful we identified three broad categories of drugs illegal prescription and over-the-counter Because few over-the-counter drugs were found the prescription and over-the-counter drugs were combined for many analyses and labeled
3 p lt 01 indicates that under the null hypothesis the probability of encountering this difference by chance is less than 1 percent p lt 05 indicates that the probability of encountering this difference by chance is less than 5 percent
3
2007 National Roadside Survey of Alcohol and Drug Use by Drivers Drug Results
ldquoMedicationsrdquo Additionally some respondents tested positive for more than one category of drug Thus tables presenting drug categories present four mutually exclusive categories Illegal Medications Illegal and Medications and Negative So as not to double count individual positive results an individualrsquos result appears in only one of these categories However for example in Table 3 to determine the proportion of daytime drivers who tested positive for illegal drugs one could sum the daytime values for the ldquoIllegalrdquo category (58) and for the rdquo Illegal amp Medicationsrdquo category (05) to arrive at a prevalence estimate of 63 of daytime drivers who were positive for at least one illegal drug Detailed summaries of prevalence estimates for individual drugs appear in Tables 137-140 later in the report As indicated in Table 3 comparison of drug categories by time of day revealed that based on oral fluid analyses almost 6 percent of daytime drivers tested positive for drugs in the ldquoIllegalrdquo category (primarily marijuana and cocaine) as opposed to over 10 percent of nighttime drivers There was a statistically significant difference between daytime and nighttime drivers (p lt 01)
Table 3 Drug Categories Distribution by Time of Day (Oral Fluid)
N Time of Day Drug Category (Unweighted) (Weighted)
Daytime
Illegal Medications Illegal amp Medications Negative
125 107 14
1604
58 48 05
890 Overall Daytime 1850 1000
Nighttime
Illegal Medications Illegal amp Medications Negative
575 201 60
5033
105 30 09
856 Overall Nighttime 5869 1000
ldquoMedicationsrdquo includes prescription and over-the-counter drugs
Positive results in the ldquoMedicationsrdquo category though not statistically significant were found to be slightly higher among the daytime drivers (almost 5) than nighttime drivers (3) Additionally some drivers tested positive for both ldquoIllegal drugs and Medicationsrdquo (05 of daytime drivers and 09 of nighttime drivers) This indicates that drugs were not detected in 890 percent of daytime drivers and 856 percent of nighttime drivers
When oral fluid drug category findings were combined with BAC results we found that in both the daytime and nighttime samples the drug-positive drivers who were also alcohol-positive were more likely to be positive for ldquoIllegalrdquo drugs than ldquoMedicationsrdquo (Table 4) This was particularly true in the nighttime sample in which 173 percent of drivers in the illegal category had BACs between zero and 08 grams per deciliter (gdL) (compared to 63 in the ldquoMedicationsrdquo category) and 57 percent had BACs greater than 08 (compared to 12 in the ldquoMedicationsrdquo category) (p lt 01) In the daytime sample however the differences were statistically non-significant (p value = 05)
4
2007 National Roadside Survey of Alcohol and Drug Use by Drivers Drug Results
Table 4 BAC Among Drug-Positive Drivers by Drug Category and Time of Day (Oral Fluid)
Time of Day Drug Category
N (Unweighted)
BAC (gdL)
Zero Between
Zero and 08 08+
Daytime Illegal Medications Illegal amp Medications Negative
125 107 14
1604
971 996 983 992
23 04 17 06
06 00 00 02
Nighttime Illegal Medications Illegal amp Medications Negative
575 199 60
5033
770 925 814 902
173 63
177 81
57 12 09 17
ldquoMedicationsrdquo includes prescription and over-the-counter drugs In this table percentages are weighted
In addition to the three drug categories we also examined drug class (Table 5) The drug classes were antidepressants marijuana narcotic-analgesics sedatives stimulants and other plus a ldquomore than one drugrdquo class To avoid double counting individual positive results the classes were mutually exclusive Thus for example since marijuana is both a class by itself and could appear in the ldquoMore than 1 classrdquo cell as well (as could other classes of drugs) from this table one cannot arrive at an overall prevalence estimate for marijuana alone However detailed summaries of prevalence estimates for individual drugs appear in Tables 137-140 later in the report In comparing prevalence of drug classes by time and region4 we found that marijuana was generally the most common drug class across all the regions both in daytime (39) and nighttime (61) samples Among the nighttime sample drivers in the Midwest and Northeast regions were more likely to test positive for marijuana than daytime drivers (p lt 05) In the South and West regions however there was little difference between daytime and nighttime drivers with respect to marijuana For stimulants a higher percentage of nighttime drivers in all regions tested positive than did daytime drivers However the difference was statistically significant only in the Midwest (p lt 01) and West (p lt 05)
When one examines the ldquoAllrdquo column of Table 5 one finds that overall sedatives were found in 16 percent of daytime drivers and in 06 percent of nighttime drivers Stimulants were found in 16 percent of daytime drivers and in 32 percent of nighttime drivers
4 Regions are defined by the NASSGES system according to US Census Regions (Midwest includes the West North Central and East North Central States Northeast includes New England and Middle Atlantic States South includes the West South Central East South Central and South Atlantic States and West includes West and Mountain States
5
2007 National Roadside Survey of Alcohol and Drug Use by Drivers Drug Results
Table 5 Drug Classes by Time of Day and Region (Oral Fluid)
Time of Midwest Northeast South West All Day Drug Class
Daytime
Antidepressants
Marijuana
Narcotic-Analgesics
Sedatives
Stimulants
Other
More than 1 Class
N=546
04
34
27
19
08
00
22
N=379
06
30
21
26
17
13
10
N=472
05
55
13
21
22
00
14
N=453
05
40
06
07
20
00
12
N=1850
05
39
16
16
16
02
15
Overall Drug Positive Daytime 115 125 131 89 110
Negative 885 875 869 911 890
Nighttime
Antidepressants
Marijuana
Narcotic-Analgesics
Sedatives
Stimulants
Other
More than 1 Class
N=1694
05
77
10
11
30
02
16
N=1111
02
76
28
02
23
00
41
N=1559
00
63
12
07
27
01
29
N=1505
01
41
18
04
40
05
20
N=5869
02
61
16
06
32
03
23
Overall Drug Positive Nighttime 150 173 140 129 144
Negative 850 827 860 871 856
In this table percentages are weighted ldquoMore than 1 Classrdquo ndash Drivers testing positive for more than one drug class are counted only in this category
Further as indicated in Table 6 comparison of number of drug classes by time of day indicated that nighttime drivers (23) were significantly more likely to test positive for more than one drug class than daytime drivers (15) (p lt 01)
Table 6 Number and Distribution of Drug Classes by Time of Day (Oral Fluid)
Number of N Time of Day Drug Classes (Unweighted) (Weighted)
1 206 95 2+ 40 15Daytime
Negative 1604 890 1850 1000
1 680 121 2+ 156 23
Overall Daytime
Nighttime Negative 5033 856
5869 1000Overall Nighttime
6
2007 National Roadside Survey of Alcohol and Drug Use by Drivers Drug Results
As mentioned earlier 3276 blood samples were obtained from nighttime drivers As expected the results of the blood analyses were quite close to those obtained by the nighttime driver oral fluid analyses For example (Table 7) among nighttime drivers 91 percent tested positive for ldquoIllegalrdquo drugs 4 percent for ldquoMedicationsrdquo and 07 percent for the combination of both ldquoIllegal and Medicationsrdquo
Table 7 Drug Categories Distribution (Blood)
N Drug Category (Unweighted) (Weighted)
Illegal 267 91 Medications 169 40 Illegal amp Medications 30 07 Negative 2810 862 Overall 3276 1000
ldquoMedicationsrdquo includes prescription and over-the-counter drugs
Additionally as indicated in Table 8 283 percent of nighttime drivers testing positive for ldquoIllegalrdquo drugs in blood also tested positive for alcohol as did 64 percent of drivers who tested positive for ldquoMedicationsrdquo and 232 percent of those testing positive for both ldquoIllegal drugs and Medicationsrdquo
Table 8 BAC Among Drug-Positive Drivers by Drug Category (Percentage by Row) (Blood)
Drug Category N
(Unweighted)
BAC (gdL)
Zero Between
Zero and 08 08+ Illegal 267 717 204 79 Medications 169 936 49 15 Illegal amp Medications 30 768 232 00
ldquoMedicationsrdquo includes prescription and over-the-counter drugs In this table percentages are weighted
As indicated in Table 6 some individuals tested positive for more than one drug Thus we also present the drug analysis results by individual drug where drug is the unit of analysis (Tables 137-140) Those results indicate that the most prevalent drug other than alcohol was marijuana The overall marijuana prevalence rate in oral fluid was 45 percent daytime and 77 percent nighttime
When we examined the analysis results of the combination of oral fluid andor blood in the nighttime driver population we found that the marijuana prevalence rate was 87 percent The next most frequently encountered individual drug was cocaine with a daytime oral fluid prevalence rate of 15 percent and a nighttime rate of 39 percent
7
2007 National Roadside Survey of Alcohol and Drug Use by Drivers Drug Results
Summary Overall analyses of the oral fluid samples obtained indicated a drug use prevalence rate of 11 percent for daytime drivers and 144 percent for nighttime drivers This difference between day and night is statistically significant (p lt 01) Among nighttime drivers providing blood samples 138 percent overall tested positive for at least one of the drugs in our panel This includes all drugs for which we tested whether illegal prescription or over-the-counter Additionally of the 98 percent of drivers testing positive for ldquoIllegalrdquo drugs in blood 28 percent also tested positive for alcohol as did 64 percent who tested positive for ldquoMedicationsrdquo and 232 percent for those testing for both ldquoIllegal drugs and Medicationsrdquo The most frequently encountered individual drug other than alcohol was marijuana
Again it is important to emphasize that the results presented in this report are estimates of the prevalence of drug use among drivers Further research is needed to determine the effect of drug prevalence on crash risk This report provides detailed displays of the data discussed above
8
2007 National Roadside Survey of Alcohol and Drug Use by Drivers Drug Results
Introduction This report presents prevalence estimates for drug-involved driving obtained from the 2007 National Roadside Survey of alcohol- and drug-involved driving Though national roadside surveys of alcohol-involved driving have been conducted on a decennial basis since the midshy1970s this is the first US national roadside survey where biological measures of drugs other than alcohol were obtained
Background Forty years ago when the Department of Transportation (DOT) was established it was well understood that alcohol was an important factor in traffic crashes In 1968 a new agency that was to become the National Highway Traffic Safety Administration (NHTSA) delivered its Report to the Congress on Alcohol and Highway Safety pointing to the need for improved data on drinking and driving (USDOT 1968) This need led to the establishment of incentives for States to conduct blood alcohol concentration (BAC) tests on all fatally injured drivers and pedestrians and eventually to the establishment of the Fatality Analysis Reporting System5
(FARS) in 1975 Initially this data file was limited by the low level of testing for alcohol by the States but since 1982 through the use of an imputation system and increased testing by states it has provided a reliable means of assessing the Nationrsquos progress in reducing crashes in which drivers have been drinking It is important to note however that FARS provides very limited information related to drugs While States routinely test drivers involved in fatal vehicle crashes for alcohol only a few also routinely test for other drugs According to the Centers for Disease Control and Prevention less than half of the fatalities in the 2005 FARS had drug test results available (CDC 2006) In our review of the FARS data we identified a lack of information related to drug use
In addition to FARS the national roadside survey (NRS) series estimates the prevalence of drinking and driving on weekends in the 48 contiguous States and assesses changes in prevalence over time The first NRS was conducted in 1973 (Wolfe 1974) the second in 1986 (Lund amp Wolfe 1991) and the third in 1996 (Voas Wells Lestina Williams amp Greene 1998) Each of these surveys included a brief verbal survey and a breath sample to determine BAC Together the first three national surveys and FARS (1995) document reductions in the number of drinking drivers on US roadways and alcohol-related fatalities over three decades The fourth NRS conducted in 2007 followed the general methodology of the three prior surveys in obtaining BACs to enable comparison with the earlier surveys but also incorporated several new features These included questionnaires on drug and alcohol use disorders and biological sampling of oral fluid and blood to determine the extent of the presence of drugs other than alcohol (ie illegal prescription and over-the-counter) among drivers
In 2005 NHTSA conducted a pilot study as a precursor to this full decennial 2007 NRS (Lacey et al 2007) The primary objective of the pilot study was to determine whether it was feasible to collect data for drugs other than alcohol through oral fluid and blood samples The pilot study consisted of six rounds of nighttime data collection with over 800 drivers participating in the survey Approximately 78 percent of the drivers participating in the survey agreed to provide an
5 FARS was originally called the Fatal Accident Reporting System
9
2007 National Roadside Survey of Alcohol and Drug Use by Drivers Drug Results
oral fluid sample and almost 50 percent of the drivers participating in the survey provided blood samples The pilot study showed that it was clearly feasible to conduct a survey that included drugs other than alcohol Such data are essential to developing more precise estimates of the presence of alcohol and other drugs in drivers and for estimating the prevalence of alcohol- and drug-involved driving
Prevalence of Drug-Involved Driving In their review of the research literature Kelly Darke and Ross (2004) cite the 2001 National Household Survey to report that 4 percent of US residents reported driving while under the influence of drugs in the preceding 12 months These data based on self-report did not distinguish between legal and illegal drugs Using data collected in Tennessee in December 1986 Lund Preusser Blomberg and Williams (1988) studied a sample of truck drivers to report prevalence of marijuana (15) cocaine (2) prescription stimulants (5) and nonprescription stimulants (12) among the drivers According to a literature review by Jones Shinar and Walsh (2003) the Lund et al study (1988) was at that time the only US study that had performed chemical tests of drivers stopped at a roadside location
With respect to prescription drugs Jones et al (2003) reported that benzodiazepines (tranquilizers) were found in four percent of non-crash-involved drivers De Gier (2006) reviewed the literature and reported that benzodiazepines were more commonly found in middle-aged to older drivers ldquopresumably due to the high rates of benzodiazepine prescriptions among these age groupsrdquo Neutel (1998) estimated a lower crash risk for older persons (OR = 28) after benzodiazepine use than younger persons (OR = 32)
Impact of Drugs on Driving Skills Laboratory Studies A number of laboratory studies have been conducted on the impact of both legal and illegal drugs on driving-related skills Still results from these experimental studies are not straightforward and are sometimes contradictory One confounding factor is that different drugs have different effects on driving-related skills with the thresholds at which those different effects occur varying as a function of the measure used (Shinar 2006) Additionally Shinar found that because of the large individual variation in human response to drug consumption attempts to define a ldquonormrdquo for the behavioral response to drugs is difficult
Some studies have found that drugs that stimulate the central nervous system (eg amphetamines cocaine caffeine) sometimes may improve laboratory driving performance (Ward Kelly Foltin amp Fischman 1997 Burns 1993 Higgins et al 1990 Hurst 1976) However in the Jones et al (2003) literature review it is reported that amphetamines are not usually associated with easily observable behavioral impairments
There is considerable evidence from laboratory studies that cannabis (marijuana) impairs reaction time attention tracking hand-eye coordination and concentration although not all of these impairments were equally detected by all studies (Couper amp Logan 2004a Heishman Stitzer amp Yingling 1989 Gieringer 1988 Moskowitz 1985) In reviewing the literature on marijuana Smiley (1998) concluded that marijuana impairs performance in divided attention tasks (ie a poorer performance on subsidiary tasks) Jones et al (2003) adds that Smileyrsquos finding is relevant to the multitasking essence of driving in particular by making marijuanashy
10
2007 National Roadside Survey of Alcohol and Drug Use by Drivers Drug Results
impaired drivers perhaps less able to handle unexpected events Interestingly there is also evidence showing that unlike alcohol marijuana enhances rather than mitigates the individualrsquos perception of impairment (Lamers amp Ramaekers 1999 Robbe amp OHanlon 1993 Perez-Reyes Hicks Bumberry Jeffcoat amp Cook 1988) Robbe and OHanlon (1993) reported that in laboratory conditions drivers under the influence of marijuana were aware of their impairment which led them to decrease speed avoid passing other vehicles and reduce other risk-taking behaviors Such was not the case with alcohol for the authors reported that alcohol-impaired drivers were generally not aware of impairment and therefore did not adjust their driving accordingly
There is laboratory evidence that benzodiazepines impair some driving skills (Drummer 2002) However there are some contradictory results Mathijssen et al (2002) reported on a case-control study conducted in the Netherlands that found there is an increased risk for benzodiazepine and alcohol use together but no increased risk for benzodiazepine use alone Additionally there is evidence that the impairing effects of benzodiazepine might be circumscribed to the first days of benzodiazepine use before tolerance develops (Lucki Rickels amp Geller 1985) leading some to conclude that the extent to which benzodiazepines increase crash risk has to be balanced against the health benefits for those taking these drugs for medicinal purposes (Beirness Simpson amp Williams 2006)
Laboratory reports are not necessarily the best indicators of the impact of drugs on driving skills As Beirness et al (2006 pages 16-17) stated ldquoan impairment or skill enhancement identified in a laboratory test may not show up on the road because the drugs may lead to other changes in driver behavior Additionally laboratory tests can address the effects of drugs only on skills not judgment and the latter may be as important when it comes to driving Thus even if drugs are found to affect driving skills in laboratory tests actual crash risk may or may not be affectedrdquo
Field Data Data from drivers apprehended for impaired driving have been used to estimate the prevalence of drug use Jones et al (2003) reviewed the literature on drug involvement among arrested drivers and reported a variety of drug prevalence levels based on the location and the population under study White et al (1981) reported the following prevalence of drugs among drivers arrested for impaired driving in California in the 1970s with BACs lower than 10 gdL sedativehypnotic (30 to 47) phencyclidine or PCP (79) and morphine (62) In contrast Polkis Maginn and Barr (1987) reported the following prevalence rates among drivers arrested in St Louis Missouri in the 1980s phencyclidine or PCP (47) marijuana (47) benzodiazepines (22) barbiturates (15) opiates (11) and cocaine (9) Walsh et al (2000) reported that marijuana and cocaine were the primary drugs detected (19 and 16 respectively) among arrested drivers in Tampa Florida with narcotics and amphetamines found in less than 1 percent of the drivers Thus as studies of drug-use patterns in the United States have shown the types of substances consumed vary across locations and time making it difficult to characterize the drug involvement of drivers
As part of the Drug Evaluation and Classification (DEC) Program trained drug recognition experts are used to determine drug usage by looking for relevant signs and symptoms Preusser Ulmer and Preusser (1992) evaluated DEC programs in Arizona California Colorado New York and Texas from 1986 to 1991 reported that about 1 to 3 percent of the drivers arrested for driving while intoxicated (DWI) were classified as drug-impaired by Drug Recognition Experts
11
2007 National Roadside Survey of Alcohol and Drug Use by Drivers Drug Results
trained in the DEC Program The most prevalent substances found were marijuana (42) stimulants (36) depressants (16) narcotic analgesics (13) and PCP (5) As Jones et al (2003) pointed out these estimates apply only to the restricted group of driving-under-theshyinfluence-of-drugs (DUID) suspects that were evaluated by officers who participated in the DEC program rather than to all drivers arrested for DWI or all drivers on the road
Other studies have been conducted using crash data to estimate the prevalence of drugs among injured drivers and their role in crashes Terhune et al (1992) used a responsibility-analysis approach6 in studying fatally injured drivers and reported no increase in crash risk due to marijuana or cocaine use alone although multiple drug use could be associated with increased responsibility They also reported that ldquodrivers with alcohol in their systems had the highest crash responsibility ratesrdquo and ldquoan alcohol-drug combined impairment effect was suggested by the responsibility analysisrdquo (pg ix) Leveille et al (1994) used a small matched-case control study design to study crash risk among drivers aged 65 or older in Seattle Washington The authors did not find an association between crash risk and benzodiazepine or sedating antihistamines among this group although they acknowledged that the sample size (234 drivers) might have been too small for significance Ray Fought and Decker (1992) also studied crash risk for drivers aged 65 years or older using data from the Tennessee Medicaid program With this larger sample (16262 drivers) they found an association between presence of benzodiazepines or tricyclic antidepressants and crash risk However they did not find a correlation for people taking oral opioid analgesics Other studies of drug over-involvement in crashes report contradictory results (eg Hemmelgarn Suissa Huang Boivin amp Pinard 1997) These results should be considered cautiously due to data limitations such as small sample size
In summary Jones et al (2003 pp 85-86) stated ldquoThe role of drugs as a causal factor in traffic crashes involving drug-positive drivers is still not understood Drug risk factors are still not known with acceptable precision with some evidence suggesting little or no increase in crash risk at drug levels being detected by current chemical test procedures Further current research does not enable one to predict whether a driver testing positive for a drug even at some measured level of concentration was actually impaired by that drug at the time of crash This is in sharp contrast to alcohol where BAC measurements can provide a good estimate of impairmentrdquo
Jones et al (2003 p 86) also stated ldquoAnother complicating factor is the role of drugs taken in combination with alcohol For many drugs a drug in combination with alcohol accounts for a significant percentage of the occurrences of that drug in crash victims Waller et al (1995) found that roughly one-half of the occurrences of drivers positive for marijuana cocaine and or opiates had elevated BACs and that the crashes of drivers testing positive for drugs alone were very similar to the crashes of drivers testing negative for both alcohol and drugs This adds further doubts about the role of drugs in the impairment of crash-involved drivers and suggests that it may be much smaller than had been suspectedrdquo
6 Responsibility-analysis was used to suggest which drugs contributed to the occurrence of the crashes This method involves examining crash reports which have no indication of driver drug use and rating each driverrsquos crash responsibility If proportionately more drug-present drivers are judged responsible than are those free of drugs this is considered evidence of drug impairment effects
12
2007 National Roadside Survey of Alcohol and Drug Use by Drivers Drug Results
Challenges in Measurement and Todayrsquos Drug Testing Opportunities According to the review of the drug impaired literature conducted by Jones et al (2003) blood is usually the ldquogold standardrdquo for linking drug concentration to behavioral impairment However the collection of other types of biological fluids (eg sweat oral fluid urine) is less invasive and easier to collect in both field studies and law enforcement operations and thus oral fluid has emerged as a valid alternative to blood collection for field use Oral fluids normally contain the parent drug substance rather than drug metabolites that are present in urine Additionally Jones et al (2003) concluded that collection of oral fluid is generally considered less invasive than either blood or urine and ldquocould be an excellent matrix to tie recent drug use with behavioral impairmentrdquo
In some applications oral fluid samples are collected and then subjected to a screening analysis in the field or at the police station to develop a basis for more definitive collection of and laboratory analysis of urine or blood In the application used for this study the oral fluid sample was collected and then sent to a laboratory for a more refined enzyme-linked immunosorbent assay (ELISA) screening followed by a confirmatory analysis by Liquid Chromatography-Tandem Mass Spectrometry (LCMS-MS) or Gas ChromatographyMass Spectrometry (GCMS)
In a recent study conducted by Cone et al (2002) oral fluid testing of 77218 subjects in private industry showed a 5 percent positive rate for any of the five Substance Abuse and Mental Health Services Administration drug categories (marijuana cocaine opiates phencyclidine and amphetamines) The pattern and frequency of drug positives was remarkably similar to urine drug prevalence rates in the general workplace from other surveys (Cone et al 2002) Further in a study of 180 drivers given blood urine and oral fluid tests which were analyzed using quantitative Gas ChromatographyMass Spectrometry (GCMS) the positive predictive value of oral fluids was 98 percent for amphetamines 92 percent for cocaine and 90 percent for cannabinoids (Samyn et al 2002)
However in an analysis of blood urine saliva and sweat from 198 injured drivers admitted to a hospital saliva detected only 14 positives for cannabinoids while 22 positives were detected in the urine (Klintz et al 2000) According to the study authors the amount of matrix (body fluid) collected in saliva appears to be smaller when compared to urine and the levels of drugs are typically higher in urine than in saliva In a study of saliva and sweat Samyn and van Haeren (2000) concluded that saliva should be considered a useful analytical matrix for the detection of recent drug use when analyzed using GCMS This finding indicates oral fluid testing would be desirable in the roadside testing of drivers
Yacoubian et al (2001) tested 114 adult arrestees using saliva and urine and concluded that saliva testing may have certain advantages over urine testing for drugs including (1) ease of sample collection (2) subject preference for giving saliva over urine (3) less vulnerability of adulteration in saliva (4) little concern for subjects producing an adequate sample with saliva and (5) saliva storage is easier than urine The authors found a sensitivity of 100 percent and a specificity7 of 99 percent for cocaine in saliva and a sensitivity of 88 percent and specificity of
7 Sensitivity Sensitivity is the ability of a test to measure what it purports to measure or in this case the ability of the oral fluid tests to correctly identify active drug users It is operationalized as a proportion represented by the true
13
2007 National Roadside Survey of Alcohol and Drug Use by Drivers Drug Results
100 percent for heroin However saliva results only had a sensitivity of five percent for marijuana likely reflecting only detection of very recent smoking as marijuana does not migrate from the blood supply to the oral fluid Thus some positives may indicate residual marijuana remaining in the mouth after ingestion This may well be a positive factor for this study in that when marijuana is detected in saliva it is more likely to be in its active phase in the body rather than simply evidence the marijuana has been consumed during a ldquolook-backrdquo period that could be as long as two weeks and may no longer have a potential impairing effect
Hold et al (1999) conducted a review of the literature concerning using oral fluid for drug testing the review included 135 references and provided guidelines for techniques for collecting and measuring drugs in saliva In an earlier review of drug use evidence found in oral fluid Schramm et al (1992) concluded that initial studies with cocaine and phencyclidine or PCP suggested a correlation between oral fluid and blood concentration but that tetrahydrocannabinol (THC) does not appear to be transferred from blood to saliva Recent marijuana smoking however can be detected in saliva from the buccal cavity8
With regard to oral fluid and BAC Bates et al (1993) found a high correlation between saliva strips and breath tester results for alcohol (r = 89-90) Blood sample analyses however still remain the ldquogold standardrdquo measurement of drugs in the human body because evidence supporting accuracy is best established for that approach
Project Objectives New to the 2007 National Roadside Survey was the collection of biological samples that could be used to determine the extent of the presence of drugs other than alcohol in the nighttime driving population These additional data are essential to estimating the national progress in reducing the prevalence of alcohol- and drug-involved driving
The objective of this report is to present the first US national prevalence estimates of drug-involved driving The first report stemming from this study described the methods used in the sampling data collection and biological specimen analysis portions of the 2007 NRS (Lacey et al 2009a) The second report describes the studyrsquos analytic approach and summarizes the alcohol data we place the set of descriptive estimates of alcohol use within the context of societal trends by comparing these measures with similar ones from the prior surveys over the
positives (ie those who are drug positive and actually test positive) divided by all persons who are drug positive (ie those who are positive and test positive [ie true positives] plus those who are positive and test negative [false negatives]) The formula for sensitivity is Sn = TP (TP + FN) where TP and FN are the number of true positive and false negative results respectively Sensitivity can also be thought of as 1 minus the false negative rate Notice that the denominator for sensitivity is the number of drug positive persons Specificity Specificity is the ability of a test to correctly identify non-cases of disease or in this case the ability of
the oral fluid tests to correctly identify non-drug users It is operationalized as a proportion represented by the true negatives (ie those who are drug negative and test negative) divided by all persons who are drug negative (ie those who are negative and test negative [true negatives] plus those who are negative but falsely test positive [false positives]) The formula for specificity is Sp = TN (TN + FP) where TN and FP are the number of true negative and false positive results respectively Specificity can be thought of as 1 minus the false-positive rate Notice that the denominator for specificity is the number of nondrug users
8 The buccal cavity includes that part of the mouth bounded anteriorly and laterally by the lips and the cheeks posteriorly and medially by the teeth andor gums and above and below by the reflections of the mucosa from the lips and cheeks to the gums
14
2007 National Roadside Survey of Alcohol and Drug Use by Drivers Drug Results
last four decades These trend analyses enable detection of changes in our populations rates and degree of alcohol-involved driving over time (Lacey et al 2009b) The current report provides insight into the use of drugs other than alcohol (illegal prescription and over the counter) in the driving population and will provide a baseline for future studies to assess trends and changes
The report will first present a summary of the methods and procedures used in survey sampling and biological sampling This is followed by a description of the drugs selected for analysis and then a description of the actual drug-collection instruments and how they were administered
The results of our analyses are divided into three sections The first presents the analyses of the oral fluid results with BAC measurement obtained through breath tests These data include both daytime and nighttime drivers The second section will report the results of the blood analysis again with the BAC measurements from breath tests In both of these sections we also contrast the results obtained from the biological specimens with driversrsquo self-report drug use Additionally we present drug prevalence estimates for nighttime weekend drivers based on the combination of results of analyses of both oral fluid and blood combined Finally we discuss the implications of these analyses in terms of estimating the prevalence of drug use among Friday daytime drivers and weekend nighttime drivers Additional tables with further blood results are included in Appendix A These analyses include results of self-reported drug use by drug type safety observation measures (seatbelt helmet use etc) as well as the results on items relating to interaction with the criminal justice and treatment systems The presence of drugs in these drivers does not necessarily imply that they are impaired and at greater risk of crash involvement Indication of impairment and increased risk will be addressed in an upcoming study of the potential contribution of drugs to crash risk
15
2007 National Roadside Survey of Alcohol and Drug Use by Drivers Drug Results
16
2007 National Roadside Survey of Alcohol and Drug Use by Drivers Drug Results
Methods This section of the report briefly summarizes the methodology used in conducting the 2007 NRS with special emphasis on sampling procedures A separate Methodology Report (Lacey et al 2009a) provides detailed descriptions of the multiple components of the data collection process
Survey Sampling Procedures This section presents an abridged description of the sampling approach we followed in conducting the 2007 NRS Because it is infeasible to conduct surveys on all the roads in the United States we constructed a sampling system for the 2007 NRS that represented the whole Nation but required interviewing only a practical portion of the almost 203 million drivers on US roads (FHWA 2006) As in the three prior surveys the area covered in this study was limited to the 48 contiguous States
For practicality we limited locations to roadways where surveys could be performed safely and with sufficient traffic to recruit the number of participants required for valid estimates of the national prevalence of drinking and drug involved-drivers as did prior NRS studies
The past three national surveys provided information on private four-wheel vehicle operators at representative then randomly selected locations during weekend nighttime periods when drinking and driving is most prevalent The 2007 NRS covered the same time periods and added two Friday daytime periods As in the three earlier surveys the 2007 NRS excluded commercial vehicles but unlike previous practice included motorcycles
The 2007 NRS followed the practice of the 1973 1986 and 1996 national surveys by using a multistage sampling system that represented the drivers at risk for crash involvement in the 48 contiguous States In this process the initial sample structure was taken from NHTSArsquos National Automotive Sampling SystemGeneral Estimates System (NASSGES) (NHTSA 1995) which was constructed to provide a basis for making nationally representative estimates of highway crashes The four steps included
1 Selecting the primary sampling units (PSUs) which are cities large counties or groups of counties from within four regions of the United States and three levels of population density
2 Randomly selecting 30 specific square-mile-grid areas within each PSU and randomly numbering them to form an order of priority from among the total of all the square mile sectors comprising the PSU area Then we attempted to recruit the cooperation of local law enforcement agencies that had jurisdiction over the selected grids One law enforcement agency often would cover several of the selected square mile areas
3 Identifying appropriate survey sites within the square-mile-grid areas Appropriate sites had a safe area large enough to accommodate the survey operation and had sufficient traffic flow to generate an adequate number of subjects In some cases more than one such location was available within a square mile grid In this case the survey manager exercised herhis judgment to select the optimal location for safe data collection This resulted in selection of five data collection or survey sites within each PSU
17
2007 National Roadside Survey of Alcohol and Drug Use by Drivers Drug Results
4 Selecting at random drivers to be interviewed from the traffic passing by the survey site The total number of eligible vehicles was counted to determine the proportion of the traffic passing by each survey site that was sampled
These sampling procedures were followed to ensure that the probability of selecting a PSU a survey location within the PSU and a driver at a survey location was known at each of the sample design stages Knowing these probabilities permitted the computation of the probability that a given driver would be interviewed in the survey This was done by multiplying the sampling probabilities at each of the four steps to obtain the final overall probability of being sampled The weight given to each case in the final totals (sampling weight) was computed as the inverse of the sampling probability This statistical procedure accounts for differences among PSUs in the size of the driver population In other words although we sampled approximately the same number of drivers at each PSU the actual number of individuals driving at each sampling site was not uniform To make the sample of drivers at each site representative of the actual number of drivers we applied the above-described weights As a result drivers interviewed at sites with a relatively heavy traffic flow (ie a relatively large pool of actual drivers) carry a larger weight than drivers sampled from sites with less traffic loads This ensured that the basic requirement of sampling theorymdashthat every driver has an equal chance of being interviewedmdashwas met by adjusting for the biases inherent in the selection of locations within the sampling frame
The major barrier to carrying out this staged sampling system was obtaining law enforcement support for the survey In some localities city attorneys or law enforcement leadership with concerns such as potential liability and scare resources declined to participate In these cases substitution PSUs were obtained Although this process was time-consuming similar difficulties had also been experienced in all three previous NRS studies Replacement PSUs were chosen from within the same GES geographic region9 and the same GES PSU type (city large suburban area all others) as the unavailable PSU For more information on PSU replacement see Lacey et al (2009a) The 60 PSUs used in the 2007 NRS are shown in Figure 1
9 GES defines four geographic strata
18
2007 National Roadside Survey of Alcohol and Drug Use by Drivers Drug Results
Figure 1 Map of Sixty 2007 National Roadside Survey Sites
As mentioned the roadside survey procedures used in the 2007 NRS followed as closely as possible those used in the previous three surveys (see Lacey et al 2009a Lestina et al 1999) However the 2007 NRS departed from the earlier surveys in several important ways The earlier surveys included only a brief questionnaire and a breath test that generally required less than 5 minutes of a participantrsquos time The 2007 NRS included a more extensive set of questions (base survey a drug questionnaire questions about interaction with the criminal justice and treatment systems an alcohol-use disorder and a drug-use disorder survey) The 2007 survey protocol also attempted to collect two biological samples (oral fluid and blood) from participants as well as a breath test Data collection for the earlier surveys was conducted by three teams of three interviewers the 2007 NRS consisted of 6 teams of 10 to 12 members The earlier surveys were conducted at 24 PSUs whereas the 2007 survey was conducted at 60 PSUs This increase in the number of PSUs allowed us to maximize the use of all possible PSUs defined by the NASSGES and increase the representativeness of the sample The earlier surveys had four 2-hour data collection periods on weekend nights the 2007 survey added a 2-hour data collection period during the daytime on Fridays for a total of five 2-hour survey periods during the weekend Finally the number of participants in the 2007 survey was about three times as many as in the 1973 study
PIRE employed and trained six specialized teams of interviewers from both the east and west coasts of the United States All staff was trained during the summer of 2007 Surveys began the weekend of July 20 and 21 2007 and concluded 20 weeks later on December 1 2007 As in the three previous NRS studies nighttime surveys were conducted between 10 pm and midnight and between 1 am and 3 am on both Friday and Saturday For the 2007 survey a 2-hour Friday daytime data collection period was added either between 930 am and 1130 am or between 130 pm and 330 pm The daytime data collection period was randomly selected for each PSU The daytime periods were added to determine the extent of alcohol- and drugshy
19
2007 National Roadside Survey of Alcohol and Drug Use by Drivers Drug Results
involved driving during the day and whether the number of drivers using drugs and the types of drugs used differed between day and night Each component used in the roadside survey is thoroughly described in the Methodology Report (Lacey et al 2009a)
Preparation for the 2007 NRS Survey The size and complexity of the 2007 NRS required extensive preparation that NHTSA began years before the actual survey was initiated including a pilot test of survey procedures (Lacey Kelley-Baker Furr-Holden Voas Brainard amp Moore 2007) The preparation activitiesmdash selection and testing of equipment for collecting biological samples recording and organizing the self-report and observational data at the roadside recruiting and training of survey staff pretesting of survey procedures developing procedures for protection of survey respondents and the publicmdashare fully described in the Methodology Report (Lacey et al 2009a) Only a brief overview of this work is described here
Survey equipment Interviewers recorded the responses to the traditional NRS interview on a handheld portable digital assistant (PDA) Through a special program developed for the 2007 NRS the PDA provided a means of prompting the interviewer through each step of the data collection process
As part of the program to protect survey participants and the public it was important to know the extent of the driversrsquo drinking To this end a passive alcohol sensor (PAS) attached to the PDA with Velcrotrade was used to collect mixed expired air from approximately 6 inches in front of the driverrsquos face (we used the PAS Vrtrade manufactured by PAS International Inc of Fredericksburg Virginia) This small handheld unit was used because it was less obvious and intimidating than the larger flashlight-based passive sensors We researched three available styles of PAS models (1) the handheld unit that was used in the pilot study (2) the flashlight PAS and (3) a clipboard device with an alcohol sensor built into one corner We tested the devices for accuracy ease of use and reliability and found that the PAS Vrtrade was best suited to the needs of this study The PAS unit can detect alcohol in emitted breath around the face (Kiger Lestina amp Lund 1993) The PAS was held within 6 inches of the participantrsquos face and when the subject spoke the interviewer activated the small electrical pump which pulled in the exhaled breath from the participant and produced an estimate of the participantrsquos breath alcohol level
Data collection To compare results from the 2007 survey to prior surveys a strong effort was made to follow the same data collection protocol employed in the three prior NRS studies despite the addition of a large number of questions and new biological specimen collections following the traditional questionnaire and breath test As described in the Methodology Report (Lacey et al 2009a) we placed the traditional NRS interview and breath-test collection before the new NRS questions and the specimen collections We believed that by structuring data collection in this way the additions to the basic survey would not affect our ability to compare the responses to the basic survey with responses from the three earlier surveys Nevertheless the 2007 NRS experienced a somewhat larger refusal rate than the 1996 NRS (see Table 9)
To determine whether the 2007 survey procedure accounted for producing the lower response rate we conducted a replica of the 1996 NRS procedure in one of our 2007 sites (Knox County Tennessee) The simpler protocol followed that used in the 1996 and earlier surveys collecting the traditional interview and a breath sample only About 16 percent of all drivers signaled to stop by the officer during this ldquoreplica surveyrdquo failed to stop andor enter the site This is similar
20
2007 National Roadside Survey of Alcohol and Drug Use by Drivers Drug Results
to the 15 percent that failed to stop (when the police signaled) in the 2007 NRS study Among those who entered the research bay and were eligible for the survey the proportion of refusals in the replica survey was similar to the full 2007 NRS (163 and 175 respectively) Thus it appears that the lower response rate in the 2007 NRS reflects a change in the driving publicrsquos willingness to be interviewed rather than an effect of the more elaborate survey procedures implemented in 2007
Table 9 Comparison of Number of Nighttime Participants by Year in the National Roadside Surveys
1973 1986 1996 2007 Signaled to enter site Not reported 3260 6480 9553 Did not enter site Not reported 217 182 1016 Entered site 3698 3043 6298 8537 Eligible for survey Not reported Not reported Not reported 8384dagger
Entered site and interviewed
Valid breath sampledaggerdaggerdagger 3353 (907) 3192 (863)
2971 (976) 2850 (937)
6045 (960) 6028 (957)
6920 (825)daggerdagger
7159 (854)daggerdagger
dagger Commercial vehicles not eligible daggerdagger Because previous surveys did not inform about the eligibility of the drivers percentages for the years 1973 1986 and 1996 are based on drivers who stopped and entered the site Percentages for 2007 are based on drivers who not only were stopped and entered site but also were eligible for the survey (ie noncommercial drivers drivers aged 16 and older and not constrained by language barriers) Percentages are based on nighttime drivers daggerdaggerdagger Some drivers provided breath samples but declined to be interviewed In this table percentages are unweighted
The basic procedure in the 2007 NRS as well as in the prior three surveys was for the law enforcement officer working with the survey team to direct the potential respondent into the survey site without speaking to the driver Once in the site the driver was directed into a research bay and was approached by an interviewer and recruited to participate in the interview Prospective participants were informed that they had done nothing wrong and that the interview concerned traffic safety and was anonymous A PAS reading was also taken at this point If the individual agreed to participate the interviewer asked the 22 questions on the traditional NRS protocol and requested a breath sample Only after the completion of the standard NRS procedure did the additional data collection for the 2007 NRS begin A detailed description of the survey procedures is provided in the Methodology Report (Lacey et al 2009a)
As indicated in Table 10 which presents response patterns for both the daytime and nighttime data collection periods over 13000 vehicles were selected to participate in the 2007 NRS of these 10909 entered the data collection site and the drivers were determined to be eligible for survey participation (for example commercial vehicles such as pizza delivery vehicles drivers under the age of 16 and drivers who could not communicate with us either in English or Spanish were not eligible to participate) Eighty-three percent of eligible drivers participated in the survey and because some of those that refused the survey did agree to provide a breath sample BACs from the PBTs were available on 86 percent of the eligible drivers Among eligible drivers 71 percent provided an oral fluid sample 72 percent completed a drug questionnaire
21
2007 National Roadside Survey of Alcohol and Drug Use by Drivers Drug Results
andor the AUD questionnaire and 39 percent of eligible nighttime drivers provided a blood sample10
Table 10 Participating Drivers (Percentages in Parentheses)
2007 Daytime Nighttime Total
Signaled to enter site 3516 9553 13069 Did not enter site 933 1016 1949 Entered site 2583 8537 11120 Eligible 2525 8384 10909 Entered site and interviewed Valid breath sample Oral Fluid sample Blood sample AUD ampor Drug Questionnaire
2174 (861)dagger
2254 (893)dagger
1850(733)dagger
NA
1889 (752)dagger
6920 (825)dagger
7159 (854)dagger
5869 (700)dagger
3276 (391)dagger
5983 (714)dagger
9094 (834)dagger
9413 (863)dagger
7719 (707)dagger
NA
7882 (722)dagger
NA (not applicable) Blood samples were not collected during daytime sessions In this table percentages are unweighted dagger Percent of eligible
To prevent impaired drivers from continuing to drive a special ldquoImpaired Driver Protocolrdquo was developed to ensure the safety of both the drivers and the public Impairment was determined by the interviewerrsquos observation of the driverrsquos behavior and by the use of a PAS If there was any sign of possible impairment the interviewer signaled the survey manager who administered a breath test with a preliminary breath test (PBT) device that displayed the actual BAC If the driverrsquos BAC was 05 gdL (grams per deciliter) or higher the survey manager provided the participant with several options for getting home without driving11 This system has been successful in preventing identified impaired drivers from returning to the road where they could be a danger to themselves or others A full description of the Impaired Driver Protocol is provided in Appendix E of the Methodology Report (Lacey et al 2009a)
A significant concern for all four NRS studies was that high BAC drivers might be less likely to agree to participate resulting in an underestimate of the number of risky drinking drivers on the road Data from the 1996 NRS and from relative risk studies such as that of Blomberg Peck Moskowitz Burns and Fiorentino (2001 p 117) have suggested that drivers who refuse the breath test are likely to have higher BACs than those who agree to participate This was corrected somewhat in the 1996 and 2007 NRS studies by using the PAS data collected as part of the consent process During the data collection process a PAS was used when the driver was first approached to participate in the survey The PAS provides a nine-unit estimate of what a true BAC measure collected by the PBT device would be We correlated the PAS and other measures (specifically gender and time of night) to impute the BACs of drivers who entered the site but refused to provide a breath sample Thus the actual BACs collected in both the 1996 and the 2007 NRS studies were corrected for nonparticipating drivers
10 Typically only drivers who had completed the oral fluid step provided a blood sample 11 Our threshold of 05 gdL was more conservative than the legal per se limit of 08 gdL
22
2007 National Roadside Survey of Alcohol and Drug Use by Drivers Drug Results
Driver Conversion As presented in the Methodology Report (Lacey et al 2009a) there were 444 attempts to convert drivers who had initially declined to participate in our study (ie to change their minds and provide us with at least a breath sample) This was done to develop an understanding of whether drivers who refused to participate were more or less likely to be alcohol or drug positive than those who initially agreed to participate Drivers who refused were offered a $100 incentive as an inducement to convert Of the 444 total attempts 50 percent were successfully converted (ie provided a breath sample) Among those converted drivers 156 (70) also provided an oral fluid sample and 49 drivers (22) also provided a blood sample
Tables 11 and 12 show the outcome of the Oral Fluid and Blood analyses (respectively) performed on the converted drivers Among converted drivers who provided an oral fluid sample the distribution of drivers who were drug positive appears to be somewhat higher than that of the total sample of daytime and nighttime participants where 110 percent of the general daytime samples were positive (as compared to 162 of converted drivers) and 144 percent of the general nighttime samples were positive (compared to the 170 of converted drivers) These differences however were not statistically significant
Table 11 Oral Fluid Analysis Results Among Converted Drivers
Daytime Nighttime Presence of Drugs N N in Oral Fluid (Unweighted) (Weighted) (Unweighted) (Weighted) Negative 27 838 107 831 Positive 6 162 16 170 All 33 100 123 100
Among drivers who were converted and provided a blood sample 127 percent were drug positive This distribution is very similar to that of the total nighttime participants who provided blood where 138 percent were drug positive (blood was not collected in the daytime sample) Given the low sample size statistical tests were not performed
Table 12 Blood Analysis Results Among Converted Drivers
Presence of Drugs in Blood
Negative Positive
Nighttime N
(Unweighted)
(Weighted) 43 873
6 127 All 49 100
23
2007 National Roadside Survey of Alcohol and Drug Use by Drivers Drug Results
Selection of Drugs for Screening and Analysis PIRE and NHTSA jointly developed an initial list of drugs to be detected based on the literature (eg Jones Shinar amp Walsh 2003 Couper amp Logan 2004) and experience with drug-involved driving research The drugs were selected because of a combination of their potential impaired-driving effects their likelihood of appearing in drivers and in the case of oral fluid the availability of scientific techniques to analyze oral fluid to detect and quantify the drug NHTSA then provided this list to experts in the field of epidemiology of drug use driving and toxicology both in the United States and abroad The experts responded to the list with additions and deletions
The list of selected drugs is shown in Table 13 The first five categories of drugs listed constitute the National Institute on Drug Abuse (NIDA)-5 which are prevalent drugs of abuse and of universal interest in the study of drug involvement The NIDA-5 are routine components of a drug-screening panel The other drugs on the list (with the exception of barbiturates) appear in the NHTSA publication titled ldquoDrugs and Human Performance Fact Sheetsrdquo (Couper amp Logan 2004) and are of interest because the expert panel for that effort believed those drugs presented potential traffic safety risks The drugs we tested for represented illegal prescription and overshythe-counter drugs that (1) have the potential to impair driving performance and (2) could reasonably be expected to appear in the driver population
Table 13 Selected Drugs and Minimum Detection Concentrationsdagger
Drug Class Minimum Concentration
Oral Fluid (ngmL) Minimum Concentration
Blood (ngmL) Self-report Item
Screen Confirm Screen Confirm
Cocaine (Cocaine benzoylecgonine)
20 8 25 10 Cocaine (eg crack or coke)
Opiates (6-AM codeine morphine hydrocodone hydromorphone)
40 10 25 10
Heroin Morphine or Codeine (eg Tylenolreg with codeine)
Amphetamine Methamphetamine (MDMA MDA MDEA Ephedrine Psuedoephedrine)
50 50
50 20 20
10
Amphetamine or Methamphetamine (eg speed crank crystal meth) Ecstasy
Cannabinoids (THC THC-COO[THCA])
4 2 10 1 Marijuana (eg pot hash weed)
Phencyclidine 10 10 10 10 PCP (eg angeldust) Benzodiazepines (oxazepam nordiazepam bromazepam flurazepam
10 5 20 10 Benzodiazepines (eg Valiumreg or tranquilizers)
24
2007 National Roadside Survey of Alcohol and Drug Use by Drivers Drug Results
Drug Class Minimum Concentration
Oral Fluid (ngmL) Minimum Concentration
Blood (ngmL) Self-report Item
Screen Confirm Screen Confirm
flunitrazepam lorazepam chlordiazepoxide temazepam diazepam clonazepam alprazolam triazolam midazolam nitrazepam) Barbiturates (Phenobarbital pentobarb secobarbital butalbital)
50 50 500 500 Barbiturates (eg phenobarbital)
Methadone 50 25 50 10 Methadone Ethyl alcohol 02 02 02 02 Alcohol Oxycodone (Percocetreg) 25 10 25 10 Prescription pain
killers (eg Percocetreg OxyContinreg oxycodone Demerolreg Darvonreg)
Propoxyphene (Darvonreg)
10 10 10 10
Tramadol (Ultramreg) 50 25 50 10 Carisoprodol (Somareg) 100 50 500 500 Meperidine (Demerolreg) Sertraline (Zoloftreg) 50 25 50 10
Antidepressants (eg Prozacreg Zoloftreg)
Fluoxetine (Prozacreg) 50 25 50 10 Tricyclic Antidepressants (amitryptiline nortriptyline)
25 25 25 10
Zolpidem (Ambienreg) 10 10 10 10 Ambienreg or other sleep aids
Methylphenidate (Ritalinreg)
10 10 10 10 ADHD medications (eg Ritalinreg)
Dextromethorphan 50 20 50 20 Cough medicines (eg Robitussinreg Vicks 44reg etc)
Ketamine 10 10 10 10 KetamineSpecial K daggerScreening utilizes ELISA micro-plate and confirmation utilizes GCMS or LCMSMS technology
We screened using ELISA micro-plate technology Confirmation was performed using GCMS or LCMSMS technology Our toxicological laboratory Immunalysis Corporation provided all necessary confirmations
Cocaine which can be used as a local anesthetic is often abused because of its stimulating effects on the central nervous system (CNS) At low doses cocaine might actually have performance enhancing effects however little is known about its effects on human performance at higher levels and in conjunction with alcohol It is clearly a drug of abuse in the United States and worthy of study in drivers
Opiates are narcotic analgesics used both medicinally and as drugs of abuse After an initial rush opiates act as CNS depressants and certainly could have performance-decreasing effects
25
2007 National Roadside Survey of Alcohol and Drug Use by Drivers Drug Results
Amphetamines are CNS stimulants and are used both medicinally and as drugs of abuse Amphetamines are generally taken recreationally and to enhance performance (eg truck drivers staying awake) Ecstasy falls within this category and as a methylated amphetamine derivative it also has hallucinogenic properties Amphetamines have been associated with crash occurrence and could logically be associated with driving impairment both in the stimulation and withdrawal stages in the latter case especially as the drug interacts with fatigue The analytical methodology is described in an article by Moore Coulter and Crompton (2007)
Cannabinoids have a variety of effects on humans and can be associated with stimulant sedative and hallucinogenic effects Both the experimental and epidemiologic evidence on cannabinoidsrsquo effects on driving are mixed When marijuana is found in drivers however it is often in conjunction with alcohol where an impairing effect is more likely The most prevalent drug detected in the pilot study was marijuana (Lacey et al 2007) There appeared to be a strong positive correlation between the oral fluid and blood tests and the only discrepancies found in the pilot study (negative oral fluid and a positive blood) were from 10 cases in which the inactive metabolites were detected in blood but not the active tetrahydrocannabinol (THC) A positive metabolite result (THCA) with a negative parent compound (THC) is consistent with less recent use (eg in the days before sample was taken) A positive oral fluid for the parent compound is likely to be associated with very recent THC use the timeframe consistent with potential impairing effects Thus such oral fluid results can be very informative The laboratory procedures for testing the oral fluid results have been previously published in several articles (Moore et al 2006 Moore Rana amp Coulter 2007c Coulter Miller Crompton amp Moore 2008)
Phencyclidine (PCP) is related to veterinary tranquilizers such as ketamine that impair motor ability but it also has hallucinogenic effects and is used as a recreational drug PCP has serious performance diminishing effects and has been found in impaired-driving cases Its determination in oral fluid has recently been published in Coulter Crompton and Moore (2008)
Benzodiazepines include many widely prescribed drugs (eg Valiumreg Xanaxreg) to reduce anxiety These drugs act as CNS depressants show cross-tolerance to ethanol and are potentially associated with driver impairment Different types of benzodiazepines have very short to very long half-lives For example the desiredtherapeutic effect of lorazepam (Ativanreg) is sedation which would obviously have a detrimental effect on driving a motor vehicle The most common benzodiazepine is diazepam (Valiumreg) andor its metabolites nordiazepam oxazepam and temazepam The confirmation procedure for the 2007 study included LCMSMS confirmation using the method described in Moore Coulter Crompton and Zumwalt (2007)
Barbiturates are still widely prescribed CNS depressants and in some cases as anti-epileptic medications Because of their depressive effects barbiturates are associated with delayed reaction times and possibly loss of concentration both effects likely to affect driving performance
Methadone a narcotic analgesic is used both medicinally for opiate detoxification and maintenance and for pain relief It has also been used as a drug of abuse It may have differential performance effects in naiumlve or recreational users versus tolerant therapeutic users and certainly deserves study
Painkillers are a class of drugs that may lead to driving impairment Commonly used painkillers include oxycodone (an opioid) Oxycodone has similar effects to morphine and heroin If used in
26
2007 National Roadside Survey of Alcohol and Drug Use by Drivers Drug Results
combination with other depressants of the CNS such as alcohol or benzodiazepines it can cause severe impairment or lead to death Tramadol an opiate analgesic has similar effects to oxycodone Propoxyphene and meperidine also atypical opiates are included in the panel The methods used for their analysis are described (Rana et al 2006 Moore Rana et al 2007b) Other painkillers such as carisoprodol a CNS depressant and muscle relaxant (Somareg also called Miltownreg) are used as prescription drugs but can lead to abuse Even at therapeutic concentrations carisoprodol and its metabolite meprobamate may cause driving impairment as the desired effect is sedation
Antidepressants are most commonly in the form of selective serotonin uptake inhibitors (SSRIs) such as fluoxetine (Prozacreg) and sertraline (Zoloftreg) They can cause impairment especially in circumstances where extremely high blood concentrations are measured or if they are taken outside of medical need or therapeutic treatment There is also an additional risk of impairment associated with combined use with alcohol
Sleep aids such as Ambienreg cause drowsiness and may cause dizziness If consumed with alcohol there is an increased likelihood of these symptoms Sleep aids alone or in combination with alcohol could have a detrimental effect on driving ability
Other stimulants such as methylphenidate (sold as Ritalinreg) are amphetamine-like prescription drugs commonly used to treat Attention Deficit Hyperactivity Disorder (ADHD) in children and adults They are CNS stimulants Some people abuse these drugs by crushing the tablets and snorting them The effect of this other stimulant abuse is similar to that of cocaine or amphetamine
Dextromethorphan a synthetic analog of codeine is an antitussive widely used in cough medicines (eg Robitussinreg Sucretsreg Vicks Formula 44reg) When consumed in high doses in recreational use it is a CNS depressant and may have driving impairment effects at those levels The analytical method has recently been published in Rodrigues et al (2008)
Ketamine (Special K) is used medicinally as a veterinary tranquilizer but it is also abused as a recreational drug for its psychedelic effects Ketamine use by humans would likely be associated with decrements in skills related to driving
Oral Fluid Collection Device Following the NRS interview and collection of the breath test the interviewer requested an oral fluid sample and offered a $10 incentive for providing one We used the Quantisaltrade (manufactured by Immunalysis Corporation) oral fluid collection device (see Appendix F of the Methodology Report [Lacey et al 2009a]) The subject placed this device under hisher tongue and its pad changed color (blue) when 1 mL of oral fluid (the necessary sample volume) was collected The collection device was then placed into a tube containing 3 mL of a stabilizing buffer solution and capped for storage and transport to the laboratory The steps are illustrated in Figure 2
27
2007 National Roadside Survey of Alcohol and Drug Use by Drivers Drug Results
Figure 2 Collecting an Oral Fluid Sample With the Quantisaltrade Oral Fluid Collection Device Distributed by Immunalysis Inc Pomona CA
httpwwwimmunalysiscomquantisal_procedurehtm
The oral fluid samples were labeled with pre-printed Chain-of-Custody (CoC) labels to be linked with the subject and additional data collected This allowed the specimen to be tracked throughout the project The CoC labels contained a unique identifier that corresponded to that sample This number was also entered into the PDA CoC numbers were preprinted by the laboratory and were used to maintain a documented link between each sample collected and the respondent who provided it A different CoC number was assigned to the oral fluid and blood sample for an individual subject and the laboratory was blinded to any link between them This assured the oral fluid and blood analyses and results were independent of one another
The collection of oral fluid while less invasive than the collection of blood or urine has some associated difficulties (ONeal Crouch Rollins amp Fatah 2000) Various researchers have noted that the method of collection and the medium itself (oral fluid) significantly affect drug concentration in the specimen and consequently whether some drugs can be detected at all However while some collection devices give no indication of the amount of oral fluid actually collected (rendering a quantitative result meaningless) the Quantisaltrade oral fluid collection device collects 1 mL (+10) of clear oral fluid from the donor Researchers have studied the device to assess the efficiency of drug release from the collection pad (Quintela Crouch amp Andrenyak 2006 Moore et al 2006 Moore Rana amp Coulter 2007b) and have found a high rate of extraction efficiency Tables 14 and 15 summarize the effectiveness of the Quantisaltrade oral fluid collection device across a range of drugs by two different research groups Findings above 100 percent are due to slight variations in the amount of the substances actually added to the scientific control samples (scientific error)
28
2007 National Roadside Survey of Alcohol and Drug Use by Drivers Drug Results
Table 14 Extraction Efficiency of Quantisaltrade Oral Fluid Collection Device Over a Range of Drugs Quintela
Drug Target Value (ngmL) Mean Recovery from the Pad () Amphetamine 50 943
Methamphetamine 50 1038
Cocaine 20 912
Benzoylecgonine 20 869
Codeine 40 956
Morphine 40 926
6-acetylmorphine 4 922
THC 4 914
Methadone 50 997
Oxazepam 20 1013
Source Quintela et al 2006
Table 15 Extraction Efficiency of Quantisaltrade Oral Fluid Collection Device Over a Range of Drugs Moore
Drug Target Value (ngmL) Mean Recovery from the Pad () Meperidine 25 867
Tramadol 25 877
Oxycodone 20 966
Source Moore Rana amp Coulter 2007a Moore et al 2006 THC recovery from the pad gt 80
For a more thorough discussion of the Quantisal device see the pilot study report (Lacey et al 2007)
Blood Collection Procedures After completion of the oral fluid sample and the drug questionnaire the interviewer requested that the subject provide a blood sample in exchange for an additional $50 incentive The incentives were given as money orders so subjects could not spend the money immediately especially on items such as alcohol and other drugs
Licensed phlebotomists conducted the blood draws The phlebotomist set up the blood draw station in the rear seat of a rental van The subject sat in the back seat of the van and the phlebotomist stood just outside the van or sat in the adjoining seat
During blood draws one gray-top tube (10 mL) of the subjectrsquos blood was drawn There are several types of tubes available for the collection of blood specimens with different color tops The choice of tube is dependent upon the type of test to be performed on the blood The Federal Aviation Administration (FAA) recommends the gray-topped tube for drug and alcohol testing of blood specimens The gray-top tube contains two preservatives potassium oxalate and sodium fluoride The oxalate is an anti-coagulant and the sodium fluoride is an anti-bacterial stabilizer These preservatives reduce the need for refrigeration but do not affect the ability to detect and quantify drugs Both additives are inorganic therefore they oxidize very slowly and are extremely stable The preservative helps inhibit the degradation of cocaine in storage to its
29
2007 National Roadside Survey of Alcohol and Drug Use by Drivers Drug Results
metabolite benzoylecgonine (Toennes amp Kauert 2001) The presence of sodium fluoride with or without refrigeration and potassium oxalate effectively inhibits cocaine degradation with 86 to 91 percent of the drug present after 48 hours In contrast substantial degradation of cocaine occurs in the samples stored without sodium fluoride (Brogan et al 1992) The presence of the parent drug is particularly useful in the determination of recent use since more cocaine per se (prior to its transformation to benzoylecgonine) indicates more recent drug use Additionally gray-top tubes are helpful in conducting ethanol analysis because the sodium fluoride is an effective antibacterial agent that helps inhibit endogenous alcohol production
For this study glass tubing was used as opposed to plastic to better maintain reliable drug results For example in a study by Christophersen (1986) on the stability of THC in whole blood during storage THC concentration in blood stored in glass vials for four weeks at -20 C remained unchanged however blood stored in plastic vials lost 60 to 100 percent of its THC content during storage Thus glass vials are recommended for collection of blood samples where marijuana content is suspected In this study approximately 10 percent of the blood samples were analyzed immediately upon receipt by the laboratory However the remaining samples were stored at 4 degrees Centigrade until additional funding was obtained for their analyses approximately one year later As a check on 13 samples which had been analyzed initially and were found to be positive for THC andor its metabolites reanalysis for THC and its metabolites one year later revealed that though values obtained were generally lower than in the initial analyses each specimen tested positive for THC andor a metabolite at the retest Additionally six samples which initially had been found to be positive for cocaine andor its metabolites were reanalyzed and though parent drug values had eroded metabolite values had increased and all were still positive for cocaine at retest For eight opiate samples and six amphetamine samples the results at retest remained positive after one year
The blood sample tubes were labeled with pre-printed Chain-of-Custody (CoC) labels that linked the blood sample to the oral fluid sample to the subject so the specimen could be tracked throughout the project The CoC labels contained a unique identifier that corresponded to that sample thus there was no identifying information traceable to the subject This number was also entered into the PDA CoC numbers were preprinted by the laboratory and were used to maintain a documented link between each sample collected and the respondent who provided it As noted above a different CoC number was assigned to the oral fluid and blood sample for an individual subject and the laboratory was blinded to any link between them
In the few cases where phlebotomists were not able to draw a full tube for a subject because some individuals had small andor difficult-to-locate veins the laboratory was able to conduct an initial screening test however it was not able to conduct a confirmatory analysis by GCMS due to the insufficient volume
At the conclusion of the blood draw procedure the subject received the $50 incentive and sat for a moment in the blood draw station The subject was offered a piece of candy before being directed safely out of the survey site and back onto the roadway
Once collected blood samples were stored either in refrigerators or in coolers with blue ice packs if no refrigeration was available The samples were subsequently shipped to the laboratory with blue ice as an additional precaution
Spanish-speaking participants were escorted to the phlebotomist by the Spanish-speaking interviewer and a Spanish consent form was given to the participant The interviewer read the
30
2007 National Roadside Survey of Alcohol and Drug Use by Drivers Drug Results
consent form to them and stayed with the participant to answer any questions and provide translation between the phlebotomist and participant
Drug Questionnaire While they provided an oral fluid sample drivers were asked to complete a drug questionnaire The 27-item questionnaire (Table 16) included a list of drugs including tobacco cough medicine other illegal prescription and over-the-counter drugs For items 1-23 subjects indicated when they last used a particular medicationdrug by responding ldquoTonightrdquo ldquoPast 2 daysrdquo ldquoPast monthrdquo Past yearrdquo ldquoOver a year agordquo or ldquoNeverrdquo
Table 16 Drug Questionnaire Survey
Item Drugs
1 Tobacco (eg cigarettes cigars)
2 Cough medicines (eg Robitussin Vicks 44 etc)
3 Other over-the-counter medicines
4 Prescription Pain Killers (eg Percocet OxyContin Oxycodone Demerol Darvon)
5 Ambien or other sleep aids
6 ADHD medications (eg Ritalin Aderall Concerta)
7 Muscle relaxants (eg Soma Miltown)
8 Prescription dietary supplements (eg Phentermine)
9 Antidepressants (eg Prozac Zoloft)
10 Marijuana (eg pot hash weed)
11 Cocaine (eg crack or coke)
12 Heroin
13 Methadone
14 LSD (acid)
15 Morphine or Codeine (eg Tylenol with Codeine)
16 Ecstasy (eg ldquoErdquo Extc MDMA ldquoXrdquo)
17 Amphetamine or Methamphetamine ( eg speed crank crystal meth)
18 GHB
19 PCP (eg Angeldust)
20 Rohypnol (Ruffies)
21 Ketamine (Special K)
22 Benzodiazepines (eg Valium or tranquilizers)
23 Barbiturates (eg Phenobarbital) Do you believe any of the medicationsdrugs you have taken (or are taking) could affect your 24 driving Have you taken any medications or drugs in the past YEAR that you think may have affected your 25 driving
26 Have you taken any medications or drugs TODAY that you think may affect your driving
27 Have you ever NOT driven because you were on a medicationdrug
31
2007 National Roadside Survey of Alcohol and Drug Use by Drivers Drug Results
Biological Sample Analysis Procedures The following sections briefly describe the analytic techniques used in the analyses of oral fluid and blood samples to determine the presence of the drugs of interest in this study
Oral Fluid Sample Analysis Procedures Each weekend the tubes from each data-collection period were packaged together and sent overnight to a laboratory for analysis Upon receipt of the specimens in the testing facility screening analysis was carried out using enzyme-linked immunosorbent assays (ELISA) at the cut-off concentrations described in Table 13 Screen positive specimens were then reanalyzed using a separate sample of the fluid using gas chromatography-mass spectrometry (GCMS) or liquid chromatography with tandem mass spectral detection (LCMSMS) according to standard operating procedures All methods were fully validated according to good laboratory practices and all standard operating procedures are on file at Immunalysis Corporation
Gas Chromatography-Mass Spectrometry (GCMS) Instrumentation
Agilent 6890 gas chromatography - 5973 or 5975 mass selective detector (GCMSD) electron impact (EI) mode
Extraction
Oral fluid (1 mL) of diluted specimen (13 buffer) was extracted using mixed mode solid phase methods with drug specific column phases
Derivatization
Drug specific derivatives used for maximum detectability and stability
Drugs included in the confirmation profile are shown in Table 13
Liquid Chromatography-Tandem Mass Spectrometry (LCMS-MS) Instrumentation
Agilent LCMS-MS System 1200 Series LC pump 6410 Triple Quadropole
Zorbax Eclipse XDB C18 (46 x 50mm x 18 μm) column
Extraction
Blood (1 mL) protein precipitate with cold acetonitrile mixed mode solid phase extraction using drug specific column phases
32
2007 National Roadside Survey of Alcohol and Drug Use by Drivers Drug Results
Blood Sample Analysis Procedures Upon receipt of the specimens by the testing facility screening analysis for 10 percent of the sample was carried out using enzyme-linked immunosorbent assays (ELISA) at the cut-off concentrations described in Table 13 The remaining 90 percent of the sample was stored at 4deg centigrade until funding was provided for their analysis Again specific drugs tested are shown in Table 13 Screen positive specimens were confirmed using either gas chromatography with mass spectral detection (GCMS) or liquid chromatography with tandem mass spectral detection (LCMSMS) All methods were fully validated according to good laboratory practices See above for instrumentation
Ethanol (Oral Fluid and Blood) Screen positive alcohol specimens were sent for confirmation to BioTox Laboratories or Immunalysis Corporation
Instrumentation
Perkin-Elmer Model F-45 Gas Chromatograph
Flame ionization detector (FID)
02 percent Carbowax 1500 Graphpac-GC 80100 column (6 ft x 18 in ID)
Extraction
Whole blood or 13 buffered oral fluid (01 mL) add 1 mL double deionized water containing 01 percent propanol
Analyzed using headspace GCFID
Drug Classes and Categories Due to the large number of drugs tested results were consolidated into drug classes and categories Drug classes are defined according to potential drug effects and include stimulants sedatives marijuana antidepressants narcotic analgesics and other Drugs were separately categorized as illegal prescription and over-the-counter12 13 Though some drugs could logically fall into more than one category we made the categories mutually exclusive and assigned each drug to only one category This approach facilitates clear presentation of results
Tables 17 and 18 present drug classes and categories In the tables the shaded entries indicate drugs that were identified only through blood analyses The non-shaded entries are drugs that were identified through both oral fluid and blood analyses
12 Drugs may be classified in different ways depending on the use of the classification system For example in NHTSArsquos drug evaluation and classification (DEC) program the categories CNS Depressants CNS Stimulants Hallucinogens Dissociative Anesthetic (PCP) Narcotic Analgesics Inhalants and Cannabis are used 13 Due to relative small sample sizes and for analytical purposes the over-the-counter and prescription categories were further collapsed into a single category (ldquoMedicationsrdquo)
33
20
07 N
atio
nal R
oads
ide
Sur
vey
of A
lcoh
ol a
nd D
rug
Use
by
Driv
ers
Dru
g R
esul
ts
34
Tab
le 1
7 D
rug
Cla
ss C
om
po
siti
on
mdashO
ral F
luid
an
d B
loo
d C
om
bin
ed
Sti
mu
lan
ts
Sed
ativ
es
Mar
ijuan
a A
nti
dep
ress
ants
N
arco
tic
An
alg
esic
s O
ther
Am
ph
etam
ines
B
arb
itu
rate
s C
ann
abin
oid
s S
SR
Is
Met
had
on
e
C
ou
gh
Su
pp
ress
ants
Am
phet
amin
e
But
albi
tal
TH
C
Flu
oxet
ine
Met
hado
ne
Dex
trom
etho
rpha
nM
DA
P
heno
barb
ital
11-O
H-T
HC
D
esm
ethy
lser
tral
ine
ED
DP
MD
EA
Pen
toba
rbita
l T
HC
-CO
OH
S
ertr
alin
e
S
tree
t D
rug
s M
DM
A
Sec
obar
bita
l
N
orflu
oxet
ine
O
pia
tes
Ket
amin
e M
etha
mph
etam
ine
6-A
M (
Her
oin)
N
orke
tam
ine
P
hent
erm
ine
B
enzo
dia
zep
ines
Tri
cyc
lics
6-
AC
(H
eroi
n im
purit
y)
PC
P
Pse
udoe
phed
rine
Alp
razo
lam
Am
itrip
tylin
e C
odei
ne
P
heny
lpro
pano
lam
ine
Alp
ha-h
ydro
xyal
praz
olam
Nor
trip
tylin
e M
orph
ine
C
hlor
diaz
epox
ide
D
oxep
in
H
ydro
codo
ne
Co
cain
e D
iaze
pam
Des
met
hyld
oxep
in
Hyd
rom
orph
one
Coc
aine
Lo
raze
pam
Im
ipra
min
e O
xyco
done
Ben
zoyl
ecgo
nine
O
xaze
pam
Des
ipra
min
e O
xym
orph
one
Coc
aeth
ylen
e T
emaz
epam
Trim
ipra
min
e
Nor
coca
ine
Tria
zola
m
C
lom
ipra
min
e
Aty
pic
al O
pio
ids
Alp
ha-h
ydro
xytr
iazo
lam
Am
oxap
ine
Tra
mad
ol
AD
HD
Med
icat
ion
s
C
lona
zepa
m
P
rotr
ipty
line
Mep
erid
ine
M
ethy
lphe
nida
te
Flu
nitr
azep
am
M
apro
tilin
e N
orm
eper
idin
e
7-
amin
oflu
nitr
azep
am
P
ropo
xyph
ene
Bro
maz
epam
Sle
ep A
ids
N
orpr
opox
yphe
ne
Nitr
azep
am
Z
olpi
dem
Est
azol
am
M
idaz
olam
Flu
raze
pam
N
ordi
azep
am
Car
iso
pro
do
l
C
aris
opro
dol
M
epro
bam
ate
Not
e S
had
ed e
ntrie
s in
dica
te d
rugs
iden
tifie
d th
roug
h bl
ood
ana
lyse
s o
nly
N
on-s
had
ed e
ntrie
s ar
e dr
ugs
ide
ntifi
ed
thro
ugh
both
blo
od
and
oral
flu
id a
naly
ses
Sel
ectiv
e S
erot
onin
Upt
ake
Inhi
bito
rs (
SS
RIs
)
20
07 N
atio
nal R
oads
ide
Sur
vey
of A
lcoh
ol a
nd D
rug
Use
by
Driv
ers
Dru
g R
esul
ts
35
Tab
le 1
8 D
rug
Cat
ego
ry C
om
po
siti
on
mdashO
ral F
luid
an
d B
loo
d C
om
bin
ed
Illeg
al
P
resc
rip
tio
n
Pre
scri
pti
on
(co
nt
) P
resc
rip
tio
n (
con
t)
Ove
r-th
e-C
ou
nte
r
Co
cain
e B
enzo
dia
zep
ines
T
ric
yclic
s A
nti
dep
ress
ants
M
eth
ado
ne
Co
ug
h S
up
pre
ssan
t C
ocai
ne
Alp
razo
lam
A
mitr
ipty
line
Met
hado
ne
Dex
trom
etho
rpha
nB
enzo
ylec
goni
ne
Alp
ha-h
ydro
xyal
praz
olam
N
ortr
ipty
line
ED
DP
C
ocae
thyl
ene
Nor
diaz
epam
D
oxep
in
C
old
Med
icin
e N
orco
cain
e C
hlor
diaz
epox
ide
Des
met
hyld
oxep
in
O
pia
tes
P
seud
oeph
edrin
e
D
iaze
pam
Im
ipra
min
e
C
odei
ne
C
ann
abin
oid
s Lo
raze
pam
D
esip
ram
ine
Mor
phin
e
T
HC
O
xaze
pam
T
rimip
ram
ine
Hyd
roco
done
11-O
H-T
HC
T
emaz
epam
C
lom
ipra
min
e H
ydro
mor
phon
e
T
HC
-CO
OH
T
riazo
lam
A
mox
apin
e O
xyco
done
Alp
ha-h
ydro
xytr
iazo
lam
P
rotr
ipty
line
Oxy
mor
phon
e
S
tree
t D
rug
s F
lura
zepa
m
Map
rotil
ine
Ket
amin
e F
luni
traz
epam
A
typ
ical
Op
ioid
s
Nor
keta
min
e 7-
amin
oflu
nitr
azep
am
S
tim
ula
nts
T
ram
adol
PC
P
Nitr
azep
am
Met
hylp
heni
date
M
eper
idin
e
M
idaz
olam
Phe
nter
min
e N
orm
eper
idin
e
Str
eet
Am
ph
etam
ines
B
rom
azep
am
Pro
poxy
phen
e
Am
phet
amin
e
C
lona
zepa
m
B
arb
itu
rate
s N
orpr
opox
yphe
ne
MD
A
Est
azol
am
But
albi
tal
MD
MA
Phe
noba
rbita
l S
leep
Aid
s
M
DE
A
SS
RIs
P
ento
barb
ital
Zol
pide
m
M
etha
mph
etam
ine
F
luox
etin
e S
ecob
arbi
tal
Phe
nylp
ropa
nola
min
e D
esm
ethy
lser
tral
ine
Car
iso
pro
do
l
S
ertr
alin
e
C
aris
opro
dol
O
pia
tes
Nor
fluox
etin
e
Mep
roba
mat
e
6-
AM
(H
eroi
n)
6-A
C (
Her
oin
impu
rity)
Not
e S
had
ed e
ntrie
s in
dica
te d
rugs
iden
tifie
d th
roug
h bl
ood
ana
lyse
s o
nly
N
on-s
had
ed e
ntrie
s ar
e dr
ugs
ide
ntifi
ed
thro
ugh
both
blo
od
and
oral
flu
id a
naly
ses
Sel
ectiv
e S
erot
onin
Upt
ake
Inhi
bito
rs (
SS
RIs
)
2007 National Roadside Survey of Alcohol and Drug Use by Drivers Drug Results
36
2007 National Roadside Survey of Alcohol and Drug Use by Drivers Drug Results
Results Since two different biological matrices (oral fluid and blood) were gathered to be analyzed for the presence of drugs we present prevalence estimates in three different ways in this report
1) We present both daytime and nighttime drug prevalence estimates based on the analyses of the oral fluid samples alone and then in combination with alcohol using breath alcohol test results Tables reporting self-report drug use observed safety measures and reports with contact with the criminal justice system and the health care system follow these results
2) We next present nighttime drug prevalence estimates based on analyses of blood14
and then in combination with alcohol using breath alcohol test results
3) The third section presents nighttime prevalence results based on the combination of the results of the oral fluid blood analyses and subsequently in combination with alcohol using breath alcohol test results We conclude this section by presenting prevalence estimates for specific drugs from oral fluid andor blood combined In each of the sections the results are presented first in terms of drivers who were positive for any drug then by class followed by category as described in Tables 17 and 18
Throughout this report we do not combine results for daytime and nighttime survey respondents but display the two groups separately because the sampling frame is different for the two groups The daytime drivers were sampled during a single Friday two-hour period in each PSU while the nighttime drivers were sampled during four two-hour periods (two on Friday night and two on Saturday night in each PSU) Thus combining the daytime and nighttime samples would not result in a meaningful representation of driver drug use overall
Each of the various sampling stages (or frames) required a separate calculation of probability which then became a component of the final probability computation reflecting all levels or frames The total weighted number of the sample was identical to the total number of eligible drivers entering the survey bays including refusers but was adjusted to reflect the estimated distribution of those drivers in the 48 contiguous States Error terms for the analyses were computed by STATA (Stat Corp 2006) to account for the differential weights and the amount of variance attributable to the various sampling frames Further information on the weighting of the data can be found in the Methodology Report (Lacey et al 2009a)
Oral Fluid Results (Daytime and Nighttime Samples) Driver Drug Use Prevalence Based on Oral Fluid Results This section of the report presents the overall results of oral fluid analyses for all of the drugs indicated in the introductory section Drivers who tested positive for one or more of the drugs we tested in oral fluid are categorized as drug-positive It should be emphasized that this set of tables aggregates over-the-counter prescription and illegal drugs and metabolites of drugs in each category indicating only that those who tested positive have recently consumed at least one of the tested drugs and not that they were necessarily impaired by the substance
14 Daytime data collection did not include requests for blood samples
37
2007 National Roadside Survey of Alcohol and Drug Use by Drivers Drug Results
Unless explicitly indicated sample size (N) refers to the actual unweighted number of respondents Percentages are weighted Sample size may vary between tables because of missing values
Comparison of drug prevalence by time of day (Table 19) indicates that 11 percent of drivers in the daytime sample were drug-positive This level was significantly lower than the 144 percent of nighttime drivers who tested positive for drugs (p lt 01)
Table 19 Drug Prevalence by Time of Day (Oral Fluid)
Time of Day N
(Unweighted) Drug Positive
(Weighted) Daytime 1850 110
Nighttime 5869 144
Further when we examined drug prevalence by time of daysession (Table 20) we found that late night (Sessions 3 and 5) drivers were significantly more likely to be drug-positive (172 and 174 respectively) than Friday daytime (Session 1) drivers (11) or Friday and Saturday early evening (Sessions 2 and 4) drivers (129 and 136 respectively) (p lt 01)
Table 20 Drug Prevalence by Time of DaySession (Oral Fluid)
Session N
(Unweighted) Drug Positive
(Weighted)
1 Friday 930 am ndash 1130 am or 130 pm ndash 330 pm
1850 110
2 Friday 1000 pm ndash Midnight 1610 129
3 Friday 100 am ndash 300 am 1299 172
4 Saturday 1000 pm ndash Midnight 1684 136
5 Saturday 100 am ndash 300 am 1276 174
Comparison of drug prevalence by time and region (Table 21) revealed that the Northeast region had the greatest percentage of drug-positive findings in the nighttime driving sample at 173 percent (p lt 05) The Northeast region also had the second highest percentage in the daytime driving sample at 125 percent (although there were no statistical differences by region during the daytime) In spite of the Northeast regionsrsquo relatively high prevalence of drug-positives no clear pattern by region emerged
38
2007 National Roadside Survey of Alcohol and Drug Use by Drivers Drug Results
Table 21 Drug Prevalence by Time of Day and Region15 (Oral Fluid)
N Drug Positive Time of Day Region (Unweighted) (Weighted)
Daytime
Midwest Northeast South West
546 379 472 453
115
125
131
89
Overall Daytime 1850 110
Nighttime
Midwest
Northeast
South
West
1694
1111
1559
1505
150
173
140
129
Overall Nighttime 5869 144
Although the daytime driving sample showed no statistically significant difference in drug prevalence between males and females (Table 22) in the nighttime driving sample male drivers were significantly more likely to be drug-positive (165) than female drivers (113) (p lt 01)
Table 22 Drug Prevalence by Time of Day and Gender (Oral Fluid)
N Drug Positive Time of Day Gender (Unweighted) (Weighted)
Daytime Males Females
1032 811
110
113
Overall Daytime 1843 110
Nighttime
Males
Females
3605
2250
165
113
Overall Nighttime 5855 144
Comparison of drug prevalence by time of day and age (Table 23) showed that within the daytime driving sample drivers aged 45-64 showed the highest percentage of drug positives and drivers aged 16-20 and aged 65+ were significantly less likely to be positive than other ages of drivers (p lt 05) In the nighttime driving sample drivers aged 45-64 and 65+ were significantly less likely to be drug positive (p lt 01) Drivers aged 16-20 21-34 years and 35-44 years all had results similar to each other Age was self-reported by respondent Note that in Table 23 as well as upcoming tables the age ranges are not of equal intervals but were developed to roughly
15 Regions are defined by the NASSGES system according to US Census Regions (Midwest includes the West North Central and East North Central States Northeast includes New England and Middle Atlantic States South includes the West South Central East South Central and South Atlantic States and West includes West and Mountain States
39
2007 National Roadside Survey of Alcohol and Drug Use by Drivers Drug Results
categorize underage drivers (16-20) young drivers (21-34) followed by middle age and late middle age (35-44 and 45-64) and finally by senior drivers (65+ years)
Table 23 Drug Prevalence by Time of Day and Age (Oral Fluid)
N Drug Positive Time of Day Age (Unweighted) (Weighted)
Daytime
16-20 21-34 35-44 45-64 65+
99 436 374 668 245
62
112
116
133
64
Overall Daytime 1822 111
Nighttime
16-20 21-34 35-44 45-64 65+
961 2437 1042 1216
148
161
171
152
95
20
Overall Nighttime 5804 146
Gender comparisons within age groups (Table 24) revealed that within the daytime sample drug prevalence among female daytime drivers aged 45-64 (168) was significantly higher than male drivers of the same age group (97) (p lt 05) The same was true of the nighttime sample with drug prevalence among female drivers aged 45-64 (131) being significantly higher than male drivers of the same age group (72) (p lt 01)
Within the daytime sample drug prevalence among male drivers aged 21-34 years was statistically higher than among female drivers of the same age group (139 versus 75) (p lt 05) Additionally in the nighttime sample drug prevalence among male drivers in age categories 16-20 years 21-34 years and 35-44 years was significantly higher than the same-aged female counterparts (p lt 01)
40
2007 National Roadside Survey of Alcohol and Drug Use by Drivers Drug Results
Table 24 Drug Prevalence by Time of Day Age and Gender (Oral Fluid)
N Drug Positive Time of Day Gender Age (Unweighted) (Weighted)
Daytime
Males
16-20
21-34
35-44
45-64
65+
59
243
192
362
161
45
139
137
97
71
Overall Males ndash Daytime 1017 110
Females
16-20
21-34
35-44
45-64
65+
39
192
181
304
84
103
75
101
168
48
Overall Females ndash Daytime 800 114
Nighttime
Males
16-20
21-34
35-44
45-64
65+
598
1492
630
734
101
207
202
182
72
19
Overall Males ndash Nighttime 3555 167
Females
16-20
21-34
35-44
45-64
65+
362
940
409
480
47
95
119
109
131
23
Overall Females ndash Daytime 2238 113
Comparisons by self-reported race and ethnicity (Table 25) showed that in both the daytime and nighttime samples drivers who identified themselves as Asian were significantly less likely to be drug-positive (41 and 18 respectively) than drivers who identified themselves as African American Hispanic White or Other (p lt 05 at daytime p lt 01 at nighttime) Although statistically non-significant African American drivers were found to have the highest percentage of drug-positive results in both daytime (144) and nighttime (205) samples followed by Other (128 daytime and 162 nighttime) and White (116 daytime and 15 nighttime)
41
2007 National Roadside Survey of Alcohol and Drug Use by Drivers Drug Results
Table 25 Drug Prevalence by RaceEthnicity (Oral Fluid)
N Drug Positive Time of Day RaceEthnicity (Unweighted) (Weighted)
Daytime
African American Asian Hispanic White Other
267 46
253 1192
59
144
41
89
116
128
Overall Daytime 1817 112
Nighttime
African American Asian Hispanic White Other
973 191
1006 3355
272
205
18
118
150
162
Overall Nighttime 5797 146
RaceEthnic groups other than ldquoHispanicrdquo are always ldquonon-Hispanicrdquo
Comparisons of drug prevalence by education level (Table 26) revealed that prevalence of drug use increased from the daytime sample to the nighttime sample across all education levels except ldquosome collegerdquo Daytime drivers who identified themselves as college graduates or having some graduate experience were statistically less likely to be drug-positive than those with less education (p lt 01) This remained the case within the nighttime sample but only for drivers who identified themselves as college graduates (p lt 01)
Table 26 Drug Prevalence by Education Level (Oral Fluid)
N Drug Positive Time of Day Education Level (Unweighted) (Weighted)
Daytime
Not a High School Graduate High School Graduate Some College College Graduate Some Graduate Work
162 476 593 419 173
154
150
139
55
41
Overall Daytime 1823 111
Nighttime
Not a High School Graduate High School Graduate Some College College Graduate Some Graduate Work
573 1470 2218 1156
387
184
224
116
95
157
Overall Nighttime 5804 146
Comparing drug prevalence by employment status (Table 27) showed that in the daytime sample drug prevalence among unemployed drivers and drivers on disability was significantly higher than that of employed drivers or homemakers students and those who reported they were
42
2007 National Roadside Survey of Alcohol and Drug Use by Drivers Drug Results
retired (p lt 01) In the nighttime sample drug prevalence among drivers on disability was again significantly higher than employed drivers (p lt 01) while no statistical difference in drug prevalence was found in the nighttime sample between unemployed and employed drivers Within the nighttime sample employed drivers had significantly higher drug prevalence than ldquohomemakerrdquo and ldquoretiredrdquo drivers (p lt 01)
Table 27 Drug Prevalence by Employment Status (Oral Fluid)
N Drug Positive Time of Day Gender (Unweighted) (Weighted)
Daytime
EmployedSelf Employed Homemaker Student UnemployedRetired On Disability Other
1240 90 73 78
286 45 11
104
42
72
213
139
387
307
Overall Daytime 1823 111
Nighttime
EmployedSelf Employed Homemaker Student UnemployedRetired On Disability Other
4618 104 585 204 205
67 22
150
59
132
168
74
412
43
Overall Nighttime 5805 146
Drug prevalence rates among drivers of various vehicle types (passenger vehicle pickup sports utility vehicles (SUV) vanminivan and motorcycles) (Table 28) were not statistically different in the daytime sample Note however that motorcyclists had the greatest percentage of drug-positive results in both the daytime and nighttime samples although this difference was found to be statistically significant only in the nighttime sample (p lt 01)
43
2007 National Roadside Survey of Alcohol and Drug Use by Drivers Drug Results
Table 28 Drug Prevalence by Vehicle Type (Oral Fluid)
Drug Time of N Positive
Day Vehicle Type (Unweighted) (Weighted)
Passenger Vehicle 952 121
Pickup 285 66
SUV 394 97Daytime Van amp Minivan 177 126
Motorcycle 30 248
1838 110
Passenger Vehicle 3623 151
Pickup 695 144
SUV 1055 121
Overall Daytime
Nighttime Van amp Minivan 381 130
Motorcycle 73 324
5827 145Overall Nighttime
Driver Drug Use Prevalence by Drug Class Based on Oral Fluid Results In this section of the report we display driver drug use prevalence by class of drug The classes of drugs for which we tested were antidepressants marijuana narcotic-analgesics sedatives stimulants and other (see Table 17) Because some drivers tested positive for drugs in more than one class an additional mutually exclusive category ldquoMore than 1 Classrdquo appears in the drug class tables This was done to avoid double counting individual positive results Thus for example since marijuana is both a class by itself and could appear in the ldquoMore than 1 classrdquo cell as well (as could other classes of drugs) from these tables one cannot arrive at an overall prevalence estimate for marijuana alone Detailed summaries of prevalence estimates for individual drugs appear in Tables 137-140 later in the report
Drug Class
Comparison of drug classes by time of day (Table 29) indicated that when examining all drivers nighttime drivers were significantly more likely to test positive for more than one drug class (23) than daytime drivers (15) (p lt 01)
Table 29 Number and Distribution of Drug Classes by Time of Day (Oral Fluid)
Number of N Time of Day Drug Classes (Unweighted) (Weighted)
1 206 95
2+ 40 15Daytime Negative 1604 890
1850 1000
1 680 121
2+ 156 23
Overall Daytime
Nighttime Negative 5033 856
5869 1000Overall Nighttime
44
2007 National Roadside Survey of Alcohol and Drug Use by Drivers Drug Results
However when examining only drug-positive drivers (Table 30) there were no significant differences between daytime and nighttime drivers in the percentage of single-drug users (862 versus 837) or multi-drug users (138 versus 163)
Table 30 Number and Distribution of Drug Classes by Time of Day (Drug Positives Only) (Oral Fluid)
Number of N Time of Day Drug Classes (Unweighted) (Weighted)
Daytime 1 2+
206 40
862 138
Overall Daytime 246 1000
Nighttime 1 2+
680 156
837 163
Overall Nighttime 836 1000
In comparing prevalence of drug classes by time and region (Table 31) it was found that marijuana was generally the most common drug class across all the regions both in daytime (39) and nighttime (61) samples Nighttime drivers in the Midwest and Northeast regions were more likely to test positive for marijuana than daytime drivers (p lt 05) However marijuana results in the South and West regions did not differ between daytime and nighttime drivers For stimulants a higher percentage of nighttime drivers in all regions tested positive than did daytime drivers However the difference was statistically significant only in the Midwest (p lt 01) and West (p lt 05)
45
2007 National Roadside Survey of Alcohol and Drug Use by Drivers Drug Results
Table 31 Drug Classes by Time of Day and Region (Oral Fluid)
Time of Midwest Northeast South West All Day Drug Class
N=546 N=379 N=472 N=453 N=1850
Antidepressants 04 06 05 05 05
Marijuana 34 30 55 40 39
Narcotic-Analgesics 27 21 13 06 16
Sedatives 19 26 21 07 16Daytime Stimulants 08 17 22 20 16
Other 00 13 00 00 02
More than 1 Class 22 10 14 12 15
115 125 131 89 110
885 875 869 911 890
Overall Drug Positive Daytime
Negative
N=1694 N=1111 N=1559 N=1505 N=5869
Antidepressants 05 02 00 01 02
Marijuana 77 76 63 41 61
Narcotic-Analgesics 10 28 12 18 16
Sedatives 11 02 07 04 06Nighttime Stimulants 30 23 27 40 32
Other 02 00 01 05 03
More than 1 Class 16 41 29 20 23
150 173 140 129 144
850 827 860 871 856
Overall Drug Positive Nighttime
Negative
ldquoMore than 1 Classrdquo ndash Drivers testing positive for more than one drug are only counted in this category In this table percentages are weighted
Comparison of drug class by time and gender (Table 32) showed that males were significantly more likely to test positive for marijuana than females in samples of both daytime (59 males versus17 females) and nighttime (74 males versus 41 females) drivers (p lt 01) In the daytime sample females were more likely to test positive for narcotic-analgesics and sedatives than were males (p lt 01) however a statistical difference of this kind was not detected in the nighttime sample
46
2007 National Roadside Survey of Alcohol and Drug Use by Drivers Drug Results
Table 32 Drug Classes Distribution by Time of Day and Gender (Oral Fluid)
Time of Males Females Total Day Drug Class
Daytime
Antidepressants Marijuana Narcotic-Analgesics Sedatives Stimulants Other More than 1 Class
N=1032 01 59 10 12 18 00 10
N=811 09 17 25 22 14 05 21
N=1843 05 40 17 16 16 02 15
Overall Drug Positive Daytime 110 113 111 Negative 890 887 889
Nighttime
Antidepressants Marijuana Narcotic-Analgesics Sedatives Stimulants Other More than 1 Class
N=3605 03 74 18 04 33 03 30
N=2250 01 41 13 10 31 03 14
N=5855 02 61 16 06 32 03 24
Overall Drug Positive Nighttime 165 113 145 Negative 835 887 855
ldquoMore than 1 Classrdquo ndash Drivers testing positive for more than one drug are only counted in this category In this table percentages are weighted
When we examined drug classes by time of day and age (Table 33) we found that daytime drivers aged 21-34 were more likely to use marijuana (74) than daytime drivers in other age groups (p lt 01) However drivers aged 16-20 years had the highest marijuana use (98) in the nighttime sample followed by the 21-34 year age group (85) both of which were statistically higher than the other age groups (p lt 01) The prevalence of narcotic-analgesics was highest among daytime drivers aged 44-64 (29) (p lt 01) however in the nighttime sample the 35-44 age group recorded the highest prevalence of narcotic-analgesics (42) (p lt 01)
47
Table 33 Drug Class Distribution by Time of Day and Age (Oral Fluid)
Time of 16-20 21-34 35-44 45-64 65+ Total Day Drug Class
N=99 N=436 N=374 N=668 N=245 N=1822 Antidepressants 09 02 03 08 03 05 Marijuana 44 74 48 17 07 40 Narcotic-Analgesics 00 07 19 29 08 17 Sedatives 07 02 14 23 40 16
Daytime Stimulants 03 22 12 22 01 16 Other 00 00 00 07 00 02 More than 1 Class 00 06 21 26 03 15 Overall Drug Positive
62 112 116 133 64 111 Daytime
Negative 938 888 884 867 936 889 N=961 N=2437 N=1042 N=1216 N=148 N=5804
Antidepressants 03 01 04 01 03 02 Marijuana 98 85 41 11 00 62 Narcotic-Analgesics 11 08 42 14 04 16 Sedatives 00 06 12 07 13 07
Nighttime Stimulants 20 36 28 45 00 33 Other 02 05 02 01 00 03 More than 1 Class 27 29 22 15 00 24 Overall Drug Positive
161 171 152 95 20 146 Nighttime
Negative 839 829 848 905 980 854 ldquoMore than 1 Classrdquo ndash Drivers testing positive for more than one drug are only counted in this category In this table percentages are weighted
2007 National Roadside Survey of Alcohol and Drug Use by Drivers Drug Results
Driver Drug Use Prevalence by Drug Category Based on Oral Fluid Results In this section of the report we display drug use prevalence results from oral fluid tests by drug category The three drug categories were illegal prescription and over-the-counter Because there were very few positive results for over-the-counter drugs the prescription and over-theshycounter categories are combined in these tables into a single category (ldquoMedicationsrdquo) Additionally some respondents tested positive for more than one category of drug Thus tables presenting drug categories present four mutually exclusive categories Illegal Medications Illegal and Medications and Negative So as not to double count individual positive results an individualrsquos result appears in only one of these categories However for example in Table 34 to determine the proportion of daytime drivers who tested positive for illegal drugs one could sum the daytime values for the ldquoIllegalrdquo category (58) and for the rdquo Illegal amp Medicationsrdquo category (05) to arrive at a prevalence estimate of 63 of daytime drivers who were positive for at least one illegal drug Detailed summaries of prevalence estimates for individual drugs appear in Tables 137-140 later in the report
As previously noted drugs may be classified in different ways depending on the use of the classification system For example in NHTSArsquos drug evaluation and classification (DEC)
48
2007 National Roadside Survey of Alcohol and Drug Use by Drivers Drug Results
program the categories CNS Depressants CNS Stimulants Hallucinogens Dissociative Anesthetic (PCP) Narcotic Analgesics Inhalants and Cannabis are used
Comparison of drug categories by time of day (Table 34) reveal that almost 6 percent of daytime drivers tested positive for drugs in the ldquoIllegalrdquo category as opposed to over 10 percent of nighttime drivers This was a statistically significant difference between the two groups (p lt 01) Positive results in the ldquoMedicationsrdquo category although not statistically significant were found to be slightly higher among the daytime drivers (almost 5) than nighttime drivers (3)
Table 34 Drug Categories Distribution by Time of Day (Oral Fluid)
N Time of Day Drug Category (Unweighted) (Weighted)
Daytime
Illegal Medications Illegal amp Medications Negative
125 107 14
1604
58 48 05
890 Overall Daytime 1850 1000
Nighttime
Illegal Medications Illegal amp Medications Negative
575 201 60
5033
105 30 09
856 Overall Nighttime 5869 1000
ldquoMedicationsrdquo includes prescription and over-the-counter drugs
Comparison of drug categories by time of day and region (Table 35) showed that of daytime drivers the South region had the highest percentage of positive results for ldquoIllegalrdquo followed by the West region however these differences were not statistically significant In the nighttime sample the Midwest region had the highest percentage of ldquoIllegalrdquo drug prevalence although this difference was not statistically significant
49
2007 National Roadside Survey of Alcohol and Drug Use by Drivers Drug Results
Table 35 Drug Categories Distribution by Time of Day and Region (Oral Fluid)
N Time Region Drug Category (Unweighted) (Weighted)
Daytime
Midwest
Illegal Medications Illegal amp Medications Negative
38 47 5
456
42 67 05
885 Overall 546 1000
Northeast
Illegal Medications Illegal amp Medications Negative
20 20 2
337
49 75 01
875 Overall 379 1000
South
Illegal Medications Illegal amp Medications Negative
35 22 5
410
82 46 03
869 Overall 472 1000
West
Illegal Medications Illegal amp Medications Negative
32 18 2
401
63 20 07
911 Overall 453 1000
Nighttime
Midwest
Illegal Medications Illegal amp Medications Negative
185 68 14
1427
115 30 04
850 Overall 1694 1000
Northeast
Illegal Medications Illegal amp Medications Negative
112 32 14
953
108 42 23
827 Overall 1111 1000
South
Illegal Medications Illegal amp Medications Negative
131 59 22
1347
102 25 13
860 Overall 1559 1000
West
Illegal Medications Illegal amp Medications Negative Overall
147 42 10
1306 1505
98 26 05
871 1000
ldquoMedicationsrdquo includes prescription and over-the-counter drugs
50
2007 National Roadside Survey of Alcohol and Drug Use by Drivers Drug Results
When examining prevalence by drug category and gender (Table 36) we found that in the daytime sample male drivers were more likely to test positive for ldquoIllegalrdquo drugs (82) than female drivers (30) (p lt 01) Conversely daytime female drivers were more likely to show positive results for ldquoMedicationsrdquo (76) than daytime male drivers (25) (p lt 01) In the nighttime sample 125 percent of male drivers tested positive for ldquoIllegalrdquo drugs as opposed to 75 percent of female drivers (p lt 01) The difference in percentage of positive results for ldquoMedicationsrdquo between male and female drivers was not as striking in the nighttime sample as in the daytime sample and was not statistically significant
Table 36 Drug Categories Distribution by Time of Day and Gender (Oral Fluid)
N Time of Day Gender Drug Category (Unweighted) (Weighted)
Illegal 87 82 Medications 35 25
Daytime
Male Illegal amp Medications Negative
9 901
03 890
Overall 1032 1000 Illegal 38 30 Medications 72 76
Female Illegal amp Medications Negative
5 696
06 887
Overall 811 1000 Illegal 410 125 Medications 106 28
Male Illegal amp Medications Negative
41 3048
11 835
Nighttime Overall 3605 1000 Illegal 164 75 Medications 95 33
Female Illegal amp Medications Negative
19 1972
05 887
Overall 2250 1000 ldquoMedicationsrdquo includes prescription and over-the-counter drugs In this table percentages are weighted
In comparing drug categories by time of day and age (Table 37) it was clear that within the daytime sample ldquoIllegalrdquo drug use was highest for drivers aged 21-34 (99) followed by drivers aged 35-44 (65) The prevalence of ldquoIllegalrdquo drugs for these age groups differed significantly from that in the remaining age groups (p lt 01) In the nighttime sample drivers in the 21-34 year age group still maintained the highest percentage (142) of positive results for ldquoIllegalrdquo drugs however that group was followed by the youngest age group (16-20 years) for ldquoIllegalrdquo drugs (131) (p lt 01) The use of ldquoMedicationsrdquo was highest among the 45-64 year age group (88) in the daytime sample (non-significant) and in the 35-44 year old age group the nighttime sample (69) (p lt 01)
51
2007 National Roadside Survey of Alcohol and Drug Use by Drivers Drug Results
Table 37 Drug Categories Distribution by Time of Day and Age (Oral Fluid)
N Time of Day Age Drug Category (Unweighted) (Weighted)
Daytime
16-20
Illegal
Medications
Illegal amp Medications
Negative
9
2
0
88
46
16
00
938
Overall 99 1000
21-34
Illegal
Medications
Illegal amp Medications
Negative
54
14
4
364
99
12
01
888
Overall 436 1000
35-44
Illegal
Medications
Illegal amp Medications
Negative
25
23
3
323
65
42
10
884
Overall 374 1000
45-64
Illegal
Medications
Illegal amp Medications
Negative
32
51
7
578
39
88
06
867
Overall 668 1000
65+
Illegal
Medications
Illegal amp Medications
Negative
3
17
0
225
08
56
00
936
Overall 245 1000 Nighttime
16-20
Illegal Medications Illegal amp Medications Negative
120 11 12
818
131 16 14
839 Overall 961 1000
21-34
Illegal
Medications
Illegal amp Medications
Negative
308
55
28
2045
142
19
10
829
Overall 2436 1000 35-44 Illegal
Medications Illegal amp Medications Negative
82 57 11
892
76 69 07
848
52
2007 National Roadside Survey of Alcohol and Drug Use by Drivers Drug Results
N Time of Day Age Drug Category (Unweighted) (Weighted)
Overall 1042 1000
45-64
Illegal
Medications
Illegal amp Medications
Negative
64
67
9
1075
57
30
07
905
Overall 1215 1000
65+
Illegal Medications Illegal amp Medications Negative
0 9 0
139
00 20 00
980 Overall 148 1000
ldquoMedicationsrdquo includes prescription and over-the-counter drugs In this table percentages are weighted
Driver Drug Prevalence Based on Oral Fluid and BAC Results The following section presents the results of the oral fluid drug analyses combined with the blood alcohol concentration (BAC) results obtained from breath tests16 Categories for BAC by grams per deciliter (gdL) are indicated as ldquozerordquo (BAC less than 005 gdL) ldquobetween zero and 08rdquo (greater than 005 up to 08 gdL) and ldquo08+rdquo (BAC greater than 08 gdL) Note that the daytime sample consisted of very few drug positive drivers with alcohol positive results which limited the statistical testing that could be done
In comparing the number of drug-positive drivers by time of day and BAC level (Tables 38 and 39) a statistically significant association was found between drug-positive and alcohol-positive drivers within the nighttime driving sample In other words the percentage of nighttime drivers with BAC gdL 08+ was significantly higher among drug-positive drivers than among drug-negative drivers (p lt 01)
The same association was observed with the ldquobetween zero and 08rdquo category among drug-positive nighttime drivers (p lt 01) relative to drug-negative drivers However for daytime drivers no statistical association was found largely because of the small number of alcohol-positive drivers in the daytime sample
Note that because of the small number of alcohol-positive drivers in the daytime sample (n = 23) comparisons involving drug-positive drivers for this group of drivers were not attempted in the remaining portion of this report
16 More complete information on the alcohol results (not including drug results) is available in Lacey et al (2009b)
53
2007 National Roadside Survey of Alcohol and Drug Use by Drivers Drug Results
Table 38 Drug Prevalence by Time of Day and BAC (Percentages Calculated by Row) (Oral Fluid)
BAC (gdL) Time of Drug N Between
Day Result (Unweighted) Zero Zero and 08 08+ Positive 246
Overall Daytime 1845
982 14 03 Daytime Negative 1599 992 06 02
07 02991 Positive 836
Overall Nighttime 5867
805 150 45 Nighttime Negative 5031 902 81 17
91 21888 In this table percentages are weighted
Table 39 Drug Prevalence by Time of Day and BAC (Percentages Calculated by Column) (Oral Fluid)
Time of Day
Drug Result
BAC (gdL)
Zero Between
Zero and 08 08+ All
Daytime Positive Negative
N=1822 109 891
N=18 222 778
N=5 171 829
N=1845 110 890
Nighttime Positive Negative
N=5207 131 869
N=530 239 761
N=130 306 694
N=5867 144 856
In this table ldquoNsrdquo are unweighted and percentages are weighted
Table 40 shows that within the daytime sample drug-positive drivers in the age groups 16-20 and 21-34 had the greatest percentage of alcohol-positive results however it should be noted that the sample size for the youngest group was only 11 Among nighttime drug-positive participants drivers aged 21-34 had the greatest percentage of alcohol positives (in both the categories BAC between zero and 08 and BAC 08+) (p lt 01) As noted earlier the number of years within age categories is not equivalent
54
2007 National Roadside Survey of Alcohol and Drug Use by Drivers Drug Results
Table 40 BAC Among Drug-Positive Drivers by Time of Day and Age (Oral Fluid)
Time of Day Age
N (Unweighted) Zero
BAC (gdL) Between
Zero and 08 08+ 16-2021-34
11 72
897 955
00 45
103 00
Daytime 35-4445-64
65+
51 90 20
992 998
1000
08 02 00
00 00 00
Overall Positive Daytime 244 982 14 03 16-2021-34
143 392
868 750
100 197
32 53
Nighttime 35-4445-64
65+
150 141
9
878 810 836
85 143 164
37 47 00
Overall Positive Nighttime 835 804 150 45 In this table percentages are weighted
Among both daytime and nighttime drivers there were fewer alcohol-positive drivers among drug-positive drivers with 2+ classes of drugs than among those with one class of drug (Tables 41 and 42) however due to the small sample size there was no statistical difference
Table 41 BAC Among Drug-Positive Drivers by Number of Drug Classes and Time of Day (Percentages Calculated by Column) (Oral Fluid)
Time of Day Number of Drug
Classes N
(Unweighted) Zero
BAC (gdL) Between
Zero and 08 08+ 1 206 860 951 1000
Daytime 2+ 40 140 49 00 Overall Daytime 246 1000 1000 1000
1 680 834 816 963 Nighttime 2+ 156 166 184 37
Overall Nighttime 836 1000 1000 1000 In this table percentages are weighted
55
2007 National Roadside Survey of Alcohol and Drug Use by Drivers Drug Results
Table 42 BAC Among Drug-Positive Drivers by Number of Drug Classes and Time of Day (Percentages Calculated by Row) (Oral Fluid)
Time of Day Number of Drug
Classes N
(Unweighted) Zero
BAC (gdL) Between
Zero and 08 08+ 1 206 980 16 04
Daytime 2+ 40 995 05 00 Overall Daytime 246 982 14 03
1 680 801 147 52 Nighttime 2+ 156 820 170 10
Overall Nighttime 836 805 150 45 In this table percentages are weighted
When oral fluid drug category findings were combined with BAC results we found that in both the daytime and nighttime samples the drug-positive drivers who were also alcohol-positive were more likely to be positive for ldquoIllegalrdquo drugs than ldquoMedicationsrdquo (Table 43) This was particularly true in the nighttime sample in which 173 percent had BACs between zero and 08 (compared to 63 in the ldquoMedicationsrdquo category) and 57 percent had BACs greater than 08 (compared to 12 in the ldquoMedicationsrdquo category) (p lt 01) In the daytime sample however the differences were statistically non-significant (p value = 05)
Table 43 BAC Among Drug-Positive Drivers by Drug Category and Time of Day (Oral Fluid)
Time of Day Drug Category
N (Unweighted)
BAC (gdL)
Zero Between
Zero and 08 08+
Daytime Illegal Medications Illegal amp Medications Negative
125 107 14
1604
971 996 983 992
23 04 17 06
06 00 00 02
Nighttime Illegal Medications Illegal amp Medications Negative
575 199 60
5033
770 925 814 902
173 63
177 81
57 12 09 17
ldquoMedicationsrdquo includes prescription and over-the-counter drugs In this table percentages are weighted
Table 44 presents the findings by drug category age and time of day Due to the number of groupings (and thus relatively small sample sizes in included cells) caution should be exercised in the interpretation of the findings especially among the daytime driving sample Overall among the nighttime driving sample the high alcohol-positive drivers (ie drivers registering greater than 08 BAC gdL) tested positive for drugs in the ldquoIllegalrdquo category more frequently than ldquoMedicationsrdquo across all age groups except 65+ (an age group producing a very small sample size for drug positives) Further the same pattern emerged among drivers with BACs
56
2007 National Roadside Survey of Alcohol and Drug Use by Drivers Drug Results
between zero and 08 across all age groups except for the age category 45-64 where a high proportion of drivers tested positive for both ldquoIllegal and Medicationsrdquo
Table 44 BAC of Drivers by Drug Category Age and Time of Day (Oral Fluid)
Time of Day Age Drug Category
N (Unweighted) Zero
BAC (gdL) Between
Zero and 08 08+
Daytime
16-20
Illegal Medications Illegal amp Medications Negative
9 2 0
88
861 1000
NA 993
00 00
NA 07
139 00
NA 00
Overall 99 987 07 06
21-34
Illegal Medications Illegal amp Medications Negative
54 14 4
364
957 932
1000 994
43 68 00 05
00 00 00 01
Overall 436 990 10 01
35-44
Illegal Medications Illegal amp Medications Negative
25 23 3
323
986 1000 1000
991
14 00 00 07
00 00 00 02
Overall 374 991 07 01
45-64
Illegal Medications Illegal amp Medications Negative
32 51 7
578
1000 1000 958 987
00 00 42 09
00 00 00 04
Overall 668 989 08 03
65+
Illegal Medications Illegal amp Medications Negative
3 17
0 225
1000 1000
NA 998
00 00
NA 01
00 00
NA 01
Overall 245 998 01 01 Nighttime
16-20
Illegal Medications Illegal amp Medications Negative
120 11 12
818
839 1000 990 944
121 00 10 51
40 00 00 05
Overall 961 931 59 10
21-34
Illegal Medications Illegal amp Medications Negative
308 55 28
2045
736 809 846 878
204 170 154
98
61 21 00 24
Overall 2436 856 115 29
35-44
Illegal Medications Illegal amp Medications Negative
82 57 11
892
777 985 927 919
159 04 73 67
64 11 00 14
Overall 1042 913 70 17
57
2007 National Roadside Survey of Alcohol and Drug Use by Drivers Drug Results
Time of Day Age Drug Category
N (Unweighted) Zero
BAC (gdL) Between
Zero and 08 08+ Illegal 64 808 126 66
45-64 Medications Illegal amp Medications
67 9
922 333
70 609
08 58
Negative 1075 901 87 13 Overall 1215 892 92 16 Illegal 0 NA NA NA
65+ Medications Illegal amp Medications
9 0
836 NA
164 NA
00 NA
Negative 139 887 66 47 Overall 148 886 68 46
ldquoMedicationsrdquo includes prescription and over-the-counter drugs In this table percentages are weighted
When examining drug category by gender and time of day (Table 45) male drivers who tested positive for ldquoIllegalrdquo drugs in both the daytime and nighttime samples also had greater percentages of alcohol-positive results than their female counterparts However the small sample size precluded valid statistical testing on the daytime sample Within the nighttime sample differences were statistically significant (p lt 01)
Table 45 BAC of Drivers by Drug Category Gender and Time of Day (Oral Fluid)
Time of Day Gender Drug Category
N (Unweighted) Zero
BAC (gdL) Between
Zero and 08 08+
Daytime
Males
Females
Illegal Medications Illegal amp Medications Negative
87 35 9
901
967 985 956 991
25 15 44 08
08 00 00 01
Overall 1032 989 09 02 Illegal Medications Illegal amp Medications Negative
38 72 5
696
984 1000 1000 993
16 00 00 05
00 00 00 03
Overall 811 993 05 02
Nighttime
Males
Illegal Medications Illegal amp Medications Negative
410 106 41
3048
743 960 766 900
180 31 223 79
76 10 11 21
Overall 3605 881 92 27
Females
Illegal Medications Illegal amp Medications Negative
164 95 19
1972
842 875 990 904
152 110 10 83
06 15 00 12
Overall 2250 899 89 12 ldquoMedicationsrdquo includes prescription and over-the-counter drugs In this table percentages are weighted
58
2007 National Roadside Survey of Alcohol and Drug Use by Drivers Drug Results
Drugs Oral Fluid Results and Agreement with Self-Reported Drug Use Table 46 compares the results of the oral fluid analyses with responses to the self-reported drug use questionnaire This questionnaire was administered to all drivers who provided an oral fluid sample and was completed while the oral fluid device was collecting the saliva
The cross tabulation results of self-reported drug use (in the past 24 hours past 2 days past month past year over a year and never) and oral fluid analysis results (by drug category) revealed interesting findings Note that this table only reports on drivers who were drug-positive Agreement between reported past 24-hour use and drug-positive analysis results for the nighttime driving sample was greatest (highest percentage) among antidepressants cough suppressants and pain killers
The lowest correspondence (lowest percentages) was found for amphetamines and barbiturates Interestingly approximately one-quarter of marijuana-positive nighttime drivers admitted to marijuana use in the previous 24 hours this increased to over one-third when combined within the past two days A smaller proportion (75 and 58 respectively) admitted to recent use of cocaine
Among nighttime drivers who tested positive for antidepressants the majority (664) indicated they in fact used the substance in the past 24 hours Thus in this example agreement between self-reports and oral fluid analysis results are fairly high However when we examine amphetamines (typically viewed as a recreational or illegal drug) agreement between self-report and a positive test analysis is low Here about 72 percent of nighttime positive drivers indicated they ldquoneverrdquo had used the substance yet the drug analysis revealed a positive result In some instances this may be related to a reluctance to disclose however in other instances a driver may not have been aware that the substance they were taking contained the drug being reported (for example some drivers may not be aware that some diet pills contain amphetamines) Similar results were obtained for nighttime drivers providing blood samples A table reflecting those results appears in Appendix A
59
2007 National Roadside Survey of Alcohol and Drug Use by Drivers Drug Results
Table 46 Oral Fluid Results and Agreement With Self-Reported by Drug Type (Oral Fluid)
Drug Category Self-Reported
Drug Use
Oral Fluid Positive for that Drug Daytime Nighttime
N (Unwtd)
(Weighted)
N (Unwtd)
(Weighted)
Antidepressants
Past 24 Hours Past 2 Days Past Month Past Year Over a Year Never
13 0 0 1 0 4
857 00 00 47 00 96
18 0 2 0 1 4
664 00 96 00
212 28
Overall 18 1000 25 1000
Amphetamines
Past 24 Hours Past 2 Days Past Month Past Year Over a Year Never
0 0 0 0 1
13
00 00 00 00 32
968
1 0 4 3
10 51
20 00 86 89 88
718 Overall 14 1000 69 1000
Barbiturates
Past 24 Hours Past 2 Days Past Month Past Year Over a Year Never
1 0 1 0 0 4
14 00 08 00 00
978
2 0 0 0 0 8
31 00 00 00 00
969 Overall 6 1000 10 1000
Benzodiazepines
Past 24 Hours Past 2 Days Past Month
Past Year Over a Year Never
11 0 0 0 3
20
158 00 00 00 38
804
14 4 2 0 5
37
244 34 26 00 22
674 Overall 34 1000 62 1000
Cocaine
Past 24 Hours Past 2 Days Past Month Past Year Over a Year Never
1 2 1 0 3
30
04 22 06 00
186 782
10 7
10 17 29
146
75 58 48 68
170 579
Overall 37 1000 219 1000
Cough Suppressants
Past 24 Hours
Past 2 Days
Past Month
Past Year
Over a Year
2
0
0
0
0
945
00
00
00
00
6
2
3
1
1
393
198
129
23
37
Never 1 55 2 220
Overall 3 1000 15 1000
60
2007 National Roadside Survey of Alcohol and Drug Use by Drivers Drug Results
Drug Category Self-Reported
Drug Use
Oral Fluid Positive for that Drug Daytime Nighttime
N (Unwtd)
(Weighted)
N (Unwtd)
(Weighted)
Ketamine
Past 24 hrs Past 2 days Past Month Past Year Over a Year Never
0 0 0 0 0 0
NA NA NA NA NA NA
0 0 0 0 0 1
00 00 00 00 00
1000 Overall 0 NA 1 1000
Marijuana
Past 24 hrs Past 2 days Past Month Past Year Over a Year Never
21 10 15 6
19 28
217 149 152
46 167 267
91 37 55 44 65
134
257 105 114
74 131 321
Overall 99 1000 426 1000
Methadone
Past 24 hrs Past 2 days Past Month Past Year Over a Year Never
1 0 1 0 0 1
966 00 29 00 00 04
6 0 0 0 0 4
298 00 00 00 00
702 Overall 3 1000 10 1000
Opiates
Past 24 hrs Past 2 days Past Month Past Year Over a Year Never
4 2 6 4 2
13
130 37
187 19
116 511
11 7 8
13 17 51
111 45
187 24
157 476
Overall 31 1000 107 1000
Pain Killers
Past 24 hrs Past 2 days Past Month Past Year Over a Year Never
13 5 6 4 2 4
275 129 131 65
309 92
24 11 8 7 7 9
599 129
46 29
138 58
Overall 34 1000 66 1000
PCP
Past 24 hrs Past 2 days Past Month Past Year Over a Year Never
1 0 0 0 0 0
1000 00 00 00 00 00
0 0 1 0 0 1
00 00
229 00 00
771 Overall 1 1000 2 1000
61
2007 National Roadside Survey of Alcohol and Drug Use by Drivers Drug Results
Observed Safety Measures of Daytime and Nighttime Drivers (Oral Fluid) In the 2007 NRS interviewers observed and recorded seat belt use of drivers and helmet use of motorcycle riders Additionally participating drivers were asked if they were acting as designated drivers (ldquoTonightToday are you or have you been a designated driverrdquo) The results of analyses of these variables by alcohol level are discussed in some detail in a previous report summarizing the alcohol results (Lacey et al 2009b) One issue that arose in that analysis was that many respondents appeared to not understand the lsquodesignated driverrsquo question Thus in this report we are not reporting on the designated driver results Additionally since the nighttime results are quite similar whether summarized by oral fluid results or blood results we are presenting these tables on observed seat belt and helmet use only in the oral fluid results section of the body of the report The nighttime blood results are presented in Appendix A
Information on seat belt and helmet use is presented by overall prevalence (daytime and nighttime) drug class (daytime and nighttime) and drug category (daytime and nighttime) in Tables 47-52 respectively
In Table 47 there was no statistically significant association between overall daytime drug prevalence among drivers and seat belt use in the daytime sample
Table 47 Daytime Seat Belt Observation By Drug Prevalence (Oral Fluid)
N (Unweighted)
Drug Negative
(Weighted)
Drug Positive
(Weighted) Driver Seat Belt Observation
Yes 1750 890 110 No 92 862 138
When examining nighttime drug use as measured in oral fluid by observed seat belt use (Table 48) drug prevalence among nighttime drivers was significantly higher among those who did not wear a seat belt than among those who did (p lt 01)
Table 48 Nighttime Seat Belt Observation by Drug Prevalence (Oral Fluid)
N (Unweighted)
Drug Negative
(Weighted)
Drug Positive
(Weighted) Driver Seat Belt Observation
Yes 5654 859 141 No 192 754 246
62
N
(Un
wei
gh
ted
)
An
tid
epre
ssa
nts
(W
eig
hte
d)
Mar
ijuan
a
(Wei
gh
ted
)
Nar
coti
c-A
nal
ge
sic
(W
eig
hte
d)
Sed
ativ
es
(W
eig
hte
d)
Sti
mu
lan
ts
(Wei
gh
ted
)
O
ther
(W
eig
hte
d)
gt1
Dru
g C
lass
(Wei
gh
ted
)
Neg
ativ
e
(Wei
gh
ted
)
Driver Seat Belt Observation Yes 1750 05 37 17 17 17 02 15 890 No 92 08 98 13 04 00 00 15 862
N
(Un
wei
gh
ted
)
An
tid
epre
ssa
nts
(W
eig
hte
d)
Mar
ijuan
a
(Wei
gh
ted
)
Nar
coti
c-A
nal
ge
sic
(W
eig
hte
d)
Sed
ativ
es
(W
eig
hte
d)
Sti
mu
lan
ts
(Wei
gh
ted
)
O
ther
(W
eig
hte
d)
gt1
Dru
g C
lass
(W
eig
hte
d)
Neg
ativ
e
(Wei
gh
ted
) Driver Seat Belt Observation
Yes 5654 No 192
01 23
61 63
16 21
07 00
31 79
03 06
22 53
859 754
2007 National Roadside Survey of Alcohol and Drug Use by Drivers Drug Results
Table 49 shows the daytime distribution of drug classes in oral fluid by observed seat belt use Most of the observed differences in this distribution were not statistically significant The exception was marijuana which was significantly more prevalent among daytime drivers who did not wear a seat belt than among drivers who did (p lt 01)
Table 49 Daytime Seat Belt Observation by Drug Class (Percentages Calculated by Row) (Oral Fluid)
Table 50 shows the nighttime distribution of drug classes by seat belt use Stimulants were significantly more prevalent among those drivers who did not wear a safety belt than those who did (p lt 01)
Table 50 Nighttime Seat Belt Observation by Drug Class (Percentages Calculated by Row) (Oral Fluid)
63
2007 National Roadside Survey of Alcohol and Drug Use by Drivers Drug Results
Table 51 shows the daytime distribution of drug categories by seat belt use Differences in daytime oral fluid drug category results involving seat belt use by the driver were not statistically significant
Table 51 Daytime Seat Belt Observation by Drug Category (Percentages Calculated by Row) (Oral Fluid)
N (Unwtd)
Illegal
(Weighted)
Medications (Weighted)
Illegal amp Medications (Weighted)
Negative
(Weighted) Driver Seat Belt Observation
Yes 1750 56 50 04 890 No 92 103 27 07 862
Table 52 shows the nighttime distribution of drug categories by seat belt use The prevalence of illegal (ldquoIllegalrdquo and ldquoIllegal and Medicationrdquo combined) drugs was higher among those who did not use a seat belt (p lt 01)
Table 52 Nighttime Belt Observation by Drug Category (Percentages Calculated by Row) (Oral Fluid)
N (Unwtd)
Illegal
(Weighted)
Medications (Weighted)
Illegal amp Medications (Weighted)
Negative (Weighted)
Driver Seat Belt Observation Yes 5353 102 30 09 859 No 192 181 50 15 754
The number of motorcyclists sampled in the daytime was very small thus limiting our ability to perform meaningful statistical comparisons However we display daytime and nighttime helmet use (for the operator) by overall drug use prevalence class and category in Tables 53-58 Note there were an extremely low number of motorcycle riders with passengers Thus these are excluded from our tables and our analyses
Table 53 Daytime Helmet Use for Motorcycle Riders (Operators) by Drug Positive (Oral Fluid)
N (Unweighted)
Drug Positive (Weighted)
Motorcycle Riders (Operators) 30 248 Helmet 23 238 No Helmet Use 6 299 Unknown 1 00
Small sample size precluded meaningful statistical comparisons
64
N
(Un
wei
gh
ted
)
An
tid
epre
ssa
nts
(Wei
gh
ted
)
Mar
ijuan
a (W
eig
hte
d)
Nar
coti
c-A
nal
ge
sic
(Wei
gh
ted
)
Sed
ativ
es
(Wei
gh
ted
)
Sti
mu
lan
ts
(Wei
gh
ted
)
Oth
er(W
eig
hte
d)
gt1
Dru
g C
lass
(
Wei
gh
ted
)
Neg
ativ
e (W
eig
hte
d)
Motorcycle Riders (Operators) 30 00 132 00 13 28 00 76 752
Helmet 23 00 169 00 17 36 00 17 762
No Helmet Use 6 00 00 00 00 00 00 299 701
Unknown 1 00 00 00 00 00 00 00 1000
Small sample size precluded meaningful statistical comparisons
N
(Un
wei
gh
ted
)
An
tid
epre
ssa
nts
(Wei
gh
ted
)
Mar
ijuan
a (W
eig
hte
d)
Nar
coti
c-A
nal
ge
sic
(Wei
gh
ted
)
Sed
ativ
es
(Wei
gh
ted
)
Sti
mu
lan
ts
(Wei
gh
ted
)
Oth
er(W
eig
hte
d)
gt1
Dru
g C
lass
(
Wei
gh
ted
)
Neg
ativ
e (W
eig
hte
d)
Motorcycle Riders (Operators) 73 63 45 00 00 83 05 128 676
Helmet 57 10 29 00 00 13 07 87 853
No Helmet Use 14 161 75 00 00 212 00 205 347
Unknown 2 00 00 00 00 00 00 00 1000
2007 National Roadside Survey of Alcohol and Drug Use by Drivers Drug Results
Table 54 shows a statistically significant difference in nighttime drug prevalence as measured in oral fluid among riders with and without helmets Drug prevalence was higher for riders who were not using helmets (p lt 01)
Table 54 Nighttime Helmet Use for Motorcycle Riders (Operators) by Drug Positive (Oral Fluid)
N (Unweighted)
Drug Positive (Weighted)
Motorcycle Riders (Operators) 73 324 Helmet 57 147 No Helmet Use 14 653 Unknown 2 00
Examining daytime and nighttime motorcycle riders by drug class as measured in oral fluid some classes had no positives perhaps due to the small sample size (Tables 55 and 56) thus rendering statistical tests inappropriate
Table 55 Daytime Helmet Use for Motorcycle Riders (Operators) by Drug Class (Oral Fluid)
Table 56 Nighttime Helmet Use for Motorcycle Riders (Operators) by Drug Class (Percentages Calculated by Row) (Oral Fluid)
Small sample size precluded meaningful statistical comparisons
65
2007 National Roadside Survey of Alcohol and Drug Use by Drivers Drug Results
The small sample size encountered when examining daytime motorcycle riders by drug category as measured in oral fluid (Table 57) rendered statistical tests inappropriate
Table 57 Daytime Helmet Use for Motorcycle Riders (Operators) by Drug Category (Oral Fluid)
N (Unwtd)
Illegal
(Weighted)
Medications (Weighted)
Illegal amp Medications (Weighted)
Negative
(Weighted)
Motorcycle Riders (Operators) 30 159 13 76 752 Helmet 23 204 17 17 762 No Helmet Use 6 00 00 299 701 Unknown 1 00 00 00 1000
Small sample size precluded meaningful statistical comparisons
Table 58 shows that overall drug prevalence was higher for riders who were not using a helmet (p lt 01) However no statistically significant difference was observed between riders who consumed ldquoIllegalrdquo and ldquoIllegal and Medicationsrdquo and those who consumed ldquoMedicationsrdquo alone
Table 58 Nighttime Helmet Use for Motorcycle Riders (Operators) by Drug Category (Percentages Calculated by Row) (Oral Fluid)
N (Unwtd)
Illegal
(Weighted)
Medications (Weighted)
Illegal amp Medications (Weighted)
Negative
(Weighted)
Motorcycle Riders (Operators) 73 200 68 56 676 Helmet 57 42 18 87 853 No Helmet Use 14 492 161 00 347 Unknown 2 00 00 00 00
Reported Contact with the Criminal Justice System (Oral Fluid) Of the 1790 daytime NRS participants who provided an oral fluid sample and responded to the question ldquoDuring the past 12 months were you arrested and booked for driving under the influence of alcohol or drugsrdquo about 3 percent indicated ldquoYesrdquo (n = 47 unweighted) Of these almost 29 percent were drug positive (Table 59) The difference between daytime drivers who indicated ldquoYesrdquo to this question and were drug positive is statistically different from those who indicated ldquoNordquo (p lt 01)
Table 59 Arrests and Drug Positives Daytime (Oral Fluid) ldquoDuring the past 12 months were you arrested and booked for driving under the influence of alcohol or drugsrdquo
N (Unweighted)
Drug Positive (Weighted)
Yes 47 289 No 1743 108 Total 1790 113
66
N
(Un
wei
gh
ted
)
An
tid
epre
ssa
nts
(W
eig
hte
d)
Mar
ijuan
a
(Wei
gh
ted
)
Nar
coti
c-A
nal
ge
sic
(W
eig
hte
d)
Sed
ativ
es
(W
eig
hte
d)
Sti
mu
lan
ts
(Wei
gh
ted
)
Oth
er
(Wei
gh
ted
)
gt1
Dru
g C
lass
(W
eig
hte
d)
Neg
ativ
e
(Wei
gh
ted
)
Yes 47 00 207 20 26 24 00 11 711 No 1743 16 36 17 16 16 02 16 892
Total 1790 16 40 17 16 16 02 16 887
2007 National Roadside Survey of Alcohol and Drug Use by Drivers Drug Results
Among the nighttime NRS participants who provided an oral fluid sample and responded to the question ldquoDuring the past 12 months were you arrested and booked for driving under the influence of alcohol or drugsrdquo (Table 60) approximately 4 percent indicated ldquoYesrdquo (n = 234 unweighted) Of these 29 percent were drug positive compared to the 14 percent who were drug positive and indicated ldquoNordquo (p lt 01)
Additionally since the nighttime results are quite similar whether summarized by oral fluid results or blood results we are presenting these tables on contact with the criminal justice system based on nighttime blood results in Appendix A
Table 60 Arrests and Drug Positives Nighttime (Oral Fluid) ldquoDuring the past 12 months were you arrested and booked for driving under the influence of alcohol or drugsrdquo
N (Unweighted)
Drug Positive (Weighted)
Yes 234 291 No 5458 140 Total 5692 145
Of the daytime drivers who were drug positive and responded to the question ldquoDuring the past 12 months were you arrested and booked for driving under the influence of alcohol or drugsrdquo (Table 61) the majority tested positive for marijuana (207)
Table 61 Arrests and Drug Class Daytime (Oral Fluid) ldquoDuring the past 12 months were you arrested and booked for driving under the influence of alcohol or drugsrdquo
Similar to results in the daytime sample the nighttime drivers who were drug positive and responded to the question ldquoDuring the past 12 months were you arrested and booked for driving under the influence of alcohol or drugsrdquo (Table 62) the majority tested positive for marijuana (118)
67
2007 National Roadside Survey of Alcohol and Drug Use by Drivers Drug Results
Table 62 Arrests and Drug Class Nighttime (Oral Fluid) ldquoDuring the past 12 months were you arrested and booked for driving under the influence of alcohol or drugsrdquo
N (Un
wei
gh
ted
)
An
tid
epre
ssa
nts
(Wei
gh
ted
)
Mar
ijuan
a(W
eig
hte
d)
Nar
coti
c-A
nal
ge
sic
(Wei
gh
ted
)
Sed
ativ
es
(Wei
gh
ted
)
Sti
mu
lan
ts
(Wei
gh
ted
)
Oth
er(W
eig
hte
d)
gt1
Dru
g C
lass
(
Wei
gh
ted
)
Neg
ativ
e (W
eig
hte
d)
Yes 234 00 118 02 02 108 00 60 709 No 5458 02 58 17 07 30 03 23 860 Total 5692 02 60 17 07 33 03 24 855
When examining the data by drug category among daytime participants who responded to the question ldquoDuring the past 12 months were you arrested and booked for driving under the influence of alcohol or drugsrdquo (Table 63) more participants tested positive for ldquoIllegalrdquo drugs than any other drug category (233)
Table 63 Arrests and Drug Categories Daytime (Oral Fluid) ldquoDuring the past 12 months were you arrested and booked for driving under the influence of alcohol or drugsrdquo
N (Unwtd)
Illegal
(Weighted)
Medications (Weighted)
Illegal amp Medications (Weighted)
Negative
(Weighted)
Yes 47 233 53 02 711 No 1743 54 49 05 892 Total 1790 59 49 05 887
Among nighttime participants who responded to the question ldquoDuring the past 12 months were you arrested and booked for driving under the influence of alcohol or drugsrdquo (Table 64) more tested positive for ldquoIllegalrdquo drugs than any other drug category (26) Although this was slightly higher than the daytime population the difference was not statistically different
Table 64 Arrests and Drug Categories Nighttime (Oral Fluid) ldquoDuring the past 12 months were you arrested and booked for driving under the influence of alcohol or drugrdquo
N (Unwtd)
Illegal
(Weighted)
Medications (Weighted)
Illegal amp Medications (Weighted)
Negative
(Weighted)
Yes 234 260 13 17 709 No 5458 99 31 09 860 Total 5692 105 31 09 855
68
2007 National Roadside Survey of Alcohol and Drug Use by Drivers Drug Results
Reported Contact with the Health System (Oral Fluid) As indicated in previous reports on the 2007 NRS questions relating to the criminal sanctions for drinking and drug use while driving were added to the survey items as well as questions related to treatment for drug and alcohol use These questions were added to the survey to investigate potential intervention opportunities
As shown in Table 65 less than 1 percent of daytime drivers responded ldquoYesrdquo to the question ldquoDuring the past 12 months did you ever stay at least overnight in an inpatient or residential drug or alcohol treatment programrdquo Of these almost 45 percent were drug positive
Table 65 Past Treatment Program and Drug Positive Daytime (Oral Fluid) ldquoDuring the past 12 months did you ever stay at least overnight in an inpatient or residential drug or alcohol
treatment programrdquo
N (Unweighted)
Drug Positive (Weighted)
Yes 7 447 No 1738 112 Total 1745 112
Among nighttime drivers less than 1 percent responded ldquoYesrdquo to the question ldquoDuring the past 12 months did you ever stay at least overnight in an inpatient or residential drug or alcohol treatment programrdquo (Table 66) Of these 37 percent were drug positive
The response patterns to these questions by nighttime drivers providing blood samples are quite similar to those reported here for nighttime oral fluid and are presented separately in Appendix A
Table 66 Past Treatment Program and Drug Positive Nighttime (Oral Fluid) ldquoDuring the past 12 months did you ever stay at least overnight in an inpatient or residential drug or alcohol
treatment programrdquo
N (Unweighted)
Drug Positive (Weighted)
Yes 51 370 No 5449 145 Total 5500 146
(p lt 01)
Of daytime drivers who responded to the question ldquoHave you ever been admitted to an outpatient drug or alcohol treatment program NOT including meetings like AA or NArdquo17
approximately 25 percent responded ldquoYesrdquo (Table 67) Of these 384 percent were drug positive
17 AA is Alcoholics Anonymous and NA is Narcotics Anonymous
69
2007 National Roadside Survey of Alcohol and Drug Use by Drivers Drug Results
Table 67 Outpatient and Drug Positive Daytime (Oral Fluid) ldquoHave you ever been admitted to an outpatient drug or alcohol treatment program NOT including meetings like AA or NArdquo
N (Unweighted)
Drug Positive (Weighted)
Yes 44 384 No 1754 107 Total 1798 112 (p lt 01)
Of nighttime drivers who responded to the question ldquoHave you ever been admitted to an outpatient drug or alcohol treatment program NOT including meetings like AA or NArdquo approximately 28 percent responded ldquoYesrdquo (Table 68) Of these 36 percent were drug positive
Table 68 Outpatient and Drug Positive Nighttime (Oral Fluid) ldquoHave you ever been admitted to an outpatient drug or alcohol treatment program NOT including meetings like AA or NArdquo
N (Unweighted)
Drug Positive (Weighted)
Yes 159 361 No 5541 141 Total 5700 145
(p lt 01)
Of daytime drivers who responded to the question ldquoDuring the past 12 months have you received treatment for your drug or alcohol use in a self-help group such as Alcoholics Anonymous or Narcotics Anonymousrdquo approximately 1 percent responded ldquoYesrdquo (Table 69) Of these 43 percent were drug positive Of the nighttime drivers who were asked the same question approximately 2 percent responded ldquoYesrdquo (Table 70) and approximately 18 percent of those were drug positive
Table 69 AA or NA and Drug Positives Daytime (Oral Fluid) ldquoDuring the past 12 months have you received treatment for your drug or alcohol use in a self-help group such as Alcoholics
Anonymous or Narcotics Anonymousrdquo
N (Unweighted)
Drug Positive (Weighted)
Yes 17 431 No 1778 109 Total 1795 112
70
N (Un
wei
gh
ted
)
An
tid
epre
ssa
nts
(Wei
gh
ted
)
Mar
ijuan
a(W
eig
hte
d)
Nar
coti
c-A
nal
ge
sic
(Wei
gh
ted
)
Sed
ativ
es
(Wei
gh
ted
)
Sti
mu
lan
ts
(Wei
gh
ted
)
Oth
er(W
eig
hte
d)
gt1
Dru
g C
lass
(
Wei
gh
ted
)
Neg
ativ
e (W
eig
hte
d)
Yes 7 00 203 00 00 00 00245 553 No 1738 05 39 17 17 16 02 16 888 Total 1745 05 39 17 17 16 02 16 888
2007 National Roadside Survey of Alcohol and Drug Use by Drivers Drug Results
Table 70 AA or NA and Drug Positives Nighttime (Oral Fluid) ldquoDuring the past 12 months have you received treatment for your drug or alcohol use in a self-help group such as Alcoholics
Anonymous of Narcotics Anonymousrdquo
N (Unweighted)
Drug Positive (Weighted)
Yes 107 183 No 5587 145 Total 5694 146
Of daytime drivers who responded to the question ldquoDuring the past 12 months did you ever stay at least overnight in an impatient or residential drug or alcohol treatment program for example detox rehab a therapeutic community or a hospitalrdquo less than 5 percent responded ldquoYesrdquo (Table 71) Of these approximately 20 percent tested positive for marijuana and nearly 25 percent tested positive for more than one drug
Table 71 Inpatient and Drug Class Daytime (Oral Fluid) ldquoDuring the past 12 months did you ever stay at least overnight in an impatient or residential drug or alcohol treatment program for
example detox rehab a therapeutic community or a hospitalrdquo
Of the nighttime drivers who were asked the same question approximately 1 percent responded ldquoYesrdquo (Table 72) Of those approximately 14 percent tested positive for marijuana and approximately 12 percent tested positive for more than one drug Although a higher percentage responded ldquoYesrdquo to the marijuana item during the day than at night this difference was not statistically significant
71
N
(Un
wei
gh
ted
)
An
tid
epre
ssa
nts
(W
eig
hte
d)
Mar
ijuan
a
(Wei
gh
ted
)
Nar
coti
c-A
nal
ge
sic
(W
eig
hte
d)
Sed
ativ
es
(W
eig
hte
d)
Sti
mu
lan
ts
(Wei
gh
ted
)
Oth
er
(Wei
gh
ted
)
gt1
Dru
g C
lass
(W
eig
hte
d)
Neg
ativ
e
(Wei
gh
ted
)
Yes 51 00 144 03 14 94 00115 630 No 5449 02 61 16 07 32 03 24 855 Total 5500 02 61 16 07 32 03 24 854
2007 National Roadside Survey of Alcohol and Drug Use by Drivers Drug Results
Table 72 Inpatient and Drug Class Nighttime (Oral Fluid) ldquoDuring the past 12 months did you ever stay at least overnight in an impatient or residential drug or alcohol treatment program for
example detox rehab a therapeutic community or a hospitalrdquo
Of daytime drivers who responded to the question ldquoDuring the past 12 months were you arrested and booked for driving under the influence of alcohol or drugsrdquo less than 5 percent responded ldquoYesrdquo (Table 73)
Table 73 Inpatients and Drug Category Daytime (Oral Fluid) ldquoDuring the past 12 months were you arrested and booked for driving under the influence of alcohol or drugsrdquo
N (Unwtd)
Illegal
(Weighted)
Medications (Weighted)
Illegal amp Medications (Weighted)
Negative
(Weighted)
Yes 7 447 00 00 553 No 1738 57 50 05 888 Total 1745 58 50 05 888
Of these nearly 45 percent tested positive for ldquoIllegalrdquo drugs Of the nighttime drivers who were asked the same question approximately 1 percent responded ldquoYesrdquo (Table 74) and approximately 23 percent of those tested positive for ldquoIllegalrdquo drugs The difference in ldquoIllegalrdquo drug use from daytime to nighttime was not significant
Table 74 Inpatients and Drug Category Nighttime (Oral Fluid) ldquoDuring the past 12 months were you arrested and booked for driving under the influence of alcohol or drugsrdquo
N (Unwtd)
Illegal
(Weighted)
Medications (Weighted)
Illegal amp Medications (Weighted)
Negative
(Weighted)
Yes 51 234 23 113 630 No 5449 106 30 09 855 Total 5500 106 30 10 854
Of daytime drivers who responded to the question ldquoHave you ever been admitted to an outpatient drug or alcohol treatment program NOT including meetings like AA or NArdquo
72
N
(Un
wei
gh
ted
)
An
tid
epre
ssa
nts
(Wei
gh
ted
)
Mar
ijuan
a (W
eig
hte
d)
Nar
coti
c-A
nal
ge
sic
(Wei
gh
ted
)
Sed
ativ
es
(Wei
gh
ted
)
Sti
mu
lan
ts
(Wei
gh
ted
)
Oth
er(W
eig
hte
d)
gt1
Dru
g C
lass
(
Wei
gh
ted
)
Neg
ativ
e (W
eig
hte
d)
Yes 44 34 154 147 00 37 00 11 616 No 1754 04 38 14 17 16 02 16 893 Total 1798 04 40 17 16 16 02 16 888
N
(Un
wei
gh
ted
)
An
tid
epre
ssa
nts
(Wei
gh
ted
)
Mar
ijuan
a (W
eig
hte
d)
Nar
coti
c-A
nal
ge
sic
(Wei
gh
ted
)
Sed
ativ
es
(Wei
gh
ted
)
Sti
mu
lan
ts
(Wei
gh
ted
)
Oth
er(W
eig
hte
d)
gt1
Dru
g C
lass
(
Wei
gh
ted
)
Neg
ativ
e (W
eig
hte
d)
Yes 159 16 101 65 17 138 00 23 639 No 5541 02 60 16 06 30 03 24 859 Total 5700 02 60 17 07 32 03 24 855
2007 National Roadside Survey of Alcohol and Drug Use by Drivers Drug Results
approximately 25 percent responded ldquoYesrdquo (Table 75) Of these the most prevalent drug was marijuana (154) Additionally nearly 15 percent tested positive for narcotic-analgesics
Table 75 Outpatient and Drug Class Daytime (Oral Fluid) ldquoHave you ever been admitted to an outpatient drug or alcohol treatment program NOT including meetings like AA or NArdquo
Of the nighttime drivers who were asked the same question nearly 3 percent responded ldquoYesrdquo (Table 76) and nearly 14 percent tested positive for stimulants which was more than any other drug category Approximately 10 percent of those tested positive for marijuana which was more than the daytime percentage however this difference was not statistically significant
Table 76 Outpatient and Drug Class Nighttime (Oral Fluid) ldquoHave you ever been admitted to an outpatient drug or alcohol treatment program NOT including meetings like AA or NArdquo
Of daytime drivers who responded to the question ldquoHave you ever been admitted to an outpatient drug or alcohol treatment program NOT including meetings like AA or NArdquo approximately 25 percent responded ldquoYesrdquo (Table 77) Of these approximately 38 percent were drug positive with nearly 20 percent testing positive for ldquoIllegalrdquo drugs
73
N
(Un
wei
gh
ted
)
An
tid
epre
ssa
nts
(W
eig
hte
d)
Mar
ijuan
a
(Wei
gh
ted
)
Nar
coti
c-A
nal
ge
sic
(W
eig
hte
d)
Sed
ativ
es
(W
eig
hte
d)
Sti
mu
lan
ts
(Wei
gh
ted
)
Oth
er
(Wei
gh
ted
)
gt1
Dru
g C
lass
(W
eig
hte
d)
Neg
ativ
e
(Wei
gh
ted
)
Yes 17 21 177 233 00 00 00 00 569 No 1778 04 39 15 17 16 02 16 891 Total 1795 04 40 17 16 16 02 16 888
2007 National Roadside Survey of Alcohol and Drug Use by Drivers Drug Results
Table 77 Outpatient and Categories Daytime (Oral Fluid) ldquoHave you ever been admitted to an outpatient drug or alcohol treatment program NOT including meetings like AA or NArdquo
N (Unwtd)
Illegal
(Weighted)
Medications (Weighted)
Illegal amp Medications (Weighted)
Negative
(Weighted)
Yes 44 199 181 04 616 No 1754 56 46 05 893 Total 1798 59 49 05 888
Of the nighttime drivers who were asked the same question nearly 3 percent responded ldquoYesrdquo (Table 78) and approximately 36 percent of those were drug positive with nearly 25 percent testing positive for ldquoIllegalrdquo drugs Although that percentage was higher for nighttime drivers than for daytime drivers there was no statistical difference in the number of people testing positive for ldquoIllegalrdquo drugs between daytime and nighttime
Table 78 Outpatient and Categories Nighttime (Oral Fluid) ldquoHave you ever been admitted to an outpatient drug or alcohol treatment program NOT including meetings like AA or NArdquo
N (Unwtd)
Illegal
(Weighted)
Medications (Weighted)
Illegal amp Medications (Weighted)
Negative
(Weighted)
Yes 159 249 100 12 639 No 5541 103 29 09 859 Total 5700 105 31 09 855
Of daytime drivers who responded to the question ldquoDuring the past 12 months have you received treatment for your drug or alcohol use in a self-help group such as AA or NArdquo approximately 1 percent responded ldquoYesrdquo (Table 79) Of these the most prevalent drug class was narcotic-analgesic (233)
Table 79 AA NA and Classes Daytime (Oral Fluid) ldquoDuring the past 12 months have you received treatment for your drug or alcohol use in a self-help group such as AA or NArdquo
74
N
(Un
wei
gh
ted
)
An
tid
epre
ssa
nts
(W
eig
hte
d)
Mar
ijuan
a
(Wei
gh
ted
)
Nar
coti
c-A
nal
ge
sic
(W
eig
hte
d)
Sed
ativ
es
(W
eig
hte
d)
Sti
mu
lan
ts
(Wei
gh
ted
)
Oth
er
(Wei
gh
ted
)
gt1
Dru
g C
lass
(W
eig
hte
d)
Neg
ativ
e
(Wei
gh
ted
)
Yes 107 04 53 04 05 95 00 22 817 No 5587 02 61 17 07 31 03 24 855 Total 5694 02 61 17 07 32 03 24 854
2007 National Roadside Survey of Alcohol and Drug Use by Drivers Drug Results
Of the nighttime drivers who were asked the same question nearly 2 percent responded ldquoYesrdquo (Table 80) and nearly 10 percent tested positive for stimulants which was more than any other drug category Approximately 5 percent of those tested positive for marijuana which was less than the daytime percentage of 18 percent however this difference was not statistically significant
Table 80 AA NA and Classes Nighttime (Oral Fluid) ldquoDuring the past 12 months have you received treatment for your drug or alcohol use in a self-help group such as AA or NArdquo
Of daytime drivers who responded to the question ldquoDuring the past 12 months have you received treatment for your drug or alcohol use in a self-help group such as AA or NArdquo approximately 1 percent responded ldquoYesrdquo (Table 81) Of these slightly more than 25 percent tested positive for ldquoMedicationsrdquo and nearly 18 percent tested positive for ldquoIllegalrdquo drugs
Table 81 NA AA and Drug Categories Daytime (Oral Fluid) ldquoDuring the past 12 months have you received treatment for your drug or alcohol use in a self-help group such as AA or NArdquo
N (Unwtd)
Illegal
(Weighted)
Medications (Weighted)
Illegal amp Medications (Weighted)
Negative
(Weighted)
Yes 17 177 254 00 569 No 1778 58 47 05 891 Total 1795 59 49 05 888
Of the nighttime drivers who were asked the same question nearly 2 percent responded ldquoYesrdquo (Table 82) and nearly 15 percent tested positive for ldquoIllegalrdquo drugs Although a greater percentage tested positive for ldquoIllegalrdquo drugs during the day than at night this difference was not statistically significant
75
2007 National Roadside Survey of Alcohol and Drug Use by Drivers Drug Results
Table 82 NA AA and Drug Categories Nighttime (Oral Fluid) ldquoDuring the past 12 months have you received treatment for your drug or alcohol use in a self-help group such as AA or NArdquo
N (Unwtd)
Illegal
(Weighted)
Medications (Weighted)
Illegal amp Medications (Weighted)
Negative
(Weighted)
Yes 107 149 30 04 817 No 5587 105 31 09 855 Total 5694 106 31 09 854
Blood Results (Nighttime Samples) Driver Drug Use Prevalence Based on Blood Results This section of the report presents the overall results of blood analyses for all of the drugs indicated in the introductory section of this report Blood samples were collected in addition to oral fluid samples because typically blood analyses are considered the ldquogold standard rdquoand is the more established technique for gathering information on drugs and their metabolites as oral fluid analyses are a more recently developed technique As expected the results between the oral fluid and blood results are very similar These blood results are presented to provide more complete results from our data analyses for those who are interested in seeing the results from both approaches
If a driver tested positive for one or more of the drugs for which we tested in blood she was categorized as drug positive Note that blood samples were only collected in the nighttime and that more drivers provided oral fluid samples than blood samples
About 14 percent of the 3276 nighttime drivers who provided blood samples were drug-positive (Table 83)
Table 83 Drug Prevalence by Time of Day (Blood)
Time of Day N
(Unweighted) Drug Positive
(Weighted) Daytime NA NA Nighttime 3276 138
NA = ldquoNot Applicablerdquo
Comparison of drug prevalence by session (Table 84) revealed that late-night (Sessions 3 and 5) drivers were significantly more likely to be drug-positive (179 and 168 respectively) as opposed to the earlier nighttime (Sessions 2 and 4) drivers (136 and 111 respectively) (p lt 01)
76
2007 National Roadside Survey of Alcohol and Drug Use by Drivers Drug Results
Table 84 Drug Prevalence by Session (Blood)
N Drug Positive Session (Unweighted) (Weighted)
2 Friday 10 pm ndash Midnight 857 136
3 Friday 1 am ndash 3 am 743 179
4 Saturday 10 pm ndash Midnight 986 111
5 Saturday 1 am ndash 3 am 690 168
Although the Northeast region had the greatest percentage of drug-positive findings in the nighttime driving sample (Table 85) such differences were not statistically significant Thus no clear pattern of drug prevalence by region emerged from the blood sample results
Table 85 Drug Prevalence by Region (Blood)
N Drug Positive Region (Unweighted) (Weighted)
Midwest 971 140 Northeast 584 145 South 862 134 West 859 135 Overall 3276 138
Comparison of blood samples by gender (Table 86) revealed that male drivers were more likely to be drug-positive (145) than female drivers (130) however such differences were not statistically significant
Table 86 Drug Prevalence by Gender (Blood)
Gender N
(Unweighted) Drug Positive
(Weighted) Males 1992 145 Females 1278 130 Overall 3270 139
When examining drug prevalence by age the prevalence of drug-positives was higher among young drivers (Table 87) Drivers aged 16-20 years showed a significantly higher prevalence than drivers aged 21-34 years and drivers aged 35-44 years (p lt 01) Drivers aged 35-44 45-64 and 65+ were significantly less likely to be drug positive than drivers in the combined age range of 16 to 34 years old (p lt 01)
77
2007 National Roadside Survey of Alcohol and Drug Use by Drivers Drug Results
Table 87 Drug Prevalence by Age (Blood)
N Drug Positive Age (Unweighted) (Weighted)
16-20 459 205 21-34 1372 152 35-44 625 107 45-64 697 112
65+ 91 60 Overall 3244 140
Comparisons between gender within age group (Table 88) showed that drug prevalence among male drivers ages 16-20 was significantly higher than female drivers ages 16-20 (p lt 01) Further drug prevalence among male drivers aged 21-34 was also significantly higher than the same-aged female counterparts (p lt 05)Among drivers aged 45-64 however drug prevalence was higher in females than in males (p lt 01)
Table 88 Drug Prevalence by Age and Gender (Blood)
N Drug Positive Gender Age (Unweighted) (Weighted)
Males
16-20 21-34 35-44 45-64
65+
301 825 368 413
61
228 169 112
83 60
Overall Males 1968 146
Females
16-20 21-34 35-44 45-64
65+
158 547 254 283
30
165 122 105 167
58 Overall Females 1272 130
Comparing drug prevalence between raceethnicity (Table 89) Asian drivers were significantly less likely to be drug positive (13) than drivers who identified themselves as African American Hispanic White or Other (p lt 01)
Table 89 Drug Prevalence by RaceEthnicity (Blood)
N Drug Positive RaceEthnicity (Unweighted) (Weighted)
African American 569 168 Asian 87 13 Hispanic 585 100 White 1836 155 Other 165 197 Overall 3242 140
RaceEthnic groups other than ldquoHispanicrdquo are always ldquonon-Hispanicrdquo
78
2007 National Roadside Survey of Alcohol and Drug Use by Drivers Drug Results
Looking at drug prevalence by education level (Table 90) drivers who identified themselves as college graduates or having some college experience were significantly less likely to be drug-positive (p lt 01) than drivers with other educational attainment
Table 90 Drug Prevalence by Education Level (Blood)
N Drug Positive Education Level (Unweighted) (Weighted)
Not a High School Graduate 289 203 High School Graduate 831 165 Some College 1318 125 College Graduate 594 108 Some Graduate Work 212 135 Overall Nighttime 3245 140
When examining drug prevalence by employment status (Table 91) drivers on disability showed drug prevalence that was significantly higher than employed drivers as well as homemakers students unemployed drivers and drivers who reported that they were retired (p lt 01) No statistical difference in drug prevalence was found between employed and unemployed drivers (p value = 06) ldquoRetiredrdquo drivers had significantly lower drug prevalence than employed drivers (p lt 05)
Table 91 Drug Prevalence by Employment Status (Blood)
N Drug Positive Gender (Unweighted) (Weighted)
EmployedSelf Employed 2592 136 Homemaker 67 120 Student 274 153 Unemployed 121 204 Retired 124 60 On Disability 47 414 Other 20 156 Overall 3245 140
79
2007 National Roadside Survey of Alcohol and Drug Use by Drivers Drug Results
Comparisons across vehicle type (Table 92) showed drug prevalence rates among drivers of passenger vehicles SUV and vanminivans were not statistically different (p value = 12) Note however that motorcyclists had the greatest percentage of drug-positive results (p lt 05) while pickup drivers had the smallest prevalence (p lt 05)
Table 92 Drug Prevalence by Vehicle Type (Blood)
N Drug Positive Vehicle Type (Unweighted) (Weighted)
Passenger Vehicle 1971 146 Pickup 401 93 SUV 586 116 Van amp Minivan 250 162 Motorcycle 48 240 Overall 3256 139
Driver Drug Use Prevalence by Drug Class Based on Blood Results In this section of the report we display driver drug use prevalence by class of drug based on blood results The classes of drugs tested for were antidepressants marijuana narcotic-analgesics sedatives stimulants and other (see Tables 94-96)
Drug Class
Two percent of the blood-sampled drivers tested positive for more than one drug class (Table 93)
Table 93 Number and Distribution of Drug Classes (Blood)
Number of N Drug Classes (Unweighted) (Weighted)
1 398 118 2+ 68 20 Negative 2810 862 Overall 3276 1000
80
2007 National Roadside Survey of Alcohol and Drug Use by Drivers Drug Results
In comparing prevalence of drug classes by region (Table 94) marijuana was the most common drug class across all of the regions (67) However drivers in the West region were less likely to test positive for marijuana than in the other regions (p lt 05)
Table 94 Drug Classes Distribution by Region (Blood)
Midwest Northeast South West All Drug Class
N=971 N=584 N=862 N=859 N=3276 Antidepressants 07 04 13 15 11 Marijuana 79 95 60 47 67 Narcotic-Analgesics 11 04 14 08 09 Sedatives 09 04 16 14 11 Stimulants 21 10 15 22 19 Other 00 00 02 05 02 More than 1 Class 13 29 13 24 20 Overall Drug Positive 140 145 134 135 138 Negative 860 855 866 865 862
ldquoMore than 1 Classrdquo ndash Drivers testing positive for more than one drug are only counted in this category In this table percentages are weighted
Comparison of drug class by gender (Table 95) revealed that male drivers were significantly more likely to test positive for marijuana than female drivers (74 males versus 56 females) (p lt 05)
Table 95 Drug Classes Distribution by Gender (Blood)
Males Females Total Drug Class
N=1992 N=1278 N=3270 Antidepressants 10 12 11 Marijuana 74 56 67 Narcotic-Analgesics 08 10 09 Sedatives 07 18 11 Stimulants 18 20 19 Other 04 00 02 More than 1 Class 24 14 20 Overall Drug Positive 145 130 139 Negative 855 870 861
In this table percentages are weighted ldquoMore than 1 Classrdquo ndash Drivers testing positive for more than one drug are only counted in this category
81
2007 National Roadside Survey of Alcohol and Drug Use by Drivers Drug Results
Comparison of drug class by age (Table 96) showed that drivers 34 or younger were more likely to test positive for marijuana than drives in other age groups (p lt 01) Among drivers aged 16shy34 drivers aged 16-20 years had the highest marijuana positives (152) The prevalence of narcotic-analgesics was higher among the 16-20 and 35-44 year age group (13 and 17) than among any other age group (p lt 01)
Table 96 Drug Classes Distribution by Age (Blood)
16-20 21-34 35-44 45-64 65+ Total Drug Class
N=459 N=1372 N=625 N=697 N=91 N=3244 Antidepressants 03 06 09 28 10 11 Marijuana 152 88 31 10 00 68 Narcotic-Analgesics 13 07 17 04 00 09 Sedatives 00 08 10 21 48 11 Stimulants 07 18 20 27 00 18 Other 02 04 02 00 00 02 More than 1 Class 27 19 18 23 01 20 Overall Drug Positive 205 152 107 112 60 140 Negative 795 848 893 888 940 860
ldquoMore than 1 Classrdquo ndash Drivers testing positive for more than one drug are only counted in this category In this table percentages are weighted
Driver Drug Use Prevalence by Drug Category Based on Blood Results In this section of the report we display drug use prevalence results from blood tests by drug category
About 9 percent of the nighttime drivers providing blood tested positive for drugs in the ldquoIllegalrdquo category (Table 97) Four percent were positive for ldquoMedicationsrdquo and 07 percent were positive for both ldquoIllegal and Medicationsrdquo
Table 97 Drug Categories Distribution (Blood)
N Drug Category (Unweighted) (Weighted)
Illegal 267 91 Medications 169 40 Illegal amp Medications 30 07 Negative 2810 862 Overall 3276 1000
ldquoMedicationsrdquo includes prescription and over-the-counter drugs
82
Table 98 Drug Categories Distribution by Region (Blood)
Region Drug Category N
(Unweighted)
(Weighted)
Midwest
Illegal Medications Illegal amp Medications Negative
81 52 8
830
102 32 06
860 Overall 971 1000
Northeast
Illegal Medications Illegal amp Medications Negative
57 26 4
497
110 27 08
855 Overall 584 1000
South
Illegal Medications Illegal amp Medications Negative
56 51 12
743
76 49 09
866 Overall 862 1000
West
Illegal Medications Illegal amp Medications Negative
73 40 6
740
82 49 05
865 Overall 859 1000
ldquoMedicationsrdquo includes prescription and over-the-counter drugs
2007 National Roadside Survey of Alcohol and Drug Use by Drivers Drug Results
The percentage of ldquoIllegalrdquo drug prevalence was slightly higher (p lt 05) in the Midwest and Northeast than in the remaining regions (Table 98)
When examining prevalence by drug category and gender (Table 99) we found that over 10 percent of male drivers had positive results for ldquoIllegalrdquo drugs as did about 7 percent of female drivers (p lt 01) The difference in percentage of positive results for ldquoMedicationsrdquo between male and female drivers was not statistically significant
83
2007 National Roadside Survey of Alcohol and Drug Use by Drivers Drug Results
Table 99 Drug Categories Distribution by Gender (Blood)
N Gender Drug Category (Unweighted) (Weighted)
Male
Illegal Medications Illegal amp Medications Negative
191 75 19
1707
104 33 08
855 Overall 1992 1000
Female
Illegal Medications Illegal amp Medications Negative
76 94 11
1097
72 54 04
870 Overall 1278 1000
ldquoMedicationsrdquo includes prescription and over-the-counter drugs
Examining drug use by age (Table 100) ldquoIllegalrdquo drug use was highest for drivers in the youngest age group (16-20 years) (p lt 01) followed by drivers aged 21-34 ldquoIllegalrdquo drug use among drivers 35 and older was significantly lower than among drivers younger than age 35 (p lt 01) ldquoMedicationrdquo usage followed the opposite trend with prevalence increasing with age Prevalence of ldquoMedicationrdquo was significantly higher for drivers aged 35 and older than for drivers younger than age 35 (p lt 01)
84
2007 National Roadside Survey of Alcohol and Drug Use by Drivers Drug Results
Table 100 Drug Categories Distribution by Age (Blood)
N Age Drug Category (Unweighted) (Weighted)
16-20
Illegal Medications Illegal amp Medications Negative
56 8 4
391
177 19 09
795 Overall 459 1000
21-34
Illegal Medications Illegal amp Medications Negative
141 48 13
1170
117 27 07
848 Overall 1372 1000
35-44
Illegal Medications Illegal amp Medications Negative
43 43 7
532
53 50 04
893 Overall 625 1000
45-64
Illegal Medications Illegal amp Medications Negative
26 61 6
604
31 73 08
888 Overall 697 1000
65+
Illegal Medications Illegal amp Medications Negative
0 9 0
82
00 60 00
940 Overall 91 1000
ldquoMedicationsrdquo includes prescription and over-the-counter drugs
Driver Drug Use Prevalence from Blood and BAC Results The following section presents the results of the blood drug analyses combined with the BAC results from breath tests
The numbers of drug-positive drivers by BAC level are shown in Tables 101 and 102 Table 101 shows BAC level with respect to the total number of drivers in each drug result category (positives negatives and overall) Table 102 shows drug prevalence with respect to the total number of drivers in each of the three BAC categories A statistically significant association was found between drug-positive and alcohol-positive drivers The percentage of drivers with BAC gdL 08+ was significantly higher among drug-positive drivers than among drug-negative drivers (p lt 01) The percentage of drivers with a BAC between zero and 08 was also significantly higher for drug-positive drivers (p lt 01)
85
2007 National Roadside Survey of Alcohol and Drug Use by Drivers Drug Results
Table 101 Drug Prevalence by BAC (Percentages Calculated by Row) (Blood)
BAC (gdL) Drug N Between
Result (Unweighted) Zero Zero and 08 08+ Positive 466 783 160 57 Negative 2810 937 52 11 Overall 3276 916 67 17
In this table percentages are weighted
Table 102 Drug Prevalence by BAC (Percentages Calculated by Column) (Blood)
BAC (gdL) Drug Between
Result Zero Zero and 08 08+ All N=2984 N=241 N=51 N=3276
Positive 118 332 453 138 Negative 882 668 547 862
In this table percentages are weighted
Examining BAC among drug-positive drivers by age (Table 103) a large percentage of alcohol-positives were found in drug-positive drivers aged 16-20 and 21-34 (p lt 01) Drivers aged 65 and older had the largest percentage of drivers at intermediate BAC (ie between zero and 08) however the sample size of this category was quite small
Table 103 BAC Among Drug-Positive Drivers by Age (Blood)
BAC (gdL) N Between Zero
Age (Unweighted) Zero and 08 08+ 16-2021-3435-4445-6465+
68 202
93 93
9
737 733 847 955 599
212 187
94 45
401
51 80 59 00 00
Overall Positive 465 786 158 57 In this table percentages are weighted
There were fewer alcohol-positive drivers among drug-positive drivers with 2+ classes of drugs than those with one class (Tables 104 and 105) however due to the small sample size this difference was statistically non-significant
86
2007 National Roadside Survey of Alcohol and Drug Use by Drivers Drug Results
Table 104 BAC Among Drug-Positive Drivers by Number of Drug Classes (Percentages Calculated by Column) (Blood)
BAC (gdL) No of Drug
Classes Zero Between
Zero and 08 08+ N=386 N=62 N=18
1 840 881 995 2+ 160 119 05
Overall 1000 1000 1000 In this table percentages are weighted
Table 105 BAC Among Drug-Positive Drivers by Number of Drug Classes (Percentages Calculated by Row) (Blood)
BAC (gdL) Number of N Between
Drug Classes (Unweighted) Zero Zero and 08 08+ 1 2+
398 68
769 867
165 131
66 02
Overall 466 783 160 57 In this table percentages are weighted
The majority of drug-positive drivers who were also alcohol-positive tested positive more often were positive for ldquoIllegalrdquo drugs (Tables 106 and 107) More than 90 percent of those drivers having a BAC between zero and 08 tested positive for ldquoIllegalrdquo drugs (either alone or in conjunction with ldquoMedicationsrdquo) This percentage was significantly higher than the approximately 65 percent of non-drinking (BAC = zero) drug-positive drivers who also had an ldquoIllegalrdquo drug in their system (alone or combined with ldquoMedicationsrdquo) (p lt 01)
Table 106 BAC Among Drug-Positive Drivers by Drug Category (Percentage by Row) (Blood)
BAC (gdL) N Between
Drug Category (Unweighted) Zero Zero and 08 08+ Illegal 267 717 204 79 Medications 169 936 49 15 Illegal amp Medications 30 768 232 00
ldquoMedicationsrdquo includes prescription and over-the-counter drugs In this table percentages are weighted
87
2007 National Roadside Survey of Alcohol and Drug Use by Drivers Drug Results
Table 107 BAC Among Drug-Positive Drivers by Drug Category (Percentage by Column) (Blood)
BAC (gdL) Between Zero
Drug Category Zero and 08 08+ N=386 N=62 N=18
Illegal 605 842 925 Medications 349 90 75 Illegal amp Medications 46 68 00
ldquoMedicationsrdquo includes prescription and over-the-counter drugs In this table percentages are weighted
High alcohol-positive drivers (ie drivers with a 08 BAC gdL or greater) who tested positive for ldquoIllegalrdquo drugs were more likely to be age 44 or younger (p lt 01) The sample size was very small for drivers aged 45 or older in particular those aged 65 or older (Note that due to the number of groupings in Table 108 and the small sample sizes caution should be exercised in interpretation of these findings)
Table 108 BAC of Drivers by Drug Category and Age (Blood)
BAC (gdL) N Between
Age Drug Category (Unweighted) Zero Zero and 08 08+
16-20
Illegal Medications Illegal amp Medications Negative
56 8 4
391
698 1000 956 978
243 00 44 19
59 00 00 03
Overall 459 929 59 13
21-34
Illegal Medications Illegal amp Medications Negative
141 48 13
1170
693 963 490 917
209 10
510 70
97 27 00 13
Overall 1372 889 87 23
35-44
Illegal Medications Illegal amp Medications Negative
43 43 7
532
781 906
1000 956
126 66 00 34
93 28 00 10
Overall 625 944 41 15
45-64
Illegal Medications Illegal amp Medications Negative
26 61 6
604
918 966
1000 925
82 34 00 60
00 00 00 15
Overall 697 928 58 13
65+
Illegal Medications Illegal amp Medications Negative
0 9 0
82
NA 599
NA 953
NA 401
NA 47
NA 00
NA 00
Overall 91 932 68 00 ldquoMedicationsrdquo includes prescription and over-the-counter drugs NA = ldquoNot Applicablerdquo In this table percentages are weighted
88
Gender Drug Category N
(Unweighted)
BAC (gdL)
Zero Between Zero
and 08 08+ Illegal 191 721 174 106Medications 75 905 84 11
Males Illegal amp Medications 19 708 292 00 Negative 1707 929 58 13Overall 1992 905 73 22 Illegal 76 707 278 15Medications 94 968 14 18
Females Illegal amp Medications 11 961 39 00 Negative 1097 950 42 08Overall 1278 933 57 09
2007 National Roadside Survey of Alcohol and Drug Use by Drivers Drug Results
Male drivers who tested positive for ldquoIllegalrdquo drugs (Table 109) had statistically greater percentages of alcohol-positive results than their female counterparts (p lt 05)
Table 109 BAC of Drivers by Drug Category and Gender (Blood)
ldquoMedicationsrdquo includes prescription and over-the-counter drugs In this table percentages are weighted
Oral Fluid andor Blood Results (Nighttime Samples) Driver Drug Use Prevalence Based on Oral Fluid andor Blood Results This section of the report presents the joint results of oral fluid and blood analyses for all of the drugs indicated in the introductory section (see Tables 17 and 18) for nighttime drivers As noted earlier blood was only obtained from nighttime drivers The tables in this section are based on the 5910 nighttime drivers from whom an oral fluid andor a blood sample was obtained and analyzed If a driver tested positive for one or more of the drugs in either the oral fluid andor in the blood analyses heshe was categorized as drug-positive Thus this section provides the most comprehensive nighttime drug prevalence estimates available using the biological specimens obtained in this study Again these are overall drug prevalence estimates including illegal prescription and over-the-counter drugs or their metabolites and do not necessarily imply impairment Within individual tables overall counts may not total 5910 because of missing values on some variables
When we examine the test results from nighttime drivers providing oral fluid andor blood 163 percent of drivers were drug-positive as indicated in Table 110
89
2007 National Roadside Survey of Alcohol and Drug Use by Drivers Drug Results
Table 110 Nighttime Drug Prevalence by Time of Day (Oral Fluid andor Blood)
N Drug Positive Time of Day (Unweighted) (Weighted)
Daytime NA NA Nighttime 5910 163
When we examined drug prevalence by time of day (Table 111) we found that late-night (Sessions 3 and 5) drivers were significantly more likely to be drug positive (191 and 183 respectively) than Friday and Saturday earlier in the night (Sessions 2 and 4) drivers (154 and 152 respectively) (p lt 01)
Table 111 Drug Prevalence by Session (Oral Fluid andor Blood)
N Drug Positive Session (Unweighted) (Weighted)
2 Friday 1000 pm ndash Midnight 1618 154
3 Friday 100 am ndash 300 am 1313 191
4 Saturday 1000 pm ndash Midnight 1695 152
5 Saturday 100 am ndash 300 am 1284 183 Overall 5910 163
Comparison of drug prevalence by region (Table 112) showed that the Northeast region had the greatest percentage of drug-positive findings at 183 percent However this difference was not statistically significant Thus no clear pattern by region emerged
Table 112 Drug Prevalence by Region (Oral Fluid andor Blood)
N Drug Positive Region (Unweighted) (Weighted)
Midwest 1708 169 Northeast 1119 183 South 1566 163 West 1517 150 Overall 5910 163
Examining drug prevalence by gender (Table 113) revealed that male drivers were significantly more likely to be drug-positive than female drivers (180 male versus 138 female) (p lt 01)
90
2007 National Roadside Survey of Alcohol and Drug Use by Drivers Drug Results
Table 113 Drug Prevalence by Gender (Oral Fluid andor Blood)
Gender N
(Unweighted) Drug Positive
(Weighted) Males 3634 180 Females 2262 138 Overall 5896 164
Comparison of drug prevalence by age (Table 114) indicated that drivers aged 16-44 showed statistically similar drug prevalence (ie no statistical difference among these age groups) Conversely drivers aged 45-64 and 65+ were significantly less likely to be drug-positive than drivers aged 16-44 (p lt 01)
Table 114 Drug Prevalence by Age (Oral Fluid andor Blood)
Age N
(Unweighted) Drug Positive
(Weighted) 16-20 974 188 21-34 2451 182 35-44 1046 170 45-64 1225 121 65+ 148 40 Overall Nighttime 5844 165
When examining drug prevalence by age and gender (Table 115) we found that drug prevalence among male drivers in the age categories 16-20 and 21-34 years was significantly higher than their same-aged female counterparts (p lt 01) Drug prevalence among male drivers in the age category 35-44 years was also significantly higher than their same-aged female counterparts (p lt 05) However drug prevalence among female drivers aged 45-64 (154) was significantly higher than male drivers of the same age group (100) (p lt 01)
91
2007 National Roadside Survey of Alcohol and Drug Use by Drivers Drug Results
Table 115 Drug Prevalence by Age and Gender (Oral Fluid andor Blood)
N Drug Positive Gender Age (Unweighted) (Weighted)
Males
16-20 21-34 35-44 45-64 65+
605 1502
634 741 101
221 211 194 100
40 Overall Males 3583 182
Females
16-20 21-34 35-44 45-64 65+
368 944 409 482
47
140 135 137 154
42 Overall Females 2250 138
Table 116 shows drug prevalence by raceethnicity Drivers who identified themselves as Asian were significantly less likely to be drug positive (19) than drivers who identified themselves as African American Hispanic White or Other (p lt 01) African American drivers were found to have the highest percentage of drug-positive results (224) which was a significantly higher rate than that of their Hispanic or White counterparts (p lt 01)
Table 116 Drug Prevalence by RaceEthnicity (Oral Fluid andor Blood)
N Drug Positive RaceEthnicity (Unweighted) (Weighted)
African American 980 224 Asian 191 19 Hispanic 1015 133 White 3378 172 Other 273 181 Overall 5837 165
RaceEthnic groups other than ldquoHispanicrdquo are always ldquonon-Hispanicrdquo
As shown in Table 117 drivers who identified themselves as having at least some college experience were statistically less likely to be drug-positive than those reporting being a high school graduate or less education (p lt 01)
92
2007 National Roadside Survey of Alcohol and Drug Use by Drivers Drug Results
Table 117 Drug Prevalence by Education Level (Oral Fluid andor Blood)
Education Level N
(Unweighted) Drug Positive
(Weighted) Not a High School Graduate 579 203 High School Graduate 1482 240 Some College 2234 140 College Graduate 1159 109 Some Graduate Work 389 169 Overall 5843 165
Comparison of drug prevalence by employment status (Table 118) indicated that drivers on disability showed a drug prevalence that was significantly higher than that of employed drivers (p lt 01) The prevalence of drug positives among employed drivers did not differ significantly from that of unemployed drivers Retired drivers had significantly lower drug prevalence than employed drivers (p lt 01)
Table 118 Drug Prevalence by Employment Status (Oral Fluid andor Blood)
N Drug Positive Employment Status (Unweighted) (Weighted)
EmployedSelf Employed 4646 167 Homemaker 104 85 Student 593 159 Unemployed 206 182 Retired 206 83 On Disability 67 447 Other 23 150 Overall 5845 165
Table 119 shows drug prevalence by vehicle type Drug prevalence rates among drivers of various vehicle types (passenger vehicle pickup SUV and vanminivans) were statistically different from motorcyclists who had the greatest percentage of drug-positive results (p lt01)
Table 119 Drug Prevalence by Vehicle Type (Oral Fluid andor Blood)
Vehicle Type N
(Unweighted) Drug Positive
(Weighted) Passenger Vehicle 3650 165 Pickup 703 159 SUV 1058 152 Van amp Minivan 381 174 Motorcycle 75 319 Overall 5867 164
93
2007 National Roadside Survey of Alcohol and Drug Use by Drivers Drug Results
Driver Drug Use Prevalence by Drug Class Based on Oral Fluid andor Blood Results In this section of the report we display driver drug use prevalence by class of drug The classes of drugs tested for were antidepressants marijuana narcotic-analgesics sedatives stimulants and other (see Tables 17-18)
Drug Class
As indicated in Table 120 135 percent of the drivers tested positive for one drug class and 28 percent tested positive for more than one drug class
Table 120 Number and Distribution of Drug Classes (Oral Fluid andor Blood)
Number of N Drug Classes (Unweighted) (Weighted)
1 792 135 2+ 184 28 Negative 4934 837 Overall 5910 1000
Further drivers testing positive for only one drug class constituted about 83 percent of drug-positive drivers (Table 121)
Table 121 Number and Distribution of Drug Classes (Drug Positives Only) (Oral Fluid andor Blood)
Number of Drug Classes
N (Unweighted)
Drug Positive (Weighted)
1 792 828 2+ 184 172 Overall 976 1000
94
2007 National Roadside Survey of Alcohol and Drug Use by Drivers Drug Results
Table 122 presents distribution of drug classes by region Generally marijuana was the most common drug class across all the regions (68) followed by stimulants (32) Drivers in the West were less likely to test positive for marijuana than drivers from the other regions (p lt 01)
Table 122 Drug Classes Distribution by Region (Oral Fluid andor Blood)
Midwest Northeast South West All Drug Class
N=1708 N=1119 N=1566 N=1517 N=5910 Antidepressants 07 04 07 07 07 Marijuana 88 78 72 47 68 Narcotic-Analgesics 10 29 16 16 16 Sedatives 12 03 08 08 08 Stimulants 31 18 26 42 32 Other 02 00 01 05 03 More than 1 Class 18 51 32 25 28 Overall Drug Positive 169 183 163 150 163 Negative 831 817 837 850 837
ldquoMore than 1 Classrdquo ndash Drivers testing positive for more than one drug are only counted in this category In this table percentages are weighted
As is shown in Table 123 males were significantly more likely to be positive for marijuana than females (80 males versus 50 females) (p lt 01)
Table 123 Drug Classes Distribution by Gender (Oral Fluid andor Blood)
Males Females Total Drug Class
N=3634 N=2262 N=5896 Antidepressants 07 07 07 Marijuana 80 50 69 Narcotic-Analgesics 17 15 16 Sedatives 06 12 08 Stimulants 31 35 33 Other 03 03 03 More than 1 Class 35 17 28 Overall Drug Positive 180 138 164 Negative 820 862 836
ldquoMore than 1 Classrdquo ndash Drivers testing positive for more than one drug are only counted in this category In this table percentages are weighted
When we examined drug class prevalence by age (Table 124) we found that drivers aged 16-20 were more likely to use marijuana (120) than drivers in the 21-34 age group (p lt 05) and any other age group (p lt 01) The age group with the second highest prevalence of marijuana was 21-34 the prevalence in this age group (92) was also significantly higher than in older age groups (p lt 01)
95
Drug Class 16-20
21-34
35-44
45-64
65+
Total
N=974 Antidepressants 04 Marijuana 120 Narcotic-Analgesics 12 Sedatives 00 Stimulants 22 Other 02
More than 1 Class 27
N=2451 03 92 08 06 33 05 36
N=1046 09 46 43 15 31 02 23
N=1225 15 11 14 12 47 01 22
N=148 06 00 04 30 00 00 01
N=5844 07 69 16 09 33 03 28
Overall Drug Positive 188 182 170 121 40 165 835 Negative 812 818 830 879 960
ldquoMore than 1 Classrdquo ndash Drivers testing positive for more than one drug are only counted in this category In this table percentages are weighted
2007 National Roadside Survey of Alcohol and Drug Use by Drivers Drug Results
Table 124 Drug Classes Distribution by Age (Oral Fluid andor Blood)
Driver Drug Use Prevalence by Drug Category Based on Oral Fluid andor Blood Results In this section of the report we display drug use prevalence results from the combined results of oral fluid and blood tests by drug category as described in Table 18
Table 125 shows that 113 percent of drivers tested positive for ldquoIllegalrdquo drugs and an additional 11 percent tested positive for ldquoIllegalrdquo drugs in conjunction with ldquoMedicationsrdquo Thus a total of 124 percent tested positive for ldquoIllegalrdquo drugs of which 11 percent also tested positive for a ldquoMedicationrdquo
Table 125 Drug Categories Distribution (Oral Fluid andor Blood)
N Drug Category (Unweighted) (Weighted)
Illegal 621 113 Medications 277 39 Illegal amp Medications 78 11 Negative 4934 837 Overall 5910 1000
ldquoMedicationsrdquo includes prescription and over-the-counter drugs
Table 126 displays the drug category results by region No statistically significant differences were found in the prevalence of ldquoIllegalrdquo drugs across regions
96
2007 National Roadside Survey of Alcohol and Drug Use by Drivers Drug Results
Table 126 Drug Categories Distribution by Region (Oral Fluid andor Blood)
N Region Drug Category (Unweighted) (Weighted)
Midwest
Illegal Medications Illegal amp Medications Negative
197 97 19
1395
127 35 06
831 Overall 1708 1000
Northeast
Illegal Medications Illegal amp Medications Negative
121 43 17
938
113 46 24
817 Overall 1119 1000
South
Illegal Medications Illegal amp Medications Negative
145 79 28
1314
109 38 16
837 Overall 1566 1000
West
Illegal Medications Illegal amp Medications Negative
158 58 14
1287
113 39 11
837 Overall 1517 1000
ldquoMedicationsrdquo includes prescription and over-the-counter drugs
When examining prevalence by drug category and gender (Table 127) we found that male drivers were more likely to be positive for ldquoIllegalrdquo drugs (combining the categories for ldquoIllegalrdquo and ldquoIllegal and Medicationsrdquo) than female drivers (144 male versus 85 female) (p lt 01)
Table 127 Drug Categories by Gender (Oral Fluid andor Blood)
N Gender Drug Category (Unweighted) (Weighted)
Male
Illegal
Medications
Illegal amp Medications
Negative
444
136
53
3001
131
35
13
820 Overall 3634 1000
Female
Illegal
Medications
Illegal amp Medications
Negative
176
141
25
1920
80
66
05
849
Overall 2262 1000 ldquoMedicationsrdquo includes prescription and over-the-counter drugs
97
2007 National Roadside Survey of Alcohol and Drug Use by Drivers Drug Results
Comparison of drug categories by age (Table 128) revealed that drivers aged 16-20 and 21-34 had the highest percentage of drug-positive results for ldquoIllegalrdquo (ldquoIllegalrdquo plus ldquoIllegal and Medicationsrdquo) drugs (p lt 01)
Table 128 Drug Categories Distribution by Age (Oral Fluid andor Blood)
N Age Drug Category (Unweighted) (Weighted)
16-20
Illegal Medications Illegal amp Medications Negative
131 15 14
814
155 19 14
812 Overall 974 1000
21-34
Illegal Medications Illegal amp Medications Negative
329 70 37
2015
148 22 12
818 Overall 2451 1000
35-44
Illegal Medications Illegal amp Medications Negative
91 78 15
862
82 81 08
830 Overall 1046 1000
45-64
Illegal Medications Illegal amp Medications Negative
68 101
12 1044
57 54 10
879 Overall 1225 1000
65+
Illegal
Medications
Illegal amp Medications
Negative
0
13
0
135
00
40
00
960
Overall 148 1000 ldquoMedicationsrdquo includes prescription and over-the-counter drugs
Driver Drug Use Prevalence from Oral Fluid andor Blood and BAC Results The following section presents the results of the oral fluid and blood analyses combined with the blood alcohol concentration (BAC) results obtained through breath tests
Tables 129 and 130 show the number of drug-positive drivers by BAC level As seen in Table 129 drug-positive drivers (41) were significantly more likely to have a BAC of 08 or higher than were drug negative drivers (17) (p lt 01)
98
2007 National Roadside Survey of Alcohol and Drug Use by Drivers Drug Results
Table 129 Drug Prevalence by BAC (Percentages Calculated by Row) (Oral Fluid andor Blood)
Drug Result
N (Unweighted) Zero
BAC (gdL) Between
Zero and 08 08+ Positive 976 795 164 41 Negative 4932 906 77 17 Overall 5908 888 91 21
In this table percentages are weighted
Table 130 provides another way of looking at this issue and indicates that among drivers with a BAC gdL 08+ almost a third (318) were also positive for drugs The difference in drug prevalence between BAC categories for drug positive drivers however was not statistically significant
Table 130 Drug Prevalence by BAC (Percentages Calculated by Column) (Oral Fluid andor Blood)
BAC (gdL) Drug Between Zero
Result Zero and 08 08+ All
N=5241 N=536 N=131 N=5908 Positive 146 293 318 163 Negative 854 707 682 837
In this table percentages are weighted
Table 131 shows that among participants who were drug positive drivers younger than 35 were the most likely to be alcohol-positive The prevalence of drivers with a BAC greater than zero among drivers less than 35-years-old was significantly higher than among older driver groups (p lt 01) Though a high proportion of drug-positive drivers 65+ were also alcohol positive that pattern is not statistically significant compared to the other age groups due to the small sample size
Table 131 BAC Among Drug-Positive Drivers by Age (Oral Fluid andor Blood)
BAC (gdL) N Zero Between Zero 08+
Age (Unweighted) and 08 16-20 160 799 174 28 21-34 436 750 200 50 35-44 184 876 87 379 45-64 181 842 122 36 65+ 13 587 413 00 Overall Positive 974 796 163 41
In this table percentages are weighted
99
2007 National Roadside Survey of Alcohol and Drug Use by Drivers Drug Results
As shown in Table 132 the majority of alcohol-positive drivers among drug-positive drivers were positive for only one class of drug
Table 132 BAC Among Drug-Positive Drivers by Number of Drug Classes (Percentages Calculated by Column) (Oral Fluid andor Blood)
Number of Drug Classes Zero
BAC (gdL) Between
Zero and 08 08+ N=468 N=71 N=20
1 2+
819 181
837 163
961 39
Overall 1000 1000 1000 In this table percentages are weighted
In Table 133 those drivers with 2+ classes of drugs were significantly less likely to be positive for alcohol than those drug-positive for one class (p lt 05)
Table 133 BAC Among Drug-Positive Drivers by Number of Drug Classes (Percentages Calculated by Row) (Oral Fluid andor Blood)
Number of Drug Classes
N (Unweighted) Zero
BAC (gdL) Between
Zero and 08 08+ 1 792 786 166 48 2+ 184 836 155 09 Overall 976 795 164 41
In this table percentages are weighted
As indicated in Table 134 drug-positive drivers who were also alcohol-positive were more likely to be positive for ldquoIllegalrdquo drugs than for ldquoMedicationsrdquo (p lt 01)
Table 134 BAC Among Drug-Positive Drivers by Drug Category (Oral Fluid andor Blood)
N BAC (gdL)
Between Drug Category (Unweighted) Zero Zero and 08 08+
Illegal 621 7521 1935 544 Medications 277 9140 731 129 Illegal amp Medications 78 8110 1816 075 Negative 4932 8879 909 212
ldquoMedicationsrdquo includes prescription and over-the-counter drugs In this table percentages are weighted
100
2007 National Roadside Survey of Alcohol and Drug Use by Drivers Drug Results
Table 135 presents the BACs of drivers by drug category and age Drivers with BAC a of 08 or higher who tested positive for drugs were more likely to test positive for ldquoIllegalrdquo drugs than those in the ldquoMedicationsrdquo category across all age groups However this difference was not statistically significant
Table 135 BAC of Drivers by Drug Category and Age (Oral Fluid andor Blood)
BAC (gdL) N Between Zero
Age Drug Category (Unweighted) Zero and 08 08+
16-20
Illegal Medications Illegal amp Medications Negative
131 15 14
814
759 1000 975 961
208 00 25 34
33 00 00 05
Overall 974 930 60 10
21-34
Illegal Medications Illegal amp Medications Negative
329 70 37
2014
731 837 812 880
209 146 188
96
60 17 00 24
Overall 2450 856 115 29
35-44
Illegal Medications Illegal amp Medications Negative
91 78 15
862
794 953 932 921
147 27 68 66
59 20 00 13
Overall 1046 913 70 17
45-64
Illegal Medications Illegal amp Medications Negative
68 101 12
1044
808 934 536 899
126 61
424 88
66 04 40 13
Overall 1225 892 92 16
65+
Illegal Medications Illegal amp Medications Negative
0 13
0 135
NA 587
NA 899
NA 413
NA 53
NA 00
NA 48
Overall 148 886 68 46 In this table percentages are weighted
When examining BAC by drug category by gender (Table 136) male drivers that tested positive for ldquoIllegalrdquo drugs were more likely to have a BAC at or above 08 gdL than their female counterparts (p lt 01)
101
2007 National Roadside Survey of Alcohol and Drug Use by Drivers Drug Results
Table 136 BAC of Drivers by Drug Category and Gender (Oral Fluid andor Blood)
BAC (gdL) N Between Zero
Gender Drug Category (Unweighted) Zero and 08 08+
Males
Illegal Medications Illegal amp Medications Negative
444 136
53 3001
749 928 760 902
179 64
231 78
72 08 10 21
Overall 3634 881 92 27
Females
Illegal Medications Illegal amp Medications Negative
176 141
25 1919
761 896 979 912
231 84 21 76
09 20 00 12
Overall 2261 899 89 12 In this table percentages are weighted
Individual Drug Prevalence Estimates from Oral Fluid and Oral Fluid andor Blood Combined In this section of the report we present prevalence estimates for individual drugs illegal prescription and over-the-counter drugs obtained from the analyses of oral fluid and blood specimens In Tables 137 and 139 there are three main columns The first column lists the individual drugs for which we tested and at least one driver tested positive in oral fluid The second main column presents the oral fluid results (unweighted N and weighted percentage) of samples obtained from daytime drivers on a drug-by-drug basis The third column presents results of oral fluid analyses from nighttime drivers in a similar manner Similarly tables 138 and 140 present the combined analyses of oral fluid andor blood samples provided by nighttime drivers Note in these tables there were 5910 nighttime drivers who provided either oral fluid blood or both oral fluid and blood for analysis If a driver tested positive for a specific drug or a metabolite of that drug in either oral fluid or blood or in both substances that driver was counted as positive for that drug once Thus these tables provide us with a robust estimate of nighttime drug prevalence available from the biological samples we collected because it takes advantage of the larger sample size of nighttime drivers providing oral fluid samples (5869) augmented with information obtained from analyses of blood samples obtained from 3276 nighttime drivers Most drivers who provided blood also provided oral fluid so including the blood results only increased the sample size by 41 drivers to 5910 However since in some cases specific drugs were found in oral fluid and not blood and conversely in blood but not oral fluid this dataset provides us with the most comprehensive estimates of individual drug prevalence
The Ns in the tables represent the actual unweighted number of positive tests for the listed drug or a metabolite of that drug The percentages are the weighted prevalence estimates for each drug Since individual drug use was the unit of analysis and some drivers were positive for more than one drug the sum of the individual drug prevalence estimates exceeds the overall prevalence estimates appearing elsewhere in this report
102
2007 National Roadside Survey of Alcohol and Drug Use by Drivers Drug Results
Of particular interest may be the prevalence estimates for relatively frequently encountered drugs such as marijuana Marijuana (and its metabolites) appears as a separate drug class in the typology presented in Table 17 and used in the subsequent tabulations of results by drug class However a number of drivers tested positive for more than one drug class (sometimes including marijuana) and were classified as such in the tabulations Thus drivers who were positive for marijuana were split between the mutually exclusive classifications of ldquomarijuanardquo and ldquomore than one drug classrdquo in those tables Here in these tables we present the prevalence estimates for a drug such as marijuana independent of whether other drugs were found in an individual driver Thus a driver for example who tested positive for marijuana and cocaine would appear twice in the tables in this section of the report Finally as indicated earlier in the report in many instances we tested both for the parent drug and its metabolites In cases where we found both the parent drug and its metabolite (for example THC and 11-OH-THC) we only counted that as one drug positive for the parent drug In the case in which a parent drug was identified alone which could also be a metabolite of another drug we only counted the observation as the parent drug itself and not again as the drug for which it could be a metabolite
Thus the values in the tables in this section of the report represent estimates of individual drug prevalence based on the analytic techniques available
Overall Individual Drug Prevalence in Daytime and Nighttime Review of Tables 137 and 138 reveals that the two highest prevalence drugs found in the 2007 NRS were in the ldquoIllegalrdquo drug category
The most frequently encountered single drug in oral fluid in both daytime and nighttime was THC (marijuana) Marijuana was detected in oral fluid in 446 percent of daytime drivers and 766 percent of nighttime drivers (Table 137) The results from nighttime drivers who provided oral fluid andor blood indicated that 865 percent of drivers were positive for marijuana or its metabolites (Table 138)
The second most frequently encountered drug was cocaine with either cocaine or a metabolite detected in oral fluid in 146 percent of daytime drivers and 390 percent of nighttime drivers The corresponding nighttime figure for oral fluid andor blood nighttime was 392 percent
During the daytime the next most frequently encountered drug was alprazolam at 112 percent Alprazolam (a benzodiazepine) exhibited a nighttime prevalence rate in oral fluid of 061 percent
Among opioids oxycodone exhibited a daytime prevalence rate of 037 percent Among the nighttime oral fluid samples oxycodone had a prevalence rate of 080 percent Another opioid hydrocodone had a 022 percent daytime and 061 percent nighttime oral fluid prevalence rate The atypical opioid propoxyphene was detected in 093 percent of daytime oral fluid samples and 046 percent of nighttime oral fluid samples
The daytime prevalence rate of methamphetamine was 032 percent and amphetamine was 023 percent Among nighttime drivers providing oral fluid samples methamphetamine had a prevalence rate of 080 percent Amphetamine had a prevalence rate of 036 percent
103
2007 National Roadside Survey of Alcohol and Drug Use by Drivers Drug Results
Table 137 Prevalence of Drugs in Daytime and Nighttime Drivers (Oral Fluid)
Drug
Oral Fluid Daytime Nighttime
N (Unweighted)
(Weighted)
N (Unweighted)
(Weighted)
Alprazolam 18 112 36 061 Amitriptyline 6 027 7 003 Amphetamine 4 023 19 036 Butalbital 5 026 8 017 Carisoprodol 2 005 5 003 Chlordiazepoxide 2 025 2 003 Clonazepam 2 003 7 012 Cocaine 38 146 222 390 Codeine 4 013 7 044 Dextromethorphan 3 023 16 022 Diazepam 3 010 10 014 Fluoxetine 11 034 14 023 Heroin 2 009 8 017 Hydrocodone 15 022 58 061 Hydromorphone 2 009 0 000 Ketamine 0 000 1 008 Lorazepam 0 000 1 001 MDMA 2 006 8 009 Meperidine 1 001 2 000 Meprobamate 0 000 1 001 Methadone 3 021 11 018 Methamphetamine 5 032 34 080 Methylphenidate 0 000 3 001 Morphine 0 000 1 000 Oxycodone 14 037 43 080 PCP 1 004 3 013 Phenobarbital 1 000 1 000 Phentermine 5 015 11 011 Propoxyphene 22 093 34 046 Sertraline 2 044 4 013 Temazepam 2 012 2 002 THC (Marijuana) 103 446 438 766 Tramadol 12 019 34 046 Zolpidem 2 012 1 001
All Tested Drivers dagger 1850 1100 5869 1440 dagger Number and percentages for All tested drivers indicate number of drivers providing samples and the percentage of those drivers who tested positive for at least one drug In this table percentages are weighted
104
2007 National Roadside Survey of Alcohol and Drug Use by Drivers Drug Results
Individual Drug Prevalence in Nighttime Oral Fluid andor Blood Results for drivers who provided oral fluid andor blood yielded an overall drug positive prevalence estimate of 163 percent (Table 138) Again marijuana (865) and cocaine (392) were the most frequently encountered drugs The next most frequently encountered drug was methamphetamine (084) Amphetamine was present in 045 percent of this nighttime driver population The opioids oxycodone (082) and hydrocodone (068) and the benzodiazepine alprazolam (064) were the next most frequently encountered drugs in this nighttime driver population The atypical opioid propoxyphene was present in 052 of these nighttime drivers Note however as indicated in the introduction of this section the unit of analysis in these tables is individual drug use Some drivers were positive for more than one drug thus the sum of the individual drug prevalence estimates exceed the overall prevalence estimates noted earlier in this report
105
2007 National Roadside Survey of Alcohol and Drug Use by Drivers Drug Results
Table 138 Prevalence of Drugs in All Drug-Tested Nighttime Drivers (Oral Fluid andor Blood)
Drug N
(Unweighted)
(Weighted)
Alprazolam 40 064 Amitriptyline 14 007 Amphetamine 25 045 Butalbital 9 017 Carisoprodol 5 003 Chlordiazepoxide 4 003 Clonazepam 10 014 Cocaine 225 392 Codeine 7 044 Dextromethorphan 16 022 Diazepam 30 038 Fluoxetine 25 037 Heroin 8 017 Hydrocodone 63 068 Hydromorphone 0 000 Imipramine 1 000 Ketamine 1 008 Lorazepam 2 003 MDMA 8 009 Meperidine 2 000 Meprobamate 1 001 Methadone 14 019 Methamphetamine 37 084 Methylphenidate 3 001 Morphine 8 006 Oxycodone 47 082 PCP 3 013 Phenobarbital 2 001 Phentermine 21 026 Propoxyphene 35 052 Sertraline 36 050 Temazepam 4 003 THC (Marijuana) 499 865 Tramadol 35 046 Zolpidem 4 003
All Tested Driversdagger 5910 1630 dagger Number and percentages for All tested drivers indicate number of drivers providing samples and percentage of those drivers who tested positive In this table percentages are weighted
106
2007 National Roadside Survey of Alcohol and Drug Use by Drivers Drug Results
Individual Drug Prevalence Sorted by Drug Type from Oral Fluid and Oral Fluid andor Blood Combined In Tables 139 and 140 we present prevalence estimates by drug within drug type for both daytime and nighttime drivers based on oral fluid analyses (Table 139) and for nighttime drivers based on the results of analyses of oral fluid andor blood (Table 140) These tables contain the same information provided in Tables 137 and 138 except that the drugs are sorted by drug type (Drug types are the subgrouping of similar drugs noted by class and category in Tables 17 and 18)
107
2007 National Roadside Survey of Alcohol and Drug Use by Drivers Drug Results Table 139 Prevalence of Drugs in Daytime and Nighttime Drivers (Oral Fluid)
Drug
Oral Fluid
Daytime Nighttime N
(Unweighted)
(Weighted) N
(Unweighted)
(Weighted)
THC (Marijuana) 103 446 438 766
Cocaine 38 146 222 390 Opioids
Codeine Heroin
Hydrocodone Hydromorphone Meperidine
Methadone Morphine Oxycodone Propoxyphene Tramadol
4 2
15 2 1 3 0
14 22 12
013 009 022 009 001 021 000 037 093 019
7 8
58 0 2
11 1
43 34 34
044 017 061 000 000 018 000 080 046 046
AmphetaminesStimulants MDMA Amphetamine
Methamphetamine Methylphenidate
Phentermine
2 4 5 0 5
006 023 032 000 015
8 19 34
3 11
009 036 080 001 011
Street Drugs Ketamine PCP
0 1
000 004
1 3
008 013
Benzodiazepines Alprazolam
Chlordiazepoxide Clonazepam Diazepam
Lorazepam Temazepam
18 2 2 3 0 2
112 025 003 010 000 012
36 2 7
10 1 2
061 003 012 014 001 002
Antidepressants Amitriptyline
Fluoxetine Imipramine Sertraline
6 11
0 2
027 034
0 044
7 14
0 4
003 023
0 013
Barbiturates Butalbital
Phenobarbital 5 1
026 000
8 1
017 000
Pain Drugs Carisoprodol Meprobamate
2 0
005 000
5 1
003 001
Sleep Aids Zolpidem 2 012 1 001
Cough Suppressants Dextromethorphan 3 023 16 022
All Tested Driversdagger 1850 1100 5869 1440 dagger Number and percentages for All tested drivers indicate number of drivers providing samples and percentage of those drivers who tested positive In this table percentages are weighted
108
2007 National Roadside Survey of Alcohol and Drug Use by Drivers Drug Results
Table 140 Prevalence of Drugs in All Drug-Tested Nighttime Drivers (Oral Fluid andor Blood)
Drug N
(Unweighted)
(Weighted) THC (Marijuana) 499 865 Cocaine 225 392 Opioids
Codeine 7 044 Heroin 8 017
Hydrocodone 63 068 Hydromorphone 0 000 Meperidine 2 000
Methadone 14 019 Morphine 8 006 Oxycodone 47 082 Propoxyphene 35 052 Tramadol 35 046
AmphetaminesStimulants MDMA 8 009 Amphetamine 25 045
Methamphetamine 37 084 Methylphenidate 3 001
Phentermine 21 026 Street Drugs
Ketamine PCP
1 3
008 013
Benzodiazepines Alprazolam 40 064
Chlordiazepoxide 4 003 Clonazepam 10 014 Diazepam 30 038
Lorazepam 2 003 Temazepam 4 003 Antidepressants Amitriptyline 14 007
Fluoxetine 25 037 Imipramine 1 000 Sertraline 36 050
Barbiturates Butalbital
Phenobarbital 9 2
017 001
Pain drugs Carisoprodol Meprobamate
5 1
003 001
Sleep Aids Zolpidem 4 003
Cough Suppressants Dextromethorphan 16 022
All Tested Driversdagger 5910 1630 dagger Number and percentages for All tested drivers indicate number of drivers providing samples and percentage of those drivers who tested positive In this table percentages are weighted
109
2007 National Roadside Survey of Alcohol and Drug Use by Drivers Drug Results
Drugs that were infrequently encountered in the study population included the sedative pain drugs carisoprodol and meprobamate the sleep aid zolpidem and the street drugs ketamine and PCP Barbiturates and cough suppressants were also infrequent in the studied driver population
Examination of the results of the daytime and the nighttime oral fluid analyses and the combination of oral fluid and or blood analyses (when either one or both types of samples were provided) indicates that similar relative patterns of prevalence estimates are realized in the daytime and nighttime Marijuana is the most frequently encountered drug whether compared with other drugs individually or with drug types Cocaine is the next most frequently encountered drug or drug type in the nighttime sample but during the daytime benzodiazepines and opioids exhibited higher prevalence rates as classes than cocaine
110
2007 National Roadside Survey of Alcohol and Drug Use by Drivers Drug Results
Discussion This report summarizes the results of the first US National Roadside Survey to estimate drug-involved driving prevalence based on biological measures It should be emphasized that this is a prevalence study and not a study that addresses the risk that may be presented by drug use among drivers For many drug types drug presence can be detected long after any impairment that might affect driving has passed However it is important to our understanding of drugs and driving to know the extent of the use of certain drugs in the driving population That was the intent of this study
As indicated earlier in the report we gathered data from drivers on US roadways during Friday daytime hours as well as during Friday nights and Saturday nights We obtained oral fluid samples (1850 during daytime and 5869 during nighttime) from drivers in each of those data collection periods and collected blood samples (3276) as well during the nighttime data collection periods (Table 10)
In this study analyses of the oral fluid and blood samples were conducted to identify the presence of some 75 drugs and metabolites (Tables 17 and 18) To make the presentation of results most useful we identified six classes of these drugs including antidepressants marijuana narcotic-analgesics sedatives stimulants and other plus a ldquomore than one drugrdquo class We also identified three broader categories illegal prescription and over-the-counter Because few overshythe-counter drugs were found the prescription and over-the-counter drugs were combined for many analyses and labeled ldquoMedicationsrdquo
Oral Fluid Analyses Analyses of the oral fluid samples obtained from daytime drivers indicated an overall drug use prevalence of 11 percent and for nighttime drivers 144 percent (Table 19) This includes illegal prescription and over-the-counter drugs combined This overall difference between day and night is statistically significant (p lt 01)
In examining the prevalence of drugs by class (Table 31) marijuana was identified in 39 percent of daytime drivers and 61 percent of nighttime drivers Sedatives were found in 16 percent of daytime drivers and in 06 percent of nighttime drivers Conversely stimulants were found in 16 percent of daytime drivers but in 32 percent of nighttime drivers
Comparison of drug classes by time of day indicated that nighttime drivers were significantly more likely to test positive for more than one drug class than daytime drivers (23 nighttime versus 15 daytime) (p lt 01) Comparison of drug categories by time of day (Table 34) revealed that almost 6 percent of daytime drivers tested positive for drugs in the ldquoIllegalrdquo category (primarily marijuana and cocaine) as did over 10 percent of nighttime drivers (there was a statistically significant difference between the two groups [p lt 01]) Positive results in the ldquoMedicationsrdquo category (prescription and over-the-counter drugs combined) were found to be slightly higher among the daytime drivers (almost 5) than nighttime drivers (3) although this difference was not statistically significant
When examining drug prevalence by time of day and gender (Table 22) the daytime driving sample showed no statistically significant difference in drug prevalence between males and
111
2007 National Roadside Survey of Alcohol and Drug Use by Drivers Drug Results
females however in the nighttime driving sample male drivers were significantly more likely to be drug-positive than female drivers (165 males versus 113 females) (p lt 01)
Further comparison of drug class by time and gender (Table 32) showed that males were significantly more likely to test positive for marijuana than females in both daytime (59 males versus 17 females) and nighttime samples (74 males versus 41 females) (p lt 01)
When examining prevalence by drug category by time of day and gender (Table 36) we found that in the daytime sample male drivers were more likely to test positive for ldquoIllegalrdquo drugs (82) than female drivers (30) (p lt 01) Conversely daytime female drivers were more likely to show positive results for ldquoMedicationsrdquo (76) than daytime male drivers (25) (p lt 01) This pattern was similar in the nighttime sample with 125 percent of male drivers testing positive for ldquoIllegalrdquo drugs as opposed to 75 percent of female drivers (p lt 01) The difference in percentage of positive results for ldquoMedicationsrdquo between male (28) and female (33) drivers was not as striking in the nighttime sample as in the daytime sample
Comparison of overall drug prevalence by time of day and age18 (Table 23) revealed that within the daytime driving sample drivers aged 45-64 showed the highest percentage of drug positives and drivers aged 16-20 and aged 65+ were significantly less likely to be positive than other ages of drivers (p lt 05) In the nighttime driving sample drivers aged 45-64 and 65+ were significantly less likely to be drug positive (p lt 01) while drivers aged 16-20 showed no difference in drug prevalence from drivers aged 21-34 years and drivers aged 35-44 years
When we examined drug classes by time of day and age (Table 33) we found that daytime drivers aged 21-34 were more likely to use marijuana (74) than daytime drivers in other age groups (p lt 01) However drivers aged 16-20 years had the highest marijuana use (98) in the nighttime sample followed by the 21-34 year age group (85) (p lt 01) The prevalence of narcotic-analgesics among daytime drivers was highest among drivers aged 45-64 (29) (p lt 01) however in the nighttime sample this changed to the age 35-44 group (42) (p lt 01)
In comparing drug categories by time of day and age (Table 37) it was clear that within the daytime sample ldquoIllegalrdquo drug use was highest for drivers aged 21-34 (99) followed by drivers aged 35-44 (65) The prevalence of ldquoIllegalrdquo drugs for these age groups differed significantly from that in the remaining age groups (p lt 01) In the nighttime sample drivers in the 21-34 year age group still maintained the highest percentage of positive results for ldquoIllegalrdquo drugs (142) however that group was then followed by the youngest age group (16-20 years) for ldquoIllegalrdquo drugs (131) (p lt 01) ldquoMedicationsrdquo usage was highest among the 45-64 year age group (88) in the daytime sample (non-significant) and in the 35-44 year old age group in the nighttime sample (69) (p lt 01)
In comparing the number of drug-positive drivers by time of day and BAC level (Tables 38 and 39) a statistically significant association was found between drug-positive and alcohol-positive drivers within the nighttime driving sample In other words the percentage of nighttime drivers with a BAC gdL of 08+ was significantly higher among drug-positive drivers than among drug-negative drivers (p lt 01) However for daytime drivers no such statistical association was found largely because of the small number of alcohol-positive drivers in the daytime sample
18 Age ranges between groups are not equivalent
112
2007 National Roadside Survey of Alcohol and Drug Use by Drivers Drug Results
In both the daytime and nighttime samples the majority of drug-positive drivers who were alcohol-positive were in the ldquoIllegalrdquo drug category (Table 43) This was particularly true in the nighttime sample in which 173 percent in the ldquoIllegalrdquo drug category had BACs between zero and 08 (compared to 63 in the ldquoMedicationsrdquo category) and 57 percent had BACs greater than 08 (compared to 12 in the ldquoMedicationsrdquo category [p lt 01]) In the daytime sample however the differences were statistically non-significant
Blood Analyses About 14 percent of the 3276 blood samples obtained from nighttime drivers were drug-positive (Table 83) Two percent of the blood-sampled drivers tested positive for more than one drug class (Table 93 and about 9 percent of driver tested positive for drugs in the ldquoIllegalrdquo category (Table 97)
Review of blood sample findings by gender (Table 86) revealed that male drivers were more likely to be drug-positive than female drivers (145 males versus 130 females) However such differences were not statistically significant Comparison of drug class by gender (Table 95) revealed that male drivers were significantly more likely to test positive for marijuana than female drivers (74 males versus 56 females) (p lt 05) When examining prevalence by drug category and gender (Table 99) we found that over 10 percent of male drivers had positive results for ldquordquoIllegalrdquo drugs as did about 7 percent of female drivers (p lt 01) The difference in percentage of positive results for ldquoMedicationsrdquo between male and female drivers was not statistically significant
When examining drug prevalence by age (Table 87) the prevalence of drug-positives was higher among young drivers Drivers aged 16-20 years showed a significantly higher prevalence than drivers aged 21-34 years and drivers aged 35-44 years (p lt 01) Drivers aged 45-64 and 65+ were significantly less likely to be drug positive than drivers ages 16 to 34 years old (p lt 01)
Comparison of drug class by age (Table 96) showed that drivers younger than 35-years-old were more likely to test positive for marijuana than drivers in other age groups (p lt 01) Among drivers aged 16-34 drivers aged 16-20 years had the highest marijuana use (152) The prevalence of narcotic-analgesics was higher among the 16-20 and 35-44 year age groups (13 and 17 respectively) than any other age group (p lt 01)
ldquoIllegalrdquo drug use was highest for drivers in the youngest age group (16-20 years) followed by drivers aged 21-34 years old (p lt 01) ldquoIllegalrdquo drug use among drivers older than 35-years-old was significantly lower than among drivers under the age of 35 (p lt 01) ldquoMedicationrdquo usage followed the opposite trend with prevalence increasing with age Prevalence of ldquoMedicationrdquo was higher for drivers aged 35 and older than for drivers younger than age 35 (p lt 01) (Table 100)
A statistically significant association was found between drug-positive and alcohol-positive drivers (Tables 101 and 102) The percentages of drivers with a BAC gdL between zero and 08 and with a BAC gdL 08+ were significantly higher among drug-positive drivers than among drug-negative drivers (p lt 01)
113
2007 National Roadside Survey of Alcohol and Drug Use by Drivers Drug Results
Oral Fluid andor Blood Analyses Combined Similar patterns of results were obtained when we examined the drug prevalence for the 5910 nighttime drivers who provided oral fluid andor blood samples If a driver tested positive for one or more of the drugs in either the oral fluid andor in the blood analyses heshe was categorized as drug-positive (Table 110) This yielded an overall drug positive rate of 163 percent
When we examined individual drugs and their metabolites (Tables 137 and 138) we found that the most frequently encountered drug was marijuana whether it was measured in oral fluid in the daytime (45) oral fluid at nighttime (77) or the combination of oral fluid andor blood at nighttime (87) The next most frequently encountered individual drug (again by all measures) was cocaine which was present in 15 percent of daytime oral fluid samples 39 percent of nighttime oral fluid samples and 39 percent of nighttime combined oral fluid andor blood analyses
During the daytime the next most frequently encountered drug was alprazolam at 112 percent Among nighttime drivers providing oral fluid samples the most frequently encountered drugs after marijuana and cocaine were methamphetamine and oxycodone each with a prevalence rate of 080percent The data collected during the 2007 National Roadside Survey provides new insight into the extent and patterns of drug use and the combination of drug and alcohol use among our Nationrsquos drivers As noted earlier the data collected can not determine whether the drug-use patterns we observed affected driver performance For example although all the drugs examined in this study can potentially impair driving skills some of the drug-positive drivers could drive better with the therapeutic effects of medicinal drugs they are taking What this study has provided is a careful estimate of the extent of alcohol-involved and drug-involved driving in the contiguous 48 States
The next step in this process is to conduct a study that attempts to quantify the risk that drug-involved driving may pose for crash involvement One way to establish that is to conduct a case control study where data including objective measures of drug use are gathered from crash-involved drivers and non-crash-involved drivers matched to the time location and direction of travel of the crash-involved drivers Those two sets of data can then be compared to estimate the risk posed by various drugs
114
2007 National Roadside Survey of Alcohol and Drug Use by Drivers Drug Results
References Bates M Brick J amp White H (1993) Correspondence between saliva and breath estimates of
blood alcohol concentration advantages and limitations of the saliva method Journal of Studies on Alcohol 54(1) 17-22
Beirness D Simpson H M amp Williams A F (2006) Role of Cannabis and Benzodiazepines in Motor Vehicle Crashes Transportation Research Circular No E-C096 Drugs and Traffic A Symposium June 20-21 2005 (pp 12-21) Woods Hole MA Transportation Research Board of the National Academies
Blomberg RD Peck RC Moskowitz H Burns M and Fiorentino D (2005) Crash risk of alcohol involved driving A case-control study Report Stanford CT Dunlap amp Associates Inc (p 117)
Brogan W C Kemp P M Bost R O Glamann D B Lange R A amp Hillis L D (1992) Collection and handling of clinical blood samples to assure the accurate measurement of cocaine concentration Journal of Analytic Toxicology 16 152-154
Burns M M (1993) Cocaine Effects on Performance In H Utzelmann G Berghause amp G Ktoj (Eds) 12th Proceedings of the International Conference on Alcohol Drugs and Traffic Safety Verlang TUumlV Rheinland GmbH (pp 612ndash619) Koumlln Germany Centers for Disease Control and Prevention (2006) Alcohol and other drug use among victims of motor vehicle crashes ndash West Virginia ndash 2004-2005 Morbidity and Mortality Weekly Report (MMWR) 55(48)1293-1296 Available online httpwwwcdcgovmmwrpreviewmmwrhtmlmm5548a2htm
Christophersen A S (1986) Tetrahydrocannabinol stability in whole blood plastic versus glass containers Journal of Analytic Toxicology 10 129-131
Cone E J Presley L Lehrer M Seiter W Smith M Kardos K Fritch D Salamone S J amp Niedbala R (2002) Oral fluid testing for drugs of abuse positive prevalence rates by Intercept immunoassay screening and GC-MS-MS confirmation and suggested cutoff concentrations Journal of Analytical Toxicology 26(8) 541-546
Coulter C Miller E Crompton K Moore C (2008) Tetrahydrocannabinol and two of its metabolites in whole blood using liquid chromatography-tandem mass spectrometry Journal of Analytical Toxicology 32 653-658
Coulter C Crompton K amp Moore C (2008) Detection of phencyclidine in human oral fluid using solid phase extraction and liquid chromatography with tandem mass spectrometric detection Journal of Chromatography B Biomedical Sciences and Applications 873 123 shy128
Couper F J amp Logan B K (2004) Drugs and human performance fact sheet DOT HS 809 725 Washington DC National Highway Traffic Safety Administration
de Gier H (2006 June 20-21) Medicinal Drugs Critical Review of Present Knowledge and Statements for Discussion Paper presented at the Drugs in Traffic A symposium Transportation Research Board Woods Hole MA
115
2007 National Roadside Survey of Alcohol and Drug Use by Drivers Drug Results
Drummer O H (2002) Benzodiazepines Effects on human performance and behavior Forensic Science Review 14 2ndash14
Federal Highway Administration (2006) Highway Statistics 2006 Retrieved June 25 2008 from wwwfhwadotgovpolicyohimhs06driver_licensinghtm
Gieringer D H (1988) Marijuana driving and accident safety Journal of Psychoactive Drugs 20(93) 101
Heishman S J Stitzer M L amp Yingling J E (1989) Effects of tetrahydrocannabinol content on marijuana smoking behavior subjective reports and performance Pharmacology Biochemistry and Behavior 34(1) 173ndash179
Hemmelgarn B Suissa S Huang A Boivin J-F amp Pinard G (1997) Benzodiazepine use and the risk of motor vehicle crash in the elderly Journal of the American Medical Association 278 27-31
Higgins S T Bickel W K Hughes J R Lynn M Capeless M A amp Fenwick J W (1990) Effects of intranasal cocaine on human learning performance and physiology Psychopharmacology 8 451ndash485
Hold K de Boer D Zuidema J amp Maes R (1999) Saliva as an analytical tool in toxicology International Journal of Drug Testing 1(1) 1-36
Hurst P M (1976) Amphetamines and driving behavior Accident Analysis and Prevention 8 9ndash13
Jones R K Shinar D amp Walsh J M (2003) State of knowledge of drug-impaired driving DOT HS 809 642 Washington DC National Highway Traffic Safety Administration
Kelly E Darke S amp Ross J (2004) A Review of drug use and driving Epidemiology impairment risk factors and risk perceptions Drug and Alcohol Review 23 319ndash344
Kiger S Lestina D amp Lund AK (1993) Passive alcohol sensors in law enforcement screening for alcohol-impaired drivers Alcohol Drugs and Driving 9 7-18
Kintz P Cirimele V amp Ludes B (2000) Detection of cannabis in oral fluid (saliva) and forehead wipes (sweat) from impaired drivers International Journal of Drug Testing 24(7) 557-561
Lacey J Kelley-Baker K Furr-Holden C Brainard K and Moore C (2007) Pilot Test of New Roadside Survey Methodology for Impaired Driving DOT HS 810 704 Washington DC National Highway Traffic Safety Administration
Lacey J H Kelley-Baker T Furr-Holden C D M Voas R Moore C Brainard K Tippetts A S Romano E Torres P amp Berning A (2009a) 2007 National Roadside Survey of Alcohol and Drug Use by Drivers Methodology Washington DC National Highway Traffic Safety Administration (in press)
Lacey J H Kelley-Baker T Furr-Holden C D M Voas Romano E Tippetts A S Brainard K amp Berning A (2009b) 2007 National Roadside Survey of Alcohol and Drug Use by Drivers Alcohol Results Washington DC National Highway Traffic Safety Administration (in press)
116
2007 National Roadside Survey of Alcohol and Drug Use by Drivers Drug Results
Lamers C T J amp Ramaekers J G (1999) Marijuana and alcohol effects on visual search and general driving proficiency Journal of Psychopharmacology 13(3 Suppl A) A53
Lestina D C Greene M Voas R B amp Wells J (1999) Sampling procedures and survey methodologies for the 1996 survey with comparisons to earlier National Roadside Surveys Evaluation Review 23(1) 28-46
Leveille S G Buchner D M Koepsell T D McCloskey L W Wolf M E amp Gagner E H (1994) Psychoactive medications and injurious motor vehicle collisions involving older drivers Epidemiology 5 591-598
Lucki I Rickels K amp Geller A (1985) Psychomotor performance following long-term use of benzodiazepines Psychopharmacology Bulletin 21 93-96
Lund A K Preusser D F Blomberg R D amp Williams A F (1988) Drug use by tractor-trailer drivers Journal of Forensic Sciences JFSCA 33(3) 648-661
Lund A K amp Wolfe A C (1991) Changes in the incidence of alcohol-impaired driving in the United States 1973-1986 Journal of Studies on Alcohol 52(4) 293-301
Mathijssen M P Movig K L de Gier J J Nagel P H van Egmond T amp Egberts A C (2002) Use of psychoactive medicines and drugs as a cause of road trauma In D R Mayhew amp C Dussault (Eds) Proceedings of Alcohol Drugs amp Traffic Safety - T 2002 16th International Conference on Alcohol Drugs amp Traffic Safety August 4-9 2002 Vol 2 (pp 451-457) Montreal Canada International Council on Alcohol Drugs and Traffic Safety (ICADTS) Centers for Disease Control and Prevention (2006) Alcohol and other drug use among victims of motor vehicle crashes ndash West Virginia ndash 2004-2005 Morbidity and Mortality Weekly Report (MMWR) 55(48)1293-1296 Available online httpwwwcdcgovmmwrpreviewmmwrhtmlmm5548a2htm
Moore C Coulter C amp Crompton K (2007) Achieving proposed Federal concentrations using reduced specimen volume for the extraction of amphetamines from oral fluid Journal of Analytic Toxicology 31(8) 442-446
Moore C Coulter C Crompton K amp Zumwalt M (2007) Determination of benzodiazepines in oral fluid using LCMSMS Journal of Analytic Toxicology 31(9) 596-600
Moore C Rana S amp Coulter C (2007a) Determination of meperidine tramadol and oxycodone in human oral fluid using solid phase extraction and gas chromatography-mass spectrometry Journal of Chromatography B Biomedical Sciences and Applications 850 370-375
Moore C Rana S amp Coulter C (2007b) Simultaneous identification of 2-carboxyshytetrahydrocannabinol tetrahydrocannabinol cannabinol and cannabidiol in oral fluid Journal of Chromatography B Biomedical Sciences and Applications 852 459-464
Moore C Vincent M Rana S Coulter C Agrawal A amp Soares J (2006) Stability of Delta(9)-tetrahydrocannabinol (THC) in oral fluid using the Quantisaltrade collection device Forensic Science International 164(2-3) 126-130
Moskowitz H (1985) Marijuana and driving Accident Analysis and Prevention 17 323ndash345
117
2007 National Roadside Survey of Alcohol and Drug Use by Drivers Drug Results
National Highway Traffic Safety Administration (1995) National automotive sampling system Crashworthiness data system 1991-1993 Washington DC National Highway Traffic Safety Administration
National Highway Traffic Safety Administration (2001) National Automotive Sampling System Crashworthiness Data System 1995-1997 Washington DC National Highway Traffic Safety Administration
National Highway Traffic Safety Administration (2005) Fatality Analysis Reporting System Fatal crash data overview DOT HS 809 726 Washington DC National Highway Traffic Safety Administration
Neutel C I (1998) Benzodiazepine-related traffic accidents in young and elderly drivers Human Psychopharmacology 13(Suppl 2) S115ndashS123
ONeal C L Crouch D J Rollins D E amp Fatah A A (2000) The effects of collection methods on oral fluid codeine concentrations Journal of Analytic Toxicology 24(7) 536shy542
Perez-Reyes M Hicks R E Bumberry J Jeffcoat A R amp Cook C E (1988) Interaction between marihuana and ethanol Effects on psychomotor performance Alcohol Clinical and Experimental Research 12(2) 268ndash276
Polkis A Maginn D amp Barr J L (1987) Drug findings in driving under the influence of drugs cases a problem of illicit drug use Drug and Alcohol Dependence 20(1) 57-62
Preusser D F Ulmer R G amp Preusser C W (1992 December) Evaluation of the impact of the drug evaluation and classification system on enforcement and adjudication DOT HS 808 058 Washington DC National Highway Traffic Safety Administration
Quintela O Crouch D J amp Andrenyak D M (2006) Recovery of drugs of abuse from the Immunalysis Quantisaltrade oral fluid collection device Journal of Analytic Toxicology 30(8) 614-616
Rana S Moore C Agrawal A Coulter C Vincent M amp Soares J (2006) Determination of propoxyphene in oral fluid Journal of Analytic Toxicology 30(8) 516-518
Ray W A Fought R L amp Decker M D (1992) Psychoactive drugs and the risk of injurious motor vehicle crashes in elderly drivers American Journal of Epidemiology 136 873-883
Robbe H amp OHanlon J (1993) Marijuana and actual driving performance DOT HS 808 078 Washington DC National Highway Traffic Safety Administration US Department of Transportation
Rodrigues W Wang G Moore C Agrawal A Vincent M amp Soares J (2008) Development and validation of ELISA and GC-MS procedures for the quantification of dextromethorphan and its main metabolite dextrorphan in urine and oral fluid Journal of Analytic Toxicology 32 1-7
Samyn N G de Boeck et al (2002) The use of oral fluid and sweat wipes for the detection of drugs of abuse in drivers Journal of Forensic Science 47(6) 1380-1387
118
2007 National Roadside Survey of Alcohol and Drug Use by Drivers Drug Results
Samyn N amp van Haeren C (2000) On-site testing of saliva and sweat with Drugwipe and determination of concentrations of drugs of abuse in saliva plasma and urine of suspected users International Journal of Legal Medicine 113(3) 150-154
Schramm W Smith R H Craig P A amp Kidwell D A (1992) Drugs of abuse in saliva A review Journal of Analytic Toxicology 16(1) 1ndash7
Shinar D (2006) Drug Effects and Their Significance for Traffic Safety Transportation Research Circular No E-C096 Drugs and Traffic A Symposium June 20-21 2005 (pp 52shy64) Woods Hole MA Transportation Research Board of the National Academies
Smiley A (1998) Marijuana On road and driving simulator studies Paper presented at the World Health Organization Geneva Switzerland
StataCorp (2006) Stata Data Analysis and Statistical Software (httpwwwstatacom)
Terhune K Ippolito C Hendricks D Michalovic J Bogema S Santinga P Blomberg R amp Preusser D (1992) The incidence and role of drugs in fatally injured drivers DOT HS 808 065 Washington DC National Highway Traffic Safety Administration
Toennes S amp Kauert G (2001) Importance of vacutainer selection in forensic toxicological analysis of drugs of abuse Journal of Analytic Toxicology 25(5) 339-343
US Department of Transportation (1968) Alcohol and highway safety Report to the US Congress Washington DC US Government Printing Office
Voas R B Wells J Lestina D Williams A amp Greene M (1998) Drinking and driving in the United States The 1996 National Roadside Survey Accident Analysis and Prevention 30(2) 267-275
Waller P Blow F Maio R Hill E Singer K and Schaefer (1995) Crash characteristics and injuries of drivers impaired by alcoholdrugs In TS-95 Proceedings of the 13th International Conference on Alcohol Drugs and Traffic Safety August 13-August 18 1995 Adelaide Australia NHMRC Road Accident Unit University of Adelaide Walsh J M Cangianelli L A Buchan B J amp Leaverton P E (2000) DUI Officer detection of illegal drugs in drivers using rapid immunoassay devices In the 15th International Council on Alcohol Drugs and Traffic Safety (ICADTS) May 22-26 2000 Stockholm Sweden ICADTS
Ward A S Kelly T H Foltin R G amp Fischman M W (1997) Effects of d-amphetamine on task performance and social behavior of humans in a residential laboratory Experimental and Clinical Psychopharmacology 5(2) 130ndash136
White J Z Clardy D O Graves M H Kuo M MacDonald B J Wiersema S J et al (1981) Testing for sedative-hypnotic drugs in the impaired driver A survey of 72000 arrests Clinical Toxicology 18(8) 945-957
Wolfe A C (1974) 1973 US National roadside breath testing survey procedures and results DOT HS 801 241 Washington DC National Highway Traffic Safety Administration
Yacoubian G Wish E D amp Peacuterez D M (2001) A comparison of saliva testing to urinalysis in an arrestee population Journal of Psychoactive Drugs 33(3) 289ndash294
119
2007 National Roadside Survey of Alcohol and Drug Use by Drivers Drug Results
120
2007 National Roadside Survey of Alcohol and Drug Use by Drivers Drug Results
Appendix A
2007 National Roadside Survey Additional Tables
121
2007 National Roadside Survey of Alcohol and Drug Use by Drivers Drug Results
122
2007 National Roadside Survey of Alcohol and Drug Use by Drivers Drug Results
Appendix A 2007 National Roadside Survey
Additional Tables
Table 141 Nighttime Blood Results and Agreement With Self-Reported by Drug Type (Blood)
Drug Category Self-Reported
Drug Use
Blood Positive for this Drug
N (Unweighted)
(Weighted)
Antidepressants
Past 24 Hours Past 2 Days Past Month Past Year Over a Year Never
41 814 1 08 1 02 0 00 1 24
13 152 Overall 57 1000
Amphetamines
Past 24 Hours Past 2 Days Past Month Past Year Over a Year Never
1 31 0 00 3 129 1 125 8 109
38 605 Overall 51 1000
Barbiturates
Past 24 Hours Past 2 Days Past Month Past Year Over a Year Never
2 13 0 00 0 00 0 00 0 00 6 987
Overall 8 1000
Benzodiazepines
Past 24 Hours Past 2 Days Past Month
Past Year Over a Year Never
11 215 4 38 4 80 3 20 5 21
36 626 Overall 63 1000
Cocaine Past 24 Hours 4 29 Past 2 Days 2 108 Past Month 5 170 Past Year 1 10 Over a Year 6 106
123
2007 National Roadside Survey of Alcohol and Drug Use by Drivers Drug Results
Drug Category Self-Reported
Drug Use
Never
Blood Positive for this Drug
N (Unweighted)
(Weighted)
23 577 Overall 41 1000
Cough Suppressants
Past 24 Hours
Past 2 Days
Past Month
Past Year
Over a Year
Never
2 157
1 222
1 606
0 00
0 00
1 14
Overall 5 1000
Ketamine
Past 24 hrs Past 2 days Past Month Past Year Over a Year Never
0 00 0 00 0 00 0 00 0 00 1 1000
Overall 1 1000
Marijuana
Past 24 hrs Past 2 days Past Month Past Year Over a Year Never
59 371 18 54 38 162 22 68 27 93 63 252
Overall 227 1000
Methadone
Past 24 hrs Past 2 days Past Month Past Year Over a Year Never
6 980 0 00 0 00 0 00 0 00 1 20
Overall 7 1000
Opiates
Past 24 hrs Past 2 days Past Month Past Year Over a Year Never
7 227 6 131 3 240 8 37 8 163
17 204 Overall 49 1000
Pain Killers
Past 24 hrs Past 2 days Past Month Past Year Over a Year Never
13 730 3 14 5 230 1 13 2 07 2 06
Overall 26 1000
124
2007 National Roadside Survey of Alcohol and Drug Use by Drivers Drug Results
Drug Category
PCP
Self-Reported Drug Use
Past 24 hrs Past 2 days Past Month Past Year Over a Year Never
Blood Positive for this Drug
N (Unweighted)
(Weighted)
0 NA 0 NA 0 NA 0 NA 0 NA 0 NA
Overall 0 NA
Table 142 Nighttime Seat Belt Observation by Drug Prevalence (Blood)
Drug Drug N Negative Positive
(Unweighted) (Weighted) (Weighted
Driver Seat Belt Observation Yes 3159 865 135 No 106 758 242
Table 143 Nighttime Seat Belt Observation by Drug Class (Percentages Calculated by Row) (Blood)
N (Un
wei
gh
ted
)
An
tid
epre
ssa
nts
(W
eig
hte
d)
Mar
ijuan
a (W
eig
hte
d)
Nar
coti
c-A
nal
ges
ic
(Wei
gh
ted
)
Sed
ativ
es
(Wei
gh
ted
)
Sti
mu
lan
ts(W
eig
hte
d)
Oth
er(W
eig
hte
d)
gt1
Dru
g C
lass
(W
eig
hte
d)
Neg
ativ
e (W
eig
hte
d)
Driver Seat Belt Observation Yes 3156 11 65 08 12 18 03 19 865 No 106 02 139 31 00 44 00 25 758
125
N
(Un
wei
gh
ted
)
An
tid
epre
ssa
nts
(W
eig
hte
d)
Mar
ijuan
a
(Wei
gh
ted
)
Nar
coti
c-A
nal
ge
sic
(W
eig
hte
d)
Sed
ativ
es
(W
eig
hte
d)
Sti
mu
lan
ts
(Wei
gh
ted
)
Oth
er
(Wei
gh
ted
)
gt1
Dru
g C
lass
(W
eig
hte
d)
Neg
ativ
e
(Wei
gh
ted
)
Motorcycle Riders (Operators) 48 085 473 000 713 1070 058 000 7600 Helmet 37 124 192 000 1034 156 084 000 8410 No Helmet Use 9 000 1152 000 000 3253 000 000 5595 Unknown 2 000 000 000 000 000 000 000 10000
2007 National Roadside Survey of Alcohol and Drug Use by Drivers Drug Results
Table 144 Nighttime Seat Belt Observation by Drug Category (Blood)
N (Unwtd)
Illegal
(Weighted)
Medications (Weighted)
Illegal amp Medications (Weighted)
Negative
(Weighted) Driver Seat Belt Observation
Yes 3156 881 400 066 8653 No 106 2025 339 055 7581
Table 145 Nighttime Helmet Use for Motorcycle Riders (Operators) by Drug Positive (Blood)
N (Unweighted)
Drug Positive (Weighted)
Motorcycle Riders (Operators) Helmet
48 37
2400 1590
No Helmet Use 9 4405 Unknown 2 000
Table 146 Nighttime Helmet Use for Motorcycle Riders (Operators) by Drug Class (Percentages Calculated by Row) (Blood)
Table 147 Nighttime Helmet Use for Motorcycle Riders (Operators) by Drug Category (Percentages Calculated by Row) (Blood)
N (Unwtd)
Illegal
(Weighted)
Medications (Weighted)
Illegal amp Medications (Weighted)
Negative
(Weighted)
Motorcycle Riders (Operators) 48 1543 857 000 7600 Helmet 37 348 1242 000 8410 No Helmet Use 9 4405 000 000 5595 Unknown 2 000 000 000 10000
126
N
(Un
wei
gh
ted
)
An
tid
epre
ssa
nts
(W
eig
hte
d)
Mar
ijuan
a
(Wei
gh
ted
)
Nar
coti
c-A
nal
ge
sic
(W
eig
hte
d)
Sed
ativ
es
(W
eig
hte
d)
Sti
mu
lan
ts
(Wei
gh
ted
)
Oth
er
(Wei
gh
ted
)
gt1
Dru
g C
lass
(W
eig
hte
d)
Neg
ativ
e
(Wei
gh
ted
)
Yes 122 16 109 04 02 104 00 82 683 No 3080 11 65 09 11 16 03 18 868 Total 3202 11 67 09 10 19 03 20 861
2007 National Roadside Survey of Alcohol and Drug Use by Drivers Drug Results
Table 148 Nighttime Arrests and Drug Positives (Blood) ldquoDuring the past 12 months were you arrested and booked for driving under the influence of alcohol or drugsrdquo
N Drug Positive (Unweighted) (Weighted)
Yes 122 317 No 3080 132 Total 3202 139
(p lt 01)
Table 149 Nighttime Arrests and Drug Class (Blood) ldquoDuring the past 12 months were you arrested and booked for driving under the influence of alcohol or drugsrdquo
Table 150 Nighttime Arrests and Drug Categories (Blood) ldquoDuring the past 12 months were you arrested and booked for driving under the influence of alcohol or drugsrdquo
N (Unwtd)
Illegal
(Weighted)
Medications (Weighted)
Illegal amp Medications (Weighted)
Negative
(Weighted) Yes 122 223 36 58 683 No 3080 87 41 04 868 Total 3202 92 41 06 861
Table 151 Nighttime Past Treatment Program and Drug Positive (Blood) ldquoDuring the past 12 months did you ever stay at least overnight in an inpatient or residential drug or alcohol
treatment programrdquo
N (Unweighted)
Drug Positive (Weighted)
Yes 31 220 No 3065 137 Total 3096 138
127
N (Un
wei
gh
ted
)
An
tid
epre
ssa
nts
(Wei
gh
ted
)
Mar
ijuan
a(W
eig
hte
d)
Nar
coti
c-A
nal
ge
sic
(Wei
gh
ted
)
Sed
ativ
es
(Wei
gh
ted
)
Sti
mu
lan
ts
(Wei
gh
ted
)
Oth
er(W
eig
hte
d)
gt1
Dru
g C
lass
(
Wei
gh
ted
)
Neg
ativ
e (W
eig
hte
d)
Yes 31 00 22 15 09 24 00 150 780 No 3065 11 68 09 11 17 03 18 863 Total 3096 11 68 09 11 17 03 19 862
2007 National Roadside Survey of Alcohol and Drug Use by Drivers Drug Results
Table 152 Nighttime Inpatient and Drug Class (Blood) ldquoDuring the past 12 months did you ever stay at least overnight in an impatient or residential drug or alcohol treatment program for
example detox rehab a therapeutic community or a hospitalrdquo
Table 153 Nighttime Inpatient and Drug Category (Blood) ldquoDuring the past 12 months did you ever stay at least overnight in an impatient or residential drug or alcohol treatment program for
example detox rehab a therapeutic community or a hospitalrdquo
N (Unwtd)
Illegal
(Weighted)
Medications (Weighted)
Illegal amp Medications (Weighted)
Negative
(Weighted) Yes 31 46 25 150 780 No 3065 93 39 04 863 Total 3096 93 39 06 862
Table 154 Nighttime Outpatient and Drug Positive (Blood) ldquoHave you ever been admitted to an outpatient drug or alcohol treatment program NOT including meetings like AA or NArdquo
Yes
N (Unweighted)
109
Drug Positive (Weighted)
223 No 3089 135 Total 3198 137
128
N
(Un
wei
gh
ted
)
An
tid
epre
ssa
nts
(W
eig
hte
d)
Mar
ijuan
a
(Wei
gh
ted
)
Nar
coti
c-A
nal
ge
sic
(W
eig
hte
d)
Sed
ativ
es
(W
eig
hte
d)
Sti
mu
lan
ts
(Wei
gh
ted
)
Oth
er
(Wei
gh
ted
)
gt1
Dru
g C
lass
(W
eig
hte
d)
Neg
ativ
e
(Wei
gh
ted
)
Yes 109 21 89 06 03 93 00 11 777 No 3089 11 66 09 11 15 03 20 865 Total 3198 11 67 09 10 17 03 20 863
N (Unweighted)
Drug Positive (Weighted)
Yes 74 262 No 3120 134 Total 3194 138
(p lt 01)
2007 National Roadside Survey of Alcohol and Drug Use by Drivers Drug Results
Table 155 Nighttime Outpatient and Drug Class (Blood) ldquoHave you ever been admitted to an outpatient drug or alcohol treatment program NOT including meetings like AA or NArdquo
Table 156 Nighttime Outpatient and Categories (Blood) ldquoHave you ever been admitted to an outpatient drug or alcohol treatment program NOT including meetings like AA or NArdquo
N (Unwtd)
Illegal
(Weighted)
Medications (Weighted)
Illegal amp Medications (Weighted)
Negative
(Weighted) Yes 109 185 30 08 777 No 3089 89 40 06 865 Total 3198 91 40 06 863
Table 157 Nighttime AA or NA and Drug Positives (Blood) ldquoDuring the past 12 months have you received treatment for your drug or alcohol use in a self-help group such as AA or NArdquo
129
N
(Un
wei
gh
ted
)
An
tid
epre
ssa
nts
(W
eig
hte
d)
Mar
ijuan
a
(Wei
gh
ted
)
Nar
coti
c-A
nal
ge
sic
(W
eig
hte
d)
Sed
ativ
es
(W
eig
hte
d)
Sti
mu
lan
ts
(Wei
gh
ted
)
Oth
er
(Wei
gh
ted
)
gt1
Dru
g C
lass
(W
eig
hte
d)
Neg
ativ
e
(Wei
gh
ted
)
Yes 74 00 171 11 03 53 00 23 738 No 3120 11 64 09 11 16 03 20 866
1 Total 3194 1 67 09 10 17 03 20 862
2007 National Roadside Survey of Alcohol and Drug Use by Drivers Drug Results
Table 158 Nighttime AA or NA and Class (Blood) ldquoDuring the past 12 months have you received treatment for your drug or alcohol use in a self-help group such as AA or NArdquo
Table 159 Nighttime AA or NA and Drug Categories (Blood) ldquoDuring the past 12 months have you received treatment for your drug or alcohol use in a self-help group such as AA or NArdquo
N (Unwtd)
Illegal
(Weighted)
Medications (Weighted)
Illegal amp Medications (Weighted)
Negative
(Weighted) Yes 74 225 33 04 738 No 3120 88 40 06 866 Total 3194 92 40 06 862
130
2007 National Roadside Survey of Alcohol and Drug Use by Drivers Drug Results
131
2007 National Roadside Survey of Alcohol and Drug Use by Drivers Drug Results
132
DOT HS 811 249December 2009