Embed Size (px)
Citation preview

An analysis of forms processing, data capture anddocument capture systems, operations and trends
2006
TAWPI 75 Federal St., Suite 901, Boston, MA 02110 • 617-426-1167 • www.tawpi.org
Study produced byTAWPI and Harvey Spencer Associates Inc.
Sponsored by


2006 Forms Processing and Data Capture Study Page 1
First published December 2006. Copyright © 2006 by The Association for Work Process Improvement (TAWPI) and Harvey Spencer Associates.
All rights reserved. Reproduction or transmission of this publication in any form without the express permission of the copyright holder is prohibited and is a violation of federal copyright law.
The information contained herein has been diligently obtained from sources believed to be reliable and has been prepared with care. TAWPI, Harvey Spencer and HSA Inc. disclaim any and all warranties as to the accuracy and completeness of this information. TAWPI and HSA Inc., its directors, employees or assistants can accept no liability for any damages or loss occasioned to person, company or entity due to errors or omissions in the information contained herein or in the interpretation thereof. The opinions expressed herein were developed from a survey of users in the United States and the analyses may contain the opinions of the author and may change at any time without notice.
This publication is designed to provide authoritative information at the time of publication in regard to the subject matter covered. It is not intended to offer accounting, legal or other professional advice. If accounting, legal, or other professional advice is required, or if expert assistance is needed, the services of a competent professional person should be sought. This document or any part thereof may not be reproduced in any form without the express written permission of the publisher.
The Association for Work Process Improvement
75 Federal Street, Suite 901, Boston, MA 02110 Phone: 617-426-1167, Fax: 617-521-8675 www.tawpi.org
Harvey Spencer Associates Inc. 2, Penfield Drive, East Northport, New York, NY 11731 Phone: 631-368-8393, Fax: 631-368-2655 www.harveyspencer.com

Page 2 2006 Forms Processing and Data Capture Study
ABOUT TAWPI The Association for Work Process Improvement (TAWPI) is the leading membership association for senior-level management and operations professionals responsible for data capture, document management, remittance processing, imaging, fulfillment, claims processing, order processing, service bureau management, and forms processing. As a neutral and unbiased source of information, TAWPI is dedicated to helping end users sharpen their management skills, improve productivity and performance of their organizations, and maximize their value as professionals. The focus of TAWPI’s educational products and services is the future—what new technologies are available, how they should be implemented and managed, and why they are important to the strategic direction of Fortune 1000 companies such as financial services, insurance, banking, government agencies and service bureaus, and utilities. For more information about TAWPI, visit: www.tawpi.org or call 617-426-1167.
ABOUT HARVEY SPENCER Harvey Spencer is president of Harvey Spencer Associates Inc. (HSA), a New York based analyst and consulting company founded in 1989 to specialize in document scanning and capture. Harvey Spencer has extensive background in the IT industry gained over 40 years as a user; VAR; manufacturer; and consultant. During his career he has designed and implemented application systems including document management in banking, financial and commercial corporations. He has had extensive experience in systems analysis, application programming, hardware development, strategic planning, product management, and product marketing using various platforms and operating environments. He has dealt with data entry, OMR and OCR recognition technologies, document scanning and offshore processing. Over the last 10 years, he has written extensively on document capture and associated technologies with over 200 published articles. He authored a book on Automated Forms Processing originally published in 1998 and updated in 1999. Harvey Spencer wrote the TAWPI 2000 study on Forms Processing and Capture Systems in the US—the only end user analysis study ever done on the costs and methodologies used for document scanning, capture and data entry. Since 2005, Harvey Spencer Associates has been publishing the only definitive studies of the Worldwide Software Capture Industry as well as organizing the only conference designed exclusively for vendors in the capture industry.

2006 Forms Processing and Data Capture Study Page 3
TABLE OF CONTENTS
Executive Summary ...........................................................................................................................................7
Research Objectives.............................................................................................................................7
Participant Profiles ...............................................................................................................................9
Trends and Outlook ..........................................................................................................................................9
User Sophistication ..............................................................................................................................9
Distributed and Decentralized Scanning ..........................................................................................9
MFP Usage for Scanning ..................................................................................................................10
Flatbed Scanners Have Almost Disappeared.................................................................................10
Use of Multiple Recognition and OCR Engines ...........................................................................10
Continued Pressure to Reduce Costs ..............................................................................................10
No Value from Being Computer Capable ......................................................................................10
Out-Sourcing May Have Peaked......................................................................................................10
Preference for One Supplier.............................................................................................................11
Use of the Internet as a Primary Research Tool............................................................................11
Need for More Education.................................................................................................................11
Methodology.....................................................................................................................................................11
Scanning and MFP Usage...............................................................................................................................13
Distributed Scanning .........................................................................................................................13
Scanner Vendors ..............................................................................................................................................15
Image Repositories ..........................................................................................................................................17
Capture Software..............................................................................................................................................19
Automated Recognition Usage ......................................................................................................................20
Back-end Databases.........................................................................................................................................22
Form Design.....................................................................................................................................................22
Drop-out Color Usage.......................................................................................................................23
Best OCR Font Types .......................................................................................................................24
Document Preparation Costs and Methods ................................................................................................24
Future Plans ........................................................................................................................................24
Image Quality Checking..................................................................................................................................25
Verifying Data Accuracy.................................................................................................................................26
Page 4 2006 Forms Processing and Data Capture Study
Achieved First Pass Data Accuracy .................................................................................................26
Forms Lost........................................................................................................................................................27
Key Entry Cost per Hour ...............................................................................................................................27
Off-Shore Outsourcing...................................................................................................................................28
Domestic or Foreign Owned Companies.......................................................................................29
Document Types Processed...........................................................................................................................30
E-Forms ............................................................................................................................................................31
E-Forms Conversion and Usage......................................................................................................31
E-Form Creation Software ...............................................................................................................32
Purchasing Capture Software .........................................................................................................................33
Invoice Processing Plans...................................................................................................................33
Who to Buy From..............................................................................................................................34
Conclusions.......................................................................................................................................................35
Appendix 1: Types of Paper Being Processed.............................................................................................37
Appendix 2: Glossary of Terms Used ..........................................................................................................38
Appendix 3: Forms Processing & Data Capture Questionnaire...............................................................40

2006 Forms Processing and Data Capture Study Page 5
LIST OF FIGURES Figure 1: E-Commerce in the US ....................................................................................................................8
Figure 2: Respondents Vertical Markets.......................................................................................................12
Figure 3: Number of Documents Processed per day .................................................................................12
Figure 4: Distributed Scanning ......................................................................................................................13
Figure 5: Service Bureaus Distributed Scanning Plans...............................................................................14
Figure 6: Scanners Used by Respondents By Scan Speed..........................................................................15
Figure 7: Scanners in Use by Manufacturer .................................................................................................16
Figure 8: Image Repository Systems .............................................................................................................17
Figure 9: Scanners Used in Conjunction with High-end ECM Solutions ...............................................18
Figure 10: Percentage Using Identifiable Standard Capture Software .....................................................19
Figure 11: Capture Software Usage...............................................................................................................20
Figure 12: Recognition Technology Usage ..................................................................................................21
Figure 13: Number of OCR Product Engines Used ..................................................................................21
Figure 14: Back-end Databases......................................................................................................................22
Figure 15: Forms Design and Margins .........................................................................................................22
Figure 16: Use of Drop-out Colors...............................................................................................................23
Figure 17: Technology Used for Pre-Sorting...............................................................................................24
Figure 18: Plans for Auto-Classification.......................................................................................................24
Figure 19: Methods of Controlling Image Quality......................................................................................25
Figure 20: Methods of Verifying Data Accuracy ........................................................................................26
Figure 21: Percentage Accuracy from Character Recognition ..................................................................27
Figure 22: Cost of Key Entry.........................................................................................................................27
Figure 23: Planned Future Change in Outsourcing Volumes ...................................................................28
Figure 24: Is an American-owned Company Important for Outsourcing?.............................................29
Figure 25: Table of Recognition Success for Variety of Forms Types ....................................................30
Figure 26: E-Forms Usage by Department..................................................................................................31
Figure 27: E-Forms Creation Software ........................................................................................................32
Figure 28: How Suppliers are Selected .........................................................................................................33
Figure 29: Invoice Processing Installation Plans.........................................................................................34
Figure 30: Importance of Purchasing from One Supplier .........................................................................34

Page 6 2006 Forms Processing and Data Capture Study
Page left blank intentionally

2006 Forms Processing and Data Capture Study Page 7
EXECUTIVE SUMMARY In the year 2000, TAWPI and Harvey Spencer Associates conducted its first major survey of the image acquisition and data entry market. The results at that time were compelling, predicting robust growth and rapid technological advancement. This second survey benefits greatly from that earlier work, as we now have a benchmark from which to draw more accurate forecasting models. Overall, we have found that that the technology itself, as well as user sophistication has substantially improved over the last six years.
While users are still happy with their capture solutions, it is clear that the vendor community still has quite a bit of education on their hands for users. For example users do not fully appreciate the value of productivity aids such as drop-out inks or constraining boxes, how font selection may provide better OCR and there may be confusion over what the term auto-classification means.
With estimated revenues (including hardware) in the billions from scanning and document capture in the United States alone, the capture (forms processing, image acquisition and data capture) marketplace has gained momentum over the last six years.
The accelerated push from paper to electronification by many large and small industries and the need for technological advancement within capture operations has been accelerated due to a number of factors. These include an increase in productivity and work process improvement within an organization, a higher demand from customers and competition on-shore and off-shore, and the need to adhere to certain compliance regulations. According to the research analyst firm Forrester, “In the US alone, nearly 114,000 regulations have been introduced since the government began collecting this metric in 1981.” During the past few years, AMR Research estimated more than $6.5 billion dollars has been spent on technology products and services in order to adhere to Sarbanes-Oxley compliance. Capture is a key front-end process used to assist in that compliance.
In response to these regulatory mandates and the growth of forms processing and data capture industries, TAWPI partnered with Harvey Spencer Associates Inc. to build on the first Forms Processing and Data Capture Study and to help its members learn and adapt to these changes. This 2006 research offers the ability to draw comparisons regarding the advances in technology and rates of adoption. This data provides image processing and data capture professionals with a tool to identify business drivers, trends and best practices. The goal is to improve work process within operations as well as to benchmark and prioritize improvement efforts by comparing peer groups against their own operations.
Research Objectives
The purpose of this study was to gather information to help forms processing and data capture professionals improve their work process and operational efficiency as well as provide leading technology vendors information on purchasing patterns, adaptation and behaviors of industry end-users. Many of the questions were drawn from the 2000 study, however adjustments from the sponsors and Harvey Spencer Associates were added to make the 2006 study more relevant and reflective of the industry changes.
The survey data was collected from a variety of high-level document capture operational professionals from the banking and finance industry, government-state and local agencies, federal government departments, healthcare, insurance, service bureaus, telecommunication and utility companies. Each of these operation’s processes a variety of different types of forms from

Page 8 2006 Forms Processing and Data Capture Study
applications, claims, and HCFA forms to invoices, medical, remittances, surveys, and tax return forms. Average total daily volumes of pages processed varied as well, ranging from 18,700 pages processed per day to 97,000 pages processed per day with peak volumes much higher.
Despite dramatic improvements in the ability of capture tools, many respondents are only just beginning to deploy them. That being said, overall we have found that that user sophistication has substantially improved over the last six years. It seems that the users are still happy with their hardware and software solutions. However, it is clear that industry thought-leaders and vendors still have more education to disseminate to the end-user community.
There is a tremendous pressure to keep costs down, which seems to be even more relevant than in 2000. This is being reflected in lower wages, higher use of recognition and off-shore usage to handle peak volumes — particularly among service bureaus. This compares with just 29% who were using off-shore to reduce costs in our 2000 survey. At the same time, labor rates for on-shore processing have not risen in six years. Few end-users seemed bothered by whether an off-shore company is American owned or not.
In view of the cost pressures, E-forms are being used less than expected with just over half the respondents reporting usage of E-forms, and almost all for internal purposes. This may be partly reflective of the fact that respondents are mostly operational staff, however, this is consistent with recent US government statistics showing a very low level of E-business usage within the service industries (see Figure 1). Clearly there are opportunities here for improvement and standards to be developed.
Figure 1: E-Commerce in the US

2006 Forms Processing and Data Capture Study Page 9
Lost forms are clearly a problem, although only about 1% of forms are lost. Approximately 30% of respondents who answered the question said they had to return to the originator to recover lost forms. This is clearly a high cost and suggests that procedures could be improved. However, this was skewed because the question was not answered by the majority.
Participant Profiles
This report summarizes the results from the survey responses from forms processing and data capture professionals. Each participant was asked to define their specific industry. There were a total of 197 respondents, with 67% of respondents coming from the banking and finance, service bureau, insurance and government industries. 20% reported job functions and titles of vice president or higher and 42% of respondents rank as manager or director of operations in their titles.
TRENDS AND OUTLOOK Survey evidence strongly suggests that adoption rates have not kept pace with advances in technology. While there appears to be a much better understanding of the potential of capture tools and technology, the market has not yet fully embraced these tools for process improvement. Six years ago, a case could have been made that IT budgets had been depleted by Y2K expenditures, which in many cases consisted of merely bringing systems up to date. Since that time, investments have been made in networking systems, as organizations must support increasingly distributed workforces.
Over the next several years, we anticipate that adoption rates will increase to leverage these networks more effectively. We believe that systems will move capture processes from the back-office to the point of receipt or to the point of form creation, as a seamless part of business processes. Integration with office and messaging applications, such as Microsoft Office and SharePoint applications and industry-specific software systems, will become commonplace. The recent investments by larger infrastructure providers such as IBM, Oracle, EMC, and Microsoft, can be expected to give capture and content management a developmental boost.
User Sophistication
Throughout the most recent survey, we saw examples of users being a significantly more knowledgeable about image-based technologies. Organizations have a greater understanding of the hardware and the software used to create and manage images and associated data. We expect this trend to continue and manufacturers and vendors can expect to receive more sophisticated RFPs. We anticipate higher level questions on RFPs and vendors will be put under more pressure to produce measurable results. Those who cannot demonstrate an understanding of the business process combined with advanced technology and good ROIs will fail. However, there is also a large population of new users who do not have this level of sophistication. Vendors and associations combined with the well-informed users need to work to improve education of these new users.
Distributed and Decentralized Scanning
Many organizations have moved to what can be described as decentralized scanning. However, this is currently a batch-based remote truncation system designed to avoid physically moving the paper. True distributed scanning with distributed processing and localized collaboration does not yet seem to have been widely implemented.

Page 10 2006 Forms Processing and Data Capture Study
We anticipate that over the next few years we will see an increasing demand to move to a more pure form of distributed scanning that will enable processing decisions to be made on the documents at the time of scanning.
MFP Usage for Scanning
Over 50% of users have image enabled their MFPs for scanning, which is higher than industry averages indicate. These all seem to be used in conjunction with document scanners so in regards to the small numbers of <25ppm document scanners found in this survey, we believe that the MFPs are being used for this type of low volume and ad-hoc scanning.
Flatbed Scanners Have Almost Disappeared
Low volume workgroup (<25ppm) scanners were far less prevalent in this survey and most scanners operating at higher speeds do not have a flatbed. We believe that users are not scanning books or photographs as often, leading to the elimination of flatbeds.
Use of Multiple Recognition and OCR Engines
As stated before, users seem to divide into two groups — • those who understand their systems, which presumably have been installed for some time, • those who do not understand the opportunities for efficiency improvements.
The former category are utilizing multiple different recognition (OCR, Barcode and OMR), but are also employing multiple (two or three) OCR engines to improve the character recognition accuracy. These users will start to demand specific-purpose engines and those that offer voting capabilities. Vendors of systems need to offer multiple engines and voting capability. Vendors of OCR must plan on pull-through strategies to educate users on the value and best utilization of their specific engines.
Continued Pressure to Reduce Costs
The survey found expanded usage of recognition technologies, a greater use of off-shore labor to reduce costs and avoid extra staffing to handle peak volumes, and a lack of pay increases from 2000 (in fact, a small decrease). This suggests that on-going pressure to reduce costs has not let up. We anticipate that this will lead to even more pressure to move to more efficient labor-saving processes.
No Value from Being Computer Capable
Unlike in our previous survey where there was a 15% premium for computer related workers, there is now no discernable differences in per hour costs between those working with paper and those working with scanners and key from image.
Out-Sourcing May Have Peaked
Two-thirds of our respondents are not planning on increasing out-sourcing, with nearly 10% planning on reducing it. Most of those planning on increasing off-shore processing are service bureaus. We believe that the combination of increasing costs off-shore as well as increased use of recognition technologies and distributed scanning is reducing the attractiveness of off-shore out-sourcing, unless competing on cost or to handle peak volumes.

2006 Forms Processing and Data Capture Study Page 11
Preference for One Supplier
With the exception of service bureaus, users would clearly prefer to buy all their solution from one suppler. Vendors need to either provide total solutions or make partnerships with other suppliers in order to be able to provide complete solutions.
Use of the Internet as a Primary Research Tool
A majority now use Internet research supplemented by Webinars to make purchase decisions. As a result, trade shows and trade magazines are the primary losers. We expect that the functionality of vendor’s web sites, as well as ranking in search engines will become increasingly important as a supplement to trade show presence and magazine advertising.
Need for More Education
While the numbers of sophisticated users who leverage technologies efficiently has increased, there is clear divide between users who understand how to achieve efficient processes and those who do not. The industry needs to do a better job of educating new and smaller users on the availability of technology and ease of use.
METHODOLOGY The report is based on an Internet survey consisting of 60 questions designed to help understand the costs and dynamics of the scanning and forms processing markets. The survey was completed in August and September of 2006 and resulted in 197 responses from end users of scanning and document management solutions. The names of the surveyed were primarily provided by the survey sponsors, who are companies in scanning and forms processing or capture markets — Adobe, AnyDoc Software, Eastman Kodak, EMC Captiva, Kofax, and ReadSoft.
Some responses were also received from VARs (Value-Added Resellers) and software developers and, where not appropriate, these have been excluded from the analysis. Titles of respondents varied from CEO and president to information specialist and analyst.
Companies and departments varied in revenues from $1m to multi-billion dollar corporations with medians of $85m and 800 employees respectively. The main verticals represented were banking and finance, service bureaus, insurance, and government, representing 67% of end user respondents.

Page 12 2006 Forms Processing and Data Capture Study
Figure 2: Respondents Vertical Markets Banking & Finance 21% Publishing, Print, Media 2% Consulting 2% Pharmaceutical 2% Government 18% Service Bureau 20% Healthcare/Medical 6% Transportation 2% Insurance 12% Utility/Energy 2% Manufacturing 4% Other 9%
Just under 100 (50%) respondents answered questions on volumes of documents processed per day with a majority processing fewer than 1,000.
Figure 3: Number of Documents Processed per Day
Greater than 10,000 per day,
26%
1,000 - 9,999 per day, 32%
Less than 1,000 per day,
42%
According to the results, the quantity of documents processed per day varied substantially. The average minimum number of pages processed/day was 18,700 with a maximum of 97,000, but this masked a big variation in different respondents—from a high of 150,000 average per day with 1.2m peak to a low of 30 documents per day—giving medians of 1,000 average and 5,000 peak documents/day.
In 2000 we created the first study to examine the costs of capturing paper and entering data into computer systems. This year’s study represents the first update of that study and where appropriate we have compared these answers with the last study.
We would like to thank the respondents for answering 60 multiple choice questions, which we realize is a lot for an on-line survey. We would also like to acknowledge our sponsors’ support which enabled us to put together this industry unique survey; without their support it would have been impossible.

2006 Forms Processing and Data Capture Study Page 13
installed40%
within 6 mths9%6-12 months
11%
12-24 months6%
no plans31%
> 24 months3%
SCANNING AND MFP USAGE Nearly half the respondents use MFPs for scanning (45% of those who answered) with 5% not answering the question. This conforms with our understanding of MFP scanning capability, but we did not ask how much paper is being scanned on these devices versus document scanners or where it ends up.
With the exception of service bureaus, the usage of MFPs as scanning devices was approximately 50%. However only 31% of service bureaus were using MFPs, This is understandable considering the volumes of paper being handled and presumably the variations in paper mix. The average size of those service bureaus using MFPs for scanning was smaller than those who were not and those who were scanning smaller volumes were also more likely to be using MFPs. This relationship did not occur with other sectors — in fact, it seems that the larger organizations or departments were more likely to use a mixture of devices.
Among government respondents, there was a larger use of MFPs in federal government than state and local. In the manufacturing sector, all were using MFPs for scanning, but in healthcare, only three out of ten used MFPs.
Capture software vendors will need to support MFPs as part of the scanning mix. While the market for MFP hardware remains strong in particular vertical industries, vendors should not expect to have a good market from high volume service bureaus.
Distributed Scanning
The use of distributed scanning has substantially increased since our last survey (in 2000) when fewer than 25% had distributed scanning capability. This increase is credited for the expanded use of smaller desktop scanners.
Figure 4: Distributed Scanning
69% of the total respondents are currently or planning to distribute their scanning but as with MFPs, there was a difference between service bureaus and other respondents. Just over 50% of service bureaus said they had no plans to distribute scanning, suggesting that they see collecting the paper for conversion at a centralized site as more important than truncating to image earlier in the cycle.

Page 14 2006 Forms Processing and Data Capture Study
Without service bureaus, the percentage that were using or planned to use distributed scanning increased to 74%, with 44% already claiming installations in place. Clearly, this is a growing trend.
However, the bulk of scanners used by those claiming they are doing distributed or remote scanning is in the departmental to mid-volume production level. We believe that this indicates that volume based remote batch scanning is being used, and not true distributed scanning which we think indicates a lower volume. In some cases it seems that MFPs are being used for distributed scanning where both high volume scanners and MFPs are being used.
Figure 5: Service Bureaus Distributed Scanning Plans
Of the service bureaus who have installed distributed scanning, most do not seem to have plans to expand this. This suggests that service bureaus believe that a primary business reason for their existence is to convert high volumes of documents into usable images at the lowest cost in a central environment.
installed19%
within 6 mths7%
6-12 months15%
12-24 months4%
no plans55%

2006 Forms Processing and Data Capture Study Page 15
SCANNER VENDORS We asked users to identify the types of scanners they use and their happiness with the manufacturer.
2,700 scanners were in use with many respondents having multiple types and brands. Clearly, users buy for a particular need and as new systems are put in place, will purchase for this reason. Users do not differentiate between brands and there does not seem to be a discernable loyalty for one scanner except at the high end.
Figure 6: Scanners Used by Respondents by Scan Speed
69% of the total was from four main vendors: Bell & Howell, Canon, Kodak and Fujitsu. (see Figure 8) We believe this may be partly reflective of the source of the user names and the overall ECM market. However, since the last study, Canon has increased its share at the expense of HP. While we believe that this year’s respondents were somewhat more sophisticated than they were previously, we also believe that five things have happened:
1. Flatbed scanners are being used less often.
This reflects a move up the market to utilization of document management systems with sheet-fed scanners. It also reflects less of a general document scanning need for items such as books or photographs.
2. Users are scanning more pages on average as the average number of scanners used this year was highest in the 25-40ppm range at 18, whereas last time the highest number was six per installation which were <25 ppm flatbeds. This year, the lowest number was in the less than 25 ppm category (average 8.6 scanners/site vs. an overall average of 21.1)
This data point seems at variance with reported actual shipments of scanners by InfoTrends in 2006. This has been consistently showing that 10-25ppm workgroup scanners have the highest growth rates during the last few years. We believe this is because most of the respondents of the TAWPI survey have been using document imaging for a number of years; they are scanning batches of documents more quickly than they had previously. We believe that the bulk of the workgroup scanners are going into new installations and the trend is to “move up” as users become more familiar with imaging solutions. Vendors need to continue to bring higher-end functionality down market, but should be able to leverage this movement up using their brands.
<25 ppm16%
25-40 ppm26%
40-60 ppm19%
60-90 ppm24%
>90 ppm15%

Page 16 2006 Forms Processing and Data Capture Study
3. Users are becoming more sophisticated and channels of distribution have expanded.
We believe that HP’s traditional edge from its channel has been eroded as most vendors now sell through the high volume distributor channels such as Techdata and CGW.
4. Most respondents were using two different brands of scanners.
These were typically Fujitsu and Kodak; Fujitsu and HP, Kodak and Canon at low and the mid range. Respondents using high-volume production scanners all deployed an additional scanner at the lower end — presumably for exception processing.
5. Smaller service bureaus tend to standardize on a single brand of scanner while larger service bureaus tend to buy multiple brands.
Bowe Bell & Howell seems to have a good market in the smaller service bureau segment. There does not seem to be a preference by service bureaus who utilize scanners from multiple vendors—61% of all service bureaus are using scanners from more than one vendor.
Figure 7: Scanners in Use by Manufacturer
“Others” consisted mostly of remittance scanning, microfilm and book scanning.
As in our previous survey, users are satisfied with their scanning equipment scoring on average a 4.1 rating with 4 being satisfied and 5 being very satisfied. But this conceals some issues across a number of vendors where users rated their scanning equipment as neutral or dissatisfied. Vendors need to be more aware of this feedback by improving their equipment, conducting customer surveys and better managing their existing customers.
We believe that manufacturers are providing a good product, but that as users become more sophisticated, they are becoming more demanding and understanding of the technologies and
Bell & Howell 14%
Canon 14%
Kodak 20%Fujitsu 21%
Scan-Optics 2% BancTec 1%
Others 8%
HP 7%
IBML 4%
OPEX 3%
Panasonic 4%
Visioneer/Xerox 2%

2006 Forms Processing and Data Capture Study Page 17
EMC 10%
Tower 1%Stellent 2%
Microsoft Generic 11%
In-House Developed 26%
Don't Know 4%
Others 13%
Laserfiche 2%
Hyland OnBase 7%OpenText 1%
FileNet 13%
IBM 6%
Hummingbird 4%
differences. In this respect, we are seeing a difference in attitude and expectations from the last survey when users were universally enthusiastic.
IMAGE REPOSITORIES There is still quite a bit of variation in where the images are stored with a majority keeping and managing their images with systems they have developed themselves in SQL or Oracle databases.
Compliance has been a large catalyst for the growth of ECM and Image Repository and Management Systems. 24 respondents reported using multiple image repositories — the most with both EMC/Documentum and FileNet. Interestingly these multiple application sites were in different vertical markets — healthcare, banking & finance, insurance (as well as service bureaus, which one would expect). The combinations resulting from the consolidation of IBM/FileNet, Hummingbird/Open Text and Oracle/Stellent can be expected to create some more order, however, the ability to manage multiple repositories is becoming a very important capability. Capture vendors should be prepared to develop products in conjunction with ECM vendors to facilitate this.
Figure 8: Image Repository Systems
Interestingly there was a clear indication that different scanner manufacturers are primarily sold with different repositories. In the case of high-end ECM systems, EMC/Documentum – Kodak and Fujitsu are dominant with 58% of systems using their scanners, whereas they are only used in 43% of the FileNet systems which are more scanner agnostic.
To a point this may reflect sizes of systems, but our conclusion is that scanner vendors with strong relationships with software vendors clearly have an advantage. For example, IBML has benefited from its relationship with EMC/Captiva in distributing its high-end scanners with EMC/Documentum systems, but has not succeeded in forging a similar relationship with FileNet.

Page 18 2006 Forms Processing and Data Capture Study
Figure 9: Scanners Used in Conjunction with High-end ECM Solutions
Documentum Scanners
0%5%
10%15%20%25%30%35%
Bowe Bell
& How
ell
Canon
Kodak
Fujitsu
Hewlett P
acka
rdIBML
Panas
onic
FileNet Scanners
0%
5%
10%
15%
20%
25%
BancT
ec
Bowe Bell
& How
ell
Canon
Kodak
Fujitsu
Hewlett P
acka
rdIBML
OPEX
Panas
onic
2006 Forms Processing and Data Capture Study Page 19
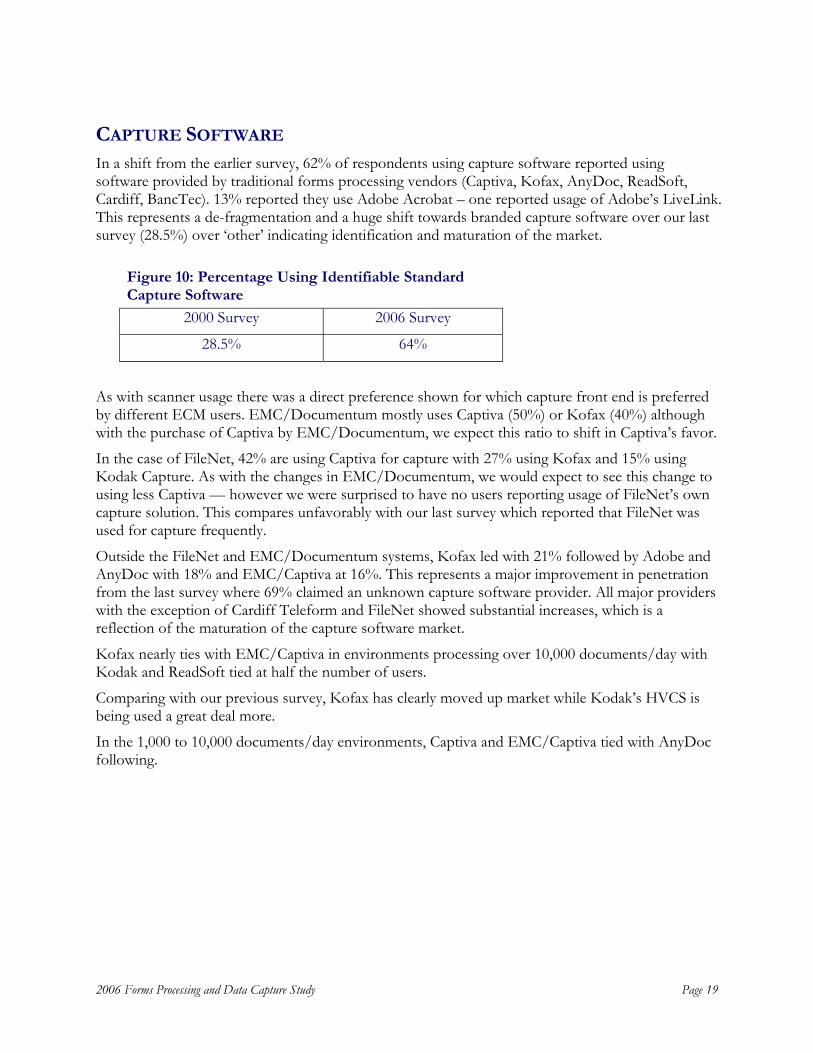
CAPTURE SOFTWARE In a shift from the earlier survey, 62% of respondents using capture software reported using software provided by traditional forms processing vendors (Captiva, Kofax, AnyDoc, ReadSoft, Cardiff, BancTec). 13% reported they use Adobe Acrobat – one reported usage of Adobe’s LiveLink. This represents a de-fragmentation and a huge shift towards branded capture software over our last survey (28.5%) over ‘other’ indicating identification and maturation of the market.
Figure 10: Percentage Using Identifiable Standard Capture Software
2000 Survey 2006 Survey
28.5% 64%
As with scanner usage there was a direct preference shown for which capture front end is preferred by different ECM users. EMC/Documentum mostly uses Captiva (50%) or Kofax (40%) although with the purchase of Captiva by EMC/Documentum, we expect this ratio to shift in Captiva’s favor.
In the case of FileNet, 42% are using Captiva for capture with 27% using Kofax and 15% using Kodak Capture. As with the changes in EMC/Documentum, we would expect to see this change to using less Captiva — however we were surprised to have no users reporting usage of FileNet’s own capture solution. This compares unfavorably with our last survey which reported that FileNet was used for capture frequently.
Outside the FileNet and EMC/Documentum systems, Kofax led with 21% followed by Adobe and AnyDoc with 18% and EMC/Captiva at 16%. This represents a major improvement in penetration from the last survey where 69% claimed an unknown capture software provider. All major providers with the exception of Cardiff Teleform and FileNet showed substantial increases, which is a reflection of the maturation of the capture software market.
Kofax nearly ties with EMC/Captiva in environments processing over 10,000 documents/day with Kodak and ReadSoft tied at half the number of users.
Comparing with our previous survey, Kofax has clearly moved up market while Kodak’s HVCS is being used a great deal more.
In the 1,000 to 10,000 documents/day environments, Captiva and EMC/Captiva tied with AnyDoc following.

Page 20 2006 Forms Processing and Data Capture Study
Figure 11: Capture Software Usage
Users were satisfied with their capture solutions although there is room for improvement. With 200 respondents, average satisfaction was 3.98 out of 5. Interestingly, the highest average was for “other solutions” with a 4.4 from 33 respondents, but this may be explained as pride in their (mostly) self- developed solutions. Apart from that, Adobe Acrobat (32 responses) scored best at 4.3 with EMC/Captiva lowest (35 responses) at 3.5. This average was dragged down by one respondent who seemed mismatched and rated the software as a 1.
This seems consistent with our previous survey where a majority rated their systems as “good” or 4 out of 5. As multiple repositories are often used and as mergers increase, the usage of multiple legacy image systems, capture vendors may need to keep track of which release script repository system they are sending the images to — it may assist with federated management.
AUTOMATED RECOGNITION USAGE 112 respondents out of 179 (63%) reported usage of recognition technologies (OCR, ICR, OMR and/or barcode). 43 (24%) reported using one recognition type only, while 30 (17%) reported using all three in their systems. Character recognition (OCR or ICR) was the predominant recognition, being used by 55% of respondents with barcode following used by 39% and OMR used by 22%.
Automated recognition usage is increasing in order to further reduce costs. This represents a 3X increase in usage of recognition technologies over our last survey.
The table below (figure 12) breaks down recognition usage by vertical market. This is affected by the types of documents being captured, but it is noteworthy that 81% of service bureaus are leveraging Optical Character Recognition (OCR) and Barcode Recognition technologies. Otherwise,
Adobe Acrobat 13%
AnyDoc 12%
Deciding 2%Other 15%
Cardiff 3%
Scan-Optics 3%
Nuance/Scansoft 2%
Readsoft 6%
Kofax 18%
BancTec 1%
Kodak 5%
eCopy 1%EMC/Captiva 19%

2006 Forms Processing and Data Capture Study Page 21
27%
35%
38% One EngineTwo EnginesThree Engines
recognition usage is lower, with OCR being used by less than 65% and Barcode by less than 40% of respondents.
In particular, government seemed to be under-utilizing these technologies with 30% of respondents using no recognition at all and it seems that there is an opportunity for productivity improvement for that group.
“Others” made up the difference in the statistics.
Figure 12: Recognition Technology Usage
Industry # Reporting OCR/ICR Usage
OMR Usage
Barcode Recognition
No Recognition
Used
Banking & Finance 40 50% 25% 40% 3%
Education 11 63% 36% 36% 9%
Government 33 58% 9% 24% 30%
Healthcare 11 64% 36% 36% 9%
Insurance 23 48% 9% 39% 4%
Service bureaus 21 81% 48% 81% 5%
Of the recognition technology users, nearly three-quarters are using multiple OCR engines to improve accuracy and reduce key entry, leveraging from different manufacturers technology. This indicates a sophistication of usage, which we did not see previously.
Figure 13: Number of OCR Product Engines Used

Page 22 2006 Forms Processing and Data Capture Study
BACK-END DATABASES The predominant back-end database used is SQL. SAP was not cited often and interestingly not at all within the manufacturing sector. This surprised us considering the predominance of SAP within manufacturing organizations.
Figure 14: Back-end Databases
FORM DESIGN Most respondents are leveraging constraining boxes on their forms wherever possible with virtually all OCR/ICR users constraining their data (72%) although most users seem to have a mixture of data which can and cannot be constrained.
Users do not set minimum margins, which is understandable as this can use up valuable space and restrict design.
Figure 15: Forms Design and Margins
DB211%
Oracle22%
SAP3%SQL
51%
Don't know13%
Neither 16%
Both 48%
Constrained only
24%
Freeform only 12%
Forms Design Minimum Margins for OCR Forms
¼ inch 33%
½ inch 17%
do not have one 50%
2006 Forms Processing and Data Capture Study Page 23
Blue16%
Green9%
Red22%Yellow
3%
Other4%
Not using drop-out colors
46%
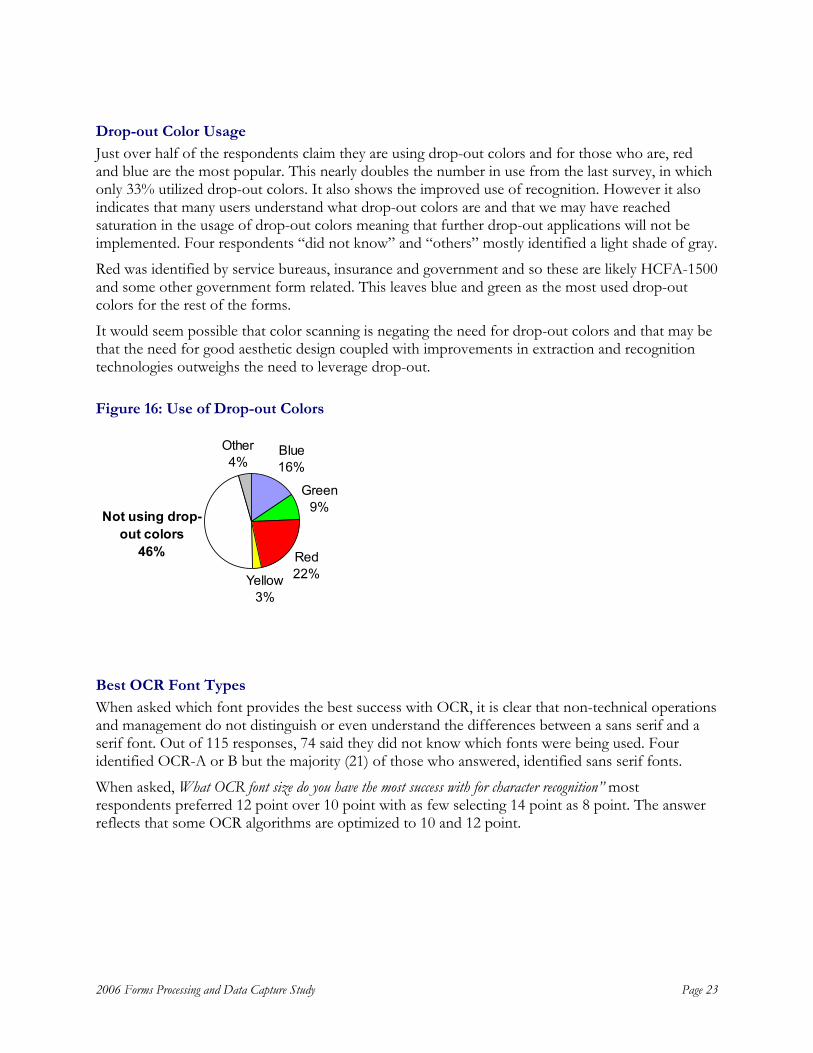
Drop-out Color Usage
Just over half of the respondents claim they are using drop-out colors and for those who are, red and blue are the most popular. This nearly doubles the number in use from the last survey, in which only 33% utilized drop-out colors. It also shows the improved use of recognition. However it also indicates that many users understand what drop-out colors are and that we may have reached saturation in the usage of drop-out colors meaning that further drop-out applications will not be implemented. Four respondents “did not know” and “others” mostly identified a light shade of gray.
Red was identified by service bureaus, insurance and government and so these are likely HCFA-1500 and some other government form related. This leaves blue and green as the most used drop-out colors for the rest of the forms.
It would seem possible that color scanning is negating the need for drop-out colors and that may be that the need for good aesthetic design coupled with improvements in extraction and recognition technologies outweighs the need to leverage drop-out.
Figure 16: Use of Drop-out Colors
Best OCR Font Types
When asked which font provides the best success with OCR, it is clear that non-technical operations and management do not distinguish or even understand the differences between a sans serif and a serif font. Out of 115 responses, 74 said they did not know which fonts were being used. Four identified OCR-A or B but the majority (21) of those who answered, identified sans serif fonts.
When asked, What OCR font size do you have the most success with for character recognition” most respondents preferred 12 point over 10 point with as few selecting 14 point as 8 point. The answer reflects that some OCR algorithms are optimized to 10 and 12 point.
Page 24 2006 Forms Processing and Data Capture Study
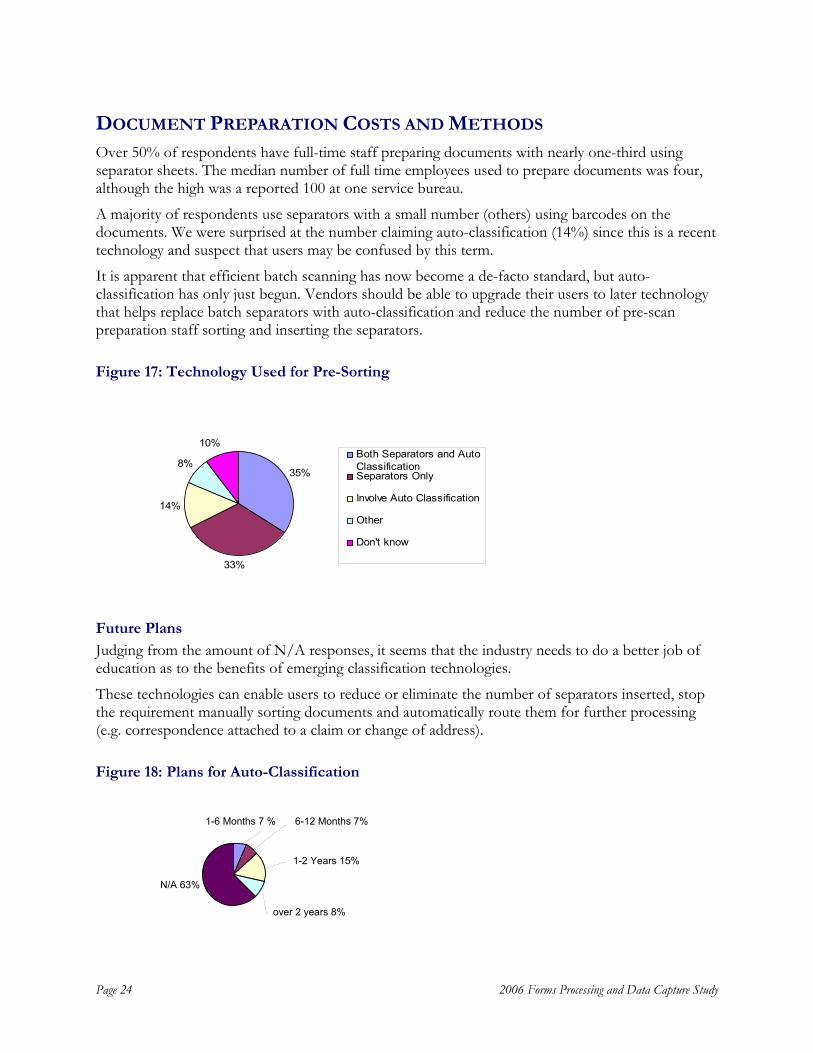
DOCUMENT PREPARATION COSTS AND METHODS Over 50% of respondents have full-time staff preparing documents with nearly one-third using separator sheets. The median number of full time employees used to prepare documents was four, although the high was a reported 100 at one service bureau.
A majority of respondents use separators with a small number (others) using barcodes on the documents. We were surprised at the number claiming auto-classification (14%) since this is a recent technology and suspect that users may be confused by this term.
It is apparent that efficient batch scanning has now become a de-facto standard, but auto-classification has only just begun. Vendors should be able to upgrade their users to later technology that helps replace batch separators with auto-classification and reduce the number of pre-scan preparation staff sorting and inserting the separators.
Figure 17: Technology Used for Pre-Sorting
Future Plans
Judging from the amount of N/A responses, it seems that the industry needs to do a better job of education as to the benefits of emerging classification technologies.
These technologies can enable users to reduce or eliminate the number of separators inserted, stop the requirement manually sorting documents and automatically route them for further processing (e.g. correspondence attached to a claim or change of address).
Figure 18: Plans for Auto-Classification
35%
33%
14%
8%
10%Both Separators and AutoClassificationSeparators Only
Involve Auto Classification
Other
Don't know
N/A 63%
over 2 years 8%
1-2 Years 15%
1-6 Months 7 % 6-12 Months 7%

2006 Forms Processing and Data Capture Study Page 25
IMAGE QUALITY CHECKING Asked whether image quality was checked, we found that 31% (56 respondents) did not respond and 11% (19 respondents) do not quality control images at all. Of those who do quality control their images (58%) 17% used two or three methods.
As with other parts of the survey, this showed a conflict in user sophistication:
• On one hand there is a lot more sophistication than in the previous survey where a majority (71%) were visually checking image for QC,
• On the other hand it seems that the lack of responses and the number who do not QC their images at all shows a divide in knowledge of image based systems. While we did not ask when systems were initially installed, we think this is mostly likely between those who have installed systems for a long time and those who are new.
Figure 19: Methods of Controlling Image Quality
Visually check all images 33%
Random visual check 38%
Automated QC system 16%
Thumbnail preview 13%

Page 26 2006 Forms Processing and Data Capture Study
VERIFYING DATA ACCURACY The use of multiple technologies indicates high level of accuracy is being achieved by over one quarter of respondents. (Note: percentages do not add up to 100% due to 26% of respondents reporting multiple methods used).
Interesting is the 9% who do not check accuracy, which has increased from 3% in 2000 — we assume this is a statistical anomaly due to the small number of respondents that this represents, although a distinct majority of these utilize barcode recognition which has in-built data checking and often check digits, leading to a higher level of accuracy.
Figure 20: Methods of Verifying Data Accuracy
Achieved First Pass Data Accuracy
Respondents claimed an average of 88% accuracy on the first pass of forms processing. Some responses were clearly optimistic at 99.9% or even 100%.
It seems that most understood accuracy and what was realistic for the types of documents they are processing. This represents a major improvement from our previous survey where users wanted 100% accuracy, with 75% relying on manual review to achieve it.
It also seems that image-based OMR accuracy has not yet achieved the same levels that hardware OMR achieves, perhaps because of lack of utilization of tonal images. OMR hardware typically leverages grayscale, whereas much image-based OMR uses bitonal images. There appears to be room for improvement before image-based OMR can reliably replace OMR hardware.
40%
30%
31%
29%
36%
9%
Backend database
Check digits
Double key entry
Random checking
Depends on data field
Do not verify dataaccuracy

2006 Forms Processing and Data Capture Study Page 27
Figure 21: Percentage Accuracy from Character Recognition
FORMS LOST Lost forms can cause a huge expense and 30% claimed that occasionally they lost forms, requiring them to go back to the end user. It seems that the overall accepted loss averaged just 1.1% which varied from a high of 5% to a claimed 0%. Maybe worse still, based on the number of 0% responses, we suspect that there may be a number of organizations that have not put in the systems to fully track the movement of the physical forms.
KEY ENTRY COST PER HOUR The average cost of key entry is $13.54 per hour. Full time dedicated key entry staff were a more expensive at $14.91 per hour than part time dedicated key entry staff at $11.96 per hour. General office staff used for key entry on a part time basis cost $12.86 per hour.
Our last survey in 2000 showed pure key entry people being paid $14.91 but when key entry was at scanning sites, a premium of approximately 20% ($19.45 per hour) over pure data entry from paper was paid. This premium seems to have been eliminated and lower level staff now seems to be used and the average for data entry has dropped.
Actual costs of key entry staff cost varied from a low of $9.75 per hour for full-time staff and $8 an hour for part-time staff to a high of $31 for full time and $15.50 for part time. This compared with a low of $7.50 and a high of $29 in 2000. Note a few respondents reported annual salaries in which case we normalized this by assuming a working year of 230 eight-hour days.
Figure 22: Cost of Key Entry
Year of Report Key from Image Office Staff
(Average)
Data Entry (Average)
Low: Part-time Low: Full-time
2000 $19.45 $17.76 $7.00 $7.50
2006 $12.86 $14.91 $8.00 $9.75
1st Pass Accuracy
Barcode Accuracy
Handprint Accuracy
Handwriting Accuracy
Machine Print Accuracy
OMR Accuracy
88% 99% 74% 66% 91% 91%

Page 28 2006 Forms Processing and Data Capture Study
OFF-SHORE OUTSOURCING When asked about off-shore labor, 38 responded that they are outsourcing off-shore, with over one-third of them processing high volumes of documents (over 10,000 per day). A majority had peak volumes that were in excess of 3 times their average daily volumes, but only a small number claimed they are using it exclusively to handle peak volumes.
Predictably, the ratio of those wanting to reduce costs vs. handling peak volumes was higher when off-shore outsourcing was cited as currently being used, than for respondents claiming on-shore outsourcing was being used. Nearly half (43%) are sending less than a quarter of their work off-shore with just 13% sending more than three quarters of their work.
Despite claims that off-shore outsourcing is being used to reduce costs, it seems that a major reason is to manage varying peak volumes at different times of the year.
16% of these respondents performed scanning while 59% performed key entry off-shore, 24% verification, and 14% outsourcing back-end processes.
The low rate of scanning is logical as scanning requires physically shipping the paper off-shore, which is time consuming and expensive, while key entry is a manual procedure that can operate from images. We were surprised at the low rate of verification, which we would have assumed would be higher to reflect the higher rate of OCR — but it seems that heavy users of OCR are using less off-shore.
As would be expected, nearly 50% of the respondents who were sending key entry overseas were service bureaus who have the most pressure on costs, with 20% being banking & finance companies.
Considering the publicity regarding outsourcing, we were surprised that the majority of the respondents do not seem to be outsourcing at this time. But it fits with our previous survey where 80% reported that they were not using outsourcing and 74% who said they did not plan on doing so. However, due to the low response rate we are not sure of the validity of this data and are unable to dissect it reliably by industry of forms type. It is also possible that some respondents were hesitant to honestly report outsourcing due to its various stigmas.
Figure 23: Planned Future Change in Outsourcing Volumes
Increase32%
No Change38%
Decrease9%
Don't know21%

2006 Forms Processing and Data Capture Study Page 29
Out of those who are outsourcing 56% said that it was to reduce costs, which represents a substantial increase over our 2000 study (29% cost). Most currently using off-shore respondents said they would increase the volumes outsourced off-shore, whereas only a small percentage of on-shore outsourcers expect to increase volume.
We believe this shows that most users of off-shore processes have gotten through any teething start-up problems and these operations are satisfactorily delivering on their commitments.
Domestic or Foreign Owned Companies
There is some differentiation between American-owned companies being used for off-shore outsourcing, but mostly users do not seem to mind or do not think about it so the issue of potential loss of data with no recourse under US law does not concern users.
24 users responded that they were outsourcing on-shore. Of these, 11 (46%) were using both on-shore and off-shore with the on-shore being used mostly for scanning and off-shore used for key entry and validation. 14 (58%) were just using on-shore services with the majority being Government (43%).
Figure 24: Is an American-owned Company Important for Outsourcing?
Yes32%
No45%
don't know23%

Page 30 2006 Forms Processing and Data Capture Study
DOCUMENT TYPES PROCESSED The median number of page sides processed by type of form and characters captured are shown below for different forms types.
Figure 25: Table of Recognition Success for Variety of Forms Types
Pages in Document
Characters Captured
OCR % Estimated Characters to
Key per Document
Applications 2 51-100 89% 8
Claims 2-5 51-100 88% 9
Correspondence & Mail 2 51-100 88% 9
HCFA Forms 1-2 >100 88% 18
Invoices 2 51-100 88% 9
Legal Documents 3-5 51-100 89% 9
Medical Forms 2 51-100 86% 10
Remittances 2 15-50 90% 4
Surveys 2 51-100 89% 8
Tax Returns 3-5 >100 87% 20
Waybills 1 51-100 88% 9
Other 2 51-100 88% 9
The question on OCR was whether the percent eliminated through OCR was 75%-90%; 90%-99% or 100%. We then weighted the answers using an average of 82.5%, 95% and 100% respectively to calculate the percentage success with OCR. We applied this to the approximate number of characters to capture in order to calculate how many characters per form must be keyed.
Readers of this report can then apply their labor figures and productivity to calculate expected costs.
For example, a user may capture 75 characters from a medical form and if efficient he should be able to achieve 86% conversion from OCR (i.e., he will capture 65 characters automatically). He can therefore expect to key 10 characters per form. Industry averages show that dedicated key operators key at an average of 10,000 chs/hr although it can be less of more. However, assuming 10,000 keystrokes/hr, then an operator can key 1,000 forms/hr at a cost of $14.91 (see figure 23). If the

2006 Forms Processing and Data Capture Study Page 31
company is processing 10,000 forms/day, then the annual cost of data entry from these forms is $3,700 (based on a 250 day year).
Depending on your actual rates you can calculate your costs.
E-FORMS
E-Forms Conversion and Usage
Out of 139 responses, 57% said they had converted forms to E-Forms. Interestingly the total seems to be less than in our last survey, where 82% said they were utilizing E-Forms.
Looking at the departmental usage, only six (<5%) seem to have widely embraced E-Forms across the enterprise but there were many who ignored this question. We expected a higher percentage of internal forms to be E-Forms by now as this represents a similar percentage to our last survey. We believe that the percentage utilization is probably higher than reported as this reflects the somewhat narrow focus of the respondents on their specific problems. However, it seems that E-Forms are no longer viewed as particularly important.
Figure 26: E-Forms Usage by Department
H-R26%
Accounting20%
Marketing13%
Purchasing12%
Other29%
In verticals it was difficult to know the real situation due to low response rates, but approximately 50% of banking & finance organizations (21 responses) are using E-Forms; 59% of government (22 responses); and 78% of insurance (14 responses). The remainder was split across multiple industries.
An interesting comparison between the above industries usage of scanning technologies appeared which may indicate how businesses are evolving to e-business.
• In banking & finance nearly all E-Forms users reported that they are scanning;
• In government, a majority reported that they were not scanning. This suggests that a number of government agencies are trying to bypass automating paper based technologies altogether.
• In insurance it was evenly split.

Page 32 2006 Forms Processing and Data Capture Study
E-Form Creation Software
Of the vendors named, Adobe dominated the software used to create these forms although nearly one third did not know how the E-Forms were created. We attribute this to the nature of the respondents who were mostly operational staff, whereas the corporate graphics department and marketing often has the responsibility for creating E-Forms. This represents a large change from 2000, when MS Word was cited as the predominant technology used. We believe that this change reflects a maturity and professionalism of E-Forms usage which are now designed by the internal design department within the organization.
Figure 27: E-Forms Creation Software
Adobe 41%
Other 2%
Adobe LiveCycle Designer
3%
MS Word 23%
Don't know 26%
Quark 2%
Nuance/ ScanSoft Omniform
3%

2006 Forms Processing and Data Capture Study Page 33
PURCHASING CAPTURE SOFTWARE Since our last report in 2000, the Internet has clearly emerged as the preferred research methodology for new system sales, Internet research and Webinars seem to have displaced trade shows and RFPs.
Figure 28: How Suppliers are Selected
This split seemed to vary by vertical although not by size of organization. Predictably Government continues to use an RFP to select a supplier, whereas service bureaus now rely more on the Internet.
Invoice Processing Plans
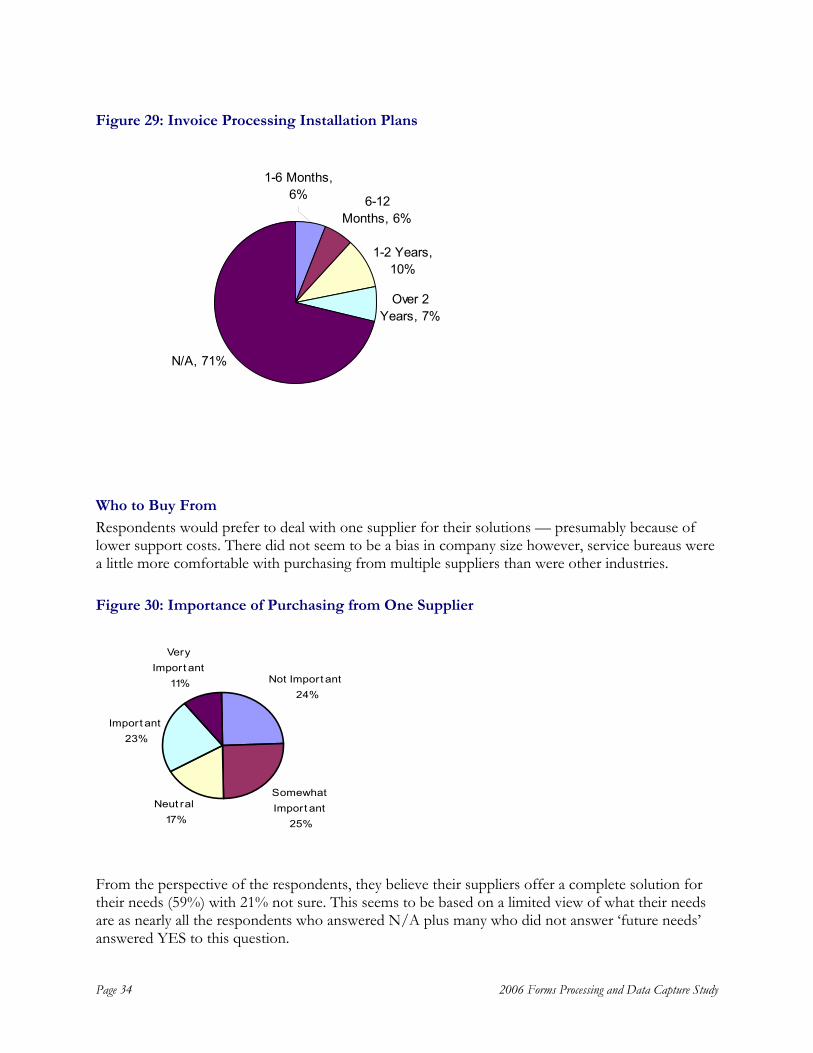
Regarding Invoice Processing it is clear from the number of N/A responses that departments performing scanning and capture are not planning to move outside their existing markets and/or are not attuned to being able to process invoices automatically.
This may reflect the lack of understanding and push by the CFOs and accounts payable departments for this technology. It also reflects the state of vendor offerings which have only just started to be installed and often seem to be over-concentrated on reducing data entry rather than improving process. This is evident in the low numbers of users who intend to install workflow.
Overall this conforms to the HSA studies of vendor sales showing the US behind Europe in adoption rates in this new market and the lack of understanding of auto-classification and unstructured forms processing technologies.
We would expect a shift in sentiment to occur over the next couple of years as vendors’ solutions improve, successful installations get placed and CFOs become more aware of the potential, which will cause the market to get more interest. However it is clear in this area that the vendors and industry will need to educate users and that the market is wide open.
RFPs 23%
Direct 11%
Internet 32%Webinars 6%
Site Visits 5%
Trade Shows & Publications 11%
Consultants 6%
Other 6%
Page 34 2006 Forms Processing and Data Capture Study
Figure 29: Invoice Processing Installation Plans
6-12 Months, 6%
N/A, 71%
1-6 Months, 6%
Over 2 Years, 7%
1-2 Years, 10%
Who to Buy From
Respondents would prefer to deal with one supplier for their solutions — presumably because of lower support costs. There did not seem to be a bias in company size however, service bureaus were a little more comfortable with purchasing from multiple suppliers than were other industries.
Figure 30: Importance of Purchasing from One Supplier
Not Import ant24%
Somewhat Import ant
25%
Neut ral17%
Import ant23%
Very Import ant
11%
From the perspective of the respondents, they believe their suppliers offer a complete solution for their needs (59%) with 21% not sure. This seems to be based on a limited view of what their needs are as nearly all the respondents who answered N/A plus many who did not answer ‘future needs’ answered YES to this question.

2006 Forms Processing and Data Capture Study Page 35
CONCLUSIONS The United States Capture market has matured. Document capture hardware and software have become familiar tools across a broad sector of industries, as commonplace as the copy machines of yesterday. This maturity should not be mistaken for market saturation, for while there is a much broader acceptance and adoption than was reported six years ago, the market still has many years of robust growth in the future.
The reasons for adopting capture have become more specialized. While the elimination of paper continues to be a major benefit, organizations now understand specific areas where capture can automate business processes. In applications as far-reaching as remittance processing, order-fulfillment, and invoice processing, capture tools are used not only to automate but to integrate with these business processes.
Image acquisition systems have become more mainstream and operators are now paid more consistently with normal clerical staff. The ‘mystique’ is gone. Most users of these systems have their costs and systems under control, but there are new users who seem to be lagging in their operations controls.
With the underlying network technology in place, a number of factors have been driving the adoption of capture and content management systems. In addition to specific process improvements (the elimination of paper), organizations are driven by factors such as regulatory compliance, customer service, and international competition.
Like most areas of technology spending, systems offer many more capabilities at lower costs. When integrated as part of a larger system of process, life cycle and content management, the benefits far outweigh the cost, offering readily demonstrable ROI.
The Internet has become the primary research and purchase assistant, although once users have committed to a supplier they seem generally happy with the choice and will remain with them.
Although capture is still a fragmented market, consolidation throughout the content management space has brought a number of larger infrastructure vendors into the industry. By approaching capture as part of an overall content management or IT strategy, these vendors can provide end-to-end document lifecycle solutions. Currently there is no single vendor dominating the industry. Similarly with hardware, the range of vendors has brought no single predominate provider. While we expect the hardware selection to increase as low end vendors look at this market, we expect further consolidation of software capture over the next few years.
Nonetheless, users of capture solutions have developed a much better understanding of the underlying tools capabilities. Automated character recognition, which was a more obscure process six years ago, is now seen as an integral part of a capture systems. However, the technology continues to offer abilities faster than the market can adopt them. The more sophisticated functions such as data validation and automated classification, have not yet reached their full potential.
Capture has moved “up-stream” in many cases and is being performed at the point of first contact. This has led to an increase in the use of decentralized capture, but has not been fully integrated as distributed business processing. This is seen as a robust growth area, as businesses more fully integrate capture with traditional line-of-business work processes.
Page 36 2006 Forms Processing and Data Capture Study
To support distributed and decentralized scanning, single-purpose capture devices are growing as are copier based Multi-Function Peripherals (MFPs) that offer the ability to copy, scan, fax, print, and most importantly, integrate with networking systems. Distributed capture devices such as teller and corporate-based check capture devices, ATM check-image capture systems, or workgroup scanners linked to larger customer service networks can be expected to proliferate.
The most notable advancement in the six-year period since TAWPI and Harvey Spencer Associates last conducted an extensive capture industry study has been a maturity of capture with more users using standardized capture solutions from recognized vendors and less key data entry. At the same time, there is a divide between new users who are struggling to use these technologies effectively and more sophisticated users who are effectively leveraging their understanding and usage of the technologies.
We look forward to seeing what the next six years brings.

2006 Forms Processing and Data Capture Study Page 37
APPENDIX 1: TYPES OF PAPER BEING PROCESSED
Applications
Assessments
Auto Loans
Case Filings
Check & Documents
Claims
Client deposit checks
College Admissions Application and Recruit Cards
Contracts
Contribution cards
Correspondence
Credit Bureau Reports (all types)
Customer agreements
Financial (payroll, invoicing, remittance)
Engineering Specifications
Flexible Spending Account Claim Forms
FSA Claim Forms
Gifts/pledge payments
Insurance Applications
Insurance Policies
Invoices
Coupons
Enrollments
IRA Documents
Life Insurance applications
Medical Records
Medical Claims
Mortgage docs
Order forms
Regulatory compliance inspection
Remittance Coupons
Remittance-sized donations and bill payments
Residential forms
Sentence & Judgment documentation
Signature Cards
Solicitations
Student Records
Surveys
Tax Bills
Test Answer Documents
Tickets
Title Deeds
Travel & Expense records
Utility Bills

Page 38 2006 Forms Processing and Data Capture Study
APPENDIX 2: GLOSSARY OF TERMS USED
Auto-Classification — utilizing pattern recognition to electronically determine a document type from its image layout or OCR’d content
Barcode Recognition -- Recognition of barcodes from a bitmapped image of a scanned form. Does not include laser based scanning.
Capture Software — the software used to control the scanner, capture images and index them or extract data from them
Check Digits — a method of mathematically checking the accuracy of a numeric field by adding an extra digit
Constrained Boxes — a method to encourage the person completing the form to locate characters in a specific location. Usually consists of a shaded box.
Document -- A complete transaction, which may contain many individual single or dual sided pages.
Document Prep -- Document Preparation, the process of preparing the documents for scanning.
Document Storage & Retrieval -- includes lower end systems which are designed to capture scanned pages, index them and make them available for retrieval.
Double Key entry — a method of verifying data accuracy by re-entering the data normally as a blind key entry. Used to ensure high accuracy.
ECM -- Enterprise Content Management provides workflow rules and management of images as well as the storage and retrieval of scanned pages.
Forms Processing (FP) -- Systems that are designed to extract the data from scanned images of business forms, to make them into a transaction for inclusion in a database.
ICR — recognition of handprint or other element.
MFP — Multi-functional Peripheral. Digital copier that can be networked and used for scanning as well as printing or copying
OCR -- identified as machine print oriented.
OMR -- Optical Mark Recognition.
QC -- Quality Control, also QA (Quality Assurance). The method for ensuring readable images and/or accurate data.
Recognition Technology — automated software that converts images into usable data. Usually consists of OCR; ICR, OMR and Barcode
Remote or Distributed Scanning — use of small scanners to convert paper to digital images at a remote office as compared to a centralized point
Repository — place to store images usually magnetic disk
RFP — Request for proposal
Sans Serif Font — a font such as Helvetica or Ariel which is a block font

2006 Forms Processing and Data Capture Study Page 39
Separator Sheets — barcoded sheets that are inserted between documents in order to separate out different document types and/or batches of documents
Serif font — a font such as Times Roman that contains small lines on the bottom of characters — known as serifs
TIF -- Standard image format used in the document imaging business for black and white images.
Page 40 2006 Forms Processing and Data Capture Study
APPENDIX 3: FORMS PROCESSING & DATA CAPTURE QUESTIONNAIRE YOUR PROFILE Company Name: Job Title: E-mail: Phone Number: Industry: Banking & Finance Education Government - State & Local Government — Federal Healthcare/Medical Insurance Legal Manufacturing Pharmaceutical Retail Service Bureau Telecommunications Utility/Energy Other, Please Specify If your industry is government, please provide department/division name: Company Size (revenue in $ millions and/or approximate number of employees): Annual Revenue $: Number of Employees: Size of Department (annual budget and/or number of employees): Cost Center Budget in $: Number of Employees: SCANNING & RECOGNITION TECHNOLOGY USAGE Do you use MFPs or Digital Copiers for scanning? Do you currently have or intend to install remote or distributed scanning? Already installed Intend to install within 6 months Intend to install between 6-12 months No plans to install Intend to install between 12-24 months Intend to install after 24 months Do you scan documents for data collection or for storage and retrieval, workflow or collaboration? Yes No Indicate the quantity of each type of scanner you use. Workgroup (less than 25 pages per minute) Departmental (25 to 40 pages per minute) Low volume (40 to 60 pages per minute) Mid volume (60 to 90 pages per minute) High volume (greater than 90 pages per minute) Whose scanners do you use? (Not MFPs or Copiers. Check all that apply.) BancTec Bowe Bell & Howell Canon Eastman Kodak Fujitsu Hewlett Packard IBML OPEX Panasonic Scan-Optics Visioneer/Xerox Other, please specify Rate your satisfaction level with your scanners: Very Dissatisfied Dissatisfied Neutral Satisfied Very Satisfied No Opinion What image repository / ECM system do your images go into? (select all those that apply) Computhink Docuware EMC/Documentum FileNET Hummingbird Hyland Onbase IBM Content Manager Laserfiche Microsoft Open Text Stellent/IBPM Tower Westbrook In-house developed Don't Know Other, Please Specify Whose forms processing or capture software do you use? Adobe Acrobat Adobe LiveCycle Forms Anydoc Software BancTec Datacap

2006 Forms Processing and Data Capture Study Page 41
Eastman Kodak eCopy EMC/Captiva Kofax/Neurascript Nuance/Scansoft Paperport Readsoft Scan-Optics Verity/Cardiff Software (Autonomy) Other or own developed. Please Specify Rate your satisfaction level with your forms processing or capture software: Very Dissatisfied Dissatisfied Neutral Satisfied Very Satisfied No Opinion Please identify all recognition technology used: (select all those that apply) OCR/ICR (recognize machine print/handprint) OMR (recognize optical marks) Barcode None Other, Please Specify What database system manages data captured from forms processing software or key entry? DB2 Oracle SAP SQL Workflow System Don't know Other, Please Specify FORMS DESIGN For OCR/ICR eligible forms, do you use constrained boxes and/or free form text fields? Constrained boxes only Free form text fields only Both, constrained boxes and free form text fields Neither What is your minimum margin space standard in order for forms to be OCR/ICR eligible? 1/4" from edge of form 1/3" from edge of form 1/2" from edge of form Do not have a minimum standard N/A Other, please specify For OCR/ICR eligible forms, what drop-out colors are you using? Blue Green Red Yellow Not using drop-out colors Other, Please Specify What font type do you have the most success with for character recognition? Serif Sans Serif Don't Know Specific font name (if known): What font size do you have the most success with for character recognition? 8 point 10 point 12 point 14 point Other, Please Specify PRODUCTIVITY On average, how many full time equivalent (FTE) staff do you have pre-sorting documents before processing? Does your current process for pre-sorting documents: Involve separator sheets Involve software for auto-classification of documents Both Don't Know Other, please specify How do you verify image quality? Visually check all images Random visual check Automated quality control system Thumbnail preview Do not verify image quality Other, Please Specify How do you verify data accuracy? (select all that apply) Back end database Check digits Double key entry Random checking Depends on data field Do not verify data accuracy Other, Please Specify What level of overall data accuracy do you get from the first pass forms processing or key entry? (indicate percentage) What level of accuracy do you expect at the point of export for the following? (indicate percentage) Barcodes Hand print Handwriting Machine print OMR

Page 42 2006 Forms Processing and Data Capture Study
On average, what percentage of forms are lost or mislaid? Are forms ever permanently lost requiring you to go back to the originator? Do you use dedicated key operators or is key entry performed by general office staff? Dedicated key operators General Staff Both Other, Please Specify How many dedicated key entry operators do you have? At this location In your company What percentage of key operators are full time? What is the average hourly wage, including benefits, per operator? For full time operators: $ For part time (dedicated) operators: $ For part time (general office) operators: $ Do you outsource any of the following to an OFFSHORE third party provider? Select all that apply Scanning Data Entry Keying Verification Back Office Processing Other, Please Specify Do you outsource any of the following to an ONSHORE third party provider? Select all that apply Scanning Data Entry Keying Verification Back Office Processing Other, Please Specify If you outsource offshore, what percentage of your data entry keying is sent offshore? Less than 25 percent 26 to 50 percent 51 to 75 percent over 75 percent If you outsource offshore, is it important that the offshore company is American-owned? Yes No Don't Know Select the primary reason for outsourcing To handle peak volumes To reduce costs Don't know Other, Please Specify Do you intend to increase or decrease your outsourcing in the next two years? Increase Decrease No Change Don't Know DOCUMENT TYPES What is the main document type you process? What is the minimum and maximum number of documents processed per day? Minimum # of documents per day: Maximum # of documents per day: If you are capturing images or data from any of the following types of documents, please identify the average number of page sides that are captured for the complete document (note that a page side is the number of sides captured: a two-sided form counts as two pages) Applications Claims Correspondence & Mail HCFA Forms Invoices Legal Documents Medical Forms Remittances Surveys Tax Returns Waybills Other For the document types below, indicate average characters captured per document: (Less than 15 characters, 16 to 50 characters, 51 to 100 characters, More than 100 characters) Applications Claims Correspondence & Mail HCFA Forms Invoices Legal Documents Medical Forms Remittances Surveys Tax Returns Waybills Other

2006 Forms Processing and Data Capture Study Page 43
For the document types below, indicate average percentage captured through automated recognition (OCR/ICR): (75-90 percent, 90-99 percent, 100 percent) Applications Claims Correspondence & Mail HCFA Forms Invoices Legal Documents Medical Forms Remittances Surveys Tax Returns Waybills Other For the document types below, indicate average turn-around time to process: (Less than one day, One to two days, Less than one week, More than one week) Applications Claims Correspondence & Mail HCFA Forms Invoices Legal Documents Medical Forms Remittances Surveys Tax Returns Waybills Other ELECTRONIC FORMS Have you converted any of your paper forms to electronic forms? Yes No If so, whose system was used to create the E-Forms: Adobe Adobe LiveCycle Designer Microsoft Word Quark Nuance/ScanSoft Don't know Other, Please Specify If you're using E-Forms, what departments use them? (select all those that apply) HR Accounting Engineering Marketing Manufacturing Purchasing Shipping Other, Please Specify What percentage of your total E-Forms are completed by internal staff? What percentage of your total E-Forms are completed externally? What percentage of internally completed forms do you expect to be electronic? In 2007: In 2008: What percentage of external turn-around forms do you expect to be electronic? In 2007: In 2008: PURCHASING What is the most common method you use when researching vendors? RFI/RFP Trade Shows Site Visits Direct Sales Presentation Internet Research Trade Publications Consultants Webinars/eSeminars Other, Please Specify Where do you purchase your capture or forms processing solution from? VAR (reseller) Manufacturer Distributor Office Products Dealer Other, Please Specify Do you intend to purchase any of the following forms processing or image management technologies within the time frame below? (1 - 6 months, 6 - 12 months, 1 - 2 years, over 2 years, N/A) Approval/Workflow Document Classification Invoice Processing Semi-Structured Capture How important is it to your organization to be able to purchase all this technology (forms processing, semi-structured capture, approval, workflow) from one supplier? Not Important Somewhat Important Neutral Important Very Important Does your current vendor offer a complete solution for capture, classification and forms processing? Yes No Not Sure