Embed Size (px)
Citation preview

Property of Valeo – Duplication prohibited2005 Results and Outlook – February 2006
1
2005 Results and Outlook
Thierry MorinChairman & CEOThierry MorinChairman & CEOFebruary 10, 2006

Property of Valeo – Duplication prohibited2005 Results and Outlook – February 2006
2
Agenda
Highlights and key figures
Sales and automotive markets
Results
Cash flow and balance sheet
Strategic highlights
Outlook

Highlights andKey Figures

Property of Valeo – Duplication prohibited2005 Results and Outlook – February 2006
4
2005 Highlights
Market share gains
Resilient margins despite challenging trading conditions
Strong cash generation allows for quick de-leveraging
Structural competitiveness further strengthened
Selective acquisitions and innovation strategy reinforce Domains and growth potential

Property of Valeo – Duplication prohibited2005 Results and Outlook – February 2006
5
2005 Key Figures
ChangeIFRS- In euro million
Total operating revenues
Operating incomeas a % of total op. revenues
Net income as a % of total op. revenues
Free cash flow
20042005
10,033
3073.1%
1411.4%
240
9,293
3333.6%
241*2.6%
292*
+8.0%
-7.8%-0.5 pt
-41.5%-1.2 pt
-17.8%
* Including a €83m fiscal one-off item

Property of Valeo – Duplication prohibited2005 Results and Outlook – February 2006
6
Q4-05 Key Figures
ChangeIFRS- In euro million
Total operating revenues
Operating incomeas % of total op. revenues
Net incomeas % of total op. revenues
Net financial debt
Q4-2004Q4-2005
2,557
773.0%
381.5%
1,080
2,306
371.6%
200.9%
497*
+10.9%
+108.1%+1.4 pt
+90%+0.6 pt
+117.3%
*as of Jan. 1, 2005

Sales & AutomotiveMarkets
Property of Valeo – Duplication prohibited2005 Results and Outlook – February 2006
8
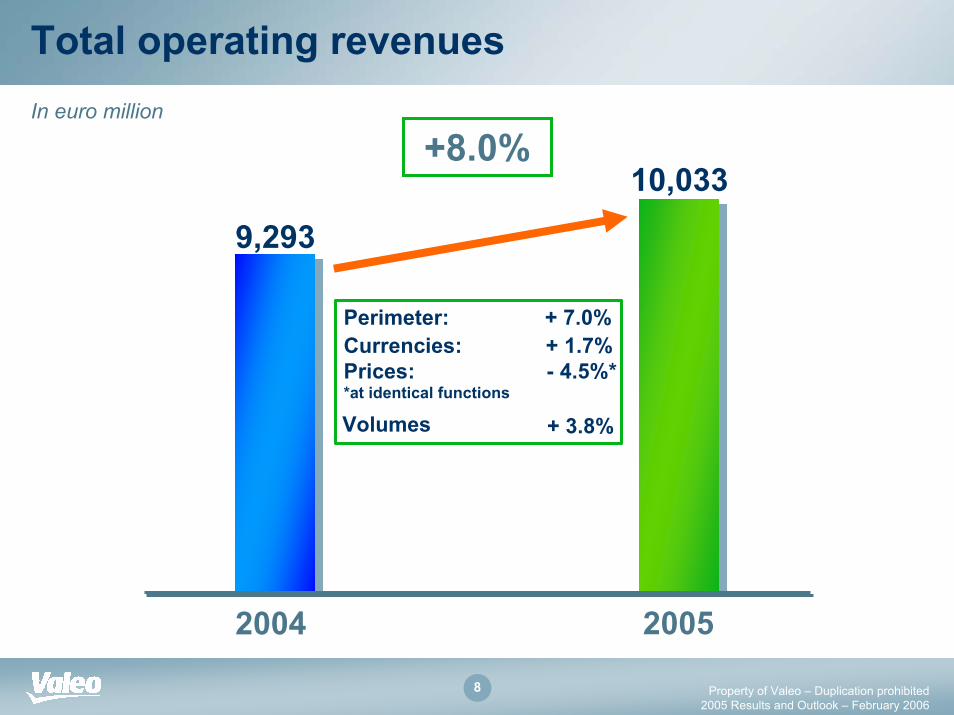
Total operating revenues
Perimeter: + 7.0%Currencies: + 1.7%Prices: - 4.5%**at identical functions
10,033
2004 2005
9,293
+8.0%
+ 3.8%Volumes
In euro million

Property of Valeo – Duplication prohibited2005 Results and Outlook – February 2006
9
2005 net sales
EuropeEurope+4% / +3%*69% of Sales
+34% / +19%* 4% of Sales
+33% / +10%* 10% of Sales
NorthNorth AmericaAmerica- 1% / +1%*15% of Sales
SouthSouth AmericaAmerica AsiaAsia
== --1%1%
+12%+12% +3%+3%
*at constant perimeter, currencies and selling prices
+1% World World automotiveautomotive productionproduction
Western Europe: -3%
Big 3: -4%
Property of Valeo – Duplication prohibited2005 Results and Outlook – February 2006
10
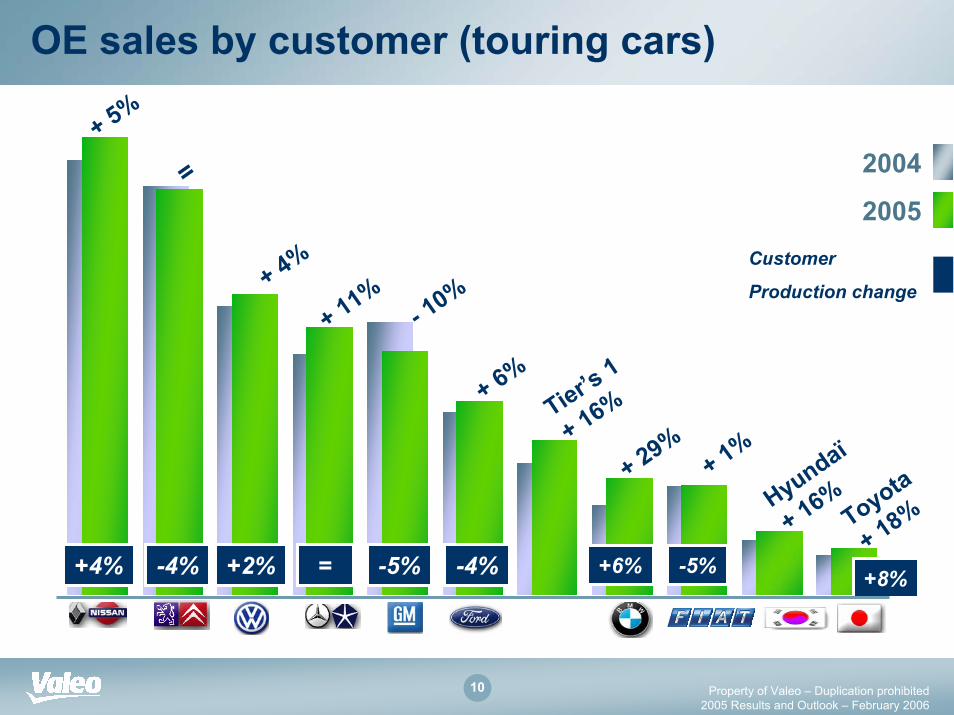
OE sales by customer (touring cars)
Customer
Production change
+4% -4% +2% = -5% -4% -5% +8%+6%
+ 5%
+ 11%
+ 29%
Hyundaï
+ 16% Toyota
+ 18%
+ 1%
2005
2004
Tier’s 1
+ 16%
=
+ 4%
- 10%
+ 6%

Results

Property of Valeo – Duplication prohibited2005 Results and Outlook – February 2006
12
Gross margin
Change
Net sales
Other operating revenues
Total operating revenues
Gross margin% of net sales
20042005
9,933
100
10,033
1,58716.0%
9,229
64
9,293
1,59817.3%
+ 7.6%
+56.3%
+ 8.0%
- 0.7%-1.3pt
IFRS- In euro million

Property of Valeo – Duplication prohibited2005 Results and Outlook – February 2006
13
Gross margin walkdown
Raw materials CustomerCompensations
Volumes Acquisitions Wipers/HVAC
Productivity
17.3% 16.0%
-1.2%
+0.5% +0.0%-0.3%
-0.8%
+0.4%
as % of net sales
Gross marginFY-2004
Gross marginFY-2005
Raw material impact(as % of gross margin)
0
0,2
0,4
0,6
0,8
1
1,2
1,4
1,6
1,8
Q104 Q204 Q304 Q404 Q105 Q205 Q305 Q405
Gross Net

Property of Valeo – Duplication prohibited2005 Results and Outlook – February 2006
14
Cost base optimisation - Purchasing
SuRe : - 370 suppliers2,688 suppliers at year end 2005
LCC suppliers26% up from 22% end of 2005

Property of Valeo – Duplication prohibited2005 Results and Outlook – February 2006
15
LCC footprint implementation
5 closures in Southern Europe; 4 openings in Slovakia, Romania and China
44% of manufacturing sites in LCC- 51% of productive workforce in LCC (48% in 2004 and 38% in 2001)
Rochester closure planned for Jul. 2008
CLOSURE Orense (Spain)VLS
Alcala (Spain)VT
Mostoles (Spain)VSS
Melfi (Italy)VECS
Martos* (Spain)VLS
ACQUISITION
Sablé (France)VEMS
Ste-Florine (France)VEMS
Brioude (France)VEMS
Chonburi (Thailand)VCC
OPENING Kosice (Slovakia)VSS
Anaka (Japan)VCC
Shonan (Japan)VEC
Pitesti (Romania)VECS
Timisoara (Romania)VLS
Wuxi (China)VSS
Q1 Q2 Q3 Q4 2005
5
4
6
* Rationalization

Property of Valeo – Duplication prohibited2005 Results and Outlook – February 2006
16
Raising quality standards
Customer returns in partsper million
48 sites (36%)
Including 10 sites at 0 ppm
Q4-2005
Q4-03 Q4-04 Q4-05
185
5332
Single digit PPM sites

Property of Valeo – Duplication prohibited2005 Results and Outlook – February 2006
17
Below gross margin costs are contained
ChangeIn euro million 2004
Gross marginas % of net sales
Net R&D expenses*as % of total op. revenues
SG&Aas % of total op. revenues
Other income & expensesas % of total op. revenues
Operating incomeas % of total op. revenues
2005
1,58716.0%
(561)5.6%
(659)6.6%
(60)0.6%
3073.1%
1,59817.3%
(539)5.8%
(630)6.8%
(96)1.0%
3333.6%
- 0.7%-1.3 pt
+ 4.1%- 0.2 pt
+ 4.6%- 0.2 pt
- 37.5%- 0.4 pt
- 7.8%- 0.5 pt
* Including other operating revenues (mainly customer contributions to development costs)

Property of Valeo – Duplication prohibited2005 Results and Outlook – February 2006
18
From operating income to net income
ChangeIn euro million
Operating income
Cost of net debt
Other financial inc./(expenses)
Associates
Income before taxes
TaxesEffective tax rate
Minority interests
Net income
20042005
307
(54)
(52)
6
207
(60)29.9%
(6)
141
333
(33)
(39)
5
266
(17)*6.5%
(8)
241*
- 7.8%
+ 63.6%
+33.3%
+20.0%
- 22.2%
+252.9%
-25.0%
- 41.5%* Including a €83m fiscal one-off item

Cash Flow andBalance sheet

Property of Valeo – Duplication prohibited2005 Results and Outlook – February 2006
20
Strong cash flowChangeIn euro million 20042005
• EBITDA• Cash tax• Change in working capital
Operating cash flow• Grants including customer contributions• Interest paid• Acquisitions of intangible assets• Acquisitions of tangible assets
Free cash flow• Acquisitions• Dividends and buy back• Others• Change in net cash
• Fiscal one off item
Free cash flow excluding items
812(28)45
82926
(28)(122)(413)
292(73)(90)(60)69
83
209
778(65)107
82039
(33)(145)(441)
240(466)(348)705*131
0
240
(34)(37)62(9)13(5)
(23)(28)
(52)(393)(258)76562
(83)
31* Mainly change in long term financial debt
Property of Valeo – Duplication prohibited2005 Results and Outlook – February 2006
21
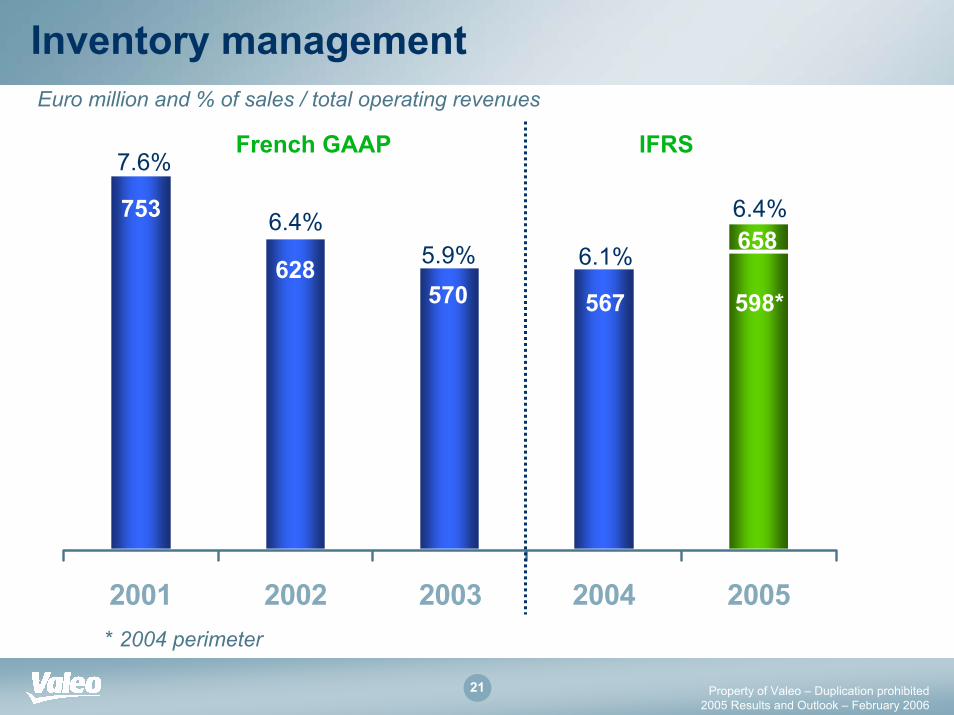
Inventory managementEuro million and % of sales / total operating revenues
2001 2002 2003 2004 2005
7.6%
6.4%5.9% 6.1%
6.4%753
628570 567
658
598*
* 2004 perimeter
IFRS French GAAP

Property of Valeo – Duplication prohibited2005 Results and Outlook – February 2006
22
Working capital managementEuro million and % of sales / total operating revenues
70101
208234
409
2001 2002 2003 2004 2005
4.1%
2.4%2.2%
1.0%0.7%
IFRS French GAAP

Property of Valeo – Duplication prohibited2005 Results and Outlook – February 2006
23
Net financial debt walkdownin euro million
Net debt@ Jan. 1, 2005
Freecash flow
Acquisitionsnet
Dividends Buy backs Others Net debt@ Dec.31, 2005
+9
497(240)
+466
+96
+252
1,080
Property of Valeo – Duplication prohibited2005 Results and Outlook – February 2006
24
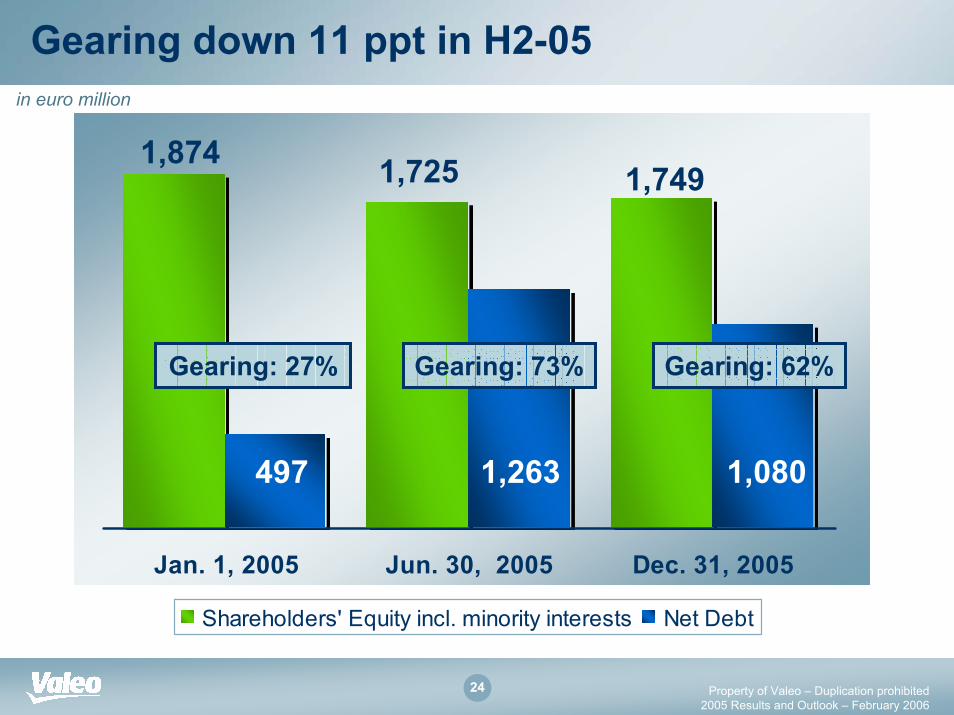
Gearing down 11 ppt in H2-05in euro million
Jan. 1, 2005 Jun. 30, 2005 Dec. 31, 2005
Shareholders' Equity incl. minority interests Net Debt
1,874
497
Gearing: 27% Gearing: 73%
1,263
1,725
Gearing: 62%
1,749
1,080

Business and strategichighlights

Property of Valeo – Duplication prohibited2005 Results and Outlook – February 2006
26
Leveraging our Central European presence
Central Europe accounts for 4.1m vehicles or ~20% of European production biased towards A & B segments
Leveraging our presence8,900 staff in 15 sitesKey partner to Toyota/ PSA B0 platform in theCzech Republic and PSA in SlovakiaKey partner to Renault Dacia in Romania Sales up 45% in 2005

Property of Valeo – Duplication prohibited2005 Results and Outlook – February 2006
27
Majors steps in order to complete our strategic ambition to derive 25% of our revenues from Asia by 2010
Acquisition of Bosch minority interests in our HVAC/compressor activities in Asia including China
Decisions to expand our manufacturing base in ChinaJV with FAW (compressors for HVAC systems)JV with Hangsheng (Ultrasonic Park Assist)
Consolidation of our Thailand HVAC joint ventures
Acquisition of 50% of Threestar, a leading manufacturer of radiators in Korea

Property of Valeo – Duplication prohibited2005 Results and Outlook – February 2006
28
Strengthening our Domains
StrengtheningAcquisition of JCEED for €316m on 1/03/2005 Order intake / sales : 2.3x in 2005 with customerdiversification, increased Diesel exposure (EGR)Accretive to earnings and cash flow
StrengtheningAcquisition of Zexel VCCNew Compressor Branch
InnovationsLaneVue, blind spot detection, dynamic bending lights(US first)
Powertrain Efficiency
Comfort Enhancement
Driving Assistance

Outlook

Property of Valeo – Duplication prohibited2005 Results and Outlook – February 2006
30
2006 trading conditions
Soft car production in core markets(Europe -1%, NA flat)
Unstable raw material situation
Ford/ GM and US suppliers restructuring

Property of Valeo – Duplication prohibited2005 Results and Outlook – February 2006
31
2006 trading conditions and corporate objectives
Corporate objectives
Growing the content per car furtherImproving return on capital employed Sustained cash generationStrengthening the order book

Property of Valeo – Duplication prohibited2005 Results and Outlook – February 2006
32
Contact
InvestorInvestor RelationsRelations
Rémy DumoulinRémy Dumoulin43, rue 43, rue BayenBayenFF--75848 Paris Cedex 1775848 Paris Cedex 17FranceFranceTel.: +33 (0) 1.40.55.29.30Tel.: +33 (0) 1.40.55.29.30Fax: +33 (0) 1.40.55.20.40Fax: +33 (0) 1.40.55.20.40EE--mailmail: : [email protected]@valeo.comWeb site: Web site: www.valeo.comwww.valeo.com

Back-up

Property of Valeo – Duplication prohibited2005 Results and Outlook – February 2006
34
Share InformationShare Data / ADR Data
Share DataBloomberg TickerReuters TickerISIN NumberShares outstanding as per 30.06.2005
FR FPVLOF.PAFR 00013033877,492,849
ADR DataRatio (ordinary share: ADR)Bloomberg TickerReuters TickerISIN NumberTypeExchangeSponsor
1:2VLEEY USVLEEY PKUS 9191343048Level 1OTCJP Morgan Chase

Property of Valeo – Duplication prohibited2005 Results and Outlook – February 2006
35
Quarterly P&L (2004 - 2005)
• Net sales• Total Revenues
• Gross Margin% of net sales
• R&D expenses% Total Revenues
• SG&A% Total Revenues
• Other income and expenses
• Operating income% Total Revenues
• Cost of net debt% Total Revenues
• Other financial income and expenses% Total Revenues
• Income before taxes% Total Revenues
• Income Taxes
• Equity in net earnings of associated companies
• Net income from consolidated companies% Total Revenues
• Minority interests
• Net income% Total Revenues
2,3622 379
40817.3%
(152)6.4%(165)7.0%(20)
883.7%
(9)(0.4%)
(9)(0.4%)
703.0%
36
1
1074.5%
(2)
1054.4%
2,4552,469
44018.1%
(152)6.2%(163)6.6%(5)
1345.5%
(8)(0.3%)
(9)(0.4%)
1174.8%
(37)
2
823.2%
(4)
783.2%
2,1262,139
35916.9%
(145)6.8%(146)6.7%(7)
743.5%
(8)(0.4%)
(11)(0.5%)
552.6%
(16)
1
401.8%
(2)
381.8%
T1
2,2862,306
39117.1%
(154)6.7%(156)6.8%(64)
371.6%
(8)(0. 3%)
(10)(0.4%)
190.9%
0
1
200.9%
0
200.9%
2,3242,344
37716.2%
(161)6.9%(164)7.0%(17)
552.3%
(11)(0.5%)
(8)(0,3%)
361.5%
(10)
(1)
261.1%
-
261.1%
2 0 0 4 2 0 0 5
Q1 Q2 Q3 Q4 Q1 Q2IFRS – in euro million)
2,7222,751
44816.5%
(173)6.3%(175)6.4%(31)
983.6%
(13)(0.5%)
(15)(0.5%)
702.8%
(25)
6
511.6%
(3)
481.7%
Q32,3562,381
37015.7%
(158)6.6%(158)6.8%(2)
773.2%
(16)(0.7%)
(13)(0,5%)
482.0%
(16)
0
321.3%
(2)
301.3%
Q42,5312,557
39215.5%
(169)6.6%(162)6.3%(10)
773.0%
(14)(0.6%)
(16)(0.6%)
481.9%
(9)
1
39
(1)
381.4%