Embed Size (px)
Citation preview
8/8/2019 2005 ICT in FE Report
http://slidepdf.com/reader/full/2005-ict-in-fe-report 1/40
the challenge of change
ICT and e-learning in
Further Education
A report to Post-16 E-learning Policy and Project Board
September 2005

8/8/2019 2005 ICT in FE Report
http://slidepdf.com/reader/full/2005-ict-in-fe-report 2/40
8/8/2019 2005 ICT in FE Report
http://slidepdf.com/reader/full/2005-ict-in-fe-report 3/40
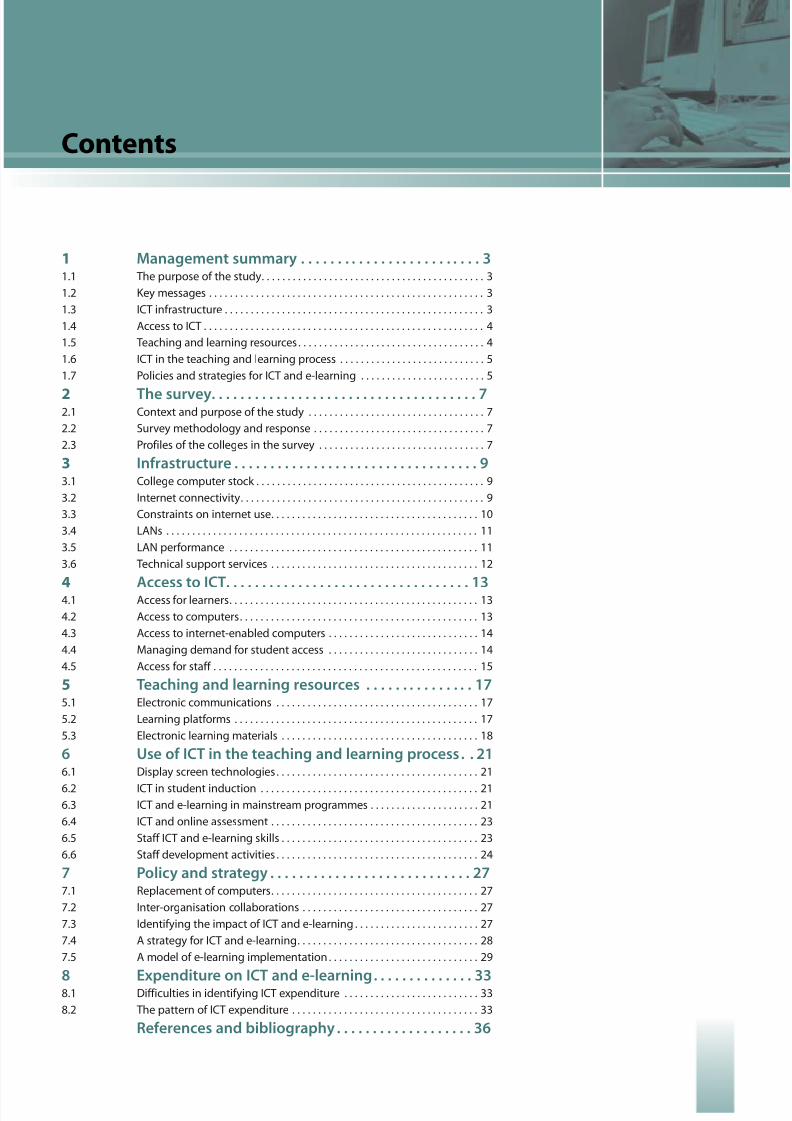
1 Management summary . . . . . . . . . . . . . . . . . . . . . . . . . 31.1 The purpose of the study. . . . . . . . . . . . . . . . . . . . . . . . . . . . . . . . . . . . . . . . . . . 3
1.2 Key messages . . . . . . . . . . . . . . . . . . . . . . . . . . . . . . . . . . . . . . . . . . . . . . . . . . . . . 3
1.3 ICT infrastructure . . . . . . . . . . . . . . . . . . . . . . . . . . . . . . . . . . . . . . . . . . . . . . . . . . 3
1.4 Access to ICT . . . . . . . . . . . . . . . . . . . . . . . . . . . . . . . . . . . . . . . . . . . . . . . . . . . . . . 4
1.5 Teaching and learning resources. . . . . . . . . . . . . . . . . . . . . . . . . . . . . . . . . . . . 4
1.6 ICT in the teaching and learning process . . . . . . . . . . . . . . . . . . . . . . . . . . . . 5
1.7 Policies and strategies for ICT and e-learning . . . . . . . . . . . . . . . . . . . . . . . . 5
2 The survey. . . . . . . . . . . . . . . . . . . . . . . . . . . . . . . . . . . . . 72.1 Context and purpose of the study . . . . . . . . . . . . . . . . . . . . . . . . . . . . . . . . . . 7
2.2 Survey methodology and response . . . . . . . . . . . . . . . . . . . . . . . . . . . . . . . . . 7
2.3 Profiles of the colleges in the survey . . . . . . . . . . . . . . . . . . . . . . . . . . . . . . . . 7
3 Infrastructure . . . . . . . . . . . . . . . . . . . . . . . . . . . . . . . . . . 93.1 College computer stock . . . . . . . . . . . . . . . . . . . . . . . . . . . . . . . . . . . . . . . . . . . . 9
3.2 Internet connectivity. . . . . . . . . . . . . . . . . . . . . . . . . . . . . . . . . . . . . . . . . . . . . . . 9
3.3 Constraints on internet use. . . . . . . . . . . . . . . . . . . . . . . . . . . . . . . . . . . . . . . . 10
3.4 LANs . . . . . . . . . . . . . . . . . . . . . . . . . . . . . . . . . . . . . . . . . . . . . . . . . . . . . . . . . . . . 11
3.5 LAN performance . . . . . . . . . . . . . . . . . . . . . . . . . . . . . . . . . . . . . . . . . . . . . . . . 11
3.6 Technical support services . . . . . . . . . . . . . . . . . . . . . . . . . . . . . . . . . . . . . . . . 12
4 Access to ICT. . . . . . . . . . . . . . . . . . . . . . . . . . . . . . . . . . 134.1 Access for learners. . . . . . . . . . . . . . . . . . . . . . . . . . . . . . . . . . . . . . . . . . . . . . . . 13
4.2 Access to computers. . . . . . . . . . . . . . . . . . . . . . . . . . . . . . . . . . . . . . . . . . . . . . 13
4.3 Access to internet-enabled computers . . . . . . . . . . . . . . . . . . . . . . . . . . . . . 14
4.4 Managing demand for student access . . . . . . . . . . . . . . . . . . . . . . . . . . . . . 14
4.5 Access for staff . . . . . . . . . . . . . . . . . . . . . . . . . . . . . . . . . . . . . . . . . . . . . . . . . . . 15
5 Teaching and learning resources . . . . . . . . . . . . . . . 175.1 Electronic communications . . . . . . . . . . . . . . . . . . . . . . . . . . . . . . . . . . . . . . . 17
5.2 Learning platforms . . . . . . . . . . . . . . . . . . . . . . . . . . . . . . . . . . . . . . . . . . . . . . . 17
5.3 Electronic learning materials . . . . . . . . . . . . . . . . . . . . . . . . . . . . . . . . . . . . . . 18
6 Use of ICT in the teaching and learning process. . 216.1 Display screen technologies . . . . . . . . . . . . . . . . . . . . . . . . . . . . . . . . . . . . . . . 21
6.2 ICT in student induction . . . . . . . . . . . . . . . . . . . . . . . . . . . . . . . . . . . . . . . . . . 21
6.3 ICT and e-learning in mainstream programmes . . . . . . . . . . . . . . . . . . . . . 21
6.4 ICT and online assessment . . . . . . . . . . . . . . . . . . . . . . . . . . . . . . . . . . . . . . . . 23
6.5 Staff ICT and e-learning skills . . . . . . . . . . . . . . . . . . . . . . . . . . . . . . . . . . . . . . 23
6.6 Staff development activities . . . . . . . . . . . . . . . . . . . . . . . . . . . . . . . . . . . . . . . 24
7 Policy and strategy . . . . . . . . . . . . . . . . . . . . . . . . . . . . 277.1 Replacement of computers. . . . . . . . . . . . . . . . . . . . . . . . . . . . . . . . . . . . . . . . 27
7.2 Inter-organisation collaborations . . . . . . . . . . . . . . . . . . . . . . . . . . . . . . . . . . 27
7.3 Identifying the impact of ICT and e-learning. . . . . . . . . . . . . . . . . . . . . . . . 27
7.4 A strategy for ICT and e-learning. . . . . . . . . . . . . . . . . . . . . . . . . . . . . . . . . . . 28
7.5 A model of e-learning implementation. . . . . . . . . . . . . . . . . . . . . . . . . . . . . 29
8 Expenditure on ICT and e-learning. . . . . . . . . . . . . . 338.1 Difficulties in identifying ICT expenditure . . . . . . . . . . . . . . . . . . . . . . . . . . 33
8.2 The pattern of ICT expenditure . . . . . . . . . . . . . . . . . . . . . . . . . . . . . . . . . . . . 33
References and bibliography . . . . . . . . . . . . . . . . . . . 36
Contents

8/8/2019 2005 ICT in FE Report
http://slidepdf.com/reader/full/2005-ict-in-fe-report 4/40

8/8/2019 2005 ICT in FE Report
http://slidepdf.com/reader/full/2005-ict-in-fe-report 5/40
1.1 The purpose of the study
This study is the sixth in a series that assesses progress in the provision of ICT within
further education (FE) and sixth form colleges since 1999. It also forms part of the
evidence base that will inform the development of the post-16 e-learning programme
by examining the integration of this provision into the teaching and learning process.
1. 2 Key messages
In the FE and sixth form colleges sector,e-learning activity continued to improve. Staff skills and access to ICT,colleges’ability to access and produce electronic resources, and
the extent to which e-learning is deployed have all moved steadily forward.The level of
access to ICT both for students and for staff has been maintained at an adequate level.
However, the large increase in full-time-equivalent (FTE) students over the last few
years has put a strain on the level of access available to students and on the college
infrastructure as a whole. All measures of student access have declined since 2003.
Some 87% of the £0.25 billion expenditure on ICT (on systems,hardware, software and
training) in FE colleges came out of the general college budget.This grew from 73% in
2003. Colleges themselves therefore have a major influence on the direction of ICT and
e-learning development at a local level.
Blended learning activity has become more widespread, seemingly at the expense of
the use of ICT in traditional courses and as a support outside scheduled lessons.Thismay be due to redefinition of some activities, as blended learning can be more readily
converted into extra guided learning hours.
Learndirect programmes are now delivered in just over half of colleges,compared with
nearly three-quarters in 2003.This has contributed to reducing the number of colleges
delivering remote learning programmes from 79% in 2003 to 68% in 2005.
The gap between teachers’skills in their personal use of ICT and their skills in using ICT
with learners narrowed between 2000 and 2003, but has remained more or less constant
since. Focusing on those teachers who have skills in word processing or spreadsheets
but lack skills and confidence in the classroom should produce quick wins.
Virtual learning environments (VLEs) are able to deliver a wide range of learning activity.
However, the weakness of these packages is in linking to colleges’management
information systems (MISs), which is vital for colleges to manage ICT and change.
1.3 ICT infrastructure
We estimate that the total number of computers in the 392 English colleges was around
370,000 in 2005 – more than double the estimated total in 1999. The rapid growth of
colleges’computer stock between 1999 and 2001 gave way to a more gradual net
increase until 2004.The purchase of 70,000 new computers in 2004-5, accompanied by a
continued reluctance to part with the oldest computers, resulted in a large net increase
of 50,000 computers to the national stock.
During 2004-5, the United Kingdom Education and Research Networking Association
(UKERNA) began a phased programme of bandwidth upgrades of JANET connections
for FE and sixth form colleges to 4Mbps or 10Mbps. At the time of the survey, 20% of
colleges still had 2Mbps bandwidth, with many of these respondents expecting changein the near future.
3
Management summary

8/8/2019 2005 ICT in FE Report
http://slidepdf.com/reader/full/2005-ict-in-fe-report 6/40
Local area network (LAN) specification improved steadily between 1999 and 2004.
A large number of colleges upgraded their LANs between 2004 and 2005, perhaps to
make best use of the new bandwidth upgrades. Gigabit Ethernet has become the
dominant feature of FE college networks. 100Mbps Ethernet declined dramatically over
the last year and 10Mbps Ethernet disappeared from the sample.Two colleges in the
survey had LAN backbones in excess of 1Gbps,signalling the beginning of a further
phase of LAN development.
1. 4 Access to ICT
An adequate level of access to the ICT infrastructure is the foundation of
a college’s ability to deliver e-learning effectively. The FE and sixth form
college sector was set targets for access in 1999 aimed at achieving this
adequate level.The two key targets were to achieve ratios of one
internet-enabled computer for every five FTE students, and one internet-
connected computer for every permanent member of teaching staff.
The median ratio of FTE students per internet-enabled computer was
4.7:1 at the time of the survey in 2005.This is a vast improvement on the
1999 ratio of 21:1, but a continued decline from 2003 when this ratio
was 4.1:1. However, this current ratio remains comfortably within the
target of 5:1, with two-thirds of colleges at or below this level.
Colleges’success in recruiting and retaining more students is a major
determinant of these worsening ratios in the face of increasing numbersof computers.
The target of one internet-connected computer for every permanent member of
teaching staff was achieved or bettered by 47% of colleges. This has improved from a
level of 26% of colleges in 2003, and 15% in 2001. This achievement is further reflected
in the median figure for the ratio of internet-connected computers to permanent
teaching staff.This stood at the target level of one member of staff for every machine
in 2005, compared to three members of staff per machine in 2000.
Just under half the institutions surveyed (47%) reported that they could not cope with
the demand for computers in 1999.This level stood at 40% in 2005, having increased
again from its lowest level in 2001. Improvements in access to the internet also declined.
Some 42% of respondents described access to computers for internet use as easy at any
time.This was a fall from 53% of respondents in 2003, and is similar to the 44% recorded
in 2001 – further evidence of the impact of increased numbers of FTE students.
1.5 Teaching and learning resources
College intranets and networks continued to be extensively used for learning.
Commercial VLEs, though less widely used than these other platforms,were used by
three-quarters of colleges in 2005 compared to 59% in 2003.However,not only did use
of these VLEs increase across colleges, they were also more widely cited as a college’s
main platform.
4
The target of one
internet-connected
computer for every
permanent member
of teaching staff was
achieved or bettered
by 47% of colleges
“”

8/8/2019 2005 ICT in FE Report
http://slidepdf.com/reader/full/2005-ict-in-fe-report 7/40
Colleges made heavy use of all three types of learning platform as repositories for
course documents. However,more than 70% of colleges with a VLE used it across a wide
range of learning activities.The ability of a learning platform to link with a college’s MIS
is not an outstanding feature of any platform.The difficulty of linking to an MIS is a
significant weakness of VLEs. Only 25% of colleges with a VLE say that this platform is
linked to the college’s MIS.
E-learning materials tended to be used at the discretion of the individual teacher.This
was the case in 58% of the colleges surveyed. Planning for the use of these materials at a
higher level was far less widespread.Only 17% of colleges had college-wide plans and
23% had department- or course-level plans.
The internet was again the most frequently used source of learning materials,
being used in 95% of colleges. Some 92% of colleges stated that they made use of
in-house-developed materials.Only one college in the sample stated that it did not
support members of staff who wished to develop materials.
The reuse of e-learning materials is also taking place in colleges. Interestingly, materials
were likely to be updated before reuse, an activity identified by 88% of respondents, and
as a regular occurrence by 31%. Given the extent of updating and repurposing
identified,ease of modification is clearly a key element for materials reuse.
1.6 ICT in the teaching and learning process
ICT remained more widely used for learning support and independent learning than forformal delivery. However blended learning became more widespread between 2004 and
2005. Most other approaches fell back,some to a level lower than in 2003. These
changes may be the result of redrawing boundaries between blended learning and
other categories in the light of funding priorities.As use of ICT for learning support takes
place outside any scheduled learning, and classroom technologies are used entirely
within scheduled learning, they are both funding-neutral.Blended learning, on the other
hand, offers greater scope for increasing guided learning hours by scheduling in
learners’use of ICT.
Fewer colleges offered learndirect programmes in 2005 than in 2003. Almost three-
quarters of colleges offered these programmes in 2003, but by 2005 only slightly more
than half were doing so.
The average number of staff considered to be competent or advanced in their personal
use of ICT grew steadily after 2000 to a level of 77%. Alongside this an average of 59% of college staff were reported to be competent or advanced in using ICT with learners
(e-learning skills). Both sets of skills have improved, though whereas the gap closed
between 2000 and 2003, it has remained at a steady level of just below 20% since.
1.7 Policies and strategies for ICT and e-learning
Colleges have increasingly relied on their own general budgets for ICT spend. Around
three-quarters of the total expenditure in 2001-2 came from the general budget, but by
2004-5 this proportion had increased to 87%. This is a trend that looks set to continue.
Total budgeted expenditure on ICT hardware, software,systems and training for 2004-5
was £0.23 billion, around 6% of the total allocation to colleges from the Learning and
Skills Council (LSC).
5

8/8/2019 2005 ICT in FE Report
http://slidepdf.com/reader/full/2005-ict-in-fe-report 8/40
6
In 2005, colleges were more conservative in their approach to replacing computers.Far
fewer sought to replace their computers at three years old than in the previous year –
some 7% of colleges had a policy to do this as opposed to 19% in 2004.
Some 80% of colleges collaborated with other organisations on ICT-related activities.
Colleges most frequently collaborated with other FE colleges, and almost as frequently
with schools. Well over half of colleges collaborated with either or both FE colleges
and schools.
One way that a college translates its strategy into action is through setting targets.
Some 29% of colleges set formal targets for the use of ICT and e-learning across allprogrammes. A further 43% set targets where they considered these appropriate,
and 25% did not set targets for ICT and e-learning at all. This situation has steadily
worsened since 2003, further suggesting a dislocation between strategy and action in
many colleges.
Students’access to a reasonably robust infrastructure gives access to electronic
resources.Limited resources,taken up by individual enthusiasts, can begin to produce
e-learning.However, management time has to be committed to facilitate access,and to
plan and set targets, and information has to flow from the teaching and learning process
to the management process. Teaching staff also need access to ICT, and their
competence and confidence with ICT need to be improved.They could then engage
with e-learning and develop their own resources. All these developments need to be in
place so that e-learning can be widely implemented and begin to transform teaching
and learning.
8/8/2019 2005 ICT in FE Report
http://slidepdf.com/reader/full/2005-ict-in-fe-report 9/40
The survey
2 .1 Context and purpose of the study
Becta carried out this study in January and February 2005 on behalf of the LSC.
The survey assesses progress in the provision of ICT within the further education (FE)
and sixth form college sector, along with the extent to which this provision is integrated
into the teaching and learning process (e-learning).
Five previous studies, undertaken in 1999,2000, 2001, 2003 and 2004 provide
comparative data against which to judge the impact and development of the ICT
infrastructure and e-learning in this sector.
2 .2 Survey methodology and response
The study took the form of a survey by questionnaire of all 392 FE and sixth form
colleges in England.Two separate questionnaires were sent out. The main questionnaire
(the ICT and e-learning survey) explored quantitative issues relating to infrastructure,
management and practice.A second questionnaire (the ICT expenditure survey),
directed to each college’s finance director, concerned expenditure on ICT and the
sources of funds for this expenditure. The two questionnaires were published and
disseminated simultaneously in both paper-based and web-based formats.
A total of 163 colleges (42% of the sector) submitted completed ICT and e-learning
survey questionnaires in time to be included in the analysis. Fewer responses to the ICT
expenditure survey were received. A total of 68 colleges (17% of the sector) submittedcompleted ICT expenditure questionnaires.
The profiles shown in the tables below, together with the good response rate for the ICT
and e-learning survey, lead us to a high degree of confidence in the data.The survey was
detailed and conducted to a tight timescale, so it is understandable that some returns
were incomplete in some sections. For this reason the basis of calculation in the report
varies from the sample maximum at times.Unless otherwise stated, all tables and charts
are based on the percentage of all respondents to the survey.
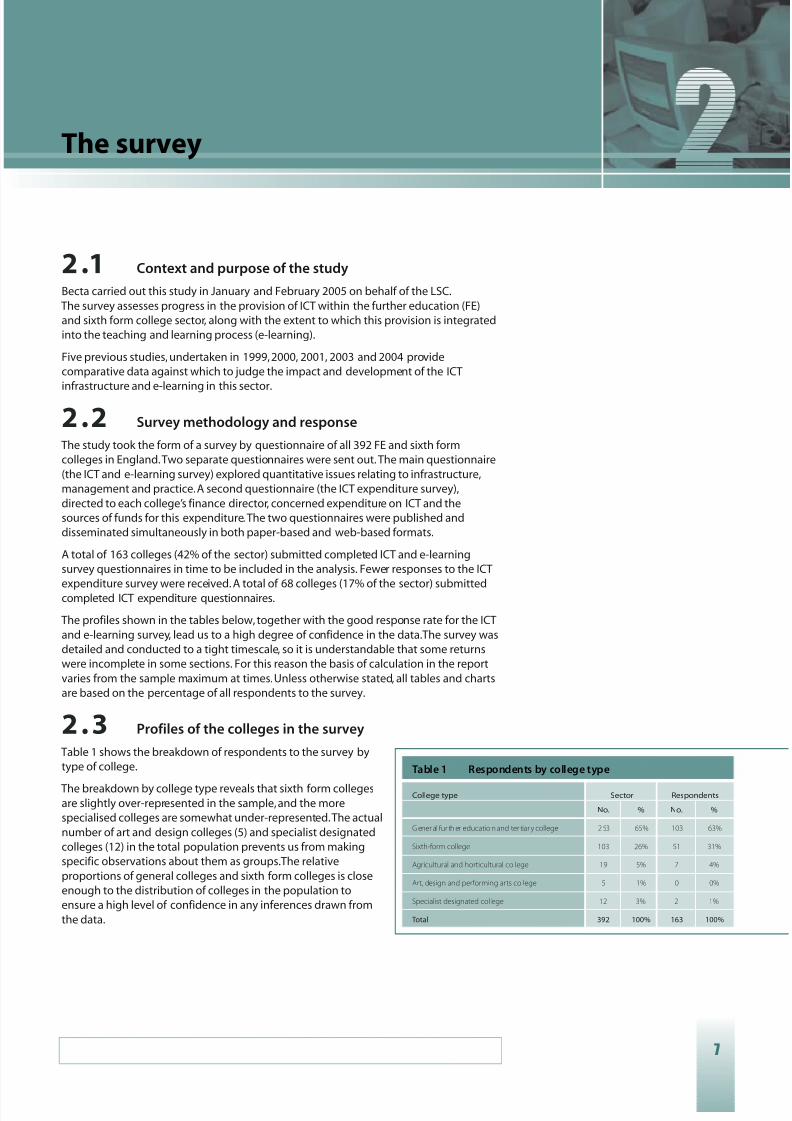
2 . 3 Profiles of the colleges in the survey
Table 1 shows the breakdown of respondents to the survey by
type of college.
The breakdown by college type reveals that sixth form collegesare slightly over-represented in the sample,and the more
specialised colleges are somewhat under-represented.The actual
number of art and design colleges (5) and specialist designated
colleges (12) in the total population prevents us from making
specific observations about them as groups.The relative
proportions of general colleges and sixth form colleges is close
enough to the distribution of colleges in the population to
ensure a high level of confidence in any inferences drawn from
the data.
7
Table 1 Respondents by college type
College type Sector Respondents
No. % No. %
G ener al fur th er educatio n and ter tiar y college 2 53 65% 103 63%
Sixth-form college 103 26% 51 31%
Agricultural and horticultural college 19 5% 7 4%
Art, design and performing arts college 5 1% 0 0%
Specialist designated college 12 3% 2 1%
Total 392 100% 163 100%
8/8/2019 2005 ICT in FE Report
http://slidepdf.com/reader/full/2005-ict-in-fe-report 10/40
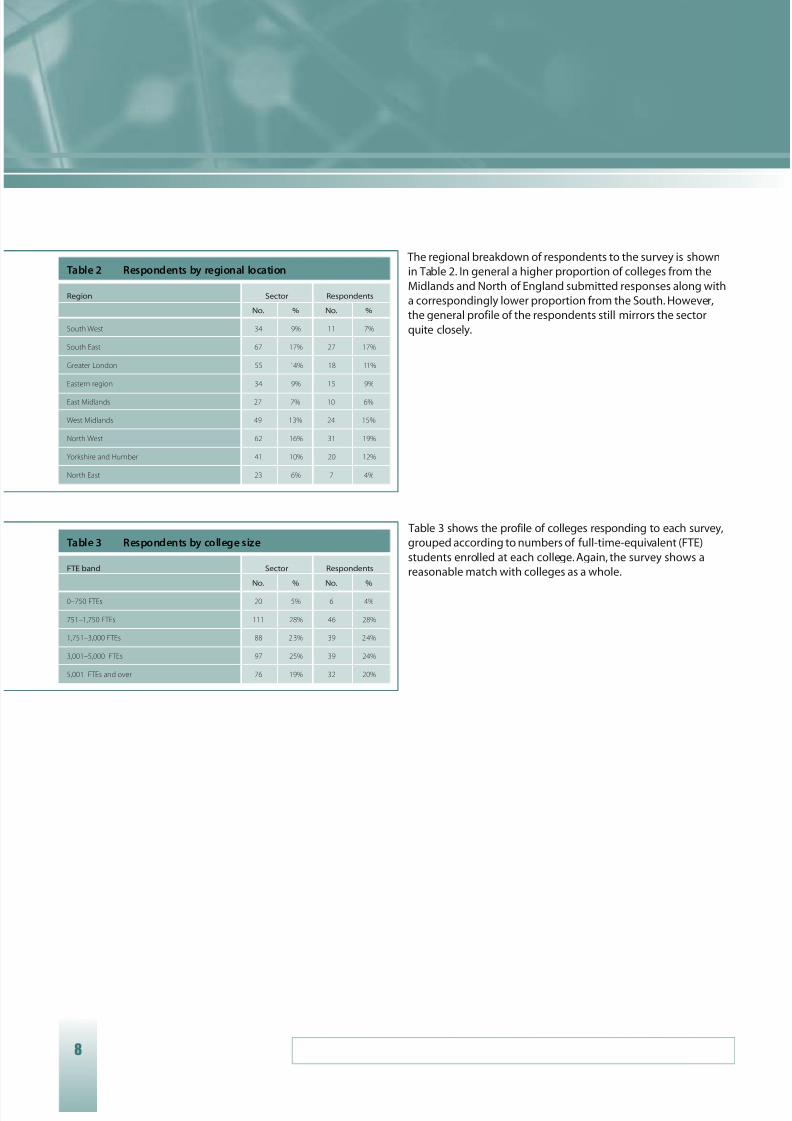
The regional breakdown of respondents to the survey is shown
in Table 2. In general a higher proportion of colleges from the
Midlands and North of England submitted responses along with
a correspondingly lower proportion from the South. However,
the general profile of the respondents still mirrors the sector
quite closely.
Table 3 shows the profile of colleges responding to each survey,
grouped according to numbers of full-time-equivalent (FTE)
students enrolled at each college. Again, the survey shows a
reasonable match with colleges as a whole.
8
Table 2 Respondents by regional location
Region Sector Respondents
No. % No. %
South West 34 9% 11 7%
South East 67 17% 27 17%
Greater London 55 14% 18 11%
Eastern region 34 9% 15 9%
East Midlands 27 7% 10 6%
West Midlands 49 13% 24 15%
North West 62 16% 31 19%
Yorkshire and Humber 41 10% 20 12%
North East 23 6% 7 4%
Table 3 Respondents by college size
FTE band Sector Respondents
No. % No. %
0–750 FTEs 20 5% 6 4%
751–1,750 FTEs 111 28% 46 28%
1,751–3,000 FTEs 88 23% 39 24%
3,001–5,000 FTEs 97 25% 39 24%
5,001 FTEs and over 76 19% 32 20%

8/8/2019 2005 ICT in FE Report
http://slidepdf.com/reader/full/2005-ict-in-fe-report 11/40
3.1 College computer stock
In February 1999, Becta’s original survey found that only 38%
of computers available for learning purposes had a Pentium II
processor or better. Pentium II was arbitrarily chosen as being an
acceptable specification for use with internet applications at that
time. Chart 1 shows that by 2005,88% of the installed stock of
computers in colleges exceeded that specification. Only 1% of
college computer stock was of a lower specification than the
1999 benchmark.
However, these figures reflect the rapid improvements in
technical specifications available in the marketplace. Newer
applications may require improved speed and memory, which
may in turn render obsolete even relatively recent purchases.
These improvements in computer specification have been
accompanied by a parallel increase in the absolute numbers
of computers in colleges.Chart 2 illustrates this increase.
We estimate that the actual number of computers in English
further education (FE) colleges stood at around 370,000 in 2005
– more than double the 1999 estimate.The rapid growth of
computer numbers between 1999 and 2001 resulted in an
annual net increase of around 50,000 computers.This situation
gave way to a more gradual net increase of around 20,000
computers a year between 2001 and 2004. The purchase of
70,000 new computers in 2004-5, accompanied by a continued
reluctance to part with the oldest computers, resulted in a
further net increase of 50,000 computers to the national stock.
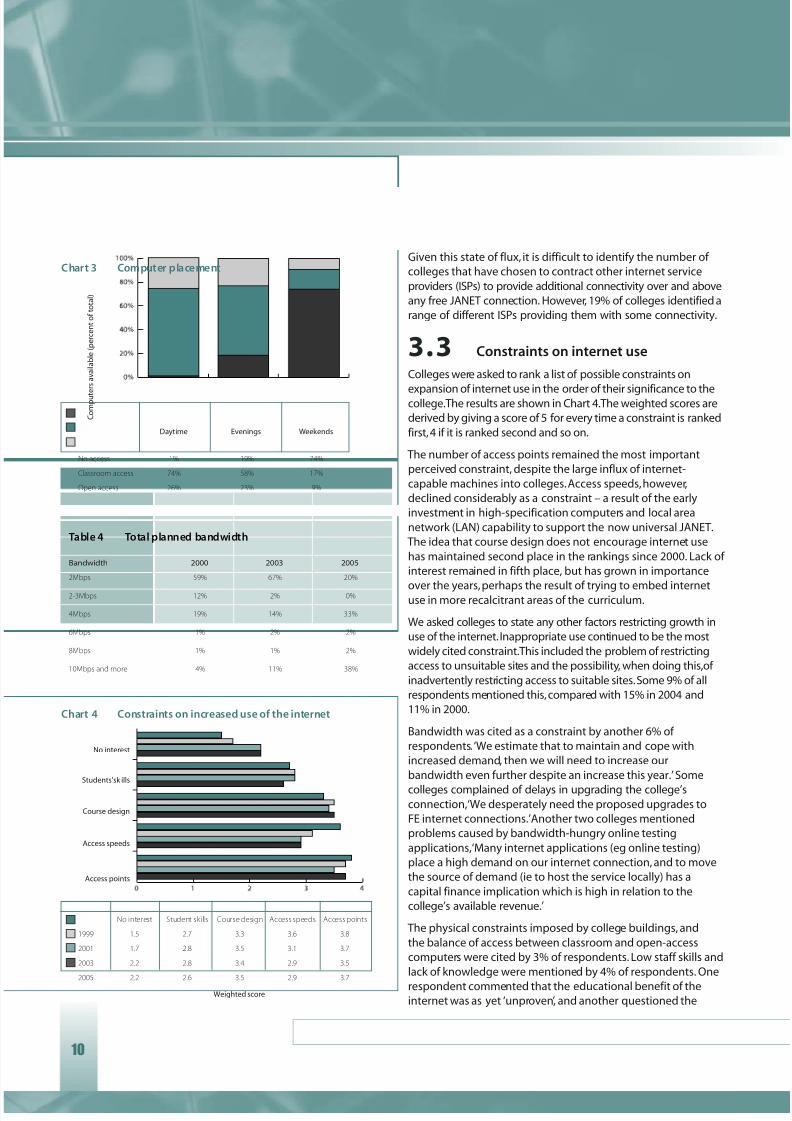
Chart 3 (below) shows the type of availability of computers
averaged across all colleges.As might be expected, computer
availability was at its greatest in the daytime, decreased in the
evening,and was at its lowest at weekends. A higher proportion
of open-access computers than classroom-access computers
remained available beyond daytime hours, with around
one-third of these open-access machines available for use at
weekends.These proportions have remained broadly unchanged
since availability was first investigated in 2003. However, though
colleges may wish for a greater proportion of computers to be
open access, the actual space available in college buildings may
prove a constraint.
3. 2 Internet connectivity
During 2004, the United Kingdom Education and Research Networking Association
(UKERNA) began the process of upgrading colleges’ free 2Mbps internet connections via
JANET as part of the National Learning Network (NLN) initiative. At the time of the survey,
colleges were migrating to upgraded bandwidth of either 4Mbps or 10Mbps, a decision
based on a college’s aggregated overall traffic flow.Table 4 (below) shows the extent to
which this migration had taken place by 2005. Only 20% of colleges still had 2Mbps
bandwidth at this time, with many respondents flagging up change in the near future.
9
Infrastructure
Chart 1 College computer stock (% of total)
Chart 2 Estimated change in computer stock over time
Pentium IV
Pentium III
Pentium II
Pentium I
Apple
N u m b e r o f c o m p u t e r s
2004-5 purchases 70,000
2003-4 purchases 40,000 40,000
2002-3 purchases 100,000 100,000 100,000
2000-1 purchases 170,000 150,000 140,000 130,000
Pre-2000 purchases 160 ,0 00 90 ,0 00 50,000 40,000 3 0,000
1999 2001 2003 2004 2005
8/8/2019 2005 ICT in FE Report
http://slidepdf.com/reader/full/2005-ict-in-fe-report 12/40
Given this state of flux, it is difficult to identify the number of
colleges that have chosen to contract other internet service
providers (ISPs) to provide additional connectivity over and above
any free JANET connection. However, 19% of colleges identified a
range of different ISPs providing them with some connectivity.
3.3 Constraints on internet use
Colleges were asked to rank a list of possible constraints on
expansion of internet use in the order of their significance to thecollege.The results are shown in Chart 4.The weighted scores are
derived by giving a score of 5 for every time a constraint is ranked
first,4 if it is ranked second and so on.
The number of access points remained the most important
perceived constraint, despite the large influx of internet-
capable machines into colleges.Access speeds,however,
declined considerably as a constraint – a result of the early
investment in high-specification computers and local area
network (LAN) capability to support the now universal JANET.
The idea that course design does not encourage internet use
has maintained second place in the rankings since 2000. Lack of
interest remained in fifth place, but has grown in importance
over the years,perhaps the result of trying to embed internetuse in more recalcitrant areas of the curriculum.
We asked colleges to state any other factors restricting growth in
use of the internet. Inappropriate use continued to be the most
widely cited constraint.This included the problem of restricting
access to unsuitable sites and the possibility, when doing this,of
inadvertently restricting access to suitable sites.Some 9% of all
respondents mentioned this,compared with 15% in 2004 and
11% in 2000.
Bandwidth was cited as a constraint by another 6% of
respondents. ‘We estimate that to maintain and cope with
increased demand, then we will need to increase our
bandwidth even further despite an increase this year.’ Some
colleges complained of delays in upgrading the college’sconnection,‘We desperately need the proposed upgrades to
FE internet connections.’Another two colleges mentioned
problems caused by bandwidth-hungry online testing
applications,‘Many internet applications (eg online testing)
place a high demand on our internet connection, and to move
the source of demand (ie to host the service locally) has a
capital finance implication which is high in relation to the
college’s available revenue.’
The physical constraints imposed by college buildings, and
the balance of access between classroom and open-access
computers were cited by 3% of respondents. Low staff skills and
lack of knowledge were mentioned by 4% of respondents. One
respondent commented that the educational benefit of theinternet was as yet ‘unproven’, and another questioned the
10
C o m p u t e r s a v a i l a b l e ( p e r c e n t o f t o t a l )
No access 1% 19% 74%
Classroom access 74% 58% 17%
Open access 26% 23% 9%
Chart 3 Computer placement
Weighted score
No interest Student skills Course design Access speeds Access points
1999 1.5 2.7 3.3 3.6 3.8
2001 1.7 2.8 3.5 3.1 3.7
2003 2.2 2.8 3.4 2.9 3.5
2005 2.2 2.6 3.5 2.9 3.7
Chart 4 Constraints on increased use of the internet
Table 4 Total planned bandwidth
Bandwidth 2000 2003 2005
2Mbps 59% 67% 20%
2-3Mbps 12% 2% 0%
4Mbps 19% 14% 33%
6Mbps 1% 2% 2%
8Mbps 1% 1% 2%
10Mbps and more 4% 11% 38%
Daytime Evenings Weekends
No interest
Students’sk ills
Course design
Access speeds
Access points

8/8/2019 2005 ICT in FE Report
http://slidepdf.com/reader/full/2005-ict-in-fe-report 13/40
desirability of direct internet access,‘the effectiveness of “raw”material versus
“processed”learning materials – high direct internet access may not be desirable.’
3.4 LANs
While 39% of the colleges surveyed were single-site institutions,
a further 31% operated out of two or three major sites, and 19%
out of four or five sites. The largest multi-site college in the
sample operated out of 19 major sites.
Most sites were networked. Some 94% of colleges had all theirmajor sites connected to the college network. Of the remaining
nine colleges in the survey, five had one major site that was not
networked and another three had three sites not networked.
One college had six major sites not networked.
Chart 5 shows how improvements in LAN specification have
risen over the years.This is broadly in line with the specification
and volume of the computers that they support. A large number
of colleges upgraded their LANs between 2004 and 2005,
perhaps to make best use of the internet upgrade mentioned
above.This has resulted in Gigabit Ethernet becoming the
dominant feature of FE college networks. 100Mbps Ethernet
declined dramatically over the last year and 10Mbps disappeared
from the sample.Two colleges also recorded LAN backbones inexcess of 1Gbps,signalling the beginning of a further phase of
LAN development.
3.5 LAN performance
The steady improvement in LAN specification between 1999
and 2004 was associated with a concomitant improvement in
performance and in capability to meet demand.However,
Chart 6 shows that the dramatic improvement in specification
between 2004 and 2005 has been associated with only a
relatively modest improvement in capacity. In 1999, only 24%
of colleges had the capacity to meet an increase in demand on
their networks,while 22% could not cope with existing callsupon them.By 2004, 45% of respondents said that they could
cope with a significant increase in traffic. However,despite the
dramatic improvement in LAN specification in 2005, this
percentage remained unchanged.
On the other hand, the proportion of colleges struggling to meet
demand fell in 2005 to 1%. While we might expect some delay
between technical improvements and the identification of any
resultant benefits, this may also confirm that the notion of a
‘motorway effect’, which sees traffic rapidly adjust upwards each time
an additional lane is opened, still applies to the nature of demand for ICT in colleges.
The data must be seen against a backcloth of substantial increases in demand on
networks.Not only must each college network support its share of the additional210,000 machines we estimate to have been added since 1999, but it must also deal
11
Chart 5 LAN backbone
1999 2000 2001 2003 2004 2005
10Mbps Ethernet 63% 27% 13% 6% 4% 0%
100Mbps Ethernet 28% 56% 66% 72% 68% 28%
Gigabit Ethernet 1% 9% 14% 20% 25% 67%
Chart 6 Network capability to meet demand
1999 2000 2001 2003 2004 2005
Overstretched 22% 9% 5% 5% 7% 1%
At capacity 54% 62% 55% 51% 47% 53%
Spare 24% 27% 38% 43% 45% 45%
P e r c e n t a g e o f c o l l e g e s
P e r c e n t a g e o f c o l l e g e s

8/8/2019 2005 ICT in FE Report
http://slidepdf.com/reader/full/2005-ict-in-fe-report 14/40
12
with the increased proportion of the total that are networked
(97%) rather than stand-alone.The burden is further increased,
moreover,by the increasing use of networked applications.
Colleges continued to restrict network traffic in bandwidth-
hungry applications.Three-quarters (75%) of colleges identified
large files as an actual or potential source of problems on the
network,and sought to control their use. Despite the continuing
improvement in colleges’technical infrastructure, this percentage
is only 9% fewer than the 84% that cited large files as a problem
in 1999.‘Bandwidth hungry’ is of course a relative term and, in afurther demonstration of the ‘motorway effect’, ever more
voracious applications eat into newly increased LAN capacity.
Chart 7 shows a rise over the period 1999-2005 in the proportion
of colleges that describe their network performance as smooth,
accompanied by a decline in those that reported their network
performance to be slow at busy times or to be a frequent
problem.However, the most dramatic changes took place
between 1999 and 2003, the overall trend tending to plateau
since that time. Students in 44% of colleges,the networked
learning of which is scheduled at busy times, will face a worse
experience than the winners in the lottery of timetable slots,
who are scheduled to use the network when traffic is low.
There have clearly been considerable technical improvements to
connectivity and college networks over the last year. However, at
the time of the survey, these improvements had not been
translated into a dramatic improvement in perceived
performance.
3.6 Technical support services
FE colleges employ technical staff to deliver a wide range of
services. in 2005, the median number of technical staff directly
employed by colleges was eight, and the median ratio of
computers to employed technicians was 100:1.
In-house technical support tended to be concentrated in thearea of end-user computing. PC support, audiovisual support
and technical helpdesk services were the services most often
provided by in-house staff.Around 90% of colleges delivered
these services entirely in-house (see Chart 8). Around three-
quarters of colleges delivered internet and network support
services in-house. Most of the remainder partially outsourced
these services.Data services, including management information systems (MISs),and
telephony support were most likely to be at least partly outsourced.Data services
were handled in-house by 63% of colleges,and telephony by only 43%.
Chart 7 Network performance
1999 2001 2003 2005
Always smooth 35% 47% 53% 55%
Slow at busy times 60% 49% 42% 44%
Slowness a problem 5% 3% 4% 1%
Chart 8 Technical support services
AV support
Telephony
Data/MIS
Network support
PC support
Internet
Helpdesk services
AV Telephony Data/ Network PC Internet Helpdesk
support MIS support support services
Not offered 5% 4% 0% 0% 6% 1% 6%
Partly outsourced 6% 32% 31% 18% 3% 13% 1%
All outsourced 1% 19% 4% 3% 1% 7% 1%
In-house 88% 43% 63% 77% 89% 77% 89%
Percentage of colleges
P e r c e n t a g e o f c o l l e g e s

8/8/2019 2005 ICT in FE Report
http://slidepdf.com/reader/full/2005-ict-in-fe-report 15/40
4.1 Access for learners
As shown in Section 3 of this report, the further education (FE) and sixth form college
sector has continued to strive to maintain a robust ICT infrastructure.Widespread
demand for this technology and increasing student numbers may, however, consume
any future increase in capacity.Access to this infrastructure is therefore a key
determinant of a college’s ability to deliver teaching and learning effectively.
The survey requested an actual count of computers available in the college. Based on
this data, calculations were made of the availability of computers for both students andstaff within colleges.The proxy variables that have been calculated to estimate this are
the ratios of computers to students and to staff.All five previous studies used these
measures,and comparisons over time can be drawn.These ratios were used by the
Learning and Skills Council (LSC) to define the targets for access to computers that it
encouraged colleges to achieve by 2002.
There is no single unambiguous measure of student numbers that can safely be used to
calculate access ratios. Full-time-equivalent (FTE) student data allows for total hours of
attendance, which other possible measures such as a simple count of student numbers
do not. We therefore used this data for our calculations.This allowed us to get closer to
the underlying question – how easy is it for a student to access a computer within the
institution? We have not tried to distinguish particular groups of students, or to separate
out attendance mode, pattern or site,although we recognise that in practice these may
also have an influence in determining access.We used the latest complete set of FTE student data available from the LSC, which
covers student numbers for the academic year 2003-4. The numbers of FTE students
have risen markedly over the past few years, reflecting the greater levels of recruitment
and retention of students across FE.The total number of FTE students stood at 0.9
million in the academic year 2000-1, but had increased to 1.15 million by 2002-3.By
2003-4 this had increased further to 1.28 million. If student numbers have continued
to grow in the intervening period,then comparing student numbers in 2003-4 with
computer numbers in 2005 will distort the apparent ratio, rendering it slightly more
optimistic than it is in reality.However,such an effect is likely to
be minimal and, given that year-old FTE figures have been
consistently used by this series of surveys, their value for
comparison over time will not be affected.
We have examined two key statistics:
• the ratio of FTE students to all computers in the college
• the ratio of FTE students to internet-enabled computers.
This latter statistic has allowed the LSC to monitor its target
for colleges of one internet-enabled computer for every five
FTE students.
4. 2 Access to computers
The change since 1999 in the availability of computers for
students is shown in Chart 9.The mean number of FTE students
per computer was 8.2:1 in 1999.This figure was most favourable in2003, when it was 4.1:1. However, it has since crept back to a level
13
Access to ICT
Chart 9 Ratio of FTE students to all computers
1999 2001 2003 2005
5:1 and below 21% 75% 87% 72%
6:1 to 7:1 36% 20% 11% 22%
8:1 to 11:1 35% 5% 2% 6%
12:1 and above 8% 0% 0% 1%
P e r c e n t a g e o f c o l l e g e s

8/8/2019 2005 ICT in FE Report
http://slidepdf.com/reader/full/2005-ict-in-fe-report 16/40
of 4.7:1 in 2005.The median number of FTE students per computer was 4.4:1 in 2005 (from
4.0:1 in 2003 and 7.6:1 in 1999). As the median value is not distorted by extreme results, it
is likely to be the better estimate of the typical situation in colleges, and to offer a better
value for comparison over time.The highest value calculated for 2005 was 12.4:1 at a
single college,with only 7% of the respondents having ratios of 8:1 or worse, a similar level
to the previous two years.This compares with 43% that had ratios of 8:1 or worse in 1999.
Colleges have had to face the challenge of maintaining their technological infrastructure
to keep it reasonably up to date.At the same time they have had to meet the demand
created by growing numbers of FTE students. Comparing the rate of increase of FTE
students to the rate of increase of numbers of computers available for students showsthat the large number of computer purchases between 1999 and 2001 reduced the
student:computer ratios considerably.Since that time,numbers of FTE students have
increased at a higher rate than the net increases in computer numbers. During 2004, one
additional computer was purchased for every 6.25 additional FTE students recruited across
the sector.However, this situation eased during 2005 when one additional computer was
purchased for every five additional FTE students.
The disparity noted in earlier surveys between different types of college in terms of
levels of resources continued to widen in 2005, having closed in 2003.The median ratio
of FTE students to computers for sixth form colleges slightly improved to 3.5:1 from the
level of 4.1:1 in 2003. On the other hand,this ratio for general FE colleges deteriorated to
4.9:1, having been 3.9:1 in 2003.The median ratio for land-based colleges stood at 5.1:1,
slightly worse than the 2003 level of 4.6:1.Again, the increase in numbers of FTE
students, which was more pronounced in general FE colleges than in sixth formcolleges,would account for this.
4.3 Access to internet-enabled computers
Chart 10 shows the dramatic increase in internet access in the FE
sector between 1999 and 2001. The chart also demonstrates a
steady improvement to 2003, followed by some deterioration,
resulting in a profile in 2005 similar to that in 2001.The median
number of FTE students to computers with internet access was
4.7:1 in the current study.This was a further deterioration from
the level of 4.1:1 in 2003, though still vastly improved on the level
of 21:1 in 1999. More than two-thirds of colleges remained within
the LSC target level of 5:1, although the number of collegeswithin the target level had declined from a proportion in excess
of three-quarters of colleges in 2003.
4.4 Managing demand for student access
In 1999, colleges overwhelmingly described student demand for
computers as widespread. Since that time demand has clearly
continued to grow in the face of a greatly increased number of
high-specification computers available for use by learners.Just
under half of institutions (47%) reported that they could not
cope with the demand for computers in 1999. As Chart 11 shows,
this level now stands at 40%. This proportion has increased again
from its lowest level in 2001. Also, the number of colleges
reporting that they are able to cope with increased demand
1414
Chart 10 Ratio of FTE students to internet-connected computers
5:1 and below 3% 64% 81% 68%
6:1 to 7:1 9% 24% 15% 24%
8:1 to 11:1 21% 9% 3% 8%
12:1 and above 65% 3% 0% 1%
P e r c e n t a g e o f c o
l l e g e s
1999 2001 2003 2005

8/8/2019 2005 ICT in FE Report
http://slidepdf.com/reader/full/2005-ict-in-fe-report 17/40
has declined to 3% from a peak of 10% in 2003.These figures
mirror the increase in the ratio of FTE students per computer
reported above.
The same general picture applies to meeting demand for
internet access.Table 5 indicates that the number of colleges
that were unable to meet demand fell from just over half in 1999
to one-quarter in 2001.This proportion increased again in 2005
to around one-third. Colleges appear more able to meet demand
for access to the internet than for computers per se. Given that
access to computers is necessary for access to both the internetand all other applications,this discrepancy is to be expected.
Improvements in access to the internet also seem to have
declined in the last few years. In 2005, 42% of respondents
described the use of computers for internet access as easy at any
time.This represented a fall from the peak of 53% of respondents
in 2003, to a level similar to the 44% recorded in 2001. Around
52% reported in 2005 that learners were likely to queue at busy
times, a rise from 44% in 2003 and, again, close to the 2001 level
of 56%.
4.5 Access for staff
The improvement in the provision of computers for the exclusiveuse of staff identified in previous studies has been maintained at
a similar level to that in 2004. The National Learning Network
(NLN) target of one internet-connected computer for every
permanent member of the teaching staff was achieved or
bettered by 47% of colleges, a similar level to that in 2004,
though improved from a level of 26% in 2003, and 15% in 2001.
The attainment of the target for staff access to computers had
proved slower to achieve than the target for student access.This
is in accord with a preference,expressed in many strategy
documents submitted by colleges to Becta in 2000, for giving
early priority to resources for students rather than staff. This
position was reaffirmed by the strategy updates for 2001, and its
translation into practice is clearly demonstrated by achievement
of the student access ratios reported above.
The actual achievement of colleges in providing computers for
staff is reflected in the median value of the ratio of internet-
connected computers to permanent teaching staff, which
improved from 3:1 in 2000, to 1:1 this year.The figure imputed for
1999 (when the question was not directly asked) was 7:1. (See Table 6.)
Table 6 also shows the improvement in access to internet-enabled computers for all
teaching staff,which is of particular significance given the heavy reliance by colleges on
sessional staff to deliver programmes of learning.The ratio of teaching staff to internet-
enabled computers has fallen from 12.0:1 to 1.7:1. We have chosen not to report
separately the ratios for staff and all computers, including those without internet
capability,because these now differ little from the figures given in Table 6.
15
P e r c e
n t a g e o f c o l l e g e s
1999 47% 46% 4%
2001 28% 61% 5%
2003 29% 60% 10%
2005 40% 56% 3%
Chart 11 Meeting student demand for computers
Table 5 Meeting student demand for internet access
College capability 2005 2003 2001 1999
Cannot cope with current demand 33% 25% 25% 54%
Can cope with current demand 56% 63% 58% 25%
Can cope with greater demand 10% 11% 11% 5%
Table 6 Median ratio of teaching staff to internet-
connected computers
2005 2003 2001 1999
All teaching staff 1.7:1 2.4:1 3.5:1 12.0:1
Permanent staff 1.0:1 1.4:1 1.9:1 *7.0:1
* Estimate based on 1999 data
Difficulty meeting
demand
Sufficient capacity
for demand
Sufficient capacity
for greater demand

8/8/2019 2005 ICT in FE Report
http://slidepdf.com/reader/full/2005-ict-in-fe-report 18/40
The improvement in access to internet-enabled computers has
come about from the increasing connection of staff computers
to the college network.In 2005, 75% of all computers set aside
for staff use were networked desktop machines, and 24%
were laptops.Only 1% of staff computers were stand-alone
desktop machines.
This improvement has accompanied a trend towards giving
each member of teaching staff their own designated computer.
Chart 12 reveals college priorities changing in the light of the
increase in available resources. By 2005, sole use of a computerfor teaching staff had been achieved by 24% of colleges,
increased from 11% in 2003.However,sole use has declined as
a priority over the last year,having been reported as a low
priority by 45% of colleges.The achievement of sole use of a
computer for teaching staff by 24% of colleges may appear to sit
awkwardly with the other reported achievement of a ratio of
teaching staff to computers of 1:1 by 47% of colleges. Although
many colleges have enough computers for all permanent
teaching staff,these machines are not designated for the sole
use of a particular individual.
Sole access to a computer for learning support staff is seen as less of a priority for
colleges than sole access for teaching staff. Even so,25% of colleges had achieved this
type of access in 2005, which is almost the same percentage as had achieved sole accessfor teaching staff.However,50% of all colleges did not regard sole access as a priority for
their learning support staff.
Taking colleges as a whole, the level of access to ICT both for students and for staff has
been maintained at a reasonable level.However, the large increase in FTE students over
the last few years has continued to put a strain on the level of access available to
students and on the college infrastructure as a whole.
16
P e r c e n t a g e o f c o l l e g e s
Not a priority 79% 46% 35% 45%
Priority 12% 39% 53% 29%
Achieved 1% 3% 11% 24%
Chart 12 Priority given to providing teaching staff with access
to own designated computer
1999 2001 2003 2005
8/8/2019 2005 ICT in FE Report
http://slidepdf.com/reader/full/2005-ict-in-fe-report 19/40
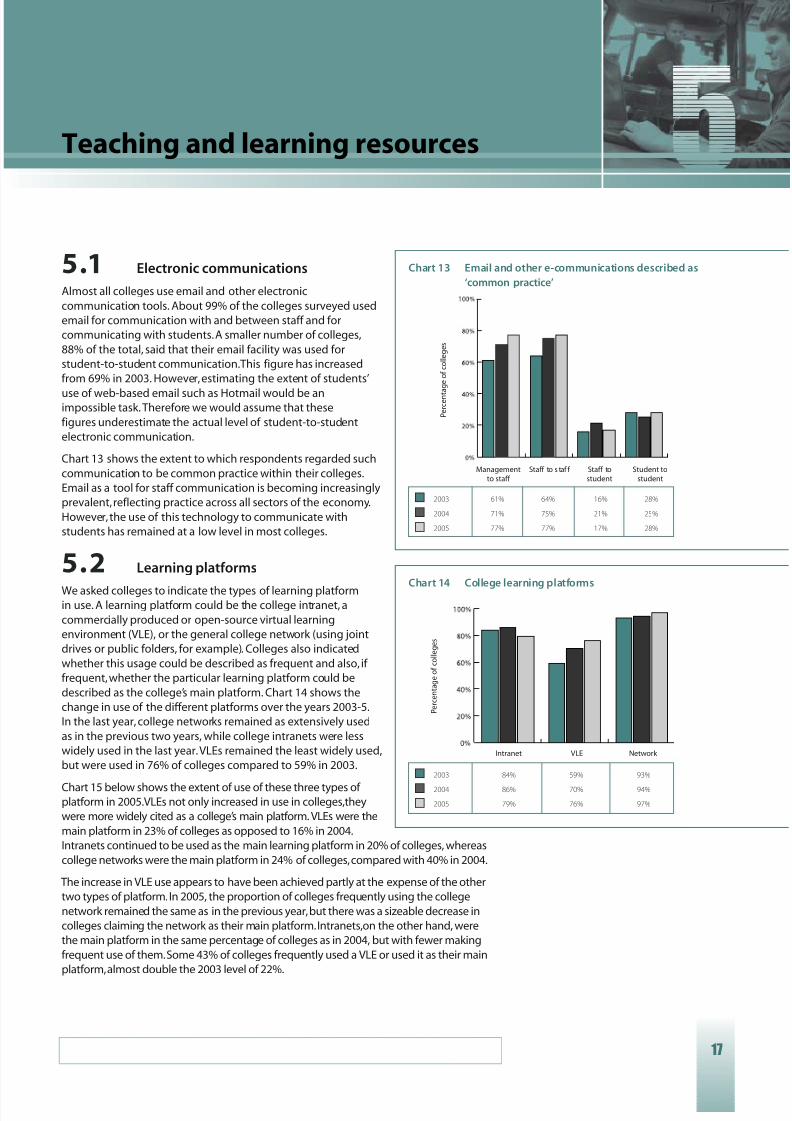
5.1 Electronic communications
Almost all colleges use email and other electronic
communication tools. About 99% of the colleges surveyed used
email for communication with and between staff and for
communicating with students.A smaller number of colleges,
88% of the total, said that their email facility was used for
student-to-student communication.This figure has increased
from 69% in 2003. However,estimating the extent of students’
use of web-based email such as Hotmail would be animpossible task. Therefore we would assume that these
figures underestimate the actual level of student-to-student
electronic communication.
Chart 13 shows the extent to which respondents regarded such
communication to be common practice within their colleges.
Email as a tool for staff communication is becoming increasingly
prevalent,reflecting practice across all sectors of the economy.
However, the use of this technology to communicate with
students has remained at a low level in most colleges.
5.2 Learning platforms
We asked colleges to indicate the types of learning platformin use. A learning platform could be the college intranet, a
commercially produced or open-source virtual learning
environment (VLE), or the general college network (using joint
drives or public folders, for example). Colleges also indicated
whether this usage could be described as frequent and also, if
frequent,whether the particular learning platform could be
described as the college’s main platform. Chart 14 shows the
change in use of the different platforms over the years 2003-5.
In the last year, college networks remained as extensively used
as in the previous two years, while college intranets were less
widely used in the last year.VLEs remained the least widely used,
but were used in 76% of colleges compared to 59% in 2003.
Chart 15 below shows the extent of use of these three types of platform in 2005.VLEs not only increased in use in colleges,they
were more widely cited as a college’s main platform. VLEs were the
main platform in 23% of colleges as opposed to 16% in 2004.
Intranets continued to be used as the main learning platform in 20% of colleges, whereas
college networks were the main platform in 24% of colleges,compared with 40% in 2004.
The increase in VLE use appears to have been achieved partly at the expense of the other
two types of platform.In 2005, the proportion of colleges frequently using the college
network remained the same as in the previous year,but there was a sizeable decrease in
colleges claiming the network as their main platform.Intranets,on the other hand, were
the main platform in the same percentage of colleges as in 2004, but with fewer making
frequent use of them.Some 43% of colleges frequently used a VLE or used it as their main
platform,almost double the 2003 level of 22%.
17
Teaching and learning resources
Chart 13 Email and other e-communications described as
‘common practice’
P e r c e n t a g e o f c o l l e g e s
2003 61% 64% 16% 28%
2004 71% 75% 21% 25%
2005 77% 77% 17% 28%
Chart 14 College learning platforms
P e r c e n t a g e o f c o l l e g e s
2003 84% 59% 93%
2004 86% 70% 94%
2005 79% 76% 97%
Managementto staff
Staff to s taf f Staff tostudent
Student tostudent
Intranet VLE Network

8/8/2019 2005 ICT in FE Report
http://slidepdf.com/reader/full/2005-ict-in-fe-report 20/40
In order to identify the uses of these different learning platforms,
we asked respondents to select from a list of features of learning
platforms.These features were derived from a typology
published in the recent Joint Information Systems Committee
(JISC)/National Institute of Adult Continuing Education (NIACE)
report on choosing and using a learning platform in adult and
community learning (Powell and Minshull 2004).Chart 16 shows
the range of uses of the different platforms in 2005. The figures
shown for each type of use are the percentages of those colleges
that have each of the three platform types. Colleges made heavyuse of all three types of learning platform as repositories for
course documents. However, more than 70% of colleges with a
VLE used it across a wide range of learning activity. The ability
of a learning platform to link with a college’s management
information system (MIS) is not an outstanding feature for any
platform.The difficulty of linking to an MIS is a significant
weakness for VLEs.Only 25% of colleges with a VLE said that
this platform was linked to the college’s MIS.
5. 3 Electronic learning materials
E-learning materials continued to be most often used at the
discretion of the individual teacher. This was the case in 58%
of the colleges surveyed.The use of e-learning materials wasdirected by a college-wide plan in only 17% of colleges and by
a plan at department or course level in 23%. These proportions
remained broadly the same between 2004 and 2005.
Chart 17 (below) shows the main sources of learning materials
used with students.The internet was again the most frequently
used source of learning materials, being used in 95% of colleges
(94% in 2003) and in common use in 45% (43% in 2003). Of the
87% of colleges that used National Learning Network (NLN)
materials,13% described their use as common practice.This is an
increase from 4% describing the use of NLN materials as common
practice in 2003. However, the overall reported use of e-learning
materials by colleges has remained fairly static since 2003.
Some 83% of colleges offered staff development programmes
to support staff who wished to develop or adapt e-learning
materials.Around 72% offered support from e-learning
‘champions’ and 64% offered support from technical staff.These proportions have
remained broadly the same over the last few years. Of the 20% of colleges that offered
other support, a number mentioned support from other members of staff,often on a
one-to-one or mentoring basis. Several colleges also mentioned the deployment of a
dedicated materials development team. Others offered some remission of time, loan of
laptops or other equipment, and sometimes funding. A number also mentioned
involvement in projects, often with sector agencies, as a source of support.
Some 93% of respondents stated that their college had no policy on the reuse of e-
learning materials.The extent of reuse that did occur (see Chart 18 below) may therefore
be taken to be largely driven by a bottom-up desire rather than by top-down edict.
18
Chart 15 College learning platforms – frequency of use
0%
20%
40%
60%
80%
100%
P e
r c e n t a g e o f c o l l e g e s
Main platform 20% 23% 24%
In frequent use 26% 20% 45%
In use 33% 33% 28%
Chart 16 Use of college learning platforms
P e r c e n t a g e o f c o l l e g e s
Store course docs 61% 72% 84%
Deliver learning activity 59% 83% 53%
Discussion 24% 81% 20%
Remote staff access 50% 73% 37%
Remote learner access 38% 79% 18%
Tracks student activity 9% 71% 17%
Links to MIS 45% 25% 40%
Intranet VLE Network
Intranet VLE Network

8/8/2019 2005 ICT in FE Report
http://slidepdf.com/reader/full/2005-ict-in-fe-report 21/40
Unmodified reuse, where materials are taken ‘back off the shelf’
for use with learners, is clearly widespread within the sector, with
82% of respondents identifying this activity within their college,
and 22% describing such reuse as a regular occurrence. However,
materials were more likely to be updated before reuse,an
activity identified by 88% of respondents, and as a regular
occurrence by 31%. Repurposing of learning materials, where
materials are modified for different learning contexts, was only
slightly less widespread than unmodified reuse, identified by
79% of respondents and described as a regular occurrence by
15%. Given the extent of updating and repurposing identified,
ease of modification is clearly a key element for materials reuse.
A far greater proportion of respondents either did not know or
did not respond to the questions asking for the extent of
material being retained but not reused (38%) or materials not
being retained (45%).These statistics indicate the lack of college-
level repositories which would be necessary to give a definitive
answer here.
19
Chart 17 Source of e-learning materials used with students
P e r c e n t a g e o f c o l l e g e s
This is common practice 13% 12% 31% 45%
We do this 74% 73% 61% 50%
NLN materials Bought-in In-house Internet
Chart 18 Reuse of e-learning materials
Percentage of colleges
Reused Updated Modified for Retained but Not retainedunmodified and reused different uses not reused by the college
/technologies
Regularly 22% 31% 15% 6% 6%
Sometimes 48% 50% 44% 28% 10%
Rarely 12% 7% 20% 21% 13%
Never 2% 1% 3% 7% 24%
Reused unmodified
Updated andreused
Modified for differentuses/technologies
Retained butnot reused
Not retained bythe college

8/8/2019 2005 ICT in FE Report
http://slidepdf.com/reader/full/2005-ict-in-fe-report 22/40
20
8/8/2019 2005 ICT in FE Report
http://slidepdf.com/reader/full/2005-ict-in-fe-report 23/40
21
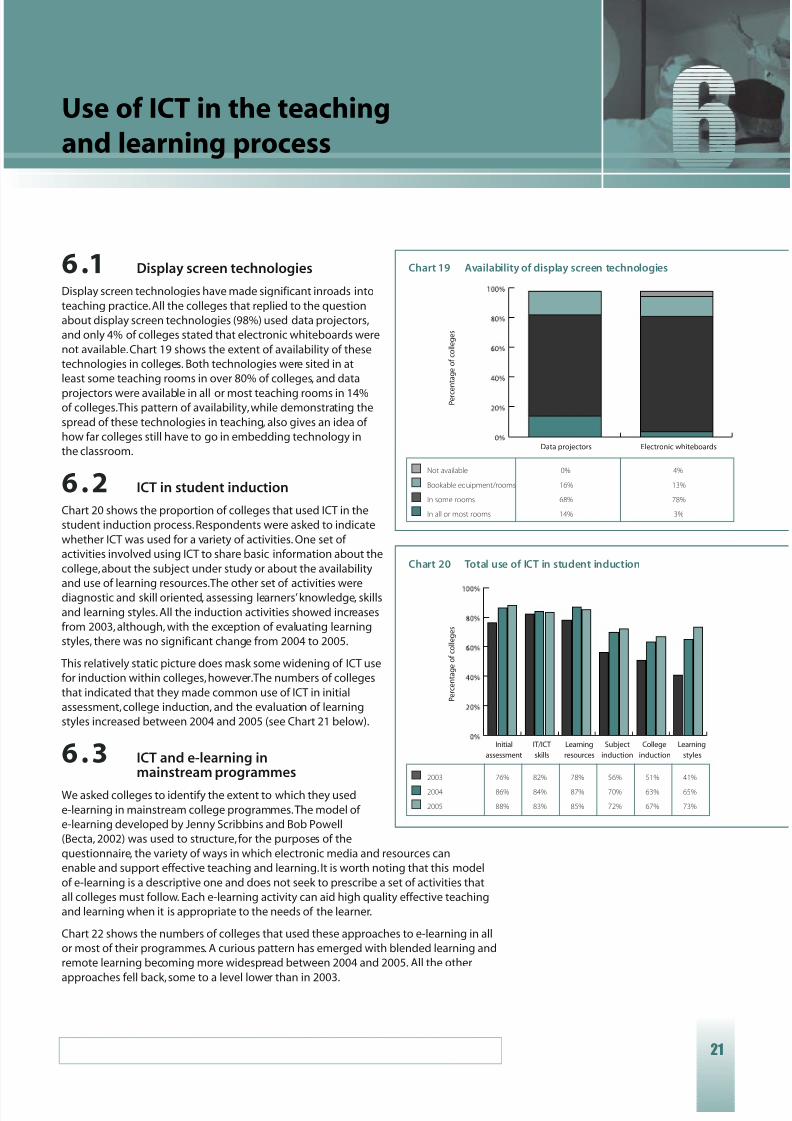
6 .1 Display screen technologies
Display screen technologies have made significant inroads into
teaching practice.All the colleges that replied to the question
about display screen technologies (98%) used data projectors,
and only 4% of colleges stated that electronic whiteboards were
not available.Chart 19 shows the extent of availability of these
technologies in colleges. Both technologies were sited in at
least some teaching rooms in over 80% of colleges, and data
projectors were available in all or most teaching rooms in 14%of colleges.This pattern of availability,while demonstrating the
spread of these technologies in teaching, also gives an idea of
how far colleges still have to go in embedding technology in
the classroom.
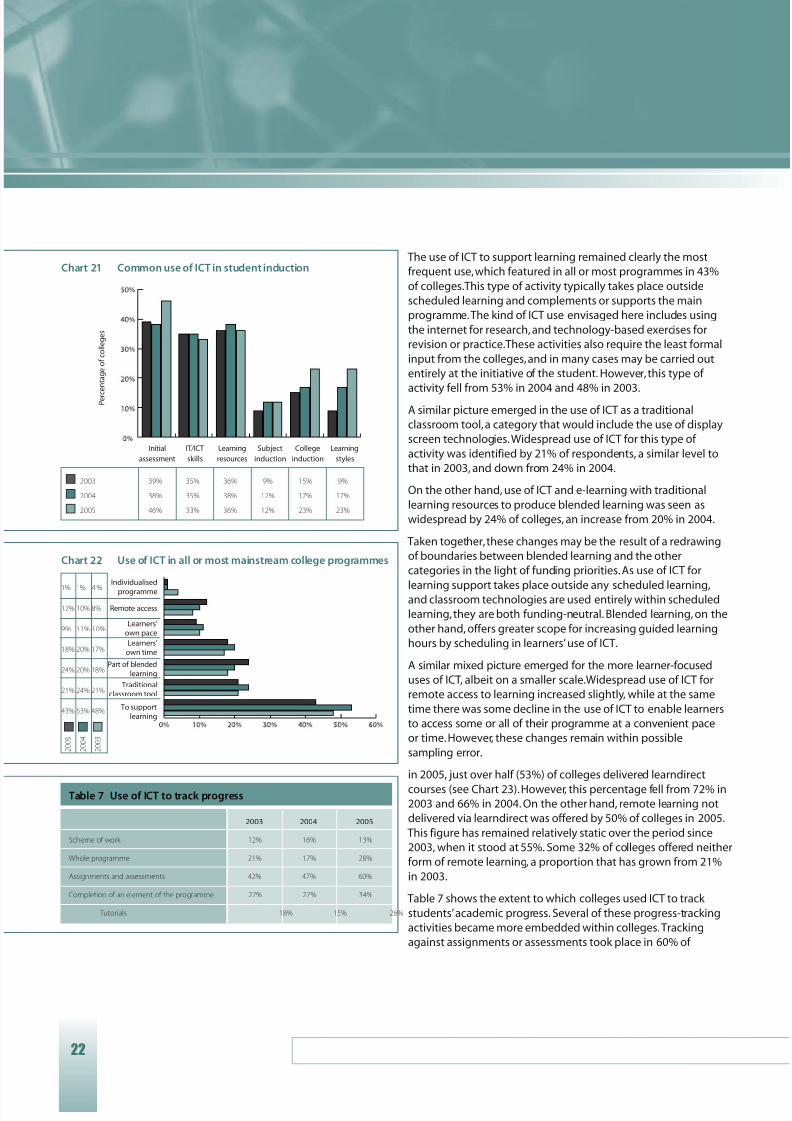
6 . 2 ICT in student induction
Chart 20 shows the proportion of colleges that used ICT in the
student induction process.Respondents were asked to indicate
whether ICT was used for a variety of activities. One set of
activities involved using ICT to share basic information about the
college,about the subject under study or about the availability
and use of learning resources.The other set of activities werediagnostic and skill oriented, assessing learners’knowledge, skills
and learning styles. All the induction activities showed increases
from 2003, although, with the exception of evaluating learning
styles, there was no significant change from 2004 to 2005.
This relatively static picture does mask some widening of ICT use
for induction within colleges,however.The numbers of colleges
that indicated that they made common use of ICT in initial
assessment,college induction, and the evaluation of learning
styles increased between 2004 and 2005 (see Chart 21 below).
6 . 3 ICT and e-learning inmainstream programmes
We asked colleges to identify the extent to which they used
e-learning in mainstream college programmes.The model of
e-learning developed by Jenny Scribbins and Bob Powell
(Becta, 2002) was used to structure, for the purposes of the
questionnaire, the variety of ways in which electronic media and resources can
enable and support effective teaching and learning.It is worth noting that this model
of e-learning is a descriptive one and does not seek to prescribe a set of activities that
all colleges must follow. Each e-learning activity can aid high quality effective teaching
and learning when it is appropriate to the needs of the learner.
Chart 22 shows the numbers of colleges that used these approaches to e-learning in all
or most of their programmes. A curious pattern has emerged with blended learning and
remote learning becoming more widespread between 2004 and 2005. All the other
approaches fell back,some to a level lower than in 2003.
Use of ICT in the teaching
and learning process
P e r c e n t a g e o f c o l l e g e s
Chart 19 Availability of display screen technologies
P e r c e n t a g e o f c o l l e g e s
2003 76% 82% 78% 56% 51% 41%
2004 86% 84% 87% 70% 63% 65%
2005 88% 83% 85% 72% 67% 73%
Chart 20 Total use of ICT in student induction
Data projectors Electronic whiteboards
Not available 0% 4%
Bookable equipment/rooms 16% 13%
In some rooms 68% 78%
In all or most rooms 14% 3%
Initial
assessment
IT/ICT
skills
Learning
resources
Subject
induction
College
induction
Learning
styles
8/8/2019 2005 ICT in FE Report
http://slidepdf.com/reader/full/2005-ict-in-fe-report 24/40
The use of ICT to support learning remained clearly the most
frequent use,which featured in all or most programmes in 43%
of colleges.This type of activity typically takes place outside
scheduled learning and complements or supports the main
programme.The kind of ICT use envisaged here includes using
the internet for research, and technology-based exercises for
revision or practice.These activities also require the least formal
input from the colleges,and in many cases may be carried out
entirely at the initiative of the student. However, this type of
activity fell from 53% in 2004 and 48% in 2003.A similar picture emerged in the use of ICT as a traditional
classroom tool,a category that would include the use of display
screen technologies.Widespread use of ICT for this type of
activity was identified by 21% of respondents, a similar level to
that in 2003, and down from 24% in 2004.
On the other hand, use of ICT and e-learning with traditional
learning resources to produce blended learning was seen as
widespread by 24% of colleges, an increase from 20% in 2004.
Taken together,these changes may be the result of a redrawing
of boundaries between blended learning and the other
categories in the light of funding priorities.As use of ICT for
learning support takes place outside any scheduled learning,and classroom technologies are used entirely within scheduled
learning,they are both funding-neutral. Blended learning, on the
other hand, offers greater scope for increasing guided learning
hours by scheduling in learners’use of ICT.
A similar mixed picture emerged for the more learner-focused
uses of ICT, albeit on a smaller scale.Widespread use of ICT for
remote access to learning increased slightly, while at the same
time there was some decline in the use of ICT to enable learners
to access some or all of their programme at a convenient pace
or time.However, these changes remain within possible
sampling error.
in 2005, just over half (53%) of colleges delivered learndirect
courses (see Chart 23).However, this percentage fell from 72% in2003 and 66% in 2004. On the other hand, remote learning not
delivered via learndirect was offered by 50% of colleges in 2005.
This figure has remained relatively static over the period since
2003, when it stood at 55%. Some 32% of colleges offered neither
form of remote learning, a proportion that has grown from 21%
in 2003.
Table 7 shows the extent to which colleges used ICT to track
students’academic progress. Several of these progress-tracking
activities became more embedded within colleges.Tracking
against assignments or assessments took place in 60% of
22
Chart 22 Use of ICT in all or most mainstream college programmes
Individualised
programme
Remote access
Learners’own pace
Learners’own time
Part of blendedlearning
Traditionalclassroom tool
To supportlearning
Table 7 Use of ICT to track progress
2003 2004 2005
Scheme of work 12% 16% 13%
Whole programme 21% 17% 28%
Assignments and assessments 42% 47% 60%
Completion of an element of the programme 27% 27% 34%
Tutorials 18% 15% 26%
P e r c e n t a g e o f c o l l e g e s
2003 39% 35% 36% 9% 15% 9%
2004 38% 35% 38% 12% 17% 17%
2005 46% 33% 36% 12% 23% 23%
Chart 21 Common use of ICT in student induction
Initial
assessment
IT/ICT
skills
Learning
resources
Subject
induction
College
induction
Learning
styles
2 0 0 5
2 0 0 4
2 0 0 3
1% 1% 4 %
12% 10% 8%
9% 11% 10%
18% 20% 17%
24% 20% 18%
21% 24% 21%
43% 53% 48%

8/8/2019 2005 ICT in FE Report
http://slidepdf.com/reader/full/2005-ict-in-fe-report 25/40
23
colleges in 2005. This continued to be the most widespread use
of ICT for student tracking, used by nearly twice as many colleges
as the second most widespread use (tracking against completion
of an element of the programme).
The use of electronic information to support teaching and
learning also progressed. In 2005, 48% of colleges commonly
used electronic information to support personal tutorials, an
increase from 35% the previous year. Information from tutorials
was recorded electronically in 29% of colleges, again increased
from 19% in 2004. Electronic student portfolios or records of achievement were maintained in 27% of colleges, a small
increase from 24% in 2004.
6.4 ICT and online assessment
Online assessment was considered insignificant or limited to
individual enthusiasts in 35% of the colleges surveyed. It was a
widespread activity in only 6% of colleges. These figures were
higher than in the previous two years, when online assessment
was considered insignificant or limited in 50% of colleges and
widespread in only 2%.
This small increase in the use online assessment is reflected in
the extent to which the assessment activities are seen ascommon practice in Chart 24.All the assessment activities
identified in the chart became more widely used in colleges,but
the extent of common usage remained small. The most extensive
use of ICT remained being to store and record outcomes of
assessment, which occurred in 81% of colleges. However,only
14% described this as common practice.The use of ICT for
assessment activities that lead to formal certification remained
the least widespread type of activity. Only 60% of colleges did
this at all, and 4% described it as common practice.
6.5 Staff ICT and e-learning skills
We asked respondents to estimate the general skills levels of staff in their college.They identified the proportion of staff with
low,medium or high levels of skill (beginner, competent,
advanced),both in their personal use of ICT (for example, word processing or using
spreadsheets) and in their use of ICT with learners (e-learning skills). We left definitions
within these broad classifications to the judgement of respondents on grounds of
practicality.We considered the identification of suitably bounded criteria to be a
daunting task, if not impossible within the timescale.We also felt that while respondents’
assessments of the categories would not be identical,respondents would share
sufficiently similar understandings of degrees of competency to enable comparisons
and judgements to be drawn from the results.
Chart 23 Delivery of remote learning in colleges
Chart 24 Online assessment activities
C o m m o n p r a c t i c e
W e u s e t h i s
2003 2004 2005
Delivers learndirect 72% 66% 53%
programmes
Delivers other 55% 52% 50%
remote learning
9% 69% For studentfeedback
4% 56% Certification
activities
14% 67% To store
outcomes
4% 68% Online submission
of work
7% 69% Computer-marked
assignment
P e r c e n t a g e o f c o l l e g e s
Percentage of colleges

8/8/2019 2005 ICT in FE Report
http://slidepdf.com/reader/full/2005-ict-in-fe-report 26/40
3224
However, it is worth noting that the lack of a commonly
agreed and well understood set of definitions of e-learning
competences, taken together with the uncertainty about what
constitutes good practice and effective pedagogy for e-learning,
may have led many respondents to overstate the e-learning skills
levels of staff.
We calculated an average of the values estimated by each college
for each category.The results for teaching staff are shown in Chart
25. Across the sector as a whole, respondents considered that 77%
of staff were competent or advanced in their personal use of ICT,compared with 67% in 2000. However, in the use of ICT with
learners, only 59% of college staff were considered competent or
advanced (in 2000 the figure was 42%).This suggests that a little
under one-fifth of staff considered competent or advanced in their
personal use of ICT were regarded as low-skilled in the application
of ICT with learners.However, the trend for both sets of skills has
been upward,as shown in Chart 26.The gap between ICT
competence and e-learning competence narrowed between
2000 and 2003, but has remained more or less constant since.
6.6 Staff development activities
We asked respondents to identify the mode of delivery of variousICT development opportunities offered to teaching staff at their
college.The results are shown in Chart 27 below.Face-to-face
delivery was by far the most common method of delivering staff
development to teaching staff. Blended learning solutions were
the next most commonly deployed, with self-study options
(either electronic or paper-based) offered by a smaller, though
still significant number of colleges.
Generic ICT skills, along with training in particular packages or
applications, were the most widely offered areas for skills
development, offered by 99% of colleges.These are the skills
necessary to build baseline competence and confidence in the
personal use of ICT,and are widely addressed in colleges.
However,over 90% of colleges offer some developmentopportunities in using classroom technologies and learning platforms, and in
developing learning materials.These skills can be readily deployed with learners in a
college setting. The skills needed for teaching online were offered far less widely, with
almost one-third of colleges (32%) not offering development in this area. The colleges
not offering this development were not restricted to those that did not offer remote
learning programmes, but were spread across the whole sector.
Chart 25 Teaching staff’s ICT and e-learning competence
P e r c e n t a g e o f s t a f f
ICT skills 23% 55% 22%
E-learning skills 42% 41% 18%
Chart 26 Teaching staff considered competent and advanced
at ITC/e-learning
P e r c e n t a g e o f s t a f f
ICT skills 67% 70% 73% 75% 77%
E-learning skills 42% 48% 56% 56% 59%
Beginner Competent Advanced
2000 2001 2003 2004 2005

8/8/2019 2005 ICT in FE Report
http://slidepdf.com/reader/full/2005-ict-in-fe-report 27/40
25
Colleges were somewhat less likely to offer ICT development
programmes to managers than to teaching staff (see Chart 28).
Again, development activities that address baseline ICT
competence and confidence were offered to managers in almost
all colleges. However,around one in eight colleges did not offer
manager development in using ICT for financial control or for
planning, and over one-fifth of colleges did not offer manager
development in using ICT for quality assessment.
Managers are a notoriously difficult cadre to train across many
sectors of the economy. Colleges may then be no different toother organisations, with managers either being reluctant to
undergo training, or regarding use of ICT as a specialist
technical role.
Chart 27 ICT skills development offered to teaching staff
Generic skills
Using particular packages
Using classroom technology
Using learning platform
Developing materials
Teaching online
Gener ic U sing Us ing Us ing Deve loping Teachi ngskil ls particular classroom learning materials online
packages technology platform
Face-to-face courses 72% 73% 79% 73% 72% 51%
Blended learning 52% 50% 39% 33% 36% 25%
Self study 26% 28% 23% 28% 22% 12%
Not offered 1% 1% 2% 8% 6% 32%
Chart 28 ICT skills development offered to managers
Generic skills
Using particular packages
Using ICT for planning
Using ICT for quality assessment
Using ICT for finance
Generic Using Using Using ICT Using ICT ski ll s particular ICT for for quali ty for f inance
packages planning assessment
Face-to-face courses 62% 70% 60% 52% 62%
Blended learning 48% 44% 33% 26% 28%
Self study 20% 21% 7% 8% 7%
Not offered 4% 1% 13% 21% 12%
Percentage of colleges
Percentage of colleges

8/8/2019 2005 ICT in FE Report
http://slidepdf.com/reader/full/2005-ict-in-fe-report 28/40
26
8/8/2019 2005 ICT in FE Report
http://slidepdf.com/reader/full/2005-ict-in-fe-report 29/40
27
Policy and strategy
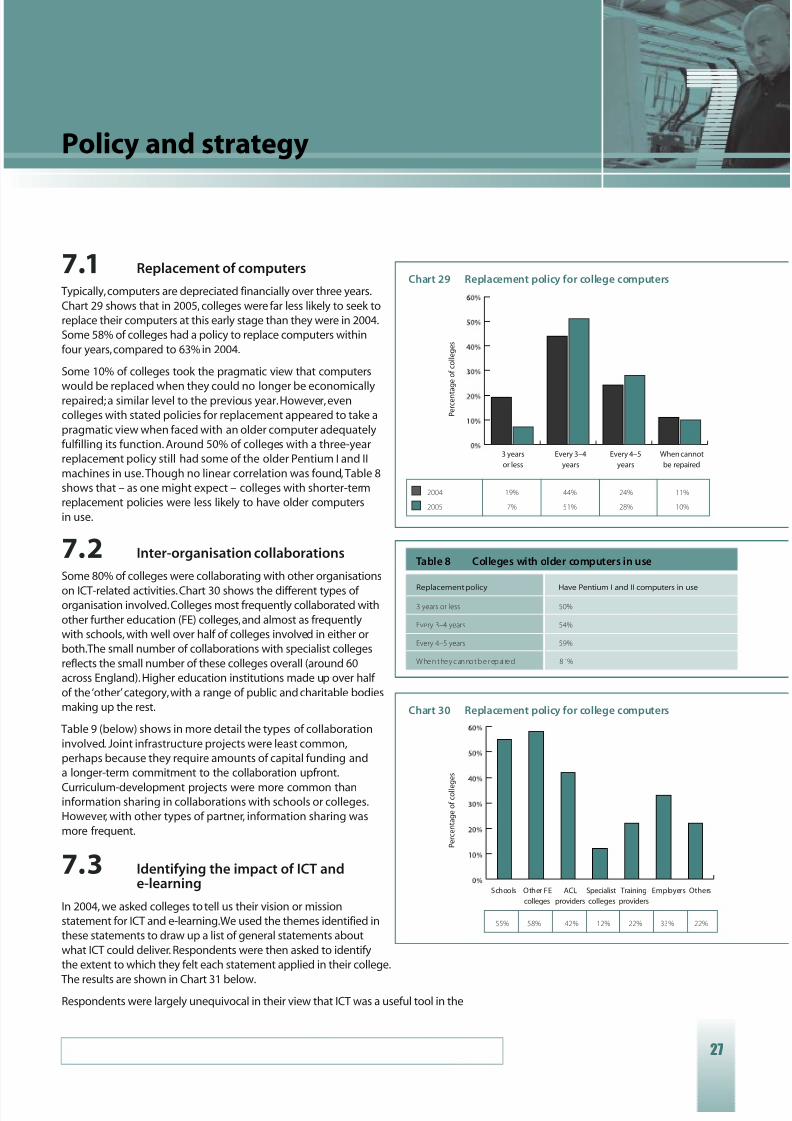
7.1 Replacement of computers
Typically,computers are depreciated financially over three years.
Chart 29 shows that in 2005, colleges were far less likely to seek to
replace their computers at this early stage than they were in 2004.
Some 58% of colleges had a policy to replace computers within
four years,compared to 63% in 2004.
Some 10% of colleges took the pragmatic view that computers
would be replaced when they could no longer be economically
repaired;a similar level to the previous year.However,even
colleges with stated policies for replacement appeared to take a
pragmatic view when faced with an older computer adequately
fulfilling its function. Around 50% of colleges with a three-year
replacement policy still had some of the older Pentium I and II
machines in use.Though no linear correlation was found, Table 8
shows that – as one might expect – colleges with shorter-term
replacement policies were less likely to have older computers
in use.
7.2 Inter-organisation collaborations
Some 80% of colleges were collaborating with other organisations
on ICT-related activities.Chart 30 shows the different types of organisation involved.Colleges most frequently collaborated with
other further education (FE) colleges,and almost as frequently
with schools, with well over half of colleges involved in either or
both.The small number of collaborations with specialist colleges
reflects the small number of these colleges overall (around 60
across England). Higher education institutions made up over half
of the ‘other’category,with a range of public and charitable bodies
making up the rest.
Table 9 (below) shows in more detail the types of collaboration
involved. Joint infrastructure projects were least common,
perhaps because they require amounts of capital funding and
a longer-term commitment to the collaboration upfront.
Curriculum-development projects were more common thaninformation sharing in collaborations with schools or colleges.
However, with other types of partner, information sharing was
more frequent.
7.3 Identifying the impact of ICT ande-learning
In 2004, we asked colleges to tell us their vision or mission
statement for ICT and e-learning.We used the themes identified in
these statements to draw up a list of general statements about
what ICT could deliver. Respondents were then asked to identify
the extent to which they felt each statement applied in their college.
The results are shown in Chart 31 below.Respondents were largely unequivocal in their view that ICT was a useful tool in the
Table 8 Colleges with older computers in use
Have Pentium I and II computers in useReplacement policy
3 years or less 50%
Every 3–4 years 54%
Every 4–5 years 59%
When they cannot be repai red 81%
P e r c e n t a g e o f c o l l e g e s
2004 19% 44% 24% 11%
2005 7% 51% 28% 10%
Chart 29 Replacement policy for college computers
3 years
or less
Every 3–4
years
Every 4–5
years
When cannot
be repaired
P e r c e n t a g e o f c o l l e g e s
55% 58% 42% 12% 22% 33% 22%
Chart 30 Replacement policy for college computers
Schools Other FE
colleges
ACL
providers
Specialist
colleges
Training
providers
Employers Others

8/8/2019 2005 ICT in FE Report
http://slidepdf.com/reader/full/2005-ict-in-fe-report 30/40
teaching and learning process.Some 60% agreed that ICT was a
great deal of help in giving students a useful set of skills, and 60%
agreed that it was a great deal of help as a support tool for
teachers.These results are unsurprising.The link between ICT use
and its outcome is relatively easy to recognise, as ICT use impacts
here directly on its users.
The next five statements related to the general operation of the
college.These were that ICT enabled more effective teaching,that
it enabled managers to plan effectively, that it enabled planning
for inspection, that it enabled students to learn more effectively,and that it enabled the college to implement change. Respondents
were still largely confident about the ability of ICT to deliver these.
However, fewer (between 34% and 44%) thought that ICT was a
great deal of help.
Respondents were far more equivocal about the final three
statements.These related to the overall strategic direction of the
college and the sector as a whole.These statements were that ICT
allowed the college to attract a broader range of students, that it
motivated students to stay on at the college, and that students
who use ICT achieve better results. Far fewer respondents agreed
that ICT was a great deal of help with these (between 11% and
21%), and up to half of respondents felt that either ICT did not help
here or that it only may help.
For these more strategic outcomes,the impact of ICT use is
necessarily indirect. It is therefore harder for practitioners to
recognise any potential impact.This may be especially true for
those directly involved in ICT use.
7.4 A strategy for ICT and e-learning
In summer 2000, the then Further Education Funding Council
(FEFC) required colleges to submit for monitoring an ILT strategy,
and the following year colleges were required to revise their
strategies.However, in 2004,3% of colleges reported to
PricewaterhouseCoopers (PwC) that they had no strategy for ICT
and e-learning,and a further 5% reported that they only had aninformal strategy (PwC, 2004).
A key way that colleges translate their strategies into action is
through setting targets.Some 29% of colleges set formal targets
for the use of ICT and e-learning across all programmes.A further
43% set targets where they considered these appropriate,and 25%
did not set targets for ICT and e-learning at all.Chart 32 shows that
this situation has steadily worsened since 2003, further suggesting
a dislocation between strategy and action in many colleges.
A written strategy,if it is not translated into action,quickly
becomes a dead document.If we are asked to describe an
organisation’s strategy,we look to its actions, rather than to the
document on the Chief Executive’s desk.Strategy, says Henry Mintzberg, is ‘a pattern inaction over time’(Mintzberg,1987).
28
Table 9 Types of ICT collaboration with other organisations
Partner organisations Joint curriculum Joint infrastructure Data/information
development development sharing
Schools 39% 9% 34%
Other FE colleges 42% 10% 37%
Adult and community 24% 9% 26%learning providers
Specialist colleges 5% 1% 9%
Training providers 9% 4% 15%
Employers 16% 5% 21%
Others 13% 8% 14%
Chart 31 What does ICT deliver?
I C T d o e s n ’ t d e l i v e r t h i s
I C T m a y h e l p w i t h t h i s
I C T i s s o m e h e l p w i t h t h i s
I C T i s a g r e a t d e a l o f h e l p w i t h t h i s
0% 2% 37% 60% Usefulsupport tool
0% 7% 32% 60% Useful skillsfor students
1% 4% 50% 44% Enables effectiveteaching
1% 10% 45% 42% Enables effectiveplanning
Enables1% 9% 51% 37% inspection
preparation
1% 7% 56% 35% Facilitateseffective learning
2% 10% 52% 34% Facilitateschange
Attracts a6% 35% 37% 21% broader range
of students
Motivates6% 44% 36% 12% students
to stay on
Students3% 40% 43% 11% achieve
better results
Percentage of colleges

8/8/2019 2005 ICT in FE Report
http://slidepdf.com/reader/full/2005-ict-in-fe-report 31/40
7.5 A model of e-learning implementation
In order to build a picture of e-learning implementation,we
constructed a model consisting of five broad dimensions.Each of
these dimensions was arrived at by combining four measures
derived from the survey data.All the measures were treated
equally.Each dimension produced a score out of 20,and when
added together, these dimensions gave an overall score out of 100
for each college.The dimensions were:
Access: This dimension describes students’access to the college
infrastructure.The measures of access consist of:
• A college’s nearness to achieving a ratio of five full-time-
equivalent (FTE) students to each internet-enabled computer.
• A college’s capacity to meet students’demands for computers.
• The capacity of a college’s local area network (LAN) to
meet demand.
• A college’s capacity to meet students’demands for internet access.
Workforce: This dimension describes the skills of the teaching staff and their ability to
access ICT for their work.The measures for this dimension are:
• A college’s nearness to achieving a ratio of one permanent member of staff to
each internet-enabled computer.
• The extent to which staff having a computer for their own personal use is seen as
a priority.
• Perceived skills of teaching staff in their personal use of ICT.
• Perceived skills of teaching staff in using ICT with learners.
E-learning: This dimension describes the extent to which ICT is deployed for teaching and
learning purposes.This is measured by:
• The extent to which e-learning is used for induction.
• The extent to which e-learning is used for assessment.
• The extent to which e-learning is used for teaching purposes.
• The extent to which e-learning is used to support learners.
Resources: This dimension describes a college’s ability to access, produce and deliver
educational content.The measures here are:
• Use of in-house-developed resources.
• Support for in-house development of resources.
• Use of acquired resources from a variety of sources.
• Use of a Virtual Learning Environment (VLE) learning platform.
29
Chart 32 Extent to which formal targets are set for e-learning
P e r c e n t a g e o f c o l l e g e s
All programmes 34% 32% 29%
Where appropriate 46% 44% 43%
No targets 16% 22% 25%
2003 2004 2005
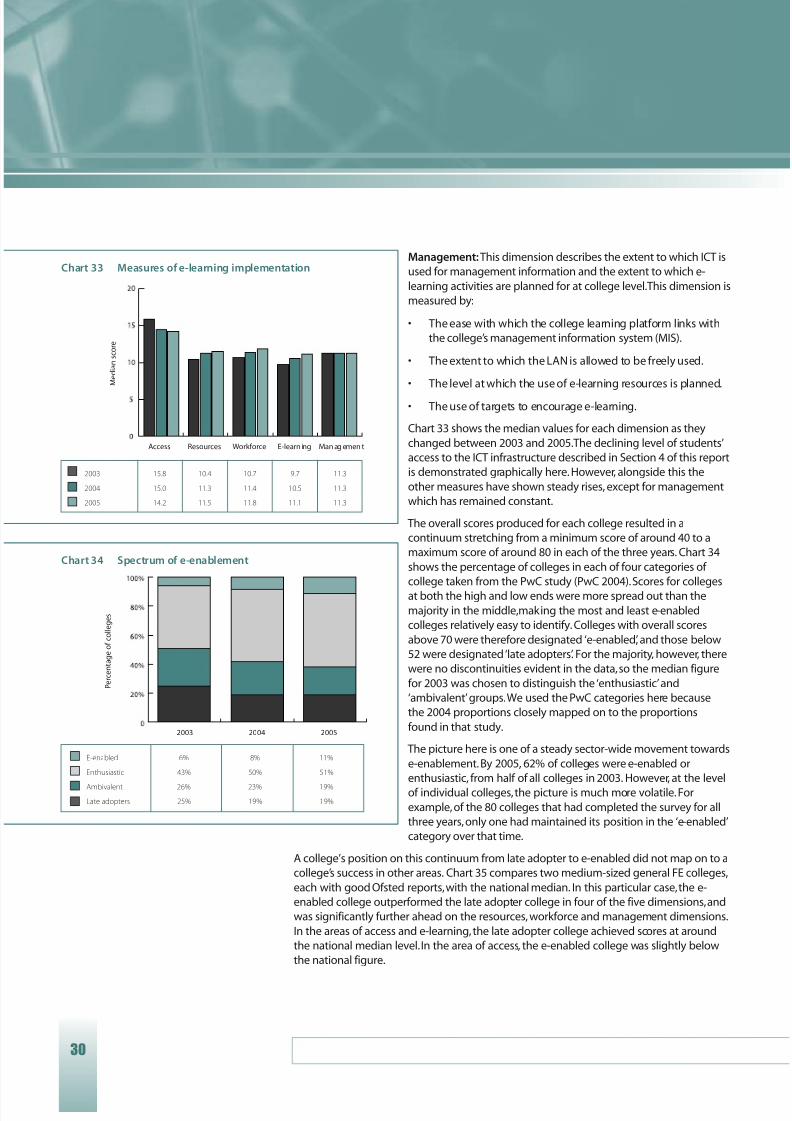
8/8/2019 2005 ICT in FE Report
http://slidepdf.com/reader/full/2005-ict-in-fe-report 32/40
Management: This dimension describes the extent to which ICT is
used for management information and the extent to which e-
learning activities are planned for at college level.This dimension is
measured by:
• The ease with which the college learning platform links with
the college’s management information system (MIS).
• The extent to which the LAN is allowed to be freely used.
• The level at which the use of e-learning resources is planned.
• The use of targets to encourage e-learning.
Chart 33 shows the median values for each dimension as they
changed between 2003 and 2005.The declining level of students’
access to the ICT infrastructure described in Section 4 of this report
is demonstrated graphically here. However, alongside this the
other measures have shown steady rises, except for management
which has remained constant.
The overall scores produced for each college resulted in a
continuum stretching from a minimum score of around 40 to a
maximum score of around 80 in each of the three years. Chart 34
shows the percentage of colleges in each of four categories of
college taken from the PwC study (PwC 2004).Scores for colleges
at both the high and low ends were more spread out than the
majority in the middle,making the most and least e-enabled
colleges relatively easy to identify. Colleges with overall scores
above 70 were therefore designated ‘e-enabled’, and those below
52 were designated ‘late adopters’. For the majority, however, there
were no discontinuities evident in the data,so the median figure
for 2003 was chosen to distinguish the ‘enthusiastic’and
‘ambivalent’groups.We used the PwC categories here because
the 2004 proportions closely mapped on to the proportions
found in that study.
The picture here is one of a steady sector-wide movement towards
e-enablement.By 2005, 62% of colleges were e-enabled or
enthusiastic, from half of all colleges in 2003. However, at the level
of individual colleges,the picture is much more volatile.For
example,of the 80 colleges that had completed the survey for all
three years,only one had maintained its position in the ‘e-enabled’
category over that time.
A college’s position on this continuum from late adopter to e-enabled did not map on to a
college’s success in other areas. Chart 35 compares two medium-sized general FE colleges,
each with good Ofsted reports,with the national median. In this particular case,the e-
enabled college outperformed the late adopter college in four of the five dimensions,and
was significantly further ahead on the resources, workforce and management dimensions.
In the areas of access and e-learning,the late adopter college achieved scores at around
the national median level.In the area of access, the e-enabled college was slightly below
the national figure.
30
M e d i a n s c o r e
Chart 33 Measures of e-learning implementation
2003 15.8 10.4 10.7 9.7 11.3
2004 15.0 11.3 11.4 10.5 11.3
2005 14.2 11.5 11.8 11.1 11.3
Access Resources Workforce E-learn ing Man ag emen t
Chart 34 Spectrum of e-enablement
P e r c e n t a g e o f c o l l e g e s
E-enabled 6% 8% 11%
Enthusiastic 43% 50% 51%
Ambivalent 26% 23% 19%
Late adopters 25% 19% 19%
2003 2004 2005

8/8/2019 2005 ICT in FE Report
http://slidepdf.com/reader/full/2005-ict-in-fe-report 33/40
31
As e-learning is the only dimension on the output side of the
equation, it seems that a reasonable level of e-learning output
can be achieved with limited levels of input in the other four
dimensions.The late adopter college seems to have drawn here on
the energies of a group of enthusiasts who have achieved results
with minimal resources, training or management input.On the
other hand,the e-enabled college has deployed significant
resources and management input.It has moved e-learning on
significantly, though there is still some way to go.
Chart 36 compares the median scores for each dimension of e-learning implementation for colleges that fall within each
category.An interesting pattern emerges.As we move from
late adopters through to e-enabled colleges, the greatest
improvements occur in the resources and management
dimensions. Students’access to ICT shows the least
improvement between the categories of college.
The pattern emerging here suggests a model describing
how these dimensions act together to drive forward the
implementation of e-learning. Students’access to a reasonably
robust infrastructure is the foundation upon which this is built.
This allows access to electronic resources for students and staff.
Even limited resources,taken up by individual enthusiasts,can
begin to produce e-learning. However, if e-learning is to be widelyimplemented,management time has to be committed to facilitate
access, and to plan and set targets,and information has to flow
from the teaching and learning process to the management
process.Teaching staff also need access to the technology,along
with improved competence and confidence in order to engage
with e-learning as well as develop their own resources. It is once
these are all in place that e-learning can be widely implemented
and can begin to transform teaching and learning.
S c o r e
Chart 35 Comparison of two colleges
Late adopter college 14.2 5.4 7.3 11.2 6.3
E-enabled college 13.3 17.1 11.3 12.1 16.3
National median 14.2 11.7 11.8 11.2 11.3
Ac cess Resources Workforce E -learning Management
M e d i a n s c o r e
Access 13.3 13.8 14.6 15.0
Resources 6.7 10.4 12.5 15.8
Workforce 10.0 10.5 12.1 13.6
E-learning 8.3 10.6 11.4 13.3
Management 6.7 9.9 12.5 16.3
Chart 36 Categories of e-enablement vs dimensions
Late adopters Ambivilent Enthusiastic E-enabled

8/8/2019 2005 ICT in FE Report
http://slidepdf.com/reader/full/2005-ict-in-fe-report 34/40
32

8/8/2019 2005 ICT in FE Report
http://slidepdf.com/reader/full/2005-ict-in-fe-report 35/40
8.1 Difficulties in identifying ICT expenditure
Colleges found the expenditure survey difficult – identifying particular items of
expenditure with particular funding streams proved a daunting task.For most colleges,
once funding has been received it is subsumed within the overall budget, and unless
tracking back is a specific requirement, it can prove to be very difficult. As a result,the
response rate of 68 colleges (17% of the sector) was disappointingly low for this section.
ICT-related direct staffing costs proved especially problematic. Several colleges found the
task of extricating ICT-related staff costs from the overall staff budget impossible, and
therefore left the field blank.Others argued that because ICT was the responsibility of
everyone within the college,it was only a marginal element of the staffing budget anyway.
The figure for staff with ICT as a key element of their role was therefore so problematic we
left it out of the analysis. It is, however, worth remembering that staffing is a necessary and
not an insignificant part of the cost of any investment in ICT.
Some £27 million of National Learning Network (NLN) funding was allocated to colleges.
This could be spent in the two years to July 2005.This amount is roughly one-third of all
earmarked funding for ICT and e-learning in colleges.More than half of this allocation
was targeted at the development of locally produced materials, development tools for
producing materials,plus procurement of and subscription to externally produced
materials.
The NLN and Learning and Skills Council (LSC) were by far the most frequently cited
sources of funding.Other funding sources included LEAs, regional development agencies,the Standards Fund and Single Regeneration Budget, and other European funding sources.
Numbers of full-time-equivalent (FTE) students are the key determinant of college funding
and costs, therefore we assumed that ICT expenditure would increase broadly in line with
college size.The expenditure figures for the sector, shown in Table 10, were calculated by
weighting the survey responses according to the college size bands given in Table 3 of
this report.
The small sample size, taken along with the assumptions underlying our calculations,
mean that the expenditure figures presented in this section are indicative only.They
present a broad picture of the general scale of expenditure and the relative amounts
spent under particular categories.They do not in any way present an auditable ‘account’.
8.2 The pattern of ICT expenditure
The total figure for ICT expenditure of £232 million for the year 2003-4 translates to 6%
of the total allocation to the college sector of £4 billon in that year.Excluding the £17.4
million training expenditure brings this percentage to around 5%. Chart 37 shows the
relative total expenditure figures collected this year for the year 2003-4, along with
projected budget figures for 2004-5.These are compared to figures for 2001-2, which
were collected as part of the 2003 survey.
Expenditure on hardware continued to dominate the picture, accounting for more than
the sum of expenditure on the other three items (major systems,software and staff
training). Colleges budgeted less for major systems in 2004-5 than the expenditure in
2003-4. Apart from this,all totals show continuing increases over time.The more detailed
figures presented in Table 10 show that as these totals increased, the proportions spent on
systems, hardware,software and training remained broadly the same.
33
Expenditure on ICT and e-learning

8/8/2019 2005 ICT in FE Report
http://slidepdf.com/reader/full/2005-ict-in-fe-report 36/40
Colleges increasingly relied on their own general budgets for ICT
spend. Around three-quarters of the total expenditure in 2001-2
came from the general budget, but by 2004-5 this percentage had
increased to 87%.This is a trend that looks set to continue.
Earmarked funding accounted for a large proportion of training
expenditure in 2001-2.Most of this amount was Standards Fund
monies, a fund that required matched funding from recipients.
Since that time,the Standards Fund has ceased to be a source of
earmarked funds for training, and additional funding has been
added to the general college allocation.The figures presentedhere show that ICT-related training has continued within colleges
despite the disappearance of this fund.There was a significant
increase in earmarked funding for software and learning materials
in 2004-5.This was caused by the targeting of NLN monies in this
area mentioned above.
34
£ m i l l i o n s
2001 – 2 expenditure 25.3 87.1 29.7 13.1
2003 – 4 expenditure 47.1 124.4 43.1 17.4
2004 – 5 budget 38.7 139.1 54.9 18.4
Chart 37 ICT expenditure over time
Major systems Hardware Software Staff training

8/8/2019 2005 ICT in FE Report
http://slidepdf.com/reader/full/2005-ict-in-fe-report 37/40
2001-2 expenditure 2003-4 expenditure 2004-5 budgeted expenditure
College Earmarked Totals College Earmarked Totals College Earmarked Totals
Major information systems
Student records 11.4 0.7 12.1 23.2 7.8 31.0 19.1 0.5 19.6
Human resources 2.2 0.3 2.5 4.0 0.3 4.3 9.3 0.3 9.6
Finance 4.5 0.3 4.8 7.0 0.3 7.3 5.0 0.3 5.3
Other 4.1 1.9 5.9 3.8 0.6 4.5 4.1 0.0 4.1
Total info systems 22.2 3.2 25.3 16% 38.1 9.0 47.1 20% 37.6 1.1 38.7 15%
88% 12% 81% 19% 97% 3%
Hardware
Classroom equipment 38.0 16.4 54.3 64.8 19.1 83.9 69.4 13.1 82.5
Learning resource centre
(LRC) equipment 6.5 2.7 9.2 9.2 3.3 12.5 12.3 2.0 14.3
Other 16.7 6.9 23.6 23.9 4.0 27.9 37.8 4.5 42.3
Total hardware 61.1 26.0 87.1 56% 98.0 26.3 124.4 54% 119.5 19.6 139.1 55%
70% 30% 79% 21% 86% 14%
SoftwareExternally produced
learning materials 1.5 0.9 2.4 3.5 1.1 4.6 4.6 2.3 6.9
Internally produced learning materials 2.9 3.5 6.4 4.1 1.3 5.4 6.0 4.7 10.7
Learning management
software 3.4 1.9 5.4 5.6 1.1 6.7 4.7 0.9 5.6
LCR software and licences 2.2 0.5 2.8 3.9 0.6 4.6 4.7 0.7 5.4
Other software and licences 11.5 1.2 12.7 20.3 1.6 21.9 22.4 3.9 26.3
Total software 21.6 8.1 29.7 19% 37.4 5.7 43.1 19% 42.4 12.5 54.9 22%
73% 27% 87% 13% 77% 23%
Technical support training
Technician training 0.7 0.9 1.6 1.5 0.1 1.6 1.8 0.1 1.9
Externally provided training 0.9 0.6 1.5 1.5 0.0 1.5 2.2 0.0 2.2
Training staff costs 0.9 0.6 1.5 2.8 0.0 2.8 1.7 0.0 1.7
Total technical support training 2.5 2.1 4.7 3% 5.9 0.1 6.0 3% 5.6 0.1 5.7 2%
55% 45% 98% 2% 98% 2%
Staff ICT/e-learning training
Externally provided training 1.6 1.2 2.8 3.5 0.1 3.6 3.7 0.1 3.8
Training staff costs 3.6 2.1 5.7 7.6 0.2 7.8 8.7 0.2 8.9
Total staff ICT training 5.2 3.3 8.5 5% 11.1 0.3 11.4 5% 12.4 0.3 12.7 5%
62% 38% 98% 2% 97% 3%
Totals 112.7 42.6 155.3 190.5 41.4 231.9 217.4 33.7 251.1
73% 27% 82% 18% 87% 13%
35
Table 10 ICT expenditure in further education (£ millions)

8/8/2019 2005 ICT in FE Report
http://slidepdf.com/reader/full/2005-ict-in-fe-report 38/40
36
References and bibliography
Becta (1999) Survey into information and learning technology provision, access and
policy in FE colleges in England , a report to the Further Education ILT Committee.
Coventry, Becta.
Becta (2000) Further education in transition, a report to the Further Education ILT
Committee of a survey into information and learning technology provision, access and
policy in FE colleges in England. Coventry, Becta.
Becta (2001) The state of ILT in FE colleges, a report to the National Learning Network
Programme Board on a survey into information and learning technology (ILT) provision,
access and policy in FE colleges in England, with additional information drawn from
updated college strategies. Coventry, Becta.
Becta (2001) Producing a college ILT strategy . Coventry, Becta.
Becta (2002) Managing inspection and ILT . Coventry, Becta.
Becta (2003) ILT in further education: laying the foundations for e-learning, a report to
the National Learning Network Transformation Board. Coventry, Becta.
Becta (2004) ICT and e-learning in further education: embedded technology, evolving
practice, a report to the Learning and Skills Council. Coventry, Becta.
Mintzberg, H. (1987) Crafting strategy, Harvard Business Review, July/August .
Powell, B. and Minshull, G. (2004) Choosing and using a learning platform in Adult and Community Learning, JISC/NIACE.
PwC (2004) Moving towards e-learning in schools and FE colleges: models of resource
planning at the institution level . London,DfES.

8/8/2019 2005 ICT in FE Report
http://slidepdf.com/reader/full/2005-ict-in-fe-report 39/40

8/8/2019 2005 ICT in FE Report
http://slidepdf.com/reader/full/2005-ict-in-fe-report 40/40
Millburn Hill Road
Science Park
Coventry CV4 7JJ
Tel: 024 7641 6994
Fax:024 7641 1418
Email: [email protected]
URL: http://www.becta.org.uk
ISBN 1 85379 463 5