Embed Size (px)
Citation preview

PART 1: FRICTION OF CARBONS
FRICTION DATA AT VARIOUS SCALES
K. Lafdi and K.M. Teo
1. University of Dayton, 300 College Park, Dayton, OH. 45469-0168 2. AFRL/MLBC, WPAFB, OH. 45433-7750
1. L ITERATURE REVIEW Carbon-carbon composites are used for braking material because of their exceptional
properties. Carbon fibers offer high specific stiffness and high thermal diffusivity along the fiber axis. The main advantage of carbon fiber composite brakes is the stability of its structure at high temperatures. Design and engineering of carbon brakes were briefly discussed in the literature [1]. Until today, production of carbon-carbon composite brakes remains costly and very time consuming.
When two carbon materials are rubbed together, friction transitions have been observed in which the value of the friction coefficient changes drastically. From the database of numerous works on the variation of coefficient of friction with time, friction transitions were subdivided into eight commonly observed transitions in friction coefficient [2]. Commonly, variation of friction coefficient is divided into three regions: run-in, mild wear and transition to severe wear. Models have been developed that predict the friction coefficient as a function of time including the transition using four terms: lubrication factor, deformation factor, transition factor and friction variable factor [3]. This model has been found very useful in predicting the run-in time of a bearing surface and checking the reproducibility of a surface contact condition [4]. Friction transitions of various types were also reported [5].
Some models have successfully predicted the average friction coefficient. However, the term average friction coefficient is very misleading because of the presence of friction transitions. Asperity models based on mechanical deformation have also been developed, but many friction details are neglected such as the effect of debris, material compositions and other reactions on the surface. A model that relates friction coefficient to asperity properties, shear stresses and microstructures was reported but was not sufficient to cover the actual sliding conditions [6]. Transition phenomena at the surface have been described as accumulation of subsurface fatigue damage, wear-through of surface film, build-up of transfer layers, agglomeration of debris and change of material properties [2]. Blau also mentioned that the magnitude of the friction coefficient during transition is proportional to the introduction of debris.
Many experiments have also been performed to study the effects of load and speed on the wear and friction behavior. Friction transitions were found dependent on sliding energy [7]. In some hybrid materials, friction transitions were influenced by the formation and the breakdown of the oxide layer on the friction surface [8-11]. It was suggested that the studies of the structure of oxide films, their formation dynamics and influencing factors are the way to understand friction mechanisms and wear [7].
Some components of the atmosphere (humidity and oxygen) are believed to affect the friction and wear process severely. In addition, contaminants may also affect the wear process [12]. It was first encountered in the late 1930s when graphite commutator

brushes in aircraft experienced this accelerated wear phenomenon at high altitude because of the lack of water vapor in the atmosphere [12]. Water vapor appears to have a lubrication effect on nongraphitic carbon too [13]. Regardless of the lattice orders or crystalline perfection of carbon materials, friction properties can be altered by gas and vapor environments.
It was found later that the friction coefficient of graphite remained low only in the presence of water or other condensable vapors [14-16]. Indeed, the friction coefficient of carbon was shown 10 times higher at vacuum condition. Therefore, the low coefficient of graphite may not be intrinsic. It was reported that in the vacuum condition, the interlaminar bonding (crosslinking) of graphite is high [17]. This interlaminar bonding decreased in the presence of air or water. It was suggested that water might reduce the binding energy of graphite by bonding with the available electrons. The lubrication properties of graphite increase when moisture is absorbed between the carbon basal planes. A similar effect but offered an alternative mechanism [18]. It was suggested that water or oxygen might intercalate between the carbon basal planes and reduce the pi electron bonding. Interaction is the ordered bonding of oxygen or water molecules between the carbon basal planes. However, other works showed that there was no increase in d-spacing, which would be expected if intercalation had occurred [19]. Studies on surfaces of carbon-carbon composites during high-energy friction testing found two types of surface morphology: a dull-looking gray surface and mirrorlike black surface, which were ascribed to contact pressure alterations [20]. The contact pressure is higher in the gray area, which leads to a rougher surface without continuous wear debris film coverage. It was also concluded that these contact pressure differences are caused by nonuniform thermal expansion due to frictional heating. It was found that friction and wear decrease with increasing temperature to 950°C due to chemisorption of impurities to form lubricating film and to oxidation [21].
Interaction between frictional heating, thermal distortion and contact mechanism may cause the development of nonuniform contact pressure and thermal instability [22]. The generation of hot spots on the friction surface may cause material degradation and thermal stress failure. The effect of load and speed on the maximum surface temperature was discussed [22]. They reported that an increase in speed might cause a reduction of contact area and hence increase the hot spotting temperature. It was found that in most braking systems, the periodic heating and loading of brakes would influence thermal and contact stress fields differently.
The overall goal of this part is to provide a friction performance of homogenous carbon-carbon composites (made of compacted carbon particulates) at various scales (pin-on-disk and subscale dynamometer). The role of friction film and friction surface would be considered.
2. EXPERIMENTAL PROCEDURES A sintered carbon-carbon composite was prepared for all friction tests. The carbon
composites have been made of compacted anisotropic coke and bonded with phenolic resins. The samples are fabricated in the cylindrical mold in which pressure is applied. After hot pressing, the materials were carbonized in flowing N2 gas at 1000°C. Graphitization was performed by raising the furnace temperature 4°C per minute until

2200°C was reached. The furnace was held at this temperature for 30 minutes. The samples used in these tests were of relatively high density.
The carbon as compacted carbon composite particulates may be considered as a cocktail of graphitic (basically made of sp2 hybrids) and nongraphitic (turbostratic carbon which includes a small amount of sp3) [23, 24]. Sp2 carbon materials generally exhibit relatively low friction and good wear resistance under most conditions; this characteristic makes them suitable for various tribological applications ranging from dry lubrication to protective coating for magnetic disks.
The friction tests were performed at two different scales. Primarily, pin-on-disk friction tests were performed using a standard test machine [friction assessment screening test (FAST)]. All samples were tested for 90 minutes under various constant frictional forces in which only the rotational velocity was varied. The temperature profile of the entire test period has been recorded using a K-type thermocouple. The thermocouple was placed at the middle of the sample at 2.5 mm from the sliding surface. In situ video capturing of surface evolutions and visual examinations were also conducted to understand the development of the friction film and its relationship to friction transition. Secondary, subscale disk-on-disk friction tests were performed using a subscale dynamometer. Two disks of 8.9-cm diameter were machined from the same carbon composites for each set of energy tested. Fifteen K-type thermocouples were embedded at various stator's locations. The disks' surfaces were inspected at each stop.
2.1 FAST The FAST machine (Figure 1) was developed by Ford Motor Company specifically for
rapid "fingerprinting" of friction material specimens. The essential elements include a sample arm, which clamps against a rotating cast iron disk. This disk is attached through an insulated hub to the shaft of a 900-rpm, 1-hp induction motor. The disk is 7 inches in diameter and 1.5 inches thick, and is designed so that either surface may be used. The design of the attachment also allows for the quick changing of disks. However, in this study the machine setup was modified to accommodate a 6-in. carbon rotor disk.
The lining sample mounts in a recess near the free end of the pivoted sample arm. The clamping load is applied by hydraulic pressure acting on a rolling diaphragm load cell. The connection between the clamping assembly and the sample arm is through a flexible tension member, and the load system is designed to reduce hysteresis and run-out. The load control system incorporates a control valve assembly, which allows tests to be performed either at constant friction force (output) or constant friction clamping load (input).
The friction force is transmitted directly to the friction valve spool. In the constant output mode, any variation of the friction force results in a displacement of the clamping valve spool. The pressure automatically adjusts to re-establish the original equilibrium. The magnitude of the friction force may be selected by means of the load control screw. In the constant friction force mode, the clamping pressure is controlled to change at a rate inversely proportional to the change of friction coefficient. Thus, the recorder produces a plot of the reciprocal of the friction coefficient versus time. To avoid recording high-
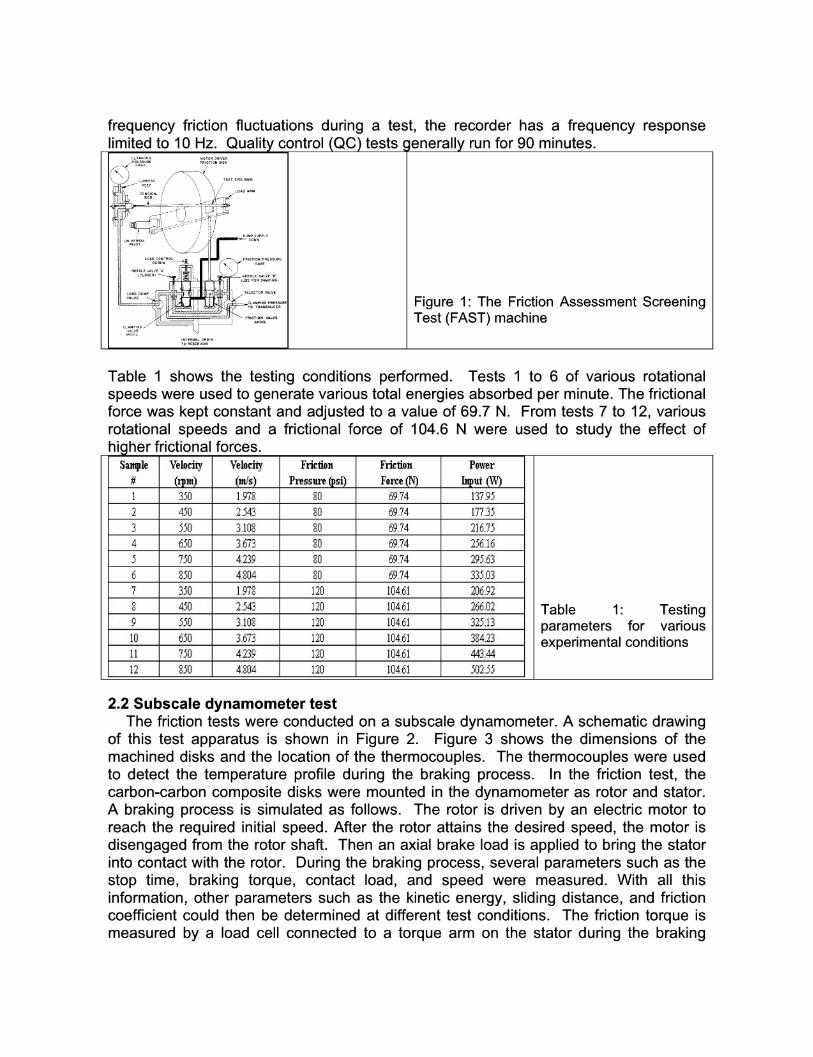
frequency friction fluctuations during a test, the recorder has a frequency response limited to 10 Hz. Quality control (QC) tests c, tenerally run for 90 minutes.
CL~MPING MOTOR ORLVEN " I~ EASq~EU . . . . . . . . . . . . . .
t . . . . . . . . ii
Figure 1" The Friction Assessment Screening , , .... su .E
Test (FAST) machine
Table 1 shows the testing conditions performed. Tests 1 to 6 of various rotational speeds were used to generate various total energies absorbed per minute. The frictional force was kept constant and adjusted to a value of 69.7 N. From tests 7 to 12, various rotational speeds and a frictional force of 104.6 N were used to study the effect of hi her frictional forces.
¸
I: 350 2 4J0
4 650 J 750 6: gJO:
7 3J0 :4Jo ~50
6JO: I t 750 , :
~50
(~s) .... 197g 2:543 3:;I08 31673 41:239; 4 ~o4 1,97g 2::543 3 IOg 3,673 4 39 4.804:
Press~ ~si) ~0
1:20 i20 i2o 120 i20 17.0
r0,,°® 69.74 69,74 69.74 69,74 69,74 69:74 104.6I Io4.~i 104;61
104.61
io4.61
137,95 177,3J
256.16
33~:03 206:92:
37.J:13 39423 :443:44
Table 1" Testing parameters for various experimental conditions
2.2 $ubscale dynamometer test The friction tests were conducted on a subscale dynamometer. A schematic drawing
of this test apparatus is shown in Figure 2. Figure 3 shows the dimensions of the machined disks and the location of the thermocouples. The thermocouples were used to detect the temperature profile during the braking process. In the friction test, the carbon-carbon composite disks were mounted in the dynamometer as rotor and stator. A braking process is simulated as follows. The rotor is driven by an electric motor to reach the required initial speed. After the rotor attains the desired speed, the motor is disengaged from the rotor shaft. Then an axial brake load is applied to bring the stator into contact with the rotor. During the braking process, several parameters such as the stop time, braking torque, contact load, and speed were measured. With all this information, other parameters such as the kinetic energy, sliding distance, and friction coefficient could then be determined at different test conditions. The friction torque is measured by a load cell connected to a torque arm on the stator during the braking

process. In all tests the braking torque will be maintained constant as in the case of FAST. Any changes happening in the coefficient of friction will therefore cause a corresponding change in contact pressure such that the torque stays constant. The brake energy level can be adjusted by adding inertia plates (flywheels) to the rotor shaft or by altering the initial rotational velocity. Different environmental conditions can be achieved by enclosing the test specimens inside a Plexiglas TM chamber where the atmospheric conditions can be controlled.
Table 2 shows the testing conditions performed using the dynamometer. The initial speeds were increased to achieve different level of kinetic energies. The energy dissipation rate is determined by the braking torque and the stop time. The lowest energy and the highest energy conditions were used to simulate the taxi and service landing conditions of an aircraft, respectively. In real application, the braking torque applied to the brake during a landing condition is higher than the taxi condition, especially for rejected takeoff condition at which the aircraft has to be stopped for the shortest time.
Stator otorN l, iiiiiiiiiiiiiiiiiii!iiiiiiiiiiiiiiiiiii i liiiiiiiiiiiiiiiiiiiiiiiiiiiiiiiii iiiiiiiii """""""""' I ~ I = ....................................... Figure 2: Schematic of the subscale
Pneumatic Actuator ] D n v m g Motor dynamometer Closed Chamber Flywheels
120 ° - - - ~ 2.5cm~--- 3.9cm - -~ 2.5cm~1---
0.6 cm ! V t --K-
Top View - L 1.0 cm 2.5 cm - - Figure 3: Dimensions of the carbon- carbon composite disk pad
5859 1.95 6.4 37863 5.28 17.2 69869 7.21 23.5 181874 8.71 28.4 133159 18.88 32.6 165244 11.15 36.3
Table 2" Testing energy of the subscale dynamometer
However, in order to study the effect of increasing speed (initial energy) alone on the friction behavior of the material, the torque was therefore set as constant for all tests. There were a total of 15 thermocouples inserted into the stator pad. Thermocouples number 1 through 5 was inserted to the pad to measure the temperature history at the thickness direction. Each of these thermocouples was separated 3 mm apart, with the first thermocouple (TC#1)inserted 3 mm from the friction surface. Thermocouples number 6 through 15 were inserted into the stator pad at a distance 6 mm from the friction surface, but with different radial distances and directions. Each of these thermocouples was separated with a radial distance 1.25 mm and 10 degrees apart from each other, with thermocouple number 6 located 3.2 cm from the center of the

stator pad. These thermocouples were intended to record the temperature difference across the friction surface. A drawing showing the locations of all thermocouples is given in Figure 4.
T C #5
T C # l : : .....
T C # 6 ,:....,:..:~:::iiiiiiiii:: ' , . . . . . . . . . . . . .
/..'..'iiiiiiiiiiiiiiii .... ::~::::::::::::~:.. ......... ,,.'..~i~i~i~i~i~i~i~i~i~i~i~i~i~ .... " . . . . . .
. . . . . l l 0 °
~iiiiiiiiii#:: :,~ iiiiiiiiiiiiiiiiiiiiiiiii' iiiii !iiiiiiiiiiiiiiiiiiiiiiii~ :iiiiii~
" ~ ~ 6 m m T C
Figure 4: Locations of thermocouples inserted into the stator pad
3. RESULTS AND DISCUSSION Figure 5 shows the FAST results for the friction force of 69.7 N with various rotational
speeds. All curves clearly show the sudden changes in the friction coefficient. 0.7
Friction Coeff icient (Filtered) versus Time
0.6
0.5
¢ .2
u 0.4 o u
.2 0.3 u .= u.
0.2
0.1
0.0
- - 3 5 0 rpm : L ! / '~ i I ' ' ' " 450 rpm : ! ~ i i " i ~/7~, ' ' ~ ....... .!~ ,. , ; :, 550 rpm ii ~ !'t i i ! ! ~f ~!k i I : 1 t ' l l l i
....... 650 rpm 1] ~ i i ) i 1 / ! i l l - - 7 5 0 rpm ,j I! i i I i - - 8 5 0 rpm ] I i \ k ! / [ ~ '~'
Figure 5: FAST results for various power input conditions
0 1000 2000 3000 4000 5000 6000 Time (sec)
Depending on the testing conditions, the coefficient of friction profile as a function of time exhibits either single or multiple friction transitions (increase of coefficient of friction from the baseline).
Figure 6 shows a typical trend in friction coefficient during a friction transition. As shown in Figure 5, the coefficient of friction initially has a value o f -0 .2 and as the test progresses with time, the coefficient of friction decreases to a value of 0.16. It stabilizes for a short period at the point of 0.16. Then, the transition occurs and the coefficient of friction increases up to a value of 0.6. When the transition is over, the coefficient of friction begins to decrease. The same pattern may be repeated many times. At the beginning of the test, the bulk temperature (2.5 mm from the surface) increases rapidly from room temperature to a value of 200°C within few seconds during the run-in process (it depends on testing conditions; the rate of temperature increase can exceed 10°C/sec). Then, the temperature increases gradually at a rate of 0.05°C/sec. After that, it remains steady at about 290°C. However, at the first glance of the transition, a fast increase of bulk temperature is recorded with a rate between 0.2 and 0.45°C/sec. After the transition, the temperature continues to increase very slowly due to the gradual wear of the sample.

3
4 Figure6" A model illustrating multiple L_ stages of the coefficient of friction variation as
, a function of time Time
However, when the frictional force is 104 N and the speed is 650 rpm or higher, a hot spot is generated at the early stages of friction transition. The increase of the coefficient of friction is so fast and high (# > 1) until the test is suddenly stopped due to over- torque. The motor of our testing machine didn't have enough torque to carry out the entire test. The same experiment is repeated 11 times, and the hot spot is successfully regenerated in every trial. The duration of every hot spot is less than 10 seconds. In terms of temperature, at first glance of the transition, a fast increase in bulk temperature (2.5 mm from the surface)is recorded with a rate of temperature increase between 5 and 55°C/sec. This heating rate fluctuation depends on the power input absorbed by the sample and may be the surface finish of the friction films. The highest bulk temperature recorded is 550°C. We expect that the surface temperature must be much higher than 550°C.
Before each friction test, both the sample and the rotor disk surfaces are sanded using sandpaper up to a grid size of 800. For all experiments, the same surface finish is managed. Also, the surface profile is taken before and after each test. As shown in Figure 7, the surface of the sample before the friction test is relatively smooth with some visible voids.
As the friction test progressed, friction film was built up (stage 1). The details of the coke grains were masked. Visual examination shows that the entire friction surface
...... ...~i... .... ~;;...;...~i~ .~.
Figure 7: Images of the friction surface at different stages
At the first indication of the transition, the coefficient of friction starts to increase, and some surface alterations are observed (stage 2). As shown at low magnification, the

friction surface of the sample appears to be made of two distinct bands or wear tracks: one is shiny (i.e. smooth) with some relative waviness, and the second is dull with some random surface irregularity (i.e. rough). During the friction transition, dull slits (powdered wear track) appear with localized roughness, cracks and voids.
We also observed that during hot spotting, powdered debris is generated on the wear tracks. The variation in the surface temperature is not very significant at larger contact areas. However, the difference is significant at narrower contact areas when powdered wear tracks are generated.
During hot spotting, two effects are dominant oxidation reaction and thermal expansion. We observe a rapid friction transition followed by an increase in bulk temperature and finally the hot spot on the surface. Figure 8 shows the hot spot ring captured during the tests. When a hot spot starts to appear, the hot spot ring changes from red to intensive white color. The magnitude and extent of this hot spot last for only few seconds. The surface temperature is expected to be higher than 1200°C due to the white color of the hot spot ring. Testing of the same carbon-carbon composite material using a subscale dynamometer yielded very similar results. Before the test, friction surfaces of the rotor and the stator were polished using sandpaper of 800-grid size. A total of six energy levels were performed using a subscale dynamometer. All tests were intended to see if the results from the FAST (pin-on-disk test) could be extended to the subscale dynamometer test (disk-on-disk test). In the dynamometer test, the braking torque was set constant at 23.4 Nm. The testing chamber was filled with air at 50% humidity for all tests. A total of 150 stops were initially set for each energy level. However, the actual stop number varied depending on the occurrence of the friction transition (the test was stopped at where we thought was appropriate after the friction transition if it occurred). After each stop, both the stator and the rotor were allowed to
recorded by thermocouple number 2 reached 100°C.
.. ., 8: Image of hot spot ring during friction test Coefficient of Friction Versus Stop Number
(Constant Torque: 23.4 Nm, Air, Humidity: 50%)
0.5 ; Stage3 ~ -~:,"-,~'-, i 1
y I ~ s : • :
~l, 0.3 T ~ Stage 2 [ " : ,~ t' ~ i ~
0.2] ~.~ ~ 7 i / ÷ ~ f ~ Figure 9
o., 1 ~"~~+,o,~~-~~+~; subscale 0 lStag el Stage 4 energies
0 5 10 15 20 25 30 35 40 45 50
Stop #
Testing results of the dynamometer at higher
""'~'~ ii ;"" , ." ~ .'-"::::'.'.':~ i" iii~ii~iii ~ ":::.'~.='~
~,..~4iiiiiil " .:iiiii=:i~i!!i!i==i==i::i::i==
~"i!ii!i~iiiiii~;;..J ~ ~;.."~{i~iiiii~i~=iiii!i!ili!iill
~i~!~tiii~!l~{ii!i~i~i~i~~iiiiiii~ii~~ii;il i!i!ii!!iiiiiii!i!iii~iiii!iii!iiiiiiiiiiiiii!i!!i!i!i !iii!iiiiiii~iii!ii!~!iiii!ii~i !:~ii
:.:::.......,...=~.~,,... :::: -:i.'...'...i."'." ~...'i~ ....::..'~. .:.~...'-.';i:i.i.~.~.~ "'.'. .iiiii
if:: :. ii~==iiiii::i!iii:.~ i~,.=i~ii ===~====
!ii~iii~,;:i i:::!ii:~:ii:il!~:::i!i,,ii!iiiiii!!iii~iii ,,
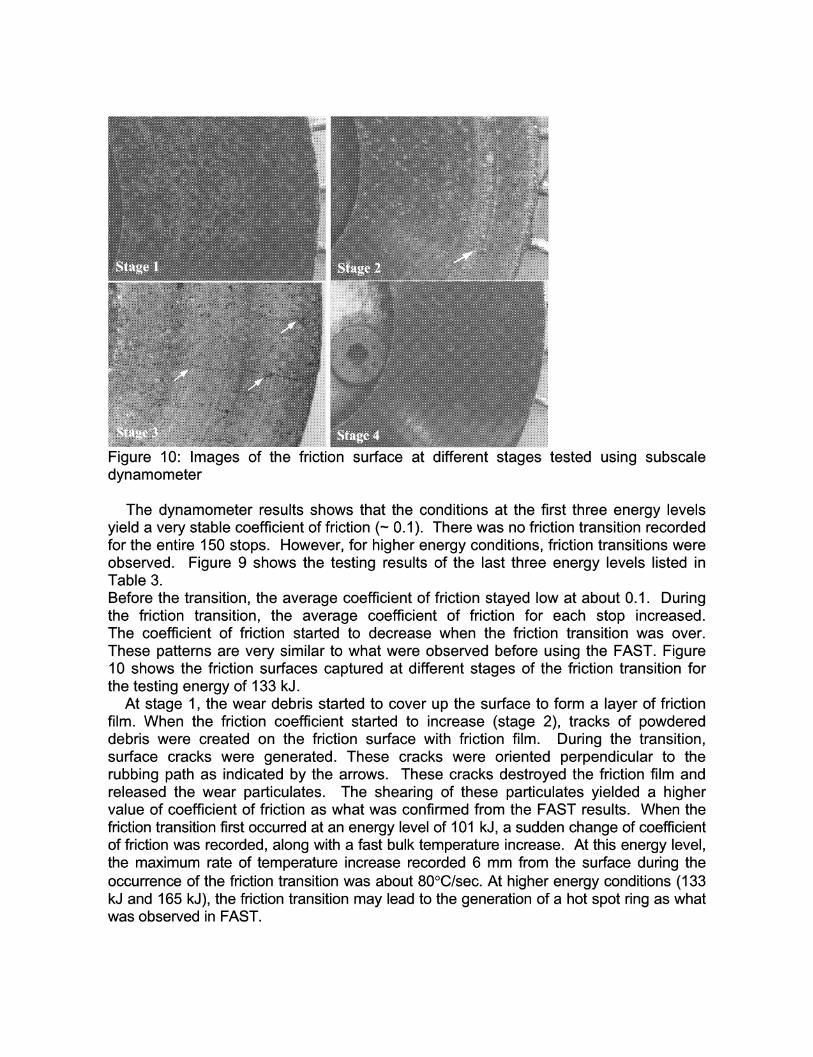
Figure 10: Images of the friction surface at different stages tested using subscale dynamometer
The dynamometer results shows that the conditions at the first three energy levels yield a very stable coefficient of friction (~ 0.1). There was no friction transition recorded for the entire 150 stops. However, for higher energy conditions, friction transitions were observed. Figure 9 shows the testing results of the last three energy levels listed in Table 3. Before the transition, the average coefficient of friction stayed low at about 0.1. During the friction transition, the average coefficient of friction for each stop increased. The coefficient of friction started to decrease when the friction transition was over. These patterns are very similar to what were observed before using the FAST. Figure 10 shows the friction surfaces captured at different stages of the friction transition for the testing energy of 133 kJ.
At stage 1, the wear debris started to cover up the surface to form a layer of friction film. When the friction coefficient started to increase (stage 2), tracks of powdered debris were created on the friction surface with friction film. During the transition, surface cracks were generated. These cracks were oriented perpendicular to the rubbing path as indicated by the arrows. These cracks destroyed the friction film and released the wear particulates. The shearing of these particulates yielded a higher value of coefficient of friction as what was confirmed from the FAST results. When the friction transition first occurred at an energy level of 101 k J, a sudden change of coefficient of friction was recorded, along with a fast bulk temperature increase. At this energy level, the maximum rate of temperature increase recorded 6 mm from the surface during the occurrence of the friction transition was about 80°C/sec. At higher energy conditions (133 kJ and 165 k J), the friction transition may lead to the generation of a hot spot ring as what was observed in FAST.

Figure 11 shows the temperature profile at different stages of the friction transition at a braking energy of 133 kJ (recorded by thermocouples number 6 through 15). At stage 1, when the friction film starts to build up, the temperature distribution over the surface is fairly even. The maximum temperature at the surface was most likely to occur at the inner surface. The maximum rate of temperature increase recorded at this stage was about 30°C/sec. During stages 2 and 3, the rate of temperature increase may reach as high as 100°C/sec with the occurrence of hot spots. The maximum temperature recorded 6 mm from the friction surface was about 750°C. A glowing flame of hot spot can be observed during this phenomenon. Severe oxidation was observed at the outer edges of the pads. During the transition, temperature distribution on the surface was very uneven. In the case shown (stage 3 in Figure 11), the maximum temperature was observed to happen at the outer diameter. However, a hot spot ring at in the inner diameter was also observed during the test (at the inner friction surface where the thermocouple was not available). From these observations, we believe that the location of the maximum temperature on the surface would occur at where new powdered wear tracks were created. At stage 4, friction film started to recover, and the temperature increase rate dropped to 30°C/sec again. Overall, the friction surface morphology and the temperature profile during the evolution of the friction transition agree very well for both scales.
iiiiiiiiiiiiiiiiiiiiiiiiiiiiiiiiiiiiiiiiiiiiiiiiiiiiiiiiiiiiiiiiiiiiiiiiiiiiiiiiiiiiiiiiiiiiiiiiiiiiiiiiiiiiiiiiiiiiiiiiiiiiiiiiiiiiiiiiiiiiiiiiiiii
iiiiiiiiiiiiiiiiiiiiiiiiiiiiiiiiiiiiiiiiiiiiiiiiiiiiiiiiiiiiiiiiiiiiiiiiiiiiiiiiiiiiiiiiiiiiiiiiiiiiiiiiiiiiiiiiiiiiiiiiiiiiiiiii•iiiiiiiiiiiiiiiiiiii iiiiiiiiiiiiiiiiiiiiiiiiiiiiiiiiiiiiiiiiiiiiiiiiiiiiiiiiiiiMiiiiiiiiiiiiiiiiiiiiiiiiiiiiiiiiiiiiiiiiiiiiiiiiiiiiiiiiiiiiiiiiiiiiiiiiiiiiiiiiiiiiii
iiiiiiiiiiiiiiiiiiiiiiiiiiiiiiiiiiiiiiiiiiiiiiiiiiiiiiiiiiiiiiiiiiiiiiiiiiiiiiiiiiiiiiiiiiiiiiiiiiiiiiiiiiiiiiiiiiiiiiiiiiiiiiiiiiiiiiiiiiiiiiiiiiiiii iiiiiiiiiiiiiiiiiiiiiiiiiiiiiiiiiiiiiiiiiiiiiiiiiiiiiiiiiiiiiiiiiiiiiiiiiiiiiiiiiiiiiiiiiiiiiiiiiiiiiiiiiiiiiiiiiiiiiiiiiiiiiiiiiiiiiiiiiiiiiiiiiiiiii iiiiiiiiiiiiiiiiiiiiiiiiiiiiiiiiiiiiiiiiiiiiiiiiiiiiiiiiiiiiiiiiiiiiiiiiiiiiiiiiiiiiiiiiiiiiiiiiiiiiiiiiiiiiiiiiiiiiiiiiiiiiiiiiiiiiiiiiiiiiiiiiiiiiii .................................................................. ::::::::::::::::::::::::::::::::::::::::::::::::::::::::::::::::::::::::::::::::::::
6 7 8 9 I0 ii 12 13 14 15
TC #
50 2 . 5 0 450 65:0
Temper'at u~e { o~)
friction surface.
6 7 8: 9 i0 Ii 12 I'3 ~4 15 6 7 8: 9 I0 11 12 13 14 15 6 7 8 9 I0 II 12 13 14 15
TC # TC # TC #
Figure 11" Temperature profile at various stages recorded 6 mm from the
4. CONCLUSIONS (1) In general, we found that the evolution of a friction transition is closely related to the
rate of the energy absorbed and the friction film. Stress may develop on the surface and with the bulk material. The friction film can be disrupted by this stress. The disruption of the friction film creates wear tracks that are made up of debris. The shearing of these particulates cause both friction and thermal instabilities.
(2) Wear tracks created at the transition stage are very porous due to surface damage. (3) Apart from the water effect, there are other factors that influence the friction
transition and the magnitude of the coefficient of friction. Finely divided debris from the wear process forms the friction film made of nanometric amorphous sheared particles. This friction film may enhance the preferred crystallographic orientation and direction of easy shear of carbon crystallites or rolled particulates. It has been observed that this effect is occurring in a cyclic manner during the sliding of carbon [25]. It was reported that when the friction rises, the surface stresses become sufficient to disrupt the layer-consolidated debris. Then, the surface is roughened and the real contact area decreases. This leads to a sudden increase in the friction

coefficient. However, we observe that an increase of friction coefficient is due to the interlaminar shear of particulates formed from the wear debris.
(4) During the run-in process, a friction film is built up. Apart from the water effect (water was desorbed at high power input), the shear stress within the film increases during a friction transition and causes an increase in the friction coefficient. The stress increases until it disrupts the film and causes a sudden change in friction coefficient. However, the disruption of the film releases the wear particulates and causes a decrease in true contact area. Decrease of contact area keeps the friction coefficient high but decreases gradually as the film is being built again. The shear stress may propagate and crack the bulk material. The crack in the bulk material will affect the behavior of the friction film.
(5) Temperature and stress fields of the sample were simulated for the entire test period. It was found that only about 1% to 30% of the friction heat was absorbed by the sample. Temperature was very localized along the wear tracks during transitions. Analysis from stress field simulation shows that cracks tend to occur at the bottom edge of the wear track. This study shows that any type of failure (mechanical or thermal fatigue) of the friction film or bulk material was sufficient to generate either a frictional transition or thermal instability.
5. REFERENCES 1. Stimson, I. L. and Fisher, R., Philos. Trans. R. Soc. London A294, (1980) 583-590. 2. Blau, P. J., Journal of Tribology, 109, (1987) 537-544. 3. Blau, P. J., Proc. 35 t" Mech. Fail. Prevention Group, (1982) 67. 4. Ruff, A. W. and Blau, P. J., Nat. Bur. Of Standards, (1980) Report No. NBSIR-80-2058. 5. Chen, J. D., Chern Lin, J. H. and Ju, C. P., Journal of Materials Science, 31, (1996) 1221-
1229. 6. Kuhlmann-Wilsdorf, D., Fundamentals of Friction and Wear of Materials, Rigney, D. A.,
ASM, Metal Part, (1981) 119-186. 7. Zhao, Y. W, Liu, J. J. and Zheng, L. Q., Tribology Trans. 33, (1990) 648-652. 8. Hill, R. C., NASA Technical Note, (1975) NASA TN D-8006. 9. Chen, J. D. and Ju, C. P., Wear, (1994) 129-135. 10. Ju, C. P., Lee, K. J., Wu, H. D., and Chen, C. I., Carbon, 32, (1994) 971. 11. Zaidi, H. and Senouci, A., Applied Surface Science, 144-145, (1999) 265-271. 12. Brunt, C. V. and Savage, R. H., Gen. Elec. 47, (1944) 16. 13. Ramadanoffand, D. and Glass, S.W., Trans. AIEE, 6, (1944) 825. 14. Savage, R. H., J. Appl. Phys. 19, (1948) 136. 15. Savage, R. H., J. Appl. Phys. 19, (1948) 1. 16. Savage, R.H. and Shaffer, D.L., J. Appl. Phys., 27, (1956) 136. 17. Bryant, P.J., Gutshall, P. C. and Taylor, L. H., Mechanisms of Solid Friction, Elsevier
Amsterdam, (1964) 118. 18. Rowe, G. W., Wear, 3, (1960) 274. 19. Arnell, R. D., and Teer, D. G., Nature, 21, (1968) 1155. 20. Yen, B. K. and Ishihara, T., Wear 174, (1994) 111-117. 21. Li, C. C. and Sheehan, J. E., Int. Conf., ASME, (1981) 525-533. 22. Barber, J. R., Beamond, T. W., Waring, J. R. and Pritchard, C., Journal of Tribology, 107,
(1985) 206-210. 23. Beeman, D., Silverman, J., Lynds, R. and Anderson, M. R., Phys. Rev. B. 30, (1984) 977. 24. Robertson, J., Adv. Phys. 35, (1986) 317. 25. Midley, J. W. and Teer, D. G., Trans. ASME, 85, (1963) 48