Embed Size (px)
Citation preview
20032003
State of the Community Survey ResultsState of the Community Survey Results
Prepared forPrepared for
The Corporate Strategy and Policy Office The Corporate Strategy and Policy Office of the CAOof the CAO
Robert C. Sinclair, Ph.D. Paul A Robert C. Sinclair, Ph.D. Paul A Seccaspina, Ph.D.Seccaspina, Ph.D.
Vice President Vice President PresidentPresident
Sudbury Toronto Montreal

Oraclepoll Research:Paul Seccaspina Bob Sinclair
City of Greater SudburyCarlos Salazar
Team Members

CORPORATE PROFILE
• We are a national research firm based in Sudbury with offices in Toronto and Montreal.• Our staff include 3 senior analysts, 8 support staff, and 40 research staff.• The company was founded in 1995 and has experienced consistent annual growth since then.• Our call centre is equipped with state of the art Voxco Computer Assisted Telephone Interview (CATI) software.• Our experience ranges from client satisfaction to program evaluation to advertising / product testing & tracking.
PARTIAL CLIENT LIST
• BCE (Télébec, Sympatico, Lino, Northern Telephone, Northwestel, Nortel & Télébec Mobility)• CTV National Sales and Marketing• Domtar • Durham Regional Police• General Motors / Saturn Corporation• Inco Ltd.• Johnson & Johnson• Northwest Territories Power Corporation• OMERS • Sudbury Regional Hospital• Toronto Public Health• World Wildlife Fund

Paul A. Seccaspina, President
• Honours B.A., 1986, Laurentian University• M.A, 1988, University of Western Ontario• Ph.D., 1997, University of Warwick
• Lecturer, Department of Political Science, Laurentian University, 1988-1993• Lecturer, Civic Education Project / Yale University, Moldova, 1993-1994
• After a career in banking, the securities industry and academia, Dr. Seccaspina founded Oraclepoll in 1995.
• Since that time he has built a national client base that spans government, the private sector (including several Fortune 500 firms) and not for profit organizations.• He has built the company by offering a quality product and excellent service to the corporation’s clients. • He regularly deals with media inquires and has been cited in all major Canadian news outlets.

Robert C. Sinclair, Vice President
• Honours B.A., 1981, University of Western Ontario• M.Sc., 1984, The Pennsylvania State University• Ph.D., 1988, The Pennsylvania State University
• Professor, Department of Psychology, Central Michigan University, 1987-1991• Professor, Department of Psychology, University of Alberta, 1991-2001
• Dr. Sinclair is listed among The 2000 Outstanding Scientists of the 21st Century.• He is listed among The 2000 Eminent Scientists of Today.
• He has approximately 100 scientific publications / presentations / invited talks.
• He was a member of the Social Sciences & Humanities Research Council of Canada Grant Adjudication Committee.• He has appeared on national and international television networks including CBS, ABC, CNN, BBC, CTV, CBC, and Global.• He has been interviewed by the New York Times, Washington Post, Los Angeles Times, National Post, Globe and Mail, and numerous other newspapers. • Dr. Sinclair has extensive experience consulting in the areas of Organizational Development, Organizational Culture, and Program Evaluation, both nationally
and internationally.

Methodology & Logistics
Random Sample Survey1200 residences100 businesses

Rationale for Survey Research
Informational BenefitsImportance of Public Opinion /
Community InvolvementInternal BenchmarkingDevelopment of Action Plan

Residential Survey Results

Satisfaction levels among those residents who have had contact with the City are low as comments reveal citizen discontent over reaching the appropriate person and having their needs, issues and concerns dealt with.
Discontent among residents is most evident with respect to infrastructure including roads.
There remains an “in” and “out” divide as residents of the Greater Sudbury Area (GSA) are more likely to be concerned with, infrastructure as well as fire and policing issues than those of the City core.
Overview of Descriptive Data

Quality of Life
Pe
rcen
tag
e
0
5
10
15
20
25
30
35
40
45
Very Poor Poor Satisfactory Good Very Good

Community Pride
Don't Know Not Proud Proud
Per
cen
tag
e
0
5
10
15
20
25
30
35
40
45
50
55
60
65
70
75
80
85
2000200120022003
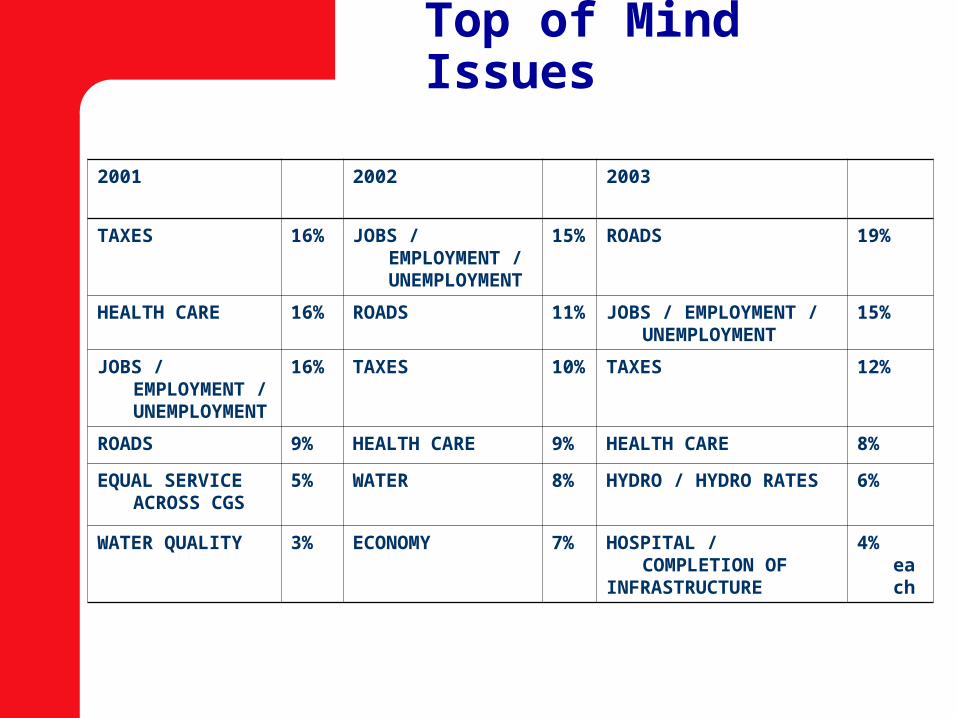
Top of Mind Issues
2001 2002 2003
TAXES 16% JOBS / EMPLOYMENT / UNEMPLOYMENT
15% ROADS 19%
HEALTH CARE 16% ROADS 11% JOBS / EMPLOYMENT / UNEMPLOYMENT
15%
JOBS / EMPLOYMENT / UNEMPLOYMENT
16% TAXES 10% TAXES 12%
ROADS 9% HEALTH CARE 9% HEALTH CARE 8%
EQUAL SERVICE ACROSS CGS
5% WATER 8% HYDRO / HYDRO RATES 6%
WATER QUALITY 3% ECONOMY 7% HOSPITAL / COMPLETION OFINFRASTRUCTURE
4% each

Economic Confidence
Per
cen
tag
e A
gre
emen
t
0
10
20
30
40
50
60
70
80
Economic Future Employment Employment Opportunities Opportunities for Youth
2000200120022003

Healthy Community
Percent Agreement 2000 2001 2002 2003
The community provides quality post college educationNa Na Na 73%
The community provides quality post secondary university education
Na Na Na 70%
The community provides opportunities for healthy living Na 71% 68% 67%
The community offers good cultural institutions Na 53% 48% 54%
The community has a strong and viable arts and cultural community 44% 42% 43% 44%
The community provides seniors in our areas with quality care 32% 40% 30% 35%
The community provides quality health care services to residents 36% 34% 29% 35%

Level of Interest in Local Politics
Perc
en
tag
e
0
10
20
30
40
50
60
70
80
Interest
Not Interested Neutral Interested
2003
2000

Budget Issues
Percent Agreement
2000 2001 2002 2003
Rather than building new facilities or roads, the City should invest in maintaining and improving existing facilities and roads
78% 72% 78% 79%
Where appropriate the direct users of City services should pay for the cost of providing those services
38% 41% 36% 37%
The City should maintain current levels of service and increase taxes up to 5% 22% 37% 37% 32%
The City should reduce service levels by whatever is needed in order to hold the line on taxes
33% 21% 25% 23%

Contact with City Staff
Per
cen
tag
e
0
10
20
30
40
50
60
70
80
Dissatisfied Neutral Satisfied
200120022003

Top 5 Issues in Terms of Importance
• Fire Protection• Winter Road Maintenance• Maintenance of Main Roads• Ambulance Services• Police Services

Bottom 5 Issues in Terms of Satisfaction
• Maintenance of Main Roads• Winter Road Maintenance• Economic Diversification• Providing Quality Land Development• Child Care Funding

Gap Analysis
Gaps Between Satisfaction and Importance:Top 10 Areas of Importance (Individual Items)
Top 10
Imp
ort
ance
- S
atis
fact
ion
0.00.10.20.30.40.50.60.70.80.91.01.11.21.31.41.51.61.71.81.92.02.12.22.32.42.5
Main Fire Winter Ambulance Police Job Public Promoting Water Planning Road Road Creation Health 3 R's & Sewer for theMaintenance Maintenance City's Future

Time-Related Changes in Satisfaction
Mean Level of Overall Satisfaction with CityServices as a Function of Year
Year
Lev
el o
f S
atis
fact
ion
3.0
3.1
3.2
3.3
3.4
3.5
3.6
3.7
3.8
3.9
4.0
2001 2002 2003
Neither Poornor Good
Good

Time-Related Changes in Satisfaction
Mean Level of Satisfaction as a Function of City Serviceand Year
City Service
Lev
el o
f S
atis
fact
ion
1.0
1.5
2.0
2.5
3.0
3.5
4.0
4.5
5.0
Economic Social Public Police Public Emergency Citizen Dev. Services Works Services Health Services Services
01 02 03 01 02 03 01 02 03 01 02 03 01 02 03 01 02 03 01 02 03Very Poor
Very Good
Good

Satisfaction with City Services Collapsed
Across TimeMean Level of Satisfaction as a Function of City Service
Collapsed Across Year
City Service
Lev
el o
f S
atis
fact
ion
3.0
3.1
3.2
3.3
3.4
3.5
3.6
3.7
3.8
3.9
4.0
Economic Social Public Police Public Emergency Citizen Dev. Services Works Services Health Services Services
Neither Goodnor Poor
Good

Time-Related Changes in Satisfaction
Mean Level of Satisfaction with the Range of City Servicesas a Function of Year
Year
Lev
el o
f S
atis
fact
ion
3.0
3.1
3.2
3.3
3.4
3.5
3.6
3.7
3.8
3.9
4.0
2001 2002 2003
Neither Satisfiednor Dissatisfied
Satisfied

Ward-Related Differences:
Satisfaction & Importance
Performance Indicators
Mean scores were computed based on the ratings of the performance indicators falling into each organizational unit of the City of Greater Sudbury, for both satisfaction and importance ratings
Reliability analyses were also conducted

Ward-Related Differences:
Satisfaction & Importance
Performance Indicators
7 (City Service) X 6 (Ward) mixed-model analyses of variance were conducted on the satisfaction and importance ratings based on the performance indicators
Tests:1) Are there significant differences among the
city services?2) Are there differences among the wards?3) Are there City Service X Ward interactions?
(i.e., are there different patterns of ratings of city services in the different wards?)

Ward-Related Differences: Satisfaction
Ward
Lev
el
of
Sa
tisfa
cti
on
3.0
3.1
3.2
3.3
3.4
3.5
3.6
3.7
3.8
3.9
4.0
Ward 1 Ward 2 Ward 3 Ward 4 Ward 5 Ward 6
Good
Neither Goodnor Poor

City Services: Satisfaction
City Service
Lev
el o
f S
atis
fact
ion
3.0
3.1
3.2
3.3
3.4
3.5
3.6
3.7
3.8
3.9
4.0
Economic Social Public Police Public Emergency Citizen Dev. Services Works Services Health Services Services

Level of Satisfaction with Economic Development& Planning as a Function of Ward
Ward
Lev
el o
f S
atis
fact
ion
3.0
3.1
3.2
3.3
3.4
3.5
3.6
3.7
3.8
3.9
4.0
Ward 1 Ward 2 Ward 3 Ward 4 Ward 5 Ward 6
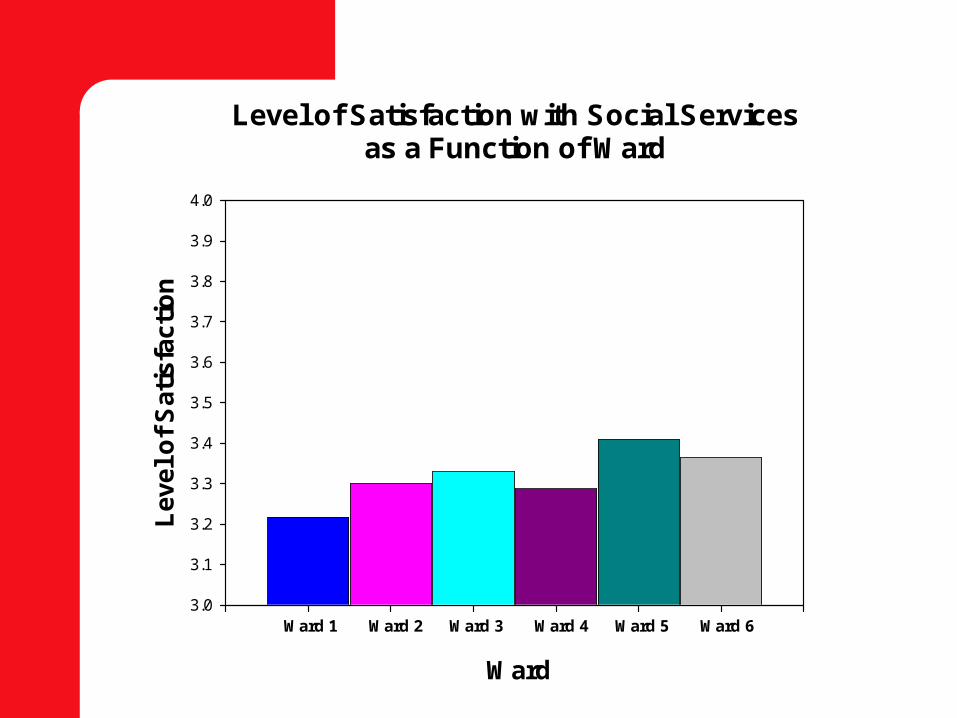
Level of Satisfaction with Social Servicesas a Function of Ward
Ward
Lev
el o
f S
atis
fact
ion
3.0
3.1
3.2
3.3
3.4
3.5
3.6
3.7
3.8
3.9
4.0
Ward 1 Ward 2 Ward 3 Ward 4 Ward 5 Ward 6

Level of Satisfaction with Public Worksas a Function of Ward
Ward
Lev
el o
f S
atis
fact
ion
3.0
3.1
3.2
3.3
3.4
3.5
3.6
3.7
3.8
3.9
4.0
Ward 1 Ward 2 Ward 3 Ward 4 Ward 5 Ward 6

Level of Satisfaction with Police Servicesas a Function of Ward
Ward
Lev
el o
f S
atis
fact
ion
3.0
3.1
3.2
3.3
3.4
3.5
3.6
3.7
3.8
3.9
4.0
Ward 1 Ward 2 Ward 3 Ward 4 Ward 5 Ward 6
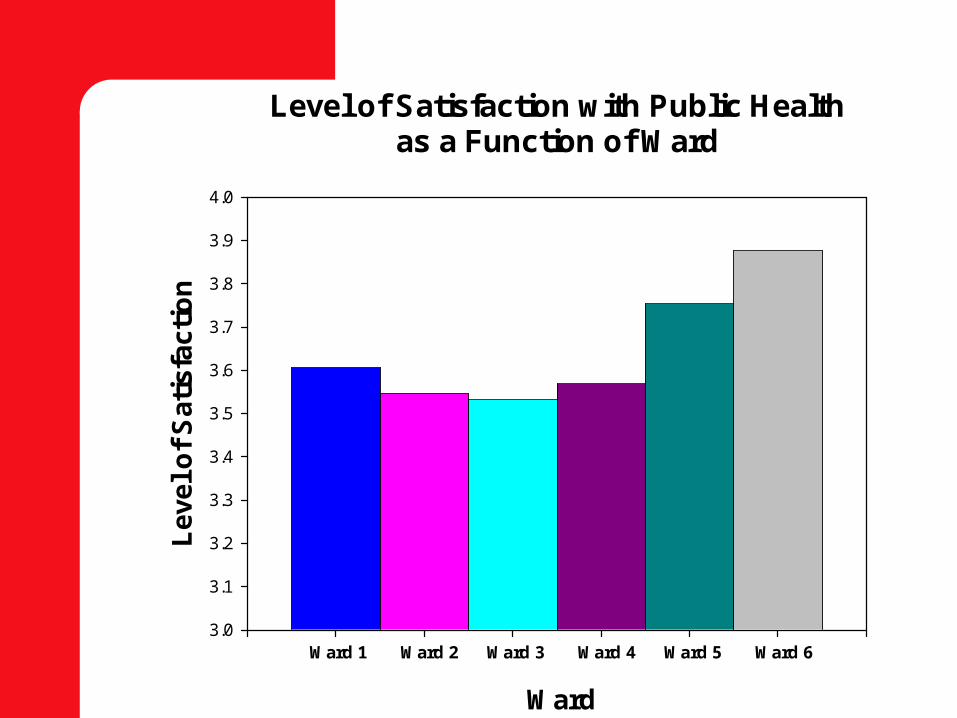
Level of Satisfaction with Public Healthas a Function of Ward
Ward
Lev
el o
f S
atis
fact
ion
3.0
3.1
3.2
3.3
3.4
3.5
3.6
3.7
3.8
3.9
4.0
Ward 1 Ward 2 Ward 3 Ward 4 Ward 5 Ward 6

Level of Satisfaction with Emergency Servicesas a Function of Ward
Ward
Lev
el o
f S
atis
fact
ion
3.0
3.1
3.2
3.3
3.4
3.5
3.6
3.7
3.8
3.9
4.0
Ward 1 Ward 2 Ward 3 Ward 4 Ward 5 Ward 6
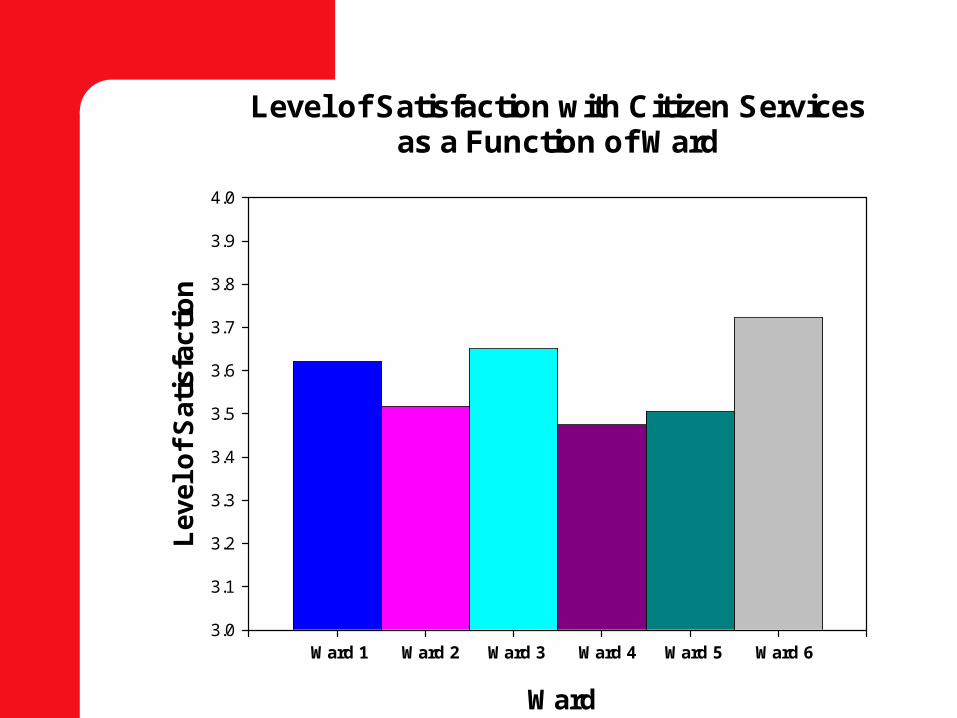
Level of Satisfaction with Citizen Servicesas a Function of Ward
Ward
Lev
el o
f S
atis
fact
ion
3.0
3.1
3.2
3.3
3.4
3.5
3.6
3.7
3.8
3.9
4.0
Ward 1 Ward 2 Ward 3 Ward 4 Ward 5 Ward 6

Level of Importance as a Function of City Service
City Service
Lev
el o
f Im
po
rtan
ce
3.03.13.23.33.43.53.63.73.83.94.04.14.24.34.44.54.64.74.84.95.0
Economic Social Public Police Public Emergency Citizen Dev. Services Works Services Health Services Services

Gaps Between Satisfaction and Importanceas a Function of City Service
City Service
Imp
ort
ance
- S
atis
fact
ion
0.0
0.1
0.2
0.3
0.4
0.5
0.6
0.7
0.8
0.9
1.0
1.1
1.2
1.3
1.4
1.5
Economic Social Public Police Public Emergency Citizen Dev. Services Works Services Health Services Services

Conclusions & Recommendations
Ensure that the GSA does not feel disenfranchised
People are most satisfied with Emergency Services and Public Health
People are least satisfied with Public Works and Economic Development & Planning Target Public Works and Economic
Development & Planning Target Gaps in Public Works, Police Services,
Emergency Services, and Economic Development and Planning

Problems/Solutions Regarding Performance
Indicators
Halo Error1) On performance indicators involving multiple
measures/categories (e.g., Economic Development & Planning), responses on one measure color responses on other performance indicators within category – addressing individual measures could be misleading – use mean responses
2) The general public does not always perceive performance indicators as representing the appropriate organizational unit in the city; thus, responses on one organizational unit can color responses on another (e.g., providing affordable housing can color responses on the Social Services indicators) – increase public awareness regarding the functions of the organizational units – use multiple indicators that map appropriately onto the organizational units – use mean responses

Problems/Solutions Regarding Performance
Indicators
Single Indicators1) Single indicators (e.g., Police Services, Public Health) are
notoriously unreliable and lead to invalid inferences 2) Multiple indicators are needed in order to address each
aspect of a particular organizational unit (e.g., measures of satisfaction with the various multifaceted aspects of Police Services would increase validity and provide more important information regarding the aspects of Police Services that need to be targeted [cf. On a scale from very poor to very good, please rate the level of Police Service that is currently provided]) – develop multiple indicators and use mean responses

Problems/Solutions Regarding Performance
Indicators
Need for Transactional Data1) Satisfaction measures on performance indicators on which
respondents have no experience are extremely problematic (e.g., asking people to evaluate satisfaction with libraries, when they have not used a library can distort the data associated with libraries) – move toward transaction-based (i.e., experience-based) surveys involving multiple indicators and mean responses
2) Conduct focus groups

Business Survey Results

Top of Mind Issues
Significant issues – Of respondents with an opinion
2000 2001 2002 2003
Jobs / Unemployment 15% Taxes (high) 25% Taxes (high) 21% Roads 14%
Amalgamation / Municipal restructuring
11% Jobs / Unemployment 13% Economic diversification
14% Jobs / Unemployment
14%
Economic diversification
11% Economic diversification
10% Business friendly environment
12% Taxes 12%
Economy 8% Business friendly environment
8% Jobs / Unemployment 11% Economic diversification
12%
Keeping youth here 8% Restructuring (process)
7% Service accessibility 10% By-laws 12%
Taxes (high) 7% Service accessibility 5% By-laws 7% Population decline
5%
(Excluding responses of Don’t Know)

EconomicConfidence
Pe
rce
nta
ge
Ag
ree
me
nt
0
10
20
30
40
50
60
70
80
Economic Future Employment Employment Skilled & Quality
Opportunities Opportunities Pool of Labour
for Youth
2000200120022003
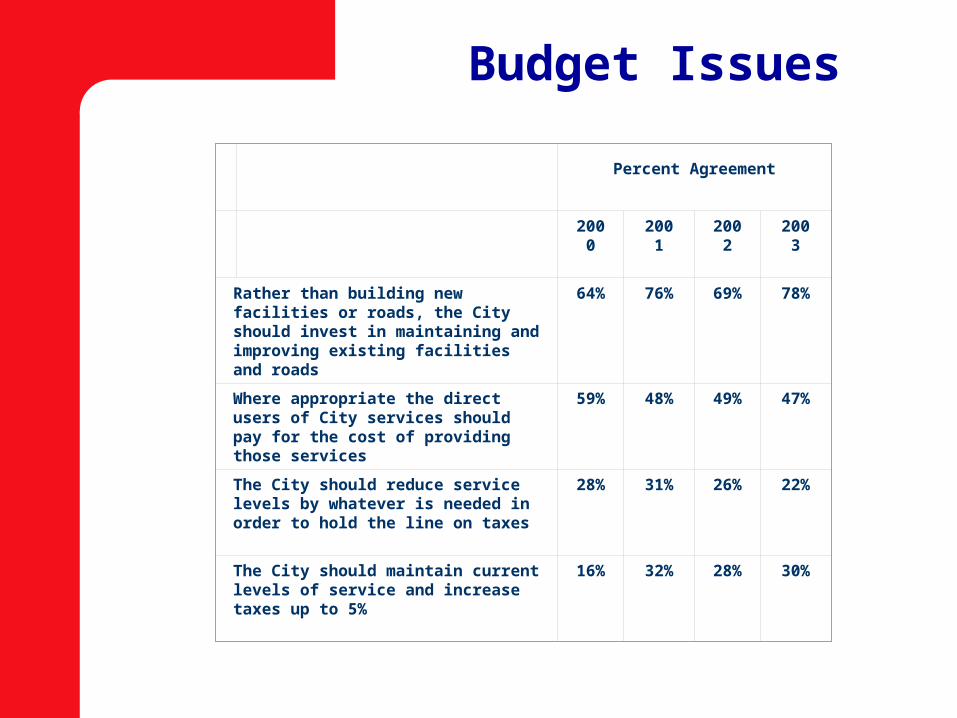
Budget Issues
Percent Agreement
2000 2001 2002 2003
Rather than building new facilities or roads, the City should invest in maintaining and improving existing facilities and roads
64% 76% 69% 78%
Where appropriate the direct users of City services should pay for the cost of providing those services
59% 48% 49% 47%
The City should reduce service levels by whatever is needed in order to hold the line on taxes
28% 31% 26% 22%
The City should maintain current levels of service and increase taxes up to 5%
16% 32% 28% 30%

Satisfaction withContact with a Municipal
Staff Member
• 58% contacted a municipal staff member
• Only 54% rated the experience as positive (a 10% decline from 2002)
• A lack of response/action and poor service were cited as areas for improvement

Top 5 Issues in Terms of Importance
• Fire Protection• Maintenance of Main Roads• Winter Road Maintenance • Planning for the City’s Future• Ambulance Services

Bottom 5 Issues in Terms of Satisfaction
• Maintenance of Main Roads• Developing Job Creation Initiatives• Child Care Funding• Economic Diversification• Winter Road Maintenance

Gaps Between Satisfaction and Importance:Top 10 Areas of Importance (Individual Items): Business
Top 10
Imp
ort
ance
- S
atis
fact
ion
0.00.10.20.30.40.50.60.70.80.91.01.11.21.31.41.51.61.71.81.92.0
Winter Fire Main Planning Police AmbulanceEconomic Water Public Job Road Road for the City's Diversification & Health CreationMaintenance Maintenance Future Sewer
Gap Analysis

Satisfaction & Importance
Performance Indicators
Mean scores were computed based on the ratings of the performance indicators falling into each organizational unit of the City of Greater Sudbury, for both satisfaction and importance ratings

Satisfaction & Importance
Level of Satisfaction as a Function of City Service:Business
City Service
Lev
el o
f S
atis
fact
ion
2.9
3.0
3.1
3.2
3.3
3.4
3.5
3.6
3.7
3.8
3.9
4.0
Economic Social Public Police Public Emergency Citizen Dev. Services Works Services Health Services Services

Level of Importance as a Function of City Service:Business
City Service
Lev
el o
f Im
po
rtan
ce
3.03.13.23.33.43.53.63.73.83.94.04.14.24.34.44.54.64.74.84.95.0
Economic Social Public Police Public Emergency Citizen Dev. Services Works Services Health Services Services

Gaps
City Service
Imp
ort
ance
- S
atis
fact
ion
0.0
0.1
0.2
0.3
0.4
0.5
0.6
0.7
0.8
0.9
1.0
1.1
1.2
1.3
1.4
1.5
Economic Social Public Police Public Emergency Citizen Dev. Services Works Services Health Services Services

Area-Related Differences
Expansion & Collaboration as a Function of Area
Area
Deg
ree
of
Ag
reem
ent
2.0
2.2
2.4
2.6
2.8
3.0
3.2
3.4
3.6
3.8
4.0
Sudbury GSA
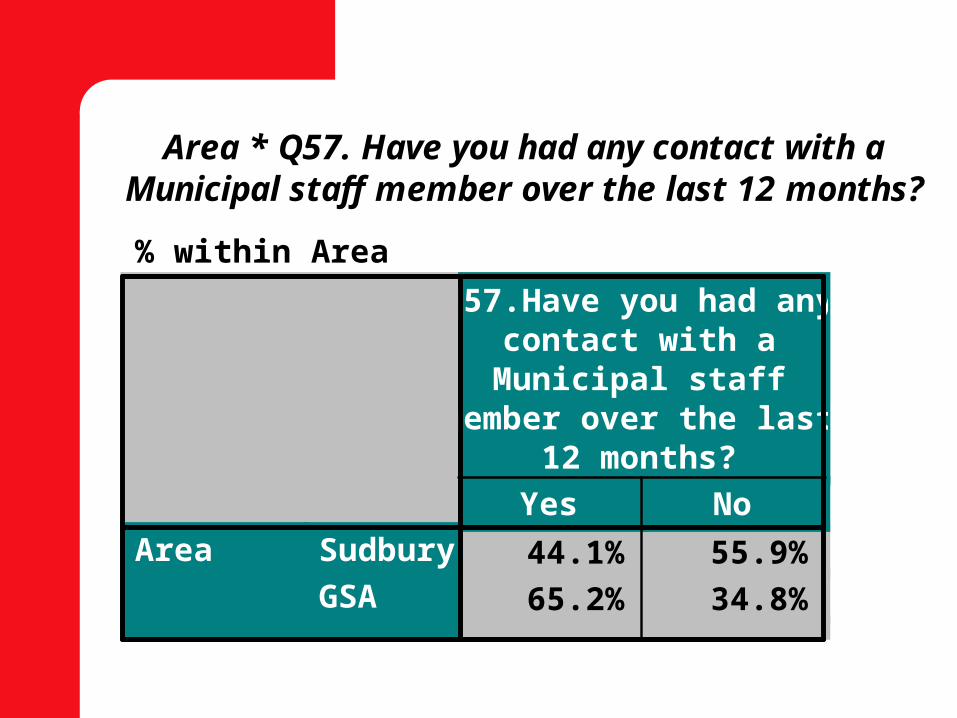
Area * Q57. Have you had any contact with aMunicipal staff member over the last 12 months?
% within Area
44.1% 55.9%
65.2% 34.8%
Sudbury
GSA
AreaYes No
Q57.Have you had anycontact with aMunicipal staff
member over the last12 months?

Type of Business-Related Differences
Businesses were categorized as:1) Hospitality (tourism, restaurants, lodges, hotels, bars, motels, lodges,
cottages, tent grounds, entertainment and recreation, movie theatres, etc.)
2) Retail (sell anything to the general public, except hospitality services)
3) Service (hair dressers, barbers, travel agents, couriers, etc.)
4) Other (communications/technology, government, manufacturing, nonprofit, professional, natural resources, transportation, wholesale, and other businesses that did not fall into the other categories)
Analyses tested for statistically significant differences on all measures as a function of Type of Business
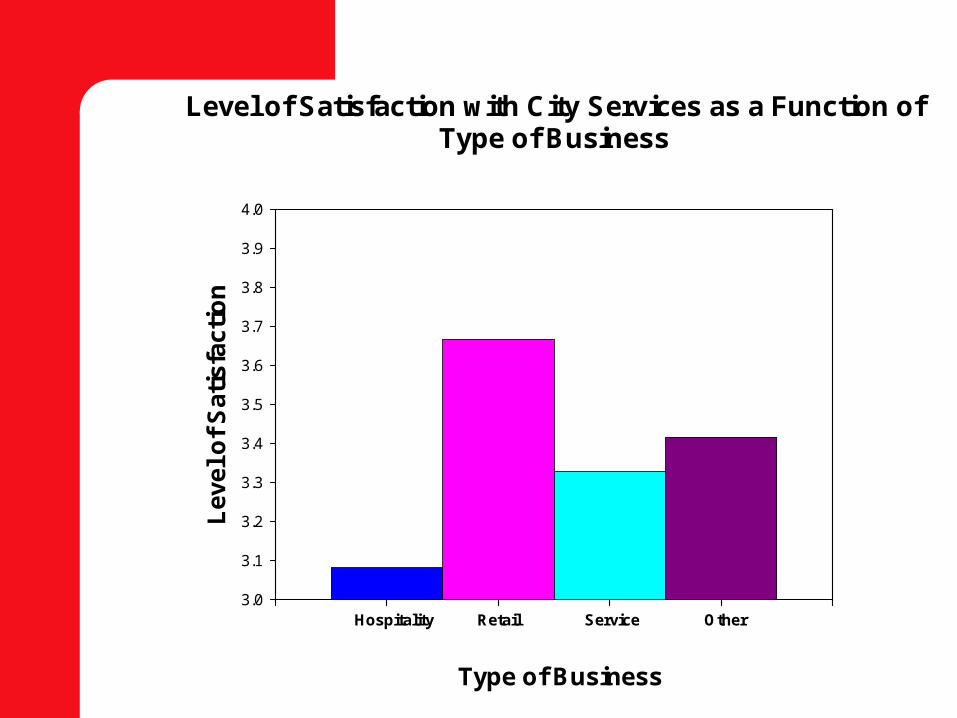
Level of Satisfaction with City Services as a Function ofType of Business
Type of Business
Lev
el o
f S
atis
fact
ion
3.0
3.1
3.2
3.3
3.4
3.5
3.6
3.7
3.8
3.9
4.0
Hospitality Retail Service Other
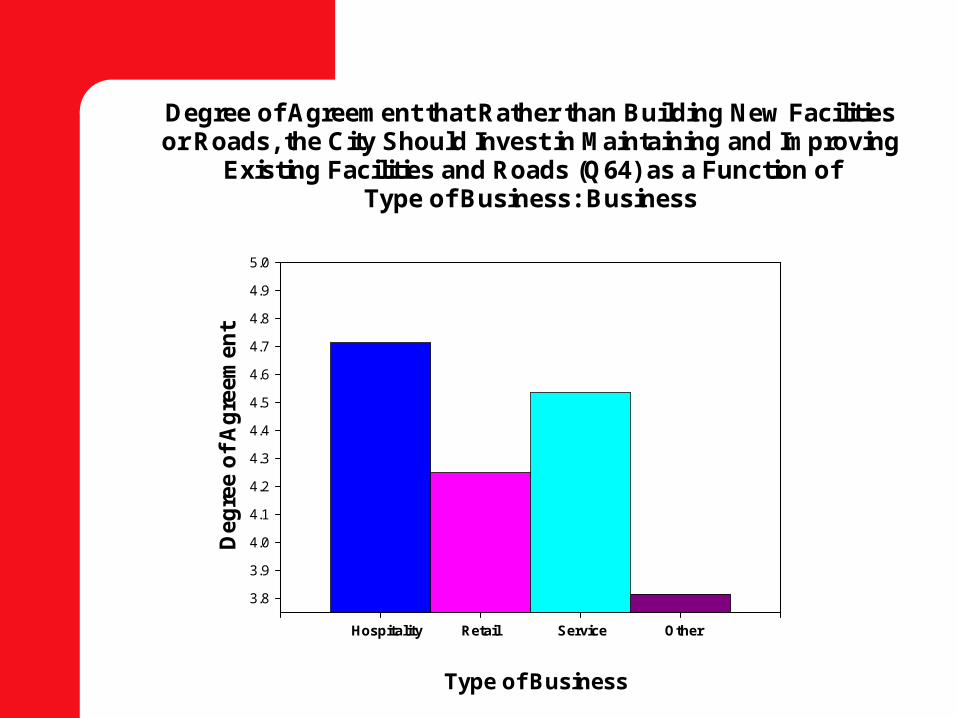
Degree of Agreement that Rather than Building New Facilitiesor Roads, the City Should Invest in Maintaining and Improving
Existing Facilities and Roads (Q64) as a Function ofType of Business: Business
Type of Business
Deg
ree
of
Ag
reem
ent
3.8
3.9
4.0
4.1
4.2
4.3
4.4
4.5
4.6
4.7
4.8
4.9
5.0
Hospitality Retail Service Other
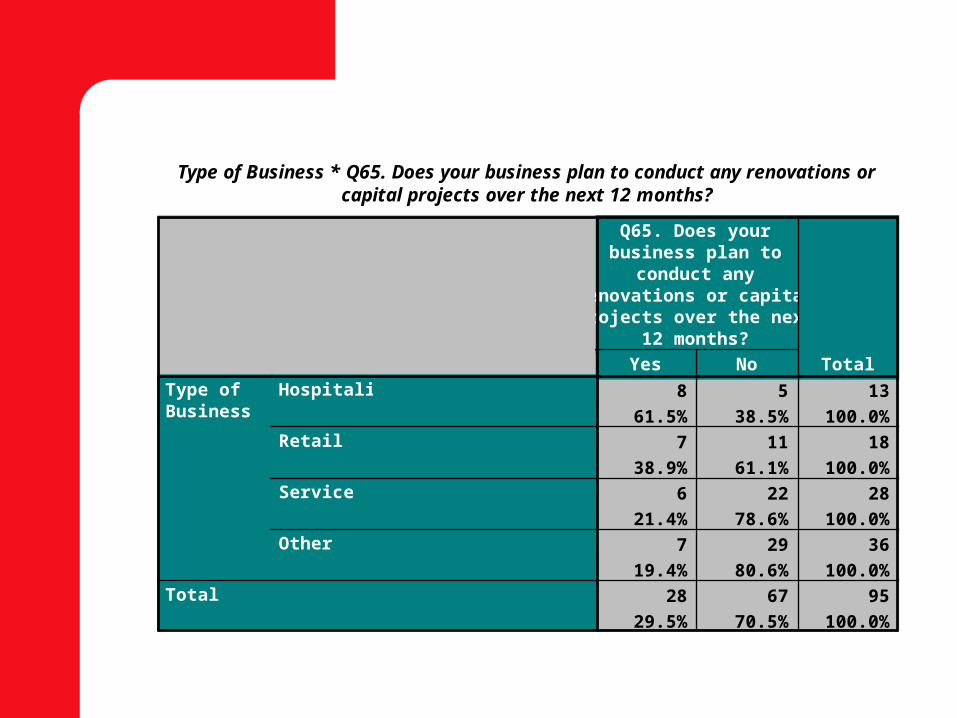
Type of Business * Q65. Does your business plan to conduct any renovations orcapital projects over the next 12 months?
8 5 13
61.5% 38.5% 100.0%
7 11 18
38.9% 61.1% 100.0%
6 22 28
21.4% 78.6% 100.0%
7 29 36
19.4% 80.6% 100.0%
28 67 95
29.5% 70.5% 100.0%
Hospitality
Retail
Service
Other
Type ofBusiness
Total
Yes No
Q65. Does yourbusiness plan to
conduct anyrenovations or capitalprojects over the next
12 months?
Total

Conclusions & Recommendations: Business
Businesses were most satisfied with Citizen Services and Public Health
Businesses were least satisfied with Public Works, Economic Development & Planning, and Social Services
Largest Gaps in Public Works, Police Services, Economic Development & Planning, and Emergency Services Target Infrastructure (Note: Businesses view EDP as
their realm) Conduct focus groups/detailed surveys to determine
reasons

General Conclusions & Recommendations
Residents place a high priority on infrastructure issues followed by economic development issues.
Businesses most want their local government to deal with issues related to having a stable infrastructure so that they can conduct their business and are less concerned with economic development issues.
In summary, the City needs to reach out to the community and make people feel empowered (i.e., more a part of the process). As it stands, many residents feel left out. Interventions could include public consultation and reassurances over emergency services and road maintenance. Furthermore, providing the general public with details regarding plans to shore-up services will likely go a long way to increasing public confidence. Often, information is power.

General Conclusions & Recommendations
Communication Consultation Inclusion Visible Action

Benchmarking
Quality of Life, Satisfaction with the Range of City Services, and Confidence in the Community’s Economic Future Ratings were Collected from Residents of:
North Bay (n = 76)Timmins (n = 75)Sault Ste. Marie (n = 85)Thunder Bay (n = 76)Toronto (n = 74)Other (n = 242) Statistical Tests were Conducted to Test for Differences in
the Mean (Average) Ratings of Residents of These Cities Versus the Ratings of Residents of the City of Greater Sudbury

BenchmarkingLevel of Quality of Life as a Function of City
City
Le
vel
of
Qu
ali
ty o
f L
ife
1
2
3
4
5
North Timmins Sault Ste. Thunder Sudbury Other Toronto Bay Marie Bay
Very Poor
Very Good
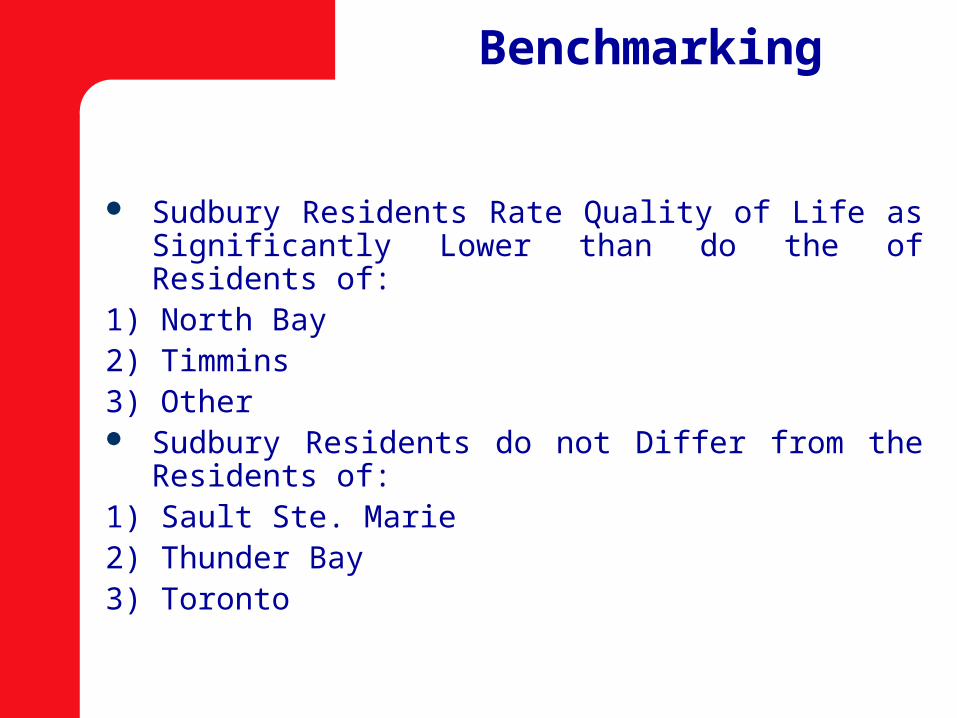
Benchmarking
Sudbury Residents Rate Quality of Life as Significantly Lower than do the of Residents of:
1) North Bay2) Timmins3) Other Sudbury Residents do not Differ from the
Residents of:1) Sault Ste. Marie2) Thunder Bay3) Toronto

Benchmarking
Level of Satisfaction with the Range of City Servicesas a Function of City
City
Lev
el o
f S
atis
fact
ion
1
2
3
4
5
North Timmins Sault Ste. Thunder Sudbury Other Toronto Bay Marie Bay
Very Dissatisfied
Very Satisfied
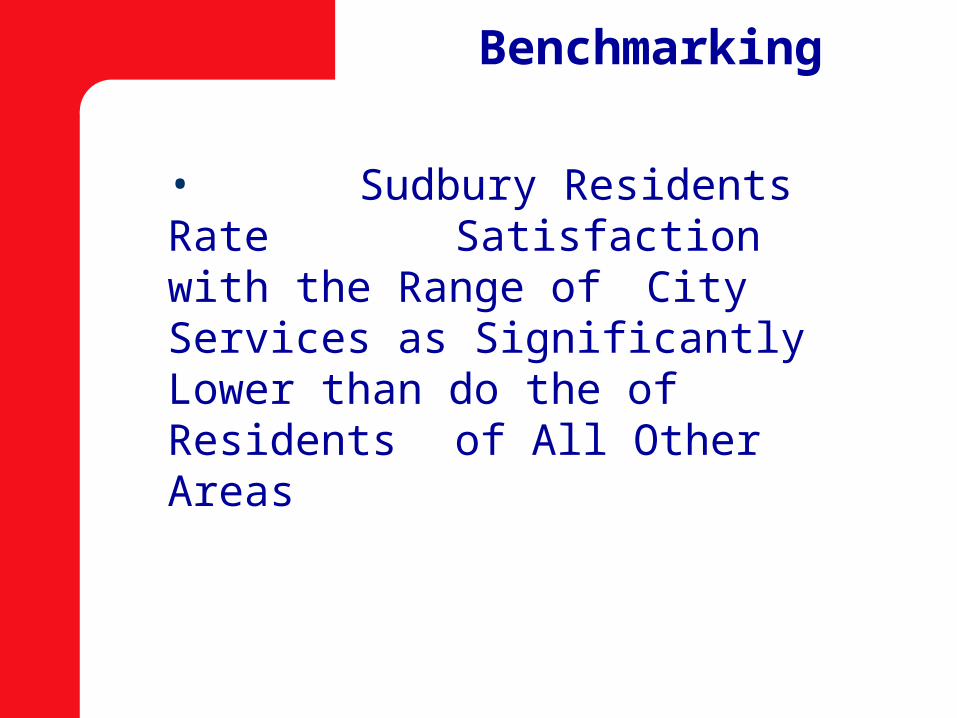
Benchmarking
• Sudbury Residents Rate Satisfaction with the Range of City Services as Significantly Lower than do the of Residents
of All Other Areas
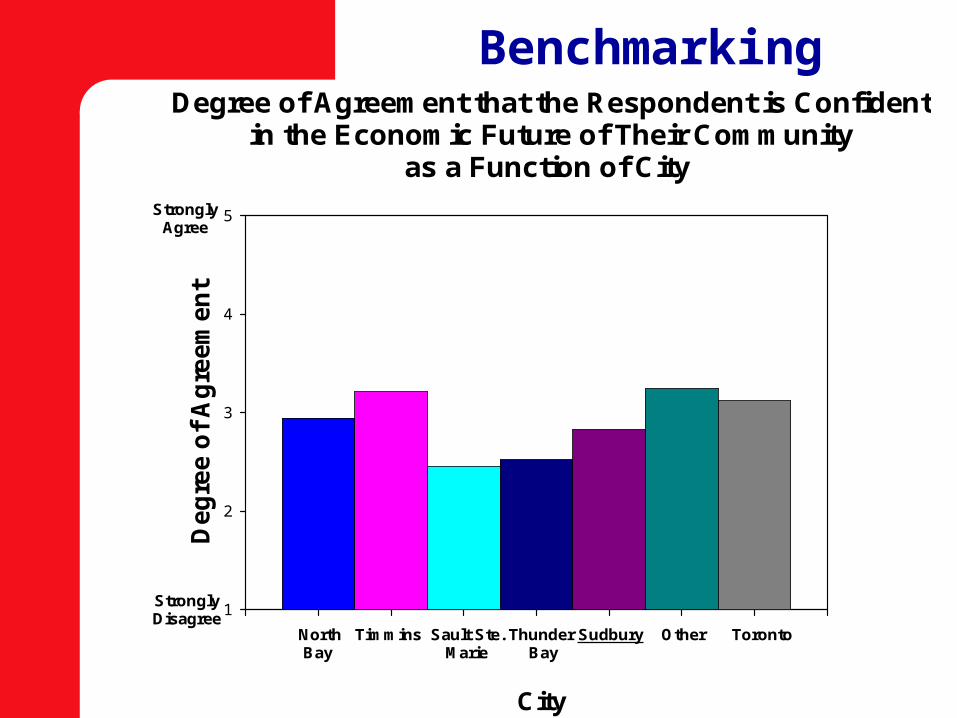
BenchmarkingDegree of Agreement that the Respondent is Confident
in the Economic Future of Their Communityas a Function of City
City
Deg
ree o
f A
gre
em
en
t
1
2
3
4
5
North Timmins Sault Ste. Thunder Sudbury Other Toronto Bay Marie Bay
StronglyDisagree
StronglyAgree

Benchmarking
Sudbury Residents have Less Confidence in the Economic Future of the Community than do
Residents of:
1) Toronto
2) Timmins
3) Other
Sudbury Residents do not Differ from Residents of:
1) North Bay
Sudbury Residents have More Confidence than do Residents of:
1) Sault Ste. Marie
2) Thunder Bay

Benchmarking
Take Home Messages:
There are definitely issues to address!
Sudbury should be on top!
More broad-based benchmarking might be useful.