Embed Size (px)
Citation preview

•
2003 Precision Agricultural Services
Dealership Survey Results Staff Paper No. 3-10
Sponsored by Crop Life Magazine
and Center for Food and Agricultural Business
Purdue University June 2003
Dr. Linda D. Whipker* Dr. Jay T. Akridge
*Linda D. Whipker is a marketing consultant in Raleigh, NC. Jay T. Akridge is Director of the Executive MBA Program in Food and Agricultural Business and the Center for Food and Agricultural Business at Purdue University and a Professor in the Purdue Department of Agricultural Economics.
Purdue University is committed to the policy that all persons shall have equal access to its programs and employment without regard to race, color, creed, religion, national origin, sex, age, marital status, disability, public assistance status, veteran status, or sexual orientation.

Table of Contents
INTRODUCTION ...................................................................................................................................................... 1
QUESTIONNAIRE AND D ATA A NALYSIS N OTES ..... ............................... .. ............ ............ . .. .............. .... ..... ... ...... . ... ..... 1
THE RESPONDENTS ...................................................................... ~ ......................................................................... 2
TRADITIONAL SERVICES CURRENTLY OFFERED BY RESPONDENTS .................................................. 8
SEED SALES .. ........ ... .......... . .. ..... ....... ............... . ... . ... .. .... .. ... . ........... . .. .. ....... .... ............. ..... ......... ... . .... .... ................. . .. 9 C USTOM A PPLICATION ...... ........... ... .... ..... ................ .. .......... ....... .. ...... ........ .. ... ....... .. ................... ............. ..... .... ...... 10
F ULL-TIME A GRONOMISTS . ....... ...... . ...................... . .............. .. ..... ......... . ....... .. ....... .. ........................... ... .. ....... ... ... .. 13
USE OF PRECISION TECHNOLOGIES AND OFFERINGS OF SITE-SPECIFIC SERVICES ................••. 15
U SE OF P RECISION TECHNOLOGIES . .. .. . .... .. ................................ ........ . .... ............ .. ...... ... ....... .. .... .... ...... .. .. .. . .. .... . .. . .. 15
E XPERIENCE WITH P RECISION SERVICES .. ......... ................................. . ... .. .. .. ...... . ............. ..... ... .... ... ...... .. .. ... .. ....... . .. 18
P RECISION S ERVICE OFFERINGS . .... . .... . .. .. .... ......... . ....... ... .. ............ . .... ... .. ......... ......... .... .... . ........ .. ........... .. .. ....... ..... 18
A Focus on Soil Sampling .............. ........ ...................... .................................................... ................... 21 v ARIABLE RATE SEEDING ...................... .. .. ............ ........... .. ................. ............ . ..... ........ ... .. ... ..... ....... . .. ... .. ... .... ... ... . 2 4
VARIABLE RATE APPLICATION .. . .. ..... .......... .. ....... . ...... . .. ...... .. .......... ....... ..... ..... ... ...... ....... ...... ...... ................... .. .... . 2 5
PRICING S ITE-SPECIFIC SERVICES . .. ... .... .......... ... ...... .... ...... ....... . ... . ..... .. ... .. .. .. ...... . ........ . .... ... .. ... ........ ..... .... . ......... .. 3 1
P ROFITABILITY OF P RECISION SERVICE O FFERINGS .. .. ............ ....... . .... . ...... ..... ..... .. ............... . ...... ..... .. ..... ......... .. . .. .. 32
C USTOMER U SE OF S ITE-SPECIFIC S ERVICES ... ........ . ........ ............ .. ... ...... .. ... ....... ..... ........ .. . .. ........ ......... . .... . ..... ... . . . 35
C OMPARING P RECISION AND TRADITIONAL CUSTOMERS ................ ... .. .... . ... . .... ... ... .. .. ... ...... ...... .. .. .... ... .. . ............. ... 39
USE OF EMAIL ............. .............. .............. ........... ....... .. ... ....... ........ .. ...................... ............................. ....... ........ ....... 41
SUMMARY ............................................................................................................................................................... 42
APPENDIX I: QUESTIONNAIRE ........................................................................................................................ 43

List of Figures
FIGURE I . STATES REPRESENTED .............. ........ .... ......... ..... ...... ...... .................................... ... ... ............... ..... ................ 3
FIGURE 2. ORGANIZATION TYPES BY REGION ........ .. ..... .................................................................... ........................ .... 3
FIGURE 3. NUMBER OF RETAlL OUTLETS OWNED OR MANAGED ............................... .... ............................. .......... .. .. .... 4
FIGURE 4 . NUMBER OF RETAlL OUTLETS OWNED OR MANAGED BY REGION . ................ ..... .................. . ... ............ ..... ... 4
FIGURE 5. T OT AL 2002 ANNUAL AGRONOMY SALES AT LOCATION ............ . .... . .. . ... ....... .............. . ........ ....... . ..... ........ ... 5 .. F IGURE 6. T OT AL 2002 ANNUAL AGRONOMY SALES AT LOCATION BY 0RGANIZA TIONAL TYPE IN THE M IDWEST ... .... 5
F IGURE 7 . RESPONSIBILITY OF SURVEY RESPONDENT ............. .................. .......................................... ....... .......... . . .... ... 6
FIGURE 8. AVERAGE CUSTOMER SIZE ....................... .............. . ................ ... ... ................................................. . ........ ... . . 7
FIGURE 9. A VERA GE CUSTOMER SIZE BY REGION ........................... ..................................... . .... ... ................................ 7
FIGURE I 0. TRADmONAL A GRONOMIC SERVICES OFFERED BY REGION .. ....... . ............... ...................... .............. . .... .... 8
FIGURE 11 . TRADmONAL AGRONOMIC SERVICES OFFERED BY 0RGANlZA TIONAL TYPE IN THE MIDWEST .... .... ..... ..... 9
FIGURE 12 . SEED SALES AS A PERCENT OF A GRONOMY REVENUE ........ .. ...... .. ....... . ........ ........................................... JO
FIGURE 13 . A CRES CUSTOM APPLIED ........................................... ................. ... ............... ..................... ............ . .. . ...... I 0
FIGURE 14. A CRES CUSTOM APPLIED BY REGION ...................... ...... ...... .................................. ........... ................... ..... 11
FIGURE 15. A CRES CUSTOM APPLIED BY ORGANIZATIONAL TYPE IN THE MIDWEST ............. ...... .. ................. .. ........... 11
FIGURE 16 . CUSTOM APPLICATION OF F ERTILIZER AND PESTICIDES ............................... .... .................... ... ........ ... ....... 12
FIGURE 17. CUSTOM APPLICATION OF FERTILIZER AND P ESTICIDES BY REGION ......... . .... ... .......... ........... .... ... .. ..... .... . 13
FIGURE 18. FULL-TIME AGRONOMISTS AVAILABLE ................. ..... .... ..... .......... ...... .. ........................... . .................. ..... . 13
FIGURE 19. AVERAGE NUMBER OF A GRONOMISTS AVAILABLE BY ORGANIZATIONAL TYPE IN THE M IDWEST ........ ... 14
FIGURE 20. USE OF PRECISION TECHNOLOGY ................ ............................................. . .. .... . ........................................ 15
FIGURE 21. USE OF P RECISION TECHNOLOGY BY REGION .. ... ................. ............................... . .... ......... ........... .......... ... 16
FIGURE 22. U SE OF P RECISION TECHNOLOGY BY 0RGANIZA TIONAL TYPE IN THE MIDWEST ..... ... ... . ............. .......... ... 17
FIGURE 23. PRECISION SERVICES OFFERED A CROSS D EALERSHIP LOCATIONS .......... .. ............... .... .. .... .. .......... ....... .. . 17
F IGURE 24. Y EARS 0FFERJNG PRECISION SERVICES ............. ........ .... ... ......... ... ..................... .............. .. .... .. .. ........ .... ... 18
FIGURE 25. P RECISION AG SERVICES OFFERED OVER TIME .... ....... ....... . .. ............... . ....................... ........ ....... ............. 19
FIGURE 26. P RECISION AG SERVICES OFFERED BY REGION ................ ............ ....................... ............. .. ................. ..... 20
FIGURE 27. P RECISION AG SERVICES OFFERED BY ORGANIZATIONAL TYPE IN THE MIDWEST .. .......... .................. .. .... 2 1
FIGURE 28. TYPES OF SOIL SAMPLING OFFERED .................. ...... ...... ... ........ . ..... ... ... . ....... ..... ............................ .... ... ... . 21
FIGURE 29. TYPES OF SOIL SAMPLING OFFERED OVER TIME .. ...................... ......................... .......................... .... .. . .... 22
FIGURE 30. GRID SIZES U SED IN GRID SAMPLING··································· ······ ·················· ···················· ··· ············ ········ · 22
FIGURE 3 I . TYPES OF S OIL SAMPLING OFFERED BY REGION ...................................... ..... .......... ........................ .......... 23
FIGURE 32. TYPES OF SOIL SAMPLING OFFERED BY ORGANIZATIONAL TYPE IN THE MIDWEST ....... .......................... . 23
FIGURE 33. VARIABLE RATE SEEDING OFFERED OVER TIME ..... ..................... ... ........................................... .............. 24
FIGURE 34. VARIABLE RATE SEEDING OFFERED BY REGION ......................... ..... .......... ....... . ........................ ........... .... 24
FIGURE 35. VARIABLE RATE SEEDING OFFERED BY ORGANIZATIONAL TYPE IN THE MIDWEST .......... . ..... ..... .. .. . ........ 25
11
FIGURE 36. PRECISION APPLICATION OFFERED OVER TIME ...................... . ................... .. ......... .... ........................... .... 26
FIGURE 3 7. PRECISION APPLICATION OFFERED FOR EACH INPUT TYPE ...... ... .. ....... ...... ............. ....... ...... .... .... ............ 27
FIGURE 38. PRECISION APPLICATION OF FERTILIZER OFFERED BY REGION ..................... ........ . .... .... . ............ .... . ..... ... . 28
FIGURE 39. PRECISION APPLICATION OF LIME OFFERED BY REGION ................ ... .. ........ .... .. ... .. .... ... .. ..... . .... ............. ... 28
FIGURE 40. PRECISION APPLICATION OF CHEMICAJ.S OFFERED BY REGION ................................................................. 29
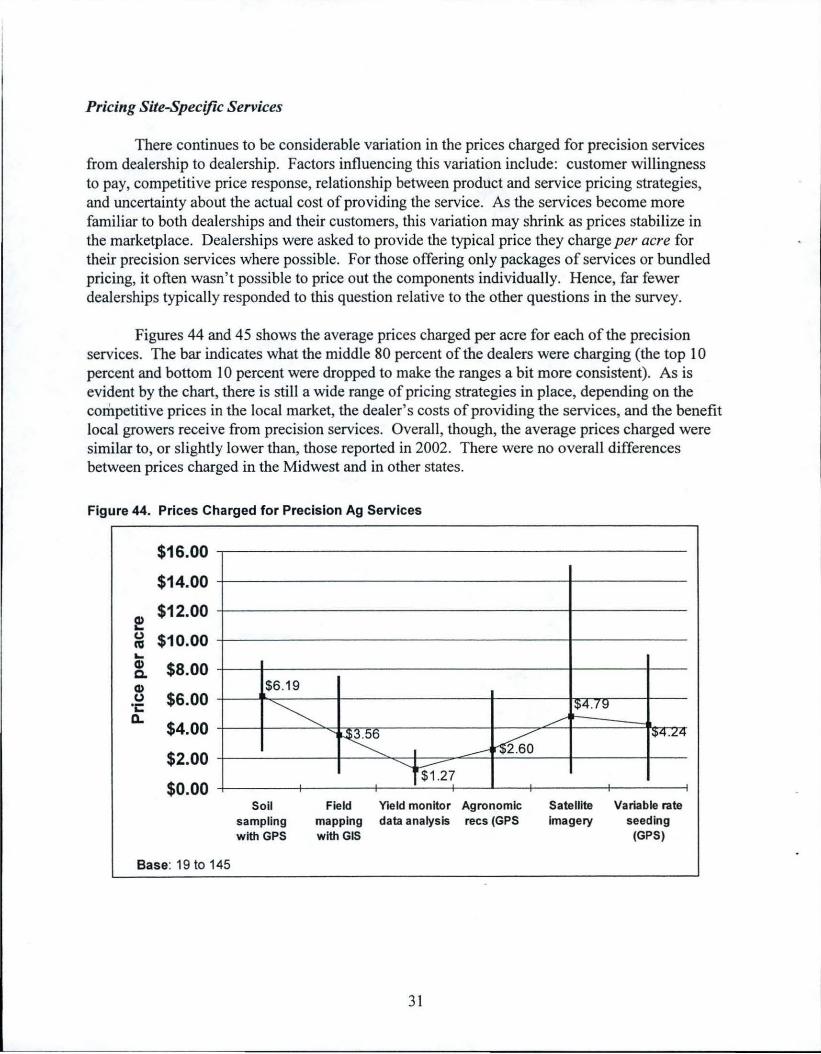
FIGURE 41. PRECISION APPLICATION OF FERTILIZER OFFERED BY ORGANIZATIONAL TYPE IN THE MIDWEST ... . ......... 29
FIGURE 42. PRECISION APPLICATION OF LIME OFFERED BY 0RGANIZA TIONAL TYPE IN THE MIDWEST.. ........ .. ...... .. .. . 30
FIGURE 43 . PRECISION APPLICATION OF CHEMICAI.S0FFERED BY ORGANIZATIONAL TYPE IN THE MIDWEST ............ 30
FIGURE 44. PRICES CHARGED FOR PRECISION AG SERVICES ...... ............................................................................... .. 31
FIGURE 45. PRICES CHARGED FOR PRECISION APPLICATION SERVICES ................................................................... . ... 32
FIGURE 46. PROFIT ABILITY OF PRECISION SERVICE OFFERINGS .......... .... .... .. .. ................. .............. ....................... .. .. .. 33
FIGURE 4 7. PROFIT ABILITY OF PRECISION APPLICATION OFFERINGS ............. ..................... .. ... ..... .. ... .. .................... .. .. 34
FIGURE 48. RESPONDENTS MAKING A PROFIT FROM PRECISION S ERVICES ....... .. .......... .. .. .. ........ ... .............. ......... ...... 34
FIGURE 49. ESTIMATED MARKET AREA USING PRECISION SERVICES ............. . .. .. .. .... ..... .... .. .. ..... ...... .... .... ..... .. .... ...... 35
FIGURE 50. ESTIMATED MARKET AREA USING SINGLE NUTRIENT CONTROLLER-DRIVEN APPLICATION .. .... ....... ....... 36
FIGURE 51. ESTIMATED MARKET AREA USING MULTI-NUTRIENT CONTROLLER-DRIVEN APPLICATION ............... .. ... 36
FIGURE 52. ESTIMATED MARKET AREA USING PRECISION SERVICES IN THE MIDWEST .. .. .. ... .... ................. .. .............. 37
FIGURE 53 . ESTIMATED MARKET AREA USING PRECISION SERVICES IN THE OTHER STATES .. ...... .. ... .. ... ... .. . .. ........ .. .. 37
FIGURE 54. ESTIMATED MARKET AREA USING VARIABLE RATE APPLICATION JN THE MIDWEST ........... .... .. ....... ... .. .. 38
FIGURE 55 . ESTIMATED MARKET AREA USING VARIABLE RATE APPLICATION IN OTHER STATES .... .... .. ............ ... ..... 38
FIGURE 56. COMPARING PRECISION AND TRADmONAL CUSTOMERS .. .............. .. .......................... .. ............................ 39
FIGURE 57. COMPARING PRECISION AND TRADmONAL CUSTOMERS IN MY B USINESS ............... .. .... ...... .. .................. 40
FIGURE 58. CUSTOMERS COMMUNICATED WITH VIA EMAIL ................... .... .............................................. .. .... ...... ..... 41
111

Introduction
2003 Precision Agricultural Services Dealership Survey Results
The use of precision technologies in agriculture continues to become more mainstream. More growers expect their local dealers to have the technology available, while more dealers incorporate it into their day-to-day business operations. Dealers appear to be using this technology where it makes sense for their businesses - both internally and in offering services to their customers. Growth has continued to occur, not necessarily rapidly, but in a definite steady pattern. For the first time since this survey was initiated, more than two-thirds of the survey respondents said they used precision technologies in some way in their dealerships.
This year marked the 8th annual Precision Agriculture Dealership Survey sponsored by Crop Life magazine and Purdue University's Center for Food and Agricultural Business. As in previous years, the survey was designed to gain a better understanding of who is adopting precision technologies and how quickly they' re adopting. In addition, the survey was designed to poll the industry as to future plans for implementing precision technologies.
The survey was conducted in late January to early March 2003. The questionnaire was sent to 2500 retail agronomy dealerships across the U.S. A second questionnaire was mailed to participants approximately two weeks after the first one as a reminder to complete and return it. (See Appendix I to this report for a copy of the questionnaire.) A total of 488 questionnaires were returned, with 447 being usable, providing an effective response rate of 18 percent. This response rate was higher than the last 2 years, though not as high as some other years. (Response rates have ranged from a high of 3 8 percent in 1996 to a low of 11 percent in 2001.)
Dealerships were asked questions about the types of precision services they offer and/or use in their businesses, the fees they are charging for precision services, how fast their customers are adopting precision agriculture practices, and how profitable they are finding precision services to be in their businesses. The responses to these questions provide insight into where dealers are in adopting precision technologies and some of the changes they expect in the fu~ure.
Questionnaire and Data Analysis Notes
As in other years, questionnaires were deemed "unusable" for several reasons. Some questionnaires were not filled out completely; others were from wholesalers who did not sell directly to farmers; some respondents sold only seed, while a few were from farmers. Like last year' s response, the unusable rate was slightly higher than previous years due to wording changes that enabled responding wholesalers and farmers to be identified more easily. Consistent with 2002, one question asked specifically how many retail outlets the respondent's firm had. Because the survey' s focus was on dealers, if the respondent indicated the firm had no retail outlets, the questionnaire was deemed "unusable." In prior years, these respondents were identified only by comments that they made on the questionnaire itself.
1
r
•
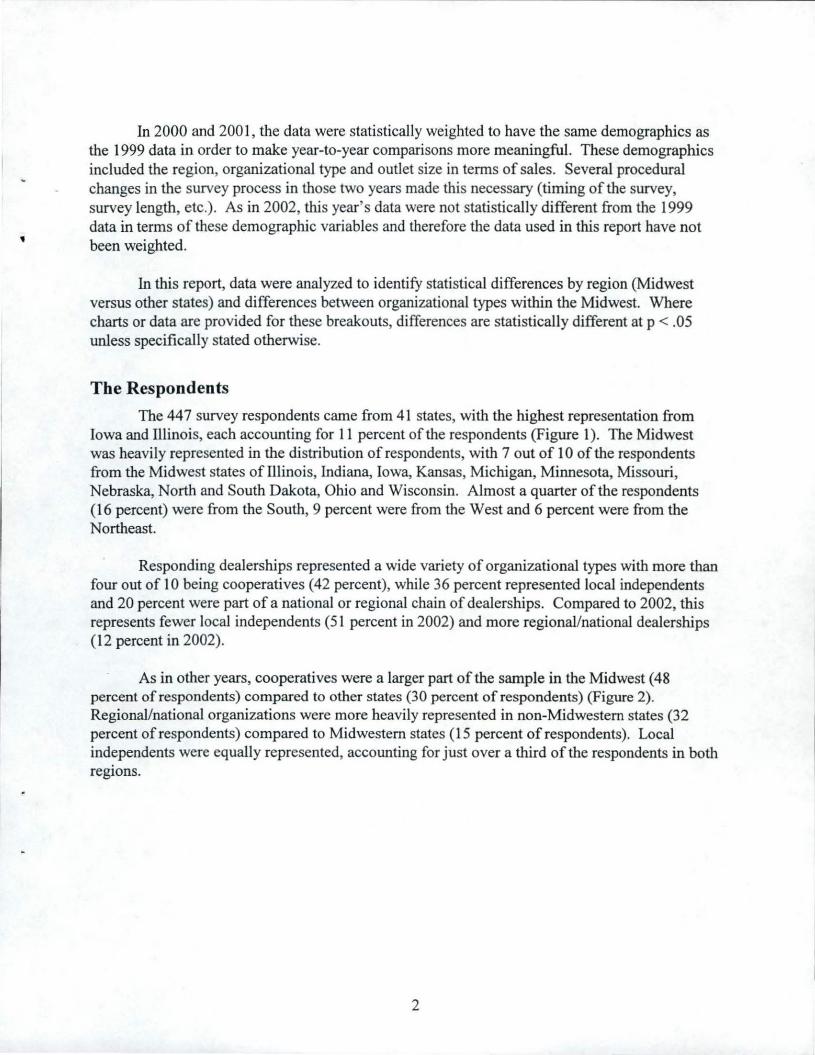
In 2000 and 2001, the data were statistically weighted to have the same demographics as the 1999 data in order to make year-to-year comparisons more meaningful. These demographics included the region, organizational type and outlet size in terms of sales. Several procedural changes in the survey process in those two years made this necessary (timing of the survey, survey length, etc.). As in 2002, th.is year's data were not statistically different from the 1999 data in terms of these demographic variables and therefore the data used in this report have not been weighted.
In this report, data were analyzed to identify statistical differences by region (Midwest versus other states) and differences between organizational types within the Midwest. Where charts or data are provided for these breakouts, differences are statistically different at p < .05 unless specifically stated otherwise.
The Respondents
The 447 survey respondents came from 41 states, with the highest representation from Iowa and Illinois, each accounting for 11 percent of the respondents (Figure 1 ). The Midwest was heavily represented in the distribution of respondents, with 7 out of 10 of the respondents from the Midwest states of Illinois, Indiana, Iowa, Kansas, Michigan, Minnesota, Missouri, Nebraska, North and South Dakota, Ohio and Wisconsin. Almost a quarter of the respondents (16 percent) were from the South, 9 percent were from the West and 6 percent were from the Northeast.
Responding dealerships represented a wide variety of organizational types with more than four out of IO being cooperatives (42 percent), while 36 percent represented local independents and 20 percent were part of a national or regional chain of dealerships. Compared to 2002, this represents fewer local independents (51 percent in 2002) and more regional/national dealerships (12 percent in 2002).
As in other years, cooperatives were a larger part of the sample in the Midwest ( 48 percent of respondents) compared to other states (30 percent of respondents) (Figure 2). Regional/national organizations were more heavily represented in non-Midwestern states (32 percent of respondents) compared to Midwestern states (15 percent of respondents). Local independents were equally represented, accounting for just over a third of the respondents in both regions.
2
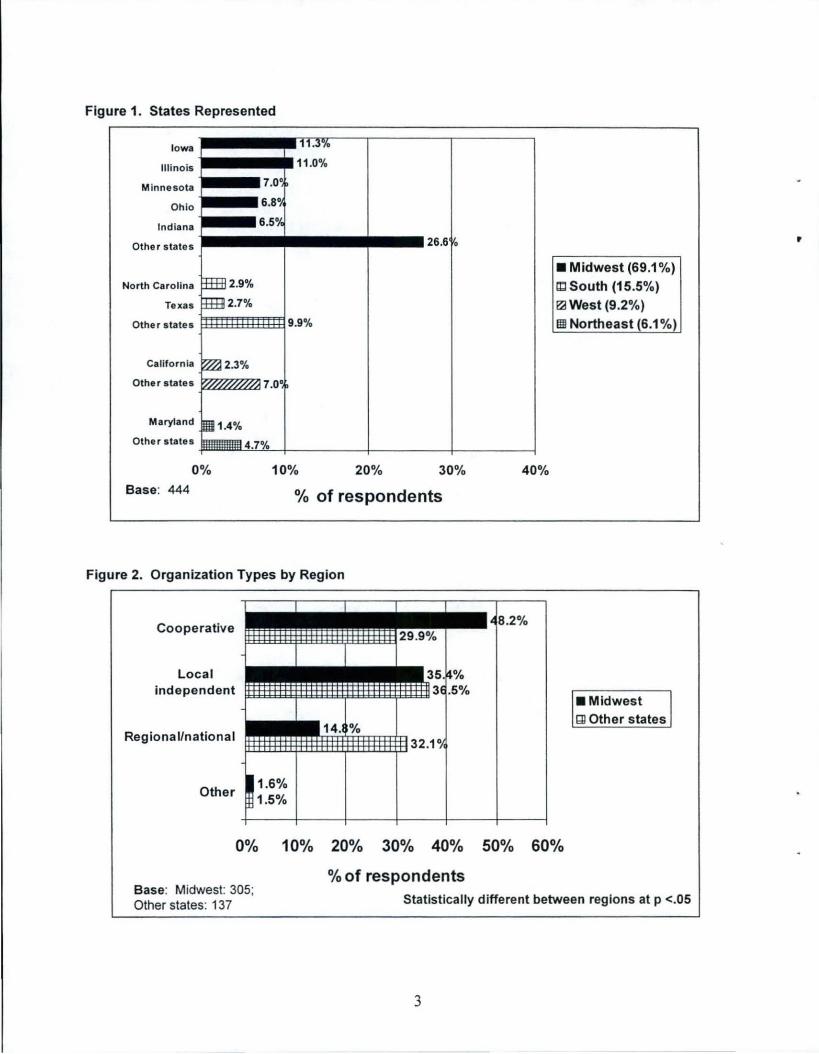
Figure 1. States Represented
Iowa •••••• 11."33--l----1---I Illinois •••••• 11.0%
Minnesota l ••• 7.0°
Ohio • --6.8°
Indiana •••I 6·50
/c Othe r s tates •••••••••••••• 26.6 o
North Carolina
Texas
California
Maryland
Other states jmJlll!ill~~LL ____ L ____ L ___ _J
0% 10% 20% 30%
Base: 444 % of respondents
Figure 2. Organization Types by Region
Cooperative
Local independent
Regional/national
Other
40%
•Midwest (69.1%)
ltl South (15.5%) ~ West (9 .2%) 1!11 Northeast (6.1% )
•Midwest Ql Other states
0% 10% 20% 30% 40% 50% 60%
Base: Midwest: 305; Other states: 137
% of respondents Statistically different between regions at p <.05
3
'

'
The size of the responding dealerships ranged from one outlet (33 percent of the respondents) to more than 25 outlets (17 percent of the respondents) (Figure 3). When the number of retail outlets were broken out by region, respondents in the Midwest were more likely to be from firms with 2 to 5 outlets while respondents in other states were more likely to represent firms at each extreme - either firms with one outlet or firms with more than 25 outlets (Figure 4). In the Midwest, local independents were significantly more likely to have only one retail outlet (57 percent) while cooperatives typically had 2 to 15 outlets (70 percent) and regional/national organizations had over 25 outlets (72 percent of the respondents).
Figure 3. Number of Retail Outlets Owned or Managed
One
2-5
6-15
16-25
More than 25
0% 10% 20% 30% 40% 50% 60%
% of respondents Base: 439
Figure 4. Number of Retail Outlets Owned or Managed by Region
•Midwest ai Other states
0% 10% 20% 30% 40% 50% 60%
% of respondents Base: Midwest: 302 Other states: 135 Statistically different between regions at p <.05
4
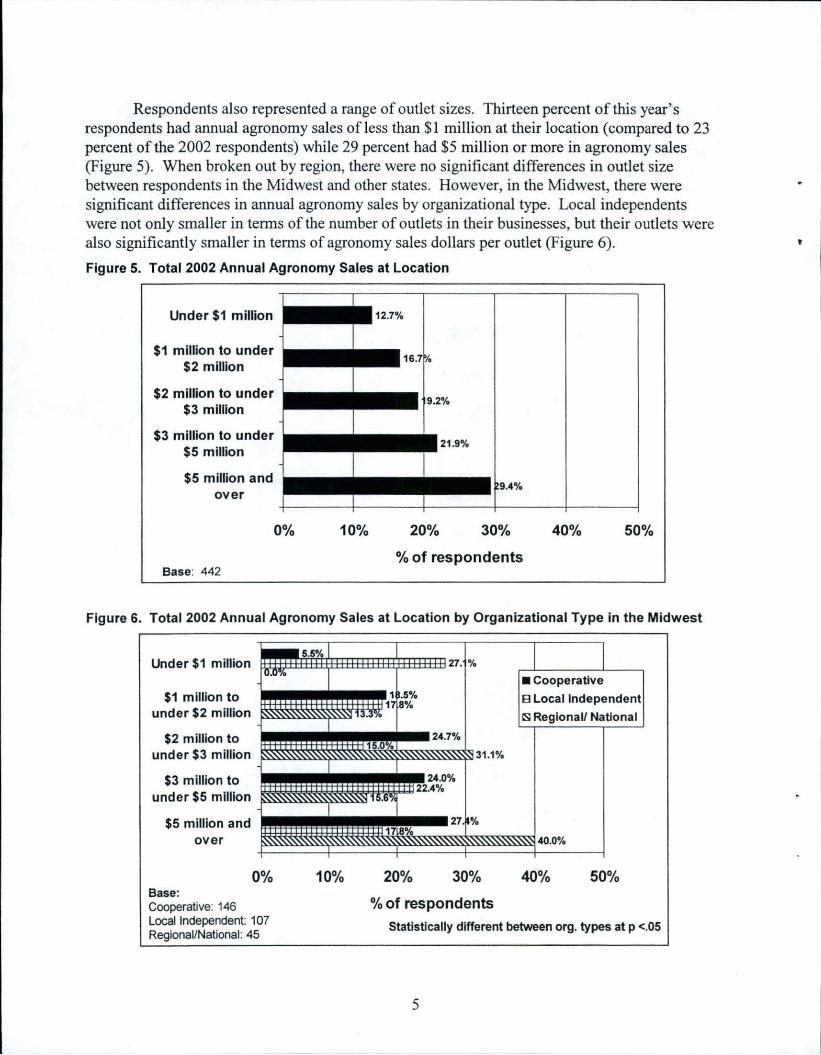
Respondents also represented a range of outlet sizes. Thirteen percent of this year's respondents had annual agronomy sales of less than $1 million at their location (compared to 23 percent of the 2002 respondents) while 29 percent had $5 million or more in agronomy sales (Figure 5). When broken out by region, there were no significant differences in outlet size between respondents in the Midwest and other states. However, in the Midwest, there were significant differences in annual agronomy sales by organizational type. Local independents were not only smaller in terms of the number of outlets in their businesses, but their outlets were also significantly smaller in terms of agronomy sales dollars per outlet (Figure 6).
Figure 5. Total 2002 Annual Agronomy Sales at Location
Under $1 million
$1 million to under $2 million
$2 million to under $3 million
$3 million to under $5 million
$5 million and over
Base: 442
0% 10% 20% 30% 40% 50%
% of respondents
Figure 6. Total 2002 Annual Agronomy Sales at Location by Organizational Type in the Midwest
Under $1 million
$1 million to under $2 million
$2 million to under $3 million
$3 million to under $5 million
$5 million and over
Base: Cooperative: 146
0%
Local Independent: 107 Regional/National: 45
10% 20% 30%
% of respondents
•Cooperative 8 Local Independent ~Regional/ National
40% 50%
Statistically different between org. types at p <.05
5
'

Two-thirds of the questionnaires were completed by the owner or manager of the outlet (66 percent), while 16 percent of the respondents were involved in sales (Figure 7). Technical consultants and "precision managers" accounted for 9 percent of the respondents. Respondents' positions did not vary region but they did vary by organizational type. In the Midwest, the owner/manager was the most common position for all three types of organizations. Eighty-one percent of the respondents representing local independents owned or managed the location, while 57 percent of the respondents representing cooperatives were the owners or managers and 56 percent of those representing regional/national organizations were owners/managers.
Figure 7. Responsibility of Survey Respondent
Base: 444
Sales/sales mgr 16.0%
Department mgr 9 .5%
Tecmcal constJtant 6.5%
Precision mgr 1.1%
To better understand the size of growers in the dealerships' markets, respondents were asked for the average size (in acres) of their customers. More than 6 out of 10 of the respondents said their average customer farmed more than 500 acres (66 percent ofrespondents) with 24 percent of the respondents indicating their average customer farmed more than 1000 acres (Figure 8). As expected, the average customer size varied greatly across geographic regions. Over half of the respondents in the Midwest said their average customer farmed between 501 and 1000 acres (51 percent) and another 22 percent of the Midwestern respondents said their average customer farmed over 1000 acres. The average customer size for dealerships in other (nonMidwest) states was almost evenly divided among the four size categories (Figure 9). There were no statistical differences in average customer size across organizational types.
6

Figure 8. Average Customer Size
501-1 000 acres 43.2%
201-500 acres 23.5%
% of respondents Base: 442
Figure 9. Average Customer Size by Region
Under 200 acres
201-500 acres
501-1000 acres
Over1000 acres
Over 1000 acres 23.8%
9.5%
•Midwest
51 .3% Ell Other states
0% 10% 20% 30% 40% 50% 60%
Base: Midwest: 304 Other states: 135
% of respondents Statistically different between regions at p <.05
7

Traditional Services Currently Offered by Respondents
The most common traditional agronomic services offered by the responding dealerships were seed sales, soil sampling and custom application (93, 91 and 89 percent of the respondents, respectively). Over three-quarters of the respondents offered some form of agronomic consulting (83 percent). Over half offered computerized field mapping (54 percent) while 43 percent offered record keeping. Only 1 percent of the respondents did not provide at least one of the traditional agronomic services listed on the questionnaire. Many of these service offerings varied statistically by region. More respondents in the Midwest said their dealerships offered seed sales, custom application and computerized field mapping (Figure 10) than did respondents from other states. There were no statistical differences between regions in their offerings of soil sampling, agronomic consulting, or record keeping.
Figure 10. Traditional Agronomic Services Offered by Region
Seed sales* 95.4% 113.9%
Soil sampling sl.~~ %
Custom application * TI:CJ% 92 .• %
Agronomic consulting 84.4% '8.8%
62.9% 3~ 3% Computerized field mapping *
45.3% ~ >.5% f •Midwest I
~ 1.0% [JI Other states
1.5%
Record keeping
None of the above I
0% 20% 40% 60% 80% 100%
% of respondents Base: Midwest: 307 Other states: 137 * Statistically different between regions at p <.05
8
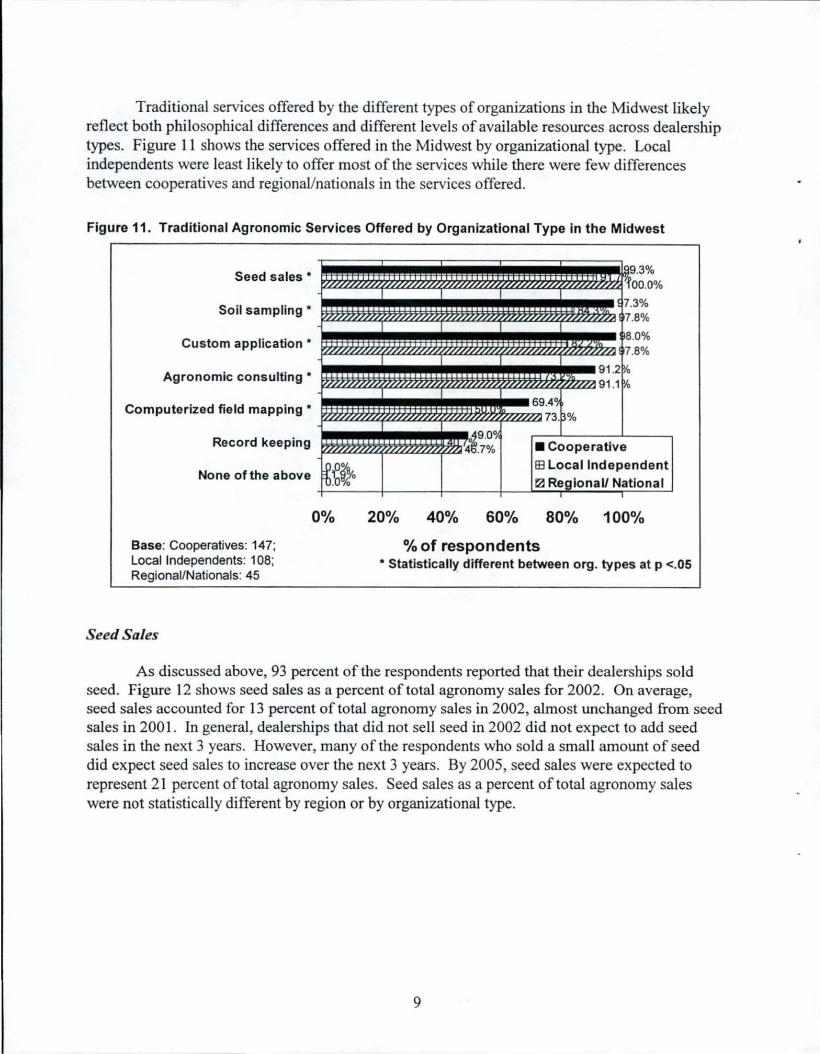
Traditional services offered by the different types of organizations in the Midwest likely reflect both philosophical differences and different levels of available resources across dealership types. Figure 11 shows the services offered in the Midwest by organizational type. Local independents were least likely to offer most of the services while there were few differences between cooperatives and regional/nationals in the services offered.
Figure 11. Traditional Agronomic Services Offered by Organizational Type in the Midwest
Seed sales•
Soil sampling •
Custom application •
Agronomic consulting •
Computerized field mapping •
Record keeping
None of the above
Base: Cooperatives: 147; Local Independents: 108; Regional/Nationals: 45
Seed Sales
9.3% lfl 'foo.oo/o .,,,,,, ,,, ,, ,, ,, ,, ,, ,, ,, ,, ,, ,,, ,, ,, ,, ,, ,, ,, ,, ,, ,, .,, ,, ,, ,,, ,; ,, ,, ,,, ,, ,, ,, ,, ,,,
! 7.3% r//./,,,,,,~ ',,,,,,,,,,,,,,,,,,,,,, '/ / ///////I ~ff/////////////////~ I 7.8%
98.0% .,, ,, ,, ,, ,, ,, ,, ,, ,, / , ,,,,, , , , ,,,,, .,,,,,,,,,,,,,,,,,, n / , -,,,. ,,,,,,,, ,, 7.8%
f · '
91 .2~ ,,,,,,,,,,,,,,, .,,,,,,,,,,, .,,,,, ,,,,, 91 .1 ~
69.4~ ~ .. .,,,,,,,,,,,,,,, . ,,,,,,,,,,, 73 . ~%
,,,, ,,,,,,,,,,, ,,,,,,,,,,,,,,, ~9.0~ .14 .7% • Cooperative
~~~o B3 Local Independent ~ Regional/ National
I I
0% 20% 40% 60% 80% 100%
% of respondents • Statistically different between org. types at p <.05
As discussed above, 93 percent of the respondents reported that their dealerships sold seed. Figure 12 shows seed sales as a percent of total agronomy sales for 2002. On average, seed sales accounted for 13 percent of total agronomy sales in 2002, almost unchanged from seed sales in 2001. In general, dealerships that did not sell seed in 2002 did not expect to add seed sales in the next 3 years. However, many of the respondents who sold a small amount of seed did expect seed sales to increase over the next 3 years. By 2005, seed sales were expected to represent 21 percent of total agronomy sales. Seed sales as a percent of total agronomy sales were not statistically different by region or by organizational type.
9

Figure 12. Seed Sales as a Percent of Agronomy Revenue
II)
~
:X None >-E 0
g 1to10% ... Cl ~
'O ~ 11to25% 0
~
II) ~
111 26 to 50% ~ ~ Ill
-g 50% plus GI I/)
8.4% 7.2%
•2002
IEI 2005 Projected
0% 20% 40% 60% 80% 100%
Base: 419 % of respondents
Average: 2002: 12.5%; 2005: 20.8%
Custom Application
As indicated earlier, 89 percent of the respondents said their dealerships offered custom application. (Custom application here is defined as dealership application of fertilizer, pesticides, and/or custom seeding.) Over half of the respondents custom applied more than 25,000 acres per year (59 percent) (Figure 13). Across the U.S., however, custom application was most common in the Midwest where 92 percent of the respondents offered custom application services compared to 81 percent of the respondents from other states (Figure 14 ).
Figure 13. Acres Custom Applied
No custom application
Under 10,000 acres
10,001 to 25,000 acres
25,001 to 50,000 acres
Over 50,000 acres
Base: 443
0% 20% 40% 60% 80% 100%
% of respondents
10

Figure 14. Acres Custom Applied by Region
No custom application
Under 10,000 acres
10,001 to 25,000 acres
25,001 to 50,000 acres
Over 50,000 acres
0% 20%
•Midwest 1±1 Other states
40% 60% 80% 100%
Base: Midwest: 305; Other states: 135
% of respondents Statistically different between regions at p <.05
Reflecting the overall higher level of focus on services by cooperatives and regional/nationals, 98 percent of the respondents representing cooperatives and regional/nationals in the Midwest offered custom application compared to 82 percent of the local independents (Figure 15). Over a third of the cooperatives and regional/national outlets in the Midwest custom applied over 50,000 acres in 2002.
Figure 15. Acres Custom Applied by Organizational Type in the Midwest
No custom application
Under 10,000 acres
10,001 to 25,000 acres
25,001 to 50,000 acres
Over 50,000 acres
0%
Base: Cooperatives: 146; Local Independents: 107 Regional/Nationals: 45
20% 40% 60%
% of respondents
•Cooperative Bl Local Independent eJ RegionaU National
80% 100%
Statistically different between org. types at p <.05
11
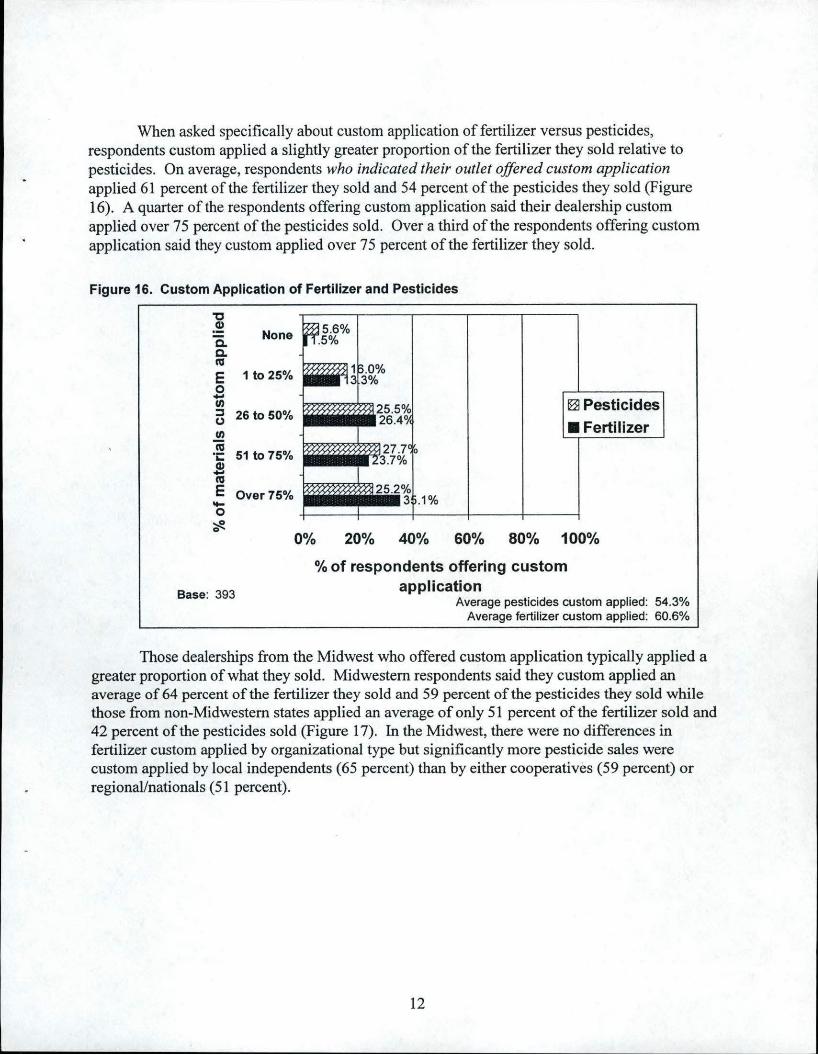
When asked specifically about custom application of fertilizer versus pesticides, respondents custom applied a slightly greater proportion of the fertilizer they sold relative to pesticides. On average, respondents who indicated their outlet offered custom application applied 61 percent of the fertilizer they sold and 54 percent of the pesticides they sold (Figure 16). A quarter of the respondents offering custom application said their dealership custom applied over 75 percent of the pesticides sold. Over a third of the respondents offering custom application said they custom applied over 75 percent of the fertilizer they sold.
Figure 16. Custom Application of Fertilizer and Pesticides
"O Q)
c. None c. cu E 1to25% 0 .... U) ::::s 26 to 50% (J
U) c; "i:: 51to75% Q) .... cu E Over75% -0 ~ 0
Base: 393
~ Pesticides
• Fertilizer
0% 20% 40% 60% 80% 100%
% of respondents offering custom application
Average pesticides custom applied: 54.3% Average fertilizer custom applied: 60.6%
Those dealerships from the Midwest who offered custom application typically applied a greater proportion of what they sold. Midwestern respondents said they custom applied an average of 64 percent of the fertilizer they sold and 59 percent of the pesticides they sold while those from non-Midwestern states applied an average of only 51 percent of the fertilizer sold and 42 percent of the pesticides sold (Figure 17). In the Midwest, there were no differences in fertilizer custom applied by organizational type but significantly more pesticide sales were custom applied by local independents (65 percent) than by either cooperatives (59 percent) or regional/nationals (51 percent).
12

Figure 17. Custom Application of Fertilizer and Pesticides by Region
~ 100% ~~~~~~~~~~~~~~.=-=-=M~ld~w-e-s~t--, .9! ~ Ell Other states ~ 80% -+--~~~~~~~~~~~~~~~~---! E ~ 64.4% ::i
~ 60% ... ·c s e 40% 0
0% Fertilizer
Base: Midwest: 281 ; Other states: 109
Full-Time Agronomists
59.2%
Pesticides
Statistically different between regions at p <.05
To support these services, many dealerships had agronomists available, either full-time on staff or shared with other locations. On average, the respondents had 1.5 full-time agronomists available on staff and shared an average of 1.4 agronomists with other locations. Two-thirds of the responding dealerships had at least one full-time agronomist on staff at their location (65 percent) (Figure 18), however several of those with no full-time agronomist at their location did have one available for their use at another location. Just under a quarter of the respondents (22 percent) had no full-time agronomist available to them at all.
Figure 18. Full-time Agronomists Available
Base: 382
One 30%
On-staff
more 6%
One
........ : ... :.:
'.; •.. Two 9%
Three 4%
more 10%
At other locations
NOTE: 21.7% had no agronomist available
13

Though there were no differences in the number of agronomists available between regions, in the Midwest the type of organization did have an impact. Regional/national organizations had the largest number of agronomists available (an average of 2.1 on staff versus 1. 7 agronomists available for cooperatives and 1.1 for local independents) (Figure 19). Cooperatives were more likely to have shared agronomists, with an average of 2.0 agronomists available that were shared between locations, compared to 1.0 shared agronomists for regional/national organizations and 0. 7 for local independents.
Figure 19. Average Number of Agronomists Available by Organizational Type in the Midwest
Full-time agronomists on- mmm:immm:imEl
staff
Full-time agronomists
shared between locations
0 0.5 1
2.1
1.5 2
•Cooperative EH Local Independent ~ Re lonal/ National
2.5 3
Base: Cooperatives: 128; Local Independents: 99 Regional/Nationals: 34
% of respondents
Statistically different between org. types at p <.05
14

Use of Precision Technologies and Offerings of Site-Specific Services
Respondents were asked several questions about their use of precision technologies and which site-specific services they were currently offering (or would be offering by the fall of 2003).
Use of Precision Technologies
Dealerships were asked how they were using precision technology in their dealerships -from offering their customers precision services to using precision technologies internally for guidance systems, billing/insurance/legal activities, logistics, or field-to-home office communications (Figure 20). Almost 7 out of 10 of the respondents used precision technologies in some way in their business (69 percent). Almost all of these dealerships (61 percent of all respondents) offered their customers precision services. This was up from last year's results when only 56 percent of the respondents said they offered precision services.
The biggest growth was seen in using GPS (Geographical Positioning System) guidance systems to reduce skips and overlaps when custom applying uniform rates of fertilizer and chemicals. The use of guidance systems grew from 44 percent of the respondents in 2002 to 56 percent of the respondents using the technology in 2003. Field mapping with GIS (Geographical Information Systems) was used for internal purposes by 24 percent of the respondents, up from 20 percent in 2002. OPS for vehicle logistics, and telemetry to send field information from the farm to the home office were both used by fewer than 5 percent of the respondents.
Figure 20. Use of Precision Technology
70%
60%
J!I 50% c Cl> 't:l 40% c 0 c. Ill Cl> ... 30% .... 0 ~ 0 20%
10%
0% 2000 2001
Base: 445
61.1% --+-Precision
55.50/o services offered
-0-GPS guidance system
31.0% ........,_Field mapplngGIS for
23.8% legaVbllllng/ Insurance
--*-GPSfor loglstlcs
4.7% -e - None of the above
2002 2003
NOTE: Telemetry was used by fewer than 2% of respondents each year
15

Precision technology use increased from 2002 to 2003 in both the Midwest and nonMidwestern regions. As in other years, precision technologies were being used by significantly more dealerships in the Midwest than in non-Midwestern states (Figure 21 ). Three-quarters of the respondents in the Midwest (76 percent) said their dealership used precision technologies in some way, compared to just over half of the respondents from other states (53 percent). Over two-thirds of the Midwestern respondents offered precision services (69 percent) compared to only a third of the non-Midwestern respondents ( 43 percent). GPS was used in a guidance system by 65 percent of the Midwestern dealerships compared to only 34 percent of the nonMidwestern respondents. There were no statistical differences between regions in the use of field mapping for internal purposes or in the use of GPS for logistics.
Figure 21. Use of Precision Technology by Region
Precision services offered•
GPS guidance system •
Field mapping (GIS) -leg a l/billing/insu ranee
GPS for logistics
None of the above*
Base: Midwest: 305 Other states: 137
0% 20%
•Midwest g Other states
40% 60% 80% 100%
% of respondents • Statistically different at p <.05
In the Midwest, adoption of precision technology varied by organizational type. Approximately 8 out of 10 respondents representing cooperatives and regional/national organizations said they used at least one precision technology (Figure 22) with only 67 percent of the local independents using at least one. Eighty percent of the respondents representing regional/nationals offered precision services to their customers, while almost 75 percent of the cooperatives offered precision services. This can be contrasted to the local independents where only 58 percent of the respondents offered precision services. Internal uses of precision technology were also more likely for the larger regional/national organizations and cooperatives than for the local independents, possibly reflecting the greater overall resources available to these firms.
16
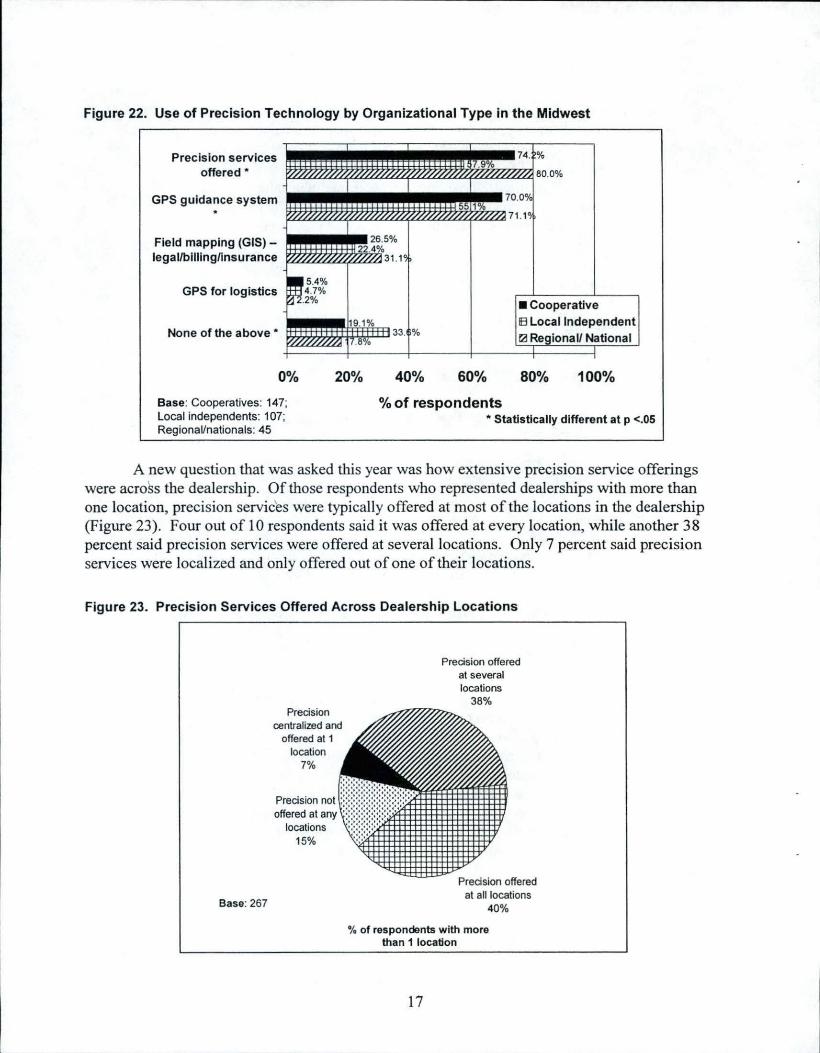
Figure 22. Use of Precision Technology by Organizational Type in the Midwest
Precis ion services offered *
GPS guidance system *
Field mapping (GIS) -legal/bllllng/lnsurance
GPS for logistics
None of the above *
• Cooperative IEI Local Independent r2! Re ional/ National
0% 20% 40% 60% 80% 100%
Base: Cooperatives: 147; Local independents: 107; Regional/nationals: 45
% of respondents * Statistically different at p <.05
A new question that was asked this year was how extensive precision service offerings were across the dealership. Of those respondents who represented dealerships with more than one location, precision servic'es were typically offered at most of the locations in the dealership (Figure 23). Four out of 10 respondents said it was offered at every location, while another 38 percent said precision services were offered at several locations. Only 7 percent said precision services were localized and only offered out of one of their locations.
Figure 23. Precis ion Services Offered Across Dealership Locations
Base:267
Precision centralized and
offered at 1 location
7%
Precision offered at several locations
38%
Precision offered at all locations
40%
% of respondents w ith more than 1 location
17
Experience with Precision Services
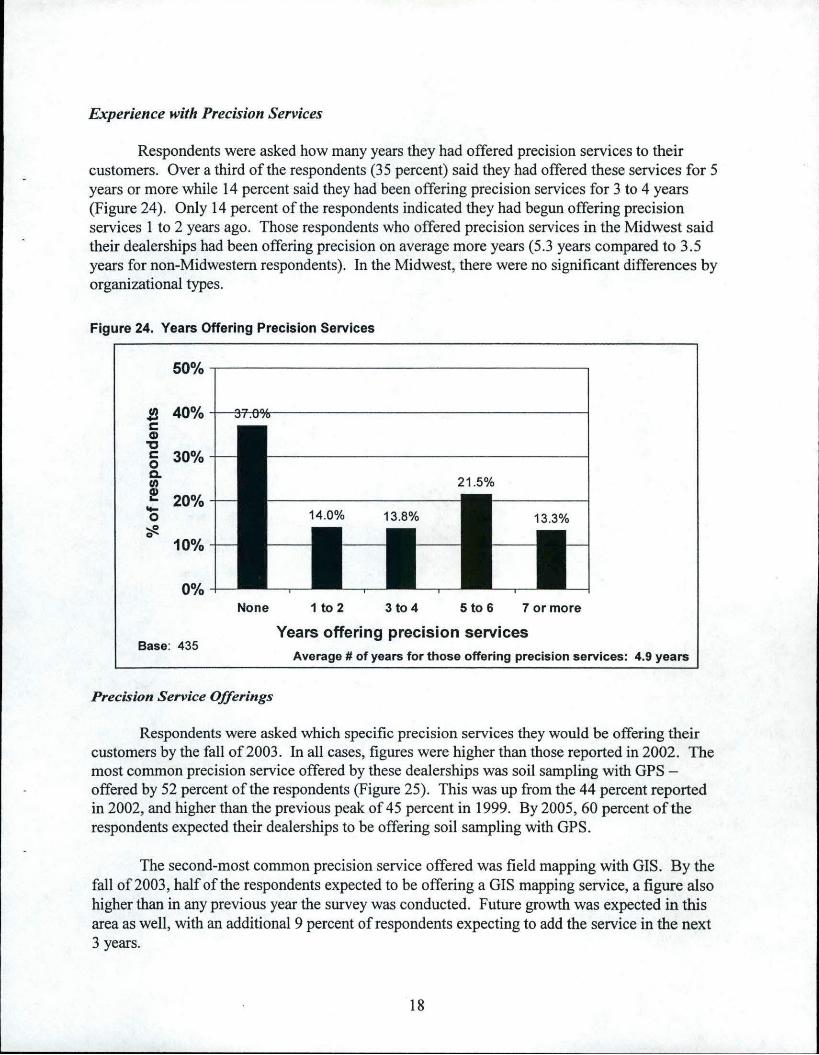
Respondents were asked how many years they had offered precision services to their customers. Over a third of the respondents (35 percent) said they had offered these services for 5 years or more while 14 percent said they had been offering precision services for 3 to 4 years (Figure 24). Only 14 percent of the respondents indicated they had begun offering precision services 1 to 2 years ago. Those respondents who offered precision services in the Midwest said their dealerships had been offering precision on average more years (5.3 years compared to 3.5 years for non-Midwestern respondents). In the Midwest, there were no significant differences by organizational types.
Figure 24. Years Offering Precision Services
J!! 40% c Cl)
"C c 30% 0 c. tn ~ 20% ... 0 ~ 0
10%
None 1to2 3 to 4 5 to 6 7 or more
Base: 435 Years offering precision services
Average# of years for those offering precision services: 4.9 years
Precision Service Offerings
Respondents were asked which specific precision services they would be offering their customers by the fall of2003. In all cases, figures were higher than those reported in 2002. The most common precision service offered by these dealerships was soil sampling with GPS -offered by 52 percent of the respondents (Figure 25). This was up from the 44 percent reported in 2002, and higher than the previous peak of 45 percent in 1999. By 2005, 60 percent of the respondents expected their dealerships to be offering soil sampling with GPS.
The second-most common precision service offered was field mapping with GIS. By the fall of 2003, half of the respondents expected to be offering a GIS mapping service, a figure also higher than in any previous year the survey was conducted. Future growth was expected in this area as well, with an additional 9 percent of respondents expecting to add the service in the next 3 years.
18
~-1
I
]
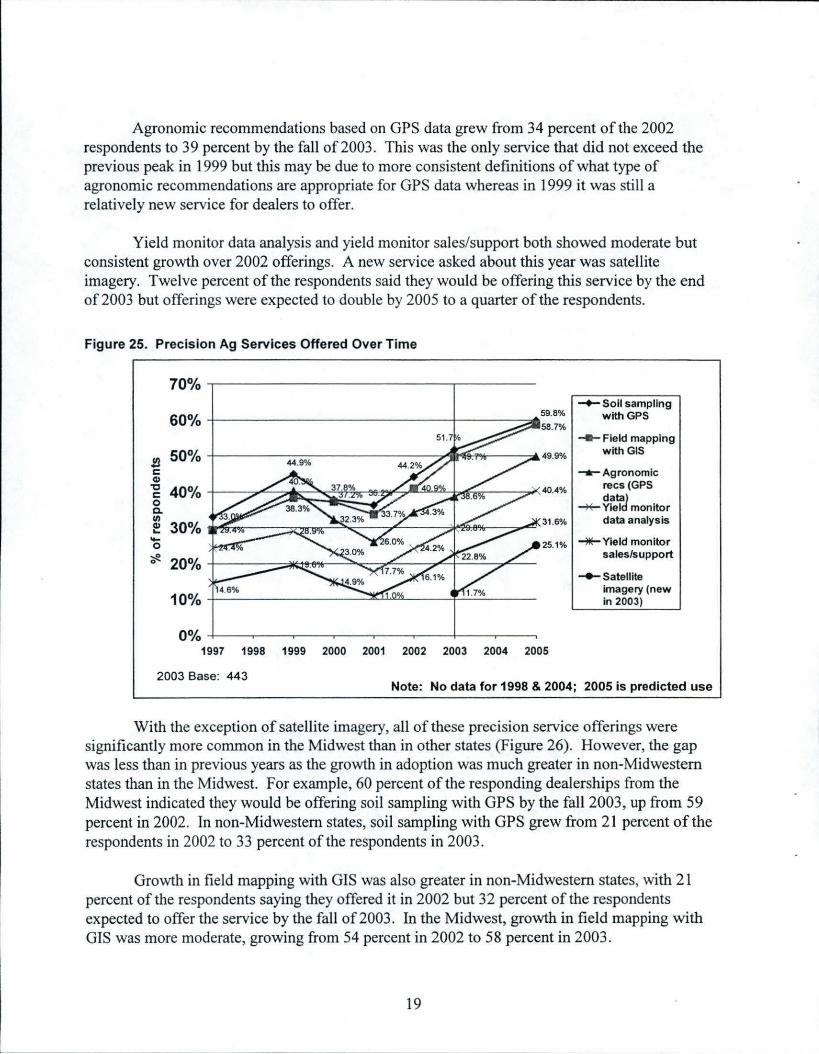
Agronomic recommendations based on GPS data grew from 34 percent of the 2002 respondents to 39 percent by the fall of 2003. This was the only service that did not exceed the previous peak in 1999 but this may be due to more consistent definitions of what type of agronomic recommendations are appropriate for GPS data whereas in 1999 it was still a relatively new service for dealers to offer.
Yield monitor data analysis and yield monitor sales/support both showed moderate but consistent growth over 2002 offerings. A new service asked about this year was satellite imagery. Twelve percent of the respondents said they would be offering this service by the end of 2003 but offerings were expected to double by 2005 to a quarter of the respondents.
Figure 25. Precision Ag Services Offered Over Time
70%
60% 59.8%
-+-Soil sampling with GPS
-e- Field mapping
J!l 50% c G)
"O 40% c 0 Q.
49.9% with GIS
-.-Agronomic
40.4% recs (GPS dataJ
~ Yiel monitor VI G) 30% ... 31 .6% data analysis
.... 0 25.1% _.,.Yield monitor
~ 0 20% sales/support
...,._ Satellite
10% imagery (new in 2003)
001o -+-~-.-~~.--~-.--~-.-~--..--~-t-~--.-~---. 1997 1998 1999 2000 2001 2002 2003 2004 2005
2003 Base: 443 Note: No data for 1998 & 2004; 2005 is predicted use
With the exception of satellite imagery, all of these precision service offerings were significantly more common in the Midwest than in other states (Figure 26). However, the gap was less than in previous years as the growth in adoption was much greater in non-Midwestern states than in the Midwest. For example, 60 percent of the responding dealerships from the Midwest indicated they would be offering soil sampling with GPS by the fall 2003, up from 59 percent in 2002. In non-Midwestern states, soil sampling with GPS grew from 21 percent of the respondents in 2002 to 33 percent of the respondents in 2003.
Growth in field mapping with GIS was also greater in non-Midwestern states, with 21 percent of the respondents saying they offered it in 2002 but 32 percent of the respondents expected to offer the service by the fall of 2003. In the Midwest, growth in field mapping with GIS was more moderate, growing from 54 percent in 2002 to 58 percent in 2003 .
19

The gap between regions continued to be large for agronomic recommendations based on GPS data, yield monitor data analysis, and yield monitor sales/support. For these services, twice as many respondents offered the service in the Midwest as offered them in other states.
Figure 26. Precision Ag Services Offered by Region
Soll sampling with GPS *
Field mapping with GIS *
Agronomic recs (GPS data) *
Yield monitor data analysis •
Yield monitor sales/support *
Satellite imagery
Base: Midwest: 304 Other states: 136
0%
•Midwest D Other states
20% 40% 60% 80% 100%
% of respondents * Statistically different between regions at p <.05
As in previous years, precision service offerings were more extensive in national/regional organizations and cooperatives compared to local independents (Figure 27). In general, in the Midwest, local independents were not as likely to offer these services relative to the other organizational types.
20
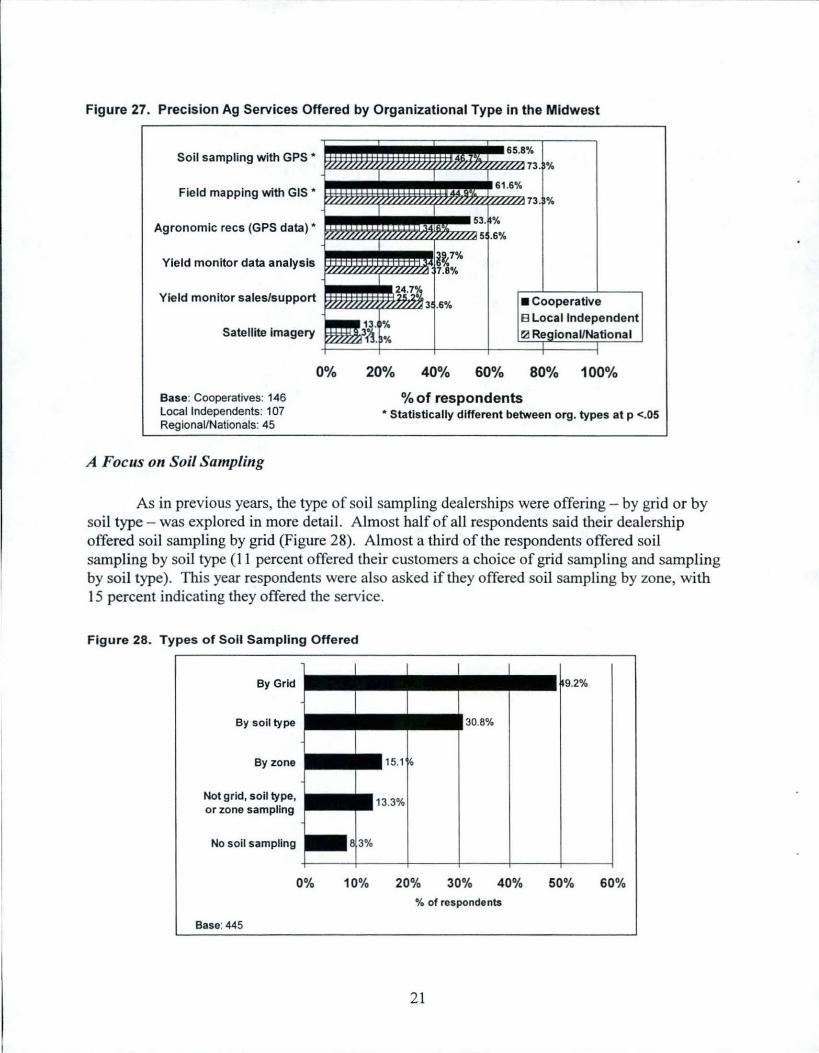
Figure 27. Precision Ag Services Offered by Organizational Type in the Midwest
Yield monitor data analysis
Satellite imagery
0% 20% 40% 60%
• Cooperative
8 Local Independent
ta Re ionaUNatlonal
80% 100%
% of respondents Base: Cooperatives: 146 Local Independents: 107 Regional/Nationals: 45
* Statistically different between org. types at p <.05
A Focus on Soil Sampling
As in previous years, the type of soil sampling dealerships were offering - by grid or by soil type - was explored in more detail. Almost half of all respondents said their dealership offered soil sampling by grid (Figure 28). Almost a third of the respondents offered soil sampling by soil type (11 percent offered their customers a choice of grid sampling and sampling by soil type). This year respondents were also asked if they offered soil sampling by zone, with 15 percent indicating they offered the service.
Figure 28. Types of Soil Sampling Offered
By Grid
By soil type
By zone
Not grid, soil type, or zone sampling
No soil sampling
Base: 445
0% 10% 20% 30% 40% 50% 60%
o/o of respondents
21

Figure 29 shows the changes in types of soil sampling offered over time. After a dip in grid soil sampling in 2000 and 200 I, the offering of grid sampling continued to increase in 2003 . Soil sampling by soil type has remained fairly steady, with 3 in 10 dealerships offering it each year. The biggest growth was seen in the percentage of dealers offering soil sampling in any form, increasing from 84 percent in 2002 to 91 percent in 2003 .
Figure 29. Types of Soil Sampling Offered Over Time
70%
60%
.fl 50% c Cl)
"C 40% c 0 Q. 111 Cl) 30% ... .... 0 ~ 0 20%
10%
0%
Base: 445
-+-Grid
49.2%
43.6% 41 .7% -II-Soil type
38.6%
1.1% 29_5% 31 .8% ...,_Zone• (new in ~""""'---c,.._-~:::::::::!!::::::=---~29;;;;· 4,:% ____ .. 30.8% 2003)
19.4% 21.8%
'
23.0% -*""Not grid, soil type or zone
16.6% 15_1% -..No soil -!------------------~~ 13
·3
% sampling 8.3%
1999 2000 2001 2002 2003
As grid sampling increases in popularity, the distribution of grid sizes has remained fairly constant, with the most common grid size being 2.5 acres (Figure 30). This did not vary across regions or organizational types.
Figure 30. Grid Sizes Used in Grid Sampling
Under 1 acre
1 to 2.5 acre
2.5 acre 54.8°
2.5 to 5 acre
Other grid size
0% 10% 20% 30% 40% 50% 60% % of respondents offering grid sampling
Base: 210
22

As in other years, those in the Midwest were more likely than dealerships in other locations to sample by grid (58 percent versus 24 percent of the respondents in other states) while sampling by soil type and zone were more popular outside of the Midwest (Figure 31 ).
Figure 31 . Types of Soil Sampling Offered by Region
By grid"
By soil type"
Not grid, soil type, or zone sampling
No soil sampling
Base: Midwest: 305 Other states: 137
0% 20%
8.0%
•Midwest B3 Other states
40% 60% 80%
% of respondents • Statistica lly different between regions at p <.05
In the Midwest, local independents were the least likely organizational type to offer any soil sampling (Figure 32). Correspondingly, they were also least likely to offer grid sampling. Regional/nationals were the most likely to offer soil sampling by zone.
Figure 32. Types of Soil Sampling Offered by Organizational Type in the Midwest
By grid"
By soil type
By zone"
Not grid, soil type, or zone sampling
No soil sampling "
0%
Base: Cooperatives: 147 Local Independents: 107 Regional/Nationals: 45
20% 40%
% of respondents
•Cooperative CD Local Independent ra Re ional/National
60% 80%
" Statistically different between org. types at p <.05
23

Variable Rate S eeding
Variable rate seeding continues to be an area where dealerships show less interest relative to other precision services. Less than 10 percent of the responding dealerships offered variable seeding, either with or without OPS in 2002 (Figure 33). These numbers showed some growth over previous years but variable rate seeding is still not very widespread. There were no statistical differences either by region or by organizational type within the Midwest (Figures 34 and 35).
Figure 33. Variable Rate Seeding Offered Over Time
J!l c Cll
"Cl c 0 Q. ., Cll ... .... 0 ~ 0
70%
60%
50%
40%
30%
20%
10%
0%
16.3%
-t-------------...i...,'7,,.c_~.- 11.1% 3.~
4.8%
2.7% 3.4%
1997 1998 1999 2000 2001 2002 2003 2004 2005
Base: 443
-+-Variable rate seeding, no GPS
_._Variable rate seeding, GPS
Note: No data for 1998 & 2004; 2005 is predicted use
Figure 34. Variable Rate Seeding Offered by Region
Variable seeding, noGPS
Variable seeding, with GPS
0% 20% 40%
% of respondents
•Midwest
IEI Other states
60% 80%
Base: Midwest: 304 Other states: 136 Not statistically different between regions at p <.05
24
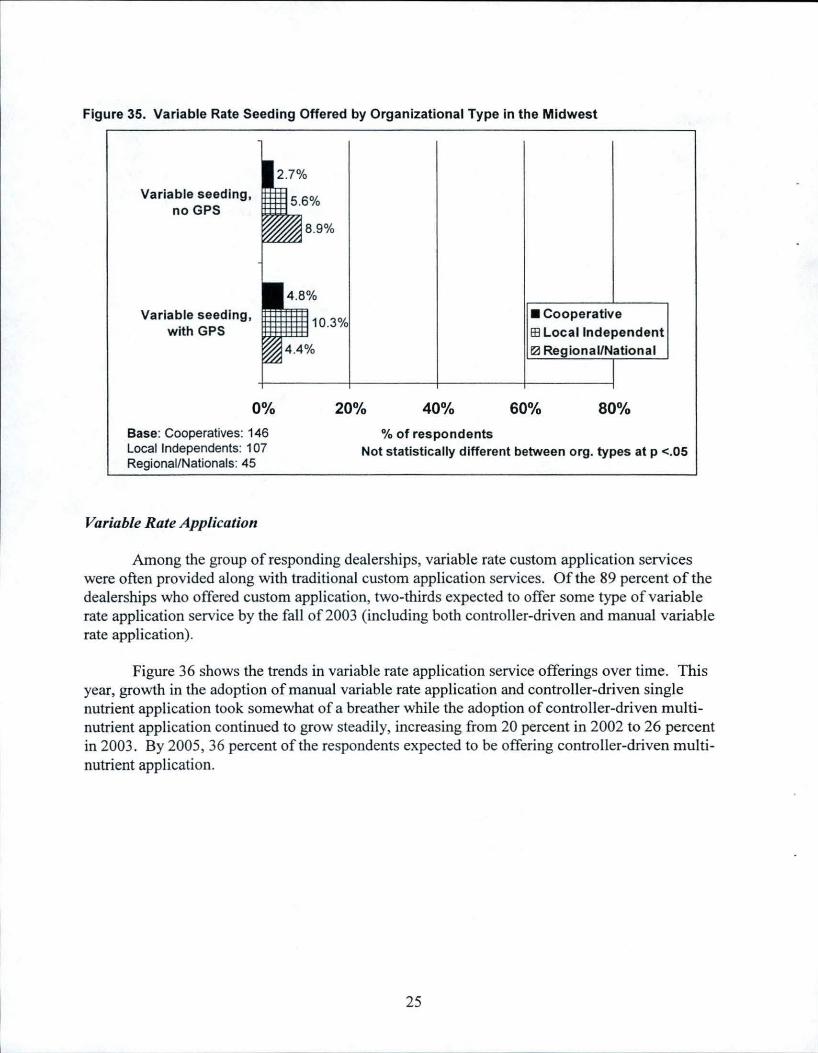
Figure 35. Variable Rate Seeding Offered by Organizational Type in the Midwest
Variable seeding, no GPS
Variable seeding, with GPS
0%
Base: Cooperatives: 146 Local Independents: 1 07 Regional/Nationals: 45
Variable Rate Application
20% 40%
% of respondents
•Cooperative
H3 Local Independent ~Regional/National
60% 80%
Not statistically different between org. types at p <.05
Among the group of responding dealerships, variable rate custom application services were often provided along with traditional custom application services. Of the 89 percent of the dealerships who offered custom application, two-thirds expected to offer some type of variable rate application service by the fall of 2003 (including both controller-driven and manual variable rate application).
Figure 36 shows the trends in variable rate application service offerings over time. This year, growth in the adoption of manual variable rate application and controller-driven single nutrient application took somewhat of a breather while the adoption of controller-driven multinutrient application continued to grow steadily, increasing from 20 percent in 2002 to 26 percent in 2003. By 2005, 36 percent of the respondents expected to be offering controller-driven multinutrient application.
25

Figure 36. Precision Application Offered Over Time
70%
60%
J!l 50% c Cl)
"C 40% c 0 c. fl) Cl) 30% ... -0 ~ 0 20%
10%
0% 1997 1998
2003 Base: 443
1999 2000 2001
54.4% .----------, 54.0%
35.9%
2002 2003 2004 2005
_._Manual variable rate
-ti-Controllerdriven singlenutrient
_,._Controllerdriven multinutrient
Note: No data for 1998 & 2004; 2005 is predicted use
Figure 37 shows the offerings of specific controller-driven variable rate application services in 2003. Almost half of the respondents ( 49 percent) offered some form of controllerdriven application of fertilizer, lime and/or chemicals - either single nutrient or multi-nutrient application. This was up from 43 percent in 2002. Single nutrient controller-driven application of fertilizer was the most common controller-driven variable rate application service offered, with 43 percent of the respondents expecting to offer the service by the fall of 2002. This figure was up from 2002 when only 38 percent offered the service. Multi-nutrient controller-driven application of fertilizer was also up this year - offered by 26 percent of the responding dealerships in 2003 compared to 19 percent offering the service in 2002. Chemicals were being applied with controller-driven technology at a slightly higher frequency compared to last year. Approximately 12 percent of the respondents offered single variable rate application of chemicals compared to 10 percent last year.
26
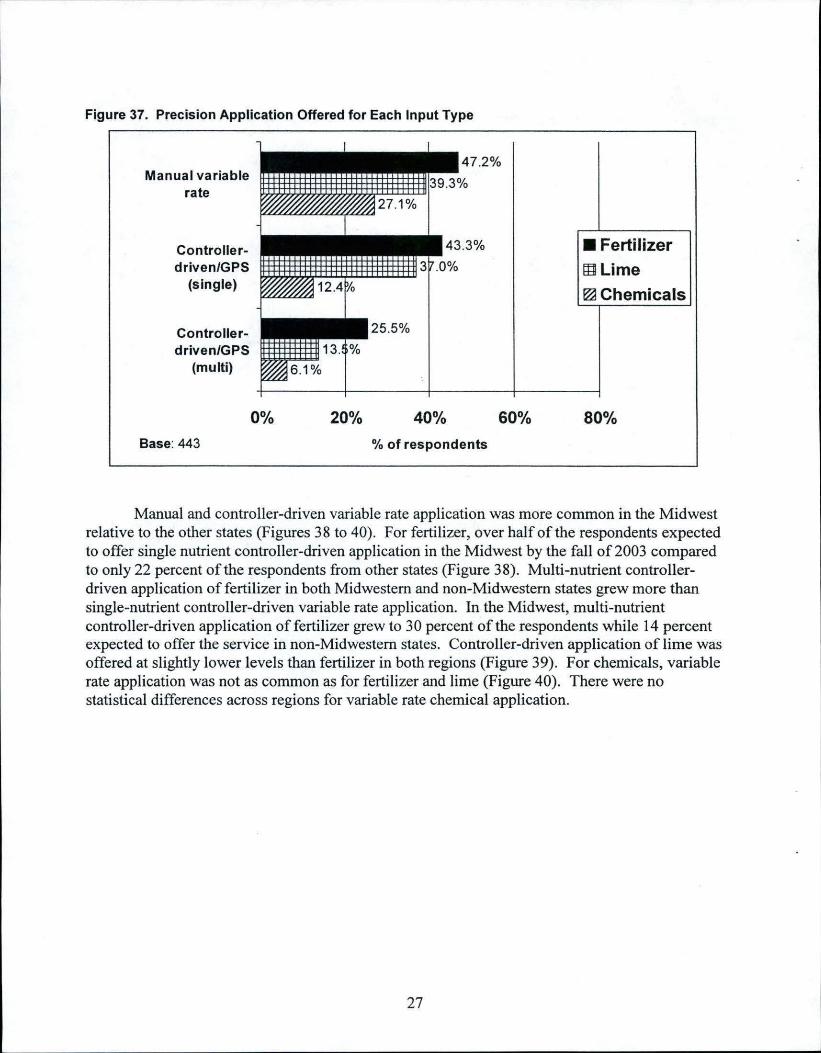
Figure 37. Precision Application Offered for Each Input Type
Manual variable rate
Controllerdriven/GPS
(single)
Controllerdriven/GPS
(multi)
Base: 443
0% 20%
47.2%
40% 60%
% of respondents
• Fertilizer !±0 Lime ~Chemicals
80%
Manual and controller-driven variable rate application was more common in the Midwest relative to the other states (Figures 38 to 40). For fertilizer, over half of the respondents expected to offer single nutrient controller-driven application in the Midwest by the fall of 2003 compared to only 22 percent of the respondents from other states (Figure 38). Multi-nutrient controllerdriven application of fertilizer in both Midwestern and non-Midwestern states grew more than single-nutrient controller-driven variable rate application. In the Midwest, multi-nutrient controller-driven application of fertilizer grew to 30 percent of the respondents while 14 percent expected to offer the service in non-Midwestern states. Controller-driven application of lime was offered at slightly lower levels than fertilizer in both regions (Figure 39). For chemicals, variable rate application was not as common as for fertilizer and lime (Figure 40). There were no statistical differences across regions for variable rate chemical application.
27

Figure 38. Precision Application of Fertilizer Offered by Region
Manual variable rate
Controllerd riven/GP S
(single)
Controllerdriven/GPS
(multi)
0%
Base: Midwest: 304; Other states: 136
20%
53. %
53. % •Midwest
IEI Other states
40% 60% 80%
% of respondents
All statistically different between regions at p <.05
Figure 39. Precision Application of Lime Offered by Region
Manual variable rate
Controllerdriven/GPS
(single)
Controllerdriven/GPS
(multi)
0%
Base: Midwest: 304; Other states: 136
20%
46.4%
46.4% •Midwest ltll Other states
40% 60% 80%
% of respondents
All statistically different between regions at p <.05
28
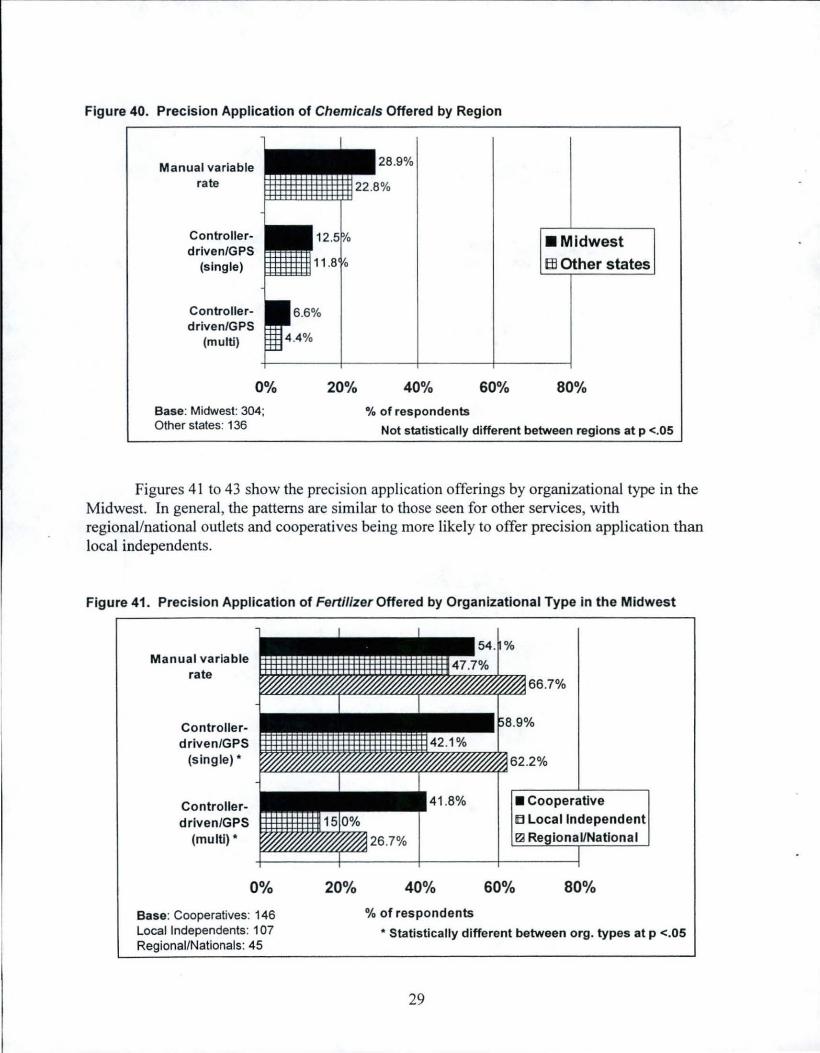
Figure 40. Precision Application of Chemicals Offered by Region
Manual variable rate
Controllerdriven/GPS
(single)
Controllerdriven/GPS
(multi)
0%
Base: Midwest: 304; Other states: 136
20%
•Midwest
Ell Other states
40% 60% 80%
% of respondents
Not statistically different between regions at p <.05
Figures 41 to 43 show the precision application offerings by organizational type in the Midwest. In general, the patterns are similar to those seen for other services, with regional/national outlets and cooperatives being more likely to offer precision application than local independents.
Figure 41. Precision Application of Fertilizer Offered by Organizational Type in the Midwest
Manual variable rate
Controllerdriven/GPS
(single) *
Controllerdriven/GPS
(multi)*
0%
Base: Cooperatives: 146 Local Independents: 107 Regional/Nationals: 45
20% 40%
% of respondents
66.7%
• Cooperative IB Local Independent ~ RegionaVNatlonal
60% 80%
* Statistically different between org. types at p <.05
29

Figure 42. Precision Application of Lime Offered by Organizational Type in the Midwest
Manual variable rate
Controllerdriven/GPS
(single)*
Controllerdriven/GPS
(multi)*
0%
Base: Cooperatives: 146 Local Independents: 107 Regional/Nationals: 45
20% 40%
% of respondents
• Cooperative EB Local Independent ~Regional/National
60% 80%
* Statistically different between org. types at p <.05
Figure 43. Precision Application of Chemicals Offered by Organizational Type in the Midwest
Manual variable rate*
Controllerdriven/GPS
(single)
Controllerdriven/GPS
(multi)* 2.2%
0%
Base: Cooperatives: 146 Local Independents: 107 Regional/Nationals: 45
20%
7.8%
40%
% of respondents
60%
•Cooperative t!l Local Independent ~Regional/National
80%
*Statistically different between org. types at p <.05
30
Pricing Site-Specific Services
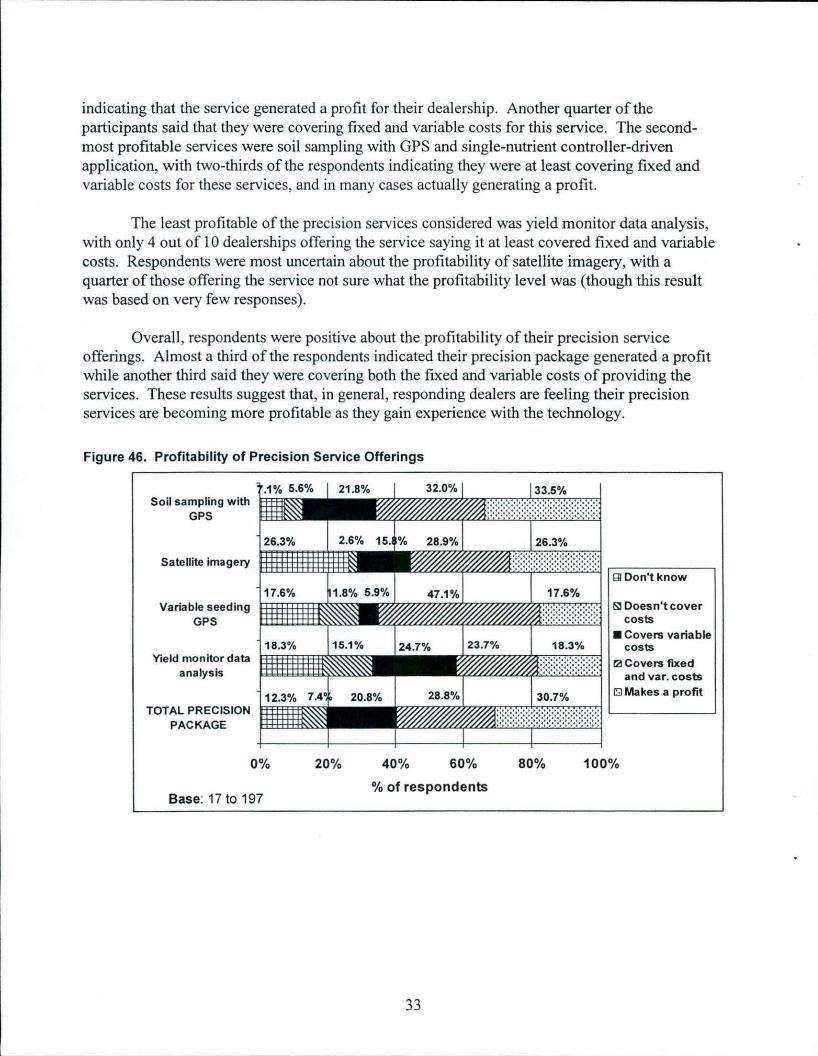
There continues to be considerable variation in the prices charged for precision services from dealership to dealership. Factors influencing this variation include: customer willingness to pay, competitive price response, relationship between product and service pricing strategies, and uncertainty about the actual cost of providing the service. As the services become more familiar to both dealerships and their customers, this variation may shrink as prices stabilize in the marketplace. Dealerships were asked to provide the typical price they charge per acre for their precision services where possible. For those offering only packages of services or bundled pricing, it often wasn't possible to price out the components individually. Hence, far fewer dealerships typically responded to this question relative to the other questions in the survey.
Figures 44 and 45 shows the average prices charged per acre for each of the precision services. The bar indicates what the middle 80 percent of the dealers were charging (the top I 0 percent and bottom 10 percent were dropped to make the ranges a bit more consistent). As is evident by the chart, there is still a wide range of pricing strategies in place, depending on the competitive prices in the local market, the dealer' s costs of providing the services, and the benefit local growers receive from precision services. Overall, though, the average prices charged were similar to, or slightly lower than, those reported in 2002. There were no overall differences between prices charged in the Midwest and in other states.
Figure 44. Prices Charged for Precision Ag Services
$16.00
$14.00
~ $12.00
0 $10.00 ca ~
a> $8.00 ~
a> $6.00 u ·c
Q. $4.00
$2.00
$0.00
Base: 19 to 145
$6.19 l
~
Soil sampling with GPS
~~ I ----6
f-$1.27 Field Yield monitor Agronomic
mapping data analysis recs {GPS with GIS
31
:!>4 . f~ .__ ,,..,..-
:~"t .L4
Satellite Variable rate imagery seeding
{GPS)

Figure 45. Prices Charged for Precision Application Services
$16.00
$14.00
$12.00 Q) '-CJ $10.00 ns '-Q) $8.00 c.. Q) CJ $6.00 ·c
CL
~ ~ $7 .3 ----... i:::. 'l 1 - ~5.52 ~v.01
~ . .,, ... :uu
9
$4.00
$2.00
$0.00 {_ertilizer Lime Pesticide~ { ertilizer Lime Pesticide~
--v --v-Base: 15 to 161
Controller-driven/GPS Single Nutrient
Controller-driven/GPS Multi Nutrient
Profitability of Precision S ervice Offerings
We also asked dealerships how profitable they felt their precision offerings were. Compared to last year, dealers seemed to have a better feel for the profitability of their precision service offerings, with some precision service offerings appearing to generate more profit and some appearing to generate less profit than last year.
Each bar in Figures 46 and 4 7 show the proportion of respondents who indicated that a particular service was:
~ not covering fixed or variable costs; ~ covering variable costs; ~ covering both variable and fixed costs; and ~ generating a profit.
Using a traditional custom application program in Figure 47 as an example, less than half of the respondents said the service generated a profit for their dealership (38 percent). A third (36 percent) said that it just covered fixed and variable costs. One in 6 respondents ( 17 percent) felt that custom application covered variable costs but not fixed costs and 5 percent said it covered neither variable nor fixed costs. Only 4 percent of the respondents did not know how profitable their traditional custom application program was.
In looking at the precision services, the most profitable service appeared to be controllerdriven multi-nutrient variable rate application with 41 percent of those offering this service
32
indicating that the service generated a profit for their dealership. Another quarter of the participants said that they were covering fixed and variable costs for this service. The secondmost profitable services were soil sampling with OPS and single-nutrient controller-driven application, with two-thirds of the respondents indicating they were at least covering fixed and variable costs for these services, and in many cases actually generating a profit.
The least profitable of the precision services considered was yield monitor data analysis, with only 4 out of 10 dealerships offering the service saying it at least covered fixed and variable costs. Respondents were most uncertain about the profitability of satellite imagery, with a quarter of those offering the service not sure what the profitability level was (though this result was based on very few responses).
Overall, respondents were positive about the profitability of their precision service offerings. Almost a third of the respondents indicated their precision package generated a profit while another third said they were covering both the fixed and variable costs of providing the services. These results suggest that, in general, responding dealers are feeling their precision services are becoming more profitable as they gain experience with the technology.
Figure 46. Profitability of Precision Service Offerings
Soil sampling w ith GPS
Satellite imagery
Variable seeding GPS
Yield monitor data analysis
TOTAL PRECISION PACKAGE
0%
Base: 17 to 197
20% 40% 60%
% of respondents
33
80%
91 Don't know
~Doesn't cover costs
•Covers variable costs
rLI Covers fixed and var. costs
l'.!l Makes a profit
100%
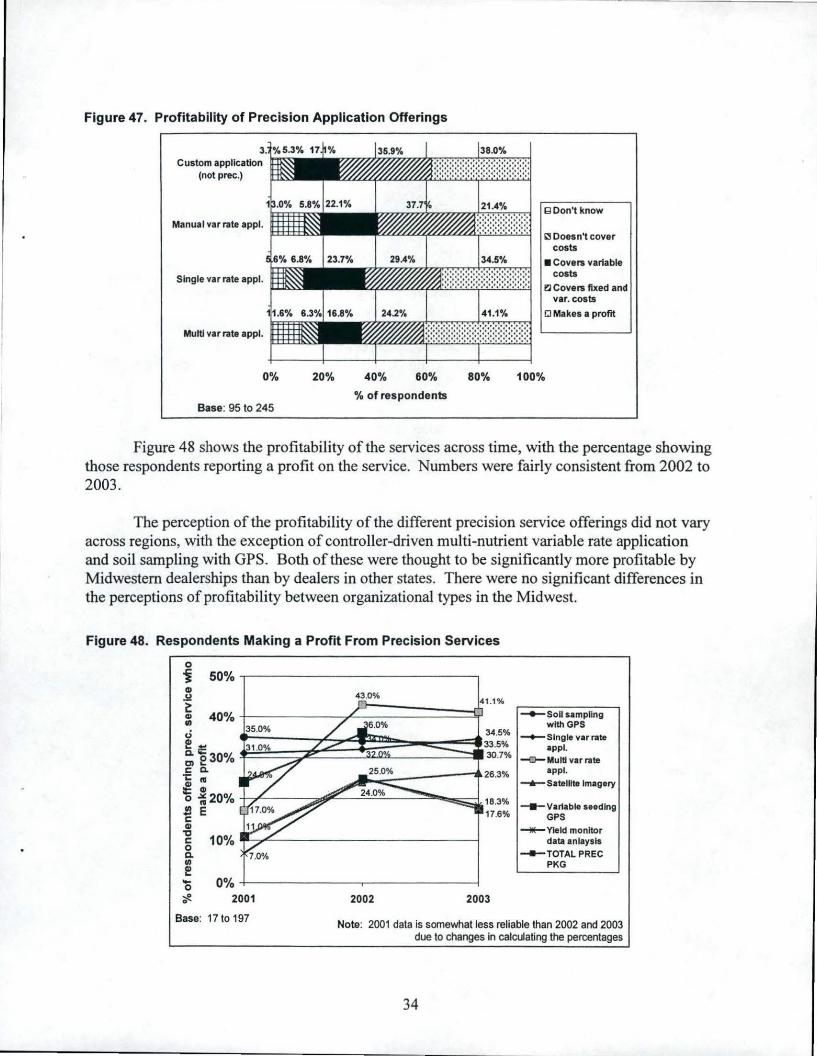
Figure 47. Profitability of Precision Application Offerings
Custom application (not prec.)
Manual var rate appl.
Single var rate appl.
Multi var rate appl.
0%
Base: 95 to 245
20% 40% 60%
"lo of respondents
80%
E3 Don't know
'3 Doesn't cover costs
•Covers variable costs
ll Covers fixed and var. costs
~Makes a profit
100%
Figure 48 shows the profitability of the services across time, with the percentage showing those respondents reporting a profit on the service. Numbers were fairly consistent from 2002 to 2003.
The perception of the profitability of the different precision service offerings did not vary across regions, with the exception of controller-driven multi-nutrient variable rate application and soil sampling with GPS. Both of these were thought to be significantly more profitable by Midwestern dealerships than by dealers in other states. There were no significant differences in the perceptions of profitability between organizational types in the Midwest.
Figure 48. Respondents Making a Profit From Precision Services
0 i 50%....--~~~~~~~~~~~~~~
CD £ 43.0% 1.1%
~ 40% L---- -__,.L:::=======::¢i ..,._Sollsampllng •• with GPS u 34.5% -Slnglevurate e~ ~ ~ ~ e30% 30.l% -O-Multlv1rrate c c. 26.3% appl. ·;: " ~ CD ...,._Satellite Imagery
o ~ 20% 18·3% -Var1able seeding -E E 17.6% GPS
.g -llE-Yleld monitor c 10% data anlaysls 8_ ---TOTALPREC e ~-P_K_G ___ ~
0%+--- - ----..-----------l 2001
Base: 17 to 197
2002 2003
Note: 2001 data is somewhat less reliable than 2002 and 2003 due to changes in calculating the percentages
34

Customer Use of Site-Specific Services
To get a better understanding of how quickly growers are adopting precision services, survey participants were asked what percentage of the total acreage they served in their market area (all growers, not just current customers) was using various site-specific management techniques currently, and, in their opinion, what proportion of the local market acres will be using these techniques in 3 years. Figures 49 to 51 show the trends over time in the estimated market use of specific precision agriculture management techniques.
During the time period market adoption has been measured by this survey, use of almost all services has grown each year. And, as in previous years, respondents are optimistic about future adoption. In 2003, the most widespread precision service or technology in use was yield monitors, estimated to be used on an average of 22 percent of the market acres served by each respondent (Figure 49). This was followed by soil sampling with GPS (used on an average of 19 percent of the market acres) and field mapping with GIS (used on 15 percent of market acres).
Figure 49. Estimated Market Area Using Precision Services
c: .2 50% ~ (,,)
~ Q. 40% C> .5 (I) :l
"' ~30% ~
"' .~ ... ~ Q) .ll::
5:20% ... "' E -0 ~ 0 10% Q) C> [!? Q)
0% > < 2000
Base: 238 to 307
2001 2002 2003 2004
39.1%
33.0% .....--------. -+- Soil sampling with
28.8% GPS
2005
-a-Field mapping with GIS
...--Yield m onitors
Note: No data for 2004; 2005 is predicted use
35
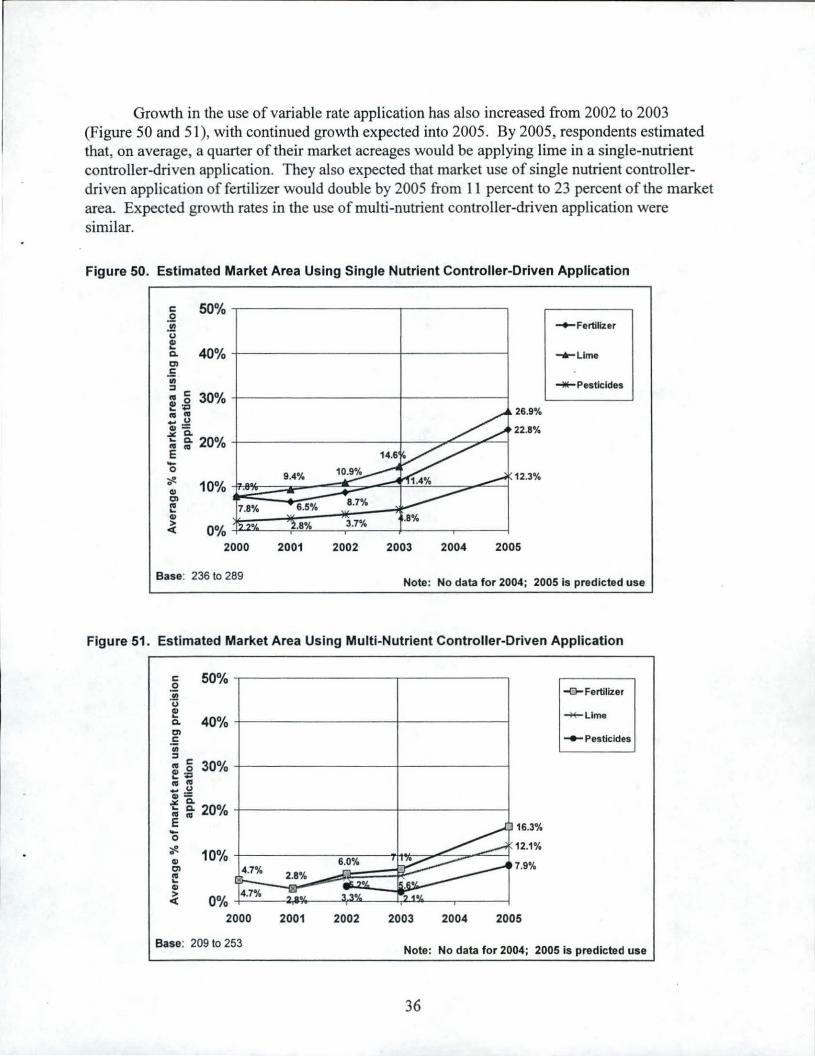
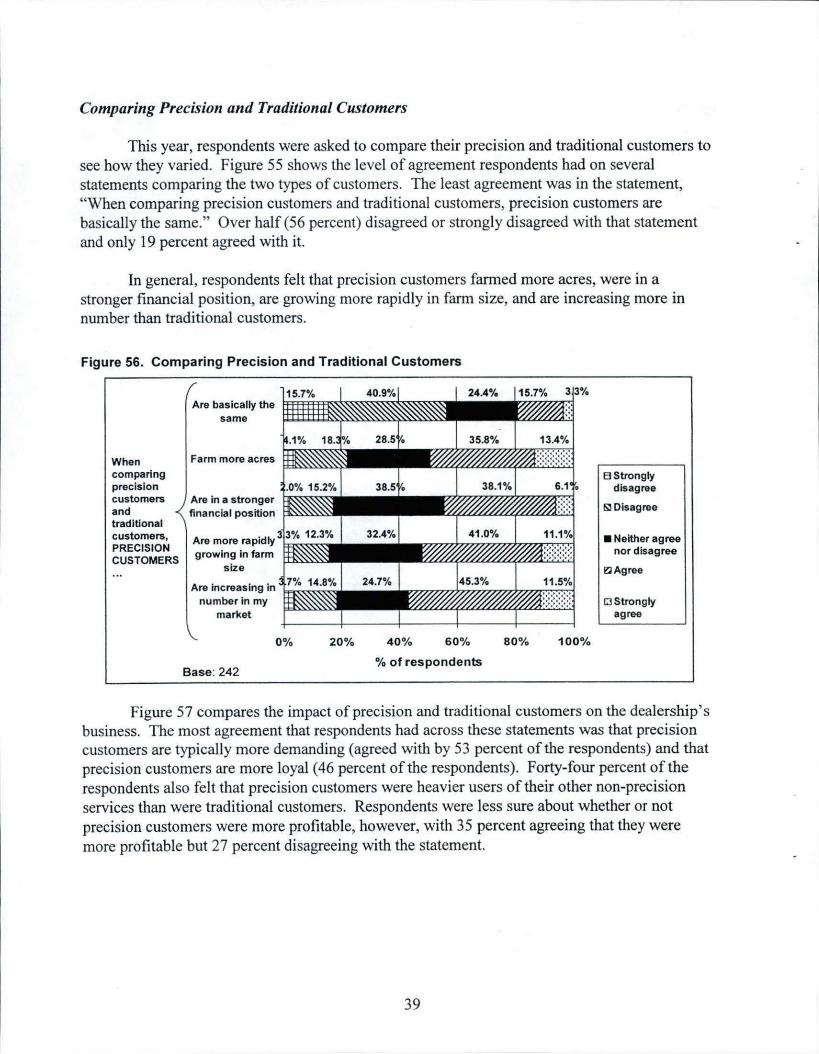
Growth in the use of variable rate application has also increased from 2002 to 2003 (Figure 50 and 51), with continued growth expected into 2005. By 2005, respondents estimated that, on average, a quarter of their market acreages would be applying lime in a single-nutrient controller-driven application. They also expected that market use of single nutrient controllerdriven application of fertilizer would double by 2005 from 11 percent to 23 percent of the market area. Expected growth rates in the use of multi-nutrient controller-driven application were similar.
Figure 50. Estimated Market Area Using Single Nutrient Controller-Driven Application
-+-Fertilizer
-e-Llme
~Pesticides
~ 10% 0
QI Cl
l! QI
~ 0% 2000 2001 2002 2003 2004 2005
Base: 236 to 289 Note: No data for 2004; 2005 is predicted use
Figure 51. Estimated Market Area Using Multi-Nutrient Controller-Driven Application
c 50% -r---------~------~ .9 .!l u Cll
Ci. 40% -+------------!------~ Cl .E Ill :::J
~ c 30% -+------------!------~ ~~ ~ ~ .. u cu=
~ ~ 20% -+------------!------~ E .... 0 ~ 0
Cll Cl
l! Cll > <(
10%
0%
16.3%
12.1% +-------=--::-:-:---Tl~-=-~-=-""=--1
4.7°,4 7.9%
4.7%
2000 2001 2002 2003 2004 2005
-0-Fertilizer
~Lime
--Pesticides
Base: 209 to 253 Note: No data for 2004; 2005 is predicted use
36

Figures 51 to 54 show estimated market usage of precision services by region. Some market estimates were significantly higher in the Midwest than in other states. These included yield monitor usage, soil sampling with OPS, and multi-nutrient controller-driven variable rate application of fertilizer. There were no significant differences across regions for the other services. Rapid growth in usage of these services was expected by 2005, with the most growth seen in the use of variable seeding with OPS and satellite imagery - both expected to triple in market usage in the next 3 years.
Figure 52. Estimated Market Area Using Precision Services in the Midwest
c: .Q 50% .!I.! CJ e Q.
40% C> .E
"' ::s e :g3o% CG .2 .... c: Q)
~ ~20% E -0 ~ 0 10%
CD C> f! Q)
0% > <
2000
Base: 175 to 230
2001 2002 2003
43.8%
35.6%
2004 2005
-+-Yield monitors
-+-Soll sampling with GPS
-<:>-Field mapping with GIS
........ Satellite Imagery
Note: No data for 2004; 2005 is predicted use
Figure 53. Estimated Market Area Using Precision Services in the Other States
c: 50% 0
:ii! CJ f Q.
40% C> r:: ·c;; ::s CG :g30% Q) ... CG .2 .... c: Q)
.:.:. ~20% ... CG E -0 ~ 0 10% Q)
C> CG ... Cl>
0% > <
2000 2001
Base: 61 to76
2002 2003 2004
27.0% 24 .9% 23.9%
2005
-+-Yield monitors
-+-Soll sampling with GPS
~Field mapping with GIS
........ Satellite Imagery
-f8-Variable seeding with GPS
Note: No data for 2004; 2005 is predicted use
37

Figure 54. Estimated Market Area Using Variable Rate Application in the Midwest
c: .2 .!/2 CJ
~ Q.
en .5 "' ::s m ~ 30% -t-----------ii--------j cu .~
~ ~ ~ :: 20% -+-----------~Rl""'---~""-----i E
-.-single nutrient: Fertilizer
,.._Single nutrient:
30.0% Pesticides
-0-Single nutrient:
23.4% Lime
.....- Multi-nutrient: Fertilizer
13.3% -It- Multi-nutrient: -0 ";/!.
G> en 10% er--=:~::::::::;;:;;~7o/.~-j~~~"ill"""'~;;;:;;>"-r 10.7% Pesticide
7.6% ~Multi-nutrient:
I! G> > <
Lime
0°/o ~ ....... '----.----r-=-=--t-'-~--..-----1
2000 2001 2002 2003 2004 2005
Base: 152 to 219 Note: No data for 2004; 2005 is predicted use
Figure 55. Estimated Market Area Using Variable Rate Application in Other States
c: .2 .!/2 CJ
~ Q.
C)
.5 "' ::s m ~ 30% -t-----------ii----------1
ca .~
~~ Wft ~ :: 20°'0 4----------~1------~ ... /( 16.8% E 1s~% -0
";/!. G> C)
I! G> > <
11 .8% 1 0% -t----3=-_-:--:4.,.,..~---....vuz:-----:;;j~~tlf'C---=,....,,,::....--a.. 8.8%
8.6%
0% ~....:....:..:.--,-.......... ......_-~~--+--'-""'°----,.----~
2000 2001 2002 2003 2004 2005
_._Single nutrient : Fertilizer
,.._Single nutrient: Pesticides
-0-Single nutrient: Lime
.....-Multi-nutrient: Fertilizer
-II-Multi-nutrient: Pestic ide
~Multi-nutrient: Lime
Base: 55 to 76 Note: No data for 2004; 2005 is predicted use
In the Midwest, respondents from regionaVnational organizations estimated market usage to be higher for yield monitors and variable rate seeding with GPS than respondents from other types of organizations. This could be due to a difference in the typical customer these dealerships deal with, resulting in a different perception of the market.
38
Comparing Precision and Traditional Customers
This year, respondents were asked to compare their precision and traditional customers to see how they varied. Figure 55 shows the level of agreement respondents had on several statements comparing the two types of customers. The least agreement was in the statement, "When comparing precision customers and traditional customers, precision customers are basically the same." Over half (56 percent) disagreed or strongly disagreed with that statement and only 19 percent agreed with it.
In general, respondents felt that precision customers farmed more acres, were in a stronger financial position, are growing more rapidly in farm size, and are increasing more in nwnber than traditional customers.
Figure 56. Comparing Precision and Traditional Customers
Are basically the 1:;::;::,=="~:"<"<"<~~~~"'<'<" same
When Farm more acres =~~~ comparing precision customers and traditional customers, PRECISION CUSTOMERS
Are in a stronger financial position ~~~
size
Are increasing in number in my
market
Base: 242
0% 20% 40% 60%
% of respondents
80% 100%
B Strongly disagree
&i Disagree
•Neither agree nor disagree
el Agree
ra strongly agree
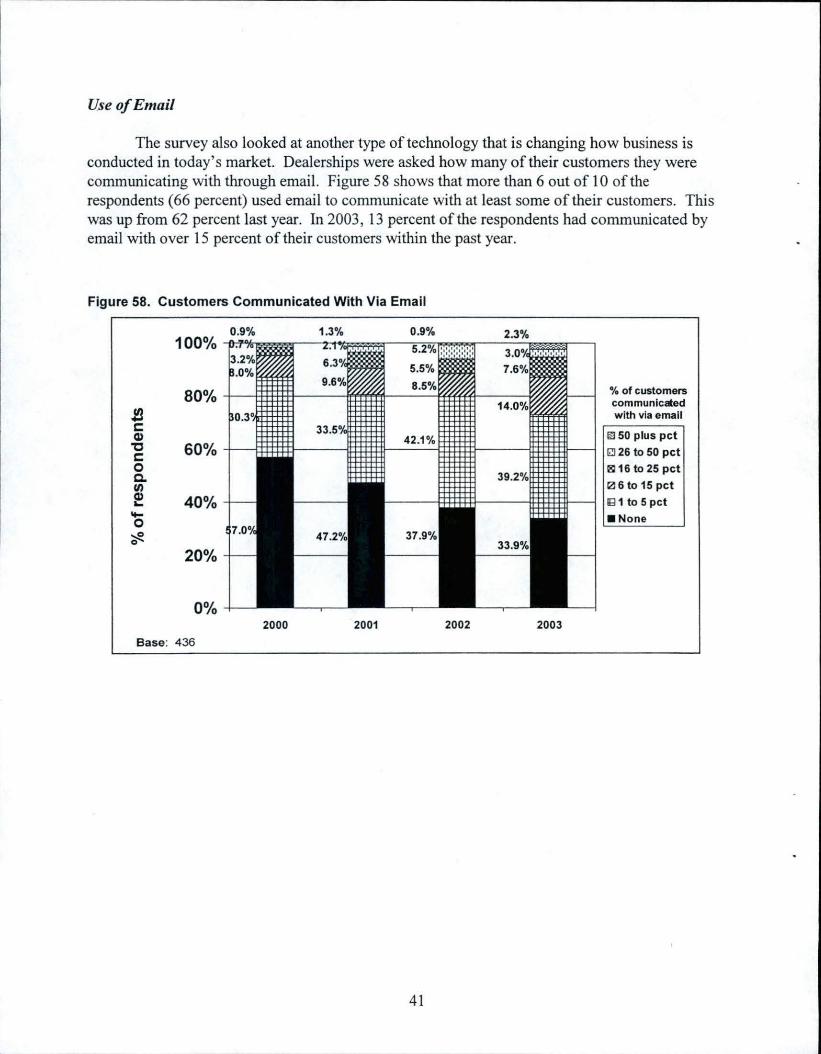
Figure 57 compares the impact of precision and traditional customers on the dealership's business. The most agreement that respondents had across these statements was that precision customers are typically more demanding (agreed with by 53 percent of the respondents) and that precision customers are more loyal (46 percent of the respondents). Forty-four percent of the respondents also felt that precision customers were heavier users of their other non-precision services than were traditional customers. Respondents were less sure about whether or not precision customers were more profitable, however, with 35 percent agreeing that they were more profitable but 27 percent disagreeing with the statement.
39
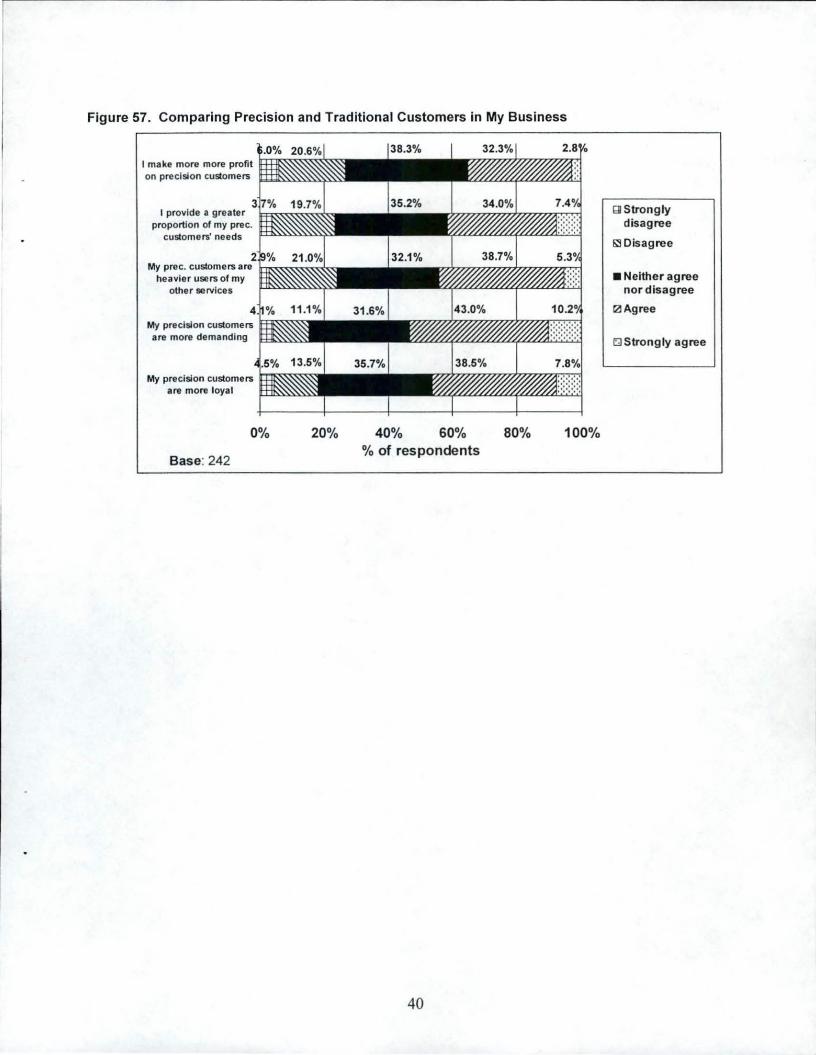
Figure 57. Comparing Precision and Traditional Customers in My Business
I make more more profit on precision customers
I provide a greater proportion of my prec.
customers' needs ~...,,,,.,.,.,,.,.,.,,.~
2 My prec. customers are inl'<~~~-tt..:
heavier users of my other services
My precision customers are more demanding
My precision customers are more loyal
0%
Base: 242
20% 40% 60% 80% 100% % of respondents
40
Q Strongly disagree
E..iDisagree
•Neither agree nor disagree
0 Agree
c::;J Strongly agree
Use of Email
The survey also looked at another type of technology that is changing how business is conducted in today's market. Dealerships were asked how many of their customers they were communicating with through email. Figure 58 shows that more than 6 out of 10 of the respondents (66 percent) used email to communicate with at least some of their customers. This was up from 62 percent last year. In 2003, 13 percent of the respondents had communicated by email with over 15 percent of their customers within the past year.
Figure 58. Customers Communicated With Via Email
J!! c: Q)
"C c: 0 c. (I)
~ ..... 0
'if-
40%
20%
0%
Base: 436
0.9% 1.3% 0.9%
2000 2001
41
2002 2003
01. of customers communicated with via email
~ 50 plus pct
~ 26 to 50 pct 3116 to 25 pct 12l 6 to 15 pct 18 1 to 5 pct
•None
Summary
The use of precision technology continues to expand in the agricultural industry among both growers and retail agronomic dealerships. Some of the areas have slowed with respect to the rate of growth, primarily in the Midwest, while dealerships outside of the Midwest have increased their offerings of precision services. As the technology evolves, dealerships are using it in ways that make sense in their businesses and in their markets. Some are only using precision technology for internal purposes if the market does not seem to want the new technology. Other dealers are offering a complete precision package to their customers. Clearly, this set of technologies is now becoming a standard part of U.S. crop production in most regions of the U.S.
42

APPENDIX I: Questionnaire
43
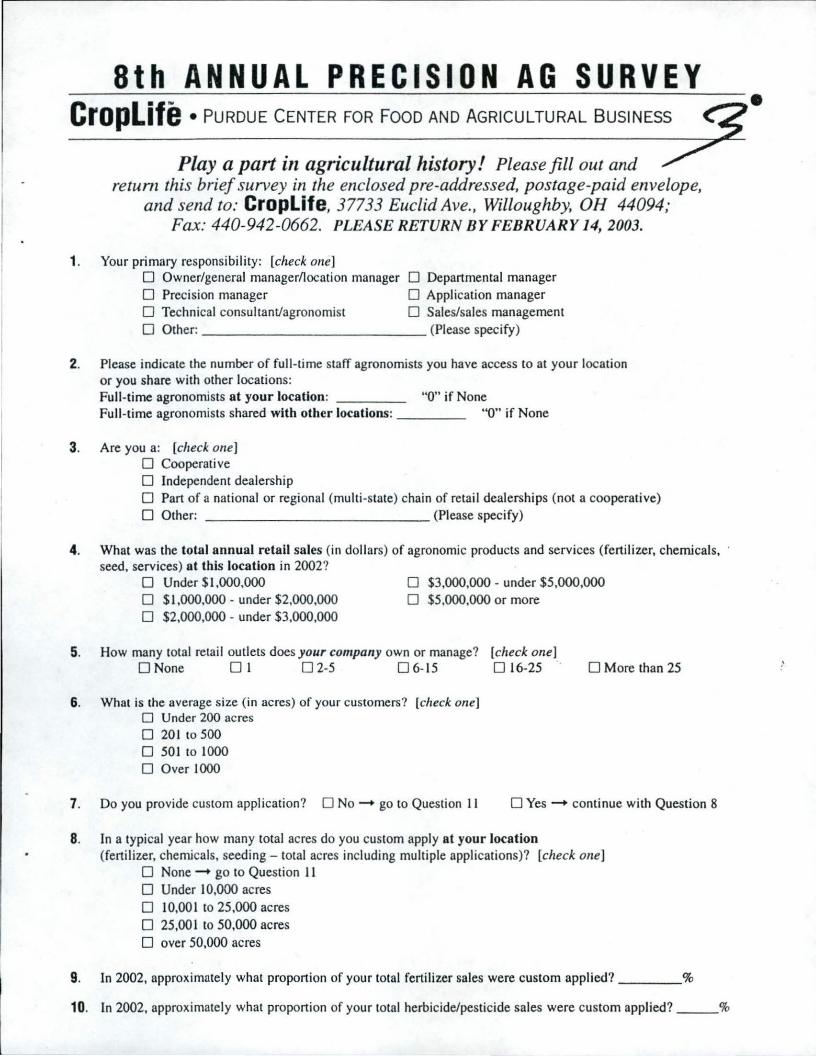
8th ANNUAL PRECISION AG SURVEY Croplife . PURDUE CENTER FOR FooD AND AGRICULTURAL sus1NEss
1.
Play a part in agricultural history! Please fill out and retuni this brief survey in the enclosed pre-addressed, postage-paid envelope,
and send to: Croplife, 37733 Euclid Ave., Willoughby, OH 44094; Fax: 440-942-0662. PLEASE RETURN BY FEBRUARY 14, 2003.
Your primary responsibility: [check one] D Owner/general manager/location manager D Departmental manager D Precision manager 0 Application manager D Technical consultantlagronomjst 0 Sales/sales management
0 Other:------------- (Please specify)
2. Please indicate the number of full-time staff agronomists you have access to at your location or you share with other locations: Full-time agronomists at your location: "O" if None Full-time agronomists shared with other locations: "O" if None
3. Are you a: [check one] D Cooperative D Independent dealership 0 Part of a national or regional (multi-state) chain of retail dealerships (not a cooperative) D Other: (Please specify)
4. What was the total annual retail sales (in dollars) of agronomic products and services (fertilizer, chemicals, · seed, services) at this location in 2002?
0 Under $1,000,000 0 $3,000,000 - under $5,000,000 0 $1,000,000 - under $2,000,000 0 $5,000,000 or more 0 $2,000,000 - under $3,000,000
5. How many total retail outlets does your company own or manage? [check one] 0 None 0 I 0 2-5 0 6-15 0 16-25 0 More than 25
6. What is the average s ize (in acres) of your customers? [check one] 0 Under 200 acres 0 201 to 500 0 501to 1000 0 Over 1000
7. Do you provide custom application? 0 No - go to Question 11 0 Yes - continue with Question 8
8. In a typical year how many total acres do you custom apply at your location (fertilizer, chemicals, seeding - total acres including multiple applicati ons)? [check one]
0 None - go to Question 11 0 Under 10,000 acres 0 10,001 to 25,000 acres 0 25,001 to 50,000 acres 0 over 50,000 acres
9. In 2002, approximately what proportion of your total fertilizer sales were custom applied? %
10. In 2002, approximately what proportion of your total herbicide/pesticide sales were custom applied? %
•

11. Please indicate other agronomic services you provide at your location. [check all that you provide ]
0 Seed sales 0 Agronomic consulting 0 Soil sampling
0 Reco rdkeeping 0 Computer-aided field mapping 0 None of the above
12. Do you offer soi l sampling following a grid pattern and/or by soil type? 0 Grid pattern - Grid size most commonly used?
0 < I acre 0 1 ac. - 2.49 ac. 0 2.5 ac. 0 2.5 1 ac. - 5 ac. 0 Other: _ ___ _ _ _ 0 Soil type
0 By zone other than soil type 0 Other: ------ -------------
13. What proportion of your total sales of agronomic products and services was accounted for by seed sales (of any kind) in 2002? What proportion of your total sales of agronomic products and services do you project will be accounted for by seed sales in three years (2005)? (Enter the percentages in the blanks below.)
Seed as a percentage of total sales of agronomic products and services:
2002
_____ %
2005 (projected)
_____ %
14. In which of the foll owing ways does your dealershi p use precision technology? (check all that apply) 0 Provide any precision agronomic services for customers (soi l sampl ing with GPS, G IS fi eld mapping, etc.) 0 GPS guida nce systems when applying uniform rates of fert ilizer/chemicals to reduce skips and overlaps 0 Field mapping with GIS to document work for bill ing/insurance/legal purposes 0 Telemetry to send field information to home office fro m field 0 GPS to manage vehic le logistics, tracking location of vehic les, and guidi ng vehicles to next site 0 Don't use precision technology
15. Which "site-spec ific" ("precision") services/products will you offer in the foll owing time periods? Q1Tur Never/ Don't offer
Service Fall 2003 by 2005 Don't Know now but did
Field mapping (with GIS) 0 0 0 0 Manual variable rate application
Feniliu r 0 0 0 0 Ume 0 0 0 0 Chemicals 0 0 0 0
Controller-driven (GPS), singJe nutrient variable rate application
Fen ilizer 0 0 0 0 Ume 0 0 0 0 Chemicals 0 0 0 D
Controller-driven (OPS), multiple nutrient variable rate application
Fenilizer 0 0 0 0
Ume 0 0 0 0
Chemicals 0 0 0 0
Yield monitor sales/support/rental 0 0 0 0
Yield monitor data analysis 0 0 0 0
Variable seed ing rates without GPS 0 0 0 0
Variable seeding rates with GPS 0 0 0 0
Satellite imagery 0 0 0 0
Agronomic recommendations based on GPS/GIS data 0 0 0 0
Soil sampling with GPS 0 0 0 0
8th ANNUAL PRECISION AG SURVEY Croplife. PURDUE UNIVERSITY/CENTER FOR FOOD AND AGRICULTURAL BUSINESS
- 2 -

16. How many years has your dealership been providing some type of GPS-assisted precision service to your customers? _____ Years 0 Do not currently offer precision services (Skip to question 20)
17. If you current ly offer any of these services/products, what is the average pe r acre/per unit price you charge for individual services? (do not include bundled pricing)
Service ~~om Pri~ ~2thec i.mi~ <$/ma~ tiltQW:, ~tc.l Field mapping (with GIS) s /acre $ (specify uni ts)
Manual variable rate application
Fenilizer $ acre $ (specify units)
Ume $ acre $ (specify units)
Chemicals $ acre $ (specify units)
Contro ller-driven (GPS), single nutrient variable rate application
Fenilizer $ acre $ (specify units)
Ume $ acre $ (specify units)
Chemicals $ acre $ (specify units)
Controller-driven (GPS), multiple nutrient variable rate application
Fenilizer $ acre $ (specify units)
Ume $ acre $ (specify units)
Chemicals $ acre $ (specify units)
Yield monitor data analysis $ acre $ (specify units)
Variable seeding rates without GPS $ acre $ (specify units)
Variable seeding rates with GPS $ /acre $ (specify uni ts)
Satellite imagery $ acre $ (specify units)
Agrono mic recommendations based on GPS/GIS data $ /acre $ (specify units)
Soil sampling with GPS $ acre $ (specify units)
18. For the following services that you offer, currently how profi table is each specific service for your dealership?
I om 02l I am ius t ..lrun tlQSl: lQ t2nrine s,;QYMine b2lb lBm
breokine l'.Drioble t2sis variable eeoeralioe n'.m !See ~2te} oml fixed t2sis o 12r2fi1
Custom application (Not-precision) 1 2 3 4 Manual variable rate application 2 "3 4
Controller-driven (GPS) single nutrient variable rate application 2 3 4 Controller-driven (GPS), multiple nutrient variable rate application 2 3 4 Data analysis for yield monitors 2 3 4 Variable seeding rates with GPS 2 3 4 Satellite imagery 2 3 4 Soil sampling with GPS 2 3 4 Total precision program, all components 2 3 4
N2.k.;. Variable Costs are the costs of actually performing the service - costs increase or decrease with how much business you do (fuel, supplies, etc.)
.l2oJti krurn:
5 5
5
5 5 5
5 5
5
Fixed Costs are the costs of making the service available (depreciation on equipment, computers, labor, training, etc.)
. 8th ANNUAL PRECISION AG SURVEY Croplife. PURDUE UNIVERSITY/CENTER FOR FOOD AND AGRICULTURAL BUSINESS
- 3 -

19. If you offe r precision services, think about customers who are heavy users and how they compare wi th your traditional customers. Rate the foll owing sta tements on how much you agree o r disag ree with them. l=Stronely disaeree 2=Disaeree 3-Neither aeree nor disaeree 4=Aeree S=Stronely Aeree My precision customers are basically the same as my tradtional customers l 2 3 4 5
I make more profit on sales/services offered to my precision customers relative to my traditional customers l 2 3 4 5 My precision customers farm more acres than my Lradtional customers l 2 3 4 5
I provide a greater proportion of my precision customers' total agronomic needs relative to traditional customers 2 3 4 5
My precision customers are heavier users of other services I offer relative to my tradtional customers
My precision customers are in a stronger financial position than my typical customers 2 3 4 5
2 3 4 5 My precision customers are more demanding than my tradtional customers 2 3 4 5
My precision customers are more loyal to me than my tradtional customers l 2 3 4 5
My precision customers' farm size is growing more rapidly than the farm size of my tradtional customers l 2 3 4 5
The number of precision customers in my market is growing 1 2 3 4 5
20. If your organizat ion has more than one location, do some, none or a ll the reta il locations offer precision services? [Check one]
0 My organization only has one location 0 My organization does not o ffer precision services 0 Precis ion services are centralized and offered at only one location 0 Precision services are offered from several locations, but not all
0 All precision services offered by the organization are offered at all locations
21 . Please answer the following question whether or not you offer any precision services. Approximately what percentage of the total acreage in your market area (all growers, not just your current customers) is currentl y using the following site-specific agricultural techniques? Approximately what percentage of the total acreage will be using these techniques in three years (the year 2005)?
% of market acres (fill in blank with a percentage; indicate 0 if none) Service Currently 3 years from now (2005)
Field mapping (with GIS) % %
Controller-driven (GPS), single nutrient variable rate application
Fertilizer % %
Lime % %
Chemicals % % Controller-driven (GPS), multiple nutrient variable rate application
Fertilizer % %
Lime % %
Chemicals % % Yield monitor % %
Variable seeding rates with OPS % %
Satellite imagery % %
Soil sampling with GPS % %
22. What proportion of your c ustomers has your location communicated with via e-mail during the last 12 months?
O None 0 1%-5% 0 6%-15 % 0 16%-25% 0 26% -50% 0 Over 50%
23. What is your two-letter state abbreviation?-- --- -- 24. What is your ZIP code? ______ _
Thank you for your cooperation! PLEASE SEND YOUR COMPLETED SURVEY TO:
Croplif~. 37733 Euclid Ave., Willoughby, OH 44094, Fax: 440-942-0662.
8th ANNUAL PRE CIS ION AG SUR VEY Croplife. PURDUE UNIVERSITY/CENTER FOR FOOD AND AGRICULTURAL BUSINESS
- 4 -

~Vaite Library Dept. of Applied Economics University of Minnesota 1904 Buford Ave - 232 ClaOff St. Paul, MN 55108-6040 L'SA