Embed Size (px)
Citation preview

Illinois Bureau of Air August 2004 Environmental 1021 North Grand Avenue East Protection Agency P.O. Box 19276
Springfield, Illinois 62794-9276
IEPA/BOA/04-019
Illinois Annual Air Quality Report
2003
Governor Rod R. Blagojevich Director Renee Cipriano

Cover: Since the creation of the Illinois EPA in 1970, Illinois has gained significant achievements in air quality. This has resulted in part by numerous environmental regulations that have been enacted but also through programs developed and implemented through the Illinois Environmental Protection Agency. The photographs featured on the cover of the 2003 Air Quality Report reflect the just a few of those programs. Top left photograph: Launch of the Illinois Clean School Bus Program. The Illinois EPA is providing grants to Illinois School Districts to reduce particulate matter emissions from Illinois school buses. Visit www.epa.state.il.us/air/cleanbus for more information. Bottom left photograph: Illinois EPA Director Renee Cipriano, Breathe Easy Man, and Jim Colon, Vice-President and General Manager of Toyota Motor Sales – Chicago Region, present Mr. Henry Kowalski and his family with the keys to a 2004 Toyota Prius. Mr. Kowalski was drawn as the Grand Prize Winner of the 2003 Green Pays on Green Days program. Additional information on the Green Pays on Green Days program and the Partners for Clean Air can be found at www.cleantheair.org. Top right photograph: An 85 percent ethanol fuel pump at Becker’s BP in Dwight, Illinois displays the E-85 emblem. Illinois EPA, working closely with Governor Blagojevich, has been a proponent for increasing the use of E-85 by individual residents as well as State employees. Information on E-85 fuel stations in Illinois can be found at www.illinoisgreenfleets.org/stations. Bottom right photograph: A natural gas-powered delivery van from Advance Presort Services displays an Illinois Green Fleet emblem. The company is one of forty fleets in Illinois that have received the designation of Illinois Green Fleets. Information on this fleets and other fleets receiving a designation by the Illinois EPA, visit www.illinoisgreenfleets.org.

ILLINOIS ANNUAL AIR QUALITY REPORT
2003
Illinois Environmental Protection Agency Bureau of Air
1021 North Grand Avenue, East P.O. Box 19276
Springfield, IL 62794-9276
Printed on recycled paper

ii
To Obtain Additional Information For additional information on air pollution, please call 217-782-7326, or write to: Illinois Environmental Protection Agency Bureau of Air 1021 N. Grand Ave., East PO Box 19276 Springfield, IL 62794-9276
Acknowledgements This document is produced by the Illinois Environmental Protection Agency; Renee Cipriano, Director; and published by the Office of Public Information; Dennis McMurray, manager. Illinois EPA Bureau of Air personnel contributed their time and expertise to the development of this publication.

iii
A MESSAGE FROM THE DIRECTOR
In 2003, Illinois continued a renewed commitment to improve air quality throughout the State as officials worked to meet all federal air quality standards. This commitment requires the efforts of all Illinoisans -- businesses, state and local officials and individual citizens. Through our efforts, the State will meet air quality standards and residents will continue to enjoy the improved environment Illinois has achieved in the last twenty years. The 33rd Annual Air Quality Report contains information gathered in 2003 from the Illinois EPA’s statewide air-monitoring network, which is made up of more than 200 monitors measuring air pollutants and other toxic compounds. The data contained in the report indicated that Illinois’ outdoor air quality in 2003 remained good or moderate 94 percent of the time, a five percent increase from 2002. The year 2003 was a successful year in which none of the air quality monitors in Illinois recorded exceedances of the federal one-hour standard for ozone. Additionally, the St. Louis Metro East region was redesignated by the U.S. Environmental Protection Agency (U.S. EPA) as meeting the federal one-hour standard for ozone. On behalf of Governor Rod Blagojevich, the Illinois EPA continues its commitment to improving air quality, serving as a regulator of air pollution sources and a proponent for innovative, proactive programs. Those programs include Partners for Clean Air and Green Pays on Green Days, encouraging residents to do their part to reduce air pollution, and the Illinois Clean School Bus Program, designed to provide a cleaner, healthier environment for Illinois school children. These programs have a real impact on reducing air pollution, and the Illinois EPA looks forward to developing and implementing additional programs to benefit all Illinois residents from the largest cities to the smallest towns. Everyone is entitled to clean air, and it is the mission of the Illinois Environmental Protection Agency to make that a reality. This document, the 2003 Annual Air Quality report, was designed to provide a comprehensive, unbiased description of air quality in the State of Illinois. The information is presented to businesses, organizations and individual citizens. We are proud of the environmental achievements Illinois has made in the past decade and we further commit ourselves to work closely with businesses and residents to build on our past successes in air quality. Our work, together, must continue to further improve air quality for Illinois residents. Please contact the Illinois EPA with comments and/or questions regarding this report or air pollution control programs. __________________ Renee Cipriano
Director

v
Illinois Annual Air Quality Report 2003
Contents
A Message from the Director.............................................................................................................iii Tables...............................................................................................................................................vi Figures.............................................................................................................................................vii Executive Summary...........................................................................................................................ix Air Pollutants: Sources, Health & Welfare Effects.............................................................................. 1 Statewide Summary of Air Quality for 2003....................................................................................... 9 Air Quality Index............................................................................................................................. 15 Statewide Summary of Point Source Emissions................................................................................. 23
Appendices Appendix A: Air Sampling Network................................................................................................ 29 Description of the Air Sampling Network Directory of Air Monitoring Sites Appendix B: Air Quality Data Summary Tables............................................................................... 45 Air Quality Data Interpretation Ozone Data
Particulate Matter (PM2.5) Data Particulate Matter (PM10) Data Carbon Monoxide Data Sulfur Dioxide Data Nitrogen Dioxide Data Lead Data Filter Analysis Data Volatile Organic Compounds Data Toxic Compounds Data PM2.5 Speciation Data Appendix C: Point Source Emission Inventory Summary Tables....................................................... 77 Appendix D: Illinois EPA Bureau of Air/Division of Air Pollution Control......................................... 91

vi
Tables Table 1: Summary of National and Illinois Ambient Air Quality Standards ......................................... 6 Table 2: Illinois Air Pollution Episode Levels..................................................................................... 7 Table 3: AQI Descriptor Categories and Health Effects .................................................................. 16 Table 4: AQI Sectors in Illinois ...................................................................................................... 18 Table 5: Distribution of Volatile Organic Material Emissions – 2003................................................ 24 Table 6: Distribution of Particulate Matter Emissions - 2003 ........................................................... 25 Table 7: Distribution of Carbon Monoxide Emissions - 2003 .......................................................... 26 Table 8: Distribution of Sulfur Dioxide Emissions - 2003................................................................. 27 Table 9: Distribution of Nitrogen Oxide Emissions - 2003............................................................... 28 Table A1: Illinois Ambient Air Monitoring Network Directory of Cooperating Agencies in Illinois ................................................................... 30 Table A2: 2003 Non-Continuous Sampling Schedule ....................................................................... 31 Table A3: Distribution of Air Monitoring Instruments ........................................................................ 33 Table A4: Site Directory................................................................................................................. 36 Table D1: Bureau of Air Organization.............................................................................................. 93

vii
Figures Figure 1: Average 1-Hour Ozone Maximum..................................................................................... 9 Figure 2: Statewide Ozone Exceedance Day Trend .......................................................................... 9 Figure 3: Particulate Matter (PM2.5) Annual Trends....................................................................... 10 Figure 4: Particulate Matter (PM10) 24-hr Trends.......................................................................... 10 Figure 5: Carbon Monoxide Trends ............................................................................................... 11 Figure 6: Sulfur Dioxide 24-hr Trends ............................................................................................ 11 Figure 7: Nitrogen Dioxide Annual Trend ...................................................................................... 12 Figure 8: Lead Maximum Quarterly Trend...................................................................................... 12 Figure 9: Air Quality Index Summaries by Sector............................................................................ 19 Figure 10: Estimated Volatile Organic Material Emissions Trend ....................................................... 24 Figure 11: Estimated Particulate Emissions Trend.............................................................................. 25 Figure 12: Estimated Carbon Monoxide Emissions Trend ................................................................. 26 Figure 13: Estimated Sulfur Dioxide Emissions Trend........................................................................ 27 Figure 14: Estimated Nitrogen Oxide Emissions Trend...................................................................... 28

ix
2003 EXECUTIVE SUMMARY
This report presents a summary of air quality data collected throughout the State of Illinois during the
calendar year - 2003. Data is presented for the six criteria pollutants (those for which air quality standards
have been developed - particulate matter (PM10 and PM2.5), ozone, sulfur dioxide, nitrogen dioxide,
carbon monoxide, and lead) along with some heavy metals, nitrates, sulfates, and volatile organic and toxic
compounds. Monitoring was conducted at over 80 different site locations collecting data from more than
200 instruments.
In terms of the Air Quality Index (AQI) air quality during 2003 was either good or moderate more than 94
percent of the time throughout Illinois. There were no days when air quality in some part of Illinois was
considered Unhealthy (category Red). There were 19 days (11 for 8-hour ozone and 8 for PM2.5 ) when
air quality in some part of Illinois was considered Unhealthy for Sensitive Groups (category Orange). This
compares with 38 Unhealthy or Unhealthy for Sensitive Groups days in 2002. Air quality trends for the
criteria pollutants are continuing to show downward trends or stable trends well below the level of the
standards. Percentage changes over the ten year period 1994 – 2003 are as follows: Particulate Matter
(PM10) 7 percent decrease, Sulfur Dioxide 37 percent decrease, Nitrogen Dioxide 10 percent decrease,
Carbon Monoxide 52 percent decrease, Lead 36 percent decrease, and Ozone 2 percent decrease.
Stationary point source emission data has again been included. The data in the report reflects information
contained in the Emission Inventory System (EIS) as of December 31, 2003. Emission estimates are for
the calendar year 2002 and are for the pollutants: particulate matter, volatile organic material, sulfur
dioxide, nitrogen oxides and carbon monoxide. Emission trends of these pollutants has been given for the
years 1981 to the present. Emissions reported with the Annual Emissions Report have been provided
starting with 1992. In general there has been a trend toward decreasing emissions over this time period.

Illinois Annual Air Quality Report 2003 Section1: Air Pollutants-Sources, Health and Welfare Effects
1
SECTION 1: AIR POLLUTANTS: SOURCES, HEALTH AND WELFARE EFFECTS
Ozone (O3) Photochemical oxidants result from a complex series of atmospheric reactions initiated by sunlight. When reactive (non-methane) hydrocarbons and nitrogen oxides accumulate in the atmosphere and are exposed to the ultraviolet component of sunlight, the formation of new compounds, including ozone and peroxyacetylnitrate, takes place. Absorption of ultraviolet light energy by nitrogen dioxide results in its dissociation into nitric oxide and an oxygen atom. The oxygen atoms, for the most part, react with atmospheric molecular oxygen (O2) to form ozone (O3). In general, nitric oxide will react with ozone to re-form nitrogen dioxide, completing the cycle. A build-up of ozone above the equilibrium concentration defined by the reaction cycle given above results when nitrogen oxide reacts with non-methane hydrocarbons. Oxygen atoms from the hydrocarbon radical oxidize nitric oxide to nitrogen dioxide without ozone being used up. Thus ozone concentrations are not depleted and can build up quickly. Ozone can also be formed naturally in the atmosphere by electrical discharge, and in the stratosphere by solar radiation. The former process is not capable of producing significant urban concentrations of this pollutant; however, there is some belief that incursion of ozone from the stratosphere can contribute significantly to elevated ground level concentrations of ozone under certain meteorological conditions. Injury to vegetation is one of the earliest manifestations of photochemical air pollution, and sensitive plants are useful biological indicators of this type of pollution. The visible symptoms of photochemical oxidant produced injury to plants may be classified as:
• Acute injury, identified by cell collapse with subsequent development of necrotic patterns.
• Chronic injury, identified by necrotic
patterns or with other pigmented patterns. • Physiological effects, identified by growth
alterations, reduced yields, and changes in the quality of plant products. The acute symptoms are generally characteristic of a specific photochemical oxidant; though chronic injury patterns are not. Ozone injury to leaves is identified as a stripling or flecking. Adverse effects on sensitive vegetation have been observed from exposure to photochemical oxidant concentrations of about 100 ug/m3 (0.05 ppm) for 4 hours.
Adverse effects on materials (rubber products and fabrics) from exposure to photochemical oxidants have not been precisely quantified, but have been observed at the levels presently occurring in many urban atmospheres. Ozone accelerates the aging of many materials, resulting in rubber cracking, dye fading and paint erosion. These effects are linearly related to the total dose of ozone and can occur at very low levels, given long duration exposures. Ozone is a pulmonary irritant that affects the respiratory mucous membranes, other lung tissues and respiratory functions. Clinical and epidemiological studies have demonstrated that ozone impairs the normal mechanical function of the lung, causing alterations in respiration; the most characteristic of which are shallow, rapid breathing and a decrease in pulmonary compliance. Exposure to ozone results in clinical symptoms such as chest tightness, coughing, and wheezing.

Illinois Annual Air Quality Report 2003 Section1: Air Pollutants-Sources, Health and Welfare Effects
2
Alterations in airway resistance can occur, especially to those with respiratory diseases (asthma, bronchitis, emphysema). These effects may occur in sensitive individuals, as well as in healthy exercising persons, at short-term ozone concentrations between 0.15 and 0.25 ppm. Ozone exposure increases the sensitivity of the lung to bronchoconstrictive agents such as histamine, acetylcholine and allergens, as well as increasing the individual's susceptibility to bacterial infection. Simultaneous exposure to ozone and SO2 can produce larger changes in pulmonary function than exposure to either pollutant alone. Peroxyacetylnitrate (PAN) is an eye irritant, and its effects often occur in conjunction with the effects of ozone. Two characteristics of ozone and oxidant exposures should be cited: • Ozone itself is a primary cause of most of
the health effects reported in toxicological and experimental human studies and the evidence for attributing many health effects to this substance alone is very compelling.
• The complex of atmospheric
photochemical substances is known to produce health effects, some of which are not attributable to pure ozone but may be caused by other photochemical substances in combination with ozone.
Particulate Matter (PM) Not all air pollutants are in the gaseous form. Small solid particles and liquid droplets, collectively called particulates or aerosols, are also present in the air in great numbers and may constitute a pollution problem. Particulates entering the atmosphere differ in size and chemical composition. The effects of particulates on health and welfare are directly related to their size and chemical composition. Particulate matter in the atmosphere consists of solids, liquids, and liquids-solids in combination. Suspended particulates generally refer to particles less than 100 micrometers in diameter (human hair is typically 100 micrometers thick). Particles larger than 100 micrometers will settle out of the
air under the influence of gravity in a short period of time. Typical sources emitting particles into the atmosphere are combustion of fossil fuels (ash and soot), industrial processes (metals, fibers, etc.), fugitive dust (wind and mechanical erosion of local soil) and photochemically produced particles (complex chain reactions between sunlight and gaseous pollutants). Combustion and photochemical products tend to be smaller in size (less than 1 micrometer); fugitive dust and industrial products are typically larger in size (greater than 1 micrometer). Particles which cause the most health and visibility difficulties are those less than 1.0 micrometer in size. These particles are also the most difficult to reduce in numbers by the various industrial removal techniques. Rainfall accounts for the major removal of these smaller particles from the air. One of the major problems associated with high concentrations of particulates is that the interaction between the particles, sunlight and atmospheric moisture can potentially result in the climatic effects and diminished visibility (haze). Particles play a key role in the formation of clouds, and emissions of large numbers of particles can, in some instances, result in local increases in cloud formation and, possibly, precipitation. Particles in the size range of 0.1 to 1.0 micrometers are the most efficient in scattering visible light (wave length 0.4 to 0.7 micrometers) thereby reducing visibility. Particles combined with high humidity can result in the formation of haze which can cause hazardous conditions for the operation of motor vehicles and aircraft. Particulate pollutants enter the human body by way of the respiratory system and their most immediate effects are upon this system. The size of the particle determines its depth of penetration into the respiratory system. Particles over 5 micrometers are generally deposited in the nose and throat. Those that do penetrate deeper in the respiratory system to the air ducts (bronchi) are often removed by ciliary action. Particles ranging in size from 0.5 - 5.0 micrometers in diameter can be deposited in the bronchi, with few reaching the air sacs (alveoli). Most particles

Illinois Annual Air Quality Report 2003 Section1: Air Pollutants-Sources, Health and Welfare Effects
3
deposited in the bronchi are removed by the cilia within hours. Particles less than 0.5 micrometer in diameter reach and may settle in the alveoli. The removal of particles from the alveoli is much less rapid and complete than from the larger passages. Some of the particles retained in the alveoli are absorbed into the blood. Besides particulate size, the oxidation state, chemical composition, concentration and length of time in the respiratory system contribute to the health effects of particulates. Particulates have been associated with increased respiratory diseases (asthma, bronchitis, emphysema), cardiopulmonary disease (heart attack) and cancer. Plant surfaces and growth rates may be adversely affected by particulate matter. Particulate air pollution also causes a wide range of damage to materials including corrosion of metals and electrical equipment and the soiling of textiles and buildings. Sulfur Dioxide (SO2) Sulfur dioxide is an atmospheric pollutant which results from combustion processes (mainly burning of fossil fuels containing sulfur compounds), refining of petroleum, manufacture of sulfuric acid and smelting of ores containing sulfur. Reduction of sulfur dioxide pollution levels can generally be achieved through the use of low sulfur content fuels or the use of chemical sulfur removal systems. Once in the atmosphere some sulfur dioxide can be oxidized (either photochemically or in the presence of a catalyst) to SO3 (sulfur trioxide). In the presence of water vapor, SO3 is readily converted to sulfuric acid mist. Other basic oxides combine with SO3 to form sulfate aerosols. Sulfuric acid droplets and other sulfates are thought to account for about 5 to 20 percent of the total suspended particulate matter in urban air. These compounds can be transported large distances and come back to earth as a major constituent of acid precipitation. Many of the resultant health problems attributed to SO2 may be a result of the oxidation of SO2 to other compounds.
The effects of SO2 on health are irritation and inflammation of tissue that it directly contacts. Inhalation of SO2 causes bronchial constriction resulting in an increased resistance to air flow, reduction of air volume and an increase of respiratory rate and heart rate. SO2 can exacerbate pre-existing respiratory diseases (asthma, bronchitis, emphysema). The enhancement (synergism) by particulate matter of the toxic response to sulfur dioxide has been observed under conditions which would promote the conversion of sulfur dioxide to sulfuric acid. The degree of enhancement is related to the concentration of particulate matter. A twofold to threefold increase of the irritant response to sulfur dioxide is observed in the presence of particulate matter capable of oxidizing sulfur dioxide to sulfuric acid. Sulfuric acid (H2SO4) inhalation causes an increase in the respiratory system's mucous secretions, which reduces the system's ability to remove particulates via mucociliary clearance. This can result in an increase incidence of respiratory infection. Carbon Monoxide (CO) The major source of carbon monoxide (CO) is motor vehicles. The USEPA has kept under its jurisdiction the regulation of emission control equipment on new motor vehicles while the State's responsibility for reducing excessive ambient carbon monoxide levels is exercised by developing transportation plans for congested urban areas. The toxic effects of high concentrations of CO on the body are well known. Carbon monoxide is absorbed by the lungs and reacts with hemoglobin (the oxygen carrying molecule in the blood) to form carboxyhemoglobin (COHb). This reaction reduces the oxygen carrying capacity of blood because the affinity of hemoglobin for CO is over 200 times that for oxygen. The higher the percentage of hemoglobin bound up in the form of carboxyhemoglobin, the more serious is the health effect. The level of COHb in the blood is directly related to the CO concentration of the inhaled air. For a
Illinois Annual Air Quality Report 2003 Section1: Air Pollutants-Sources, Health and Welfare Effects
4
given ambient air CO concentration, the COHb level in the blood will reach an equilibrium concentration after a sufficient time period. This equilibrium COHb level will be maintained in the blood as long as the ambient air CO level remains unchanged. However, the COHb level will slowly change in the same direction as the CO concentration of the ambient air as a new equilibrium of CO in the blood is established. The lowest CO concentrations shown to produce adverse health effects result in aggravation of cardiovascular disease. Studies demonstrate that these concentrations have resulted in decreased exercise time before the onset of pain in the chest and extremities of individuals with heart or circulatory disease. Slightly higher CO levels have been associated with decreases in vigilance, the ability to discriminate time intervals and exercise performance. Evidence also exists indicating a possible relationship between CO and heart attacks, the development of cardiovascular disease and fetal development. Studies on the existing ambient levels of CO do not indicate any adverse effects on vegetation, materials, or other aspects of human welfare. Nitrogen Dioxide (NO2) Nitrogen gas (N2) is an abundant and inert gas which makes up almost 80 percent of the earth's atmosphere. In this form, it is harmless to man and essential to plant metabolism. Due to its abundance in the air, it is a frequent reactant in many combustion processes. When combustion temperatures are extremely high, as in the burning of coal, oil, gas and in automobile engines, atmospheric nitrogen (N2) may combine with molecular oxygen (O2) to form various oxides of nitrogen (NOx). Of these, nitric oxide (NO) and nitrogen dioxide (NO2) are the most important contributors to air pollution; NOx generally is used to represent these. Nitric oxide (NO) is a colorless and odorless gas. It is the primary form of NOx resulting from the combustion process. NOx contributes to haze and visibility reduction. NOx is also known to cause deterioration and fading of certain fabrics and damage to
vegetation. Depending on concentration and extent of exposure, plants may suffer leaf lesions and reduced crop yield. Sensitivity of plants to nitrogen oxides depends on a variety of factors including species, time of day, light, stage of maturity and the presence or absence of other air pollutants such as sulfur dioxide and ozone. There is a lack of strong evidence associating health effects with most nitrogen oxide compounds. NO2, a secondary derivative of atmospheric nitric oxide, however, has been clearly established as exerting detrimental effects on human health and welfare.
NO2 can cause an impairment of dark adaptation at concentrations as low as 0.07 ppm. NO2 can cause an increase in airway resistance, an increase in respiratory rate, an increase in sensitivity to bronchoconstrictors, a decrease in lung compliance and an enhanced susceptibility to respiratory infections. NO2 is a deep lung irritant capable of producing pulmonary edema if inhaled in sufficient concentrations. When NO2 is inhaled in concentrations with other pollutants, the effects are additive. NOx may also react with water to form corrosive nitric acids, a major component of acid precipitation. Additionally, NOx and various other pollutants (e.g., hydrocarbons) may react in the presence of sunlight to product photochemical oxidants. These are extremely unstable compounds which damage plants and irritate both the eyes and respiratory system of people. Ozone (O3) and a group of chemicals called peroxyacetylnitrates (PAN) are the major constituents of photochemical oxidants. Lead (Pb) Historically atmospheric lead came primarily from combustion of leaded gasoline. However, the use of unleaded gas since 1975 has reduced mobile source lead emissions by over 90%. Currently stationary sources, such as lead smelters, battery manufacturers, iron and steel producers and others can contribute significant amounts of lead to their immediate vicinity.

Illinois Annual Air Quality Report 2003 Section1: Air Pollutants-Sources, Health and Welfare Effects
5
Lead is a stable compound which persists and accumulates both in the environment and in the human body. Lead enters the human body through ingestion and inhalation with consequent absorption into the blood stream and distribution to all body tissues. Clinical, epidemiological and toxicological studies have demonstrated exposure to lead adversely affects human health. Low level lead exposure has been found to interfere with specific enzyme systems and blood production. Kidney and neurological cell damage has also been associated with lead exposure. Animal studies have demonstrated that lead can contribute to reduced fertility and birth defects. Children are the population segment most sensitive to many of lead's adverse effects. Other serious potential effects from lead exposure are behavioral. Brain damage has been well documented in cases of severe lead poisoning in children. Restlessness, headaches, tremors and general symptoms of mental retardation have been noted. The brain seems to be particularly sensitive to lead poisoning, yet it is unclear whether low level exposure will result in brain dysfunction. Although evidence exists which indicates that children with above-normal blood lead levels are more likely to demonstrate poor academic performance, the studies remain inconclusive. Illinois Ambient Air Quality Standards and Episode Levels Consistent with the intent of the Environmental Protection Act of the State of Illinois, Illinois has adopted ambient air quality and episode standards that specify maximum permissible
short-term and long-term concentrations of various contaminants in the atmosphere. Ambient air quality and episode standards are limits on atmospheric concentrations of air contaminants established for the purpose of protecting the public health and welfare. The Illinois and National Ambient Air Quality Standards consist of a primary and secondary standard for each pollutant (contaminant) as presented in Table 1. The Illinois Air Pollution Episode Levels are presented in Table 2. The primary standard and episode criteria represents the level of air quality which is necessary to protect the public health. Air entering the respiratory tract must not menace health. Therefore, the air quality standards must, as a minimum, provide air which will not adversely affect, through acute or chronic symptoms, the public health. Air contaminants increase the aggravation and the production of respiratory and cardio-pulmonary diseases. The secondary standard defines the level of air quality which is necessary to protect the public welfare. This includes, among other things, effects on crops, vegetation, wildlife, visibility and climate, as well as effects on materials, economic values and on personal comfort and well-being. The standards are legally enforceable limitations, and any person causing or contributing to a violation of the standards is subject to enforcement proceedings under the Environmental Protection Act. The standards have also been designed for use as a basis for the development of implementation plans by State and local agencies for the abatement and control of pollutant emissions from existing sources, and for the determination of air contaminant emission limitations to ensure that population, industry and economic growth trends do not add to the region's air pollution problems.

Illinois Annual Air Quality Report 2003 Section1: Air Pollutants-Sources, Health and Welfare Effects
6
Table 1: Summary of National and Illinois Ambient Air Quality Standards
Standard Pollutant Averaging Time Primary Secondary Standard units are micrograms per cubic meter (ug/m3) and parts per million (ppm) Particulate Matter Annual Arithmetic Mean 50 ug/m3 Same as Primary 10 micrometers (PM10) 24-hour 150 ug/m3 Same as Primary Particulate Matter Annual Arithmetic Mean 15.0 ug/m3 Same as Primary 2.5 micrometers (PM2.5) 24-hour 65 ug/m3 Same as Primary Sulfur dioxide Annual Arithmetic Mean 0.03 ppm None 24-hour 0.14 ppm None 3-hour None 0.5 ppm Carbon Monoxide 1-hour 35 ppm Same as Primary 8-hour 9 ppm Same as Primary Ozone 1-hour/day 0.12 ppm Same as Primary 8-hour/day 0.08 ppm Same as Primary Nitrogen Dioxide Annual Arithmetic Mean 0.053 ppm Same as Primary Lead Quarterly Arithmetic Mean 1.5 ug/m3 Same as Primary The PM2.5 standards are referenced to local conditions of temperature and pressure rather than standard conditions (760 mm and 25 deg C). Note: The State of Illinois has not adopted the PM2.5 or 8-hour ozone standards at this time.

Illinois Annual Air Quality Report 2003 Section1: Air Pollutants-Sources, Health and Welfare Effects
7
Table 2: Illinois Air Pollution Episode Levels
Pollutant Advisory Yellow alert Red Alert Emergency Particulate Matter 2-hour 24-hour 24-hour 24-hour micrograms per cubic meter 420 350 420 500 Sulfur Dioxide 2-hour 4-hour 4-hour 4-hour parts per million 0.30 0.30 0.35 0.40 Carbon Monoxide 2-hour 8-hour 8-hour 8-hour parts per million 30 15 30 40 Nitrogen Dioxide 2-hour 1-hour 1-hour 1-hour parts per million 0.40 0.60 1.20 1.60 or or or 24-hour 24-hour 24-hour 0.15 0.30 0.40 Ozone 1-hour 1-hour 1-hour 1-hour parts per million 0.12 0.20 0.30 0.50

Illinois Annual Air Quality Report 2003 Section 2: Statewide Summary of Air Quality for 2003
9
SECTION 2: STATEWIDE SUMMARY OF AIR QUALITY FOR 2003 OZONE Monitoring was conducted at 38 locations during at least part of the April-October "ozone season" and at least 75 percent data capture was obtained at all 38 sites. The Calumet City and Libertyville sites were discontinued. Two sites (East St. Louis (2) and Edwardsville(1)) recorded hourly concentrations above the 0.12 parts per million (ppm) 1-hour standard. The highest 1-hour concentration was 0.134 ppm in East St. Louis compared with a statewide high 1-hour value of 0.136 ppm in 2002. The highest value recorded in the Chicago area was 0.117 ppm recorded in Evanston compared with a high in 2002 of 0.136 ppm in Zion. Data is also presented to compare with the 8-hour standard of 0.08 ppm. The appropriate statistic for comparison with the 8-hour Standard is the fourth highest value, which is averaged over a three year period. A total of 2 sites in Illinois had fourth high values above 0.08 ppm in 2002 compared with 24 sites in 2002. The highest fourth high value was 0.111 ppm at East St. Louis. The highest level in the Chicago area was 0.099 ppm in Lemont. For the three year period 2001 – 2003, five sites (Chicago-SWFP, Evanston, Waukegan, Alton, and Jerseyville) had fourth high averages above 0.08 ppm. Figure 1 shows for each year the statewide average of each site’s highest hourly ozone value for the ten year period 1994-2003. The graph shows a great deal of year-to-year fluctuation and a fairly flat 10-year trend and slightly downward since 1995 even with the increase in 2002. The Statewide average for 2003 was 0.097 ppm compared with 0.109 ppm in 2002 and 0.099 ppm in 2001.
Statewide, the total number of excursion days in 2002 was six compared with one in 2001 and zero in 2000.
Figure 1Average 1-Hour Ozone
Maximum (ppm)
0.05
0.075
0.1
0.125
94 95 96 97 98 99 00 01 02 03
Year
Figure 2Statewide Ozone 1-Hour Exceedance Day Trend
01234567
94 95 96 97 98 99 00 01 02 03
Year

Illinois Annual Air Quality Report 2003 Section 2: Statewide Summary of Air Quality for 2003
10
Figure 2 shows the trend of the total number of days on which one or more sites exceeded the ozone standard in Illinois for the same period 1994-2003. This trend is generally flat with a downward trend since 1995. Overall, Illinois’s weather was near normal in terms of meteorological conditions favorable to ozone formation and transport Statewide. August was the most conducive month in terms of meteorological conditions Statewide followed by July. In terms of conducive days, the Chicago area had 15 percent above the average number and the Metro-East area had the average number. PARTICULATE MATTER Monitoring was conducted at 35 sites for PM2.5. Valid annual averages were obtained for 32 of the 35 sites. A total of 9 sites recorded averages above 15.0 ug/m3, the level of the annual standard compared with 14 sites in 2002 and 16 sites in 2001. The Statewide average of annual averages was 14.1 ug/m3 in 2003 compared with 14.9 ug/m3 in 2002 and 15.5 ug/m3 in 2001. Figure 3 shows the trend of the Statewide annual averages for PM2.5 for the period 2000-2003. There were no exceedances of the 24-hour standard of 65 ug/m3 in 2003. The Statewide peak of 56.8 ug/m3 was recorded in Summit. The Statewide average of the 98th percentile of 24-hour averages was 34.1 ug/m3 in 2003 compared with 33.9 ug/m3 in 2002 and 35.5 ug/m3 in 2001. In 2001 there were 17 sites monitoring PM10.. The Statewide average in 2003 was 27 ug/m3 compared with 27 ug/m3 in 2002 and 28 ug/m3 in 2001. For PM10 the Statewide average of the maximum 24-hour averages in 2003 was 75 ug/m3 compared with 78 ug/m3 in 2002 and 79 ug/m3 in 2001. Figure 4 depicts this trend for the period 1994-2003. No sites exceeded the primary annual standard of 50 ug/m3. The highest annual average was 38
ug/m3 in Granite City - 2040 Washington. The lowest annual was 19 ug/m3 in Carbondale. There were no exceedances of the 24-hour primary standard of 150 ug/m3. The highest 24-hour average was recorded in Lyons township with a value of 120 ug/m3 compared with a high 24-hour value of 138 ug/m3 at Granite City - 2040 Washington in 2001.
Figure 3Particulate Matter (PM2.5)
Annual Trends (ug/m3)
0
5
10
15
20
94 95 96 97 98 99 00 01 02 03
Year
Figure 4Particulate Matter (PM10) 24-
Hour Trends (ug/m3)
0
50
100
150
94 95 96 97 98 99 00 01 02 03
Year

Illinois Annual Air Quality Report 2003 Section 2: Statewide Summary of Air Quality for 2003
11
CARBON MONOXIDE
There were no exceedances of either the 1-hour primary standard of 35 ppm or the 8-hour primary standard of 9 ppm in 2003. The highest 1-hour average was 5.3 ppm recorded in Peoria. The highest 8-hour average was 4.0 ppm recorded in Peoria and Maywood. Figure 5 shows the trend for the period 1994-2003 for the statewide average of the 1-hour and 8-hour high CO values. The overall trend for both averages is downward. The statewide average of the 1-hour high was 4.4 ppm in 2003 compared with 4.4 ppm in 2002. The statewide average for the 8-hour high was 2.9 ppm in 2003 compared with 2.9 ppm in 2002.
Figure 5Carbon Monoxide Trends (ppm)
0
2
4
6
8
10
94 95 96 97 98 99 00 01 02 03
Year
1-hr
8-hr
SULFUR DIOXIDE There were no exceedances of the the annual primary standard of 0.03 ppm, or the 3-hour secondary standard of 0.5 ppm in 2003. There was 1 exceednace of the 24-hour primary standard of 0.14 ppm in Pekin.
The maximum 24-hour average was 0.152 ppm recorded in Pekin. This compares with a high 24-hour average in 2002 of 0.074 ppm. The highest 3-hour average of 0.292 ppm was also recorded in Pekin. The Statewide annual average for 2003 was 0.004 ppm. The Statewide average in 2002 was 0.004 ppm.
Figure 6Sulfur Dioxide 24-Hour Trends
(ppm)
0.000
0.020
0.040
0.060
0.080
94 95 96 97 98 99 00 01 02 03
Year
Since 1984 that Statewide trend of annual averages has been flat, ranging from 0.009 ppm to 0.004 ppm. Figure 6 shows the statewide trend for the maximum 24-hour averages for the period 1994-2003. The 24-hour average trend has been overall downward; however a greater degree of year-to-year fluctuations have occurred. The statewide average for 2003 was ppm compared with the 2002 average of 0.033 ppm. NITROGEN DIOXIDE There were no violations of the annual primary standard of 0.053 ppm recorded in Illinois during 2003. The highest annual average of 0.031 ppm was recorded at Chicago - CTA. The Statewide average for 2003 was 0.024 ppm compared with 0.023 ppm in 2002 and 0.025 ppm in 2001.
Illinois Annual Air Quality Report 2003 Section 2: Statewide Summary of Air Quality for 2003
12
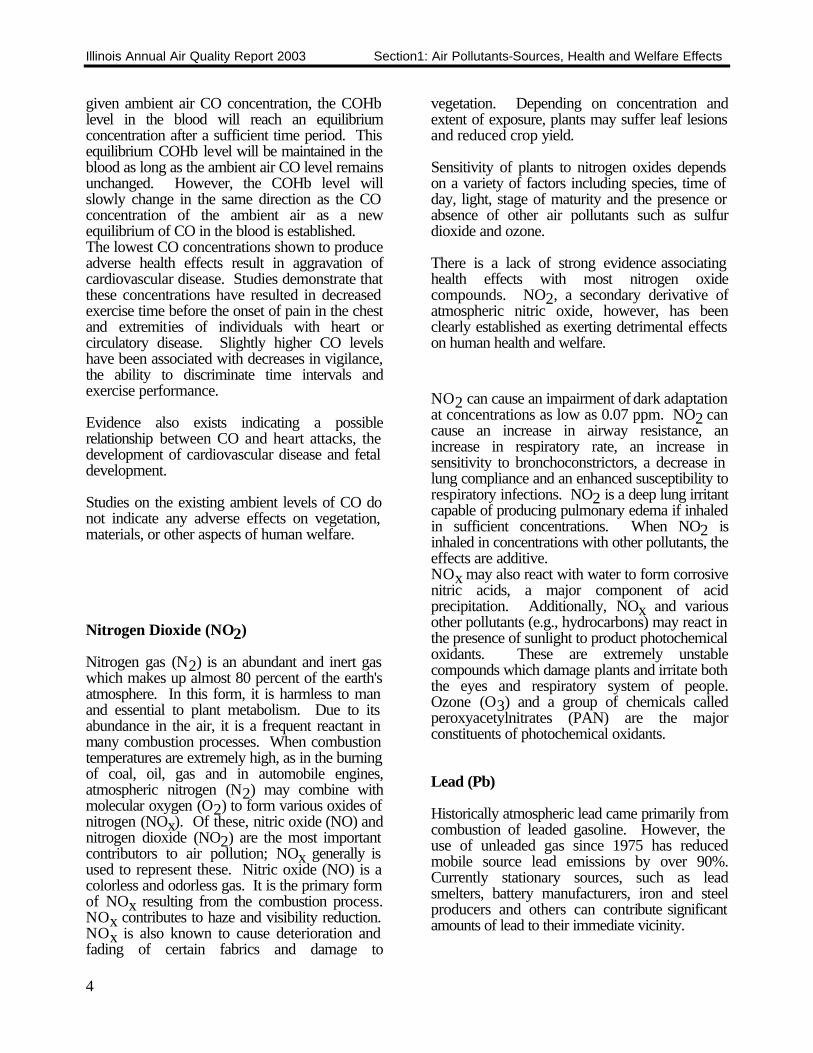
Three sites operated only during part of the ozone season as PAMS. Figure 7 depicts the trend of statewide averages from 1994-2003. The trend has been generally stable for the period ranging from 0.022 ppm to 0.027 ppm. There have been no violations of the annual standard since 1980.
Figure 7Nitrogen Dioxide Annual Trend
(ppm)
0
0.01
0.02
0.03
94 95 96 97 98 99 00 01 02 03
Year
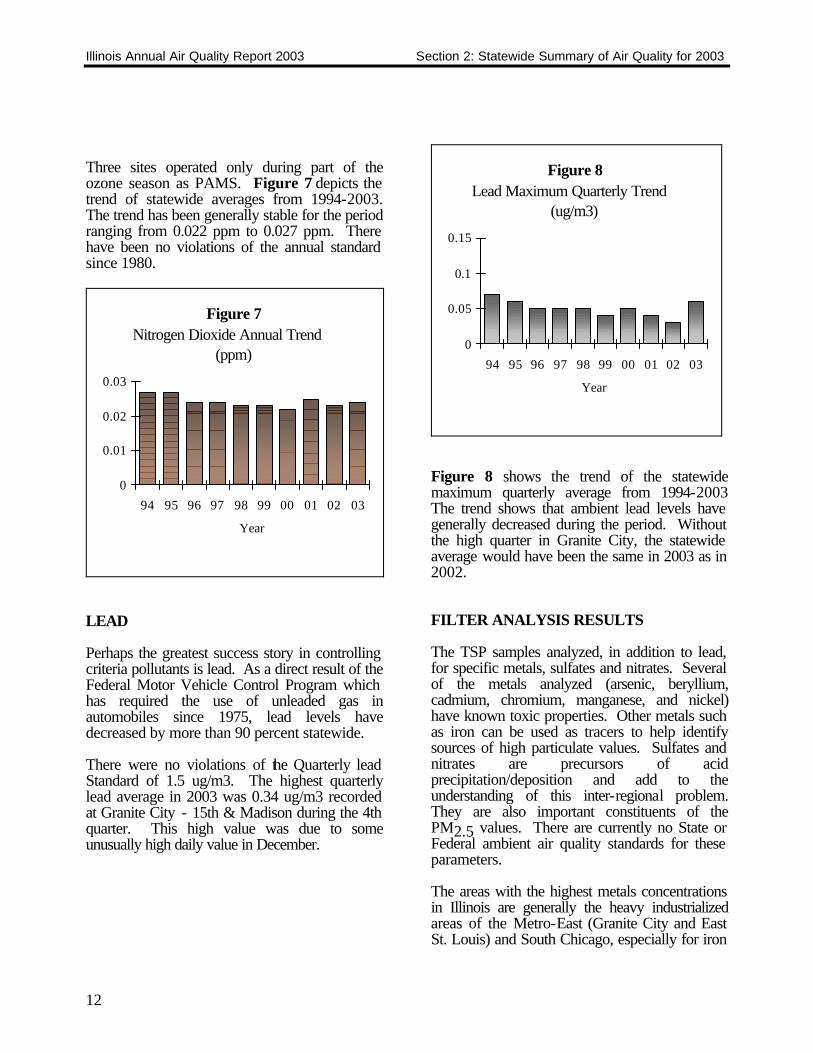
LEAD Perhaps the greatest success story in controlling criteria pollutants is lead. As a direct result of the Federal Motor Vehicle Control Program which has required the use of unleaded gas in automobiles since 1975, lead levels have decreased by more than 90 percent statewide. There were no violations of the Quarterly lead Standard of 1.5 ug/m3. The highest quarterly lead average in 2003 was 0.34 ug/m3 recorded at Granite City - 15th & Madison during the 4th quarter. This high value was due to some unusually high daily value in December.
Figure 8Lead Maximum Quarterly Trend
(ug/m3)
0
0.05
0.1
0.15
94 95 96 97 98 99 00 01 02 03
Year
Figure 8 shows the trend of the statewide maximum quarterly average from 1994-2003 The trend shows that ambient lead levels have generally decreased during the period. Without the high quarter in Granite City, the statewide average would have been the same in 2003 as in 2002. FILTER ANALYSIS RESULTS
The TSP samples analyzed, in addition to lead, for specific metals, sulfates and nitrates. Several of the metals analyzed (arsenic, beryllium, cadmium, chromium, manganese, and nickel) have known toxic properties. Other metals such as iron can be used as tracers to help identify sources of high particulate values. Sulfates and nitrates are precursors of acid precipitation/deposition and add to the understanding of this inter-regional problem. They are also important constituents of the PM2.5 values. There are currently no State or Federal ambient air quality standards for these parameters. The areas with the highest metals concentrations in Illinois are generally the heavy industrialized areas of the Metro-East (Granite City and East St. Louis) and South Chicago, especially for iron
Illinois Annual Air Quality Report 2003 Section 2: Statewide Summary of Air Quality for 2003
13
and manganese. The highest 24-hour average for arsenic was 0.088 ug/m3 measured in Summit. The highest annual average of 0.006 ug/m3 was recorded at the same site . There were no measurable beryllium 24-hour averages recorded statewide. East St. Louis recorded the highest cadmium concentrations with a maximum 24-hour average of 0.038 ug/m3 and the highest annual average of 0.003 ug/m3 . The highest 24-hour chromium average was 0.047 ug/m3 recorded at Chicago - Washington. Maywood had the highest annual average at 0.012 ug/m3. The highest iron and manganese values were recorded in the industrial areas of Granite City and South Chicago and the high traffic areas of Chicago - Cermak and Maywood. The highest 24-hour average for nickel was recorded at Summit with a value of 0.036 ug/m3. The highest annual average was in Maywood with an average of 0.010 ug/m3. For nitrates the highest 24-hour average was 22.7 ug/m3 recorded at Chicago - Washington. The highest annual average was 5.7 ug/m3 at Chicago - Mayfair. For sulfates the highest 24-hour average was 25.4 ug/m3 recorded at East St. Louis. The highest annual average was 10.5 ug/m3 also at East St. Louis. In general metals values were somewhat higher, nitrate values were lower, and sulfates were similar in 2003 than in 2002.
VOLATILE ORGANIC COMPOUNDS
Sampling for volatile organic compounds (VOCs) continues as part of the photochemical assessment monitoring site (PAMS) network. The network consists of three sites: Chicago - Jardine - Type 2 source area and Northbrook - Type 3 peak ozone area. The Zion - Type 4 domain edge site was temporarily discontinued in 2003. Sampling was conducted for the period June - August. Automated Gas Chromatograph (GC) systems providing hourly data were located at both sites. In addition, continuous formaldehyde data was collected in Northbrook and manual carbonyl samples were taken every six days at Northbrook. There were no supplemental high ozone days during 2003 so the 3-hour cartridge data was not available. The data is presented as parts per billion carbon (ppbc). This process
reduces all of the results to a common basis in terms of single carbon atoms. The carbonyls are expressed in regular parts per billion volume. In general VOC levels were lower in 2003 than in 2002. The highest compounds in terms of 24-hour and seasonal averages at Chicago - Jardine were Isopentane, Ethane, Propane, Toluene, 2,2,4 Trimethylpentane, and N-Butane. The lowest compounds were Isoprene, Methylheptanes, Ethyltoluenes, Diethylbenzenes, Butenes, and Pentenes. The highest compounds for 24-hour and seasonal averages at Northbrook were Isopentane, Ethane, Toluene, 2,2,4 Trimethylpentane, Formaldehyde, Isoprene, N-Butane, and Propane. The lowest compounds were Pentenes, Styrene, Diethylbenzenes, and Propylbenzenes. TOXIC COMPOUNDS Sampling for toxic compounds other than metals (see Filter Analysis Section) was conducted at two locations - Northbrook and Schiller Park. Most compounds were below the method detection limits. The highest compounds were toluene, formaldehyde, acetaldehyde, and benzene.

Illinois Annual Air Quality Report 2003 Section 3: Air Quality Index
15
SECTION 3: AIR QUALITY INDEX The Air Quality Index (AQI) is the national standard method for reporting air pollution levels to the general public in 2002. An index such as the AQI is necessary because there are several air pollutants, each with different typical ambient concentrations and each with different levels of harm, and to report actual concentrations for all of them would be confusing. The AQI uses a single number and a short descriptor to define the air quality in an easy-to-remember and easy-to-understand way, taking all the pollutants into account. The AQI is based on the short-term Federal National Ambient Air Quality Standards (NAAQS), the Federal episode criteria, and the Federal Significant Harm levels for six of the "criteria pollutants", namely:
•• Ozone (O3) •• Sulfur dioxide (SO2) •• Carbon monoxide (CO) •• Particulate matter (PM10)
•• Particulate matter (PM2.5) •• Nitrogen dioxide (NO2)
In each case (except PM2.5 which uses a lower value), the short-term primary NAAQS corresponds to a AQI of 100 and a descriptor of Unhealthy for Sensitive Groups, the Significant Harm level corresponds to a AQI of 500 and a descriptor of Hazardous, and the episode criteria correspond to intermediate hundreds. NO2 does not have short-term NAAQSs; AQI begins at 201 for it. For the AQI the health effects and
cautionary statements are pollutant-specific. Table 3 lists those for 8-hour ozone as an example. Unhealthy for Sensitive Groups occurs on occasion for 8-hour ozone and PM2.5. Unhealthy air quality is uncommon in Illinois, and Very Unhealthful air quality is rare. There has never been an occurrence of Hazardous air quality in Illinois. The AQI is computed as follows: data from pollution monitors in an area are collected, and the AQI subindex for each pollutant is computed using formulas derived from the index/concentration relations noted above. Nomograms and tables are also available for this purpose. The data used are:
•• O3 estimate of the highest 8-hour average for that calendar day
•• SO2 the most recent 24-hour average •• CO the highest 8-hour average so far
that calendar day •• PM10 the most recent 24-hour average
•• PM2.5 estimate of the highest 24-hour average for that calendar day
•• NO2 the highest 1-hour average (if
above 600 ppb) Continuous monitors are utilized for all the pollutants including PM10 and PM2.5.

Illinois Annual Air Quality Report 2003 Section 3: Air Quality Index
16
Table 3: AQI Descriptor Categories and Health Effects
AQI Range Descriptor Category 0-50 Good (G) 51-100 Moderate (M) 101-150 Unhealthy for Sensitive Groups (USG) 151-200 Unhealthy (UH) 201-300 Very Unhealthy (VUH) 301 and above Hazardous (HAZ) Index & Category Health Effects Cautionary Statements 101-150, Unhealthy for Sensitive Groups
Increasing likelihood of respiratory symptoms and breathing discomfort in active children and adults and prople with respiratory disease, such as asthma.
Active children and adults, and people with respiratory disease, such as asthma, should limit prolonged outdoor activity.
151-200, Unhealthy Greater likelihood of respiratory
symptoms and breathing difficulties in active children and adults and prople with respiratory disease, such as asthma. Possible respiratory effects in general population.
Active children and adults, and people with respiratory disease, such as asthma, should avoid prolonged outdoor exertion;everyone else, especially children should limit prolonged outdoor exertion.
201-300, Very Unhealthful Increasingly severe symptoms
and inpaired breathing likely in active children and adults and people with respitatory disease, such as asthma: increasing likelihood of respiratory effects in general population.
Active children and adults, and people with respiratory disease, such as asthma, should avoid all outdoor exertion; everyone else. especially children, should limit outdoor exertion.
301-500, Hazardous Severe respiratory effects and
inpaired breathing likely in active children and adults and people with respitatory disease, such as asthma: increasingly severe respiratory effects likely in general population.
Everyone should avoid all outdoor exertion.

Illinois Annual Air Quality Report 2003 Section 3: Air Quality Index
17
SO2 = 23 CO = 19 PM10 = 41
PM2.5 = 61 Anytown's AQI for that day would be 61, which is in the Moderate category, and the Critical Pollutant would be particulates (PM2.5). If data for one of the pollutants used in computing AQI is missing, the AQI is computed using the data available, ignoring the missing datum. It occasionally happens that two pollutants have the same subindex; in such cases there are two critical pollutants. The Illinois EPA issues the AQI for 10 areas, or Sectors, in Illinois (Table 4). These correspond to metropolitan areas with populations greater than 100,000. Illinois AQI's are computed from data up to and including the 3 PM local time readings (4 PM during the May – September portion of the Ozone Season) every weekday. A bulletin giving the AQI numbers, descriptors, critical pollutants, and a forecast of the category for the next day's AQI for each of the sectors is issued over the Illinois Weatherwire, a service of the National Weather Service, about 3:30 PM each work day (4:30 PM during the summer). Almost all TV stations and many radio stations and newspapers receive the Illinois Weatherwire, and are therefore able to inform the public about the AQI either immediately or on the evening news. Also the AQI is available on IEPA's web site (URL http://www.epa.state.il.us/air/aqi/index.html) In the Chicago and Cook County area, AQI's are available on phone recordings maintained by the Cook County Department of Environmental Control and the Chicago Department of the Environment.
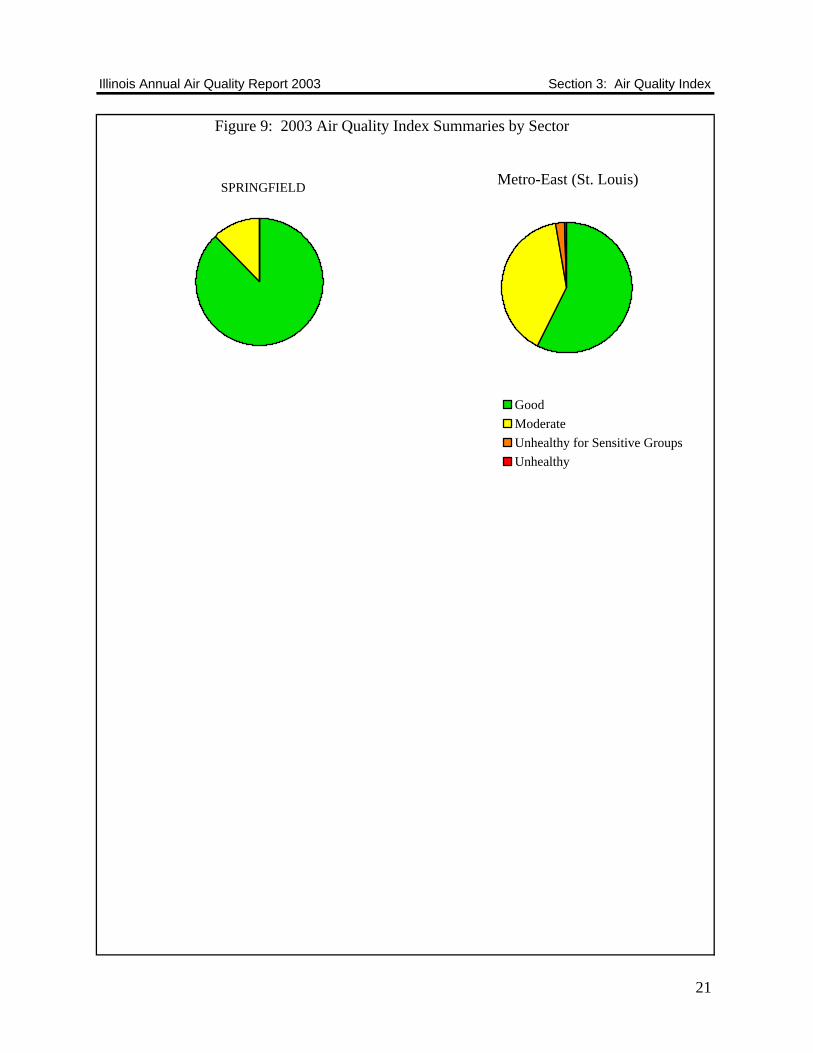
If the AQI subindex for any pollutant in any sector should reach or exceed the Unhealthy (or any higher) category late in the afternoon or on weekends when the AQI is not published, the IEPA puts out a special bulletin on the Illinois Weatherwire. 2003 Illinois AQI Summary In order to present a more representative AQI, 24-hour calendar day PM2.5 values from the total network were used to determine the percentages in Figure 9 even though these values were not available for issuing the daily AQI. Air quality was still in the "Good" category most often in 2003. All Sectors had a higher frequency of "Good" than "Moderate" and "Unhealthy for Sensitive Groups". All sectors except Chicago and Metro-East had 75 percent or more of the days in the "Good" category. Within AQI sectors there were 2 occurrences of Unhealthy and 28 occurrences of Unhealthy for Sensitive Groups air quality in in 2003. The sector breakdown for Unhealthy was 2 in Metro East. The sector breakdown for Unhealthy for Sensitive Groups was 8 in Metro-East, 7 in Chicago, 5 in South & West Suburbs, 4 in the North & West Suburbs, 2 in Will County, 1 in Bloomington-Normal, and 1 in Peoria. Outside of AQI sectors there were 2 additional occurrences of Unhealthy for Sensitive Groups. Figure 9 presents the AQI statistics for each sector. The pie chart shows the percent of time each sector was in a particular category. In 2003 there were no ozone advisories issued in the State. An Advisory is declared when ozone levels have reached the level of the 1-hour standard (0.12 ppm) on a particular day and meteorological conditions are such that these levels are expected again the next day.
Illinois Annual Air Quality Report 2003 Section 3: Air Quality Index
18
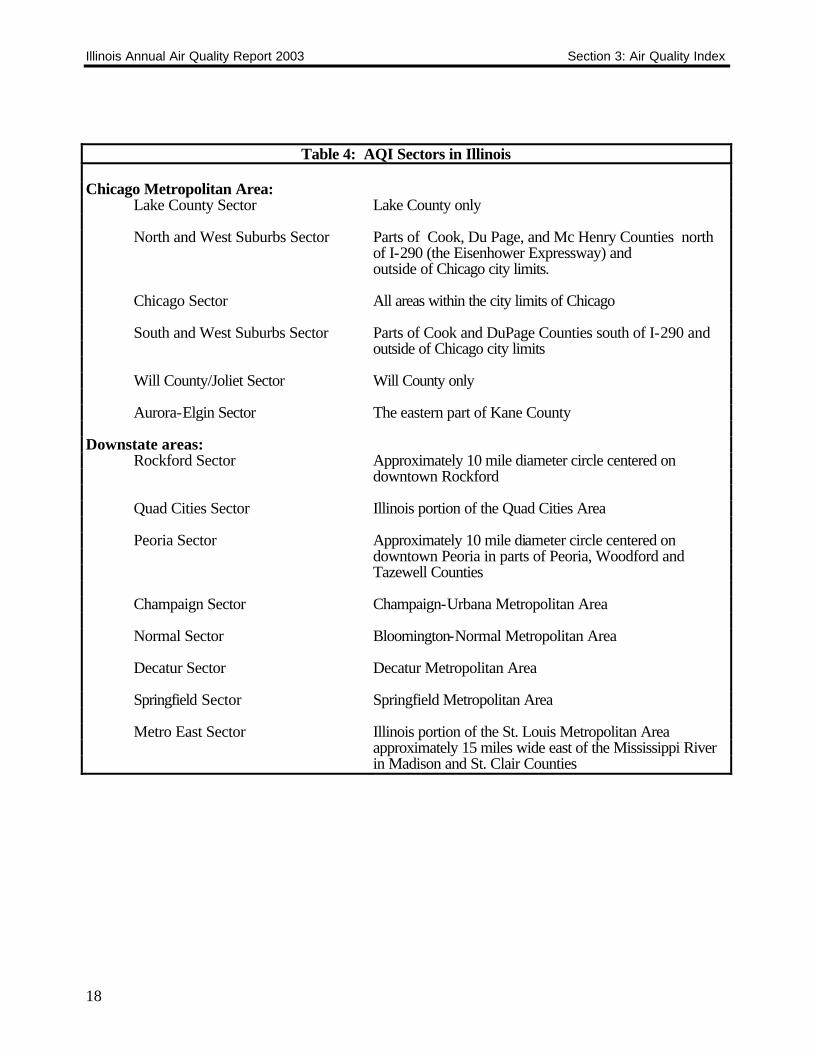
Table 4: AQI Sectors in Illinois
Chicago Metropolitan Area: Lake County Sector Lake County only North and West Suburbs Sector Parts of Cook, Du Page, and Mc Henry Counties north
of I-290 (the Eisenhower Expressway) and outside of Chicago city limits. Chicago Sector All areas within the city limits of Chicago South and West Suburbs Sector Parts of Cook and DuPage Counties south of I-290 and outside of Chicago city limits Will County/Joliet Sector Will County only Aurora-Elgin Sector The eastern part of Kane County Downstate areas: Rockford Sector Approximately 10 mile diameter circle centered on
downtown Rockford Quad Cities Sector Illinois portion of the Quad Cities Area Peoria Sector Approximately 10 mile diameter circle centered on
downtown Peoria in parts of Peoria, Woodford and Tazewell Counties
Champaign Sector Champaign-Urbana Metropolitan Area Normal Sector Bloomington-Normal Metropolitan Area Decatur Sector Decatur Metropolitan Area Springfield Sector Springfield Metropolitan Area Metro East Sector Illinois portion of the St. Louis Metropolitan Area
approximately 15 miles wide east of the Mississippi River in Madison and St. Clair Counties

Illinois Annual Air Quality Report 2003 Section 3: Air Quality Index
Figure 9: 2003 Air Quality Index Summaries by Sector
19
Chicago Sector - Lake County Chicago Sector - Chicago
Chicago Sector - North & West Suburbs
Chicago Sector - South & West Suburbs
Aurora - Elgin Joliet/Will County
GoodModerateUnhealthy for Sensitive GroupsUnhealthy

Illinois Annual Air Quality Report 2003 Section 3: Air Quality Index
Figure 9: 2003 Air Quality Index Summaries by Sector
20
Rockford Quad Cities
Peoria Champaign
Decatur
Good
Moderate
Unhealthy for Sensitive Groups
Unhealthy
Normal
Illinois Annual Air Quality Report 2003 Section 3: Air Quality Index
Figure 9: 2003 Air Quality Index Summaries by Sector
21
Metro-East (St. Louis)
GoodModerateUnhealthy for Sensitive GroupsUnhealthy
SPRINGFIELD

Illinois Annual Air Quality Report 2003 Section 4: Statrewide Summary of Point Source Emissions
23
SECTION 4: STATEWIDE SUMMARY OF POINT SOURCE EMISSIONS
Since the late 1970's, the Division of Air Pollution Control has maintained a database of stationary point source emissions for the entire State. 40 CFR 51.211 requires Illinois to include in its State Implementation Plan "... procedures for requiring owners or operators of stationary sources to maintain records of... a) Information on the nature and amount of emissions from the stationary source and b) other information as may be necessary..." The emission database maintained by the Division of Air Pollution Control was originally called the Total Air System (TAS). Updates to the database were made through batch transactions every two weeks. In June 1989, the TAS was replaced with an on-line system known as the Emission Inventory System (EIS). Very few new data items to be stored were added when the Division switched to the EIS. The change was mainly to get to an on-line system and to enhance the structure of the database to make it more flexible. In March, 1999, the Bureau of Air introduced a new emission inventory system known as ISSIS (Illinois Stationary Source Inventory System). This new inventory system, which was developed in Oracle, built upon the structure of the annual emission reporting system (CAERS - Computerized Annual Emission Reporting System) previously developed. Up until then, inventory data resided both in EIS and CAERS. Data from EIS was loaded annually into CAERS. ISSIS did away with this requirement. Now inventory data resides in one database. ISSIS currently includes emission data on approximately 7,500 active sources throughout the State. The ISSIS data includes source addresses, source emission totals, permit data such as expiration date and status, emission unit data such as name, hours of operation, operating rate, fuel parameters and emissions, control equipment data such as control device name, type and removal efficiencies, and stack parameters. Reported emissions and Agency calculated emissions are stored separately.
Also in March, 1999, the group responsible for the entry of emission inventory data was switched from the Permit Section to the Inventory Unit of the Compliance and Systems Management Section. The Inventory Unit, now in the Air Quality Planning Section, uses permit applications, the issued permit and data reported on annual emission reports to compile the inventory. The following tables and graphs are an analysis of the emissions data contained in ISSIS at the end of 2003. It is important to note emissions contained in the ISSIS are not necessarily the actual emissions that entered the atmosphere. This is due to the fact that when an air pollution permit is applied for, the applicant provides maximum and average emission rates. The maximum emission rate reflects what the applicant believes the emission rate would be at maximum production. The average emission rate reflects emissions at the applicant's most probable production rate. In the future, more and more reported data will be incorporated into the inventory. To calculate the distribution of emissions for the individual categories, the source classification code (SCC) field was used from the ISSIS. The SCC is an eight digit code that breaks emission units into logical categories. SCCs are provided by the USEPA and are included in the Aerometric Information Retrieval System (AIRS) Facility Subsystem (AFS). Currently there are approximately 7,000 of these SCCs. To produce the following tables, the first three digits of the SCC were used. Only categories that contributed significantly to the overall total are listed in the following sections. The complete category breakdown can be found in Appendix D.
Illinois Annual Air Quality Report 2003 Section 4: Statrewide Summary of Point Source Emissions
24
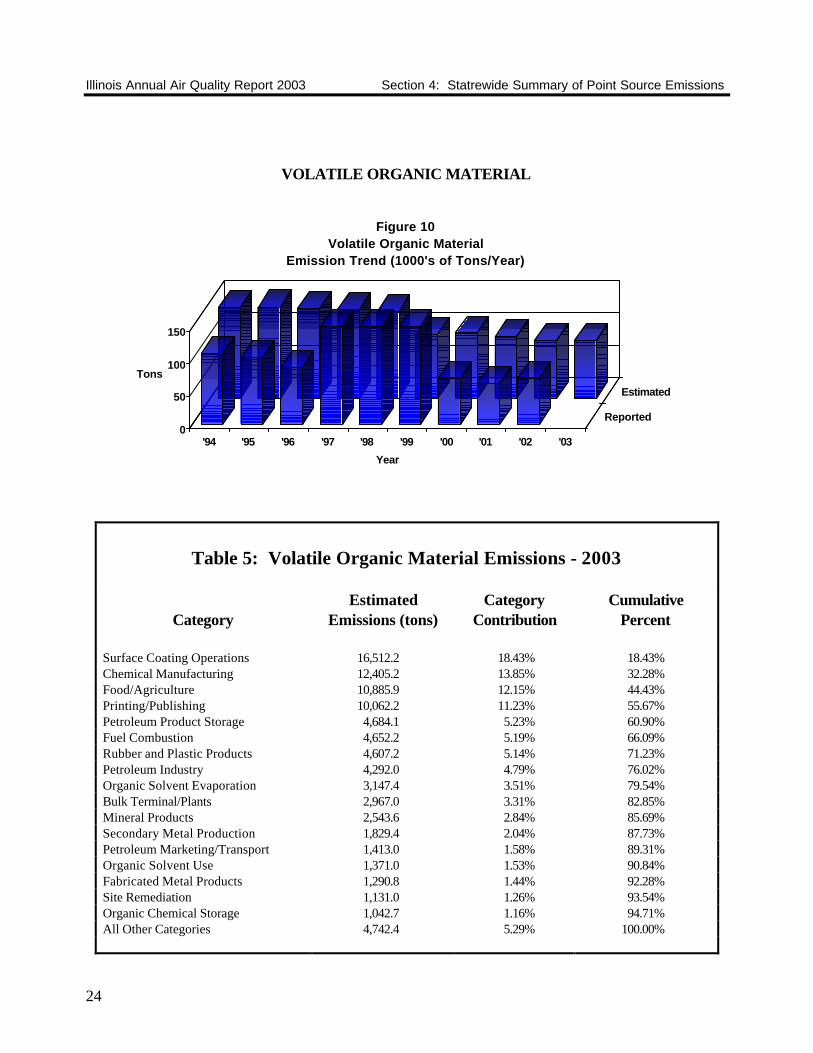
VOLATILE ORGANIC MATERIAL
0
50
100
150
Tons
'94 '95 '96 '97 '98 '99 '00 '01 '02 '03
Reported
Estimated
Year
Figure 10Volatile Organic Material
Emission Trend (1000's of Tons/Year)
Table 5: Volatile Organic Material Emissions - 2003
Category
Estimated Emissions (tons)
Category Contribution
Cumulative Percent
Surface Coating Operations 16,512.2 18.43% 18.43% Chemical Manufacturing 12,405.2 13.85% 32.28% Food/Agriculture 10,885.9 12.15% 44.43% Printing/Publishing 10,062.2 11.23% 55.67% Petroleum Product Storage 4,684.1 5.23% 60.90% Fuel Combustion 4,652.2 5.19% 66.09% Rubber and Plastic Products 4,607.2 5.14% 71.23% Petroleum Industry 4,292.0 4.79% 76.02% Organic Solvent Evaporation 3,147.4 3.51% 79.54% Bulk Terminal/Plants 2,967.0 3.31% 82.85% Mineral Products 2,543.6 2.84% 85.69% Secondary Metal Production 1,829.4 2.04% 87.73% Petroleum Marketing/Transport 1,413.0 1.58% 89.31% Organic Solvent Use 1,371.0 1.53% 90.84% Fabricated Metal Products 1,290.8 1.44% 92.28% Site Remediation 1,131.0 1.26% 93.54% Organic Chemical Storage 1,042.7 1.16% 94.71% All Other Categories 4,742.4 5.29% 100.00%

Illinois Annual Air Quality Report 2003 Section 4: Statrewide Summary of Point Source Emissions
25
PARTICULATE MATTER
0
50
100
150
Tons
'94 '95 '96 '97 '98 '99 '00 '01 '02 '03
Reported
Estimated
Year
Figure 11Particulate Emission Trend
(1000's of Tons/Year)
Table 6: Distribution of Particulate Matter Emissions - 2003
Category
Estimated Emissions (tons)
Category Contribution
Cumulative Percent
Mineral Products 22,432.0 28.73% 28.73% Fuel Combustion 20,251.3 25.94% 54.67% Food/Agriculture 16,373.6 20.97% 75.64% Secondary Metal Production 4,788.1 6.13% 81.77% Primary Metal Production 2,942.3 3.77% 85.54% Chemical Manufacturing 2,876.1 3.68% 89.22% Petroleum Industry 2,540.6 3.25% 92.48% Solid Waste Disposal 1,802.3 2.31% 94.78% Fabricated Metal Products 861.7 1.10% 95.89% Surface Coating Operations 744.7 0.95% 96.84% Rubber and Plastic Products 521.2 0.67% 97.51% All Other Categories 1,944.5 2.49% 100.00%
Illinois Annual Air Quality Report 2003 Section 4: Statrewide Summary of Point Source Emissions
26
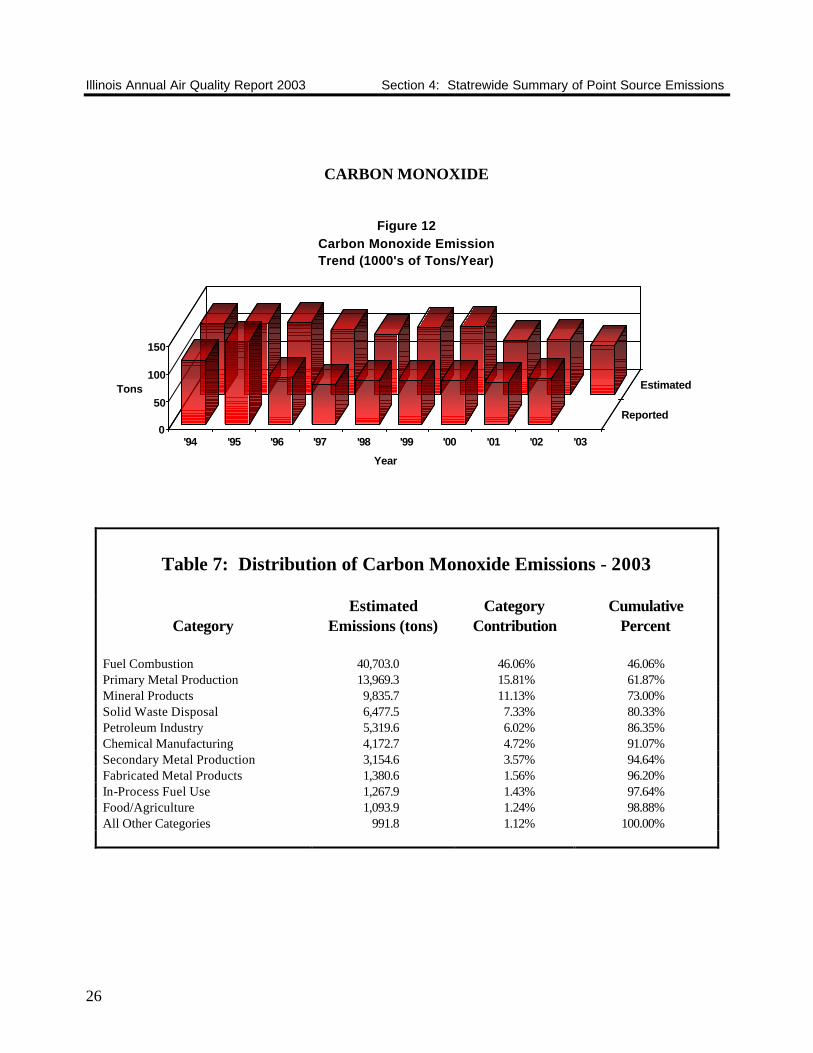
CARBON MONOXIDE
0
50
100
150
Tons
'94 '95 '96 '97 '98 '99 '00 '01 '02 '03
Reported
Estimated
Year
Figure 12Carbon Monoxide EmissionTrend (1000's of Tons/Year)
Table 7: Distribution of Carbon Monoxide Emissions - 2003
Category
Estimated Emissions (tons)
Category Contribution
Cumulative Percent
Fuel Combustion 40,703.0 46.06% 46.06% Primary Metal Production 13,969.3 15.81% 61.87% Mineral Products 9,835.7 11.13% 73.00% Solid Waste Disposal 6,477.5 7.33% 80.33% Petroleum Industry 5,319.6 6.02% 86.35% Chemical Manufacturing 4,172.7 4.72% 91.07% Secondary Metal Production 3,154.6 3.57% 94.64% Fabricated Metal Products 1,380.6 1.56% 96.20% In-Process Fuel Use 1,267.9 1.43% 97.64% Food/Agriculture 1,093.9 1.24% 98.88% All Other Categories 991.8 1.12% 100.00%

Illinois Annual Air Quality Report 2003 Section 4: Statrewide Summary of Point Source Emissions
27
SULFUR DIOXIDE
0
500
1000
1500
Tons
'94 '95 '96 '97 '98 '99 '00 '01 '02 '03
Reported
Estimated
Year
Figure 13Sulfur Dioxide Emission
Trend (1000's of Tons/Year)
Table 8: Distribution of Sulfur Dioxide Emissions - 2003
Category
Estimated Emissions (tons)
Category Contribution
Cumulative Percent
Fuel Combustion 414,050.0 80.82% 80.82% Petroleum Industry 60,558.6 11.82% 92.64% Mineral Products 14,046.1 2.74% 95.38% Chemical Manufacturing 12,892.9 2.52% 97.90% Primary Metal Production 3,243.0 0.63% 98.53% All Other Categories 7,530.0 1.47% 100.00%

Illinois Annual Air Quality Report 2003 Section 4: Statrewide Summary of Point Source Emissions
28
NITROGEN OXIDES
0
200
400
600
Tons
'94 '95 '96 '97 '98 '99 '00 '01 '02 '03
Repor ted
Est imated
Year
Figure 14Nitrogen Oxide Emission
Trend (1000's of Tons/Year)
Table 9: Distribution of Nitrogen Oxide Emissions - 2003
Category
Estimated Emissions (tons)
Category Contribution
Cumulative Percent
Fuel Combustion 241,018.9 83.13% 83.13% Mineral Products 18,755.3 6.47% 89.60% Petroleum Industry 14,794.2 5.10% 94.70% Solid Waste Disposal 2,970.9 1.02% 95.73% In-Process Fuel Use 2,439.7 0.84% 95.57% Secondary Metal Production 2,359.6 0.81% 97.38% Primary Metal Production 2,250.5 0.78% 98.16% Chemical Manufacturing 1,575.5 0.54% 98.70% Food/Agriculture 984.4 0.34% 99.04% All Other Categories 2,772.3 0.96% 100.00%

29
APPENDIX A AIR SAMPLING NETWORK
DESCRIPTION OF THE AIR SAMPLING NETWORK
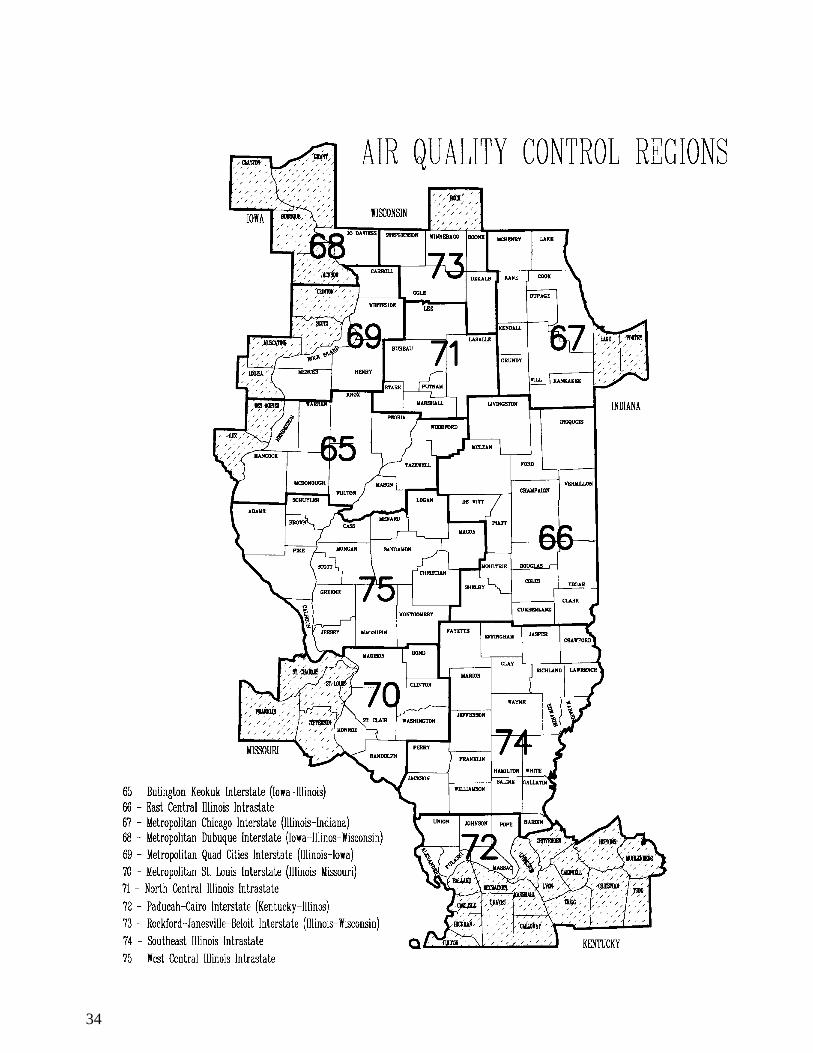
The Illinois air monitoring network is composed of instrumentation owned and operated by both the Illinois Environmental Protection Agency and by cooperating local agencies. A directory of local agencies within Illinois and the environmental agencies of adjacent states can be found in Table A1. This network has been designed to measure ambient air quality levels in the various Illinois Air Quality Control Regions (AQCR). Historically, each AQCR was classified on the basis of known air pollutant concentrations or, where these were not known, estimated air quality. A map of the AQCR's in Illinois and overlapping into surrounding states can be found at the end of this section. Many local agencies and volunteers cooperate and support the operation of the Illinois air monitoring network. The network contains both continuous and intermittent instruments. The continuous instruments operate throughout the year, while noncontinuous instruments operate intermittently based on the schedule shown in Table A2. This is the official noncontinuous
sampling schedule used by the Illinois EPA during 2002. The Illinois network is deployed along the lines described in the Illinois State Implementation Plan. An updated air monitoring plan is submitted to USEPA each year for review. In accordance with USEPA air quality monitoring requirements as set forth in Title 40 of the Code of Federal Regulations, Part 58 (40 CFR 58), four types of monitoring stations are used to collect ambient air data. The types of stations are distinguished from one another on the basis of the general monitoring objectives they are designed to meet The SLAMS /NAMS /PAMS/ SPMS designations for the sites operated within the State of Illinois are provided by site in the Site Directory (Table A4). All of the industrial sites are considered to be SPMS. Table A3 is a summary of the distribution of SLAMS/NAMS/PAMS/SPMS by pollutant.
1. State/Local Air Monitoring Station (SLAMS) Network - The SLAMS network is designed to meet a minimum of four basis monitoring objectives:
a. To determine the highest concentrations expected to occur in the area covered by the
network. b. To determine representative concentrations in areas of high population density. c. To determine the air quality impact of significant sources or source categories. d. To determine general background concentration levels. 2. National Air Monitoring Station (NAMS) Network - The NAMS network is a subset of
stations selected from the SLAMS network with emphasis given to urban and multisource areas. The primary objectives of the NAMS network are:
a. To measure expected maximum concentrations.

30
TABLE A1
DIRECTORY OF REGIONAL AIR POLLUTION AGENCIES Chicago Department of the Environment 30 N. LaSalle Street, 25th Floor Chicago, Illinois 60602 312/744-7606 Fax 312/744-6451 Cook County Department of Environmental Control 69 W. Washington, Suite 1900 Chicago, Illinois 60602 312/603-8200 Fax 312/603-9828 Indiana Dept. of Environmental Management 100 N. Senate Ave. Indianapolis, Indiana 46204 317/232-8611 Fax 317/233-6647 Iowa Dept. of Natural Resources Air Quality Bureau 7900 Hickman Road Suite 1 Urbandale, Iowa 50322 515/242-5100
Kentucky Dept. for Environmental Protection Air Quality Division 803 Schenkel Lane Frankfort, Kentucky 40601 502/573-3382 Fax 502/573-3787 Michigan Dept. of Natural Resources Air Quality Division P.O. Box 30260 Lansing, Michigan 48909 517/373-7023 Fax 517/373-1265 Missouri Dept. of Natural Resources Division of Environmental Quality P.O. Box 176 205 Jefferson Street Jefferson City, Missouri 65102 573/751-4817 Fax 573/751-2706 Wisconsin Dept. of Natural Resources Bureau of Air Management P.O. Box 7921 101 S. Webster Madison, Wisconsin 53707 608/266-7718 Fax 608/267-0560

31
Table A22003 - Noncontinous Sampling Schedule
January February MarchS M T W T F S S M T W T F S S M T W T F S
1 2 3 4 1 1
5 6 7 8 9 10 11 2 3 4 5 6 7 8 2 3 4 5 6 7 8
12 13 14 15 16 17 18 9 10 11 12 13 14 15 9 10 11 12 13 14 15
19 20 21 22 23 24 25 16 17 18 19 20 21 22 16 17 18 19 20 21 22
26 27 28 29 30 31 23 24 25 26 27 28 23 24 25 26 27 28 29
30 31
April May JuneS M T W T F S S M T W T F S S M T W T F S
1 2 3 4 5 1 2 3 1 2 3 4 5 6 7
6 7 8 9 10 11 12 4 5 6 7 8 9 10 8 9 10 11 12 13 14
13 14 15 16 17 18 19 11 12 13 14 15 16 17 15 16 17 18 19 20 21
20 21 22 23 24 25 26 18 19 20 21 22 23 24 22 23 24 25 26 27 28
27 28 29 30 25 26 27 28 29 30 31 29 30
July August SeptemberS M T W T F S S M T W T F S S M T W T F S
1 2 3 4 5 1 2 1 2 3 4 5 6
6 7 8 9 10 11 12 3 4 5 6 7 8 9 7 8 9 10 11 12 13
13 14 15 16 17 18 19 10 11 12 13 14 15 16 14 15 16 17 18 19 20
20 21 22 23 24 25 26 17 18 19 20 21 22 23 21 22 23 24 25 26 27
27 28 29 30 31 24 25 26 27 28 29 30 28 29 30
31
October November DecemberS M T W T F S S M T W T F S S M T W T F S
1 2 3 4 1 1 2 3 4 5 6
5 6 7 8 9 10 11 2 3 4 5 6 7 8 7 8 9 10 11 12 13
12 13 14 15 16 17 18 9 10 11 12 13 14 15 14 15 16 17 18 19 20
19 20 21 22 23 24 25 16 17 18 19 20 21 22 21 22 23 24 25 26 27
26 27 28 29 30 31 23 24 25 26 27 28 29 28 29 30 31
30
15 6 Day Sampling Schedule 18 3 Day Sampling Schedule

32
b. To measure concentrations in areas where poor air quality is combined with high population exposure.
c. To provide data useable for the determination of national trends. d. To provide data necessary to allow the development of nationwide control strategies. 3. Photochemical Assessment Monitoring Station (PAMS) Network - The PAMS network is
required in serious, severe, and extreme ozone non-attainment areas to obtain detailed data for ozone, precursors (NOx and VOC), and meteorology. VOC and NOx sampling is required for the period June - August each year. Ozone sampling occurs during the ozone season, April - October. Network design is based on four monitoring types. In Illinois PAMS are required in the Chicago metropolitan area only.
a. Type 1 sites are located upwind of the non-attainment area and are located to measure
background levels of ozone and precursors coming into the area b. Type 2 sites are located slightly downwind of the major source areas of ozone
precursors. c. Type 3 sites are located at the area of maximum ozone concentrations. d. Type 4 sites are located at the domain edge of the non-attainment area and measure
ozone and precursors leaving the area. 4. Special Purpose Monitoring Station (SPMS) Network - Any monitoring site that is not a
designated SLAMS or NAMS is considered a special purpose monitoring station. Some of the SPMS network objectives are as follows:
a. To provide data as a supplement to stations used in developing local control strategies, including enforcement actions. b. To verify the maintenance of ambient standards in areas not covered by the
SLAMS/NAMS network. c. To provide data on noncriteria pollutants.

33
Table A3
DISTRIBUTION OF AIR MONITORING INSTRUMENTS PAMS NAMS SLAMS SPMS TOTAL
Particulate Matter (PM2.5) 0 0 35 10 45 PM2.5 Speciation 0 0 5 2 7 Particulate Matter (PM10) 0 8 7 1 16
Total Suspended Particulates (TSP) 0 0 0 12 12 Lead 0 2 11 0 13 Sulfur Dioxide 0 10 8 3 21 Nitrogen Dioxide 3 2 3 0 8 Ozone 4 9 25 1 39 Carbon Monoxide 0 2 6 0 8 Volatile Organic Compounds/Toxics 2 0 0 2 4 Wind Systems 4 0 0 18 22 Solar Radiation 4 0 0 5 9
Meteorological 4 0 0 0 4
Total 21 33 100 54 208
There were a several changes to the monitoring network from 2002 to 2003. Sites were discontinued in Calumet City (CO, NO/NO2, O3, SO2), Libertyville (O3) and Sauget (SO2). PM10 was discontinued at Hoffman Estates and SO2 was discontinued at Alton. Also PAMS O3 and VOC was temporarily discontinued at Zion.
New PM2.5 continuous monitors were installed at Alsip, Chicago-Springfield, Chicago-Washington, Hoffman Estates, Maywood and Naperville. PM2.5 speciation monitors were installed at Decatur and Northbrook. A map depicting the locations of the Statewide air monitoring network sites follows the AQCR map.
34

35

36
Table A4
2003 SITE DIRECTORY
CITY NAME OWNER/
AIRS CODE ADDRESS OPERATOR UTM COORD. (km) EQUIPMENT
65 BURLINGTON - KEOKUK INTERSTATE (IA - IL)
PEORIA COUNTY
Peoria Fire Station #8 Ill. EPA N. 4507.113 NAMS - SO2, O3
(1430024) MacArthur & Hurlburt E. 279.709 SPMS - WS/WD
Peoria Commercial Building Ill. EPA N. 4508.534 SLAMS - CO
(1430036) 1005 N. University E. 279.194
Peoria City Office Building Ill. EPA N. 4508.197 NAMS - PM10
(1430037) 613 N.E. Jefferson E. 281.675 SLAMS - Pb, PM2.5
SPMS - TSP
Peoria Heights Peoria Heights H.S. Ill. EPA N. 4513.476 NAMS - O3
(1431001) 508 E. Glen Ave. E. 281.660
TAZEWELL COUNTY
Pekin Fire Station #3 Ill. EPA N. 4492.693 NAMS - SO2
(1790004) 272 Derby E. 275.291
66 EAST CENTRAL ILLINOIS INTRASTATE
CHAMPAIGN COUNTY
Bondville SWS Climate Station Ill. EPA/SWS N. 4434.201 SLAMS - PM2.5
(0191001) Twp. Rd. 500 E. E. 382.959
Champaign Booker T. Washington Elem. Sch. Ill. EPA N. 4442.017 SLAMS - O3, PM2.5
(0190004) 606 E. Grove E. 395.248
McLEAN COUNTY
Normal University H.S. Ill. EPA N. 4486.625 SLAMS - PM2.5
(1132003) Main & Gregory E. 330.925
Normal ISU Physical Plant Ill. EPA N. 4486.886 SLAMS – O3
(1132003) Main & Gregory E. 330.771
67 METROPOLITAN CHICAGO INTERSTATE (IL - IN)
COOK COUNTY
Alsip Village Garage Cook County DEC N. 4613.287 SLAMS - O3, Pb, PM10
(0310001) 4500 W. 123rd St. E. 439.015 SPMS - TSP,WS/WD,PM2.5n
Bedford Park APC Laboratory Cook County DEC N. 4624.760 SLAMS - SO2
(0311018) 7800 W. 65th St. E. 432.241 SPMS - WS/WD
Blue Island Eisenhower H.S. Cook County DEC N. 4612.286 NAMS - PM10
(0312001) 12700 Sacramento E. 442.003 SLAMS - SO2d, PM2.5

37
Table A4
2003 SITE DIRECTORY
CITY NAME OWNER/
AIRS CODE ADDRESS OPERATOR UTM COORD. (km) EQUIPMENT
COOK COUNTY
Chicago Carver H.S. Cook County DEC N. 4611.594 NAMS - PM10
(0310060) 13100 S. Doty E. 450.911
Chicago Cermak Pump Sta. Cook County DEC N. 4635.707 SLAMS - Pb
(0310026) 735 W. Harrison E. 446.469 SPMS - TSP
Chicago CTA Building Ill. EPA N. 4636.096 NAMS - CO, NO/NO2, SO2
(0310063) 320 S. Franklin E. 447.365
Chicago Com Ed Maintenance Bldg. Cook County DEC N. 4622.217 SLAMS - PM2.5/SPEC
(0310076) 7801 Lawndale E. 440.658 NO/NO2
SPMS – WS/WD, PM2.5
Chicago Farr Dormitory Cook County DEC N. 4631.367 SLAMS - PM2.5
(0310014) 3300 S. Michigan Ave. E. 448.202
Chicago Jardine Water Plant Ill. EPA N. 4638.169 PAMS - NO/NO2, O3, VOC
(0310072) 1000 E. Ohio E. 449.597 WS/WD, SOL, MET,
UV, RAIN
Chicago Mayfair Pump Sta. Cook County DEC N. 4645.961 NAMS - Pb
(0310052) 4850 Wilson Ave. E. 437.866 SLAMS - PM2.5
SPMS - TSP
Chicago Sears Tower Ill. EPA N. 4636.320 SPMS - O3
(0310042) Wacker @ Adams E. 447.265
Chicago Southeast Police Sta. Cook County DEC N. 4617.220 NAMS - SO2
(0310050) 103rd & Luella E. 452.700 SLAMS - O3d, PM2.5
Chicago South Water Filtration Plant Cook County DEC N. 4622.596 SLAMS - O3
(0310032) 3300 E. Cheltenham Pl. E. 454.663
Chicago Springfield Pump Sta. Cook County DEC N. 4640.189 SLAMS - PM2.5/SPEC
(0310057) 1745 N. Springfield. Ave. E. 440.009 SPMS - PM2.5n
Chicago Taft H.S. Cook County DEC N. 4648.125 SLAMS - O3
(0311003) 6545 W. Hurlbut St. E. 434.392
Chicago University of Chicago Cook County DEC N. 4626.508 SLAMS - O3
(0310064) 5720 S. Ellis Ave. E. 450.010 SPMS - SOL
Chicago Washington H.S. Cook County DEC N. 4615.038 SLAMS - Pb, PM2.5, PM10
(0310022) 3535 E. 114th St. E. 455.155 SPMS - TSP, PM2.5n
Cicero Liberty School Cook County DEC N. 4634.780 SLAMS - PM2.5
(0316005) 13th St. & 50th Ave. E. 437.846

38
Table A4
2003 SITE DIRECTORY
CITY NAME OWNER/
AIRS CODE ADDRESS OPERATOR UTM COORD. (km) EQUIPMENT
COOK COUNTY
Cicero Trailer Cook County DEC N. 4633.763 NAMS - SO2, NO/NO2
(0314002) 1820 S. 51st Ave. E. 437.541 SLAMS - O3, CO
Des Plaines Regional Office Building Ill EPA N. 4656.615 SLAMS - O3, PM2.5
(0314007) 9511 W. Harrison St. E. 428.577 SPMS - PM2.5
Evanston Water Pumping Sta. Ill. EPA N. 4656.649 NAMS - O3
(0317002) 531 E. Lincoln E. 444.221 SPMS - WS/WD
Hoffman Estates Hoffman Estates H.S. Cook County DEC N. 4656.069 SPMS - PM2.5n
(0314101) 1100 W. Higgins Rd. E. 408.304
Lemont Trailer Cook County DEC N. 4613.184 SLAMS - SO2, O3
(0311601) 729 Houston E. 417.532
Lyons Township Village Hall Ill. EPA N. 4627.820 SLAMS - PM10, PM2.5
(0311016) 50th St. & Glencoe E. 430.886
Maywood 4th District Court Bldg Cook County DEC N. 4635.705 NAMS - Pb
(0316003) 1500 Maybrook Dr. E. 431.435
Maywood Com Ed Maintenance Cook County DEC N. 4635.695 NAMS - CO
(0316004) 1505 S. First Ave. E. 431.200
Maywood (NEW) 4th District Court Bldg Cook County DEC N. 4635.994 SPMS - PM10, PM2.5
(0316006) 1500 Maybrook Dr. E. 431.466
Midlothian Bremen High Sch. Cook County DEC N. 4607.103 SLAMS - PM10 (0311901) 15205 Crawford Ave. E. 440.416
Northbrook Northbrook Water Plant Ill. EPA N. 4665.414 PAMS - O3, NO/NO2, VOC
(0314201) 750 Dundee Rd. E. 433.955 WS/WD, SOL, MET
SLAMS - PM2.5/SPECn
SPMS - Hg, TOX
Schiller Park IEPA Trailer Ill. EPA N. 4646.084 SLAMS - CO, NO/NO2, Pb
(0313103) 4743 Mannheim Rd. E. 427.387 SPMS - TSP, TOX, WS/WD
Summit Graves Elem. Sch. Cook County DEC N. 4625.756 SLAMS - PM10, Pb, PM2.5
(0313301) 60th St. & 74th Ave. E. 433.074 SPMS - TSP
DUPAGE COUNTY
Lisle Morton Arboretum Ill. EPA N. 4629.361 SLAMS - O3
(0436001) Route 53 E. 410.891 SPMS - WS/WD
Naperville City Hall Ill. EPA N. 4624.786 SLAMS - PM2.5
(0434002) 400 S. Eagle St. E. 404.208 SPMS - PM2.5n

39
Table A4
2003 SITE DIRECTORY
CITY NAME OWNER/
AIRS CODE ADDRESS OPERATOR UTM COORD. (km) EQUIPMENT
KANE COUNTY
Elgin Larsen Junior H.S. Ill. EPA N. 4655.844 NAMS - O3
(0890005) 665 Dundee Rd. E. 394.654
Elgin McKinley School Ill. EPA N. 4655.941 SLAMS - PM2.5
(0890003) 258 Lovell St. E. 394.048
LAKE COUNTY
Waukegan North Fire Station Ill. EPA N. 4693.854 NAMS - O3
(0971002) Golf & Jackson Sts. E. 430.744
Zion Camp Logan Ill. EPA N. 4701.795 PAMS - O3, NO/NO2, VOC
(0971007) Illinois Beach State Park E. 433.407 WS/WD, SOL, MET
SLAMS - PM2.5
Mc HENRY COUNTY
Cary Cary Grove H.S. Ill. EPA N. 4674.900 NAMS - O3
(1110001) 1st St. & Three Oaks Rd. E. 397.486 SLAMS - PM2.5
WILL COUNTY
Braidwood Com Ed Training Center Ill. EPA N. 4563.825 PAMS - O3, NO/NO2,
(1971011) 36400 S. Essex Road E. 400.172 WS/WD, SOL, MET
SLAMS - PM2.5
Joliet Pershing Elem. Sch. IIl. EPA N. 4597.636 NAMS - PM10
(1971002) Midland & Campbell Sts. E. 406.854 SLAMS - PM2.5
Joliet Water Plant West Ill. EPA N. 4590.279 NAMS - SO2
(1970013) Rte. 6 & Young Rd. E. 401.284
South Lockport Fitness Forum Ill. EPA N. 4602.982 SLAMS - O3
(1971008) 2021 Lawrence E. 412.039
69 METROPOLITAN QUAD CITIES INTERSTATE (IA - IL)
ROCK ISLAND COUNTY
Rock Island Rock Island Arsenal Ill. EPA N. 4598.661 NAMS - O3
(1613002) 32 Rodman Ave. E. 707.185 SLAMS - PM2.5
SPMS - WS/WD, SOL

40
Table A4
2003 SITE DIRECTORY
CITY NAME OWNER/
AIRS CODE ADDRESS OPERATOR UTM COORD. (km) EQUIPMENT
70 METROPOLITAN ST. LOUIS INTERSTATE (IL - MO)
MADISON COUNTY
Alton Clara Barton Elem. Sch. Ill. EPA N. 4308.245 SLAMS - O3
(1190008) 409 Main St. E. 747.375
Alton SIU Dental Clinic Ill. EPA N. 4309.690 SLAMS - PM2.5/SPEC
(1192009) 1700 Annex. St. E. 747.752
Edwardsville RAPS Trailer Ill. EPA N. 4297.793 SLAMS - O3
(1192007) Poag Road E. 757.118 SPMS - WS/WD, SOL
Granite City Fire Station #1 Ill. EPA N. 4287.661 SLAMS - PM2.5
(1191007) 23rd & Madison E. 748.745
Granite City Air Products Ill. EPA N. 4286.516 NAMS - PM10
(1190010) 15th & Madison E. 747.561 SLAMS - Pb
SPMS - TSP
Granite City VFW Building Ill.EPA N. 4287.099 NAMS - PM10
(1190023) 2040 Washington E. 748.427 SLAMS - PM2.5
Maryville Southwest Cable TV Ill. EPA N. 4290.382 SLAMS - O3
(1191009) 200 W. Division E. 242.680
South Roxana S. Roxana Grade Sch. Ill. EPA N. 4301.623 SLAMS - SO2
(1191010) Michigan St. E. 755.369
Wood River Water Treatment Plant Ill. EPA N. 4305.084 NAMS - SO2, O3, PM10
(1193007) 54 N. Walcott E. 751.138 SLAMS - Pb, PM2.5
SPMS – TSP
Wood River VIM Test Station Ill. EPA N. 4305.786 SLAMS - SO2
(1193009) 1710 Vaughn Road E. 754.204
RANDOLPH COUNTY
Houston Baldwin Site #2 Ill. EPA N. 4228.843 SLAMS - SO2, O3, PM2.5
(1570001) County Rds. 25.0 N. & 23.5 E. E. 255.741
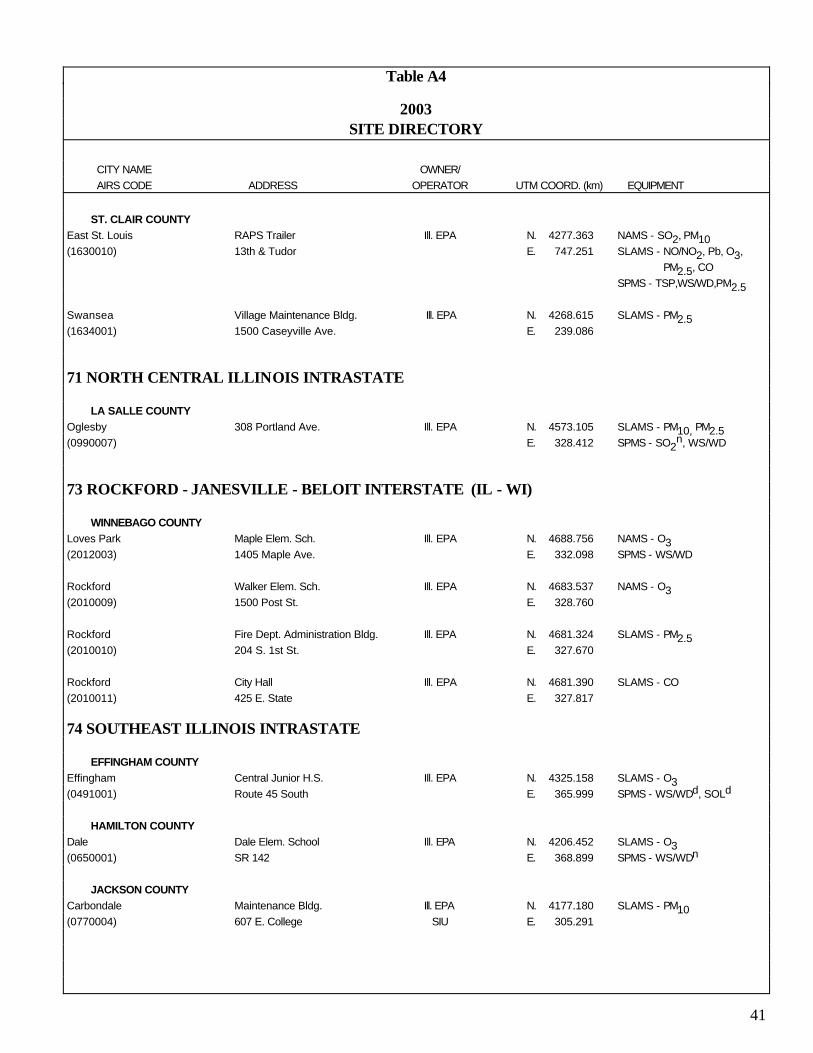
41
Table A4
2003 SITE DIRECTORY
CITY NAME OWNER/
AIRS CODE ADDRESS OPERATOR UTM COORD. (km) EQUIPMENT
ST. CLAIR COUNTY
East St. Louis RAPS Trailer Ill. EPA N. 4277.363 NAMS - SO2, PM10
(1630010) 13th & Tudor E. 747.251 SLAMS - NO/NO2, Pb, O3,
PM2.5, CO
SPMS - TSP,WS/WD,PM2.5
Swansea Village Maintenance Bldg. Ill. EPA N. 4268.615 SLAMS - PM2.5 (1634001) 1500 Caseyville Ave. E. 239.086
71 NORTH CENTRAL ILLINOIS INTRASTATE
LA SALLE COUNTY
Oglesby 308 Portland Ave. Ill. EPA N. 4573.105 SLAMS - PM10, PM2.5
(0990007) E. 328.412 SPMS - SO2n, WS/WD
73 ROCKFORD - JANESVILLE - BELOIT INTERSTATE (IL - WI)
WINNEBAGO COUNTY
Loves Park Maple Elem. Sch. Ill. EPA N. 4688.756 NAMS - O3
(2012003) 1405 Maple Ave. E. 332.098 SPMS - WS/WD
Rockford Walker Elem. Sch. Ill. EPA N. 4683.537 NAMS - O3
(2010009) 1500 Post St. E. 328.760
Rockford Fire Dept. Administration Bldg. Ill. EPA N. 4681.324 SLAMS - PM2.5
(2010010) 204 S. 1st St. E. 327.670
Rockford City Hall Ill. EPA N. 4681.390 SLAMS - CO
(2010011) 425 E. State E. 327.817
74 SOUTHEAST ILLINOIS INTRASTATE
EFFINGHAM COUNTY
Effingham Central Junior H.S. Ill. EPA N. 4325.158 SLAMS - O3
(0491001) Route 45 South E. 365.999 SPMS - WS/WDd, SOLd
HAMILTON COUNTY
Dale Dale Elem. School Ill. EPA N. 4206.452 SLAMS - O3 (0650001) SR 142 E. 368.899 SPMS - WS/WDn
JACKSON COUNTY
Carbondale Maintenance Bldg. Ill. EPA N. 4177.180 SLAMS - PM10
(0770004) 607 E. College SIU E. 305.291

42
Table A4
2003 SITE DIRECTORY
CITY NAME OWNER/
AIRS CODE ADDRESS OPERATOR UTM COORD. (km) EQUIPMENT
WABASH COUNTY
Mount Carmel Division St. Public Service N. 4249.965 SPMS - SO2
(1850001) of Indiana E. 432.444
Rural Wabash County South of SR-1 Public Service N. 4246.929 SPMS - SO2
(1851001) of Indiana E. 427.104
75 WEST CENTRAL ILLINOIS INTRASTATE
ADAMS COUNTY
Quincy St. Boniface Elem. Sch. Ill. EPA N. 4421.320 SLAMS - PM2.5, SO2, O3
(0010006) 732 Hampshire E. 636.351 SPMS - WS/WD
JERSEY COUNTY
Jerseyville Illini Jr. H.S. Ill. EPA N. 4332.242 SLAMS - O3
(0831001) Liberty St. & County Rd. E. 731.369
MACON COUNTY
Decatur IEPA Trailer Ill. EPA N. 4414.538 NAMS - SO2
(1150013) 2200 N. 22nd E. 335.308 SLAMS - O3, PM2.5/SPEC
SPMS - WS/WD, PM2.5
MACOUPIN COUNTY
Nilwood IEPA Trailer Ill. EPA N. 4364.287 SLAMS - O3, SO2, Pb,PM10
(1170002) Heaton & Dubois E. 258.053 SPMS - TSP, WS/WD, SOL CO2, UV
SANGAMON COUNTY
Springfield Sewage Treatment Plant Ill. EPA N. 4408.650 NAMS - SO2
(1670006) 3300 Mechanicsburg Rd. E. 278.194 SPMS - WS/WD
Springfield Federal Building Ill. EPA N. 4408.623 SLAMS - CO
(1670008) 6th St. & Monroe E. 273.327
Springfield Public Health Warehouse Ill. EPA N. 4413.490 SLAMS - O3
(1670010) 2875 N. Dirksen Pkwy. E. 277.134
Springfield Agriculture Building Ill. EPA N. 4412.240 SLAMS - PM2.5
(1670012) State Fair Grounds E. 273.720

43
Table A4
2003 SITE DIRECTORY
CITY NAME OWNER/
AIRS CODE ADDRESS OPERATOR UTM COORD. (km) EQUIPMENT
Summary of Equipment Codes for the Site Directory TSP - Total Suspended Particulates PM10 - Particulate Matter (10 microns or smaller) PM2.5 Particulate Matter (2.5 microns or smaller) SPEC - PM2.5 Speciation SO2 - Sulfur Dioxide NO - Nitric Oxide NO2 - Nitrogen Dioxide CO - Carbon Monoxide CO2 - Carbon Dioxide O3 - Ozone Pb - Lead VOC - Volatile Organic Compounds TOX - Toxic Compounds Hg - Mercury WS/WD - Wind Speed and Wind Direction SOL - Total Solar Radiation MET - Temperature, Relative Humidity, Barometric Pressure UV - Ultra-violet Radiation RAIN - Rainfall (n) - Instrument installed during 2003 (d) - Instrument removed during 2003 NEW - Site started during 2003 DISC - Site discontinued during or at the end of 2003
SLAMS Designations NAMS - National Air Monitoring Site PAMS - Photochemical Assessment Monitoring Site SLAMS - State and Local Air Monitoring Site SPMS - Special Purpose Air Monitoring Site
UTM Coordinates N. - Northing Coordinate (in kilometers) E. - Easting Coordinate (in kilometers)
45
APPENDIX B AIR QUALITY DATA SUMMARY TABLES
AIR QUALITY DATA INTERPRETATION
In order to provide a uniform procedure for determining whether a sufficient amount of air quality data has been collected by a sensor in a given time period (year, quarter, month, day, etc.) to accurately represent air quality during that time period, a minimum statistical selection criteria was developed. In order to calculate an annual average for noncontinuous parameters, a minimum of 75% of the data that was scheduled to be collected must be available, i.e., 45 samples per year for an every-six-day schedule (total possible of 60 samples). Additionally, in order to have proper quarterly balance, each site on an every sixth day schedule should have at least 10 samples per calendar quarter. This provides for a 20% balance in each quarter if the minimum required annual sampling is achieved. For lead results which must be compared to a quarterly standard, 75% of the possible samples in each quarter must be obtained. Thus for a valid lead quarterly average, a total of 12 values must be available. PM10 and PM2.5 samplers operate on one of three sampling frequencies:
• Every-day sampling (68 samples required each quarter for 75% data capture)
• Every-third-day sampling (23 samples required each quarter for 75% data capture)
• Every-six-day sampling (12 samples required each quarter for 75% data capture).
To calculate an annual PM10 or PM2.5 mean, arithmetic means are calculated for each quarter in which valid data is recorded in at least 75% of the possible sampling periods. The annual mean is then the arithmetic average of the four quarterly means.
To determine an annual average for continuous data 75% of the total possible yearly observations are necessary, i.e., a minimum of 6570 hours (75% of the hours available) were needed in 2003. In order to provide a balance between the respective quarters, each quarter should have at least 1300 hours which is 20% of the 75% minimum annual requirement. To calculate quarterly averages at sites which do not meet the annual criteria, 75% of the total possible observations in a quarter are needed, i.e., a minimum of 1647 hours of 2200 hours available. Monthly averages also require 75% of the total possible observations in a month, i.e., 540 hours as a minimum. Additionally, for short-term running averages (24 hour, 8 hour, 3 hour) 75% of the data during the particular time period is needed, i.e, 18 hours for a 24-hour average, 6 hours for an 8-hour average and 3 hours for a 3-hour average. For ozone, a valid day for 1-hour samples must have 75% of the hours between 9 a.m. and 9 p.m. otherwise it is considered missing. A missing day can be considered valid if the peak ozone concentration on the preceding and succeeding days is less than 0.090 ppm. The expected exceedences are actual exceedences adjusted for the percent of missing days. For 8-hour samples, forward running averages are computed for each hour which includes the next seven hours as well. A valid 8-hour average has at least 6 valid 1-hour averages within the 8-hour period. A valid 8-hour day contains at least 75% (18) of the possible 8-hour running averages. Complete sampling over a three year period requires an average of 90% valid days with each year having at least 75% valid days. Data listed as not meeting the minimum statistical selection criteria in this report were so noted after evaluation using the criteria above. Although short term averages (3, 8, 24 hours) have been computed for certain sites not meeting the annual

46
criteria, these averages may not be representative of an entire year's air quality. In certain circumstances where even the 75% criteria is met, the number and/or magnitude of short term averages may not be directly comparable from one year to the next because of seasonal distributional differences. For summary purposes, the data is expressed in the number of figures to which the raw data is validated. Extra figures may be carried in the averaging technique, but the result is rounded to the appropriate number of figures. For example, the values 9, 9, 10 are averaged to give 9; whereas the values 9.0, 9.0, 10.0 are averaged to 9.3. The raw data itself should not be expressed to more significant figures than the sensitivity of the monitoring methodology allows. In comparing data to the various air quality standards, the data are implicitly rounded to the number of significant figures specified by that standard. For example, to exceed the 0.12 ppm hourly ozone standard, an hourly value must be 0.125 ppm or higher, to exceed the 9 ppm CO 8-hour standard, an 8-hour average must be 9.5 ppm or higher. Peak averages, though, will be expressed to the number of significant figures appropriate to that monitoring methodology.
National Ambient Air Quality Standards (NAAQS) for sulfur dioxide (SO2) and carbon monoxide (CO) have short-term standards for ambient air concentrations (24 hours or less) not to be exceeded more than once per year. Particulate Matter (PM10) has a 24-hour standard which cannot average more than 1 over a three year period (total of 3 in three years). Particulate Matter (PM2.5) has a 24-hour standard which is a 3-year average of each year's 98th percentile values. In the case of ozone, the expected number of exceedances (one hour per day greater than 0.12 ppm) may not average more than one per year in any period of three consecutive years. The 8-hour ozone standard is concentration based and as such is the average of the fourth highest value each year over a three year period. The standards are promulgated in this manner in order to protect the public from excessive levels of pollution both in terms of acute and chronic health effects. The following data tables detail and summarize air quality in Illinois in 2003. The tables of short term exceedences list those sites which exceeded any of the short term primary standards (24 hours or less). The detailed data tables list averages and peak concentrations for all monitoring sites in Illinois.

47
Table B1
2003 OZONE IN EXCESS OF THE PRIMARY STANDARD OF
ONE HOUR PER DAY GREATER THAN 0.12 PARTS PER MILLION MAXIMUM
STATION ADDRESS DATE VALUE (PPM)
70 METROPOLITAN ST. LOUIS INTERSTATE (IL - MO)
MADISON COUNTY
Edwardsville Poag Road August 26 0.128
ST. CLAIR COUNTY
East St. Louis 13th & Tudor July 17 0.125
August 26 0.134
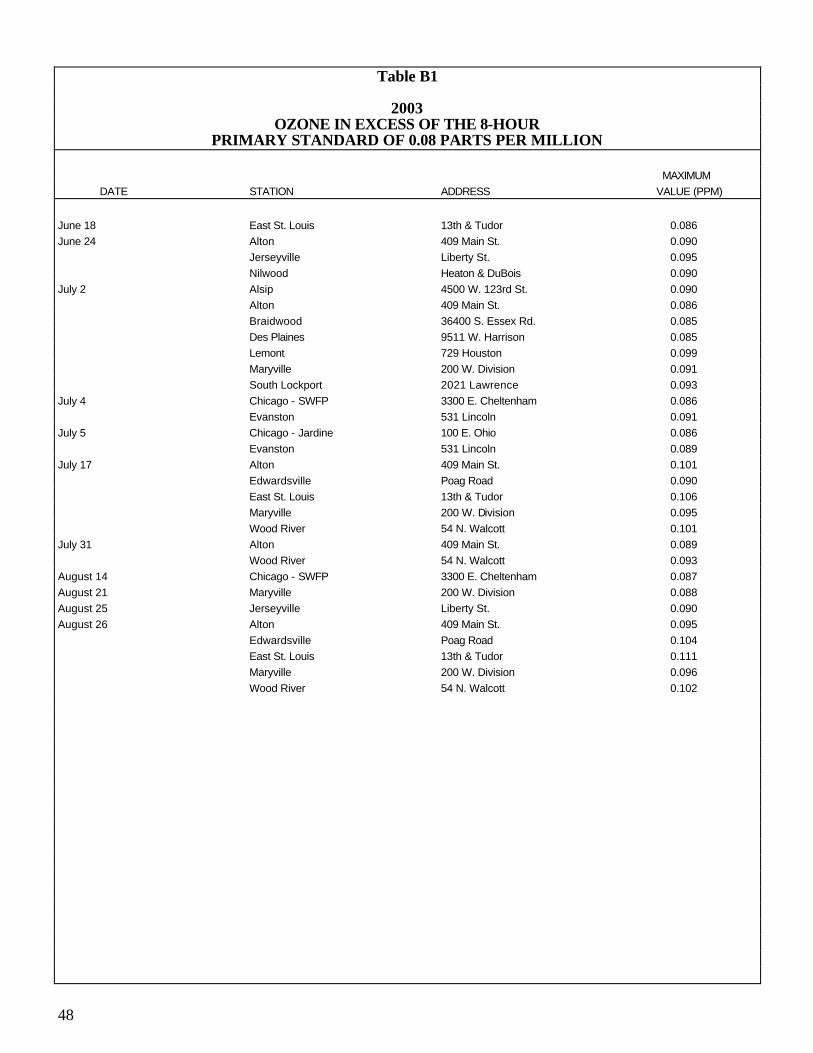
48
Table B1
2003 OZONE IN EXCESS OF THE 8-HOUR
PRIMARY STANDARD OF 0.08 PARTS PER MILLION MAXIMUM
DATE STATION ADDRESS VALUE (PPM)
June 18 East St. Louis 13th & Tudor 0.086
June 24 Alton 409 Main St. 0.090
Jerseyville Liberty St. 0.095
Nilwood Heaton & DuBois 0.090
July 2 Alsip 4500 W. 123rd St. 0.090
Alton 409 Main St. 0.086
Braidwood 36400 S. Essex Rd. 0.085
Des Plaines 9511 W. Harrison 0.085
Lemont 729 Houston 0.099
Maryville 200 W. Division 0.091
South Lockport 2021 Lawrence 0.093
July 4 Chicago - SWFP 3300 E. Cheltenham 0.086
Evanston 531 Lincoln 0.091
July 5 Chicago - Jardine 100 E. Ohio 0.086
Evanston 531 Lincoln 0.089
July 17 Alton 409 Main St. 0.101
Edwardsville Poag Road 0.090
East St. Louis 13th & Tudor 0.106
Maryville 200 W. Division 0.095
Wood River 54 N. Walcott 0.101
July 31 Alton 409 Main St. 0.089
Wood River 54 N. Walcott 0.093
August 14 Chicago - SWFP 3300 E. Cheltenham 0.087
August 21 Maryville 200 W. Division 0.088
August 25 Jerseyville Liberty St. 0.090
August 26 Alton 409 Main St. 0.095
Edwardsville Poag Road 0.104
East St. Louis 13th & Tudor 0.111
Maryville 200 W. Division 0.096
Wood River 54 N. Walcott 0.102
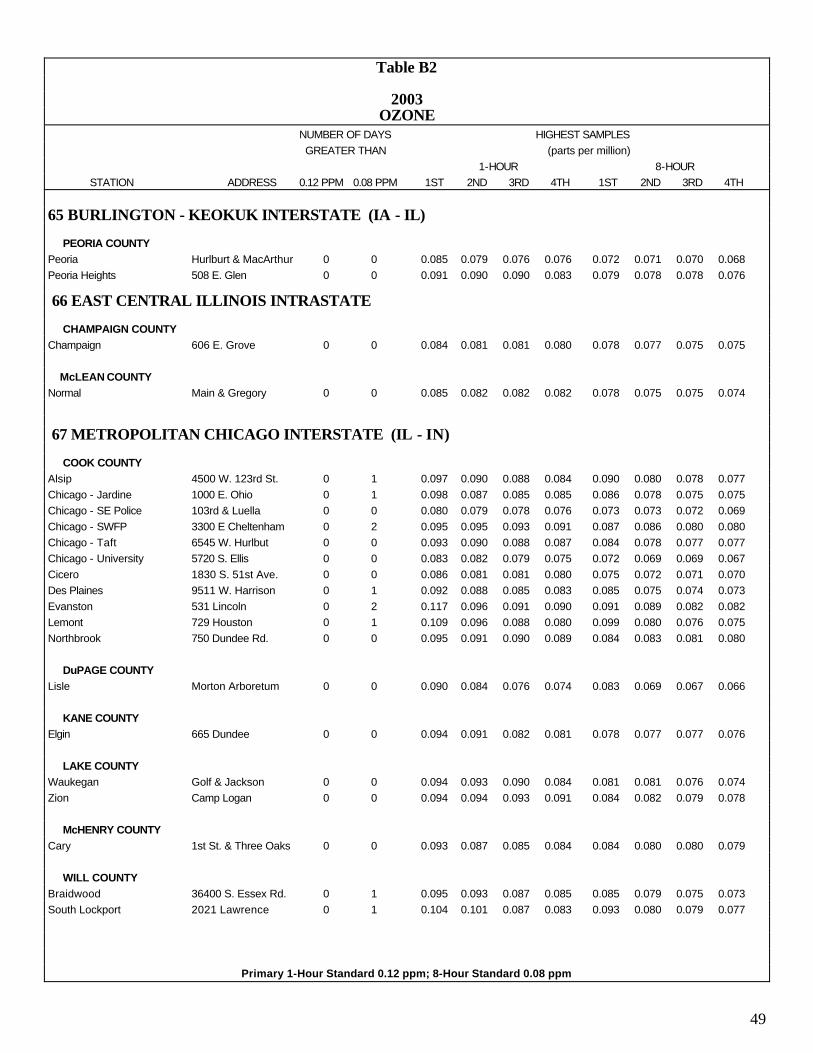
49
Table B2
2003 OZONE
NUMBER OF DAYS HIGHEST SAMPLES
GREATER THAN (parts per million)
1-HOUR 8-HOUR
STATION ADDRESS 0.12 PPM 0.08 PPM 1ST 2ND 3RD 4TH 1ST 2ND 3RD 4TH
65 BURLINGTON - KEOKUK INTERSTATE (IA - IL)
PEORIA COUNTY
Peoria Hurlburt & MacArthur 0 0 0.085 0.079 0.076 0.076 0.072 0.071 0.070 0.068
Peoria Heights 508 E. Glen 0 0 0.091 0.090 0.090 0.083 0.079 0.078 0.078 0.076
66 EAST CENTRAL ILLINOIS INTRASTATE CHAMPAIGN COUNTY
Champaign 606 E. Grove 0 0 0.084 0.081 0.081 0.080 0.078 0.077 0.075 0.075
McLEAN COUNTY
Normal Main & Gregory 0 0 0.085 0.082 0.082 0.082 0.078 0.075 0.075 0.074
67 METROPOLITAN CHICAGO INTERSTATE (IL - IN) COOK COUNTY
Alsip 4500 W. 123rd St. 0 1 0.097 0.090 0.088 0.084 0.090 0.080 0.078 0.077
Chicago - Jardine 1000 E. Ohio 0 1 0.098 0.087 0.085 0.085 0.086 0.078 0.075 0.075
Chicago - SE Police 103rd & Luella 0 0 0.080 0.079 0.078 0.076 0.073 0.073 0.072 0.069
Chicago - SWFP 3300 E Cheltenham 0 2 0.095 0.095 0.093 0.091 0.087 0.086 0.080 0.080
Chicago - Taft 6545 W. Hurlbut 0 0 0.093 0.090 0.088 0.087 0.084 0.078 0.077 0.077
Chicago - University 5720 S. Ellis 0 0 0.083 0.082 0.079 0.075 0.072 0.069 0.069 0.067
Cicero 1830 S. 51st Ave. 0 0 0.086 0.081 0.081 0.080 0.075 0.072 0.071 0.070
Des Plaines 9511 W. Harrison 0 1 0.092 0.088 0.085 0.083 0.085 0.075 0.074 0.073
Evanston 531 Lincoln 0 2 0.117 0.096 0.091 0.090 0.091 0.089 0.082 0.082
Lemont 729 Houston 0 1 0.109 0.096 0.088 0.080 0.099 0.080 0.076 0.075
Northbrook 750 Dundee Rd. 0 0 0.095 0.091 0.090 0.089 0.084 0.083 0.081 0.080
DuPAGE COUNTY
Lisle Morton Arboretum 0 0 0.090 0.084 0.076 0.074 0.083 0.069 0.067 0.066
KANE COUNTY
Elgin 665 Dundee 0 0 0.094 0.091 0.082 0.081 0.078 0.077 0.077 0.076
LAKE COUNTY
Waukegan Golf & Jackson 0 0 0.094 0.093 0.090 0.084 0.081 0.081 0.076 0.074
Zion Camp Logan 0 0 0.094 0.094 0.093 0.091 0.084 0.082 0.079 0.078
McHENRY COUNTY
Cary 1st St. & Three Oaks 0 0 0.093 0.087 0.085 0.084 0.084 0.080 0.080 0.079
WILL COUNTY
Braidwood 36400 S. Essex Rd. 0 1 0.095 0.093 0.087 0.085 0.085 0.079 0.075 0.073
South Lockport 2021 Lawrence 0 1 0.104 0.101 0.087 0.083 0.093 0.080 0.079 0.077
Primary 1-Hour Standard 0.12 ppm; 8-Hour Standard 0.08 ppm

50
Table B2
2003 OZONE
NUMBER OF DAYS HIGHEST SAMPLES
GREATER THAN (parts per million)
1-HOUR 8-HOUR
STATION ADDRESS 0.12 PPM 0.08 PPM 1ST 2ND 3RD 4TH 1ST 2ND 3RD 4TH
69 METROPOLITAN QUAD CITIES INTERSTATE (IA - IL) ROCK ISLAND COUNTY
Rock Island 32 Rodman Ave. 0 0 0.092 0.080 0.079 0.079 0.084 0.074 0.071 0.068 70 METROPOLITAN ST. LOUIS INTERSTATE (IL - MO) MADISON COUNTY
Alton 409 Main St. 0 5 0.117 0.107 0.102 0.098 0.101 0.095 0.090 0.089
Edwardsville Poag Road 1 2 0.128 0.112 0.104 0.094 0.104 0.090 0.082 0.082
Maryville 200 W. Division 0 4 0.122 0.115 0.109 0.098 0.096 0.095 0.091 0.088
Wood River 54 N. Walcott 0 3 0.118 0.115 0.102 0.091 0.102 0.101 0.093 0.083
RANDOLPH COUNTY
Houston Twp Rds. 150 & 45 0 0 0.093 0.092 0.091 0.089 0.081 0.078 0.077 0.077
ST. CLAIR COUNTY
East St. Louis 13th & Tudor 2 3 0.134 0.125 0.100 0.097 0.111 0.106 0.086 0.079 73 ROCKFORD - JANESVILLE - BELOIT INTERSTATE (IL - WI) WINNEBAGO COUNTY
Loves Park 1405 Maple 0 0 0.086 0.080 0.080 0.078 0.077 0.075 0.074 0.071
Rockford 1500 Post 0 0 0.087 0.086 0.085 0.082 0.081 0.079 0.078 0.076 74 SOUTHEAST ILLINOIS INTRASTATE EFFINGHAM COUNTY
Effingham Route 45 South 0 0 0.086 0.075 0.074 0.074 0.083 0.071 0.070 0.069
HAMILTON COUNTY
Dale Route 142 0 0 0.102 0.089 0.088 0.085 0.080 0.079 0.078 0.077 75 WEST CENTRAL ILLINOIS INTRASTATE ADAMS COUNTY
Quincy 732 Hampshire 0 0 0.090 0.087 0.078 0.077 0.077 0.077 0.071 0.071
JERSEY COUNTY
Jerseyville Liberty St. 0 2 0.110 0.108 0.106 0.095 0.095 0.090 0.084 0.083
MACON COUNTY
Decatur 2200 N. 22nd St. 0 0 0.085 0.084 0.080 0.078 0.079 0.072 0.071 0.071
MACOUPIN COUNTY
Nilwood Heaton & DuBois 0 1 0.097 0.087 0.086 0.086 0.090 0.078 0.077 0.077
SANGAMON COUNTY
Springfield 2875 N. Dirksen 0 0 0.092 0.085 0.085 0.084 0.080 0.077 0.076 0.075
Primary 1-Hour Standard 0.12 ppm; 8-Hour Standard 0.08 ppm

51
Table B3
2003 PARTICULATE MATTER FINE (PM2.5)
(micrograms per cubic meter) ANNUAL
SAMPLING NUMBER OF SAMPLES HIGHEST SAMPLES ARITHMETIC
STATION ADDRESS FREQUENCY TOTAL >65 ug/m3 1st 2nd 3rd 4th MEAN
65 BURLINGTON-KEOKUK INTERSTATE (IA - IL)
PEORIA COUNTY
Peoria 613 N.E. Jefferson 3-day 112 0 37.8 35.5 35.2 31.6 13.7
66 EAST CENTRAL ILLINOIS INTRASTATE CHAMPAIGN COUNTY
Bondville Twp. Rd. 500 E. 6-day 55 0 37.2 35.7 29.7 25.0 +
Champaign 606 E. Grove 6-day 59 0 34.9 32.8 27.8 25.1 13.1
Mc LEAN COUNTY
Normal Main & Gregory 6-day 56 0 41.1 33.8 30.1 28.2 13.2
67 METROPOLITAN CHICAGO INTERSTATE (IL - IN)
COOK COUNTY
Blue Island 12700 Sacramento 3-day 110 0 45.1 43.8 39.6 32.8 14.9
Chicago-Com Ed 7801 Lawndale 3-day 102 0 47.5 43.3 32.6 29.7 14.9
Chicago-Farr 3300 S. Michigan Ave. 3-day 115 0 51.4 39.3 39.0 33.4 15.1
Chicago-Mayfair 4850 Wilson Ave. 1-day 327 0 50.7 46.2 44.4 37.9 15.8
Chicago-SE Police 103rd & Luella 3-day 120 0 47.7 39.8 34.8 34.3 15.3
Chicado-Springfield 1745 N. Springfield Ave. 3-day 105 0 48.6 38.3 36.4 35.3 15.6
Chicago-Washington HS 3535 E. 114th St. 3-day 111 0 49.0 39.8 37.7 31.5 15.6
Cicero 13th St. & 50th Ave. 3-day 89 0 44.5 38.5 37.3 36.4 +
Des Plaines 9511 W. Harrison 3-day 118 0 46.0 39.9 35.8 32.5 13.2
Lyons Township 50th St. & Glencoe Ave. 3-day 109 0 50.1 47.3 45.0 40.2 16.7
Northbrook 750 Dundee Road 3-day 118 0 44.0 35.2 31.9 29.5 12.2
Summit 60th St. & 74th Ave. 3-day 120 0 56.8 40.6 38.4 37.9 15.6
Du PAGE COUNTY
Naperville 400 S. Eagle St. 3-day 117 0 38.5 36.5 34.0 30.1 13.1
KANE COUNTY
Elgin 258 Lovell St. 6-day 59 0 35.0 34.5 32.7 31.8 13.3
LAKE COUNTY
Zion Camp Logan 6-day 59 0 23.4 21.4 21.2 20.8 11.3
Mc HENRY COUNTY
Cary 1st St. & Three Oaks Rd. 3-day 116 0 35.4 35.0 32.7 31.0 12.2
WILL COUNTY
Braidwood 36400 S. Essex Rd. 6-day 61 0 36.2 27.9 25.2 24.7 11.9
Joliet Midland & Campbell 6-day 61 0 45.7 30.8 30.8 30.1 13.8 + - Did not meet minimum statistical selection criteria (See Section B.1)
Primary 24-Hour Standard 65 ug/m3; Primary Annual Standard 15.0 ug/m3

52
Table B3
2003 PARTICULATE MATTER FINE (PM2.5)
(micrograms per cubic meter) ANNUAL
SAMPLING NUMBER OF SAMPLES HIGHEST SAMPLES ARITHMETIC
STATION ADDRESS FREQUENCY TOTAL >65 ug/m3 1st 2nd 3rd 4th MEAN
69 METROPOLITAN QUAD CITIES INTERSTATE (IA - IL)
ROCK ISLAND COUNTY
Rock Island 32 Rodman Ave. 6-day 60 0 30.5 30.1 29.0 28.7 12.8
70 METROPOLITAN ST. LOUIS INTERSTATE (IL - MO)
MADISON COUNTY
Alton 1700 Annex St. 3-day 117 0 51.1 36.1 31.5 28.6 14.1
Granite city 23rd & Madison 3-day 113 0 49.9 41.7 40.8 37.3 17.5
Granite City 2040 Washington 3-day 119 0 48.3 39.1 38.0 37.6 18.1
Wood River 54 N. Walcott 3-day 117 0 33.2 32.7 31.6 31.3 14.0
RANDOLPH COUNTY
Houston Twp Rds. 150 & 45 6-day 56 0 36.3 34.3 34.2 27.1 13.4
ST. CLAIR COUNTY
East St. Louis 13th & Tudor 3-day 110 0 50.9 32.9 32.6 29.1 14.8
Swansea 1500 Caseyville Ave. 3-day 112 0 45.0 36.2 34.2 32.8 +
71 NORTH CENTRAL ILLINOIS INTRASTATE
LASALLE COUNTY
Oglesby 308 Portland Ave. 3-day 114 0 36.5 33.9 30.0 28.8 13.0
73 ROCKFORD - JANESVILLE - BELOIT INTERSTATE (IL - WI)
WINNEBAGO COUNTY
Rockford 204 S. 1st St. 6-day 56 0 35.8 26.6 24.3 22.2 12.2
75 WEST CENTRAL ILLINOIS INTRASTATE
ADAMS COUNTY
Quincy 732 Hampshire 6-day 61 0 34.9 31.6 30.7 25.3 13.4
MACON COUNTY
Decatur 2200 N. 22nd 3-day 107 0 36.3 35.8 34.4 33.1 13.6
SANGAMON COUNTY
Springfield State Fair Grounds 3-day 118 0 36.6 34.6 33.7 31.0 13.0
+ - Did not meet minimum statistical selection criteria (See Section B.1)
Primary 24-Hour Standard 65 ug/m3; Primary Annual Standard 15.0 ug/m3

53
Table B4
2003 SHORT-TERM TRENDS
PARTICULATE MATTER (PM2.5)
ANNUAL ARITHMETIC MEANS (ug/m3) STATION ADDRESS 1998 1999 2000 2001 2002 2003
65 BURLINGTON - KEOKUK INTERSTATE (IA - IL)
PEORIA COUNTY
Peoria 613 N.E. Jefferson - + 14.9 13.9 13.9 13.7
66 EAST CENTRAL ILLINOIS INTRASTATE CHAMPAIGN COUNTY
Bondville Twp. Rd. 500 E. - + 14.5 + 12.2 +
Champaign 606 E. Grove - - 14.8 12.6 12.2 13.1
McLEAN COUNTY
Normal Main & Gregory - - 14.9 14.8 12.9 13.2
67 METROPOLITAN CHICAGO INTERSTATE (IL - IN)
COOK COUNTY
Blue Island 12700 Sacramento - 17.4 16.8 17.1 + 14.9
Chicago-Com Ed 7801 Lawndale - - 16.6 + 15.7 14.9
Chicago-Farr 3300 S. Michigan Ave. - 18.0 + 17.1 15.5 15.1
Chicago-Mayfair 48500 Wilson Ave. - + 18.3 19.4 16.5 15.8
Chicago-SE Police 103rd & Luella - 17.2 + + 15.5 15.3
Chicago-Springfield 1745 N. Springfield Ave. - - 17.3 16.2 15.2 15.6
Chicago - Washington HS 3535 E. 114th St. - 17.4 17.9 17.1 15.3 15.6
Cicero 13th St. & 50th Ave. - - + 17.4 16.0 +
Des Plaines 9511 W. Harrison - - 15.3 14.8 14.4 13.2
Lyons Township 50th St. & Glencoe Ave. - 21.8 20.2 2.08 17.7 16.7
Northbrook 750 Dundee Road - 15.5 14.3 14.7 13.2 12.2
Summit 60th St. & 74th Ave. - 17.5 16.9 16.5 16.1 15.6
Du PAGE COUNTY
Naperville 400 S. Eagle St. - 15.6 15.3 15.5 14.7 13.1
KANE COUNTY
Elgin 258 Lovell St. - - + 15.1 14.3 13.3
LAKE COUNTY
Zion Camp Logan - - 12.2 + 13.5 11.3
Mc HENRY COUNTY
Cary 1st St. & Three Oaks Rd. - - 14.8 13.7 12.3 12.2
WILL COUNTY
Braidwood 36400 S. Essex Rd. - + 14.2 12.9 13.5 11.9
Joliet Midland & Campbell Sts. - 15.5 16.0 16.1 14.4 13.8
- Station not in operation during the year.
+ Did not meet minimum statistical selection criteria (See Appendix B.1).
Primary Annual Standard 15.0 ug/m3

54
Table B4
2003 SHORT-TERM TRENDS
PARTICULATE MATTER (PM2.5)
ANNUAL ARITHMETIC MEANS (ug/m3) STATION ADDRESS 1998 1999 2000 2001 2002 2003
69 METROPOLITAN QUAD CITIES INTERSTATE (IA - IL)
ROCK ISLAND COUNTY
Rock Island 32 Rodman Ave. - - 13.6 12.8 11.8 12.8
70 METROPOLITAN ST. LOUIS INTERSTATE (IL - MO)
MADISON COUNTY
Alton 1700 Annex St. - - 16.0 15.8 14.7 14.1
Granite City 23rd & Madison - + 17.4 17.3 17.7 17.5
Granite City 2040 Washington - 20.6 2.06 19.7 19.6 18.1
Wood River 54 N. Walcott - 15.7 15.9 15.0 15.1 14.0
RANDOLPH COUNTY
Houston Twp Rds. 150 & 45 - 14.5 15.2 12.1 11.6 13.4
ST. CLAIR COUNTY
East St. Louis 13th St. & Tudor Ave. - 17.9 17.4 17.0 16.7 14.8
Swansea 1500 Caseyville Ave. - - 15.0 15.5 15.1 +
71 NORTH CENTRAL ILLINOIS INTRASTATE
LASALLE COUNTY
Oglesby 308 Portland Ave. - - 15.2 14.5 14.8 13.0
73 ROCKFORD - JANESVILLE - BELOIT INTERSTATE (IL - WI)
WINNEBAGO COUNTY
Rockford 204 S. 1st St. - + 15.0 + 14.8 12.2
75 WEST CENTRAL ILLINOIS INTRASTATE
ADAMS COUNTY
Quincy 732 Hampshire - - 13.1 12.3 13.7 13.4
MACON COUNTY
Decatur 2200 N. 22nd - + 15.0 14.3 14.1 13.6
SANGAMON COUNTY
Springfield State Fair Grounds - 15.9 13.4 13.3 13.6 13.0
- Station not in operation during the year.
+ Did not meet minimum statistical selection criteria (See Appendix B.1).
Primary Annual Standard 15.0 ug/m3

55
Table B5
2003 PARTICULATE MATTER (PM10)
(micrograms per cubic meter) ANNUAL
SAMPLING NUMBER OF SAMPLES HIGHEST SAMPLES ARITHMETIC
STATION ADDRESS FREQUENCY TOTAL >150 ug/m3 1st 2nd 3rd 4th MEAN
65 BURLINGTON - KEOKUK INTERSTATE (IA - IL)
PEORIA COUNTY
Peoria 613 N.E. Jefferson 6-day 58 0 60 55 52 50 25
67 METROPOLITAN CHICAGO INTERSTATE (IL - IN)
COOK COUNTY
Alsip 4500 W. 123rd St. 6-day 59 0 54 47 44 44 23
Blue Island 12700 Sacramento 6-day 56 0 66 65 64 64 30
Chicago - Carver 13100 S. Doty 6-day 60 0 80 75 74 70 33
Chicago - Washington HS 3535 E. 114th St. 1-day 344 0 66 64 61 58 23
Lyons Township 50th St. & Glencoe Ave. 1-day 362 0 120 103 92 92 32
Midlothian 15205 Crawford Ave. 6-day 59 0 62 45 44 43 24
Summit 60th St. & 74th Ave. 6-day 60 0 69 67 56 54 31
WILL COUNTY
Joliet Midland & Campbell Sts. 6-day 60 0 109 66 65 64 27
70 METROPOLITAN ST. LOUIS INTERSTATE (IL - MO)
MADISON COUNTY
Granite City 15th & Madison 6-day 59 0 78 66 62 59 32
Granite City 2040 Washington 1-day 365 0 105 95 92 88 38
Wood River 54 N. Walcott 6-day 61 0 56 46 44 44 24
ST. CLAIR COUNTY
East St. Louis 13th St. & Tudor Ave. 6-day 60 0 70 63 60 58 34
71 NORTH CENTRAL ILLINOIS INTRASTATE
LASALLE COUNTY
Oglesby 308 Portland Ave. 1-day 365 0 101 86 72 66 22
74 SOUTHEAST ILLINOIS INTRASTATE
JACKSON COUNTY
Carbondale 607 E. College 1-day 59 0 57 43 42 35 19
75 WEST CENTRAL ILLINOIS INTRASTATE
MACOUPIN COUNTY
Nilwood Heaton & Dubois 6-day 59 0 53 44 42 39 21
Primary 24-Hour Standard 150 ug/m3; Primary Annual Standard 50 ug/m3

56
Table B6
2003 SHORT-TERM TRENDS
PARTICULATE MATTER (PM10)
ANNUAL ARITHMETIC MEANS (ug/m3) STATION ADDRESS 1998 1999 2000 2001 2002 2003
65 BURLINGTON - KEOKUK INTERSTATE (IA - IL)
PEORIA COUNTY
Peoria 613 N.E. Jefferson 26 23 24 22 21 25
67 METROPOLITAN CHICAGO INTERSTATE (IL - IN)
COOK COUNTY
Alsip 4500 W. 123rd St. 30 25 26 27 23 23
Blue Island 12700 Sacramento 33 30 30 28 27 30
Chicago - Carver 13100 S. Doty 58 32 + 35 31 33
Chicago - Washington HS 3535 E. 114th St. 33 - - 28 24 23
Lyons Township 50th St. & Glencoe Ave. 35 36 35 38 36 32
Midlothian 15205 Crawford Ave. 28 25 24 26 23 24
Summit 60th St. & 74th Ave. 35 34 32 + 31 31
WILL COUNTY
Joliet Midland & Campbell Sts. 23 23 + 24 21 27
70 METROPOLITAN ST. LOUIS INTERSTATE (IL - MO)
MADISON COUNTY
Granite City 15th & Madison 46 31 36 39 35 32
Granite City 2040 Washington 40 44 46 47 46 38
Wood River 54 N. Walcott 30 26 29 27 23 24
ST. CLAIR COUNTY
East St. Louis 13th St. & Tudor Ave. 37 32 32 30 30 34
71 NORTH CENTRAL ILLINOIS INTRASTATE
LASALLE COUNTY
Oglesby 308 Portland Ave. 29 28 26 22 26 22
74 SOUTHEAST ILLINOIS INTRASTATE
JACKSON COUNTY
Carbondale 607 E. College 23 22 23 19 19 19
75 WEST CENTRAL ILLINOIS INTRASTATE
MACOUPPIN COUNTY
Nilwood Heaton & Dubois 22 - 23 19 18 21
- Station not in operation during the year.
+ Did not meet minimum statistical selection criteria (See Appendix B.1).
Primary Annual Standard 50 ug/m3
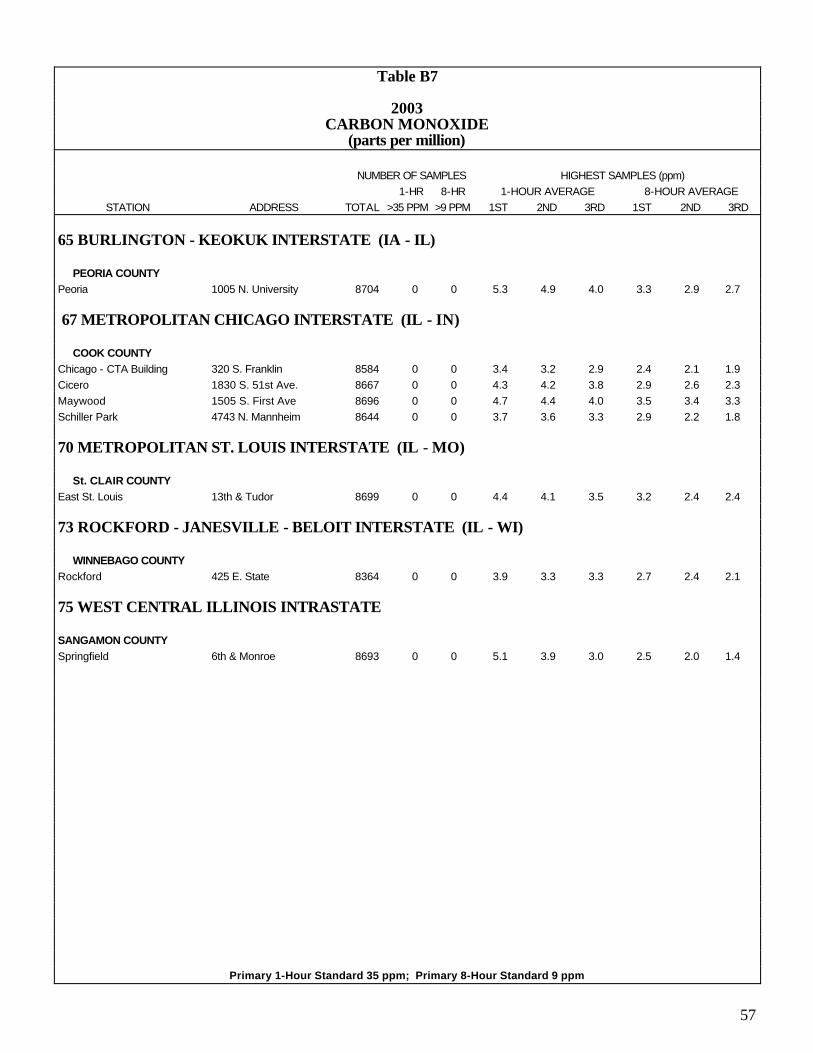
57
Table B7
2003 CARBON MONOXIDE
(parts per million)
NUMBER OF SAMPLES HIGHEST SAMPLES (ppm)
1-HR 8-HR 1-HOUR AVERAGE 8-HOUR AVERAGE
STATION ADDRESS TOTAL >35 PPM >9 PPM 1ST 2ND 3RD 1ST 2ND 3RD
65 BURLINGTON - KEOKUK INTERSTATE (IA - IL)
PEORIA COUNTY
Peoria 1005 N. University 8704 0 0 5.3 4.9 4.0 3.3 2.9 2.7
67 METROPOLITAN CHICAGO INTERSTATE (IL - IN)
COOK COUNTY
Chicago - CTA Building 320 S. Franklin 8584 0 0 3.4 3.2 2.9 2.4 2.1 1.9
Cicero 1830 S. 51st Ave. 8667 0 0 4.3 4.2 3.8 2.9 2.6 2.3
Maywood 1505 S. First Ave 8696 0 0 4.7 4.4 4.0 3.5 3.4 3.3
Schiller Park 4743 N. Mannheim 8644 0 0 3.7 3.6 3.3 2.9 2.2 1.8
70 METROPOLITAN ST. LOUIS INTERSTATE (IL - MO)
St. CLAIR COUNTY
East St. Louis 13th & Tudor 8699 0 0 4.4 4.1 3.5 3.2 2.4 2.4
73 ROCKFORD - JANESVILLE - BELOIT INTERSTATE (IL - WI)
WINNEBAGO COUNTY
Rockford 425 E. State 8364 0 0 3.9 3.3 3.3 2.7 2.4 2.1
75 WEST CENTRAL ILLINOIS INTRASTATE
SANGAMON COUNTY
Springfield 6th & Monroe 8693 0 0 5.1 3.9 3.0 2.5 2.0 1.4
Primary 1-Hour Standard 35 ppm; Primary 8-Hour Standard 9 ppm

58
Table B8
2003 SULFUR DIOXIDE VALUES IN EXCESS
OF THE 24-HOUR PRIMARY STANDARD OF 0.14 PPM OR THE 3-HOUR SECONDARY STANDARD OF 0.5 PPM
AVERAGING NUMBER OF TIME MAXIMUM
STATION ADDRESS DATE TIME EXCURSIONS PERIOD AVERAGE
70 BURLINGTON-KEOKUK INTERSTATE (IA - IL)
TAZEWELL COUNTY
Pekin 272 Derby May 10-11 24-hour 1 1800-2400 0.152
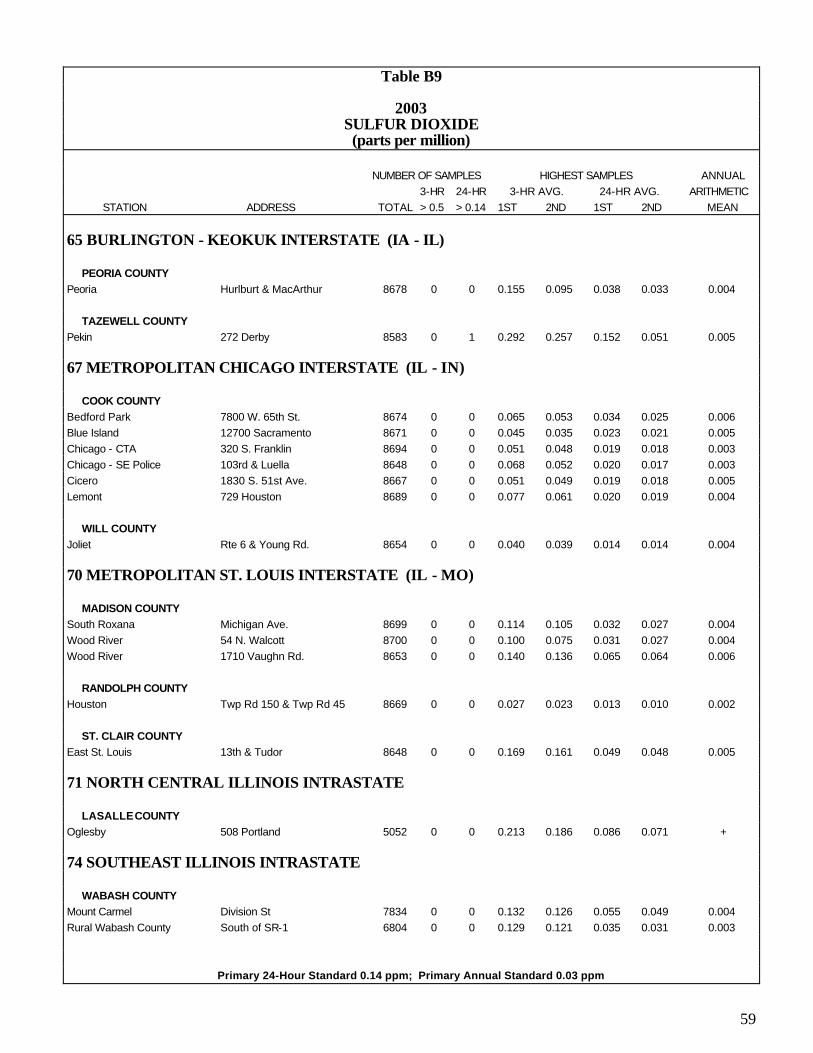
59
Table B9
2003 SULFUR DIOXIDE (parts per million)
NUMBER OF SAMPLES HIGHEST SAMPLES ANNUAL
3-HR 24-HR 3-HR AVG. 24-HR AVG. ARITHMETIC
STATION ADDRESS TOTAL > 0.5 > 0.14 1ST 2ND 1ST 2ND MEAN
65 BURLINGTON - KEOKUK INTERSTATE (IA - IL)
PEORIA COUNTY
Peoria Hurlburt & MacArthur 8678 0 0 0.155 0.095 0.038 0.033 0.004
TAZEWELL COUNTY
Pekin 272 Derby 8583 0 1 0.292 0.257 0.152 0.051 0.005
67 METROPOLITAN CHICAGO INTERSTATE (IL - IN)
COOK COUNTY
Bedford Park 7800 W. 65th St. 8674 0 0 0.065 0.053 0.034 0.025 0.006
Blue Island 12700 Sacramento 8671 0 0 0.045 0.035 0.023 0.021 0.005
Chicago - CTA 320 S. Franklin 8694 0 0 0.051 0.048 0.019 0.018 0.003
Chicago - SE Police 103rd & Luella 8648 0 0 0.068 0.052 0.020 0.017 0.003
Cicero 1830 S. 51st Ave. 8667 0 0 0.051 0.049 0.019 0.018 0.005
Lemont 729 Houston 8689 0 0 0.077 0.061 0.020 0.019 0.004
WILL COUNTY
Joliet Rte 6 & Young Rd. 8654 0 0 0.040 0.039 0.014 0.014 0.004
70 METROPOLITAN ST. LOUIS INTERSTATE (IL - MO)
MADISON COUNTY
South Roxana Michigan Ave. 8699 0 0 0.114 0.105 0.032 0.027 0.004
Wood River 54 N. Walcott 8700 0 0 0.100 0.075 0.031 0.027 0.004
Wood River 1710 Vaughn Rd. 8653 0 0 0.140 0.136 0.065 0.064 0.006
RANDOLPH COUNTY
Houston Twp Rd 150 & Twp Rd 45 8669 0 0 0.027 0.023 0.013 0.010 0.002
ST. CLAIR COUNTY
East St. Louis 13th & Tudor 8648 0 0 0.169 0.161 0.049 0.048 0.005
71 NORTH CENTRAL ILLINOIS INTRASTATE
LASALLE COUNTY
Oglesby 508 Portland 5052 0 0 0.213 0.186 0.086 0.071 +
74 SOUTHEAST ILLINOIS INTRASTATE
WABASH COUNTY
Mount Carmel Division St 7834 0 0 0.132 0.126 0.055 0.049 0.004
Rural Wabash County South of SR-1 6804 0 0 0.129 0.121 0.035 0.031 0.003
Primary 24-Hour Standard 0.14 ppm; Primary Annual Standard 0.03 ppm

60
Table B9
2003 SULFUR DIOXIDE (parts per million)
NUMBER OF SAMPLES HIGHEST SAMPLES ANNUAL
3-HR 24-HR 3-HR AVG. 24-HR AVG. ARITHMETIC
STATION ADDRESS TOTAL > 0.5 > 0.14 1ST 2ND 1ST 2ND MEAN
75 WEST CENTRAL ILLINOIS INTRASTATE
ADAMS COUNTY
Quincy 732 Hampshire 8611 0 0 0.019 0.018 0.010 0.009 0.002
MACON COUNTY
Decatur 2200 N. 22nd St. 8515 0 0 0.049 0.047 0.030 0.027 0.003
MACOUPIN COUNTY
Nilwood Heaton & DuBois 8698 0 0 0.033 0.027 0.012 0.009 0.002
SANGAMON COUNTY
Springfield Sewage Plant 8655 0 0 0.103 0.103 0.044 0.034 0.003
Primary 24-Hour Standard 0.14 ppm; Primary Annual Standard 0.03 ppm

61
Table B10
2003 SHORT-TERM TRENDS
SULFUR DIOXIDE
ANNUAL MEANS (ppm)
STATION ADDRESS 1998 1999 2000 2001 2002 2003
65 BURLINGTON - KEOKUK INTERSTATE (IA - IL)
PEORIA COUNTY
Peoria Hurlburt & MacArthur 0.007 0.007 0.006 0.005 0.005 0.004
TAZEWELL COUNTY
Pekin 272 Derby 0.006 0.005 0.005 0.006 0.005 0.005
67 METROPOLITAN CHICAGO INTERSTATE (IL - IN)
COOK COUNTY
Bedford Park 7800 W. 65th St. 0.007 0.008 0.006 0.005 0.006 0.006
Blue Island 12700 Sacramento 0.008 0.009 0.011 0.004 0.004 0.005
Chicago -CTA 320 S. Franklin 0.005 0.004 0.005 0.005 0.004 0.003
Chicago - SE Police 103rd & Luella 0.002 0.003 0.004 0.003 0.002 0.003
Cicero 1830 S. 51st Ave. 0.005 0.006 0.005 0.005 0.004 0.005
Lemont 729 Houston 0.006 0.006 0.006 0.005 0.005 0.004
WILL COUNTY
Joliet Rte 6 & Young Rd. 0.004 0.005 0.005 0.005 0.004 0.004
70 METROPOLITAN ST. LOUIS INTERSTATE (IL - MO)
MADISON COUNTY
South Roxanna Michigan Ave. 0.008 0.008 0.004 0.007 0.005 0.004
Wood River 54 N. Walcott 0.006 0.007 0.006 0.006 0.004 0.004
Wood River 1710 Vaughn Rd. + 0.009 0.008 0.004 0.005 0.006
RANDOLPH COUNTY
Houston Twp Rd 150 & Twp Rd 45 0.005 0.004 0.002 0.002 0.002 0.002
ST. CLAIR COUNTY
East St. Louis 13th & Tudor 0.008 0.008 0.007 0.007 0.005 0.005
74 SOUTHEAST ILLINOIS INTRASTATE
WABASH COUNTY
Mount Carmel Division St. 0.004 0.007 0.005 0.005 0.004 0.004
Rural Wabash County South of SR-1 0.005 0.005 0.006 0.005 0.003 0.003
+ Did not meet minimum statistical selection criteria (See Section B.1)
Primary Annual Standard 0.03 ppm

62
Table B10
2002 SHORT-TERM TRENDS
SULFUR DIOXIDE
ANNUAL MEANS (ppm)
STATION ADDRESS 1998 1999 2000 2001 2002 2003
75 WEST CENTRAL ILLINOIS INTRASTATE
ADAMS COUNTY
Quincy 732 Hampshire 0.004 0.005 0.003 0.003 0.003 0.002
MACON COUNTY
Decatur 2200 N. 22nd St. 0.005 0.005 0.005 0.005 0.004 0.003
MACOUPIN COUNTY
Nilwood Heaton & DuBois 0.003 0.003 0.002 0.002 0.002 0.002
SANGAMON COUNTY
Springfield Sewage Plant 0.006 0.006 0.005 0.003 0.003 0.003
- Station not in operation during year shown
+ Did not meet minimum statistical selection criteria (See Section B.1)
Primary Annual Standard 0.03 ppm
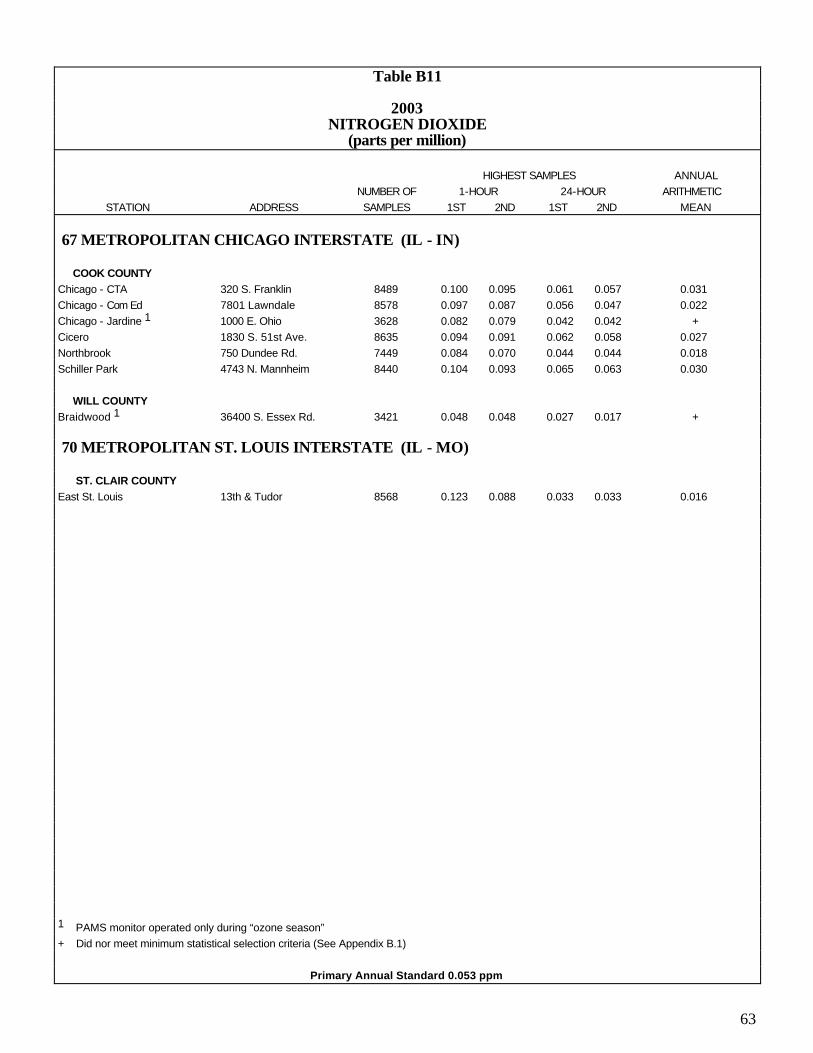
63
Table B11
2003 NITROGEN DIOXIDE
(parts per million) HIGHEST SAMPLES ANNUAL
NUMBER OF 1-HOUR 24-HOUR ARITHMETIC
STATION ADDRESS SAMPLES 1ST 2ND 1ST 2ND MEAN
67 METROPOLITAN CHICAGO INTERSTATE (IL - IN)
COOK COUNTY
Chicago - CTA 320 S. Franklin 8489 0.100 0.095 0.061 0.057 0.031
Chicago - Com Ed 7801 Lawndale 8578 0.097 0.087 0.056 0.047 0.022
Chicago - Jardine 1 1000 E. Ohio 3628 0.082 0.079 0.042 0.042 +
Cicero 1830 S. 51st Ave. 8635 0.094 0.091 0.062 0.058 0.027
Northbrook 750 Dundee Rd. 7449 0.084 0.070 0.044 0.044 0.018
Schiller Park 4743 N. Mannheim 8440 0.104 0.093 0.065 0.063 0.030
WILL COUNTY
Braidwood 1 36400 S. Essex Rd. 3421 0.048 0.048 0.027 0.017 +
70 METROPOLITAN ST. LOUIS INTERSTATE (IL - MO)
ST. CLAIR COUNTY
East St. Louis 13th & Tudor 8568 0.123 0.088 0.033 0.033 0.016
1 PAMS monitor operated only during “ozone season”
+ Did nor meet minimum statistical selection criteria (See Appendix B.1)
Primary Annual Standard 0.053 ppm

64
Table B12
2003 SHORT-TERM TRENDS
NITROGEN DIOXIDE ANNUAL MEANS (ppm)
STATION ADDRESS 1998 1999 2000 2001 2002 2003
67 METROPOLITAN CHICAGO INTERSTATE (IL - IN)
COOK COUNTY
Chicago - CTA 320 S. Franklin 0.032 0.032 0.032 0.032 0.032 0.031
Chicago - Com Ed 7801 Lawndale - - - - 0.022 0.022
Cicero 1820 S. 51st St. 0.026 0.027 0.027 0.028 0.023 0.027
Northbrook 750 Dundee Rd. 0.017 0.017 0.018 0.018 0.017 0.018
Schiller Park 4743 N. Mannheim 0.031 0.031 0.029 0.028 0.030 0.030
WILL COUNTY
Braidwood 36400 S. Essex Rd. 0.009 0.010 0.009 + + +
70 METROPOLITAN ST. LOUIS INTERSTATE (IL - MO)
ST. CLAIR COUNTY
East St. Louis 13th & Tudor 0.018 0.019 0.018 0.019 0.017 0.016
- Station not in operation during year shown
+ Did not meet minimum statistical selection criteria (See Section B.1)
Primary Annual Standard 0.053 ppm

65
Table B13
2003 LEAD
(micrograms per cubic meter)
NUMBER OF
QUARTERS QUARTERLY AVERAGES ANNUAL
STATION ADDRESS >1.5 1st 2nd 3rd 4th MEAN
65 BURLINGTON - KEOKUK INTERSTATE (IA - IL) PEORIA COUNTY
Peoria 613 N.E. Jefferson 0 0.01 0.02 0.01 0.01 0.01
67 METROPOLITAN CHICAGO INTERSTATE (IL - IN)
COOK COUNTY
Alsip 4500 W. 123rd St. 0 0.01 0.02 0.02 0.01 0.01
Chicago - Cermak 735 W. Harrison 0 0.04 0.06 0.05 0.03 0.04
Chicago - Mayfair 4850 Wilson Ave. 0 0.01 0.02 0.03 0.02 0.02
Chicago - Washington 3535 E. 114th St. 0 0.02 0.02 0.03 0.02 0.02
Maywood 1500 Maybrook Dr. 0 0.03 0.04 0.04 0.02 0.03
Northbrook 750 Dundee Rd. 0 0.01 0.01 0.01 0.01 0.01
Schiller Park 4243 N. Mannheim Rd. 0 0.02 0.02 0.01 0.01 0.02
Summit 60th St. & 74th Ave. 0 0.02 0.03 0.03 0.08 0.04
70 METROPOLITAN ST. LOUIS INTERSTATE (IL - MO)
MADISON COUNTY
Granite City 15th & Madison 0 0.03 0.03 0.04 0.34 0.11
Wood River 54 N. Walcott 0 0.01 0.02 0.02 0.02 0.02
ST. CLAIR COUNTY
East St. Louis 13th St. & Tudor Ave. 0 0.02 0.03 0.06 0.05 0.04
75 WEST CENTRAL ILLINOIS INTRASTATE
MACOUPIN COUNTY
Nilwood Heaton & DuBois 0 0.01 0.01 0.01 0.01 0.01
+ Did not meet minimum statistical selection criteria (See Section B.1)
Primary Quarterly Standard 1.5 ug/m3

66
Table B14
2003 FILTER ANALYSIS DATA (micrograms per cubic meter)
TOTAL HIGHEST ARITH. TOTAL HIGHEST ARITH.
STATION ADDRESS SAMPLES 1st 2nd MEAN SAMPLES 1st 2nd MEAN
ARSENIC BERYLLIUM 65 BURLINGTON - KEOKUK INTERSTATE (IA - IL) PEORIA COUNTY
Peoria 613 N.E. Jefferson 61 0.005 0.003 0.001 61 0.000 0.000 0.000
67 METROPOLITAN CHICAGO INTERSTATE (IL - IN) COOK COUNTY
Alsip 500 W. 123rd. St. 56 0.045 0.027 0.005 NA
Chicago - Cermak 735 W. Harrison 58 0.026 0.019 0.004 NA
Chicago - Mayfair 4850 Wilson Ave 55 0.031 0.016 0.004 NA
Chicago - Washington 3535 E. 114th St. 58 0.024 0.019 0.004 NA
Maywood 1500 Maybrook Dr. 58 0.031 0.020 0.004 NA
Northbrook 750 Dundee Rd. 61 0.003 0.003 0.001 61 0.000 0.000 0.000
Schiller Park 4743 N. Mannheim Rd. 61 0.004 0.004 0.001 61 0.000 0.000 0.000
Summit 60th St. & 74th Ave. 59 0.088 0.035 0.006 NA
70 METROPOLITAN ST. LOUIS INTERSTATE (IL - MO) MADISON COUNTY
Granite City 15th & Madison 58 0.021 0.016 0.003 58 0.000 0.000 0.000
Wood River 54 N. Walcott 60 0.007 0.005 0.001 60 0.000 0.000 0.000
ST. CLAIR COUNTY
East St. Louis 13th St. & Tudor Ave. 60 0.042 0.017 0.004 60 0.000 0.000 0.000
75 WEST CENTRAL ILLINOIS INTRASTATE MACOUPIN COUNTY
Nilwood Heaton & DuBois 58 0.005 0.005 0.001 58 0.000 0.000 0.000

67
Table B14
2003 FILTER ANALYSIS DATA (micrograms per cubic meter)
TOTAL HIGHEST ARITH. TOTAL HIGHEST ARITH.
STATION ADDRESS SAMPLES 1st 2nd MEAN SAMPLES 1st 2nd MEAN
CADMIUM CHROMIUM 65 BURLINGTON - KEOKUK INTERSTATE (IA - IL) PEORIA COUNTY
Peoria 613 N.E. Jefferson 61 0.000 0.000 0.000 61 0.006 0.006 0.000
67 METROPOLITAN CHICAGO INTERSTATE (IL - IN) COOK COUNTY
Alsip 4500 W. 123rd. St. 56 0.015 0.003 0.001 56 0.014 0.013 0.006
Chicago - Cermak 735 W. Harrison 58 0.016 0.014 0.002 58 0.019 0.016 0.006
Chicago - Mayfair 4850 Wilson Ave 55 0.015 0.003 0.002 55 0.020 0.017 0.005
Chicago - Washington 3535 E. 114th St. 58 0.005 0.003 0.001 58 0.047 0.033 0.008
Maywood 1500 Maybrook Dr. 58 0.013 0.010 0.002 58 0.030 0.025 0.012
Northbrook 750 Dundee Rd 61 0.006 0.000 0.000 61 0.003 0.003 0.000
Schiller Park 4743 N. Mannheim Rd. 61 0.006 0.000 0.000 61 0.010 0.007 0.004
Summit 60th St. & 74th Ave. 59 0.010 0.009 0.002 59 0.025 0.015 0.006
70 METROPOLITAN ST. LOUIS INTERSTATE (IL - MO) MADISON COUNTY
Granite City 15th & Madison 58 0.000 0.000 0.000 58 0.014 0.014 0.004
Wood River 54 N. Walcott 60 0.013 0.000 0.000 60 0.003 0.003 0.000 ST. CLAIR COUNTY
East St. Louis 13th St. & Tudor Ave. 60 0.038 0.019 0.003 60 0.004 0.004 0.001
75 WEST CENTRAL ILLINOIS INTRASTATE MACOUPIN COUNTY
Nilwood Heaton & DuBois 58 0.006 0.000 0.000 58 0.003 0.000 0.000
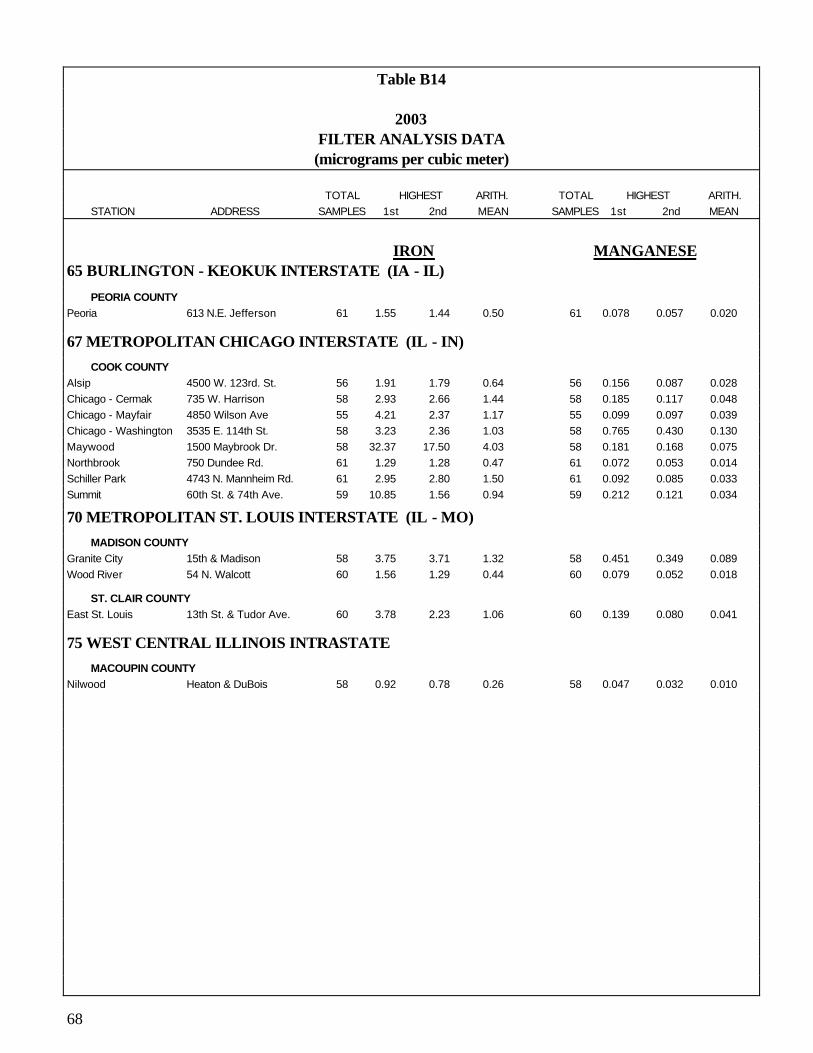
68
Table B14
2003 FILTER ANALYSIS DATA (micrograms per cubic meter)
TOTAL HIGHEST ARITH. TOTAL HIGHEST ARITH.
STATION ADDRESS SAMPLES 1st 2nd MEAN SAMPLES 1st 2nd MEAN
IRON MANGANESE 65 BURLINGTON - KEOKUK INTERSTATE (IA - IL) PEORIA COUNTY
Peoria 613 N.E. Jefferson 61 1.55 1.44 0.50 61 0.078 0.057 0.020
67 METROPOLITAN CHICAGO INTERSTATE (IL - IN) COOK COUNTY
Alsip 4500 W. 123rd. St. 56 1.91 1.79 0.64 56 0.156 0.087 0.028
Chicago - Cermak 735 W. Harrison 58 2.93 2.66 1.44 58 0.185 0.117 0.048
Chicago - Mayfair 4850 Wilson Ave 55 4.21 2.37 1.17 55 0.099 0.097 0.039
Chicago - Washington 3535 E. 114th St. 58 3.23 2.36 1.03 58 0.765 0.430 0.130
Maywood 1500 Maybrook Dr. 58 32.37 17.50 4.03 58 0.181 0.168 0.075
Northbrook 750 Dundee Rd. 61 1.29 1.28 0.47 61 0.072 0.053 0.014
Schiller Park 4743 N. Mannheim Rd. 61 2.95 2.80 1.50 61 0.092 0.085 0.033
Summit 60th St. & 74th Ave. 59 10.85 1.56 0.94 59 0.212 0.121 0.034 70 METROPOLITAN ST. LOUIS INTERSTATE (IL - MO) MADISON COUNTY
Granite City 15th & Madison 58 3.75 3.71 1.32 58 0.451 0.349 0.089
Wood River 54 N. Walcott 60 1.56 1.29 0.44 60 0.079 0.052 0.018 ST. CLAIR COUNTY
East St. Louis 13th St. & Tudor Ave. 60 3.78 2.23 1.06 60 0.139 0.080 0.041
75 WEST CENTRAL ILLINOIS INTRASTATE MACOUPIN COUNTY
Nilwood Heaton & DuBois 58 0.92 0.78 0.26 58 0.047 0.032 0.010

69
Table B14
2003 FILTER ANALYSIS DATA (micrograms per cubic meter)
TOTAL HIGHEST ARITH. TOTAL HIGHEST ARITH.
STATION ADDRESS SAMPLES 1st 2nd MEAN SAMPLES 1st 2nd MEAN
NICKEL 65 BURLINGTON - KEOKUK INTERSTATE (IA - IL) PEORIA COUNTY
Peoria 613 N.E. Jefferson 61 0.013 0.007 0.000
67 METROPOLITAN CHICAGO INTERSTATE (IL - IN) COOK COUNTY
Alsip 4500 W. 123rd. St. 56 0.018 0.017 0.007
Chicago - Cermak 735 W. Harrison 58 0.014 0.012 0.008
Chicago - Mayfair 4850 Wilson Ave 55 0.014 0.012 0.007
Chicago - Washington 3535 E. 114th St. 58 0.013 0.011 0.007
Maywood 1500 Maybrook Dr. 58 0.016 0.015 0.010
Northbrook 750 Dundee Rd. 61 0.013 0.010 0.001
Schiller Park 4743 N. Mannheim Rd. 61 0.013 0.010 0.001
Summit 60th St. & 74th Ave. 59 0.036 0.023 0.008 70 METROPOLITAN ST. LOUIS INTERSTATE (IL - MO) MADISON COUNTY
Granite City 15th & Madison 58 0.013 0.007 0.000
Wood River 54 N. Walcott 60 0.020 0.010 0.001 ST. CLAIR COUNTY
East St. Louis 13th St. & Tudor Ave. 60 0.010 0.010 0.000
75 WEST CENTRAL ILLINOIS INTRASTATE MACOUPIN COUNTY
Nilwood Heaton & DuBois 58 0.007 0.000 0.000

70
Table B14
2003 FILTER ANALYSIS DATA (micrograms per cubic meter)
TOTAL HIGHEST ARITH. TOTAL HIGHEST ARITH.
STATION ADDRESS SAMPLES 1st 2nd MEAN SAMPLES 1st 2nd MEAN
NITRATES SULFATES 65 BURLINGTON - KEOKUK INTERSTATE (IA - IL) PEORIA COUNTY
Peoria 613 N.E. Jefferson 61 15.2 15.1 5.0 61 24.2 21.6 8.2
67 METROPOLITAN CHICAGO INTERSTATE (IL - IN) COOK COUNTY
Alsip 4500 W. 123rd. St. 56 21.0 18.8 5.5 56 22.3 19.7 7.8
Chicago - Cermak 735 W. Harrison 58 19.5 16.3 5.6 58 20.8 15.6 9.0
Chicago - Mayfair 4850 Wilson Ave 55 18.8 17.6 5.7 55 22.7 17.3 8.3
Chicago - Washington 3535 E. 114th St. 58 22.7 13.5 5.1 58 20.9 18.1 8.6
Maywood 1500 Maybrook Dr. 58 16.8 14.7 5.0 58 19.6 17.2 9.4
Northbrook 750 Dundee Rd. 61 19.3 14.0 5.1 61 20.6 17.4 7.7
Schiller Park 4743 N. Mannheim Rd. 61 17.4 15.8 5.5 61 21.7 17.6 8.9
Summit 60th St. & 74th Ave. 59 21.9 19.9 5.6 59 20.6 18.3 8.8 70 METROPOLITAN ST. LOUIS INTERSTATE (IL - MO) MADISON COUNTY
Granite City 15th & Madison 58 11.2 10.9 3.9 58 23.1 18.4 8.8
Wood River 54 N. Walcott 60 10.5 10.2 3.8 60 20.8 19.7 8.2 ST. CLAIR COUNTY
East St. Louis 13th St. & Tudor Ave. 60 13.4 12.9 4.8 60 25.4 24.5 10.5
75 WEST CENTRAL ILLINOIS INTRASTATE MACOUPIN COUNTY
Nilwood Heaton & DuBois 58 13.6 12.8 4.4 58 23.0 18.2 7.6
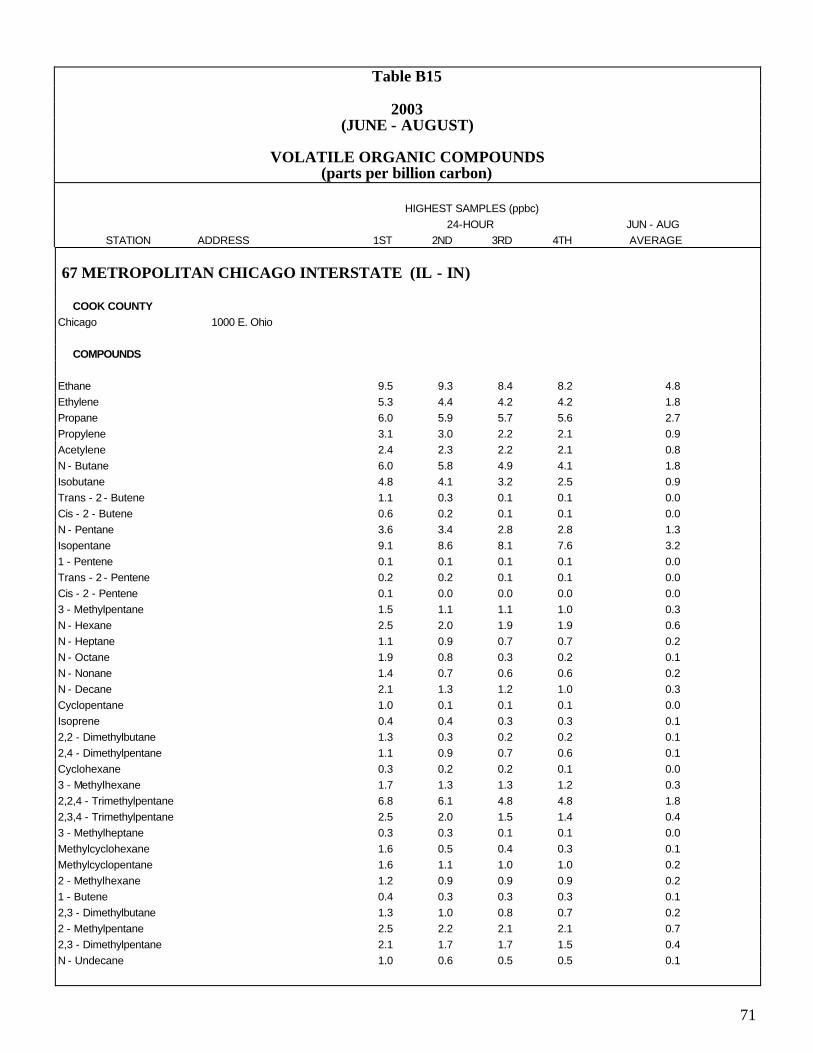
71
Table B15
2003 (JUNE - AUGUST)
VOLATILE ORGANIC COMPOUNDS
(parts per billion carbon) HIGHEST SAMPLES (ppbc)
24-HOUR JUN - AUG
STATION ADDRESS 1ST 2ND 3RD 4TH AVERAGE
67 METROPOLITAN CHICAGO INTERSTATE (IL - IN)
COOK COUNTY
Chicago 1000 E. Ohio
COMPOUNDS
Ethane 9.5 9.3 8.4 8.2 4.8
Ethylene 5.3 4.4 4.2 4.2 1.8
Propane 6.0 5.9 5.7 5.6 2.7
Propylene 3.1 3.0 2.2 2.1 0.9
Acetylene 2.4 2.3 2.2 2.1 0.8
N - Butane 6.0 5.8 4.9 4.1 1.8
Isobutane 4.8 4.1 3.2 2.5 0.9
Trans - 2 - Butene 1.1 0.3 0.1 0.1 0.0
Cis - 2 - Butene 0.6 0.2 0.1 0.1 0.0
N - Pentane 3.6 3.4 2.8 2.8 1.3
Isopentane 9.1 8.6 8.1 7.6 3.2
1 - Pentene 0.1 0.1 0.1 0.1 0.0
Trans - 2 - Pentene 0.2 0.2 0.1 0.1 0.0
Cis - 2 - Pentene 0.1 0.0 0.0 0.0 0.0
3 - Methylpentane 1.5 1.1 1.1 1.0 0.3
N - Hexane 2.5 2.0 1.9 1.9 0.6
N - Heptane 1.1 0.9 0.7 0.7 0.2
N - Octane 1.9 0.8 0.3 0.2 0.1
N - Nonane 1.4 0.7 0.6 0.6 0.2
N - Decane 2.1 1.3 1.2 1.0 0.3
Cyclopentane 1.0 0.1 0.1 0.1 0.0
Isoprene 0.4 0.4 0.3 0.3 0.1
2,2 - Dimethylbutane 1.3 0.3 0.2 0.2 0.1
2,4 - Dimethylpentane 1.1 0.9 0.7 0.6 0.1
Cyclohexane 0.3 0.2 0.2 0.1 0.0
3 - Methylhexane 1.7 1.3 1.3 1.2 0.3
2,2,4 - Trimethylpentane 6.8 6.1 4.8 4.8 1.8
2,3,4 - Trimethylpentane 2.5 2.0 1.5 1.4 0.4
3 - Methylheptane 0.3 0.3 0.1 0.1 0.0
Methylcyclohexane 1.6 0.5 0.4 0.3 0.1
Methylcyclopentane 1.6 1.1 1.0 1.0 0.2
2 - Methylhexane 1.2 0.9 0.9 0.9 0.2
1 - Butene 0.4 0.3 0.3 0.3 0.1
2,3 - Dimethylbutane 1.3 1.0 0.8 0.7 0.2
2 - Methylpentane 2.5 2.2 2.1 2.1 0.7
2,3 - Dimethylpentane 2.1 1.7 1.7 1.5 0.4
N - Undecane 1.0 0.6 0.5 0.5 0.1

72
Table B15
2003 (JUNE - AUGUST)
VOLATILE ORGANIC COMPOUNDS
(parts per billion carbon) HIGHEST SAMPLES (ppbc)
24-HOUR JUN - AUG
STATION ADDRESS 1ST 2ND 3RD 4TH AVERAGE
COMPOUNDS
2 - Methylheptane 0.2 0.1 0.1 0.1 0.0
M/P Xylene 5.1 2.9 2.5 2.4 0.8
Benzene 3.4 2.2 1.9 1.8 0.7
Toluene 15.2 12.8 8.3 8.1 2.5
Ethylbenzene 1.4 0.6 0.5 0.5 0.1
O - Xylene 1.8 1.5 1.3 0.8 0.2
1,3,5 - Trimethylbenzene 0.5 0.4 0.3 0.3 0.0
1,2,4 - Trimethylbenzene 1.7 1.3 1.2 1.2 0.4
N - Propylbenzene 0.1 0.1 0.1 0.0 0.0
Isopropylbenzene 0.4 0.2 0.2 0.2 0.0
O-Ethyltolune 0.2 0.1 0.1 0.1 0.0
M-Ethyltolune 0.7 0.7 0.5 0.5 0.1
P-Ethyltolune 0.2 0.1 0.1 0.0 0.0
M-Diethylbenzene 0.2 0.1 0.1 0.0 0.0
P-Diethylbenzene 0.2 0.1 0.1 0.1 0.0
Styrene 0.0 0.0 0.0 0.0 0.0
1,2,3 - Trimethylbenzene 0.4 0.4 0.3 0.3 0.0
Northbrook 750 Dundee Rd.
COMPOUNDS
Ethane 12.5 9.6 9.2 8.7 5.0
Ethylene 2.2 2.0 2.0 1.9 0.8
Propane 5.6 5.4 5.4 5.3 2.9
Propylene 2.0 1.8 1.6 1.5 0.6
Acetylene 1.7 0.4 0.4 0.4 0.1
N - Butane 5.3 4.5 4.5 4.4 2.0
Isobutane 2.4 2.4 2.1 1.9 0.9
Trans - 2 - Butene 1.7 1.7 1.7 1.7 1.1
Cis - 2 - Butene 0.3 0.2 0.2 0.2 0.0
N - Pentane 5.0 3.8 3.6 3.2 1.5
Isopentane 9.5 8.4 8.4 8.0 3.5
1 - Pentene 0.2 0.1 0.1 0.1 0.0
Trans - 2 - Pentene 0.5 0.4 0.4 0.4 0.1
Cis - 2 - Pentene 0.2 0.2 0.2 0.1 0.0
3 - Methylpentane 1.5 1.5 1.3 1.3 0.4
N - Hexane 2.7 2.6 2.4 2.3 1.0
N - Heptane 1.2 1.1 1.1 1.1 0.4
N - Octane 0.6 0.5 0.5 0.5 0.1
N - Nonane 0.7 0.6 0.6 0.4 0.2
N - Decane 0.9 0.8 0.7 0.6 0.2

73
Table B15
2003 (JUNE - AUGUST)
VOLATILE ORGANIC COMPOUNDS
(parts per billion carbon) HIGHEST SAMPLES (ppbc)
24-HOUR JUN - AUG
STATION ADDRESS 1ST 2ND 3RD 4TH AVERAGE
COMPOUNDS
Cyclopentane 0.2 0.2 0.2 0.2 0.0
Isoprene 5.3 5.1 5.0 4.6 1.9
2,2 - Dimethylbutane 0.3 0.3 0.2 0.2 0.1
2,4 - Dimethylpentane 1.4 1.1 1.1 1.1 0.4
Cyclohexane 0.7 0.5 0.5 0.4 0.1
3 - Methylhexane 1.8 1.5 1.4 1.4 0.5
2,2,4 - Trimethylpentane 6.8 6.6 5.9 5.5 2.3
2,3,4 - Trimethylpentane 2.1 1.9 1.7 1.6 0.6
3 - Methylheptane 0.5 0.4 0.4 0.3 0.1
Methylcyclohexane 0.7 0.6 0.6 0.5 0.2
Methylcyclopentane 1.6 1.5 1.4 1.4 0.5
2 - Methylhexane 1.2 1.2 1.1 1.0 0.4
1 - Butene 0.2 0.2 0.2 0.1 0.0
2,3 - Dimethylbutane 1.2 1.1 1.1 1.0 0.3
2 - Methylpentane 2.8 2.7 2.5 2.5 0.9
2,3 - Dimethylpentane 1.9 1.9 1.7 1.7 0.6
N - Undecane 0.6 0.6 0.5 0.4 0.2
2 - Methylheptane 0.3 0.3 0.2 0.2 0.1
M/P Xylene 2.6 2.4 2.2 2.1 0.7
Benzene 1.8 1.7 1.6 1.5 0.6
Toluene 7.2 7.1 6.9 6.8 2.5
Ethylbenzene 0.7 0.6 0.5 0.5 0.1
O - Xylene 2.9 0.9 0.8 0.7 0.3
1,3,5 - Trimethylbenzene 0.5 0.4 0.4 0.3 0.1
1,2,4 - Trimethylbenzene 1.6 1.4 1.3 1.3 0.5
N - Propylbenzene 0.1 0.1 0.1 0.1 0.0
Isopropylbenzene 0.1 0.1 0.1 0.1 0.0
N-Decane 1.8 1.8 1.6 1.3 0.4
N-Undecane 1.6 1.3 1.3 1.3 0.4
O-Ethyltolune 0.3 0.3 0.3 0.2 0.1
M-Ethyltolune 0.7 0.6 0.6 0.6 0.2
P-Ethyltolune 0.4 0.3 0.2 0.2 0.1
M-Diethylbenzene 0.3 0.2 0.2 0.1 0.0
P-Diethylbenzene 0.2 0.1 0.1 0.1 0.0
Styrene 0.1 0.1 0.1 0.1 0.0
1,2,3 Trimethylbenzene 1.1 1.0 0.7 0.6 0.2
Formaldehyde 1 8.9 8.1 7.2 7.0 6.0
1 Values in ppb (volume)
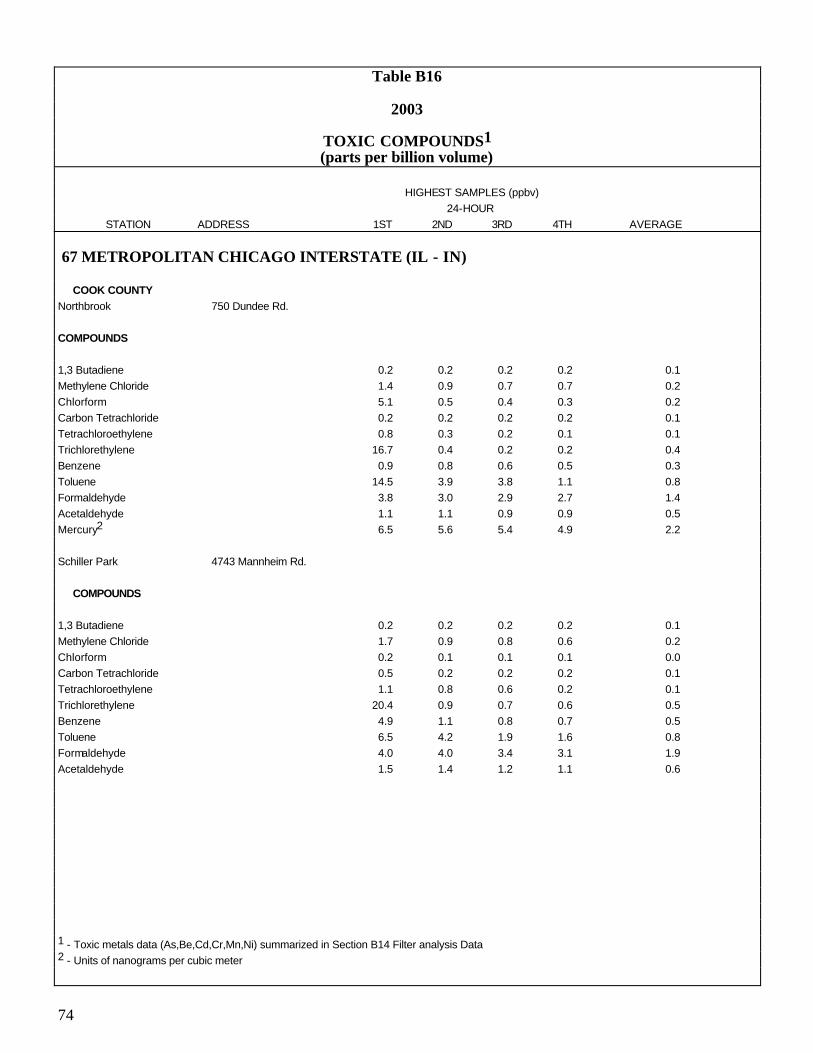
74
Table B16
2003
TOXIC COMPOUNDS1 (parts per billion volume)
HIGHEST SAMPLES (ppbv)
24-HOUR
STATION ADDRESS 1ST 2ND 3RD 4TH AVERAGE
67 METROPOLITAN CHICAGO INTERSTATE (IL - IN)
COOK COUNTY
Northbrook 750 Dundee Rd.
COMPOUNDS
1,3 Butadiene 0.2 0.2 0.2 0.2 0.1
Methylene Chloride 1.4 0.9 0.7 0.7 0.2
Chlorform 5.1 0.5 0.4 0.3 0.2
Carbon Tetrachloride 0.2 0.2 0.2 0.2 0.1
Tetrachloroethylene 0.8 0.3 0.2 0.1 0.1
Trichlorethylene 16.7 0.4 0.2 0.2 0.4
Benzene 0.9 0.8 0.6 0.5 0.3
Toluene 14.5 3.9 3.8 1.1 0.8
Formaldehyde 3.8 3.0 2.9 2.7 1.4
Acetaldehyde 1.1 1.1 0.9 0.9 0.5
Mercury2 6.5 5.6 5.4 4.9 2.2
Schiller Park 4743 Mannheim Rd.
COMPOUNDS
1,3 Butadiene 0.2 0.2 0.2 0.2 0.1
Methylene Chloride 1.7 0.9 0.8 0.6 0.2
Chlorform 0.2 0.1 0.1 0.1 0.0
Carbon Tetrachloride 0.5 0.2 0.2 0.2 0.1
Tetrachloroethylene 1.1 0.8 0.6 0.2 0.1
Trichlorethylene 20.4 0.9 0.7 0.6 0.5
Benzene 4.9 1.1 0.8 0.7 0.5
Toluene 6.5 4.2 1.9 1.6 0.8
Formaldehyde 4.0 4.0 3.4 3.1 1.9
Acetaldehyde 1.5 1.4 1.2 1.1 0.6
1 - Toxic metals data (As,Be,Cd,Cr,Mn,Ni) summarized in Section B14 Filter analysis Data 2 - Units of nanograms per cubic meter

75
Table B17
2003
PM2.5 SPECIATION (micrograms per cubic meter)
HIGHEST SAMPLES (ug/m3)
24-HOUR ANNUAL
STATION ADDRESS 1ST 2ND 3RD 4TH AVERAGE
67 METROPOLITAN CHICAGO INTERSTATE (IL - IN)
COOK COUNTY
Chicago - Com Ed 7801 Lawndale
MAJOR CONSTITUENTS
Inorganic Elements 3.0 2.4 2.3 2.1 0.6
Ammonium 9.2 8.5 7.6 7.0 1.8
Nitrate 17.8 14.5 12.6 12.1 2.7
Sulfate 10.4 10.3 10.1 9.9 3.2
Elemental Carbon 2.0 1.7 1.4 1.4 0.7
Organic Carbon 7.3 5.7 5.5 5.3 3.2
Chicago - Springfield 1745 N. Springfield Ave.
MAJOR CONSTITUENTS
Inorganic Elements 2.1 1.6 1.5 1.4 0.6
Ammonium 7.5 7.1 6.4 4.7 2.0
Nitrate 14.3 14.2 13.2 10.5 3.2
Sulfate 13.5 10.4 9.9 9.2 3.6
Elemental Carbon 1.8 1.6 1.5 1.4 0.7
Organic Carbon 9.1 7.3 7.3 7.1 4.4
70 METROPOLITAN ST. LOUIS INTERSTATE (IL - MO)
MADISON COUNTY
Alton 1700 Annex St.
MAJOR CONSTITUENTS
Inorganic Elements 1.9 1.8 1.5 1.2 0.5
Ammonium 6.0 5.6 4.8 3.8 1.8
Nitrate 9.4 9.4 6.0 5.6 2.0
Sulfate 16.6 15.6 14.0 10.8 4.0
Elemental Carbon 1.1 1.1 0.9 0.9 0.4
Organic Carbon 8.3 6.9 6.6 6.5 3.4

76
Table B17
2003
PM2.5 SPECIATION (micrograms per cubic meter)
HIGHEST SAMPLES (ug/m3)
24-HOUR ANNUAL
STATION ADDRESS 1ST 2ND 3RD 4TH AVERAGE
75 WEST CENTRAL ILLINOIS INTRASTATE
MACON COUNTY
Decatur 2200 N. 22nd St.
MAJOR CONSTITUENTS
Inorganic Elements 2.1 1.6 1.4 1.3 0.5
Ammonium 8.4 6.2 5.8 5.5 1.9
Nitrate 8.7 8.7 8.1 7.2 2.2
Sulfate 20.8 16.9 13.6 10.5 4.0
Elemental Carbon 0.7 0.7 0.7 0.7 0.5
Organic Carbon 9.0 6.5 6.5 6.0 3.8
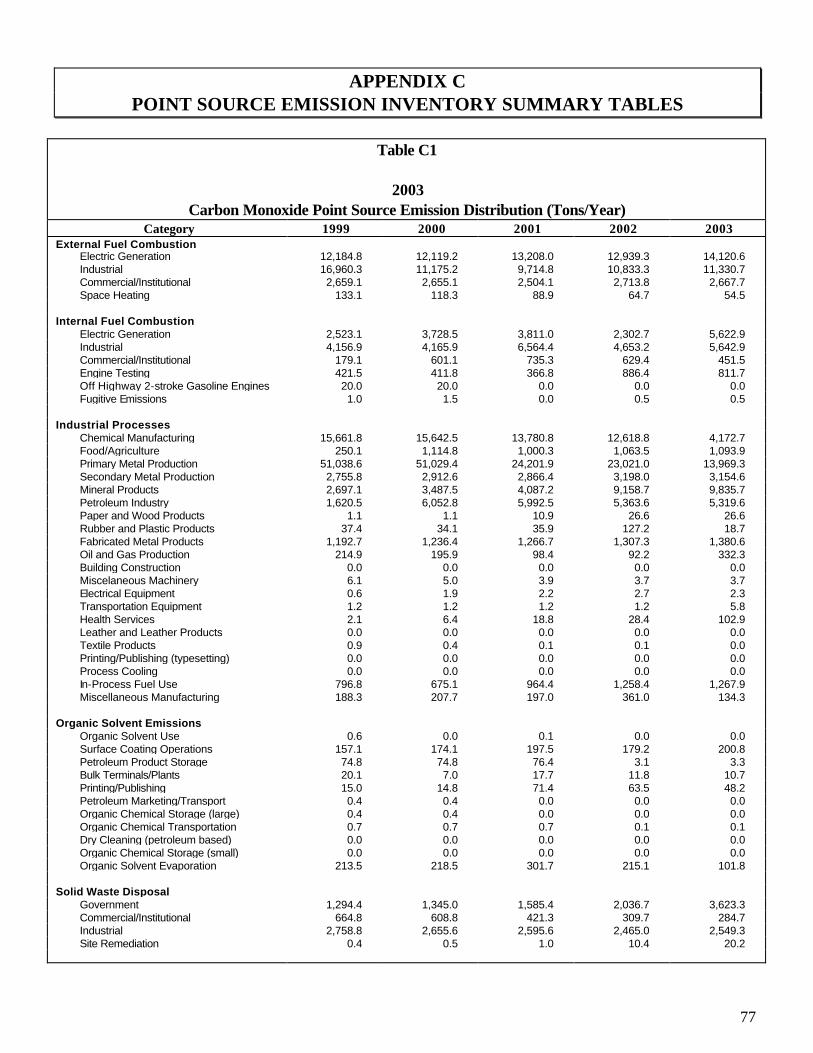
77
APPENDIX C POINT SOURCE EMISSION INVENTORY SUMMARY TABLES
Table C1
2003
Carbon Monoxide Point Source Emission Distribution (Tons/Year) Category 1999 2000 2001 2002 2003
External Fuel Combustion Electric Generation 12,184.8 12,119.2 13,208.0 12,939.3 14,120.6 Industrial 16,960.3 11,175.2 9,714.8 10,833.3 11,330.7 Commercial/Institutional 2,659.1 2,655.1 2,504.1 2,713.8 2,667.7 Space Heating 133.1 118.3 88.9 64.7 54.5 Internal Fuel Combustion Electric Generation 2,523.1 3,728.5 3,811.0 2,302.7 5,622.9 Industrial 4,156.9 4,165.9 6,564.4 4,653.2 5,642.9 Commercial/Institutional 179.1 601.1 735.3 629.4 451.5 Engine Testing 421.5 411.8 366.8 886.4 811.7 Off Highway 2-stroke Gasoline Engines 20.0 20.0 0.0 0.0 0.0 Fugitive Emissions 1.0 1.5 0.0 0.5 0.5 Industrial Processes Chemical Manufacturing 15,661.8 15,642.5 13,780.8 12,618.8 4,172.7 Food/Agriculture 250.1 1,114.8 1,000.3 1,063.5 1,093.9 Primary Metal Production 51,038.6 51,029.4 24,201.9 23,021.0 13,969.3 Secondary Metal Production 2,755.8 2,912.6 2,866.4 3,198.0 3,154.6 Mineral Products 2,697.1 3,487.5 4,087.2 9,158.7 9,835.7 Petroleum Industry 1,620.5 6,052.8 5,992.5 5,363.6 5,319.6 Paper and Wood Products 1.1 1.1 10.9 26.6 26.6 Rubber and Plastic Products 37.4 34.1 35.9 127.2 18.7 Fabricated Metal Products 1,192.7 1,236.4 1,266.7 1,307.3 1,380.6 Oil and Gas Production 214.9 195.9 98.4 92.2 332.3 Building Construction 0.0 0.0 0.0 0.0 0.0 Miscelaneous Machinery 6.1 5.0 3.9 3.7 3.7 Electrical Equipment 0.6 1.9 2.2 2.7 2.3 Transportation Equipment 1.2 1.2 1.2 1.2 5.8 Health Services 2.1 6.4 18.8 28.4 102.9 Leather and Leather Products 0.0 0.0 0.0 0.0 0.0 Textile Products 0.9 0.4 0.1 0.1 0.0 Printing/Publishing (typesetting) 0.0 0.0 0.0 0.0 0.0 Process Cooling 0.0 0.0 0.0 0.0 0.0 In-Process Fuel Use 796.8 675.1 964.4 1,258.4 1,267.9 Miscellaneous Manufacturing 188.3 207.7 197.0 361.0 134.3 Organic Solvent Emissions Organic Solvent Use 0.6 0.0 0.1 0.0 0.0 Surface Coating Operations 157.1 174.1 197.5 179.2 200.8 Petroleum Product Storage 74.8 74.8 76.4 3.1 3.3 Bulk Terminals/Plants 20.1 7.0 17.7 11.8 10.7 Printing/Publishing 15.0 14.8 71.4 63.5 48.2 Petroleum Marketing/Transport 0.4 0.4 0.0 0.0 0.0 Organic Chemical Storage (large) 0.4 0.4 0.0 0.0 0.0 Organic Chemical Transportation 0.7 0.7 0.7 0.1 0.1 Dry Cleaning (petroleum based) 0.0 0.0 0.0 0.0 0.0 Organic Chemical Storage (small) 0.0 0.0 0.0 0.0 0.0 Organic Solvent Evaporation 213.5 218.5 301.7 215.1 101.8 Solid Waste Disposal Government 1,294.4 1,345.0 1,585.4 2,036.7 3,623.3 Commercial/Institutional 664.8 608.8 421.3 309.7 284.7 Industrial 2,758.8 2,655.6 2,595.6 2,465.0 2,549.3 Site Remediation 0.4 0.5 1.0 10.4 20.2

78
Table C1
2003
Carbon Monoxide Point Source Emission Distribution (Tons/Year) Category 1999 2000 2001 2002 2003
MACT Processes Food and Agriculture Processes 0.0 0.0 0.0 0.0 0.0 Agricultural Chemical Production 0.0 0.0 0.0 0.0 0.0 Styrene or Methacrylate Based Resins 0.0 0.0 0.0 0.0 0.0 Cellulose Based Resins 0.0 0.0 0.0 0.0 0.0 Miscellaneous Resin Production 0.0 0.0 0.0 0.0 0.0 Alkyd Resin Production 0.0 0.0 0.0 0.0 0.0 Vinyl Based Resins 0.0 0.0 0.0 0.0 0.0 Miscellaneous Polymers 0.0 0.0 0.0 0.0 0.0 Fibers Production 0.0 0.0 0.0 0.0 0.0 Consumer Product Mfg Facilities 0.0 0.0 0.0 0.0 0.0 Miscellaneous Processes 0.0 0.0 0.0 0.0 0.0 Paint Stripper Use 0.0 0.0 0.0 0.0 0.0 Phthalate Plasticizers Production 0.0 0.0 0.0 0.0 0.0 Totals 120,905.9 122,702.0 96,970.4 99,173.4 88,366.6
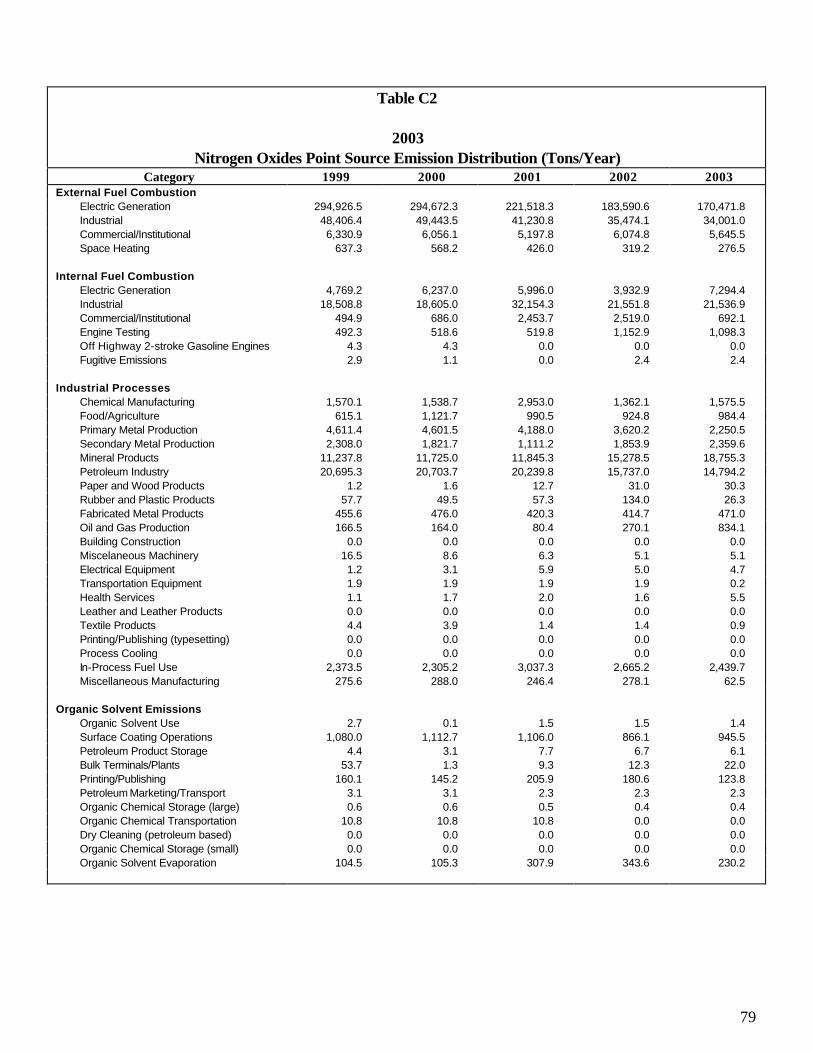
79
Table C2
2003
Nitrogen Oxides Point Source Emission Distribution (Tons/Year) Category 1999 2000 2001 2002 2003
External Fuel Combustion Electric Generation 294,926.5 294,672.3 221,518.3 183,590.6 170,471.8 Industrial 48,406.4 49,443.5 41,230.8 35,474.1 34,001.0 Commercial/Institutional 6,330.9 6,056.1 5,197.8 6,074.8 5,645.5 Space Heating 637.3 568.2 426.0 319.2 276.5 Internal Fuel Combustion Electric Generation 4,769.2 6,237.0 5,996.0 3,932.9 7,294.4 Industrial 18,508.8 18,605.0 32,154.3 21,551.8 21,536.9 Commercial/Institutional 494.9 686.0 2,453.7 2,519.0 692.1 Engine Testing 492.3 518.6 519.8 1,152.9 1,098.3 Off Highway 2-stroke Gasoline Engines 4.3 4.3 0.0 0.0 0.0 Fugitive Emissions 2.9 1.1 0.0 2.4 2.4 Industrial Processes Chemical Manufacturing 1,570.1 1,538.7 2,953.0 1,362.1 1,575.5 Food/Agriculture 615.1 1,121.7 990.5 924.8 984.4 Primary Metal Production 4,611.4 4,601.5 4,188.0 3,620.2 2,250.5 Secondary Metal Production 2,308.0 1,821.7 1,111.2 1,853.9 2,359.6 Mineral Products 11,237.8 11,725.0 11,845.3 15,278.5 18,755.3 Petroleum Industry 20,695.3 20,703.7 20,239.8 15,737.0 14,794.2 Paper and Wood Products 1.2 1.6 12.7 31.0 30.3 Rubber and Plastic Products 57.7 49.5 57.3 134.0 26.3 Fabricated Metal Products 455.6 476.0 420.3 414.7 471.0 Oil and Gas Production 166.5 164.0 80.4 270.1 834.1 Building Construction 0.0 0.0 0.0 0.0 0.0 Miscelaneous Machinery 16.5 8.6 6.3 5.1 5.1 Electrical Equipment 1.2 3.1 5.9 5.0 4.7 Transportation Equipment 1.9 1.9 1.9 1.9 0.2 Health Services 1.1 1.7 2.0 1.6 5.5 Leather and Leather Products 0.0 0.0 0.0 0.0 0.0 Textile Products 4.4 3.9 1.4 1.4 0.9 Printing/Publishing (typesetting) 0.0 0.0 0.0 0.0 0.0 Process Cooling 0.0 0.0 0.0 0.0 0.0 In-Process Fuel Use 2,373.5 2,305.2 3,037.3 2,665.2 2,439.7 Miscellaneous Manufacturing 275.6 288.0 246.4 278.1 62.5 Organic Solvent Emissions Organic Solvent Use 2.7 0.1 1.5 1.5 1.4 Surface Coating Operations 1,080.0 1,112.7 1,106.0 866.1 945.5 Petroleum Product Storage 4.4 3.1 7.7 6.7 6.1 Bulk Terminals/Plants 53.7 1.3 9.3 12.3 22.0 Printing/Publishing 160.1 145.2 205.9 180.6 123.8 Petroleum Marketing/Transport 3.1 3.1 2.3 2.3 2.3 Organic Chemical Storage (large) 0.6 0.6 0.5 0.4 0.4 Organic Chemical Transportation 10.8 10.8 10.8 0.0 0.0 Dry Cleaning (petroleum based) 0.0 0.0 0.0 0.0 0.0 Organic Chemical Storage (small) 0.0 0.0 0.0 0.0 0.0 Organic Solvent Evaporation 104.5 105.3 307.9 343.6 230.2

80
Table C2
2003
Nitrogen Oxides Point Source Emission Distribution (Tons/Year) Category 1999 2000 2001 2002 2003
Solid Waste Disposal Government 800.8 820.3 1,108.1 1,248.2 2,015.1 Commercial/Institutional 138.3 125.2 99.9 98.3 105.9 Industrial 665.1 666.4 706.1 669.2 826.0 Site Remediation 1.6 4.5 1.1 7.0 23.9 MACT Processes Food and Agriculture Processes 0.0 0.0 0.0 0.0 0.0 Agricultural Chemical Production 0.0 0.0 0.0 0.0 0.0 Styrene or Methacrylate Based Resins 0.0 0.0 0.0 0.0 0.0 Cellulose Based Resins 0.0 0.0 0.0 0.0 0.0 Miscellaneous Resin Production 0.0 0.0 0.0 0.0 0.0 Alkyd Resin Production 0.0 0.0 0.0 0.0 0.0 Vinyl Based Resins 0.0 0.0 0.0 0.0 0.0 Miscellaneous Polymers 0.0 0.0 0.0 0.0 0.0 Fibers Production 0.0 0.0 0.0 0.0 0.0 Consumer Product Mfg Facilities 0.0 0.0 0.0 0.0 0.0 Miscellaneous Processes 0.0 0.0 0.0 0.0 0.0 Paint Stripper Use 0.0 0.0 0.0 0.0 0.0 Phthalate Plasticizers Production 0.0 0.0 0.0 0.0 0.0 Totals 421,992.9 424,609.4 358,263.3 301,215.7 289,921.3

81
Table C3
2003
Particulate Matter Point Source Emission Distribution (Tons/Year) Category 1999 2000 2001 2002 2003
External Fuel Combustion Electric Generation 17,048.2 17,042.7 17,275.6 16,273.9 15,336.4 Industrial 5,272.8 3,788.7 3,116.0 2,980.2 2,938.6 Commercial/Institutional 884.2 861.6 714.9 773.7 746.6 Space Heating 25.6 22.4 22.8 20.0 10.8 Internal Fuel Combustion Electric Generation 294.8 392.0 624.2 188.2 634.4 Industrial 112.6 114.2 176.3 245.3 509.0 Commercial/Institutional 20.2 43.0 43.7 41.7 28.8 Engine Testing 38.1 39.6 39.6 62.0 46.6 Off Highway 2-stroke Gasoline Engines 0.1 0.1 0.0 0.0 0.0 Fugitive Emissions 0.1 0.0 0.0 0.0 0.1 Industrial Processes Chemical Manufacturing 4,121.5 3,934.0 3,299.0 3,253.8 2,876.1 Food/Agriculture 18,164.8 20,140.4 18,950.1 18,919.3 16,373.6 Primary Metal Production 6,460.6 6,539.9 5,408.2 3,897.2 2,942.3 Secondary Metal Production 7,741.9 7,599.3 6,334.8 4,728.6 4,788.1 Mineral Products 20,767.2 23,872.1 23,458.7 19,984.3 22,432.0 Petroleum Industry 2,929.3 2,930.1 3,061.1 2,442.1 2,540.6 Paper and Wood Products 780.6 800.3 451.7 327.5 306.9 Rubber and Plastic Products 608.5 688.1 663.8 580.4 521.2 Fabricated Metal Products 1,222.7 1,254.5 992.5 943.0 861.7 Oil and Gas Production 7.1 7.2 3.3 11.9 18.4 Building Construction 0.0 0.0 1.5 1.5 1.9 Miscelaneous Machinery 98.1 126.0 94.3 91.2 69.6 Electrical Equipment 25.4 13.0 37.9 24.3 21.4 Transportation Equipment 94.7 72.7 54.7 54.7 73.2 Health Services 1.9 4.2 14.8 31.4 858.0 Leather and Leather Products 48.7 48.7 50.5 4.3 4.3 Textile Products 10.2 10.2 10.4 12.4 2.9 Printing/Publishing (typesetting) 0.3 0.3 0.3 0.3 1.9 Process Cooling 16.2 24.3 259.9 342.3 352.1 In-Process Fuel Use 252.9 201.6 228.9 341.8 356.0 Miscellaneous Manufacturing 420.8 266.4 236.0 142.1 118.0 Organic Solvent Emissions Organic Solvent Use 48.6 14.7 9.3 20.0 16.1 Surface Coating Operations 965.1 996.5 564.5 642.0 744.7 Petroleum Product Storage 55.6 51.1 50.9 36.3 31.7 Bulk Terminals/Plants 3.4 3.4 3.0 3.2 3.0 Printing/Publishing 127.5 86.4 100.1 68.3 62.9 Petroleum Marketing/Transport 0.6 0.6 2.2 10.4 13.7 Organic Chemical Storage (large) 13.7 21.3 19.4 17.6 16.7 Organic Chemical Transportation 12.4 12.4 10.8 0.1 0.1 Dry Cleaning (petroleum based) 0.0 0.0 0.0 0.0 0.0 Organic Chemical Storage (small) 0.0 0.0 0.0 0.0 0.0 Organic Solvent Evaporation 52.4 46.6 67.0 109.9 74.1

82
Table C3
2003
Particulate Matter Point Source Emission Distribution (Tons/Year) Category 1999 2000 2001 2002 2003
Solid Waste Disposal Government 275.2 280.4 432.9 331.0 1,364.0 Commercial/Institutional 362.1 378.9 208.6 38.0 106.7 Industrial 642.7 675.3 217.2 386.9 331.6 Site Remediation 2.7 19.3 45.9 26.6 84.6 MACT Processes Food and Agriculture Processes 0.0 0.0 0.0 0.0 0.0 Agricultural Chemical Production 0.0 0.0 0.0 0.0 0.0 Styrene or Methacrylate Based Resins 5.0 5.0 5.4 5.5 5.5 Cellulose Based Resins 0.2 0.2 0.2 0.2 0.2 Miscellaneous Resin Production 0.0 0.0 0.0 3.4 3.9 Alkyd Resin Production 0.0 1.8 2.1 0.0 0.0 Vinyl Based Resins 276.3 276.3 285.3 240.0 243.1 Miscellaneous Polymers 0.9 1.2 1.2 3.2 3.4 Fibers Production 0.0 0.0 0.0 0.2 0.0 Consumer Product Mfg Facilities 0.7 0.0 0.0 0.3 0.3 Miscellaneous Processes 0.0 0.0 0.0 0.9 0.0 Paint Stripper Use 0.9 0.9 0.9 0.0 0.9 Phthalate Plasticizers Production 0.0 0.0 0.0 0.0 0.0 Totals 90,316.4 93,709.9 87,652.5 79,140.9 78,078.4
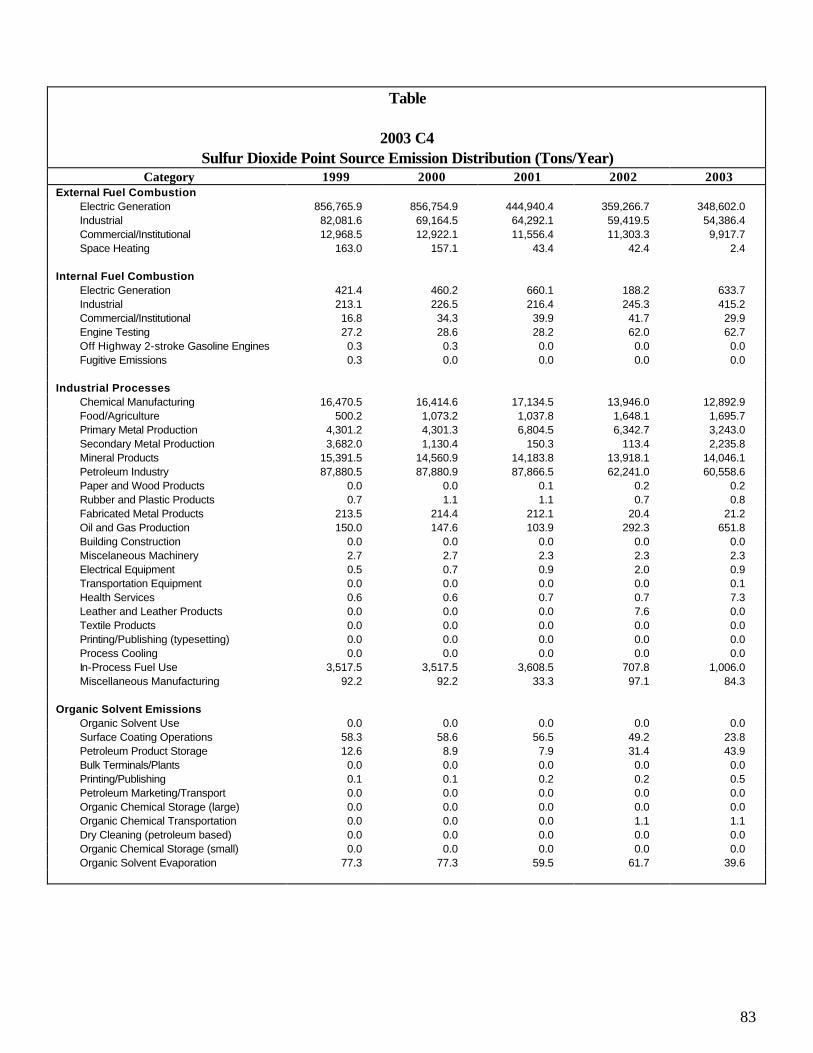
83
Table
2003 C4
Sulfur Dioxide Point Source Emission Distribution (Tons/Year) Category 1999 2000 2001 2002 2003
External Fuel Combustion Electric Generation 856,765.9 856,754.9 444,940.4 359,266.7 348,602.0 Industrial 82,081.6 69,164.5 64,292.1 59,419.5 54,386.4 Commercial/Institutional 12,968.5 12,922.1 11,556.4 11,303.3 9,917.7 Space Heating 163.0 157.1 43.4 42.4 2.4 Internal Fuel Combustion Electric Generation 421.4 460.2 660.1 188.2 633.7 Industrial 213.1 226.5 216.4 245.3 415.2 Commercial/Institutional 16.8 34.3 39.9 41.7 29.9 Engine Testing 27.2 28.6 28.2 62.0 62.7 Off Highway 2-stroke Gasoline Engines 0.3 0.3 0.0 0.0 0.0 Fugitive Emissions 0.3 0.0 0.0 0.0 0.0 Industrial Processes Chemical Manufacturing 16,470.5 16,414.6 17,134.5 13,946.0 12,892.9 Food/Agriculture 500.2 1,073.2 1,037.8 1,648.1 1,695.7 Primary Metal Production 4,301.2 4,301.3 6,804.5 6,342.7 3,243.0 Secondary Metal Production 3,682.0 1,130.4 150.3 113.4 2,235.8 Mineral Products 15,391.5 14,560.9 14,183.8 13,918.1 14,046.1 Petroleum Industry 87,880.5 87,880.9 87,866.5 62,241.0 60,558.6 Paper and Wood Products 0.0 0.0 0.1 0.2 0.2 Rubber and Plastic Products 0.7 1.1 1.1 0.7 0.8 Fabricated Metal Products 213.5 214.4 212.1 20.4 21.2 Oil and Gas Production 150.0 147.6 103.9 292.3 651.8 Building Construction 0.0 0.0 0.0 0.0 0.0 Miscelaneous Machinery 2.7 2.7 2.3 2.3 2.3 Electrical Equipment 0.5 0.7 0.9 2.0 0.9 Transportation Equipment 0.0 0.0 0.0 0.0 0.1 Health Services 0.6 0.6 0.7 0.7 7.3 Leather and Leather Products 0.0 0.0 0.0 7.6 0.0 Textile Products 0.0 0.0 0.0 0.0 0.0 Printing/Publishing (typesetting) 0.0 0.0 0.0 0.0 0.0 Process Cooling 0.0 0.0 0.0 0.0 0.0 In-Process Fuel Use 3,517.5 3,517.5 3,608.5 707.8 1,006.0 Miscellaneous Manufacturing 92.2 92.2 33.3 97.1 84.3 Organic Solvent Emissions Organic Solvent Use 0.0 0.0 0.0 0.0 0.0 Surface Coating Operations 58.3 58.6 56.5 49.2 23.8 Petroleum Product Storage 12.6 8.9 7.9 31.4 43.9 Bulk Terminals/Plants 0.0 0.0 0.0 0.0 0.0 Printing/Publishing 0.1 0.1 0.2 0.2 0.5 Petroleum Marketing/Transport 0.0 0.0 0.0 0.0 0.0 Organic Chemical Storage (large) 0.0 0.0 0.0 0.0 0.0 Organic Chemical Transportation 0.0 0.0 0.0 1.1 1.1 Dry Cleaning (petroleum based) 0.0 0.0 0.0 0.0 0.0 Organic Chemical Storage (small) 0.0 0.0 0.0 0.0 0.0 Organic Solvent Evaporation 77.3 77.3 59.5 61.7 39.6

84
Table C4
2003
Sulfur Dioxide Point Source Emission Distribution (Tons/Year) Category 1999 2000 2001 2002 2003
Solid Waste Disposal Government 216.9 218.5 301.0 331.0 640.8 Commercial/Institutional 36.2 36.1 37.6 38.0 45.4 Industrial 562.1 569.0 395.3 386.9 528.6 Site Remediation 3.2 3.2 22.4 26.6 27.1 MACT Processes Food and Agriculture Processes 0.0 0.0 0.0 472.6 472.6 Agricultural Chemical Production 0.0 0.0 0.0 0.0 0.0 Styrene or Methacrylate Based Resins 0.0 0.0 0.0 0.0 0.0 Cellulose Based Resins 0.0 0.0 0.0 0.0 0.0 Miscellaneous Resin Production 0.0 0.0 0.0 0.0 0.0 Alkyd Resin Production 0.0 0.0 0.0 0.0 0.0 Vinyl Based Resins 0.1 0.0 0.0 0.0 0.0 Miscellaneous Polymers 0.0 0.0 0.0 0.0 0.0 Fibers Production 0.0 0.0 0.0 0.0 0.0 Consumer Product Mfg Facilities 0.0 0.0 0.0 0.0 0.0 Miscellaneous Processes 0.0 0.0 0.0 0.0 0.0 Paint Stripper Use 0.0 0.0 0.0 0.0 0.0 Phthalate Plasticizers Production 0.0 0.0 0.0 0.0 0.0 Totals 1,085,828.3 1,070,058.3 653,797.5 531,342.7 512,320.6

85
Table C5
2003
Volatile Organic Material Point Source Emission Distribution (Tons/Year) Category 1999 2000 2001 2002 2003
External Fuel Combustion Electric Generation 1,247.4 1,235.9 1,337.5 1,342.2 1,461.3 Industrial 3,008.4 1,232.2 1,130.6 854.1 814.4 Commercial/Institutional 258.4 250.0 258.2 380.8 344.9 Space Heating 25.7 26.0 18.2 13.4 14.8 Internal Fuel Combustion Electric Generation 349.8 443.3 709.2 292.9 639.8 Industrial 2,000.7 1,979.2 1,932.4 1,022.2 1,066.1 Commercial/Institutional 35.3 79.8 139.1 122.1 78.1 Engine Testing 93.2 93.8 72.5 236.9 232.5 Off Highway 2-stroke Gasoline Engines 4.5 4.5 0.0 0.0 0.0 Fugitive Emissions 0.1 0.0 37.9 19.6 0.3 Industrial Processes Chemical Manufacturing 13,515.1 14,441.9 12,504.9 12,698.4 12,405.2 Food/Agriculture 8,662.8 10,503.5 9,942.7 10,503.8 10,885.9 Primary Metal Production 3,089.0 3,098.3 1,756.9 674.2 645.3 Secondary Metal Production 1,290.3 1,439.0 1,178.0 1,914.9 1,829.4 Mineral Products 1,331.1 1,661.9 1,476.9 1,694.3 2,543.6 Petroleum Industry 6,066.9 6,049.7 6,027.9 5,197.5 4,292.0 Paper and Wood Products 139.1 146.4 198.5 177.0 240.1 Rubber and Plastic Products 4,543.1 4,487.4 4,096.4 5,061.1 4,607.2 Fabricated Metal Products 1,446.5 1,470.1 1,743.6 1,545.4 1,290.8 Oil and Gas Production 574.3 720.9 564.0 252.5 465.7 Building Construction 0.0 0.0 0.0 0.0 0.0 Miscelaneous Machinery 113.0 114.7 31.3 28.7 25.8 Electrical Equipment 213.0 224.5 200.4 185.7 142.2 Transportation Equipment 21.8 26.3 26.3 40.4 267.8 Health Services 80.6 86.6 75.2 81.2 70.6 Leather and Leather Products 69.2 69.2 90.0 108.6 107.0 Textile Products 4.9 4.9 4.9 4.9 7.3 Printing/Publishing (typesetting) 0.0 0.0 0.0 0.0 0.0 Process Cooling 0.0 0.0 10.1 11.6 12.6 In-Process Fuel Use 232.8 235.1 329.7 180.4 141.5 Miscellaneous Manufacturing 301.2 354.5 332.8 287.5 261.7 Organic Solvent Emissions Organic Solvent Use 1,784.5 1,914.4 1,484.4 1,403.8 1,371.0 Surface Coating Operations 22,854.7 22,338.8 20,049.9 17,979.3 16,512.2 Petroleum Product Storage 5,805.0 5,773.7 5,214.4 5,058.6 4,684.1 Bulk Terminals/Plants 1,744.6 1,755.8 2,117.9 2,402.2 2,967.0 Printing/Publishing 10,930.4 11,028.1 11,517.9 9,012.0 10,062.2 Petroleum Marketing/Transport 1,221.5 1,250.8 1,319.1 1,519.7 1,413.0 Organic Chemical Storage (large) 769.4 1,184.3 1,147.5 1,222.3 1,042.7 Organic Chemical Transportation 64.3 69.8 40.2 38.6 29.0 Dry Cleaning (petroleum based) 361.6 389.0 380.7 457.7 550.9 Organic Chemical Storage (small) 1.9 1.9 1.9 2.9 1.0 Organic Solvent Evaporation 3,657.1 3,590.0 4,027.4 3,537.6 3,147.4

86
Table C5
2003
Volatile Organic Material Point Source Emission Distribution (Tons/Year) Category 1999 2000 2001 2002 2003
Solid Waste Disposal Government 215.4 232.0 253.8 352.3 685.8 Commercial/Institutional 68.8 64.9 57.2 32.5 46.5 Industrial 326.8 305.2 292.1 226.1 325.9 Site Remediation 454.0 595.9 659.0 990.7 1,131.0 MACT Processes Food and Agriculture Processes 0.1 3.2 3.0 42.8 42.8 Agricultural Chemical Production 16.0 1.7 1.8 1.7 0.0 Styrene or Methacrylate Based Resins 0.0 18.3 63.6 68.2 55.7 Cellulose Based Resins 0.0 0.0 0.0 0.0 0.0 Miscellaneous Resin Production 0.0 0.0 0.0 0.0 0.0 Alkyd Resin Production 28.6 32.5 221.8 228.5 239.8 Vinyl Based Resins 84.6 95.1 112.7 124.0 123.3 Miscellaneous Polymers 0.0 13.3 18.0 16.7 13.8 Fibers Production 0.3 0.3 0.3 0.3 0.0 Consumer Product Mfg Facilities 9.6 3.9 6.5 57.0 235.3 Paint Stripper Use 3.8 3.8 3.8 1.0 3.8 Miscellaneous Processes 0.0 0.0 6.5 3.8 1.4 Phthalate Plasticizers Production 0.0 0.6 0.6 0.7 0.0 Totals 99,121.32 101,146.9 95,221.1 90,013.5 89,579.3

87
Table C6
2003 Estimated County Stationary Point Source Emissions (Tons/Year)
County
Carbon
Monoxide
Nitrogen Oxides
Particulate
Matter
Sulfur Dioxide
Volatile Organic Material
Adams 273.0 297.1 485.2 758.0 2,043.8 Alexander 193.0 332.6 140.5 934.8 1,299.3 Bond 182.9 43.7 66.6 13.7 37.3 Boone 210.5 337.0 260.9 14.7 1,364.8 Brown 15.8 7.4 32.3 1.4 3.9 Bureau 42.7 94.5 300.0 37.0 245.5 Calhoun 0.6 0.7 34.6 0.0 0.0 Carroll 73.7 92.2 153.5 5.5 58.3 Cass 82.5 128.5 141.7 18.2 67.1 Champaign 2,450.2 2,190.8 690.0 710.4 1,258.5 Christian 1,122.2 19,765.0 568.5 16,429.7 262.4 Clark 11.1 8.3 110.1 1.1 123.3 Clay 39.6 109.7 88.8 17.4 226.8 Clinton 237.2 912.6 103.3 161.4 170.9 Coles 306.9 228.3 400.4 104.1 1,929.5 Cook 10,285.1 24,941.8 11,322.6 24,557.3 18,997.3 Crawford 981.9 4,362.7 777.2 19,034.4 1,258.4 Cumberland 16.7 3.3 102.0 0.4 16.4 DeKalb 114.5 107.0 244.1 30.1 401.9 DeWitt 131.7 58.3 235.3 16.7 121.3 Douglas 1,624.3 5,620.6 557.5 9,360.0 330.1 DuPage 1,732.7 2,127.6 861.8 335.5 2,020.4 Edgar 31.1 53.0 229.6 0.3 352.1 Edwards 2.2 2.2 50.7 0.0 112.6 Effingham 109.9 125.3 196.4 5.4 971.6 Fayette 128.8 467.6 249.3 213.1 253.7 Ford 160.0 331.7 390.6 258.6 662.6 Franklin 22.2 58.1 109.3 0.5 281.2 Fulton 359.5 5,117.7 614.0 11,501.2 63.8 Gallatin 4.5 18.1 127.7 6.4 7.5 Greene 0.4 1.5 92.9 0.0 33.4 Grundy 3,564.9 3,135.2 1,220.2 1,427.1 1,251.8 Hamilton 0.4 1.7 43.5 0.0 8.3 Hancock 46.7 32.7 230.8 8.4 16.1

88
Table C6
2003 Estimated County Stationary Point Source Emissions (Tons/Year)
County
Carbon
Monoxide
Nitrogen Oxides
Particulate
Matter
Sulfur Dioxide
Volatile Organic Material
Hardin 245.3 25.4 138.4 58.0 37.7 Henderson 0.4 0.0 152.6 0.0 3.4 Henry 1,392.0 3,597.8 315.9 26.5 382.7 Iroquois 53.4 65.4 546.4 4.8 310.1 Jackson 267.8 206.4 152.5 763.8 73.0 Jasper 1,067.1 5,237.6 1,089.8 17,843.9 175.1 Jefferson 427.5 93.1 763.7 291.1 683.4 Jersey 0.7 0.0 43.4 0.0 18.7 Jo Daviess 266.8 331.8 497.7 0.7 721.0 Johnson 45.2 38.4 101.6 370.3 24.4 Kane 928.1 1,244.7 1,070.6 255.7 2,314.8 Kankakee 1,089.1 3,739.5 893.4 33.3 1,520.6 Kendall 424.8 1,569.0 283.1 322.3 543.3 Knox 100.7 113.0 306.1 44.4 343.6 Lake 2,803.0 11,310.3 2,368.0 13,194.7 1,756.1 La Salle 4,615.3 6,617.1 3,559.3 5,179.0 1,929.7 Lawrence 10.9 44.7 84.9 49.1 89.4 Lee 179.8 110.1 339.3 8.9 489.7 Livingston 487.5 902.5 648.8 30.0 1,016.8 Logan 75.1 616.6 429.2 679.3 151.7 McDonough 78.7 329.9 216.4 761.5 118.7 McHenry 591.7 1,331.3 679.6 66.6 954.3 McLean 370.6 734.1 684.4 40.8 3,089.8 Macon 3,025.6 14,018.2 4,992.4 17,918.5 7,500.3 Macoupin 6.5 16.5 211.2 3.4 124.3 Madison 17,978.9 16,738.7 4,861.3 44,895.4 4,904.7 Marion 32.0 51.9 184.6 3.9 803.6 Marshall 38.3 298.2 358.6 3,894.5 151.6 Mason 150.9 56.7 372.6 67.1 57.5 Massac 1,882.7 11,728.3 2,162.6 24,121.9 350.5 Menard 0.7 0.8 53.7 0.0 16.4 Mercer 0.7 4.4 110.2 0.3 19.9 Monroe 4.0 10.8 106.5 0.1 33.1 Montgomery 758.0 15,668.1 921.1 47,221.0 138.9

89
Table C6
2003 Estimated County Stationary Point Source Emissions (Tons/Year)
County
Carbon
Monoxide
Nitrogen Oxides
Particulate
Matter
Sulfur Dioxide
Volatile Organic Material
Morgan 507.1 4,562.9 1,044.8 22,777.0 636.5 Moultrie 141.1 367.0 142.9 6.2 311.3 Ogle 542.8 363.4 692.1 44.9 2,048.1 Peoria 2,044.9 11,635.8 1,995.0 39,189.2 2,617.1 Perry 336.9 456.4 141.4 49.7 112.3 Piatt 92.8 989.2 183.1 0.7 135.1 Pike 199.7 1,601.6 447.6 1,574.6 67.5 Pope 0.0 0.0 0.0 0.0 2.1 Pulaski 22.4 61.8 198.4 101.0 20.7 Putnam 772.8 4,285.5 881.7 6,967.2 215.2 Randolph 1,888.0 22,473.9 3,627.5 26,240.7 353.4 Richland 0.7 3.1 20.1 0.4 100.8 Rock Island 1,332.7 1,034.3 926.0 3,103.4 1,534.7 St. Clair 1,141.8 891.9 1,645.5 1,530.3 2,477.4 Saline 39.0 15.5 355.3 1.3 38.8 Sangamon 943.1 10,385.6 875.4 10,820.4 357.7 Schuyler 5.4 6.1 98.7 0.0 12.6 Scott 47.8 126.8 128.3 22.6 7.1 Shelby 451.6 367.2 329.0 120.2 125.9 Stark 0.0 0.0 72.8 0.0 9.2 Stephenson 179.8 153.4 187.0 3.7 530.5 Tazewell 2,342.0 30,349.9 2,615.1 30,293.0 709.5 Union 33.8 43.2 129.6 679.0 17.2 Vermilion 726.7 2,542.8 1,514.1 17,642.3 2,735.8 Wabash 6.2 6.7 127.6 2.4 29.4 Warren 43.1 58.1 252.3 251.2 58.5 Washington 20.0 43.2 204.2 0.2 166.3 Wayne 363.5 902.2 68.8 445.0 111.9 White 48.4 113.2 91.8 0.3 146.8 Whiteside 176.9 197.6 428.1 17.9 170.6 Will 8,802.2 25,355.5 5,987.3 79,429.0 5,084.5 Williamson 240.9 1,573.0 407.9 6,815.0 276.3 Winnebago 907.0 981.5 1,098.0 78.0 1,163.3 Woodford 6.6 7.2 228.9 0.0 94.3

90
Table C7
Annual Estimated Emissions Trends (Tons)
Year
Carbon Monoxide
Nitrogen Oxides
Particulate
Matter
Sulfur Dioxide
Volatile Organic Material
1981 240,421 826,427 276,529 1,577,992 270,814 1982 163,704 693,054 184,716 1,404,040 233,951 1983 144,622 759,453 185,931 1,363,292 207,405 1984 110,922 746,367 204,490 1,435,066 197,418 1985 107,876 715,556 174,102 1,406,300 191,070 1986 109,777 676,181 164,246 1,400,761 180,148 1987 98,213 644,511 166,292 1,379,407 176,406 1988 127,758 653,521 162,124 1,393,628 165,792 1989 132,214 610,214 212,778 1,254,474 193,499 1990 134,744 623,466 266,888 1,272,445 170,378 1991 148,667 619,161 220,903 1,239,690 154,008 1992 129,054 610,214 163,529 1,228,949 156,867 1993 130,097 556,460 142,123 1,170,549 152,288 1994 127,848 555,893 133,275 1,158,555 140,492 1995 127,661 505,966 119,726 1,273,786 141,381 1996 130,040 495,267 105,842 1,183,278 139,445 1997 117,046 510,729 100,038 1,197,404 136,541 1998 108,117 509,676 99,619 1,196,461 134,924 1999 120,906 421,993 90,316 1,085,828 99,121 2000 122,702 424,609 93,710 1,070,058 101,147 2001 96,970 358,263 87,652 653,797 95,221 2002 99,173 301,216 79,141 531,343 90,014 2003 88,367 289,921 78,078 512,321 89,579
Table C8
Annual Source Reported Emissions Trends (Tons)
Year
Carbon Monoxide
Nitrogen Oxides
Particulate
Matter
Sulfur Dioxide
Volatile Organic Material
1992 112,394 38,1940 95,653 1,045,102 143,852 1993 113,777 41,8211 90,153 1,001,125 108,847 1994 116,183 40,4488 88,829 967,215 108,897 1995 160,247 36,6980 67,039 814,230 103,143 1996 84,282 40,7680 63,693 914,297 87,263 1997 71,360 40,4251 57,451 974,234 76,232 1998 79,313 37,7201 61,395 964,264 77,836 1999 80,126 36,0651 56,117 863,660 71,317 2000 80,044 32,8925 55,681 620,456 70,862 2001 76,023 29,1165 53,178 528,219 62,398 2002 82,230 26,2057 49,504 499,284 70,441

91
APPENDIX D
THE BUREAU OF AIR/ DIVISION OF AIR POLLUTION CONTROL
Organization and Programs The Bureau of Air consists of two divisions: the Division of Air Pollution Control and the Division of Vehicle Inspection and Maintenance. The focus of this section is on the programs of the Division of Air Pollution Control which is responsible for developing, implementing and enforcing regulations to assure that the air we breathe is clean and healthful. This mission is accomplished by finding, correcting and controlling air pollution hazards. The Division of Air Pollution Control also works to prevent air quality problems from occurring in areas which have clean air. The basic strategy to improve air quality is to control the pollutants which are emitted by industry and motor vehicles. This strategy requires the IEPA to monitor the air, identify emission sources, impose limitations on the amount of emissions which can be released to the air and take the necessary enforcement action against violators. The Division of Air Pollution Control is divided into five sections: Air Monitoring, Air Quality Planning, Compliance and Enforcement, Permits, and Field Operations. Each of these sections is briefly described below.
Air Monitoring
The Division of Air Pollution Control operates a statewide air quality monitoring network which includes more than 200 monitors. The Air Monitoring Section is responsible for the maintenance of this network, which operates year round monitoring the quality of the air that we breathe. The IEPA monitors the air for a variety of pollutants including particulate matter, sulfur dioxide, ozone, carbon monoxide, lead and
nitrogen dioxide. Specialized sampling projects for other hazardous pollutants are also conducted by the Air Monitoring Section. Illinois residents can be proud of the IEPA's record of efficiency in data collection. The system ranks as one of the best in the nation with over 90 percent efficiency in the collection of high quality data. This high efficiency rate guarantees that the network is operating with a minimum amount of "down-time" thereby providing the IEPA with a complete and accurate description of air quality in Illinois. The Air Monitoring Section is also responsible for validating and summarizing the data in this report. It provides notification of air quality exceedances and issues any episodes as required. Special air quality studies are performed which identify pollution trends and evaluate special air quality problems.
Air Quality Planning The Air Quality Planning Section is responsible for developing Agency programs which are designed to achieve and maintain National Ambient Air Quality Standards and to prevent deterioration of air quality. This is accomplished by:
•• Assessment of strategies and technologies for the elimination or reduction of air pollutant emissions.
•• Conducting and reviewing detailed air
quality studies using computerized air quality models.
•• Proposing and supporting regulatory
revisions where they are necessary to attain or maintain healthful air quality.
92
•• Coordination with local planning agencies to ensure compatibility of air quality programs between state and local jurisdictions.
• Coordination of the Bureau’s Stationary
Source Inventory.
Compliance and Enforcement
The Compliance and Enforcement Section provides Management oversight for all aspects of the compliance program. The work of the section is currently focused on the following areas: • Formulating and interpreting policy
regarding the Bureau’s Air Pollution Compliance and Enforcement Program.
• Coordinating the Air Pollution
Compliance and Enforcement Program with USEPA’s Compliance and Enforcement Program.
• Coordinating, through the Bureau’s
Compliance Decision Group, the work of the Bureau’s staff in order to provide an effective and efficient compliance program.
• Evaluate the Annual Emission Reports
provided by Illinois industry. • Oversees the source emissions
monitoring program including continuous emission monitors (cems), stack testing, and escess emissions reporting
Permits Permits are required in Illinois prior to construction and operation of emission sources and control equipment. The permit program provides a consistent and systemic way of ensuring that air emission sources are built and operated in compliance with air pollution control regulations.
In a permit application the IEPA requires: a description of the emission source, a list of types and amounts of the contaminants which will be emitted, and a description of the emission control equipment to be utilized. This information is used to determine if the emissions comply with standards adopted by the Illinois Pollution Control Board. Operating permits are granted for periods up to five years, after which they must be renewed. Operating permits for smaller facilities may run indefinitely. When a facility constructs a new emission source or makes modifications to existing emission sources, it must apply for a new construction permit. Large sources also need a Federal Operating Permit which is administered by the IEPA. Under the Clean Air Act Permit Program (CAAPP) these large sources will be required to consolidate all of their existing State operating permits into one permit which will be available for public review and is subject to Federal oversight.
Field Operations The Field Operations Section investigates sources of air pollution and works with industry to control air pollution. The major functions of the Field Operations Section include locating and identifying sources of air pollution, determining the amount of pollution emitted and verifying the information which industry submits when applying for a permit. Field Operations also initiates much of the IEPA's enforcement activities when violations are discovered. Approximately 3,000 investigations and inspections are conducted each year.

93
Table D1
BUREAU OF AIR
Dave Kolaz, Bureau Chief (217) 785-4140
DIVISION OF AIR POLLUTION CONTROL
Laurel Kroack, Division Manager (217) 785-4140
AIR MONITORING SECTION
Terry Sweitzer, Manager (217) 782-5811
AIR QUALITY PLANNING SECTION
Rob Kaleel, Manager (217) 524-4343
COMPLIANCE AND ENFORCEMENT SECTION
Julie Armitage, Acting Manager (217) 782-5811
PERMITS SECTION
Don Sutton, Manager (217) 782-2113
FIELD OPERATIONS SECTION
Ed Bakowski, Manager (217) 785-2011
Harish Narayen Dean Hayden, Acting John Justice Region I Region II Region III 9511 W. Harrison Street 5415 North University 2009 Mall Street Des Plaines, Illinois 60016 Peoria, Illinois 61614 Collinsville, Illinois 62234 (847) 294-4000 (309) 693-5461 (618) 346-5120

![Home [epa.state.il.us]epa.state.il.us/water/conservation/lake-notes/shoreline-buffer.pdf · state guidance for stream buffers observed a range of 20 to 200 feet (with a median width](https://img.dokumen.tips/doc/110x75/5f7113239cbb77150b3f0eb1/home-epastateilusepastateiluswaterconservationlake-notesshoreline-.jpg)


![Home [epa.state.il.us]epa.state.il.us/.../conservation/lake-notes/canada-geese.pdf · 2009. 6. 17. · Modify Your Shoreline: Canada geese don't like to nest in or walk through tall](https://img.dokumen.tips/doc/110x75/5fdee73fbf356779ee0aa1f9/home-epastateilusepastateilusconservationlake-notescanada-geesepdf.jpg)