Embed Size (px)
Citation preview

2002 Summer Undergraduate Research Program Musculoskeletal Research Center
Table of Contents
A Letter from the Editors Foreword: Savio L-Y. Woo, Ph.D., D.Sc. Erdrin Azemi
Quantifying the Structural Properties of the Clavicle and the Coracoid Process of the Acromioclavicular Joint During Bending
C
C
T
J
R
D
M
K
N
K
M
J
hristina Casella
Subject Specific Geometric Modeling of the FATC for Finite Element Analysisasey Castner Comparison of the Quadrant and Clock Methods for Femoral Tunnel Positioning in ACL Reconstruction
homas Christophel Force Production of the Thumb in Multiple Directions
onita Cutts Validation and Description of Glenohumeral Kinematics Collected During a Clinical Test
ebecca Hrutkay Inflammatory and Proliferation Reponses of Tenosynovial Fibroblasts to Cyclic Mechanical Stretching
aphne Kontos Development of a Calibration Plate in Order to Validate the Function of a UFS
organa Martin A Study of Controlled Release of Vanadate and its Effect on Fibroblast Proliferation
risten Moffat New Clamp Design for Rat Medial Collateral Ligament Tensile Testing
icole Paga Cyclic Stretching Increases 5-Lipoxygenase Activity and Leukotriene B4 Production: An Implication of Tendinopathy
atherin Peperzak Development of a Dynamic Culture Force Monitor to Study Cell Mechanobiology
ara Schenker Antisense Treatment of Both Healing and Normal Rat Medial Collateral Ligament Fibroblasts: A Method Study
ohn Solic Which Muscles Have the Greatest Potential to Contribute to Glenohumeral Stability? A Stability Index for the Muscular Stabilizers of the Shoulder

2002 EDITORS
Thirteen of us started our internships at the MSRC in May. We are the largest group of summer students so far with eleven females and two very lucky males. Throughout the summer, we have learned a lot and we will remember this experience for the rest of our lives. With the MSRC’s diversity in culture, language, and educational background, we have been exposed to many different types of people. Some of us have learned bits of Chinese, Russian, Japanese, and Spanish while others have taught some English. In addition to learning anatomy and engineering, we have made new friends, tried new foods, and had a wonderful overall experience. We would like to thank all of our knowledgeable mentors for guiding us through the summer and for their patience and support. Also, thanks to Dr. Debski for providing us with a well organized summer internship. Finally, we would like to thank Dr. Woo for allowing us to spend our summer at the MSRC. The standard of excellence at the lab is very high and over the summer, we have strived to reach this standard. Thank you, Dr. Woo, for challenging us and for providing us with an unforgettable experience. Mara, Casey, Jonita, and Daphne

FOREWORD
Savio L-Y. Woo, Ph.D., D.Sc. Ferguson Professor and Director
Musculoskeletal Research Center, Department of Orthopaedic Surgery It is a distinct pleasure to write a few words for our Summer Undergraduate Research Program, not because it is getting bigger, but rather because it is getting better. The students have worked on projects relating to their background and interest in the fields of functional tissue engineering and gene therapy, as well as robotics technology. Each student was assigned a graduate student or post-graduate research fellow as his/her mentor, and, as a result, everyone performed in an outstanding manner. This year, 12 students from Carnegie Mellon University, the University of Akron, Rochester Institute of Technology, and the University of Pittsburgh joined us. A few of them had only completed their freshman and sophomore years, but many are going to be seniors. They major in Biology, Biotechnology, Material Science, Neuroscience, Computer Science, and, of course, Mechanical and Biomedical Engineering. Five students are funded by the Biomedical Engineering Program, two by the Pittsburgh Tissue Engineering Institute, and the remaining five by the Musculoskeletal Research Center (MSRC). Such diversity befits the current emphasis at the MSRC. Our summer program, under the guidance and leadership of Dr. Richard Debski, has resided on his three key words: education, productivity, and fun – which culminated in the Symposium on July 18, 2002, where every student presented his/her results. I was most impressed with the content and the quality of their presentations – a reflection that they all have been well educated on the process of research, are productive in gathering data, and they all have fun doing their projects. Therefore, I am delighted to bestow each student a special award. And the awards are as follows:
Ms. Casey Castner “Clinical Relevance Award” Ms. Erdrin Ezemi “New Idea Award” Ms. Jonita Cutts “Engineering Award” Mr. Tom Christophel “Clinical Study Award” Ms. Nicole Paga “Appreciation of Literature Award” Ms. Mara Schenker “Animation and Presentation Award” Ms. Morgana Martin “Frontier of Science and Engineering Award” Ms. Rebecca Hrutkay “Promising Hypotheses Award” Ms. Kat Peperzak “Super Kitty Award” Ms. Kristen Moffat “Design Award” Ms. Daphne Kontos “Validation and Accuracy Award” Ms. Christina Casella “Numerical Modeling Award”
I trust that, after reading the contents in this volume, you will find that all of our students have exhibited true potential for becoming quality scientific investigators. This is really a tribute not only to them, but also to the efforts and guidance of their laboratory mentors: Mr. Andrew Van Scyoc, Mr. Ryan Costic, Ms. Susan Moore, Dr. Zhaozhu Li, Dr. Fengyan Jia, Ms. Jinhong Zhu, Mr. Steve Abramowitch, Mr. Shon Darcy, and Dr. Yuhua Song. All deserve special acknowledgements for their dedication, and for being caring teachers. To conclude, we wish to thank the Biomedical Engineering Program at the University of Pittsburgh and Carnegie Mellon University, through Ms. Hilda Diamond, for their strong collaboration and financial support. I thank the faculty members at the MSRC, Dr. Patrick McMahon, Dr. James Wang, and Dr. Zong-Ming Li, for their unwavering dedication, participation, and guidance in this very important endeavor. We are proud of our students and their mentors, and hope that their experience will serve as a spark to ignite their scientific curiosity, or as a pleasing appetizer so that they will want to taste the main dish of musculoskeletal research. Finally, I thank Dr. Debski for making this program a great success and enhancing our summer with many challenges and much laughter.

Erdrin Azemi Erdrin Azemi University of Pittsburgh University of Pittsburgh
[email protected] [email protected] Shoulder Group Shoulder Group
Lab Mentor: Ryan Costic, B.S. Lab Mentor: Ryan Costic, B.S. Faculty Advisor: Richard Debski, Ph.D. Faculty Advisor: Richard Debski, Ph.D.
I was born in Tirana, Albania on November 10th, 1981. After living
there for 15 years, my family and I decided to move to the United States.
New Orleans was the first destination of my journey. After a year in New
Orleans, I got tired of the French Quarter and the hot weather, so I decided
to join my family in Pittsburgh, PA. I have been interested in medicine
since I was a little kid. As I grew older, I gained a fondness for engineering.
Being interested in both fields, I decided to major in bioengineering at the
University of Pittsburgh.
The University of Pittsburgh has been such a good experience for me. I am an active member of the
Biomedical Engineering Society, and an engineering honor student. While I am not studying or working at
the MSRC, I enjoy playing soccer, pool, going to the gym and hanging out with my friends. Also, I like
reading a good book or magazine to relax.
After finishing my undergraduate studies, I plan to apply to graduate school for my PhD in
Bioengineering. I really like doing research, and I hope to follow in the footsteps of the many doctors at this
research center, creating the future out of the present. My summer experience at the MSRC was
unforgettable. I liked the challenge and determination that this research center offers. I want to thank my
mentor, Ryan Costic, for his patience and helpful suggestions throughout my project. Thanks to Dr. Debski
for giving me the opportunity to work at the MSRC, and for always being available to answer my questions
and give me advice. Most importantly thank you to Dr. Woo for his guidance this summer. Through his
example, I have learned how to be a kind and altruistic person. Also, I would like to thank my parents for
all their loving sacrifices each and everyday of my life. Last but not least, I would like to thank the whole
MSRC family, especially the Shoulder Group and Colleen.

QUANTIFYING THE STRUCTURAL PROPETIES OF THE CLAVICLE AND THE CORACOID PROCESS OF THE ACROMIOCLAVICULAR JOINT
Erdrin Azemi, Ryan S. Costic, Mark W. Rodosky, Richard E. Debski
Musculoskeletal Research Center
Department of Orthopaedic Surgery University of Pittsburgh
OBJECTIVE INTRODUCTION The objective of this study was to calculate two
structural properties; the bending stiffness and the flexural rigidity, of the clavicle and the coracoid process during cantilever bending.
During active participation in sports such as hockey, football, rugby, and mountain biking, the coracoclavicular (CC) ligaments of the shoulder are commonly ruptured when a blunt force drives the scapula inferiorly with respect to the clavicle [1]. The CC ligaments are composed of the trapezoid and the conoid ligaments, and are thought to be the prime suspensatory ligaments of the shoulder. Each ligament is thought to play a significant but different role in providing acromioclavicular (AC) joint stability [2, 3].
METHODS Seven once fresh-frozen human cadaveric shoulders
(mean age = 45 ± 14), and six twice frozen scapula and clavicle bones (mean age = 48 ± 10) were dissected free of all soft tissue. The specimens were potted in epoxy putty and were rigidly fixed with custom aluminum fixture blocks to a material testing machine (Instron, Model 4502).
Type III AC joint injuries occur when the AC capsule and the CC ligaments are both ruptured. The standard treatment for Type III injury remains controversial [4].
A current study is utilizing a novel technique to anatomically reconstruct the CC ligament complex using a semitendinosus tendon graft (Figure 1). In this study the researchers are determining the viscoelastic and structural properties of the CC ligament complex and the novel tendon reconstruction complex.
The specimens were kept moist with saline throughout testing. All tests were performed with a cross-head speed of 5mm/min and initial preload of 2N. Each specimen was preconditioned for 10 cycles from 0 to 0.1mm by applying a transverse load with a custom made indenter. Structural properties were evaluated applying a 150N transverse load to the bones. This protocol was repeated on three different points on the clavicle, and two different points on the coracoid. The first load was applied to the first hole close to the epoxy putty, the second load was applied to the second hole, one centimeter distal to the first hole, and the third load was applied approximately one centimeter distal to the second hole on the clavicle (Figure 2). The same protocol was repeated on the coracoid but only for two points as the testing set-up allowed. The bones were allowed to rest 30 minutes between each loading condition.
A BClavicle Clavicle
Coracoid Coracoid
Figure 1: A) CC ligament complex The distance of the holes (points) where load was applied was measured using a ruler. Two distances were measured: 1) from the epoxy putty and 2) from the tip of the clavicle or coracoid. The thickness and width of each point where load was applied, was measured using a caliper. The cross-sectional area was calculated assuming a hollow elliptical shape for the clavicle and a circular shape for the coracoid.
B) Novel semitendinosus tendon reconstruction To fully understand the role of each component of the
novel tendon reconstruction complex, the structural properties of the clavicle, coracoid and tendon complex must be determined to report the structural properties of the tendon complex (Equation 1).
In addition, determining the structural properties and the flexural rigidity of these bones will help establish the optimal placement of the holes used in novel tendon reconstructions.
The structural properties of the clavicle and the coracoid were derived from the load-displacement curve. The flexural rigidity was calculated by a derived equation. A paired student’s t-test was used to compare the data achieved from the once-frozen specimens. An unpaired student’s t-test was used to compare the structural properties between the once frozen and twice frozen specimens. The statistical significance was set at p<0.05.

RESULTS Normal load-displacement curves for the clavicle are
shown in Figure 3. It was observed that moving the point of load application more distally in the once frozen specimens, the bending stiffness of the clavicle significantly decreased 34% from Point 1 (P1) to Point 2 (P2), 28% from P2 to P3, and 46% from P1 to P3 (p<0.05). The bending stiffness of the coracoid increased 17% from P1-P2, however there was not a significant difference between these two points (p>0.05, Table 1).
The bending stiffness of the clavicles of the twice frozen specimens significantly decreased 16% from P1-P2, 19% from P2-P3, and 32% from P1-P3 (p<0.05). The bending stiffness of the coracoid in the twice frozen specimens, differing from the coracoids of the once frozen specimens, decreased 47% from P1-P2, and there was not a significant change between these two points (p>0.05, Table 1).
The bending stiffness was observed to decrease from the once frozen (1F) specimens to the twice frozen (2F) specimens (Table 1). The bending stiffness of the clavicle at P1 and P2 significantly decreased 46% and 34% from 1F to 2F, respectively (p<0.05). The clavicle P3 showed a similar decrease in bending stiffness of 23% from 1F to 2F although not significant (p>0.05).
The bending stiffness of the coracoid at P1 decreased 34% from 1F to 2F (p>0.05), and at P2 there was a significant decrease of the bending stiffness by 70% from 1F to 2F (p<0.05).
Flexural rigidity is still being determined and analyzed.
DISCUSSION The structural properties of the clavicle and the
coracoid process were characterized in this study.
It was observed and expected that the bending stiffness
of the clavicle decreased as the applied load during cantilever bending was moved more distally on the clavicle (Figure 3). This suggests that during common surgical procedures, the placement of CC ligament repairs or reconstructions should align longitudinally with the base of the coracoid to assure maximum stiffness of the clavicle. The placement of repairs or reconstructions on the coracoid does not have a significant effect on the stiffness of the coracoid.
The stiffness of both the clavicle and coracoid were shown to decrease after a second freezing period. This finding should be taken into consideration during future studies to ensure proper determination of the properties of the clavicle and coracoid process.
The data obtained from this study will provide basic knowledge to improve the placement of holes in the clavicle and the coracoid process during novel reconstructions of Type III injuries.
Clavicle Bending Curves
0
20
40
60
80
100
120
140
160
0 0.5 1 1.5 2 2.5 3 3.5 4Displacement (mm)
Load
(N)
P1P3P2
Figure 3: Typical Clavicle Bending Curves
REFERENCES 1. Vangura Jr., A, et al.: TORS, 2002. 2. Debski RE, et al.: TORS, 24-2:378, 1999. 3. Fuduka K, et al.: JBJS, 68A: 434-439, 1986. 4. Rodosky: CORR, 325-30:12, 2001.
ACKNOWLEDGEMENTS Thank you to Dr. Debski and Ryan Costic for their help
and supervision throughout this project. The support of the Aircast Foundation, the shoulder group and the whole MSRC family is greatly appreciated.

Christina Casella
Carnegie Mellon University [email protected]
ACL Group Lab Mentor: Yuhua Song, Ph.D.
Faculty Advisor: Savio L-Y. Woo, Ph.D., D.Sc.
I was born in San Diego, CA on February 17, 1981. When I was
two years old my mother and I moved to Phoenix, AZ where I graduated
from Shadow Mountain High School. At Shadow Mountain, I was involved
in volleyball, basketball, and soccer. Although I was involved in several
sports, volleyball has always been my favorite. My senior year in high
school I went on several volleyball recruiting trips to universities that were
interested in having me play for their team. I had a lot of fun visiting the
volleyball team at Carnegie Mellon University. I chose to attend Carnegie Mellon not only for their
volleyball team but for their excellent engineering program.
At CMU, I am majoring in Mechanical Engineering and I will also have a minor in Business. My
summer internship last summer introduced me to Biomechanics. Since this internship, I have become very
interested in Biomedical Engineering. At CMU, I am a member of the women’s varsity volleyball team.
Last season we were ranked 20th in the nation for division III volleyball and qualified to go to the NCAA
tournament where we were defeated in the second round.
After I graduate in 2003 I hope to attend graduate school to get my masters in Biomedical
Engineering. I would like to thank the MSRC for giving me the opportunity to work in a prestigious lab.
Specifically, I would like to thank my mentor, Dr. Song, and the entire ACL group.

SUBJECT SPECIFIC GEOMETRIC MODELING OF THE FATC FOR FINITE ELEMENT ANALYSIS
Christina Casella, Yuhua Song , Tomoyuki Sasaki, Richard Debski, Savio L-Y. Woo
Musculoskeletal Research Center
Department of Orthopaedic Surgery University of Pittsburgh
INTRODUCTION
The anterior cruciate ligament (ACL) restrains anterior tibial translation and limits varus-valgus and axial tibial rotations. Absence of a functional ACL can lead to severe joint instability [1]. In order to improve ACL reconstruction procedures, clinically relevant data must be collected to understand the mechanism of ACL injury.
A finite element model of the femur-ACL-tibia complex (FATC) can determine stress-strain distribution within the ACL under complex loading conditions. Analysis of stress-strain distribution within the ACL requires accurate information on the geometry of the femur, ACL and tibia. A Previous study by Harner et al. [2] looked at the cross sectional shape and area of the ACL. In a later study, Harner et al. [3] used a digitizing system to quantify ACL insertion sites on the femur and tibia. Martelli et al. [4] developed a model of the ACL composed of 10 curvilinear fibers corresponding to the surface of the ligament.
OBJECTIVE
The objective of this project was to obtain subject specific geometry of the FATC for analyzing the force and stress distribution of the ACL. First, subject specific geometry of the femur, ACL and tibia were reconstructed individually. Second, these individual geometries were combined to form a model of the entire FATC.
METHODS One fresh-frozen porcine knee was thawed overnight.
Plexiglas blocks (registration blocks) machined to tolerances of ±0.01mm were rigidly fixed to the femur and tibia. Images of the intact knee were obtained from a CT scan with pixel size 0.4mm × 0.4mm × 1mm. All soft tissue and bony contact between the femoral condyles and tibial plateaus were removed so that only the FATC remained. A second CT scan, pixel size 0.3mm × 0.3mm × 1mm, was taken with the FATC fixed at full extension. The images from both CT scans were imported into the MIMICS computer software (Materialise, Ann Arbor, MI). The femur and tibia were modeled from images of the first CT scan of the intact knee and the ACL was modeled from images of the second CT scan of the FATC. In order to generate a model of the entire FATC the geometry information obtained from both CT scans needed to be related, this was done via the registration blocks on the femur and tibia.
In order to create an entire model of the FATC the 3D models of the femur, tibia and ACL were exported from MIMICS to Patran software (MSC software Co. Los Angeles, CA). A neutral file with coordinate and mesh
information was exported from Patran. A matlab program was used to multiply the coordinate information by a transformation matrix and create a new neutral file of transformed coordinates. This transformed neutral file was then imported back into Patran and an entire model of the FATC was formed.
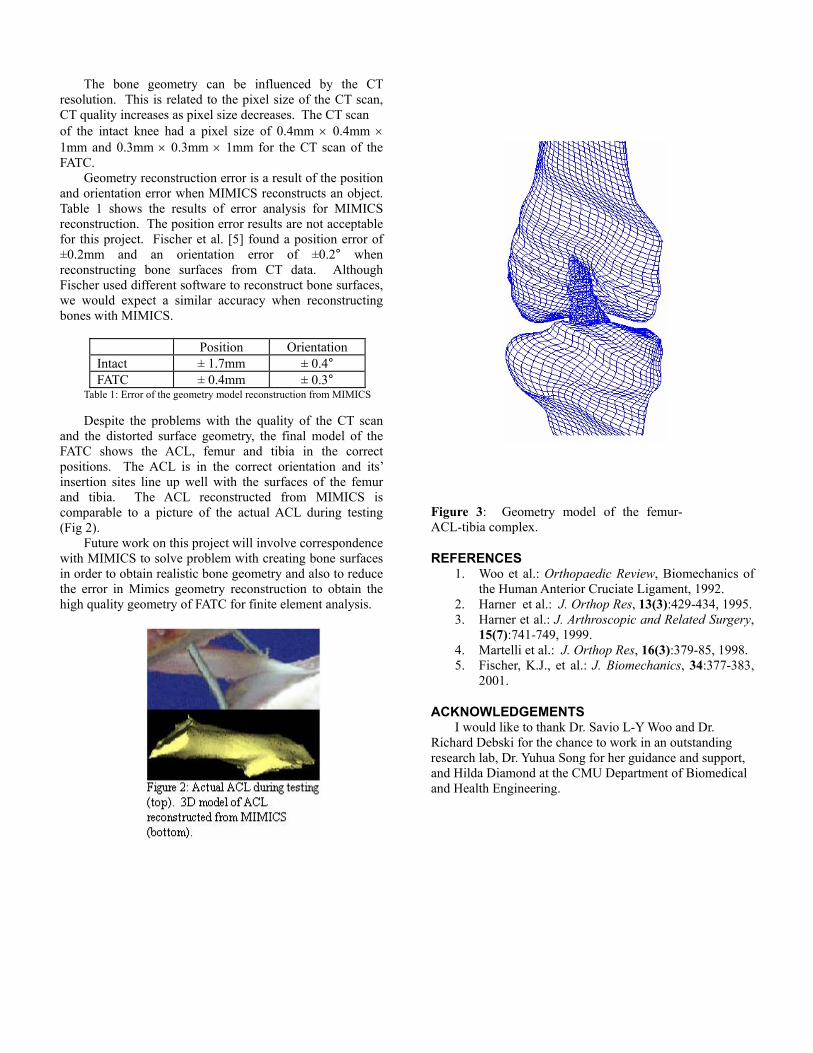
RESULTS In the finite element model of the FATC the femur and
tibia were treated as rigid bodies. It was necessary that the geometric models of the femur and tibia were surfaces. These surfaces were created from the 3D models in MIMICS using polylines. After the 3D models of the femur and tibia were reconstructed, polylines were drawn around the perimeter of each slice. In figure 1, one slice of the intact CT scan of the femur with polylines around the perimeter, is shown. The polylines from each slice were put together to form a surface of the femur, also shown in figure 1. The ACL reconstructed from the second CT scan is shown in figure 2 along with an actual picture of the ACL during testing. A posterior view of the entire FATC model is shown in figure 3.
DISCUSSION By comparing the 3D model of the femur to the surface
model (Fig 1) it is apparent that the surface model has distorted geometry. This distorted geometry occurred during the process of converting the 3D model into a surface using polylines. This could be a result of the orientation of the knee during the CT scan, CT resolution, or MIMICS reconstruction error.
The bone geometry can be influenced by the CT
resolution. This is related to the pixel size of the CT scan, CT quality increases as pixel size decreases. The CT scan of the intact knee had a pixel size of 0.4mm × 0.4mm × 1mm and 0.3mm × 0.3mm × 1mm for the CT scan of the FATC.
Geometry reconstruction error is a result of the position and orientation error when MIMICS reconstructs an object. Table 1 shows the results of error analysis for MIMICS reconstruction. The position error results are not acceptable for this project. Fischer et al. [5] found a position error of ±0.2mm and an orientation error of ±0.2° when reconstructing bone surfaces from CT data. Although Fischer used different software to reconstruct bone surfaces, we would expect a similar accuracy when reconstructing bones with MIMICS.
Position Orientation Intact ± 1.7mm ± 0.4° FATC ± 0.4mm ± 0.3°
Table 1: Error of the geometry model reconstruction from MIMICS Despite the problems with the quality of the CT scan
and the distorted surface geometry, the final model of the FATC shows the ACL, femur and tibia in the correct positions. The ACL is in the correct orientation and its’ insertion sites line up well with the surfaces of the femur and tibia. The ACL reconstructed from MIMICS is comparable to a picture of the actual ACL during testing (Fig 2).
Future work on this project will involve correspondence with MIMICS to solve problem with creating bone surfaces in order to obtain realistic bone geometry and also to reduce the error in Mimics geometry reconstruction to obtain the high quality geometry of FATC for finite element analysis.
igure 3: Geometry model of the femur-
REFERENCES l.: Orthopaedic Review, Biomechanics of
2. 95.
4. op Res, 16(3):379-85, 1998.
ACKNOWLEDGEMENTS avio L-Y Woo and Dr.
Rich g t,
FACL-tibia complex.
1. Woo et athe Human Anterior Cruciate Ligament, 1992. Harner et al.: J. Orthop Res, 13(3):429-434, 19
3. Harner et al.: J. Arthroscopic and Related Surgery, 15(7):741-749, 1999. Martelli et al.: J. Orth
5. Fischer, K.J., et al.: J. Biomechanics, 34:377-383,2001.
I would like to thank Dr. Sard Debski for the chance to work in an outstandin
research lab, Dr. Yuhua Song for her guidance and supporand Hilda Diamond at the CMU Department of Biomedical and Health Engineering.

Casey Castner
The University of Akron [email protected]
ACL Group Lab Mentor: Andy Van Scyoc, B.S.
Faculty Advisor: Savio L-Y. Woo, Ph.D., D.Sc.
Born on November 15, 1982, I grew up in the city of Green just
south of Akron, OH. After graduating from high school in May 2001, I
began pursuing a biomedical engineering degree at the University of Akron.
I have one younger brother, Ryan, who has Down Syndrome. It is because
of Ryan that I first became interested in medicine and biomedical
engineering. He has taught me a lot and I hope that he will continue to be
an inspiration to me in the future.
While not attending school or working at the MSRC I enjoy
swimming, bowling and reading. I am a member of the biomedical engineering society and the honors
program at the University of Akron. I also enjoy spending time with my pets, including my two dogs, Diggi
and Chips, and also my charming cat, Al.
The future holds many exciting things including the conclusion of my bachelor’s degree in
biomedical engineering and then medical school. I hope to finish medical school and work in pediatrics. I
would like to thank all of my colleagues for their help including Anton, the impatient Russian, Tomo, the
American linguist, and Star 100.7 for providing us with “Flashback Friday” during our 12-hour ACL
reconstructions. On a more serious note, I would like to thank my parents for their support, my mentor,
Andy Van Scyoc, Dr. Debski, and Dr. Woo for giving me this unforgettable and valuable experience.
COMPARISON OF THE QUADRANT AND CLOCK METHODS FOR FEMORAL TUNNEL POSITIONING IN ACL RECONSTRUCTIONS
C. Castner, A. Van Scyoc, A. Plakseychuk, T. Sasaki, V. Musahl, R.E. Debski, P.J. McMahon, Savio L-Y. Woo
Musculoskeletal Research Center
Department of Orthopaedic Surgery University of Pittsburgh
INTRODUCTION
As sports become more and more of an American hobby, so do injuries. One of the most frequent sports injuries is an anterior cruciate ligament (ACL) tear. There are at least 50,000 reconstructions a year and failure rates range from 10-40% [1]. There are many reasons for failure of an ACL reconstruction one of which includes the placement of the femoral tunnel. Currently there are two common methods used by surgeons to determine the position of the femoral tunnel; the clock method and the quadrant method.
The clock method is commonly used intra-operatively and is used by placing a circular clock in the intercondylar notch of the femur (Figure 1). The tunnels are then drilled at clock positions such as ten or eleven o’clock [2].
Figure 1: Clock positioned on femur for clock method
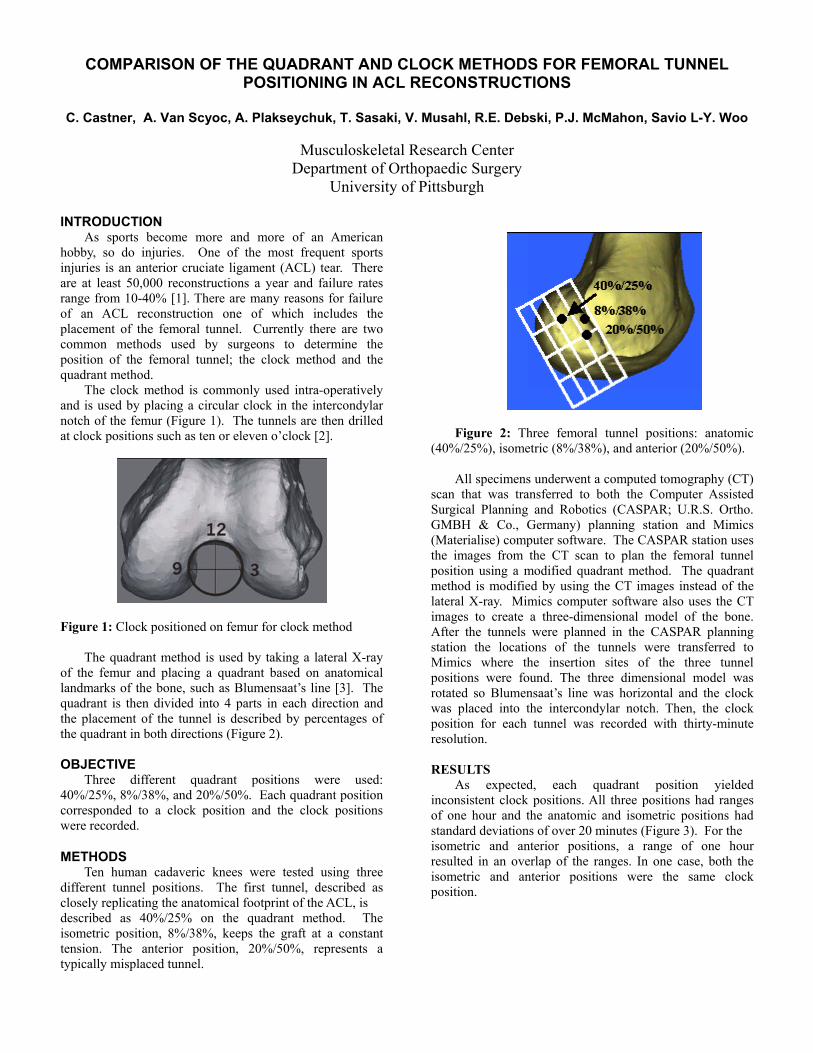
The quadrant method is used by taking a lateral X-ray of the femur and placing a quadrant based on anatomical landmarks of the bone, such as Blumensaat’s line [3]. The quadrant is then divided into 4 parts in each direction and the placement of the tunnel is described by percentages of the quadrant in both directions (Figure 2).
OBJECTIVE
Three different quadrant positions were used: 40%/25%, 8%/38%, and 20%/50%. Each quadrant position corresponded to a clock position and the clock positions were recorded.
METHODS Ten human cadaveric knees were tested using three
different tunnel positions. The first tunnel, described as closely replicating the anatomical footprint of the ACL, is described as 40%/25% on the quadrant method. The isometric position, 8%/38%, keeps the graft at a constant tension. The anterior position, 20%/50%, represents a typically misplaced tunnel.
Figure 2: Three femoral tunnel positions: anatomic
(40%/25%), isometric (8%/38%), and anterior (20%/50%). All specimens underwent a computed tomography (CT)
scan that was transferred to both the Computer Assisted Surgical Planning and Robotics (CASPAR; U.R.S. Ortho. GMBH & Co., Germany) planning station and Mimics (Materialise) computer software. The CASPAR station uses the images from the CT scan to plan the femoral tunnel position using a modified quadrant method. The quadrant method is modified by using the CT images instead of the lateral X-ray. Mimics computer software also uses the CT images to create a three-dimensional model of the bone. After the tunnels were planned in the CASPAR planning station the locations of the tunnels were transferred to Mimics where the insertion sites of the three tunnel positions were found. The three dimensional model was rotated so Blumensaat’s line was horizontal and the clock was placed into the intercondylar notch. Then, the clock position for each tunnel was recorded with thirty-minute resolution. RESULTS
As expected, each quadrant position yielded inconsistent clock positions. All three positions had ranges of one hour and the anatomic and isometric positions had standard deviations of over 20 minutes (Figure 3). For the isometric and anterior positions, a range of one hour resulted in an overlap of the ranges. In one case, both the isometric and anterior positions were the same clock position.

Quadrant Clock Average (min) St. Dev. (min)40%/25% 8:30-9:30 8:57 22 8%/38% 10:30-11:30 11:06 24 20%/50% 10:00-11:00 10:24 19
Figure 3: Three femoral tunnel positions and their corresponding clock positions, averages, and standard deviations in minutes.
While researching the proper placement of the clock, inconsistencies of the clock method were found [2, 4]. With many different ways to position the femur and place the clock in the notch, it is very difficult to compare clock positions to one another.
DISCUSSION Each quadrant position was not shown to
correspond to a single clock position. Also, there are many ways to view the femur when placing the clock into the intercondylar notch. By placing the clock as consistently as possible, the clock positions still varied by as much as one hour.
Both the clock and quadrant method have advantages and disadvantages. The clock method is simple, intuitive, and can be used very easily intra-operatively with an arthroscope. There are, however, many ways to place the clock and orient the femur. The quadrant method better takes into account the overall geometry of the bone and is also fairly easy to use. It requires a lateral X-ray, which can be difficult to obtain in an intra-operative setting and cannot be used with an arthroscope.
With the advantages and disadvantages of both methods and the inconsistency between the two, a modified quadrant method, like that used in CASPAR, can improve the precision in placing the femoral tunnel. The CASPAR software uses a modified quadrant method, which considers all three dimensions of the bone geometry, by using a CT scan. The clock method provides a good approximation of tunnel position intra-operatively. However, this method has low accuracy and cannot be used in research settings when one tunnel position has to be compared to another.
The modified quadrant method, based on three-dimensional anatomy, can accurately quantify where each tunnel is placed so it can be repeated and compared to other tunnels.
REFERENCES
1. Fu, et al.: AAOS, 43:137-148, 1994. 2. Loh, et al.: 2002, [in press]. 3. Bernard, et al.: AJKS, 10:14-21, 1997. 4. Draganich, et al.: AJSM, 27:329-334, 1999.
ACKNOWLEDGEMENTS
I’d like to thank all of my co-authors especially Dr. Plakseychuk and Dr. Sasaki for their patience throughout the summer. Also, Andy Van Scyoc for being a very knowledgeable and supportive mentor. Lastly, to Dr. Woo for giving me this amazing summer experience for which I will never forget and the support of the NIH grant AR 39683.

Thomas Christophel
University of Pittsburgh [email protected]
Upper Extremity Group Lab Mentor/Faculty Advisor: Zong-Ming Li, Ph.D.
I was born in Spokane, Washington on August 15, 1980. I started
my high school career at Princeton Senior High School in Princeton, West
Virginia. In 11th grade, I moved to Greencastle, Pennsylvania where I went
to Greencastle High School for 11th and 12th grade.
My extracurricular college activities, interests, and hobbies consist
of being a Resident Assistant at Lothrop Hall, working in the MSRC lab,
playing hockey, watching ESPN and the Discovery Channel, watching
improves, and going to concerts.
Most of my high school friends did not want to go to college, but I always knew I wanted to
continue my education after high school. I spent the first two years of college wondering what I wanted to
do. I heard that Pitt had a reputable engineering program, so I decided to try out bioengineering. I gained
an interest in bio-systems and have stayed in this major ever since.
During a bioengineering seminar, Dr. Zong-Ming Li offered me a position in the MSRC. I worked
at the MSRC during my first and second semester of my junior year. It was a great opportunity to see what
bioengineering really was. After I graduate, I plan to get my MBA from the University of Pittsburgh. In the
future, I see myself working for a biotech company.
I would like to thank my advisor Dr. Zong-Ming Li for all of his guidance. Without his support, I
would be more lost than I was throughout my entire freshman year. I would also like to thank Drs. Debski
and Wang for their Summer Internship Program. I have learned more then I will ever learn from any class.
Lastly, I would like to thank Dr. Woo for his words of wisdom and founding the MSRC.
FORCE PRODUCTION OF THE THUMB IN MULTIPLE DIRECTIONS
Thomas H. Christophel Jr, Zong-Ming Li
Musculoskeletal Research Center Department of Orthopedic Surgery
University of Pittsburgh
INTRODUCTION Procedures Hand strength has been the most common and
convenient criterion used to assess the motor function of the hand. The thumb is vital for daily activities of the human hand. Traditional strength measurement of the thumb has been limited in a few directions.
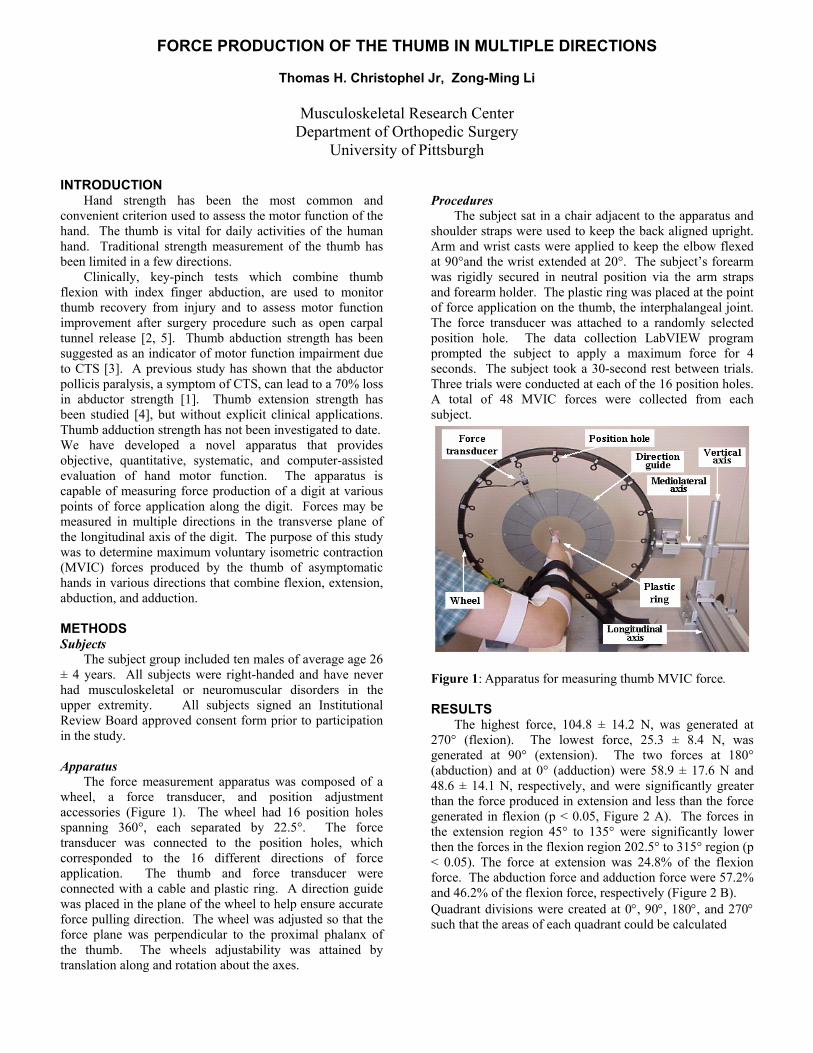
The subject sat in a chair adjacent to the apparatus and shoulder straps were used to keep the back aligned upright. Arm and wrist casts were applied to keep the elbow flexed at 90°and the wrist extended at 20°. The subject’s forearm was rigidly secured in neutral position via the arm straps and forearm holder. The plastic ring was placed at the point of force application on the thumb, the interphalangeal joint. The force transducer was attached to a randomly selected position hole. The data collection LabVIEW program prompted the subject to apply a maximum force for 4 seconds. The subject took a 30-second rest between trials. Three trials were conducted at each of the 16 position holes. A total of 48 MVIC forces were collected from each subject.
Clinically, key-pinch tests which combine thumb flexion with index finger abduction, are used to monitor thumb recovery from injury and to assess motor function improvement after surgery procedure such as open carpal tunnel release [2, 5]. Thumb abduction strength has been suggested as an indicator of motor function impairment due to CTS [3]. A previous study has shown that the abductor pollicis paralysis, a symptom of CTS, can lead to a 70% loss in abductor strength [1]. Thumb extension strength has been studied [4], but without explicit clinical applications. Thumb adduction strength has not been investigated to date.
We have developed a novel apparatus that provides objective, quantitative, systematic, and computer-assisted evaluation of hand motor function. The apparatus is capable of measuring force production of a digit at various points of force application along the digit. Forces may be measured in multiple directions in the transverse plane of the longitudinal axis of the digit. The purpose of this study was to determine maximum voluntary isometric contraction (MVIC) forces produced by the thumb of asymptomatic hands in various directions that combine flexion, extension, abduction, and adduction. METHODS Subjects The subject group included ten males of average age 26 ± 4 years. All subjects were right-handed and have never had musculoskeletal or neuromuscular disorders in the upper extremity. All subjects signed an Institutional Review Board approved consent form prior to participation in the study.
Figure 1: Apparatus for measuring thumb MVIC force.
RESULTS The highest force, 104.8 ± 14.2 N, was generated at 270° (flexion). The lowest force, 25.3 ± 8.4 N, was generated at 90° (extension). The two forces at 180° (abduction) and at 0° (adduction) were 58.9 ± 17.6 N and 48.6 ± 14.1 N, respectively, and were significantly greater than the force produced in extension and less than the force generated in flexion (p < 0.05, Figure 2 A). The forces in the extension region 45° to 135° were significantly lower then the forces in the flexion region 202.5° to 315° region (p < 0.05). The force at extension was 24.8% of the flexion force. The abduction force and adduction force were 57.2% and 46.2% of the flexion force, respectively (Figure 2 B).
Apparatus The force measurement apparatus was composed of a wheel, a force transducer, and position adjustment accessories (Figure 1). The wheel had 16 position holes spanning 360°, each separated by 22.5°. The force transducer was connected to the position holes, which corresponded to the 16 different directions of force application. The thumb and force transducer were connected with a cable and plastic ring. A direction guide was placed in the plane of the wheel to help ensure accurate force pulling direction. The wheel was adjusted so that the force plane was perpendicular to the proximal phalanx of the thumb. The wheels adjustability was attained by translation along and rotation about the axes.
Quadrant divisions were created at 0°, 90°, 180°, and 270° such that the areas of each quadrant could be calculated

(Figure 3 A). The largest area (5031 ± 1330 N2) corresponded to flexion-adduction, representing 41.4% of the total area. The area for flexion-abduction (4776 ± 1592 N2) was 39.3% of the total area of the envelope, which was approximately the same as flexion-adduction. The areas for extension-abduction (1383 ± 634 N2) and extension-adduction (952 ± 481 N2) were 11.4% and 7.6%, respectively (Figures 3 A & 4 A).
A second method for defining quadrants was also considered. The divisions were created at 45°, 135°, 225°, and 315° such that the areas of each quadrant could be calculated (Figure 3 B). The largest area was the flexion quadrant (6394 ± 1787 N2), which was 52.7% of the total area. The smallest area was the extension quadrant (599 ± 413 N2), which was only 4.9% of the total area. The abduction quadrant (2870 ± 1430 N2) and adduction quadrant (2279 ± 897 N2) were 23.6% and 18.8% of the total area, respectively (Figures 3 B & 4 B).
Figure 4: Quadrant areas at (A)0°, 90°, 180°, and 270°, (B) 45°, 135°, 225°, and 315°
DISCUSSION In this study, the multi-directional forces of the thumb
were obtained for asymptomatic hands. It was found that the forces varied according to the direction of effort; the polar plot of the force envelope demonstrates this characteristic pattern. While the standard deviations of the quadrant areas were large, the shape of the force envelope was consistent between subjects. It would be expected that when normalizing the subject force data with respect to flexion MVIC and then calculating quadrant areas with this normalized data, standard deviation would be smaller.
Figure 2: Polar plots of the (A) average force and (B) normalized force generated in 16 directions with standard deviations.
The methods described in this study provide an advanced level of quantification of hand motor function. In the future we plan to use the current methods to study the impairment of hand motor function due to carpal tunnel syndrome.
REFERENCES 1. Boatright, JR et al.: J Hand Surg, 22(5): 849-52, 1996. 2. Cook, AC et al.: J Hand Surg, 20(2): 228-30, Apr 1995. 3. D'Arcy CA et al.: JAMA, 283(23): 3110-7, June 2000.
4. Karen, T et al.: Neuroscience Letter, 290:53-56, July Figure 3: Force envelopes and force quadrants. 2000. 5. Nakamichi, K et al.: J Hand Surg, 22(5):853-62, Sept 1997. ACKNOWLEDGEMENTS Special thanks to the coolest mentor Dr. Zong-Ming Li
for his praises and constructive criticism though out the summer. Also, thanks to the fellows, residents, graduate students, summer students, faculty, and Dr. Savio L-Y. Woo of the MSRC.

Jonita Cutts University of Pittsburgh
[email protected] Shoulder Group
Lab Mentor: Susan Moore, B.S. Faculty Advisor: Richard Debski, Ph.D.
Born June 20, 1981, I grew up in Mt. Prospect, IL (a suburb of
Chicago) with my mother, father, younger sister, Jolene, and dog, Boomer.
During my four years at Prospect High School, I played flute in the band,
violin in the orchestra and worked stage tech crew for several musicals and
plays.
By the time I was 17 and had lived in the same house my entire life,
I knew I wanted to go to college somewhere outside of Illinois. When the
University of Pittsburgh Honors College and School of Engineering offered
me a scholarship to attend Pitt, I gladly accepted. This fall will mark the beginning of my fourth year as a
Bioengineering major at Pitt. Although I enjoyed my Bioengineering classes, I decided to study abroad my
sophomore year and I joined 700 other undergraduate students on the Spring 2001 voyage of Semester at
Sea. I traveled to Cuba, Brazil, South Africa, Kenya, India, Malaysia, Vietnam, Hong Kong, China, and
Japan and studied the geography and culture of each of these diverse countries.
This summer I have had the privilege of working in the shoulder lab of the MSRC. In particular, I
have been collecting and analyzing kinematics of the glenohumeral joint. I would like to thank my mentor,
Susan Moore, my advisor, Dr. Debski, and the rest of the shoulder group for their helpful suggestions and
patient guidance. I would also like to extend my thanks to Dr. Woo and the MSRC for making this summer
research opportunity possible.

VALIDATION AND DESCRIPTION OF GLENOHUMERAL KINEMATICS COLLECTED DURING A CLINICAL TEST
Jonita G. Cutts, Susan M. Moore, Volker Musahl, Patrick J. McMahon, Richard E. Debski
Musculoskeletal Research Center
Department of Orthopaedic Surgery University of Pittsburgh
INTRODUCTION The glenohumeral (GH) joint is the most commonly dislocated diarthrodial joint in the body. In order to diagnose injury of the GH joint, surgeons perform clinical tests such as the Anterior and Posterior Drawer Test (APDT) in which the humerus is translated with respect to the scapula. One method of describing kinematics involves Cardan angles wherein an orthogonal coordinate system is created for each bone and the motion of one bone is reported with respect to the other. Another method of describing kinematics, Joint Motion Description (JMD), was developed [1] which allows motion to be described in terms of anterior/posterior (A/P), proximal/distal (P/D), and medial/lateral (M/L) translations that are independent of the order of rotations. This method uses two fixed axes (one to each bone) and one floating axis perpendicular to both fixed axes to describe motion through kinematic linkages. JMD is widely accepted by clinicians and engineers as the method of choice to describe kinematics in clinically relevant terms for the knee. Because of its widespread use, JMD was investigated as a possible method to describe shoulder kinematics in this study. For the shoulder, however, the floating axis is only oriented superiorly at 90° GH abduction. Therefore, JMD can only be used to describe shoulder kinematics for small angles of GH adduction with negligible translations in the M/L direction. Consequently, Cardan Angle Description (CAD) may represent shoulder kinematic data in a more clinically relevant manner than JMD. In CAD, the motion is always reported with respect to the scapular coordinate system which has an axis directed superiorly. OBJECTIVE The objective of this study was to validate the accuracy of the magnetic tracking device system (Flock of Birds, Ascension Tech) used to collect GH kinematics during a simulated APDT and to describe the kinematic data obtained in clinically relevant terms. METHODS Eight fresh-frozen cadaveric shoulder specimens, 50±6 yrs. (mean±SD), were dissected leaving the mid-humerus, scapula, rotator cuff (RC) tendons, and GH capsule intact. The humerus and scapula were potted in epoxy putty and mounted to Plexiglas supports on a table such that the scapular plane was perpendicular to the top of the table. Tethers were sutured to the RC tendons allowing a 13.4 N
load to be applied to each tendon to simulate muscle forces. A sensor was fixed to each bone. A third sensor, augmented with a stylus, was used to digitize anatomic landmarks. To describe the kinematics using CAD, anatomical coordinate systems (CS) were determined. The humeral and scapular CS were defined by the cross products of several vectors. For a left shoulder specimen, a vector, V1, connecting the anterior- and posterior- most points digitized on the humeral head was created. The long axis of the humerus (HA) was digitized representing the lateral z-axis of the humeral CS. The y- and x-axes of the humeral CS were oriented in the superior and anterior direction respectively. The x-axis of the scapular CS was defined to be V1. The y- and z-axes of the scapular CS were oriented in the superior and lateral directions respectively. JMD was used to describe the GH kinematics in terms of anatomical parameters digitized to determine the CS of the bones. The first axis was defined as V1, fixed to the scapula. The second axis was defined as HA, fixed to the humerus. The third was a floating axis, orthogonal to both fixed axes. The shoulder was preconditioned and the APDT was performed where the humerus was positioned at 60° GH abduction, 0° horizontal abduction, and at 0° external rotation. The humerus was then translated to its limit in the anterior and posterior directions. The exam was repeated at 30° and 60° external rotation (ER). This process was repeated five consecutive times for each specimen. The Flock of Birds (FOB) collected the kinematic data. The magnitude and repeatability of the maximum translations of the humerus with respect to the scapula during this simulated clinical test for the cadaveric GH joint was determined [2]. In order to validate the FOB system, registration blocks were fixed to the bones. In a series of fixed positions, the blocks were digitized by the Microscribe (3DX, Imersion, CA) and by the FOB sensor. The accuracy of the Microscribe is <0.2mm for creating a CS on the blocks. The transformation between the humeral and scapular blocks was determined at each position using the Microscribe. The blocks were digitized by the sensor to determine the constant transformation between the block and sensor on each bone. The resulting transformation matrix between blocks was compared to that from the Microscribe for the eight positions and the error of the FOB system was determined.
RESULTS The FOB sensors recorded sub-millimeter accuracy when comparing the magnitude of the transformation matrices

between the blocks for five of the eight positions that were tested. The greatest magnitude of error was 3.5mm. The repeatability of the JMD analysis was found to be within 1.9mm for both the applied and coupled translations. The repeatability of the CAD analysis was found to be within ±2.4mm for both the applied and coupled translations. The applied A/P and coupled superior/inferior (S/I) translations for 5 cycles of the APDT, performed on eight specimens, and reported by both analysis methods, are shown in Figures 1, 2 and 3.
-2 0
0
20
APP
LIE
D T
RA
NS
LA
TIO
NS
(mm
)
0° ER 30 ° ER 6 0 ° E R
E x te r n a l R o ta t io n (° )
Jo in t M ot i o n D e sc rip t io n
C ar da n An g le D e scri p t io n
POST
ER
IOR
A
NTE
RIO
R
Figure 1: Maximum applied anterior-posterior translations of the humerus at 0°, 30°, and 60° external rotation during drawer test.
CO
UP
LED
TR
AN
SLA
TIO
NS
(mm
)
In R
espo
nse
to A
nter
ior
Tra
nsla
tion
- 2 0
- 1 0
0
1 0
2 0
INF
ERIO
R
SUP
ERIO
R
0° ER 30 ° ER 6 0 ° E R
E x te r n a l R o ta t io n (° )
Jo in t M ot i o n D e sc rip t io n
C ar da n An g le D e scri p t io n
Figure 2: Maximum coupled superior-inferior translations of the humerus in response to anterior translation at 0°, 30°, and 60° external rotation during drawer test.
CO
UP
LED
TR
AN
SL
ATI
ON
S (
mm
)In
Res
pons
e to
Pos
terio
r Tra
nsla
tion
- 20
- 10
0
10
20
INFE
RIO
R
SU
PER
IOR
0° ER 30° ER 60° ER
Extern al Ro tat ion (°)
Joint Motion Desc ription
Car dan Angle Description
Figure 3: Maximum coupled superior-inferior translations of the humerus in response to posterior translation at 0°, 30°, and 60° external rotation during drawer test.
JMD and CAD reported similar trends in applied translation magnitudes. JMD reported that 87.5% of the specimens exhibit maximal posterior translation (-17.9±5.4mm) at 30° ER and 100% showed decreased anterior translation with increasing ER. Analysis by CAD demonstrated that 75% of the specimens exhibited maximal posterior translation (-17.1±5.3mm) at 30° ER and 87.5% showed decreased anterior translation with increasing ER. The most distinctive difference in results between JMD and CAD was seen in the S/I coupled motion trends. According to JMD, in response to anterior translation, 100% exhibited a maximum inferior translation (-8.1±3.0mm) at
30° ER. JMD also reported that in response to posterior translation, 100% showed a maximum superior translation (10.4±4.5mm) at 60° ER. CAD, however, reported that in response to anterior translation, 87.5% showed inferior translation that decreasesd with increasing ER. Also, according to CAD, in response to posterior translation, 75% exhibited a maximum inferior translation (-5.6±2.9mm) at 30° ER.
DISCUSSION The accuracy of the FOB was validated. The magnitude of difference between the FOB sensors and Microscribe was found to be less than one millimeter for the majority of the positions tested. These results provide evidence that the magnetic tracking device is an accurate tool with which to collect kinematic data. The results from the three positions that yielded a much higher error can be explained by other factors in the apparatus. During the preliminary testing in this study, it was determined that the table and fixtures were not completely rigid. Modifications to the setup were made and the repeatability of the data collected increased. Practical limitations to secure fixation remain; however, and further modification to the apparatus is needed. It is likely that a lack of rigidity in the clamping of the specimen is responsible for the discrepancy between the FOB and Microscribe. The cadaveric shoulder kinematic data collected during a simulated clinical test was described in an anatomically relevant manner. As evidenced by the coupled motion observed in response to the applied translations, there is a significant difference in the results of the two methods of kinematic description. The superior translations reported by JMD in response to posterior translation seem inconsistent with known shoulder anatomy. Upon posterior translation, the acromion would inhibit superior translation of the humerus with respect to the scapula. The inferior translations reported by CAD for the same translations are more reasonable anatomically. Future research will include repeating the FOB validation procedure. In addition, statistical analysis will be performed between the two methods of reporting kinematics.
REFERENCES 1. Grood, E.S., Suntay, W. J. (1983). Trans ASME, 105, 136-44. 2. Debski, R.E. et al. (1995). J Biomech, 28, 869-74. ACKNOWLEDGEMENTS The support of the Whitaker Foundation is gratefully acknowledged.

Rebecca Hrutkay University of Pittsburgh
[email protected] Upper Extremity & Mechanobiology Groups Faculty Advisors: James H-C Wang, Ph.D.
Zong-Ming Li, Ph.D.
I was born in Washington, PA on July 12th, 1981 and have always
lived in PA and probably will never escape from here. In elementary
school, my mother and I moved around a lot, so I had been to 3 different
schools by the 4th grade. Then I moved back to Washington, PA with my
dad and gram and stayed there until the end of 7th grade (my fav place).
Finally, I moved to Bridgeville, PA with my dad and graduated from a
small public high school called South Fayette. All of my siblings are
younger than me, and my mom just had a baby girl on May 18, 2002. I
have 2 brothers, Dimiah and Carson who are 12 and 6, and 2 sisters now, Cierra and Lindsay who are 4
years and 1 month.
At Pitt I am a Student Academic Counselor (SAC) at the Learning Skills Center. I am responsible
for teaching fellow students study skills and how to apply them to their courses. I conduct individual
appointments or group sessions, so if you need some help, stop by the LSC! I am also a member of the
National Society of Collegiate Scholars. When I am not being studious, I enjoy snowboarding, cooking,
and painting. This is my 7th year of snowboarding, but I haven’t been able to go a lot because of the crazy
weather we have here in PGH. To pay my rent, I have worked at Max and Erma’s in Shadyside since my
freshman year.
As of now, I am really not sure of what I am going to do after I graduate. A couple of ideas are grad
school for bioengineering or business, or I might just try to find a job and then go to grad school later.
Ideally, I would like to get a job in CA, because I love it and a lot of my friends live there. Plus, I could go
snowboarding and then go to the beach all in one day! I would like to thank Dr. Li and Dr. Wang for all of
their help with my project as well as everyone in the mechanobio lab that helped throughout the summer. I
would also like to thank Dr. Woo for the opportunity to work in a great lab this summer.

INFLAMMATORY AND PROLIFERATION RESPONSES OF TENOSYNOVIAL FIBROBLASTS TO CYCLIC MECHANICAL STRETCHING
Rebecca Hrutkay, Zong-Ming Li, James H-C. Wang
Musculoskeletal Research Center
Department of Orthopaedic Surgery University of Pittsburgh
The purpose of this study was to evaluate the levels of two inflammatory mediators, prostaglandin E2 (PGE2) and interleukin-1 (IL-1), while human tenosynovial fibroblasts were exposed to cyclic mechanical stretching. It was hypothesized that the tenosynovial fibroblasts would be arranged in a parallel alignment before and after stretching; the production of PGE2 and IL-1 would increase in a stretching-magnitude dependent manner; and cyclic mechanical stretching would increase the proliferation rate of the flexor tenosynovial fibroblasts.
INTRODUCTION The workforce today is faced with the enormous negative impact of carpal tunnel syndrome (CTS). According to the Bureau of Labor and Statistics data in 1994, 40.8% of the repetitive motion disorder cases of the upper extremity resulting in lost days of work are from carpal tunnel syndrome. CTS results from increased pressure on the median nerve and is characterized by numbness, burning, or tingling of the hand, and even a total loss of hand motor control. The severity and high incidence of CTS provides the motivation for this study. Exposure to excessive mechanical loads or repetitive use of the hand and wrist can lead to CTS [3]. Currently, methods used to quantify the effect of repetitive motion work in the development of CTS are based on statistical correlation in workplaces, where multiple factors (both personal and environmental) may contribute to the development of CTS [7]. While the causal effects of CTS by repetitive motion have been a topic of debate, repetitive mechanical loading on the synovium and flexor tendons in the carpal tunnel has been thought to give rise to tenosynovitis and tendinitis. Tenosynovitis, an irritation or swelling of the tendon and the tendon sheath, causes inflammation, pain, and median nerve compression [4, 6].
MATERIALS AND METHODS A system, developed by Wang et al., for stretching cells
was utilized to mimic the effects of repetitive motion on tenosynovial fibroblasts [10]. See Figure 1. The cell stretching system consisted of a six-station stimulation apparatus for the silicone dishes, with each station fixing one end of the dish to a stationary clamp and the other end to a moving clamp. The stationary clamp holds the dish in place, while the moving clamp cyclically stretches the dishes. The stretching apparatus is capable of applying uniaxial displacement with varying stretching magnitudes to the cells in the silicone dishes. The circular cams, which are rotated by a DC motor, specify the stretching magnitude and the frequency is varied by changing the motor speed with a separate control unit [10].
Previous studies have shown that inflammatory mediators, including prostaglandin E2 (PGE2) and interleukin-1 (IL-1) are involved in tendon inflammation [2]. Using a novel in vitro model, Wang et al. have recently shown that human patellar tendon fibroblasts produce high levels of PGE2 in response to cyclic mechanical stretching [9]. A study by Archambault et al. showed that with the combined stimuli of mechanical loading and IL-1 β, the tendon matrix underwent degenerative changes [3]. However, little is known about the levels of IL-1 when fibroblasts are subjected to mechanical stretching.
Figure 1: Apparatus used for cyclic stretching of teno novial fibroblasts.
r tendons nts undergoing wrist surgery. The
rgeons extracted the most mildly inflamed samples from the
Despite the increasing prevalence of CTS, and the fact that it has become an extremely costly public health problem, there are critical gaps in our knowledge about pathophysiological mechanisms for CTS at the cellular and molecular levels. In an investigation of the molecular factors of CTS, Tucci et al. found that serum samples collected with CTS showed a five-fold elevation in PGE2 compared to control samples [8], which suggests that the high levels of PGE2 may be responsible for both the pathological changes and the symptoms of CTS. Likely, PGE2, and IL-1 are involved in the development of tenosynovitis by altering the synovial fibroblast biology and hence synovium pathophysiology during the development of CTS.
sy
Tenosynovium samples (n=4) from the flexowere collected from patiesu
flexor tendons in the carpal tunnel of each patient. Surgeries included a left wrist dorsal ganglion excision, right carpal tunnel release with microscopic internal neurolysis, and carpal tunnel release with cyst excision. The

samples were immediately placed in conical tubes containing Dulbecco’s Modified Eagle Medium (DMEM) supplemented with 10% fetal bovine serum (FBS) and 1% penicillin/streptomycin (P/S). The samples were washed twice with DMEM in a laminar flow hood. Each sample was then minced into small segments, approximately 1 mm2 in size, and placed in petri dishes with a roughened bottom to promote cell attachment. The cells were cultured with 5 mL of regular growth medium and maintained in a humidified atmosphere of 5% CO2 and 95% air at 37°C until they reached confluence. To obtain a sufficient amount of cells for the stretching experiments, the fibroblasts were sub-cultured five to seven passages. Silicone dishes were used for the stretching experiments since silicone is non-toxic to the cells. To promote cell attachment to the surfaces, the silicone dishes were coated with 10 µg/mL of Pronectin-F. Prior to plating the fibroblasts, the number of cells were counted using a hemacytometer. The fibroblasts were then transferred to the microgrooved silicone dishes and plated at a density of 19 x 104 cells/cm2. The fibroblasts were then grown in DMEM supplemented with 1% P/S and 10% FBS. After 48 hours, the growth medium was replaced with a low serum DMEM (1% FBS and 1% P/S) in order to align the fibroblasts in the G0 phase of the cell cycle before the onset of cyclic stretching. Cells without stretching were processed similarly for control. The tenosynovial fibroblasts will be stretched at magnitudes of 4%, 8%, and 12% at a constant frequency of 0.5 Hz for a period of 4 hours followed by a 15 hour incubation period [10]. The levels of inflammatory mediators, PGE2 and IL-1, will be determined using ELISA kits. The cells will be detached from the silicone dish with trypsin and then the cell number will be recounted. An unpaired t-test will be used to evaluate the statistical significance of the levels of the inflammatory mediators at the different stretching magnitudes.
PRELIMINARY AND EXPECTED RESULTS Figure 2 shows the preliminary results before stretching of the alignment of the tenosynovial fibroblasts on a microgrooved silicone dish. In vivo, fibroblasts tend to align in a parallel arrangement in the tendons. 48 hours after plating the cells, the tenosynovial fibroblasts attached to the microgrooved silicone dishes in a parallel arrangement.
Figure 2: Parallel alignment of tenosynovial fibroblasts before cyclic stretching.
Currently, results have not been obtained for after stretching due to unexpected contamination of cells in the silicone dishes. The tenosynovial fibroblasts are expected to remain in a parallel alignment after the stretching experiments are complete. It is expected that repetitive mechanical stretching of human tenosynovial fibroblasts will lead to an increase in the levels of PGE2 and IL-1, as seen in previous in vitro studies. In control samples without stretching, the levels of inflammatory mediators are not expected to elevate. Finally, the number of cells following cyclic mechanical stretching is expected to increased due to cellular proliferation of the tenosynovium.
DISCUSSION A unique method was utilized to investigate and understand the molecular mechanisms of CTS. The preliminary results of the tenosynovial fibroblasts parallel alignment before the onset of cyclic stretching mimicked the alignment of human patellar tendon fibroblasts in other in vitro studies [9, 10]. We expect that the molecular responses of tenosynovial fibroblasts will also be similar to previous in vitro studies of human patellar tendon fibroblasts [1, 2, 7]. Although the stretching of tenosynovial fibroblasts may not mimic the mechanical stimuli received by synovium in vivo, our results may provide insight into the molecular responses of the tenosynovium under well-controlled mechanical loading conditions. This study has the potential to help elucidate the causal mechanisms of CTS. We will continue to determine the alignment of the fibroblasts after stretching, measure the levels of PGE2 and IL-1 released, and finally investigate the proliferative response of the tenosynovial fibroblasts.
REFERENCES 1. Almekinders et al.: Med Sci Sports Exerc 25: 603-607, 1993. 2. Almekinders et al.: Am J Sports Med 23: 119-123, 1995. 3. Archambault et al.: J Orthop Res 20: 36-39, 2002. 4. Fuchs et al.: J Hand Surg 16A: 753-758, 1991. 5. Gelmers: ACTA Neuro 55: 317-320, 1981 6. Neal et al.: J Hand Surg 12B: 229-232, 1987. 7. Szabo: Clin Orthop 78-89, 1998. 8. Tucci et al.: Biomed Sci Instrum 33: 246-251, 1997. 9. Wang et al.: ORS 2001. 10.Wang et al.: Conn Tissue Res Submitted, 2002.
ACKNOWLEDGMENTS Special thanks to Guo-guang Yang, Q, Tom Gilbert, and
Beth Kirkpatrick of the mechanobiology lab for all of their help with my project this summer. I would also like to thank Savio L-Y. Woo, Ph.D., D.Sc., for the opportunity to work in the MSRC this summer.
Microgroove Direction

e K ntos of Pi@pitt Gro
Shon Richa
d rai
then
ough the lo aduating
igh .
am sp
ning,
comm
home
perie
how it coincides with the practice of m
k Dr. W
nd guidance.
Daphn
Universitydak74
ACLLab Mentor:
Faculty Advisor:
I was born an
town of Bergenfield,
my way up thr
ottsburgh .edu up Darcy, B.S. rd Debski, Ph.D.
sed in Bergen County New Jersey; first in the
Woodcliff Lake, and finally Montvale. I worked
cal school system and finished it off by gr
from Pascack Hills H
Organized te
activities such as run
and helping out the
been involved with various organizations that build
assist the disabled.
Working in the MSRC has been a valuable ex
bioengineering and
S l in 2001choo
orts are not my favorite so I prefer leisure sorts of
swimming, kayaking, and hiking. Volunteering
unity are two of my favorite things to do. I have
s for the homeless, clean up parks and streets, and
nce. It has allowed me to see the value of
edicine. This summer experience has shaped my
oo for this opportunity and all of the MSRC desire to go to medical school. I would like to than
family for their help a
DEVELOPMENT OF A CALIBRATION O VALIDATE THE FUNCTION THE
D. Kontos, S. Darcy, J. E. Debski, S. L-Y. Woo
INTRODUCTION
Previously, various methods havedetermine the forces in the knee. The use of a robot has showed to be an adequate method forA high payload robotic UFS testing system cdegree of freedom (DOF) robot manipulator universal force moment sensor (UFS)to determine the in-situ forces in ligament (ACL) while simulating However, to do this correctly the UFS
In calibrati
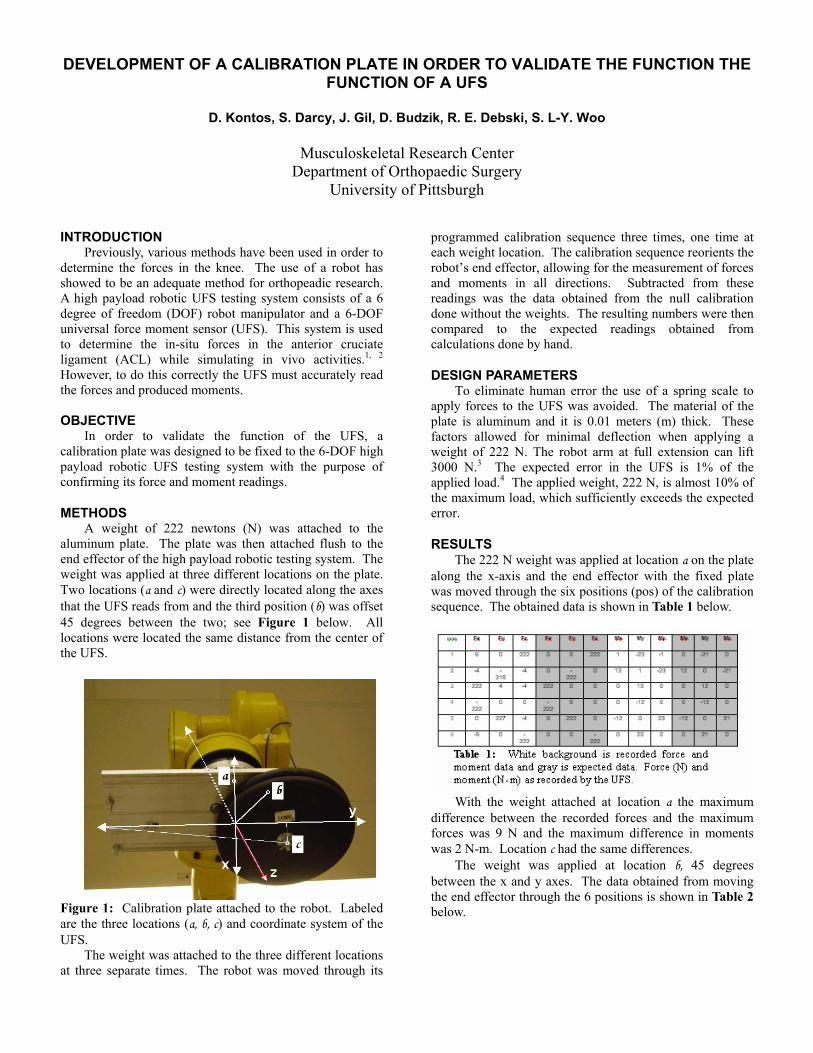
METHODS attached to the
aluminum plate. The plate was then attached flush to the end effector of the high payload robotic testing system. The weight was applied at three different locations on the plate. Two locations (a and c) were directly located along the axes that the UFS reads from and the third position (b) was offset 45 degrees between the two; see Figure 1 below. All locations were located the same distance from the center of the UFS.
PLATE IN ORDER TFUNCTION OF A UFS
Gi . l, D. Budzik, R
Musculoskeletal Research Center Department of Orthopaedic Surgery
University of Pittsburgh
been used in order to
orthopeadic research.
each weight location. The calibration sequence reorients the
and moments in onsists of a 6 and a 6-DOF
. This system is used the anterior cruciate
in vivo activities.1, 2 must accurately read
the forces and produced moments.
OBJECTIVE
readings was the data obtained from the null calibration done without the weights. The resulting numbers were then compared to the expected readings obtained fromcalculations done by hand.
To eliminate human error the use of a spring scale to
order to validate the function of the UFS, a on plate was designed to be fixed to the 6-DOF high
payload robotic UFS testing system with the purpose of confirming its force and moment readings.
A weight of 222 newtons (N) was
factors allowed for minimal deflection when apweight of 222 N. The robot arm at full extension3000 N. The expected error in the UFS is 1% of the applied load.4 The applied weight, 222 N, is almost 10% of the maximum load, which sufficiently exceeds the expe
Figure 1: Calibration plate attached to the robot. Labeled are the three locations (a, b, c) and coordinate system of the UFS.
The weight was attached to the three different locations at three separate times. The robot was moved through its
programmed calibration sequence three times, one time at
robot’s end effector, allowing for the measurement of forces all directions. Subtracted from these
DESIGN PARAMETERS
apply forces to the UFS was avoided. The material of the plate is aluminum and it is 0.01 meters (m) thick. These
plying a can lift
3
cted error.
RESULTS The 222 N weight was applied at location a on the plate
along the x-axis and the end effector with the fixed plate was moved through the six positions (pos) of the calibration sequence. The obtained data is shown in Table 1 below.
With the weight attached at location a the maximum
difference between the recorded forces and the maximum forces was 9 N and the maximum difference in moments was 2 N-m. Location c had the same differences.
The weight was applied at location b, 45 degrees between the x and y axes. The data obtained from moving the end effector through the 6 positions is shown in Table 2 below.

With the weight attached at location b the maximum
difference between recorded forces and expected forces was 13 N and the maximum difference in moments was 1 N-m.
DISCUSSION The estimated error in the readings for translations is
10.5 N. This includes the 3.5 N error in the load cell.4 The remaining 7 N is due to error in human measurement. There was a significant amount of noise when recording the forces
the number fluctuated so a visual average was
The remaining error can be attributed to assumptions expected calculations including no plate
defl
ll into the accuracy specifications, thereby vali the function of the load cell.
REFERENCES 1) Fujie, Livesay et al. (1996). J Biomecs 29(12):
1577-85. 2) Rudy, Livesay, et al. (1996). J Biomecs 29(10):
1357-60. 3) S-900W, FANUC Robotics North America, Inc,
Auburn Hills, MI. 4) Theta Model, ATI-Industrial Automation, Graner,
NC.
ACKNOWLEDGEMENTS Thank you to my mentor Shon Darcy for his help and
guidance, to Dr. Debski, the ACL group, the MSRC family, Dr. Woo, and the support from the NIH-Grant AR
from the UFS; taken. The estimated error in rotations is calculated as
the 10.5 N error multiplied by the distance from the center of the UFS to each of the three locations. This error equals 1 N-m.
made duringection, and perfectly measured distances. Also, the
results are preliminary due to the fact that the validation system is yet to be completed. The final design will include a pin that assures plate position and a spacer that centers the weight at the different locations.
The accuracy of the load cell is 3.5 N and 0.35 N-m.4 Incorporating the estimated errors into the obtained results and justifying for incompleteness in the system, the UFS readings fa
dating
and 39683.

Morgana Martin
Carnegie Mellon University [email protected]
MCL Group Lab Mentor: Jinhong Zhu, M.D.
Faculty Advisor: James H-C Wang, Ph.D.
I was born on November 18, 1981 in Newport Beach, CA. I lived in
southern California for 11 years before moving to Henderson, NV where I
graduated from Green Valley High School in 1999. My mom, my 19 year
and my 17 year old sister, Larissa, still live in
is right outside Las Vegas.
In May of 2003 I will graduate from Carnegie Mellon University
in Materials Science & Engineering and Biomedical &
nce; I play the flute.
I plan to attend graduate school for biomedical
medical Engineering career in the area of Biomaterials.
like to thank Dr. Wang and Jenny for being great mentors this summer and for giving me so many
ch. I would also like to thank Dr. Woo for the
ow it is an experience that I have learned a great deal
old brother, Marty,
Henderson, which
with a double major
Health Engineering, and a minor in Music Performa
After completing my undergraduate degree,
engineering. After that, I would like to pursue a Bio
I would
experiences to learn and participate in exciting resear
opportunity to work in the MSRC this summer; I kn
from and will always remember.

A STUDY OF CONTROLLED RELE ND ITS EFFECT ON FIBROBLAST
Morgana Martin,1 Kelly L. Co Marra,2 James H-C. Wang,1
1Musculoskeletal Research ity of Pittsburgh, Pittsburgh, PA
2Institute for Complex Enginee Mellon University, Pittsburgh, PA
INTRODUCTION Healing medial collateral ligaments (MC
shown to have a disorganized colcollagen fibril diameters,3,4 and decreased mechanical properties.2 These decreased propeprovide motivation for studying improve its healing quality.
In skin incision wounds, s(Na3O4V) has been shown to induuniformly organized collagen fiber bundlcollagen fibril diameters by 20%, and incbreaking strength.5 In vitro, vanadatto induce cell proliferation in a biphasic, dosage dependent
reasons, we are interested in applying vanadate to a wounde
quantity of vanadate at a predetermined rate for prolonged
8
this study was to determine the kinetics of the release of vanadate from PLGA microspheres, and the effect of vanadate on fibroblast proliferation in vitro. MATERIALS AND METHODS
PLGA microspheres were prepared using a double-emulsion, solvent extraction technique [(water-in-oil)-in-water].9 In a glass tube, 0.200 g PLGA was dissolved in 1 mL CH Cl , and this was combined with 100 µL of a 100
spheres were immersed in water. After 1, 3, 6, 24, 48 and 72 hrs., the samples were centrifuged and the water was measured at 315 nm for the UV absorption of vanadate.
Cell proliferation experiments were performed on rat MCL and NIH 3T3 fibroblasts. Cells, at a density of 4 X 10⁴ cells per well, were cultured in 6-well plates in 3 mL
n incubated for 24 hrs. at 37 °C and 5% CO . After
d d 1% P/S. m (DMEM
1% P/S). At this time, 10 µL of ach well, resulting in concentrations
ere incubated for an additional 24 hrs. (37 °C and 5% CO ).
d to each well and the cells were % CO2) for three hours. Each 6-well
and 1 mL DS), 44%
into each well. The cells were incubated overnight, and the
plate
ell for
each experiment. A one-way ANOVA statistical analysis was performed on the data to determine if the levels of cell proliferation induced by the various concentrations of vanadate were significantly different.
RESULTS The cumulative amount of vanadate released from
PLGA microspheres over time was found to increase, with larger increases in the release during the initial stages of the release and smaller increases after longer periods of time (Fig. 1).
Figure 1: Cumulative release of vanadate from PLGA microspheres. Cell proliferation experiments showed that 100 µM
vanadate is toxic to rat MCL and NIH 3T3 fibroblasts. Additionally, it was shown that 10 µM vanadate significantly decreases proliferation of these fibroblasts.
n=3
ASE OF VANADATE APROLIFERATION
llins,2 Jin 1 acey G.hong Zhu, K
Center, Department of Orthopaedic Surgery, Universred Systems, and Department of Biomedical Engineering, Carnegie
L) have been lagen matrix,1,2 small
rties of healing MCL potential methods to
odium orthovanadate ce formation of more
Dulbecco’s Modified Eagle Medium (DMEM) containing 10% Fetal Bovine Serum (FBS) and 1% Penicillin/Streptomycin (P/S). The cells were the
2incubation, the medium was removed and cells were washewith 1 mL of DMEM containing 1% FBS anEach well then received 3 mL of fresh mediucontaining 1% FBS andvanadate was added to e
es, increase rease wound
e has also been shown
manner,6 and stimulate collagen synthesis.7 For these
of 0, 1, 5, 10 and 100 µM vanadate in medium. Cells w2
To determine cell viability, 200 µL of MTT solution (5mg/mL) was addeincubated (37 °C, 5
d ligament to enhance its healing quality. Controlled release of vanadate from biodegradable poly(D,L-lactic-co-glycolic acid) (PLGA) microspheres has been chosen for delivery of vanadate because of the efficiency and convenience of this method. Controlled release from microspheres permits delivery of a precise
periods of time, offers localized delivery, and reduces the number of necessary injections.
As a first step, the objective of
plate was centrifuged, the medium was removed,of extraction buffer (15% Lauryl Sulfate (SDimethyl Formamide (DMF), 41% H2O) was introduced
following day, 2- 200 µL samples from each well werepipetted into a 96-well plate. The plate was read in a reader and an MTT Assay was performed to measure theoptical density values, which are proportional to cnumber. Data was normalized to the mean of the control
2 2mM solution of vanadate. The mixture was emulsified on a vortexer for 1 min., and then re-emulsified in 0.3% aqueous PVA solution for 5 min. on a magnetic stirrer. Next, 100 mL of 2% aqueous Isopropyl Alcohol (IPA) solution was added, and the solution was maintained on a magnetic stirrer for 2 hrs. The solution was centrifuged and the supernatant was extracted. The microspheres were dried under vacuum overnight.
To measure the cumulative amount of vanadatereleased from the PLGA microspheres over time, 15 mg of vanadate was encapsulated in PLGA microspheres, and the
0100200300400
0 20 40 60 80
Hours
Vana
date
R
elea
sed
( µM
)

the cells (Fig. 2). Fibroblasts treated with 10 µM vowed a slight decrease in cell proliferation, accompanied
by some cell anadate treatment appeared to be detached, which can be
seen by their rounddetached cellsfibroblasts. These observat ns were quantified by data
T Assay (Fig. 3).
* *p< 0.01
n =30 *
*
0
0.5
1
1.5
0 1 5 10
Vanadate Concentration (µM)
Nor
mal
ized
OD
Va
lue
This was seen quantitatively in photographs taken of
anadate
fibroblasts over the level of proliferation seen without vanadate treatment. 10 µM vanadate significantly decreased
shdetachment. Many cells that received 100 µM 4).
ved shape. The high incidence of
suggests that 100 µM vanadate is toxic to DISCUSSION io
obtained from an MT
no vanadate 10 µM vanadate 100 µM vanadateno vanadateno vanadate 10 µM vanadate10 µM vanadate 100 µM vanadate100 µM vanadate
Figure 2 Rat MCL fibroblasts 16 hrs. after vanadate treatment.
* *
*
*p< 0.01
n=6
0.000
0.100
0.200
0.300
0.400
OD
Val
ue
fibroblasts after vanadate eatment.
te sign
cell proliferation of the fibroblasts below the level of proliferation seen without vanadate treatment (Fig.
Encapsulation of vanadate in PLGA microspheres was
ed cell
379-89, 1983. 2. Weiss et al.: J Orthop Res: 9(4), 5126-28, 1991.
l.: Connect Tissue Res: 27(4), 251-63, 1992. 4. H
8. Mahoney and Saltzman: J Pharm 85(12), 1276-81, 1996. 9. Lu et al.: J Biomed Mater Res: 50(3), 440-51, 2000.
ACKNOWLEDGEMENTS This study was supported by Whitaker Biomedical Engineering Grant (JHW). Special thanks to Savio L-Y. Woo, Ph.D., D.Sc. and Hilda Diamond and the CMU Department of Biomedical and Health Engineering for the internship opportunity this summer.
Figure 3 Viability of rat MCL
0 10 100
Vanadate Concentration (µM)
tr
Figure 4 Viability of NIH 3T3 fibroblasts after vanadate treatment.
Experiments were continued only with NIH 3T3
fibroblasts, and it was shown that 1 and 5 µM vanadaificantly increased cell proliferation of NIH 3T3
successful, and vanadate was shown to release from the microspheres in an increasing and time-dependent fashion, as seen in studies done with proteins.9 The release kinetics that were observed indicate that controlled release of vanadate from PLGA microspheres is a feasible method of delivering vanadate to an injured MCL.
This study also showed that vanadate affects rat MCL and NIH 3T3 fibroblast proliferation in a biphasic and dosage dependent manner, as seen in a study done with vanadate and Swiss 3T3 fibroblasts.6 Data showed that 1 and 5 µM vanadate significantly increased cell proliferation, whereas 10 and 100 µM vanadate significantly decreas
proliferation. Since an optimal concentration range has been determined, further work can be done to encapsulate and release the desired quantity of vanadate to achieve a controlled release of vanadate from PLGA microspheres that will stimulate cell proliferation.
Experiments will be continued to determine the effect of a controlled release of vanadate from PLGA microspheres on fibroblast proliferation. Additionally, the effect of vanadate on tyrosine phosphorylation and collagen production will be determined. In vivo studies are planned to determine the effect of a controlled release of vanadate from PLGA microspheres on the healing quality of the rat MCL.
REFERENCES 1. Frank et al.: Am J Sports Med: 11(6),
3. Frank et aart et al.: J Orthop Res: 10(1), 96-103, 1991.
5. Ehrlich et al.: Plast Reconstr Surg: 107(2), 471-7, 2001. 6. Cortizo et al.: Biometals: 10(2), 127-33, 1997. 7. Lau et al.: Endocrinology: 123(6), 2858-67, 1988.
Sci:

Moffat
Carnegie Mellon University [email protected]
MCL Group Lab Mentor: Steve Abramowitch, B.S.
Faculty Advisor: Savio L-Y. Woo, Ph.D., D.Sc.
On April 16, 1981 I was born in Monroeville, PA. Until the age of
20, I lived in Penn Hills, where I learned all of the wonderful lessons of
adolescence. I attended Penn Hills Senior High School and graduated as
one of the Class of 1999 Valedictorians. I am now a senior at Carnegie
Mellon University. In the past year, my family has moved to Oakmont.
Choosing to attend Carnegie Mellon University has proven to be a
good decision. Despite the challenging pursuit of double majoring
Materials Science and Engineering and Biomedical and Health Engineering, I have had many enjoyable
experiences and made a lot of great memories. In the spring of 2000, I became a member of Kappa Kappa
ublic Relations Chair. I have also been a resident assistant for the past two
other great year. In the fall 2002 semester I will be serving as the
be serving as co-President of the Materials Engineering organization,
ng tennis, softball, running, and exercising.
graduate school, and pursue a Ph.D. degree in
biom ined this summer at the MSRC has been exceptional.
W dvisor, and all of the faculty, staff and students of the MSRC, I have
gained a tremendous amount of knowledge about biomedical research, the medial collateral ligament, and
teamwork. I would especially like to thank my mentor, Steven Abramowitch, for all of his assistance,
advice, and guidance. He could not have been more helpful, patient, and sincere. It is not often in life that
you meet someone so intelligent, dedicated, and so willing to lend a helping hand every step of the way. I
would also like to thank Dr. Woo, Dr. Wang, and Dr. Debski for their advice, guidance, and for offering me
a wonderful and educational opportunity.
Kristen
Gamma, where I am now the P
years and I am looking forward to an
Treasurer of Mortar Board and I will
ASM. In my spare time, I enjoy playi
After graduation in May 2003, I plan to attend
edical engineering. The experience that I have ga
ith the help of my mentor, my a

COLLATERAL LIGAMENT TENSILE TESTING
. Abra
al Res arch Center rthop edic Surgery of Pittsburgh
The medial collateral ligament has proven to be a useful model for studying ligament healing.9 The MCL has a good aspect ratio, which allows for strain in the midsubstance to be distributed in a longitudinal direction and stress to be distributed homogeneously throughout the midsubstance.9 The location of the MCL is also easily accessible during dissection and surgery. In addition, clinical studies have shown that the MCL displays a large propensity for healing without surgical intervention.7
The MSRC performs extensive studies, which focus on understanding the healing mechanisms of the MCL using the rat model. Uniaxially tensile testing intact and
ovide insight and useful information about the structural properties of the femur-MCL-tibia complex (FMTC) and the mechanical properties of the ligament midsubstance.9
There are, however, several difficulties associated with tensile testing the rat model. Measurements based on dissection of a Sprague-Dawley rat show that the rat has a very small bone diameter, fragile bones, and a small MCL. The most important limitation associated with the rat is that it remains skeletally immature until late in its life. Therefore, when a tensile load is applied to the MCL, failure at the femoral growth plate is a common problem during biomechanical testing.1
In order to be able to compare the mechanical roperties of the healing and intact rat MCLs and to
understand ligament healing in rat model, a tensile sting clamp must be desi ed that can accoun the ifficulties of using the rat m del. Limita ns of previous esigns for tensile testing rat MCLs2,3,4,5 that a lamp design should incorporate fixtures to prevent growth late separation, eliminate the use of transfixing pins, alter e angle of knee flexion, and minimize bone rotation and
one bending.
BJECTIVE The objective of our study is to design a rat tensile
rowth plates, reduce rotation and bending of bones, and eliminate the use of transfixing rder to determine measurements of the structural and mechanical properties of the rat MCL d uniaxial tensile testing.
METHODS
One hind leg of a Sprague-Dawley rat was disarticulated at the hip joint and the remainder of the soft tissues was removed from the femur, tibia, and fibula. All other knee ligaments, with the exception of the MCL, were
ith a 1.5
ersed into the PMMA, while ensuring that the MCL did ot contact the PMMA. Once the PMMA hardened, the x-
ray film was removed. The sample specimen was then used tensile testing. The bones were potted in
PMM
ee screw holes in the fron
for the angle of knee flexion to be altered and enables the specimen to be aligned so that the tensile load is
ally to the MCL. vide
ck plate the
t ranslations
rt plate
ndylar bone surface. The support plate has two te in
the x direction. This ensures that the support plate can be ot contact the MCL during
NEW CLAMP DESIGN FOR RAT MEDIAL
Kristen L. Moffat, Steven D
MusculoskeletDepartment of O
University INTRODUCTION
mowitch, Savio L-Y. Woo
ea
healing rat MCLs is an endpoint of these studies. These tests will pr
pthe
te gno
t for d tio
,6 d indicate cpthb
O
testing clamp that will incorporate fixtures that will reduce failure at g
pins in o
uring
transected. Two pieces of x-ray film were then cut to a length of 4.7 cm and formed into two cylinders wcm diameter. Polymethylmethacrylate (PMMA) was then poured into both cylinders. The femur and tibia were immn
for preliminary A to increase the rigidity of the bones and to surround
the bones with a material which could be penetrated by screws.
The clamp design was drawn with FormZ™, a three dimensional computer modeling program. The design and dimensions are based largely on the clamp design used by Woo et al.8 to test rabbit MCLs.
DESIGN The design consists of two main components, the
femoral component and the tibial component (figure 1), both of which will be manufactured from 304 stainless steel. The femoral component consists of five main structures: the femoral fixture, back plate, support plate, side plate, and the top plate.
The purpose of the femoral fixture (A) is to secure the femur/PMMA complex close to the knee joint with eight screws penetrating the PMMA (thr
t, three screw holes on the top, two screw holes on the back, and three screw holes on the bottom). This allows the femoral fixture to rigidly fix the femur/PMMA complex thereby minimizing all bone translations, bone rotations, and bone bending. The femoral fixture has two obliquely oriented screw holes on the back side, which enable the fixture to translate along the arcs of the back plate. This allows
applied longitudinThe purpose of the back plate (B) is to pro
support to the entire femoral component. The baalso provides the site of attachment for the side plate and top plate.
The purpose of the support plate (C) is to prevengrowth plate separation and minimize all bone tand bone rotations during tensile testing. The suppoprovides this protection by slightly compressing the femur on the coscrew tracks (right and left), which enable it to transla
positioned such that it will ntesting. The support plate is attached to the side plate with two screw holes in the bottom of the side plate. The support plate dimensions were determined from simple beam

calculations to minimize deflection at 100 N (figure 2). Previous literature2,3,4,5 indicated that the stiffness values for rat MCLs ranged from 12-20 N/mm and that the rat MCLs failed at loads ranging from 20-50 N.
The purpose of the side plate (D) is to hold the support plate and adjust its position. The side plate has two vertical screw tracks, which allow it to move in the z
Deflection vs. Load
0.0004
0.0005
0.0006
0.0007
0.0008
tion
(m)
direction. The vertical translation of the side plate enables the support plate to contact the femur.
The purpose of the top plate (E) is to align the tensile load so that is oriented longitudinally with the MCL. The top plate has two screw tracks, which provide movement in the x direction so that the load can be aligned uniaxially. The large screw connects the femoral component to a universal joint, which connects to the Instron™.
The tibia/PMMA complex is inserted into the tibial component (F) and secured close to the knee joint with eight screws penetrating the PMMA. The purpose of the tibial component is to rigidly fix the tibia/PMMA complex thereby minimizing all bone translations, bone rotations, and bone bending. The large screw connects the tibial component to a universal joint, which connects to the Instron™.
Once the FMTC is secured in place, the entire clamp can be adjusted to align the longitudinal axis of the MCL with the Instron™ axis of load using the universal joint. This ensures that only uniaxial tensile load is being applied to the MCL during tensile testing.
DISCUSSION Although, the clamp design fulfills the objectives
stated previously, there are some disadvantages associated with the design. Before mounting the FMTC into the clamp, all other knee ligaments must be removed. Excessive handling of the FMTC could predispose the MCL to damage. Careful handling of the FMTC will prevent this problem. Additionally, care must be taken to ensure that the PMMA does not contact the MCL. Otherwise, the heat released from the PMMA will damage the MCL. Finally, although bone rotation will be minimized it will not be completely prevented. The next step in the study is to manufacture the clamp. Once the clamp has been manufactured, the clamp must be validated. Preliminary tests will be performed to determine the overall stiffness of the clamp. Finally, preliminary tests using sample specimens will be performed in order to determine if any modifications must be made to the clamp design or to the testing protocol.
REFERENCES 1. Campbell RB, et al.: CORR 332:242-253, 1996 2. Crowninshield RD, et al.: The Journal of Trauma
16:99-105, 1976 3. Hart DP, et al.: JBJS 69A:1194-1199, 1987 4. Horn PC, et al.: Clin. Ortho. 360:238-242, 1999 5. Tipton CM, et al.: JBJS 49A:63-72, 1967 6. Vailas AC, et al.: Am. J. Physiol. 258:R724-R728,
1990 7. Weiss JA, et al.: JOR 9:516-528, 1991 8. Woo SL-Y, et al.: JOR 8:712-721, 1990 9. Woo SL-Y, et al.: JAAOS 8(6):364-372, 2000
ACKNOWLEDGEMENTS Many thanks to Steven Abramowitch for all of his endless help, patience, and support throughout the summer. Also, thank you to Thomas Gilbert and Andy Van Scyoc for their advice and suggestions. Finally, thank you to Dr. Woo, Dr. Debski, and Dr. Wang for a wonderful learning experience.
Figure 2: Deflection vs. Load curve from bending analysis
0
0.0001
0.0002
0.0003
0 20 40 60 80 100 120
Load (N)
Def
lec
Figure 1: New Clamp Design – Femoral and Tibial Components

Rochester Institute of Technology
MCL/Tendinitis Group
M
g
t
T
women’
s r RIT.
Nicole Paga
Lab Mentor: Zhaozhu Li, M.D., Ph.D. Faculty Advisor: James H-C Wang, Ph.D.
of
y twin sister and I were born in Pittsburgh on January 26, 1982. I
rew up in Brookline, and attended John A. Brashear High School as part
he class of 2000.
I am a third year Biotechnology major at Rochester Institute of
echnology in Rochester, NY. I am also one of the tri-captains on the
s varsity soccer team and participate in intramural basketball and
oftball. For the past two years, I have also been a student mentor fo
I love working in the MSRC. In the future, I would like to work in forensics or possibly
intelligence. I have enjoyed the research here very much and I would like to thank Dr. Li and Dr. Wang for
their guidance and support.

C PRODUCTION: AN IMPLICATION OF TENDINOPATHY
Nico ng
Depa gery University of Pittsburgh
4 4 4
5% CO2 to allow for cell outgrowth. The d four to six times before they were
grooved silicone dishes coated with 10
the of HPTFs, but the cells were not stretched.
s were able to mimic the in vivo tendon fibroblasts
YCLIC STRETCHING INCREASES 5-LIPOXYGENASE ACTIVITY AND LEUKOTRIENE B4
le Paga, ZhaoZhu Li, James H-C Wa
Musculoskeletal Research Center
rtment of Orthopaedic Sur
INTRODUCTION
Tendinopathy is a term that broadly defines any damaging condition of the tendon, such as tendonitis or tendinosis. The etiology of tendinopathy is unclear, and treatment methods are varied. However, these treatments can often be ineffective for the more severe, chronic cases of tendinopathy1, which illustrates the need to understand the molecular mechanisms of the condition.
The causes of tendinitis and other tendon disorders have been the subject of research for many years. We hypothesize that excessive repetitive mechanical loading on the tendon fibroblasts leads to increased production of inflammatory mediators, potentially contributing to the onset of tendinopathy2.
One inflammatory mediator thought to be associated with tendinopathy is leukotriene B (LTB ). LTB is derived from arachidonic acid (AA) and is formed through the 5-lipoxygenase (5-LO) pathway. The enzyme 5-LO, along with 5-lipoxygenase activating protein (FLAP), reduce AA to form the very unstable epoxide intermediate leukotriene A4 (LTA4). LTA4 then reacts with LTA4 hydrolase to form LTB4.
A previous study by Almekinders3 had detected elevated levels of LTB4 following the biaxial cyclic stretching of human tendon fibroblasts. Therefore, the purpose of this study was to determine 5-LO expression and LTB4 production in human patellar tendon fibroblasts (HPTFs) subjected to three stretching magnitudes (4%, 8%, and 12% uniaxial stretching) at 0.5Hz (30 cycles/min). MATERIALS AND METHODS
Fibroblasts obtained from surgical samples of human patellar tendon were cultured in DMEM with 10% FBS and 1% penicillin/streptomycin (P/S) and were kept in 37°C environment withcells were passe transferred to microµg/mL ProNectin-F (Sigma Chemical, St. Louis, MO) to assist with adhesion. After approximately 48 hours, the medium was changed to DMEM with 1% FBS, and 1% P/S. Using a novel system designed by our laboratory, the silicone dishes were then subjected to cyclical stretching at three magnitudes (4%, 8%, and 12%) for four hours at 0.5Hz (30 cycles/min). The medium was changed in control groupAfter stretching the cells were incubated for an additional four hours to allow 5-LO expression and LTB4 accumulation in the medium. LTB4 concentration in the media was measured with an ELISA kit (R&D Systems, Minneapolis,
MN). The cells were then lysed so that protein could be collected to measure 5-LO levels through Western blotting. Statistical analysis was performed using an unpaired t-test with a p-value of 0.05.
RESULTS Using our novel in vitro model system to stretch cells,
the HPTFin alignment, shape, and stretching conditions. Western blotting of total cellular protein indicated a slight increase in the production of the protein 5-LO (Figure 1) as the stretching magnitude increased.
0% 4% 8% 12% pos. con.
Figure 1: Using Western blot, 5-LO expression appears to increase with stretching magnitudes.
An ELISA kit was used to determine the concentration of LTB4 in the medium. LTB4 concentration increased with increasing stretching magnitude (Figure 2). Statistical significance was unable to be determined due to the small sample size (n = 3).

Figure 2: ELISA analysis of LTB4 production. Cyclic stretching of HPTFs increased LTB4 production in an apparent stretching magnitude dependant manner. Statistical significance could not be determined (n=3). DISCUSSION
This study has shown that cyclic stretching of HPTFs at three different magnitudes showed an increase in LTB4 levels and 5-LO expression. The concentration of LTB4 in the media increased with increasing stretching magnitudes (4%, 8%, and 12%) as compared to the control, which were not stretched. This increase could be due to an increase of 5-LO activity, since there is only a very slight increase in the actual protein, as shown by the Western blot.
LTB4 is a very potent inflammatory mediator. It has been associated with disorders such as cystic fibrosis,
amounts of neutrophils and other leukocytes into the area of inflamm
the release of lysosomal enzymes and generate superoxi
TB4 in tendinopathy. Further, an in vivo study will
et al.: Sports-Induced Inflammation: Clinical and Basic Science Concepts: 152-3, 613, 1990.
2. Wang, James, et al.: submitted to Conn T Res, 2002.
3. Almekinders, Louis, et al.: Med Sci Sports Exerc, 25:603-607, 1993. 4. Crooks and Stockley, Int J Biochem Cell Biol, 2:173-8, 1998. 5. Tager, Andrew, et al.: J Exp Med, 3:439-446, 2000.
ACKNOWLEDGEMENTS Many heartfelt thanks to Dr. Li for being an excellent
mentor in the lab. His instruction, guidance, and patience has helped me more than words can say. Thanks also to Dr. Wang as an advisor, and to all of the wonderful people that work in the mechanobiology lab at the MSRC. Also, to Dr. Woo and everyone else in the MSRC for their continuous support and guidance every step of the way. You have set the standard by which I will gage all future experiences.
Bttsburgh Medical Center (JHCW). Also,
0
10
50
0% 4% 0% 8% 0% 12%
psoriasis, and arthritis4. In addition to attracting large
ation, LTB4 also has the ability to activate the neutrophils.
Activation of the neutrophil induces a rise in intracellular calcium, migration of cells into the area of inflammation, and can increase the ability of the neutrophil to adhere to venule walls5. Activation of neutrophils can also lead to
de radicals4 causing damage to the soft tissue and possibly eventual degeneration of the tendon.
Future studies will further investigate the 5-LO pathway leading to the production of LTB4. There will also be an investigation into the effects of inhibiting prostaglandin E2 (PGE2)—another inflammatory mediator derived from AA through the COX pathway to better define the role of L
be performed in order to assess the histological and biological effects of LTB4.
REFERENCES 1. Leadbetter, Wayne, ed.,
This study was supported in part by the Whitaker iomedical Engineering Grant, and the CMRF from the
University of Pithanks to the Pittsburgh Tissue Engineering Initiative, Inc.
20
30
LTB
4 C
once
ntra
tions
(pg/
mL)
40
0,00
0 ce
lls40

Kat ak
Lab Me , Ph.D.
I was born in Twinfalls, Idaho on May 12, 1981, but grew up in
Boulder, CO, where my family moved in 1985. I did a lot of traveling
throughout my childhood and have now been to 34 countries (6 continents).
After missing three weeks of school my senior year to go to Antarctica, I
graduated from Fairview High School in 1999, and left Colorado to attend
Carnegie Mellon University.
When I’m not pulling all-nighters in the cluster in effort to complete
my degrees in Computer Science and Biomedical Engineering, I can be found doing various activities. I am
president of my sorority, Zeta Psi Sigma, and have participated in the CMU/Shadyside Hospital
Preceptorship Program. Last year, I also worked as a programmer at CMU’s Center for Medical Robotics
and Computer Assisted Surgery. I have a special interest in philosophy as well and was recently asked to
present my work at a Center for the Advancement of Applied Ethics lecture series. When I’m at home I can
usually be found cooking, watching ice hockey (Go Avs!), playing the flute, or entertaining my unusually
large cat, Pixel.
My future goals include making it to that 7th continent, Australia, and, more importantly, attending
medical school after either completing a post-baccalaureate premedical program or a Masters degree. My
interests are in both orthopedics and infectious diseases, as my travels have given me an interesting
perspective on disease. My sincerest gratitude goes to Dr. Wang for all of his guidance throughout my
project. Also, many thanks to Dr. Woo for giving me the opportunity to work in his lab, Dr. Debski, and the
rest of the MSRC.
herin PeperzCarnegie Mellon University
[email protected] MCL Group
ntor/Faculty Advisor: James H-C Wang
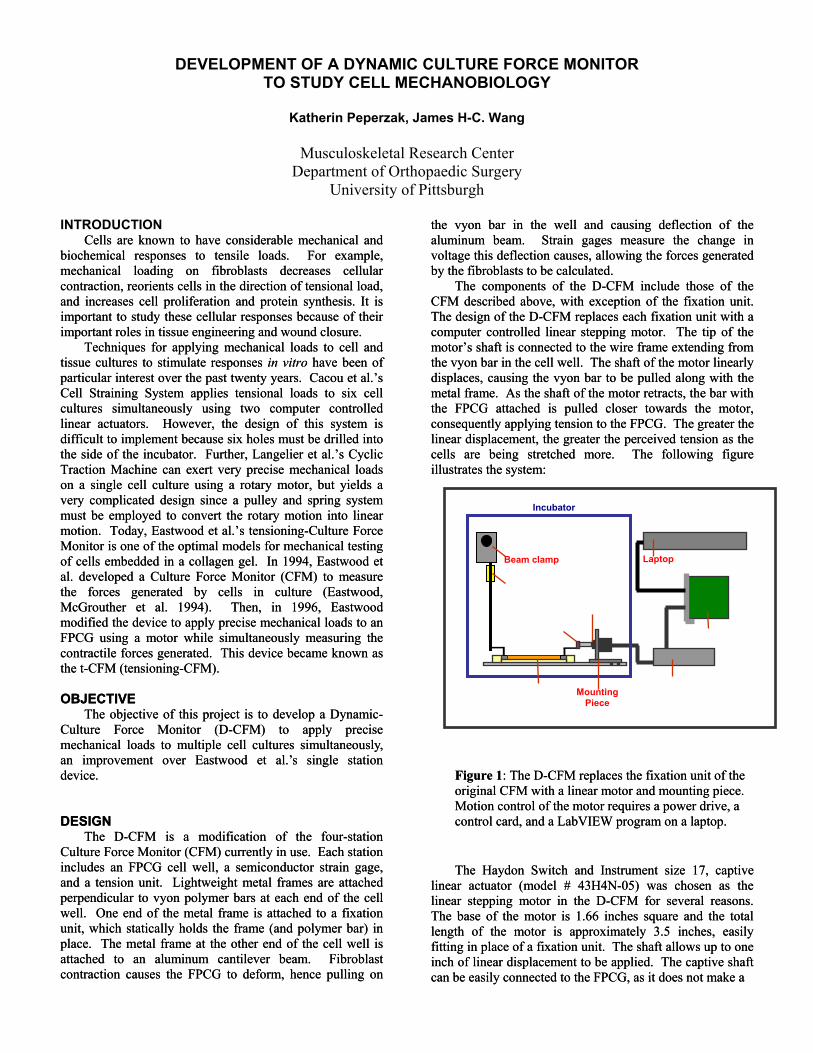
d closure.
ver, the design of this system is diffi
o
he FPCG to deform, hence pulling on
e vyon bar in the well and causing deflection of the
he D-CFM include those of the CFM described above, with exception of the fixation unit.
f the D-CFM replaces each fixation unit with a com
oser towards the motor, cons quently applying tension to the FPCG. The greater the
near displacement, the greater the perceived tension as the ells are being stretched more. The following figure lustrates the system:
Figure 1: The D-CFM replaces the fixation unit of the original CFM with a linear motor and mounting piece. Motion control of the motor requires a power drive, a control card, and a LabVIEW program on a laptop. The Haydon Switch and Instrument size 17, captive
near actuator (model # 43H4N-05) was chosen as the near stepping motor in the D-CFM for several reasons. he base of the motor is 1.66 inches square and the total ngth of the motor is approximately 3.5 inches, easily tting in place of a fixation unit. The shaft allows up to one ch of linear displacement to be applied. The captive shaft
can be easily connected to the FPCG, as it does not make a
DEVELOPMENT OF A DYNAMIC CULTURE FORCE MONITOR TO STUDY CELL MECHANOBIOLOGY
Katherin Peperzak, James H-C. Wang
Musculoskeletal Research Center Department of Orthopaedic Surgery
University of Pittsburgh
ththINTRODUCTION Cells are known to have considerable mechanical and
biochemical responses to tensile loads. For example, mechanical loading on fibroblasts decreases cellular contraction, reorients cells in the direction of tensional load, and increases cell proliferation and protein synthesis. It is important to study these cellular responses because of their important roles in tissue engineering and woun
Cells are known to have considerable mechanical and biochemical responses to tensile loads. For example, mechanical loading on fibroblasts decreases cellular contraction, reorients cells in the direction of tensional load, and increases cell proliferation and protein synthesis. It is important to study these cellular responses because of their important roles in tissue engineering and woun
aluminum beam. Strain gages measure the change in voltage this deflection causes, allowing the forces generated by the fibroblasts to be calculated.
The components of t
aluminum beam. Strain gages measure the change in voltage this deflection causes, allowing the forces generated by the fibroblasts to be calculated.
The components of t
The design oThe design oputer controlled linear stepping motor. The tip of the
motor’s shaft is connected to the wire frame extending from the vyon bar in the cell well. The shaft of the motor linearly displaces, causing the vyon bar to be pulled along with the metal frame. As the shaft of the motor retracts, the bar with the FPCG attached is pulled cl
puter controlled linear stepping motor. The tip of the motor’s shaft is connected to the wire frame extending from the vyon bar in the cell well. The shaft of the motor linearly displaces, causing the vyon bar to be pulled along with the metal frame. As the shaft of the motor retracts, the bar with the FPCG attached is pulled cl
Techniques for applying mechanical loads to cell and tissue cultures to stimulate responses in vitro have been of particular interest over the past twenty years. Cacou et al.’s Cell Straining System applies tensional loads to six cell cultures simultaneously using two computer controlled linear actuators. Howe
Techniques for applying mechanical loads to cell and tissue cultures to stimulate responses in vitro have been of particular interest over the past twenty years. Cacou et al.’s Cell Straining System applies tensional loads to six cell cultures simultaneously using two computer controlled linear actuators. Howe ee
cult to implement because six holes must be drilled into the side of the incubator. Further, Langelier et al.’s Cyclic Traction Machine can exert very precise mechanical loads on a single cell culture using a rotary motor, but yields a very complicated design since a pulley and spring system must be employed to convert the rotary motion into linear motion. Today, Eastwood et al.’s tensioning-Culture Force Monitor
cult to implement because six holes must be drilled into the side of the incubator. Further, Langelier et al.’s Cyclic Traction Machine can exert very precise mechanical loads on a single cell culture using a rotary motor, but yields a very complicated design since a pulley and spring system must be employed to convert the rotary motion into linear motion. Today, Eastwood et al.’s tensioning-Culture Force Monitor
liliccilil
is one of the optimal models for mechanical testing f c
as e t-CFM (tensioning-CFM).
OBJ
is one of the optimal models for mechanical testing f c
as e t-CFM (tensioning-CFM).
OBJ
ells embedded in a collagen gel. In 1994, Eastwood et al. developed a Culture Force Monitor (CFM) to measure the forces generated by cells in culture (Eastwood, McGrouther et al. 1994). Then, in 1996, Eastwood modified the device to apply precise mechanical loads to an FPCG using a motor while simultaneously measuring the contractile forces generated. This device became known
ells embedded in a collagen gel. In 1994, Eastwood et al. developed a Culture Force Monitor (CFM) to measure the forces generated by cells in culture (Eastwood, McGrouther et al. 1994). Then, in 1996, Eastwood modified the device to apply precise mechanical loads to an FPCG using a motor while simultaneously measuring the contractile forces generated. This device became known
Strain gage
Linear Motor
Connecting Piece
FPCG Power Drive
Control Card
Beam clamp
Mounting Piece
Laptop
Incubator
thth ECTIVE
The objective of this project is to develop a Dynamic-Culture Force Monitor (D-CFM) to apply precise mechanical loads to multiple cell cultures simultaneously, an improvement over Eastwood et al.’s single station device.
DESIGN The D-CFM is a modification of the four-station
Culture Force Monitor (CFM) currently in use. Each station includes an FPCG cell well, a semiconductor strain gage, and a tension unit. Lightweight metal frames are attached perpendicular to vyon polymer bars at each end of the cell well. One end of the metal frame is attached to a fixation unit, which statically holds the frame (and polymer bar) in place. The metal frame at the other end of the cell well is attached to an aluminum cantilever beam. Fibroblast contraction causes t
ECTIVE The objective of this project is to develop a Dynamic-
Culture Force Monitor (D-CFM) to apply precise mechanical loads to multiple cell cultures simultaneously, an improvement over Eastwood et al.’s single station device.
DESIGN The D-CFM is a modification of the four-station
Culture Force Monitor (CFM) currently in use. Each station includes an FPCG cell well, a semiconductor strain gage, and a tension unit. Lightweight metal frames are attached perpendicular to vyon polymer bars at each end of the cell well. One end of the metal frame is attached to a fixation unit, which statically holds the frame (and polymer bar) in place. The metal frame at the other end of the cell well is attached to an aluminum cantilever beam. Fibroblast contraction causes t
lilililiTTlelefifiinin

rotational movement like a bare non-captive screw. The motor has a resolution of 0.00012 inches (3 microns) allowing for appropriate strains to be applied to the FPCG.
Lastly, this motor is made of hybrid materials such as thermoplastics and stainless steel, which are likely to function well inside the incubator.
After the motor was chosen, a mounting piece was designed. The base of the stainless steel mounting piece is intended to slide into the bottom of the incubator and screw in place. The shaft of the motor protrudes through a hole in
the mounting such that the motor is parallel to the bottom. When the mounting is in place the tip of the motor shaft is at is approximately 1 inch from the edge of the cell well during maximum extension. The motor will be connected to the FPCG by fixating the wire frame from the vyon bar to the tip of the motor with a combination of stainless steel
uts and a stainless steel screw through an aluminum L-racket.
eted y the control card which sends commands to the power
wer drive translates the commands into elec
nb
The D-CFM requires a power drive and a controller in order to actually make the motor move in a specified manner. The user specifies how the motor should move in a LabVIEW program on a laptop. The program is interprbdrive. The po
trical signals which cause the motor to move. Figure 2 shows the flow of information through the D-CFM.
in
appropriate
op computer. However, it is D-CFM to be done using a
n order to use this control card it was
Card sinserted is co
mot it provides commands for the control card
to in have FM. The first program allows the e shaft of an appropriate distance from the FPCG.
he second and third programs both cause the motors to make an oscillating motion. One program prescribes the
n, while the other allows the mot
, velocity, and acceleration of the motors. These patterns include sinusoidal, zig-zag, and square waves. We hope to install the motors inside the incubator as soon as the mounting devices are manufactured. Then, we will run experiments to determine the feasibility of the D-CFM
REFERENCES 1. Cacou, C., et al.: Med Eng Phys, 22(5):327-33, 2000. 2. Eastwood, M., D., et al.: Biochim Biophys Acta,
1201(2): 186-92, 1994. 3. Eastwood, M., et al.: Wound Repair Regen, 4(A): 150,
1996. 4. Langelier, E., et al.:Annals of Biomedical Engineering, 27(1): 67-17, 1999.
ACKNOWLEDGEMENTS Special thanks to Tom Gilbert for allowing me to use
his LabVIEW program. Also, thanks to Dr. Savio L-Y. Woo for giving me the opportunity to work in the MSRC. Much appreciation goes to the funding support from the CMRF, University of Pittsburgh Medical Center.
terpret for the power drive. Three different programs been written for the D-C
user to move each motor to a specific position so th the motor is atThen, the wire frame can be connected to the shaft.
T
motors to make the same motioors to make independent motions. The programs
prompt the user to define the velocity, acceleration, blend (amount of “blending” between backwards and forwards motions), and relative displacement of the motors. Further, the position of the shaft of each motor is displayed on a numeric indicator and on a graph as a function of time.
SUMMARY We have developed a promising design for the D-CFM.
The equipment appears to function well, and motion control of the motors has been demonstrated. We are able to define several types of motion patterns by adjusting the blends
Figure 2: The user defines the desired motion of the motor in a LabVIEW program. This program is interpreted by a control card. The control card sends appropriate commands to the power drive based on the program. Then, the power drive converts the commands
to electrical pulses to output to the motor. The electrical pulses cause the motor to move.
The power drive that was selected for the D-CFM is the National Instruments MID-7604, 4-axis Integrated Stepper Driver Power Unit, 115V. This unit is capable of powering up to four motors. The drive outputs and voltage and current for the motor we are using. The power drive is connected to a controller via the National Instruments shielded connecting cable. The control card that was chosen is the National Instruments PCI-7334 Low Cost Stepper only Controller. It is a 4-axis controller board compatible with the chosen power drive and LabVIEW software. The controller is a PCI card that is meant to fit into a PCI slot of a desktdesirable for control of thelaptop. Therefore, inecessary to purchase a PCI expansion unit (Magma 2 slot
Bu -to-PCI Expansion System). The control card is in one of the slots of the expansion system, which
nnected to the laptop through a PCMCIA card. The LabVIEW program determines what motion the
akes, asor m
Faculty Advisor: Savio L-Y. Woo, Ph.D., D.Sc.
.
e fall of 2002. My major is Neuroscience and
I have
o. I have
or…she
f I
ry enthusiastic about their work but they are also a lot of fun to be around. I tried many
new things this summer that I would have otherwise been too afraid to try (i.e. camping and sleeping
UTSIDE with skunks and bugs) I would also like to thank Dr. Woo for offering me this opportunity to
ork at the MSRC and for providing me with guidance and advice.
Mara Schenker University of Pittsburgh
[email protected] MCL Group
Lab Mentor: Fengyan Jia, M.D.
I was born on June 6, 1981 in the wonderful town of Butler, PA
Since, I have moved to Indiana, PA and my family and I settled in Allison
Park, PA (20 minutes north of Oakland) in 1986. I graduated from North
Allegheny High School in 1999 and I am going to be a senior at the
University of Pittsburgh in th
spent this summer learning the ways and words of the biomedical
engineer here at the MSRC.
During college, I have spent a lot of my time competing, training, and teaching taekwond
traveled all over the country competing in national and world tournaments. In 2001, I won the World
Championship in sparring, the National Championship in weapons (I use the nunchucks like Michelangelo
in the Teenage Mutant Ninja Turtles show), and the Pennsylvania State Championship in forms
competition. I did not compete in 2002 because I had arthroscopy on both hips but I am competing again
for 2003.
I am planning to go to medical school in the fall of 2003 to eventually become an orthopaedic
surgeon. First, I would like to thank Dr. Fengyan Jia for being an excellent mentor – she is a very talented
person and I have learned a lot from her. Next, I would like to thank Susan for NOT being my ment
definitely needs a passive student to balance her personality and she and I would have had some issues i
would have been her summer student (just kidding, Susan…) I would also like to thank everyone in the
lab. Everyone is ve
O
w

ANTISENSE T LLATERAL LIGA DY
Mara oo
or com
vitro. The second obje
mitted unrestrained cage access and they were sacrificed one week after surgery. The MCLs were arvested and cultured in Dulbecco’s Modified Eagle Med (DMEM) Fetal Bovine Serum (FBS) and 1% Penicillin/Streptomycin (P/S). After 4-5 passages, the cells were plated at 90% confluence in a 6-well plate. Four well were us antisense, mis and sense. To each well 10 µg/ml and 0.4 µM of the ODNs were added. After the add e ODN complexes, the cells were incu ted at 37°C for fo
fter inc l lysates were obtained using M PER Mammalian Protein Extraction Re ce, Roc rd, IL) following the manufacturer’s instructions. Sixt micrograms of protein sample were extracted, lyop d then mixed with lo er. The prot n samples reso ng 6% and 7.5% SDS-PAGE gel and electroblotted onto a nitrocellulose mem rane (Invitrogen). The electroblotted proteins were localized using antibodies.
rial and error experiments were done to resolve errors in th gel in h
REATMENT OF BOTH HEALING AND NORMAL RAT MEDIAL COMENT FIBROBLASTS: A METHOD STU
L. Schenker, Fengyan Jia, Savio L-Y. W
Musculoskeletal Research Center
Department of Orthopaedic Surgery University of Pittsburgh
INTRODUCTION The medial collateral ligament (MCL) has the potential
to heal without surgical or pharmacological intervention. The healing tissue is, however, mechanically, structurally, and materially inferior to the normal MCL [3,5,6]. It has been shown that there are three types of collagen in ligaments: types I, III, and V. Type I is the main component of normal tissues while types III and V are relatively min
ponents [3,4]. In healing tissue, however, elevated levels of type V collagen have been observed [4]. It is understood that elevated type V collagen levels cause smaller collagen fibril diameters in the healing tissue [2]. The smaller collagen fibrils are believed to be correlated to the inferior biomechanics of the healing tissue.
Antisense oligonucleotides are short strands (15-20 bases) of DNA that are injected into the cells. They are complementary to a target sequence of mRNA. When introduced into the cells, they bind to the strand and block mRNA translation into protein. The blockage of translation is believed to occur through the activation of the enzyme ribonuclease H (RNAase H) [1]. This enzyme cleaves the RNA-DNA heteroduplex and thus, protein translation is blocked. (Figure 1)
Three controls are used in the study: lipofectamine
only, missense and sense. Missense is a random rearrangement of the bases of the antisense strand. The sense sequence is identical to the target mRNA sequence. Since the target mRNA will in theory only bind to its complementary strand, missense and sense will not bind and the mRNA will translate normally into a protein. Antisense treatment has been used to improve the healing process [4].
OBJECTIVE There are two main objectives of this study. The first
objective was to down-regulate type V collagen synthesis using antisense oligonucleotides in
ctive was to determine the source of inconsistencies in the Western Blot protein analysis data.
METHODS Four Sprague-Dawley rats were used in this study. The
animals were anesthetized with intra-peritoneal xylazine (10 mg/kg) and ketamine (90 mg/kg). The hind legs were shaved and washed with a betadine solution. Small medial incisions were made in both legs. The MCLs were exposed and undermined in the joint line. Using a number 11 blade, the right MCL was cut just below the joint line. Both incisions were closed with 4-0 non-absorbable sutures.
The rats were per
hium with 10%
s ed: control, sense,
ition of thba ur hours. A ubation, the cel
- agent (Pierkfoy hilized, an ading buffei were lved usi
b
Te protocol. Protein concentrations, lysis methods, and
and antibody concentrations were systematically alteredopes of improving the quality of the Western Blot data.
RESULTS The sequence of the antisense (AS), sense (S) and
missense (MS) are shown in Figure 1.

Figure 1:
The Western Blotting protein analysis of the oligonucleotide-treated rat MCL fibroblasts is show in Figure 2. Figure 2:
SENSE 5’ GAG AGA AGT ATC ACG GTC CA 3’
llowing nditions: primary antibody (1:750), secondary (1:2000),
gel concentrations (6%).
DISCUSSION Preliminary data indicates that qualitatively, the
tisense oligonucleotides down-regulate type V collagen syde
inthHof istencies were
nked to several potential sources. Protein concentrations
y endless questions and for extending to me her knowledge on
dition, I would like to thank everyone at the MS
S
REFERENCES 1. Alama et al.: Phamacological Research, 36(3):
171-178, 1997. 2. Birk et.al.: Journ Cell Science, 95: 649-657, 1990. 3. Frank et al.: AJSM, 11(6): 379-389, 1983. 4. Niyibizi et al.: Knee Surg. Sports Traumatol,
Arthrosc, 8: 281-285, 2000. 5. Woo et al.: AJSM, 15: 22-29, 1987. 6. Yamaji et al.: JOR: 14: 223-227, 1996.
ACKNOWLEDGEMENTS I would like to thank Dr. Fengyan Jia for answering m
ENSE 5’ ATG TTG CCT ACC GAG TCT CT 3’ ANTISENSE 5’ AGA GAG TCG GTA GGC AAC AT 3’ MIS
antisense. In adRC for their patience in teaching me bioengineering.
Thanks to Dr. Woo for extending to me this opportunity to work in a fabulous lab. Thanks also to the funding support NIHAR41820.
Trial and error experiments to evaluate protocol consistencies varied the following conditions: Primary antibody concentrations: 1:750 and 1:500 Secondary antibody concentrations: 1:3000 and 1:2000 Gel concentrations: 6% and 7.5% SDS-PAGE Previous antisense experiments used the foco
annthesis in rat MCL fibroblasts in vitro. Without nsitometric scans, significance cannot be determined.
Trial and error experiments helped to resolve some consistencies within the protocol. In some experiments, ere was no data obtained from the Western Blot. owever, when protein bands were obtained, they were ten indiscrete and blurry. These incons
liand levels of degradation were considered as well as antibody and gel concentrations. Lysis methods were also varied to maximize protein collection.
Success of the trial and error experiments was determined qualitatively. The bands were present and most discrete with the following conditions: primary antibody (1:750), secondary antibody (1:3000), gel concentrations (7.5%).
With the above changes, the data was more consistent. In the future, the amount of proteins loaded to the gels will also be varied. With lower amounts, the Western Blot bands should be more discrete and clear. In addition, the antisense experiments will be resumed and in the long-term, an in vivo rat model will be established to study the effects of antisense treatment.

University of Pittsburgh School of Medicine
Shoulder Group Facu .D.
e my
d
hockey coach.
oulder
John Solic
lty Advisors: Patrick McMahon, M Richard Debski, Ph.D.
I was born in Chapel Hill, NC and lived there for 2 years before
my family moved to State College, PA, where we have stayed since
then. I attended State College Area High School, where my youngest
sister is a junior. My other siblings both go to Notre Dame, wher
sister is a senior and my brother is a junior. My father is an internist and
specializes in pulmonary medicine and my mother is a high school fiel
I graduated with a BA from Princeton in 2001. While I was there I played football, which took most
of my free time. Now I try to stay busy lifting weights, running, and playing golf and basketball.
I have not yet decided what type of medicine I want to do but I am considering internal medicine or
some type of surgical subspecialty. I want to thank John Jolly, Dr. McMahon, Dr. Debski, the Sh
Group, Colleen O’Hara, Dr. Woo, and the rest of the MSRC for a great summer.

GLENOHUMERAL ST LAR STABILIZERS OF THE SHOULDER
John Solic, John Jolly, Richard E. Debski, Patrick J. McMahon
Depa rgery University of Pittsburgh
INT
le to contribute to joint stability by this com ression mechanism depends on a few parameters. One
con bute to glenohumeral stability in three positions: 90° abd ion, apprehension, and the cocked arm phase of thro
ME
6 To gather data on lines of action in all three positions we used a computational
el that allows musculoskeletal modeling of the shou
90° Abd
omponent
RES
rces. The line of action data is reported as components in e medial/lateral, anterior/posterior, and superior/inferior
irections. A sample plot for the subscapularis is shown in Figure 1. The most important indicator of contribution to
this parameter is the medial/lateral component. A l
he head of the humerus into the glenoid and resist destabilizing forces. The subscapularis (.93), infraspinatus (.89), and supraspinatus (.79) had the largest medial components. Moment arm data (not shown) was gathered for the
WHICH MUSCLES HAVE THE GREATEST POTENTIAL TO CONTRIBUTE TO ABILITY? A STABILITY INDEX FOR THE MUSCU
Musculoskeletal Research Center
rtment of Orthopaedic Su
RODUCTION The glenohumeral joint is the most mobile diarthrodial
joint in the body. As a consequence of this mobility it is a common site of dislocation, especially in extreme positions such as apprehension (90° abduction with external rotation), and the cocked arm phase of throwing (apprehension with extension).1
THODS Maximum Contractile Force data was calculated by gathering PCSA values from the literature,3,4,5 averaging those numbers, and multiplying by a constant of 4.7 kg cm-2 that was also taken from the literature.
shoulder modlder in various positions, and determination of
parameters such as muscle line of action. The line of action unit vectors were defined based on a coordinate system centered with respect to the scapula and are reported as components of the scapular coordinate system: Superior/Inferior, Medial/Lateral, Anterior/Posterior. Moment arm data from the literature was only obtained for the apprehension position so the stability indices for the
uction and Cocked Arm positions only incorporated the maximum force and line of action data. We developed a stability equation that related the three
parameters to obtain a single stability index value for each muscle in each position: SI = (4A+4B+200C-100D-100E)/10 A=Maximum Contractile Force
B=Moment Arm C=Med/Lat Line of Action component D=Sup/Inf Line of Action c
One of the most important ways that the 27 muscles crossing the shoulder can stabilize the joint is by causing compression of the head of the humerus into the glenoid.2 The ability of a musc
pof these components is the force generating capacity of the muscle, which is proportional to its physiological cross sectional area (PCSA). The line of action of a muscle, which is the direction in which its force is directed, also determines the amount of stability provided to the joint. The more it is directed in the medial direction, the greater the stabilizing effect of the muscle. A final parameter that is considered when determining muscle contribution to stability is moment arm, which is the perpendicular distance from the line of action to the center of rotation (the center of the humeral head), and is a representation of how much torque a muscle can apply to the humerus. OBJECTIVE
To rank select shoulder muscles by potential to
E=Ant/Post Line of Action component Maximum force and moment arm values were weighted
equally in the equation and the medial/lateral component of line of action was given a high weight because it has the largest influence on stability. The superior/inferior and anterior/ posterior components were subtracted because larger values in those directions act to pull the humeral head out of the glenoid and destabilize the joint.
ULTS The maximum force data indicates that subscapularis
(71N), middle deltoid (52 N), pectoralis major (62 N), and latissimus dorsi (48 N) have the largest potential contraction
tri fouct thwing. The muscles will be ranked using three
parameters and related in an equation to develop a stability index. This knowledge can be applied to rehabilitation protocols following shoulder injury and will contribute to the overall understanding of the mechanisms of glenohumeral joint stability.
d
stability for arger value in this direction will give a muscle more
stabilizing ability, allowing it to compress t

pprehension position. The latissimus dorsi (11.7 cm) and major (6.2 cm) had the largest moment arms,
while the rotator cuff muscles had the smallest ones. gest moment arms,
while the rotator cuff muscles had the smallest ones.
apectoralis
-1
-0.6
Shoulder Position
nit
Lat/Med
90° Abduction Apprehension Cocked Arm
-0.8
U
-0.4
-0.2
Vec
tor
Com
p
Ant/PostSup/Inf
0
ent
0.2
on
Figure 1: Line of action of the subscapularis as applie o e humerus with respect to the scapular coordinate system.
. The rotator
d tth Stability index values are listed in Table 1cuff muscles (except the teres minor) and the middle and
hile the
90° Cocked
Teres Minor 13 16
posterior deltoid have the highest stability indices, wpectoralis major and latissimus dorsi have the lowest.
Abduction*
Apprehension Arm*
14 Supraspinatus 25 26 25
pscapularis 44 44 44 fraspinatus 31 34 32
SuInAnt Deltoid 3 16 15
id Deltoid 13 25 25 st Deltoid 14 22 22 ectoralis
ajor (Clav) 1 8 6
ectoralis ajor (Thor)
9 13 11
MPo
PM
PMLatissimus
Dorsi 10 15 11
Table 1: Stability Index of Select Shoulder Muscles in three Relevant Positions
*Stability Index calculated without moment arm values
DISCUSSION ons to glenohumeral stability by select
shouexaminin dices it is essential to note that the valuwer l rm data into certainly included, it is still poss ed on these prel prehension position data, which does include the moment arm values.
greatest potential to stabilize the
sting that although they are large, powerful muscles, they have the least potential to stabilize the shoulder joint. This can be explained by their lines of action, which have the smallest components in the medial direction of all the muscles we looked at.
Based on our stability index, the rotator cuff muscles and the middle and posterior deltoid have the most potential to stabilize the shoulder. Rehabilitation protocols following shoulder injury should focus on returning function to these muscles. Further work in this area should focus on incorporating the moment arm data for the other two positions. Furthermore, incorporating EMG data that indicates levels of muscle activity in each position will also give a better picture of which muscles are acting to stabilize the joint.
REFERENCES 1. Cave EJ, et al.: Trauma Management
The contributilder muscles were characterized in this study. When
g the stability ines for the 90° Abduction and Cocked Arm positions e ca culated without incorporating the moment a the stability equation. Although the index values will
change when that data isible to make some observations basiminary calculations as well as the ap
The subscapularis had theshoulder joint in all three positions. Additionally, the
remaining rotator cuff muscles (infraspinatus, supraspinatus, teres minor) also had high stability indices, which agrees with previous studies that suggest that the rotator cuff provides stability to the shoulder.7 The pectoralis major and latissimus dorsi had the lowest stability indices in all of the positions, sugge
, 1974. 2. Morrey BF, et al.: Biomechanics of the Shoulder. 3. Van der Helm FTC, et al.: J Biomechanics, 27:
551- 69, 1994. 4. Basset RW, et al.: J Biomechanics, 23: 405-15, 1990. 5. Veeger HE, et al.: J Biomechanics, 24: 615-29, 1991. 6. Ikai M, et al.: Int Z Angew Physiol, 26: 26-32, 1968. 7. Rockwood CA, et al.: The Shoulder, 1998.
ACKNOWLEDGEMENTS I would like to thank John Jolly for all of his assistance
throughout this project. I also want to thank my advisors Dr. McMahon, and Dr. Debski as well as the rest of the Shoulder group. Finally, I want to thank Dr. Woo and the rest of the MSRC for an educational and enjoyable summer.