Embed Size (px)
Citation preview

EMBARGOED FOR RELEASE – 6:00 A.M. (EST) – Tuesday, April 2, 2002
Prepared by:
Date:March 2002
2002 “Sleep in America” Poll
1522 K Street, Suite 500, NWWashington, DC 20005
Ph: (202) 347-3471Fax: (202) 347-3471
Website: www.sleepfoundation.org
©National Sleep Foundation 2002
1EMBARGOED FOR RELEASE – 6:00 A.M. (EST) – Tuesday, April 2, 2002
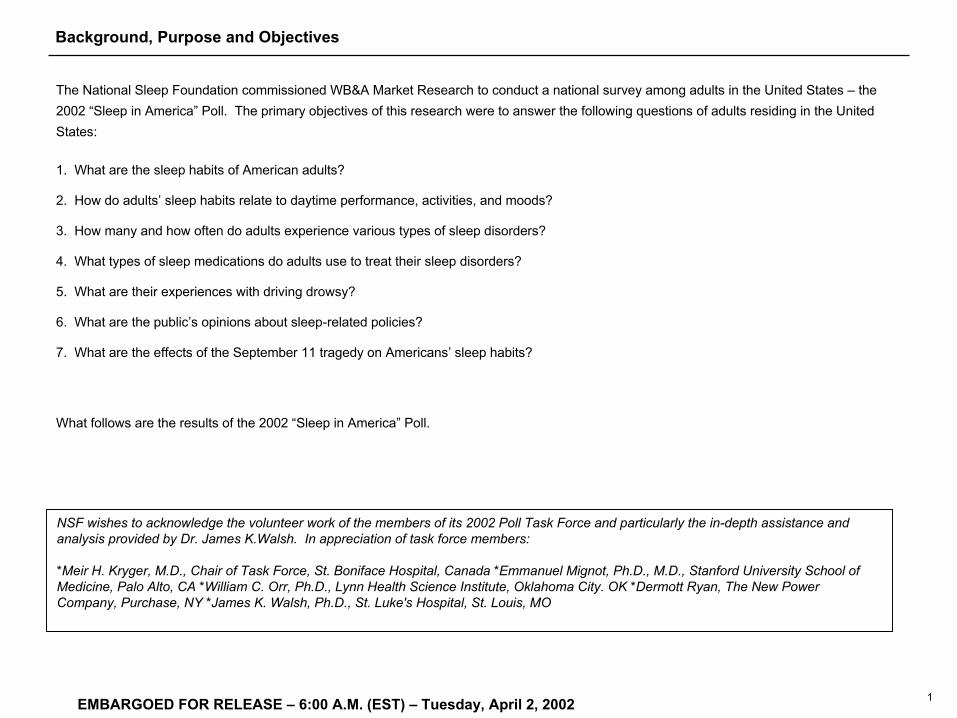
Background, Purpose and Objectives
The National Sleep Foundation commissioned WB&A Market Research to conduct a national survey among adults in the United States – the 2002 “Sleep in America” Poll. The primary objectives of this research were to answer the following questions of adults residing in the United States:
1. What are the sleep habits of American adults?
2. How do adults’ sleep habits relate to daytime performance, activities, and moods?
3. How many and how often do adults experience various types of sleep disorders?
4. What types of sleep medications do adults use to treat their sleep disorders?
5. What are their experiences with driving drowsy?
6. What are the public’s opinions about sleep-related policies?
7. What are the effects of the September 11 tragedy on Americans’ sleep habits?
What follows are the results of the 2002 “Sleep in America” Poll.
NSF wishes to acknowledge the volunteer work of the members of its 2002 Poll Task Force and particularly the in-depth assistance and analysis provided by Dr. James K.Walsh. In appreciation of task force members:
*Meir H. Kryger, M.D., Chair of Task Force, St. Boniface Hospital, Canada *Emmanuel Mignot, Ph.D., M.D., Stanford University School of Medicine, Palo Alto, CA *William C. Orr, Ph.D., Lynn Health Science Institute, Oklahoma City. OK *Dermott Ryan, The New Power Company, Purchase, NY *James K. Walsh, Ph.D., St. Luke's Hospital, St. Louis, MO
2EMBARGOED FOR RELEASE – 6:00 A.M. (EST) – Tuesday, April 2, 2002
Methodology
In order to collect the information, telephone interviews were conducted between October 1, 2001 and December 10, 2001 among a random sample of 1,010 adults. The survey averaged 20 minutes in length. In order to qualify for this study, participants had to be:
At least 18 years of age; and
Living within the continental United States.
A random sample of telephone numbers was purchased from SSI (Survey Sampling, Inc.). In addition, quotas were established by region, based on U.S. Census household data. An equal number of males and females were interviewed. Most of the interviewing was conducted on weekdays between 5:00 p.m. and 9:00 p.m., Saturdays between 10:00 a.m. and 4:00 p.m., and Sundays 4:00 p.m. and 8:00 p.m. by professional interviewers calling from WB&A’s interviewing facility located near Annapolis, Maryland.
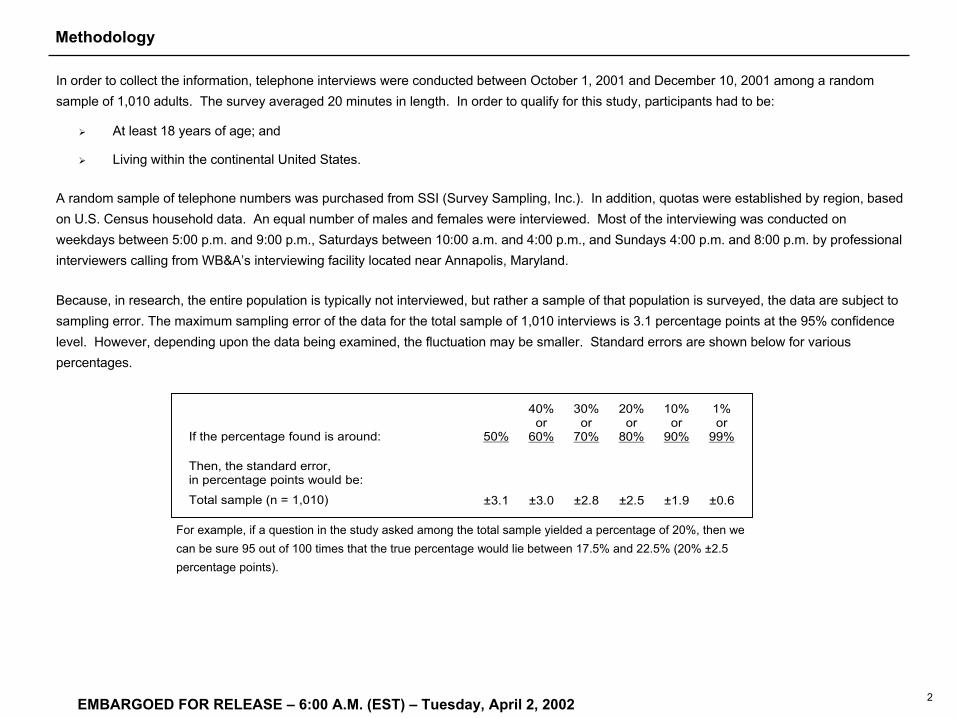
Because, in research, the entire population is typically not interviewed, but rather a sample of that population is surveyed, the data are subject to sampling error. The maximum sampling error of the data for the total sample of 1,010 interviews is 3.1 percentage points at the 95% confidence level. However, depending upon the data being examined, the fluctuation may be smaller. Standard errors are shown below for various percentages.
For example, if a question in the study asked among the total sample yielded a percentage of 20%, then we can be sure 95 out of 100 times that the true percentage would lie between 17.5% and 22.5% (20% ±2.5 percentage points).
If the percentage found is around: 50%
40% or
60%
30% or
70%
20% or
80%
10% or
90%
1% or
99%
Then, the standard error, in percentage points would be:
Total sample (n = 1,010) ±3.1 ±3.0 ±2.8 ±2.5 ±1.9 ±0.6

EMBARGOED FOR RELEASE – 6:00 A.M. (EST) – Tuesday, April 2, 2002
Executive Summary

4EMBARGOED FOR RELEASE – 6:00 A.M. (EST) – Tuesday, April 2, 2002
Percent Reporting the Number of Hours Slept on Weekdays (past two weeks)
1998 1999 2000 2001 2002
Less than 6 hours 12% 12% 13% 13% 15%
6 to 6.9 hours 23 22 24 18 24
7 to 7.9 hours 28 31 30 31 29
8 or more hours 35 35 33 38 30
Mean (# of hours) na 7.0 6.9 7.0 6.9
Median (# of hours) na na na 7.0 7.0
Percent Reporting the Number of Hours Slept on Weekends (past two weeks)
1998 1999 2000 2001 2002
Less than 6 hours 8% 8% 9% 7% 10%
6 to 6.9 hours 14 14 14 10 12
7 to 7.9 hours 23 20 21 21 22
8 or more hours 53 58 56 61 52
Mean (# of hours) na 7.6 7.5 7.8 7.5
Median (# of hours) na na na 8.0 8.0
Executive Summary – Sleep Habits
The 2002 “Sleep in America” Poll indicates that, on average, respondents are sleeping 6.9 hours during the weekdays and an average of 7.5 hours on the weekends.
• A significant proportion of respondents (39%) report getting less than seven hours of sleep on weeknights. In fact, more than two-thirds (68%) are getting less than eight hours of sleep on weeknights.
• Some of the people are increasing their sleep time on the weekends, as more than one-half (52%) are getting eight hours of sleep or more on the weekends (compared to 30% on weekdays).
• Respondents who tend to sleep less during the week are more likely to be males (6.7) vs. females (7.0), those who are between the ages of 18-29 (6.9) and 30-64 (6.7) vs. those who are 65 or older (7.3), those with children in the household (6.7) vs. those without children (6.9), and shift workers (6.5) vs. regular day shift workers (6.8).
As shown in the tables below, the number of hours slept on weekdays and weekends has remained consistent over the last four years (1998-2002). The timing of sleep (bedtimes and wake-up times on weekends and weekdays) also has not changed during this time period (not shown).
5EMBARGOED FOR RELEASE – 6:00 A.M. (EST) – Tuesday, April 2, 2002
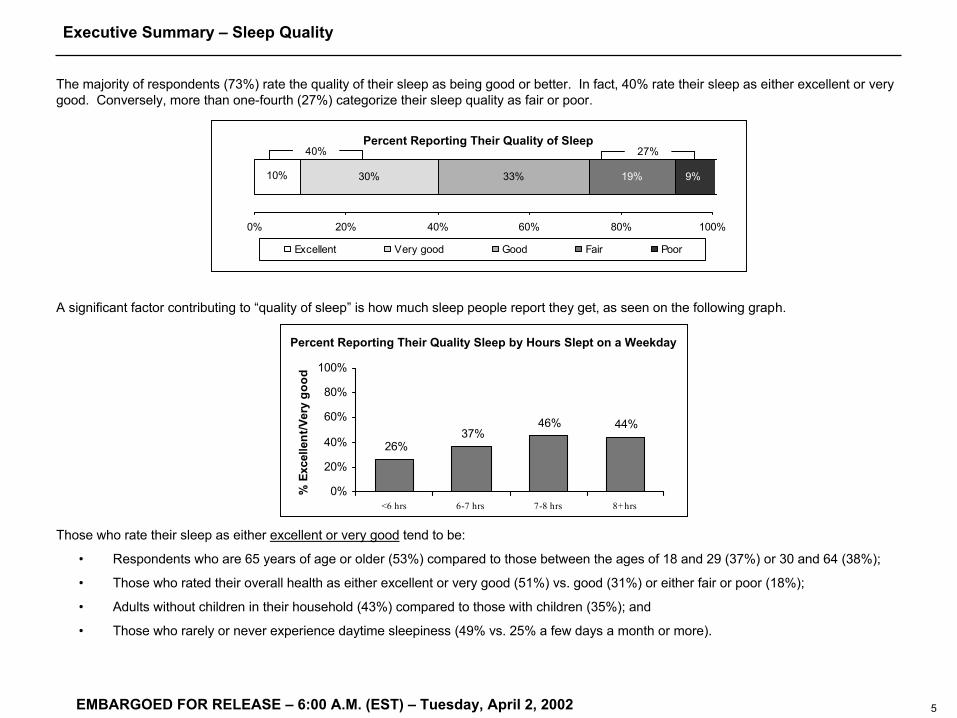
The majority of respondents (73%) rate the quality of their sleep as being good or better. In fact, 40% rate their sleep as either excellent or very good. Conversely, more than one-fourth (27%) categorize their sleep quality as fair or poor.
A significant factor contributing to “quality of sleep” is how much sleep people report they get, as seen on the following graph.
Those who rate their sleep as either excellent or very good tend to be:
• Respondents who are 65 years of age or older (53%) compared to those between the ages of 18 and 29 (37%) or 30 and 64 (38%);
• Those who rated their overall health as either excellent or very good (51%) vs. good (31%) or either fair or poor (18%);
• Adults without children in their household (43%) compared to those with children (35%); and
• Those who rarely or never experience daytime sleepiness (49% vs. 25% a few days a month or more).
40% 27%
30% 33% 19%10% 9%
0% 20% 40% 60% 80% 100%
Excellent Very good Good Fair Poor
Percent Reporting Their Quality of Sleep
Executive Summary – Sleep Quality
44%46%37%
26%
0%
20%
40%
60%
80%
100%
<6 hrs 6-7 hrs 7-8 hrs 8+ hrs
% E
xcel
lent
/Ver
y go
od
Percent Reporting Their Quality Sleep by Hours Slept on a Weekday

6EMBARGOED FOR RELEASE – 6:00 A.M. (EST) – Tuesday, April 2, 2002
58%
35% 23% 21% 21%
0% 20% 40% 60% 80% 100%
2002
Every night or almost every night A few nights a w eek A few nights a month Rarely/Never
Insomnia
Insomnia is defined as any of the following symptoms: difficulty falling asleep, waking a lot during the night, waking up too early and not being able to get back to sleep, and waking up feeling unrefreshed.
More than one-half of the respondents (58%) report having experienced at least one of the four symptoms of insomnia at least a few nights a week (see graph below). In fact, 35% say they experienced at least one of these four symptoms of insomnia every night or almost every night in the past year.
Adults who are more likely to experience symptoms of insomnia at least a few nights a week include:
• Females (63%) vs. males (54%);
• Adults aged 18 to 29 (68%) or 30 to 64 (59%) compared to adults aged 65 or older (44%);
• Those who have children in the household (66%) compared to those without children in the household (54%);
• Those who experience daytime sleepiness at least a few days a month (75% vs. 49% rarely or never); and
• Those who say they are in fair or poor health (80% vs. 64% good or 49% excellent or very good health).
Percent Reporting One or More Symptoms of Insomnia
Executive Summary – Symptoms of Sleep Disorders

7EMBARGOED FOR RELEASE – 6:00 A.M. (EST) – Tuesday, April 2, 2002
24%25%
36%40%
0%
10%
20%
30%
40%
50%
Percent Reporting Insomnia Symptoms within the Past Year(a few nights a week or more)
Awake a lotduring the night
Woke up feelingunrefreshed
Difficulty falling asleep
Woke up too early & could not get back to sleep
More common symptoms of insomnia, experienced at least a few nights a week in the past year were waking up feeling unrefreshed (40%) and/or being awake a lot during the night (36%). These were followed by approximately one-fourth of respondents who said that they had difficulty falling asleep (25%) and/or woke up too early and could not get back to sleep (24%) at least a few nights a week.
Executive Summary – Symptoms of Sleep Disorders (cont’d)
Two symptoms of insomnia, waking up feeling unrefreshed and difficulty falling asleep, are more likely to be experienced by 18 to 29 year olds and 30 to 64 year olds than those 65 or older.
25%
41%49%
19%24%33%
0%
20%
40%
60%
80%
100%
18-29 years old 30-64 years old 65 or older
Woke up feeling un-refreshed Diff iculty falling asleep
Percent Reporting Two Insomnia Symptoms by Age(a few nights a week or more)

8EMBARGOED FOR RELEASE – 6:00 A.M. (EST) – Tuesday, April 2, 2002
Insomnia is defined as any of the following symptoms: difficulty falling asleep, waking a lot during the night, waking up too early and not being able to get back to sleep, and waking up feeling unrefreshed.
More than one-half of the respondents (58%) report having experienced at least one of the four symptoms of insomnia at least a few nights a week (see graph below). In fact, 35% say that they experienced at least one of these four symptoms of insomnia every night or almost every night in the past year.
Snoring: Frequent or loud snoring is a symptom of sleep apnea.
Thirty-seven percent (37%) of adults report that they have snored at least a few nights a week in the past year. In fact, 27% say that they snore every night or almost every night. Males are more likely than females to report snoring at least a few nights a week during the past year (42% vs. 31%).
Pauses in breathing: Observed or experienced pauses in breathing during sleep can be a symptom of sleep apnea.
Nine percent (9%) of adults report experiencing pauses in breathing during sleep at least a few nights a week over the past year. Males are more likely than females to say that they experience pauses in breathing at least a few nights a week in the last year (11% vs. 7%).
Unpleasant, tingling feelings in legs: A common report of those with restless legs symptoms.
Symptoms of Restless Legs (RLS) were reported by 16% of the respondents. Respondents who are 18 to 29 years of age are less likely than older adults to report experiencing RLS at least a few nights a week (8% vs. 17%-18%).
Executive Summary – Symptoms of Sleep Disorders (cont’d)
9%16%
37%
58%
0%
20%
40%
60%
80%
100%
Insomnia Snoring Restless Legs symptoms Pauses in breathing
Percent Reporting Symptoms of Sleep Disorders(a few nights a week or more)
Of the many adults reporting symptoms, less than one in ten have been diagnosed with insomnia (6%), sleep apnea (4%) or RLS (4%). Even fewer respondents have been treated for insomnia (4%), sleep apnea (2%) or RLS (1%).

9EMBARGOED FOR RELEASE – 6:00 A.M. (EST) – Tuesday, April 2, 2002
Any Symptom of a Sleep Disorder
The following are defined as symptoms of a sleep disorder: difficulty falling asleep, waking a lot during the night, waking up too early and not being able to get back to sleep, waking up feeling unrefreshed, snoring, unpleasant, tingling feelings in legs (RLS), or pauses in breathing.
Overall, 74% of respondents in the 2002 study experienced at least one symptom of a sleep disorder a few nights a week or more, representing a small, but significant increase from those who experienced at least one symptom of a sleep disorder in 2001 (69%) or in previous years (62%).
Those who are most likely to experience a symptom of a sleep disorder a few nights a week or more include:
• Adults between the ages of 18 and 29 (77%) or 30 to 64 (76%) compared to those 65 years of age or older (60%);
• Those who experience daytime sleepiness at least a few days a month (88% vs. 65% rarely or never); and
• Those who report being in fair or poor health (93% vs. 66% excellent or very good health or 78% good health).
62% 62%69%
74%
0%
20%
40%
60%
80%
100%
1999 2000 2001 2002
Percent Reporting One or More Symptoms of a Sleep Disorder (a few nights a week or more) by Year
Executive Summary – Symptoms of Sleep Disorders (cont’d)

10EMBARGOED FOR RELEASE – 6:00 A.M. (EST) – Tuesday, April 2, 2002
5% 5% 14%
10%
5%
6%
3%
2%
2%
4%
6%
11%
0% 10% 20% 30% 40% 50%
Every night/A few nights a w eek A few nights a month Rarely
Executive Summary – Sleep Aids
Sleep Aids
During the past year, 15% of the respondents report using either a prescription sleep medication (8%) and/or an over-the-counter (OTC) sleep aid (10%) to help them sleep at least a few nights a month. This is an increase from 11% in 2001 who reported using either prescription and/or OTC sleep aids.
Characteristics of those who are more likely to use sleep aids at least a few nights a month include:
• Females are more likely than males to have used over-the-counter sleep aids (12% vs. 7%) and/or prescription sleep aids (10% vs. 6%) at least a few nights a month.
• Adults who report having any symptom of insomnia at least a few nights a month (18% vs. 7% rarely or never) were more apt to take sleep aids, both prescription and OTC, to help them sleep.
• Those who mention having daytime sleepiness at least a few times a month are more likely to have taken a sleep aid at least a few nights a month (22% vs. 12%).
Percent Reporting Use of Medications to Help Sleep
Use over-the-counteror store bought sleep aids
Use medicationprescribed by a doctor
2001
2002
2001
2002
11%
15%
0%
5%
10%
15%
20%
2001 2002
Percent Reporting Use of Any Medication to Help Sleep
(at least a few nights a month)
11EMBARGOED FOR RELEASE – 6:00 A.M. (EST) – Tuesday, April 2, 2002
46% 47%61% 60%
43%27%
0%
20%
40%
60%
80%
100%
No sleepproblems
Any sleepproblem
Any Insomnia Pauses inbreathing
RLS Snoring
44%38%
23%
0%
20%
40%
60%
80%
100%
18-29 year olds 30-64 year olds 65 or older
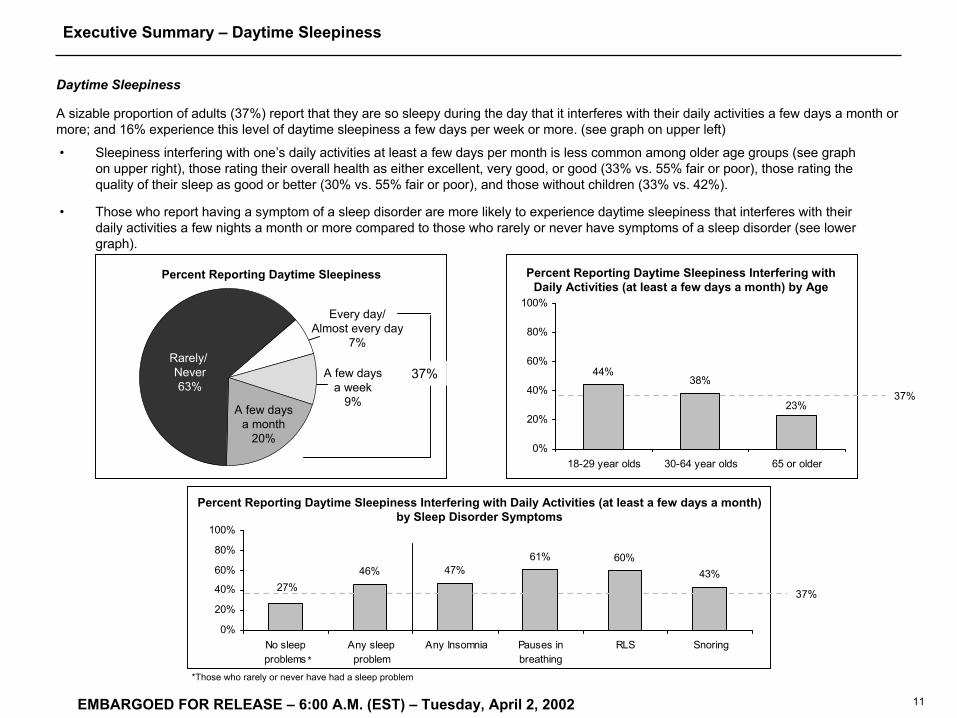
• Sleepiness interfering with one’s daily activities at least a few days per month is less common among older age groups (see graph on upper right), those rating their overall health as either excellent, very good, or good (33% vs. 55% fair or poor), those rating the quality of their sleep as good or better (30% vs. 55% fair or poor), and those without children (33% vs. 42%).
• Those who report having a symptom of a sleep disorder are more likely to experience daytime sleepiness that interferes with their daily activities a few nights a month or more compared to those who rarely or never have symptoms of a sleep disorder (see lowergraph).
Executive Summary – Daytime Sleepiness
Every day/Almost every day
7%
Percent Reporting Daytime Sleepiness
A few daysa week
9%A few daysa month
20%
Rarely/ Never63%
Percent Reporting Daytime Sleepiness Interfering with Daily Activities (at least a few days a month) by Age
Percent Reporting Daytime Sleepiness Interfering with Daily Activities (at least a few days a month) by Sleep Disorder Symptoms
37%
37%
**Those who rarely or never have had a sleep problem
37%
Daytime Sleepiness
A sizable proportion of adults (37%) report that they are so sleepy during the day that it interferes with their daily activities a few days a month or more; and 16% experience this level of daytime sleepiness a few days per week or more. (see graph on upper left)

12EMBARGOED FOR RELEASE – 6:00 A.M. (EST) – Tuesday, April 2, 2002
DK/Refused5%
Prescription11%
Both5%
Over-the-counter
79%
Yes6%No
94%
Percent Taking Medicine to Stay Awake Type of Medicine Taken
In this year’s survey, 6% of respondents indicate that they have taken medications to stay awake. Among those who have taken these medications, the majority report using an over-the-counter medication (79%), while roughly 11% (.6% of entire sample) used a prescription medication.
• Adults who report daytime sleepiness at least a few days a week are most likely to take a medication to keep them awake (8% vs. 4%).
Executive Summary – Stay-Awake Medications

13EMBARGOED FOR RELEASE – 6:00 A.M. (EST) – Tuesday, April 2, 2002
Executive Summary – Perceived Sleep Need
24% 29%
0% 20% 40% 60% 80% 100%
Less than needed The same as needed
Percent of Respondents Reporting Usual Weekday Sleep Duration Less Than or the Same as the Minimum Hours of Sleep Needed
Thirty percent (30%) of respondents say that they need a minimum of eight hours of sleep per night in order to not feel sleepy the next day. The proportions reporting a minimum nightly sleep need of less than 6 hours is 19%, 6 up to 7 hours is 30%, and 7 up to 8 hours is 19%.Responses to “the minimum number of hours of sleep they need not to feel sleepy the next day” were compared to the number of hours slept on weekdays to determine whether each respondent was getting less sleep, the same amount of sleep, or more sleep than the amount they say is the minimum numbers of hours of sleep that they need to not feel sleepy the next day.
• As shown in the graph (below left), 24% state they get less than the minimum amount of sleep they say they need; 29% report getting the minimum amount needed. And, 43% say they usually obtain more than the minimum amount needed to avoid sleepiness the next day
• As respondents get older, they are more likely to get enough sleep so that they do not feel sleepy the next day (29% 18 to 29 year olds vs. 25% 30 to 64 years olds vs. 12% 65 or older).
12%
25%29%
0%
20%
40%
60%
80%
100%
18-29 year olds 30-64 year olds 65 or older
Percent Getting Less Sleep Than Minimum Hours of Sleep Needed by Age
14EMBARGOED FOR RELEASE – 6:00 A.M. (EST) – Tuesday, April 2, 2002
60%
79%
31%
42%
38%
39%
33%
20%
18%17%
44%
52%
53%
32%
9%
6%
6%
4%
1%
5%
2%
2%
0% 20% 40% 60% 80% 100%
Completely agree Mostly agree Mostly disagree Completely disagree
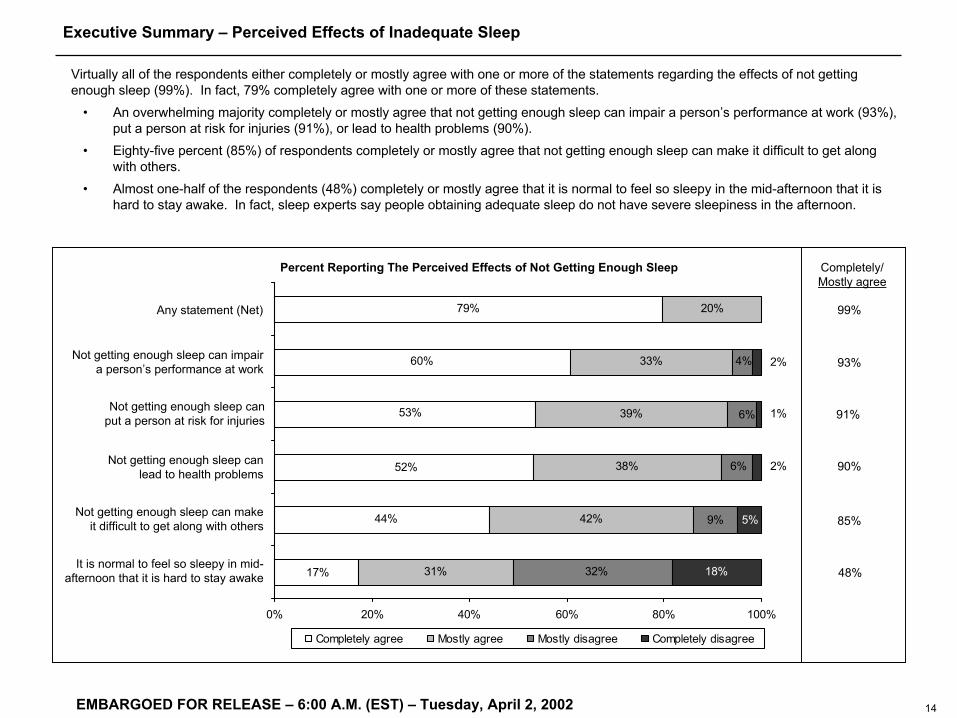
Percent Reporting The Perceived Effects of Not Getting Enough Sleep Completely/Mostly agree
93%
90%
85%
48%
91%
99%
Not getting enough sleep can impaira person’s performance at work
It is normal to feel so sleepy in mid-afternoon that it is hard to stay awake
Not getting enough sleep canlead to health problems
Not getting enough sleep canput a person at risk for injuries
Not getting enough sleep can makeit difficult to get along with others
Any statement (Net)
Executive Summary – Perceived Effects of Inadequate Sleep
Virtually all of the respondents either completely or mostly agree with one or more of the statements regarding the effects of not getting enough sleep (99%). In fact, 79% completely agree with one or more of these statements.
• An overwhelming majority completely or mostly agree that not getting enough sleep can impair a person’s performance at work (93%), put a person at risk for injuries (91%), or lead to health problems (90%).
• Eighty-five percent (85%) of respondents completely or mostly agree that not getting enough sleep can make it difficult to get along with others.
• Almost one-half of the respondents (48%) completely or mostly agree that it is normal to feel so sleepy in the mid-afternoon that it is hard to stay awake. In fact, sleep experts say people obtaining adequate sleep do not have severe sleepiness in the afternoon.

15EMBARGOED FOR RELEASE – 6:00 A.M. (EST) – Tuesday, April 2, 2002
16%
17%
25%
32%
51%
31%
46%
46%
46%
41%
36%
35%
9%
6%
8%
6%
7%
5%
7%
4%
5%
5%
6%
4%
4%
5%
16%
15%
11% 41%
16%
22%
24%
25%
24%
38%
33%
5%
3%
2%
2%
2%
4%
2%
Much harder Somew hat harder The same Somew hat easier Much easier Don't know /Refused
Any statement (Net)
Read a report/business document forat least one hour before feeling sleepy
Produce quality work tothe best of your ability
Take on additional tasks at theend of a regular work day
Listen carefully so that youremember what is being said
Make careful, thought-out decisions
Follow through on instructionsyou just received
Shop for grocery items, rememberingmost items without a list
Percent Reporting The Ease of Doing Activities on Days with Enough Sleep Versus Days Without Enough Sleep Somewhat/Much Harder
68%
62%
61%
62%
52%
47%
66%
86%
Executive Summary – Perceived Task Difficulty After Inadequate Sleep
Respondents were read a number of activities (listed in graph below) and were asked to rate the degree of difficulty in doing these tasks when they did not get enough sleep the previous night, compared to days following a full night’s sleep. The great majority of respondents (86%) indicated that it would be much or somewhat harder to do one or more of the activities on days when they did not get enough sleep, with 51% of respondents reporting that it would be much harder. Without getting enough sleep the previous night, most respondents feel that it would be much or somewhat harder to:
• Read a report or business document for at least one hour before feeling sleepy (68%);• Take on additional tasks at the end of a regular work day (66%);• Make careful, thought-out decisions (62%);• Listen carefully so that you remember what is being said (62%); and• Produce quality work to the best of your ability (61%).
Without getting enough sleep the previous night, approximately one-half believe that it would be much or somewhat harder to:• Follow through on instructions they just received (52%); and• Shop for grocery items, remembering most items without a list (47%).

16EMBARGOED FOR RELEASE – 6:00 A.M. (EST) – Tuesday, April 2, 2002
12%
23%
29%
49%
26%
32%
47%
36%
36%
39%
22%
20%
15%
9%
8%
8%
20%
9%
10%
5%
7%
5%
18%
11%
9% 14%
20%
19%
19%
30%
31%
30%
2%
7%
2%
2%
2%
4%
Much more likely Somew hat more likely Just as likely Somew hat less likely Much less likely Don't know /Refused
Percent Reporting The Likelihood of Their Behavior on Days Without Enough SleepMuch/
Somewhat more likely
Eat more than usual
Have difficulty getting along with others
Get upset with children whenthey are noisy or misbehave
Make mistakes or errors
Complete a physical task ina safe manner without injury
Get impatient/aggravated when waiting in line, when traffic is backed up, or when
others are late for an event/meeting
Any statement (Net)
64%
65%
44%
37%
24%
59%
88%
Executive Summary – Perceived Likelihood of Behavior After Inadequate Sleep
Respondents were read a number of behaviors (listed below in the graph) and asked how likely they are to behave in that way after not getting enough sleep. Eighty-eight percent (88%) of respondents report that they would be much or somewhat more likely to do one or more of these behaviors after not getting enough sleep, with 49% of the respondents being much more likely.
• The majority of respondents said they are much or somewhat more likely to make mistakes or errors (65%), to get impatient or aggravated when waiting (64%), and/or to get upset with children when they are noisy or misbehave (59%).
• Smaller percentages of respondents report they are much or somewhat more likely to have difficulty getting along with others (44%), completing a task in a safe manner without injury (37%), or to eat more than usual (24%).
• Those who are between the ages of 18 and 29 are more likely than their older counterparts to get impatient or aggravated while waiting (76% vs. 66% of 30 to 64 year olds vs. 45% of 65 or older).
• On days when they did not get enough sleep, females are more likely than males to eat more than usual (27% vs. 20%) and those who experience daytime sleepiness a few days a month or more are more likely to eat more than usual (31% vs. 19%).

17EMBARGOED FOR RELEASE – 6:00 A.M. (EST) – Tuesday, April 2, 2002
Full of energy
Optimistic
Happy
Seeking social interaction
Relaxed
Satisfied with life
Peaceful
Percent Reporting Their General Mood and Attitude on a Typical Day
Respondents were asked to rate themselves regarding their mood and attitude on a typical day on seven dimensions using a five-point scale.Overall, at least two out of three respondents rate that, on a typical day, they are satisfied with life (74%), they tend to be happy (70%), and/or they are peaceful (68%).
• Sixty-two (62%) report that they tend to be optimistic. • Slightly fewer than one-half report that they tend to be relaxed (47%), full of energy (45%), and/or seek social interaction (43%).• Respondents who are 65 years of age or older are more likely than their younger counterparts to be relaxed, satisfied with life, and
peaceful on a typical day.• On a typical day, males are more likely than females to report being full of energy, angry, and prefer to be alone, while females are
more likely than males to report being stressed.
11%
6%
6%
6%
12%
13%
11%
38%
39%
33%
32%
33%
29%
26%
30%
31%
41%
30%
12%
18%
17%
3%
8%
8%
3%
2%
2%4%
34%
32%
36%
27%
16%
23%
26%Angry
Sad
Dissatisf ied w ith life
Pessimistic
Tired
Stressed
Prefer to be alone
1 (Negative) 2 3 4 5 (Positive)
Executive Summary – Mood and Attitudes on a Typical Day

18EMBARGOED FOR RELEASE – 6:00 A.M. (EST) – Tuesday, April 2, 2002
• Respondents who are 65 years of age or older are more likely than their younger counterparts to have a very positive score on mood and attitude (30 or higher).
• Interestingly, those with higher mood scores are more likely to get at least the minimum number of hours of sleep needed to not feel tired, while those with lower mood scores are more likely to get less than the minimum number of hours of sleep needed to not feel sleepy the next day.
Neutral 22 to 25
25%
Negative 7 to 21
21%Very Positive 30 or more
22%
Positive26 to 29
32%
Percent of Respondents by Mood and Attitude Score
Executive Summary – Moods and Attitudes on a Typical Day (cont’d)
From responses to these seven mood and attitude ratings, respondents were classified into four mood and attitude groups (mood and attitude score) which would allow examination of the relationship of typical mood and attitude and a number of sleep factors.

19EMBARGOED FOR RELEASE – 6:00 A.M. (EST) – Tuesday, April 2, 2002
61%
38%33%
75%
49%
42%
62%
39%
30%
60%58%50%
40% 38%42%
58%
0%
20%
40%
60%
80%
100%
Executive Summary – Sleep Associations with Mood and Attitude
Percent of Respondents with Very Positive or Positive Mood and Attitude Scores
<6 6-7 7-8 8+ Fewdays aweek
Fewdays amonth
Rarely/Never
Fewnights a
week
Fewnights amonth
Rarely/Never
Fewnights a
week
Fewnights amonth
Rarely/Never
Fewnights a
week
Fewnights amonth
Rarely/Never
Hours Slept on a Weekday Daytime Sleepiness Insomnia Snore/Pauses in Breathing Restless Legs symptoms
The graph below shows the proportions of respondents with very positive or positive mood and attitude scores as a function of various sleep characteristics. Some of the highlights include:
• The longer people sleep on weekdays, the more likely they are to have a very positive or positive mood and attitude score.
• The less frequently people experience daytime sleepiness, the more likely they are to have a very positive or positive mood and attitude score.
• The less frequently people report insomnia symptoms, the more likely they are to have a very positive or positive mood and attitude score.
• Those who report “rarely or never” to snoring and having pauses in breathing or Restless Legs symptoms are more likely to have a very positive or positive mood and attitude score, as compared to people reporting that they experience these symptoms.
20EMBARGOED FOR RELEASE – 6:00 A.M. (EST) – Tuesday, April 2, 2002
15%16%24%
32%
0%
20%
40%
60%
80%
100%
61%68%
63%
51%
0%
20%
40%
60%
80%
100%
7%7%7%14%
0%
20%
40%
60%
80%
100%
Executive Summary – Hours Slept on Weekdays With Mood and Attitude
…Tired …Optimistic
16%18%23%32%
0%
20%
40%
60%
80%
100%
<6 6-7 7-8 8+
75%78%73%
65%
0%
20%
40%
60%
80%
100%
<6 6-7 7-8 8+
4%5%7%11%
0%
20%
40%
60%
80%
100%
<6 6-7 7-8 8+
…Sad
…Stressed …Satisfied with Life …Angry
<6 6-7 7-8 8+ <6 6-7 7-8 8+ <6 6-7 7-8 8+
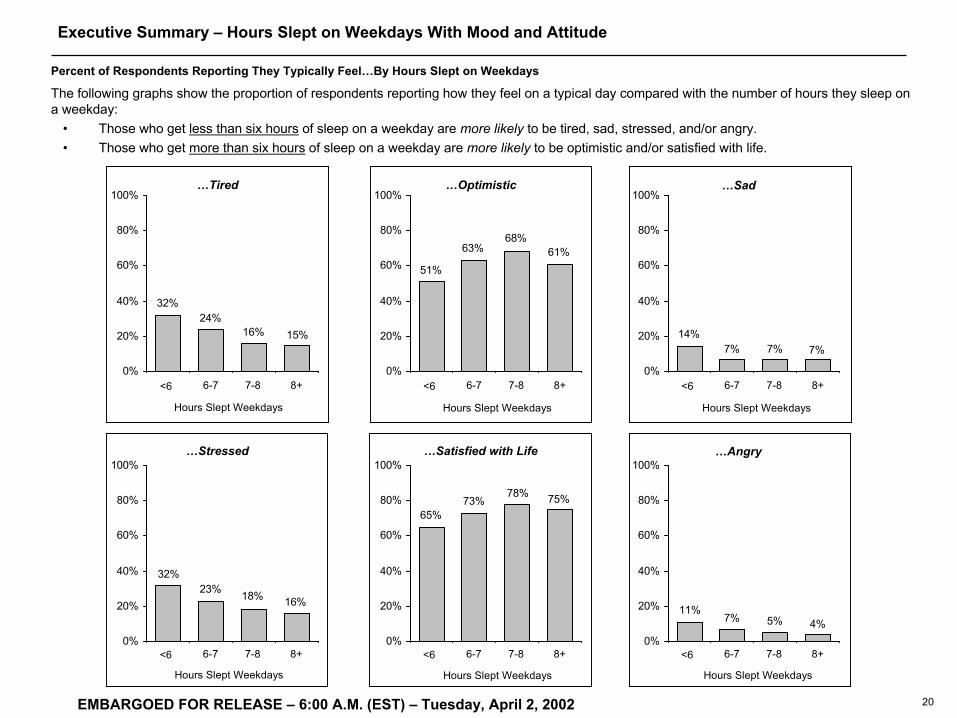
Percent of Respondents Reporting They Typically Feel…By Hours Slept on Weekdays
The following graphs show the proportion of respondents reporting how they feel on a typical day compared with the number of hours they sleep on a weekday:
• Those who get less than six hours of sleep on a weekday are more likely to be tired, sad, stressed, and/or angry.• Those who get more than six hours of sleep on a weekday are more likely to be optimistic and/or satisfied with life.
Hours Slept Weekdays Hours Slept Weekdays
Hours Slept Weekdays Hours Slept Weekdays
Hours Slept Weekdays
Hours Slept Weekdays

21EMBARGOED FOR RELEASE – 6:00 A.M. (EST) – Tuesday, April 2, 2002
54%
34%30%
0%
20%
40%
60%
80%
100%
7%14%
21%
0%
20%
40%
60%
80%
100%
4%9%12%
0%
20%
40%
60%
80%
100%
Percent of Respondents Reporting They Typically Feel… By Daytime Sleepiness
The following graphs show the proportion of respondents reporting how they feel on a typical day compared with how often they experience daytime sleepiness:
• Those who rarely or never experience daytime sleepiness are more likely to be full of energy and/or relaxed.• Those who rarely or never experience daytime sleepiness are less likely to be pessimistic, sad, dissatisfied with life, and/or angry.
53%
30%21%
0%
20%
40%
60%
80%
100%
8%13%
18%
0%
20%
40%
60%
80%
100%
6%11%15%
0%
20%
40%
60%
80%
100%
Executive Summary – Daytime Sleepiness With Mood and Attitude
…Full of Energy …Pessimistic …Sad
…Relaxed …Dissatisfied with Life …Angry
Few daysa week
Few daysa month
Rarely/Never
Few daysa week
Few daysa month
Rarely/Never
Few daysa week
Few daysa month
Rarely/Never
Few daysa week
Few daysa month
Rarely/Never
Few daysa week
Few daysa month
Rarely/Never
Few daysa week
Few daysa month
Rarely/Never
Daytime Sleepiness Daytime Sleepiness Daytime Sleepiness
Daytime Sleepiness Daytime Sleepiness Daytime Sleepiness

22EMBARGOED FOR RELEASE – 6:00 A.M. (EST) – Tuesday, April 2, 2002
70%
41%35%
0%
20%
40%
60%
80%
100%
Few nightsa week
Few nightsa month
Rarely/Never
85%
71%67%
0%
20%
40%
60%
80%
100%
Few nightsa week
Few nightsa month
Rarely/Never
83%
64%61%
0%
20%
40%
60%
80%
100%
Few nightsa week
Few nightsa month
Rarely/Never
68%
38%32%
0%
20%
40%
60%
80%
100%
78%
58%56%
0%
20%
40%
60%
80%
100%82%
66%61%
0%
20%
40%
60%
80%
100%
Executive Summary – Symptoms of Insomnia With Mood and Attitude (cont’d)
…Full of Energy …Optimistic …Happy
…Relaxed …Satisfied with Life …Peaceful
Few nightsa week
Few nightsa month
Rarely/Never
Percent of Respondents Reporting They Typically Feel…By Any Symptom of Insomnia
The following graphs show the proportion of respondents reporting how they feel on a typical day compared with how often they have experienced a symptom of insomnia:
• Those who have rarely or never have any symptoms of insomnia are more likely to be full of energy, optimistic, happy, relaxed, satisfied with life, and/or peaceful.
• Those who experience symptoms of insomnia a few nights a week or more are less likely to report any of these moods and attitudes.
Few nightsa week
Few nightsa month
Rarely/Never
Few nightsa week
Few nightsa month
Rarely/Never
Symptoms of Insomnia Symptoms of Insomnia Symptoms of Insomnia
Symptoms of Insomnia Symptoms of Insomnia Symptoms of Insomnia
23EMBARGOED FOR RELEASE – 6:00 A.M. (EST) – Tuesday, April 2, 2002
51%
31%27%
0%
20%
40%
60%
80%
100%
75%
62%59%
0%
20%
40%
60%
80%
100%
71%
57%55%
0%
20%
40%
60%
80%
100%
17%
36%38%
0%
20%
40%
60%
80%
100%
68%
53%52%
0%
20%
40%
60%
80%
100%
74%
61%59%
0%
20%
40%
60%
80%
100%
Executive Summary – Snoring and Pauses in Breathing With Mood and Attitude (cont’d)
…Tired …Optimistic …Happy
…Relaxed …Satisfied with Life …Peaceful
Few nightsa week
Few nightsa month
Rarely/Never
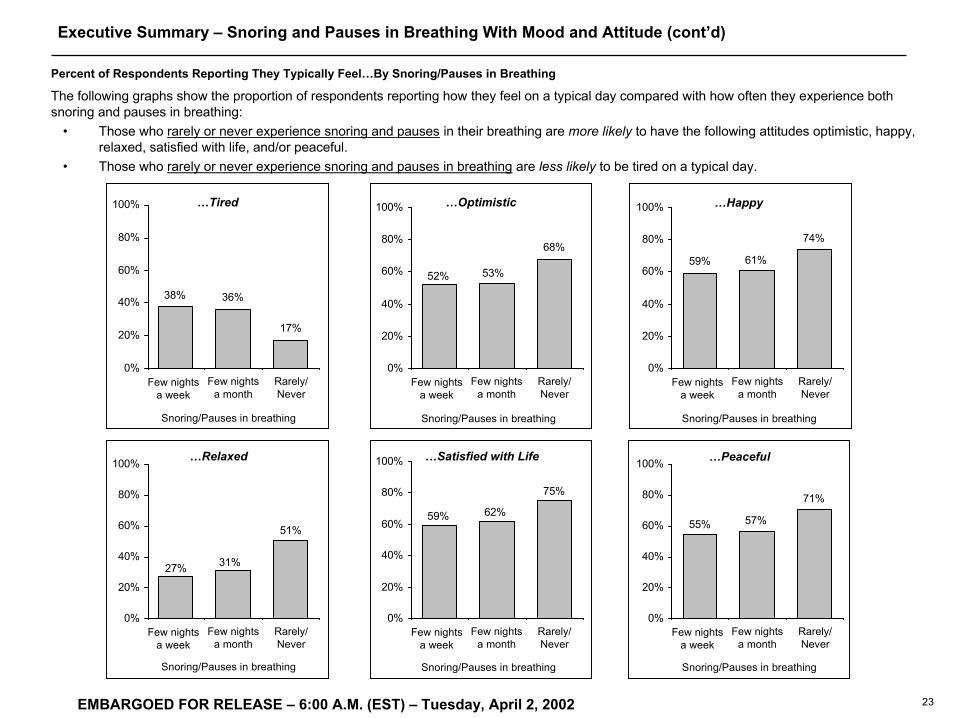
Percent of Respondents Reporting They Typically Feel…By Snoring/Pauses in Breathing
The following graphs show the proportion of respondents reporting how they feel on a typical day compared with how often they experience both snoring and pauses in breathing:
• Those who rarely or never experience snoring and pauses in their breathing are more likely to have the following attitudes optimistic, happy, relaxed, satisfied with life, and/or peaceful.
• Those who rarely or never experience snoring and pauses in breathing are less likely to be tired on a typical day.
Few nightsa week
Few nightsa month
Rarely/Never
Few nightsa week
Few nightsa month
Rarely/Never
Few nightsa week
Few nightsa month
Rarely/Never
Few nightsa week
Few nightsa month
Rarely/Never
Few nightsa week
Few nightsa month
Rarely/Never
Snoring/Pauses in breathing Snoring/Pauses in breathing Snoring/Pauses in breathing
Snoring/Pauses in breathing Snoring/Pauses in breathing Snoring/Pauses in breathing

24EMBARGOED FOR RELEASE – 6:00 A.M. (EST) – Tuesday, April 2, 2002
17%
32%37%
0%
20%
40%
60%
80%
100%
76%
66%65%
0%
20%
40%
60%
80%
100%
4%12%15%
0%
20%
40%
60%
80%
100%
17%
29%35%
0%
20%
40%
60%
80%
100%
64%54%52%
0%
20%
40%
60%
80%
100%
72%62%60%
0%
20%
40%
60%
80%
100%
Executive Summary – Restless Legs Symptoms With Mood and Attitude (cont’d)
…Tired …Optimistic …Happy
…Stressed …Satisfied with Life …Angry
Few nightsa week
Few nightsa month
Rarely/Never
Percent of Respondents Reporting They Typically Feel…By Restless Legs Symptoms
The following graphs show the percent of respondents reporting how they feel on a typical day compared with how often they experience Restless Legs symptoms:
• Those who rarely or never experience RLS are more likely to be optimistic, happy, and/or satisfied with life.• Those who rarely or never experience RLS are less likely to be tired, stressed, and/or angry.
Few nightsa week
Few nightsa month
Rarely/Never
Few nightsa week
Few nightsa month
Rarely/Never
Few nightsa week
Few nightsa month
Rarely/Never
Few nightsa week
Few nightsa month
Rarely/Never
Few nightsa week
Few nightsa month
Rarely/Never
Restless Legs symptoms Restless Legs symptoms Restless Legs symptoms
Restless Legs symptoms Restless Legs symptoms Restless Legs symptoms
25EMBARGOED FOR RELEASE – 6:00 A.M. (EST) – Tuesday, April 2, 2002
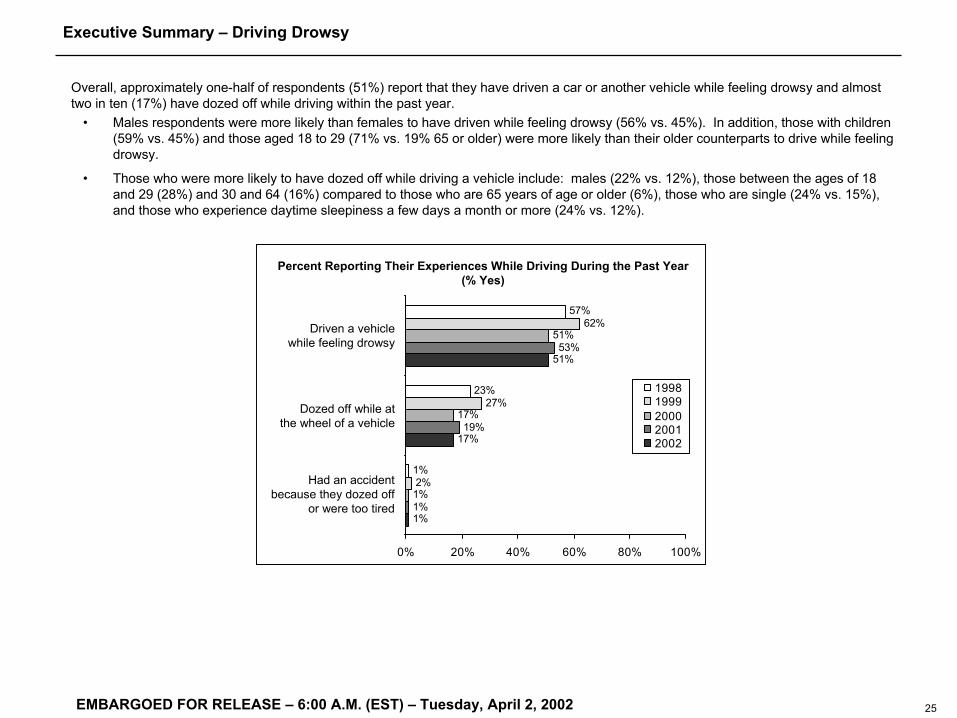
Executive Summary – Driving Drowsy
Overall, approximately one-half of respondents (51%) report that they have driven a car or another vehicle while feeling drowsy and almost two in ten (17%) have dozed off while driving within the past year.
• Males respondents were more likely than females to have driven while feeling drowsy (56% vs. 45%). In addition, those with children (59% vs. 45%) and those aged 18 to 29 (71% vs. 19% 65 or older) were more likely than their older counterparts to drive while feeling drowsy.
• Those who were more likely to have dozed off while driving a vehicle include: males (22% vs. 12%), those between the ages of 18and 29 (28%) and 30 and 64 (16%) compared to those who are 65 years of age or older (6%), those who are single (24% vs. 15%), and those who experience daytime sleepiness a few days a month or more (24% vs. 12%).
1%
17%
51%
1%
19%
53%
1%
17%
51%
2%
27%
62%
1%
23%
57%
0% 20% 40% 60% 80% 100%
19981999200020012002
Percent Reporting Their Experiences While Driving During the Past Year (% Yes)
Driven a vehiclewhile feeling drowsy
Dozed off while atthe wheel of a vehicle
Had an accidentbecause they dozed off
or were too tired

26EMBARGOED FOR RELEASE – 6:00 A.M. (EST) – Tuesday, April 2, 2002
39%
86%
70%
60%
Percent Reporting the Likelihood of Their Response if Doctor has Been on Duty for 24 Consecutive Hours
Executive Summary – Sleep Policy Issues
Physician Work HoursRespondents were read a statement asking the likelihood of their actions if they learned that the doctor that is about to perform their surgery has been on duty for 24 consecutive hours.
• Seven in ten or more respondents report that if they learned that their doctor had been on duty for 24 consecutive hours, they would be very or somewhat likely to feel anxious about their safety (86%) or to ask for a different doctor (70%). On the other hand, 60% would be very or somewhat unlikely to assume that their procedure would go well.
65%
25%
21%
31%
12%
7%
11%
45%
28% 29%
15%
6%
2%
3%
<1%
Assume your procedure w ill gow ell
Ask for a different doctor
Feel anxious about your safety
Very likely Somew hat likely Somew hat unlikely Very unlikely Don't know /Refused
27EMBARGOED FOR RELEASE – 6:00 A.M. (EST) – Tuesday, April 2, 2002
86%
Executive Summary – Sleep Policy Issues (cont’d)
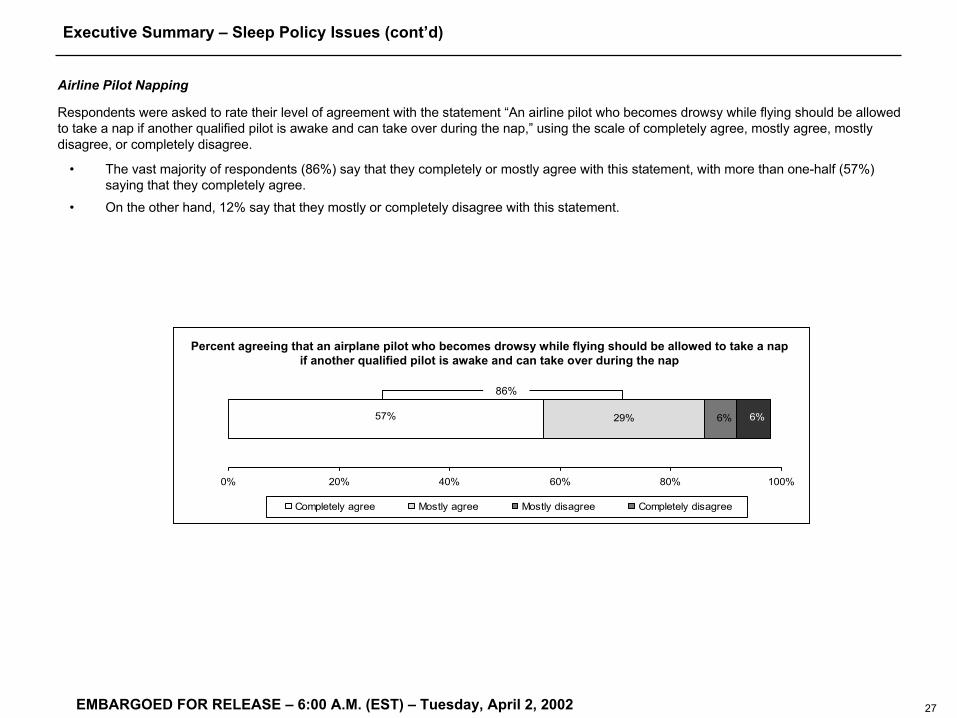
Airline Pilot Napping
Respondents were asked to rate their level of agreement with the statement “An airline pilot who becomes drowsy while flying should be allowed to take a nap if another qualified pilot is awake and can take over during the nap,” using the scale of completely agree, mostly agree, mostly disagree, or completely disagree.
• The vast majority of respondents (86%) say that they completely or mostly agree with this statement, with more than one-half (57%) saying that they completely agree.
• On the other hand, 12% say that they mostly or completely disagree with this statement.
Percent agreeing that an airplane pilot who becomes drowsy while flying should be allowed to take a nap if another qualified pilot is awake and can take over during the nap
29%57% 6% 6%
0% 20% 40% 60% 80% 100%
Completely agree Mostly agree Mostly disagree Completely disagree

28EMBARGOED FOR RELEASE – 6:00 A.M. (EST) – Tuesday, April 2, 2002
Executive Summary – Sleep Policy Issues (cont’d)
Workplace Overtime and Time Off
The vast majority of respondents (82%) completely or mostly agree that employers should not require their employees to work beyond a regular shift if the employee says that he or she is too tired or sleepy. In fact, nearly one-half of respondents (46%) said that they completely agree with this policy.
• Females are more likely than males (86% vs. 78%) to agree with this statement.
• Those who are 65 years or older (86%) are more likely to agree with this statement compared to those who are between the ages 18and 29 (77%) and 30 and 64 (83%).
More than one-half of respondents (59%) completely or mostly agree that employees should take a sick, personal, or vacation day if they do not get enough sleep the night before and feel that they will not function well at work. Fewer than one-fourth (23%) completely agree with this policy.
• Females (62% vs. 55% males) and those who are 65 years of age or older (71% vs. 57% 18 to 29, 56% 30 to 64) are more likely to agree that employees should take a sick, personal, or vacation day if they do not get enough sleep the previous night and feel they will not function well.
Percent Agreeing with Statements about Sleep in the Workplace
82%
59%Employees should take a sick, personal,
or vacation day if they do not get enough sleep the night before & feel they
will not function well at work
Employers should not require employees to work beyond a regular shift if
they say they are too tired/sleepy
36%
36%
10%23%
46%
28%
12% 3%
0% 20% 40% 60% 80% 100%
Completely agree Mostly agree Mostly disagree Completely disagree

29EMBARGOED FOR RELEASE – 6:00 A.M. (EST) – Tuesday, April 2, 2002
Maximum Work Hours
Respondents were asked the maximum number of hours that people in certain occupations should work per day in order to perform with alertness and provide services safely and effectively.
• The majority of respondents say that teachers (70%) and pilots (63%) should work a maximum of 8 hours or less per day.
• Slightly more than one-half of adults stated that truck drivers (51%) and police officers (51%) should work no more than 8 hours per day.
• Fewer respondents felt that nurses (49%) and doctors (39%) should be limited to 8 hours or less per workday.
• However, between 8% and 26% of respondents, depending on occupation, indicated maximum daily work hours should exceed 11 hours for each occupation.
5%
15%
17%
45%
34%
46%
43%
55%
46%
25%
27%
25%
27%
15%
18%
20%
26%
18%
15%
8%
12%
4%
5%
8%
4%
5%
4%
4%
5%
3%
1%
3%
3%
3%
2%
4%
Nurse
Doctor
Police off icer
Truck driver
Teacher
Airplane pilot
<8 8 9 10 11+ Don't know
Percent Reporting the Maximum Number of Hours that Should be Worked by Occupations
Executive Summary – Sleep Policy Issues (cont’d)

30EMBARGOED FOR RELEASE – 6:00 A.M. (EST) – Tuesday, April 2, 2002
40%
23% 47%
27%
8%
30% 33%
29%
19%
26% 21%
10%
15%
9%
0% 20% 40% 60% 80% 100%
Excellent Very good Good Fair Poor
Executive Summary – Impact of September 11
Percent Rating Quality of Sleep
After September 11
On most nights
Sleep and September 11
Respondents were much more likely to rate the quality of their sleep on the nights immediately following the September 11 attacks as fair or poor (47%) compared to a typical night (27%).
• Females were more likely than males to report that the quality of their sleep was fair or poor (54% vs. 40%).• Surprisingly, respondents in the Northeast (31%) were more likely than those in the South (21%) or the Midwest (15%) to rate the
quality of their sleep as excellent or very good.
In general, following September 11, respondents were more likely to have experienced symptoms of insomnia at least a few nights a week (69%) as compared to typical nights (58%). On the nights immediately following the attacks, females were more likely than males to report that they experienced symptoms of insomnia at least a few nights (78% vs. 59%).
Percent Experiencing Any Symptoms of Insomnia
After September 11
On most nights
69%
58%
35%
27%
23%
42%
21% 21%
31%
0% 20% 40% 60% 80% 100%
Every night or almost every night A few nights a w eek/A few nights A few nights a month Rarely/Never

31EMBARGOED FOR RELEASE – 6:00 A.M. (EST) – Tuesday, April 2, 2002
93%
32% 5%62% 1%
0% 20% 40% 60% 80% 100%
Very supportive Somew hat supportive Not very supportive Not at all supportive
94%
32%62% 3% 2%
0% 20% 40% 60% 80% 100%
Very comfortable Somewhat comfortable Not very comfortable Not at all comfortable
89%
48% 7%41% 2%
0% 20% 40% 60% 80% 100%
Completely agree Mostly agree Mostly disagree Completely disagree
91%
25% 5%4%66%
0% 20% 40% 60% 80% 100%
Very important Somew hat important Not very important Not at all important
Executive Summary – Sleep Surfaces
Importance of Sleep Surface Agreement with A Better Quality Mattress Provides a Better Night’s Sleep
The vast majority of respondents say that their sleep surface is very or somewhat important (91%) in helping them get a deep, restful night’s sleep. In fact, about two-thirds (66%) say that their sleep surface is very important to them.
Similarly, the vast majority of respondents agree that a better quality mattress provides a better night’s sleep (89%), with 41% completely agreeing with this statement.
Comfort of Sleep SurfaceSupport of Sleep Surface
The vast majority of respondents say that their sleep surface is very or somewhat supportive (93%), with about six in ten (62%) saying that their sleep surface is very supportive.Virtually all respondents say that their sleep surface is very or somewhat comfortable (94%). In fact, 62% rate their sleep surface as very comfortable.

EMBARGOED FOR RELEASE – 6:00 A.M. (EST) – Tuesday, April 2, 2002
Profiles
33
EMBARGOED FOR RELEASE – 6:00 A.M. (EST) – Tuesday, April 2, 2002
Profile – Region
The following is a profile of adults’ sleep habits based on the four U.S. Census regions:
• Adults in the West are more likely than their Midwestern, Southern, and Northern counterparts to get more sleep on average, specifically, eight or more hours of sleep on a workday.
• Those in all regions get an average of about seven and one-half hours of sleep on weekends, while adults in the West are more likely than those in the Northeast to get eight or more hours of sleep on a weekend.
• Respondents residing in the South are more likely than those in the Northeast to experience sleepiness during the day so badly that it interferes with their daily activities.
• In fact, Southern respondents are more likely to report taking a prescription medication to help them sleep compared to those living in the Northeast.
• While most symptoms of insomnia are equally prevalent across the four regions, respondents in the Northeast are more likely thanthose in the Midwest to report that they have difficulty falling asleep at least a few nights a week. And, respondents in the South are more likely than those in the West to report waking too early and have trouble getting back to sleep a few nights a week or more.
• Adults in the South are the most likely than those residing in the Midwest to report having any symptom of a sleep disorder, specifically, pauses in breathing at least a few times a week. And, those in the South are more likely than their Western counterparts to experience pauses in breathing as well as having symptoms of Restless Legs symptoms.
• Respondents in the West are the most likely to report snoring at least a few times a week than those in the Midwest.
• Adults in the Midwest and South are more likely than those in the West to get less sleep than what they say is the minimum amount that they need to not feel sleepy the next day. In addition, Southern respondents are also more likely to get less sleep than needed than those residing in the Northeast.
• Those living in the West and Northeast are more likely than their Southern counterparts to get more sleep than the minimum they report needing to not feel sleepy the next day.

34
EMBARGOED FOR RELEASE – 6:00 A.M. (EST) – Tuesday, April 2, 2002
Profile – Region (cont’d)
Region
Northeast Midwest South West
n = (191) (243) (365) (211)
B C D E
Hours slept on a workday 8 hours or more 25% 24% 32%C 40%BCD Mean (# of hours) 6.7 6.7 6.8 7.2BCD
Hours slept on a weekend 8 hours or more 48% 51% 52% 59%B Mean (# of hours) 7.3 7.5 7.5 7.7B
Insomnia – at least a few nights a week
Net: Any symptoms of insomnia 58% 54% 60% 60% Difficulty falling asleep 30C 21 25 24 Awake a lot during the night 34 38 37 34 Woke too early & couldn’t get back to sleep 24 22 29E 19
Woke up feeling unrefreshed 44 38 41 38 Sleep disorders reported – at least a few nights a week
Net: Any sleep disorder 70% 69% 77%C 75% Any symptoms of insomnia 58% 54% 60% 60% Snoring 34 31 39 42C
Pauses in breathing 8 7 13CE 7 Restless Legs symptoms 13 17 19E 11
Actual vs. minimum hours of sleep
Less than needed 19% 27%E 28%BE 17%
Same as minimum 29 28 29 31
More than needed 50D 41 37 49D
Region
Northeast Midwest South West
n = (191) (243) (365) (211)
B C D E
Daytime sleepiness – at least a few days a week 12% 16% 19%B 16%
Sleep medications – at least a few nights a week
Prescription 4% 6% 8%B 5% Over-the-counter 3 5 5 5
Medication to stay awake Yes 5% 7% 5% 6%
Any task: Much harder (Net) 50% 48% 52% 53%
Any activities: Much more likely (Net) 47% 47% 53% 46%
Perceived effects: Completely/mostly agree (Net) 76% 81% 78% 81%
Mood score
Negative 18% 21% 22% 20%
Neutral 24 23 27 27
Positive 30 35 30 32
Very Positive 28 21 21 21

35
EMBARGOED FOR RELEASE – 6:00 A.M. (EST) – Tuesday, April 2, 2002
Profile – Gender
The following is a profile of adults’ sleep habits based on their gender:
• While men and women report getting an average of seven hours of sleep on workdays, women are more likely than men to sleep eighthours or more.
• Conversely, there are no significant differences in the hours males and females sleep on a weekend.
• Adult females are more likely than males to report having daytime sleepiness at least a few times a week.
• Females are more likely than males to have had any symptoms of insomnia at least a few times a week. Specifically, they are more likely to have difficulty falling asleep, to wake a lot during the night, to wake too early and have trouble getting back to sleep, and to wake up feeling unrefreshed compared to males.
• While males are more likely to report snoring or having pauses in their breathing at least a few times a week, males and females are almost equally as likely to have experienced Restless Legs symptoms.
• There are no significant differences between males and females in terms of using over-the-counter or prescribed sleep medications and using a medication to help them stay awake.
• Females are more likely than males to get less sleep during a weekday than the minimum hours of sleep they report needing to not feel sleepy the next day, whereas males are more likely to get more sleep than the minimum hours of sleep they report needing to not feel sleepy the next day.

36
EMBARGOED FOR RELEASE – 6:00 A.M. (EST) – Tuesday, April 2, 2002
Profile – Gender (cont’d)
Gender
Male Female
n = (499) (511)
F G
Hours slept on a workday 8 hours or more 26% 35%F Mean (# of hours) 6.7 7.0F
Hours slept on a weekend 8 hours or more 51% 54% Mean (# of hours) 7.5 7.5
Insomnia – at least a few nights a week
Net: Any symptoms of insomnia 54% 63%F
Difficulty falling asleep 22 28F
Awake a lot during the night 31 41F
Woke too early & couldn’t get back to sleep 21 28F
Woke up feeling unrefreshed 36 45F
Sleep disorders reported – at least a few nights a week
Net: Any sleep disorder 72% 75% Any symptoms of insomnia 54% 63%F
Snoring 42G 31 Pauses in breathing 11G 7 Restless Legs symptoms 14 18
Actual vs. minimum hours of sleep
Less than needed 19% 28%F
Same as minimum 28 30
More than needed 47G 39
Gender
Male Female
n = (499) (511)
F G
Daytime sleepiness – at least a few days a week 13% 20%F
Sleep medications – at least a few nights a week
Prescription 6% 5% Over-the-counter 3 6
Medication to stay awake Yes 6% 6%
Any task: Much harder (Net) 48% 54%
Any activities: Much more likely (Net) 46% 52%F
Perceived effects: Completely/mostly agree (Net) 77% 81%
Mood score
Negative 22% 19%
Neutral 25 26
Positive 31 32
Very Positive 22 23

37
EMBARGOED FOR RELEASE – 6:00 A.M. (EST) – Tuesday, April 2, 2002
Profile – Age of Respondents
The following is a profile of adults’ sleep habits based on their age:
• Overall, respondents between the ages of 18 and 64 are more likely to get less sleep during the week than older adults. However, younger adults (18 to 29) are more likely to sleep longer on the weekend.
• Adults who are between the ages of 18 and 29 are more likely than those over the age of 65 to report having daytime sleepiness at least a few days a week. In addition, they are more likely to report taking medication to help stay awake.
• On the other hand, adults between the ages of 30 and 64 are more likely than their younger counterparts to take an over-the-counter medication a few nights a week or more to help them sleep.
• In addition, those who are 18 to 64 are more likely to report experiencing one or more symptoms of insomnia at least a few times a week. Specifically, younger adults are more likely to experience difficulty falling asleep and/or waking up feeling unrefreshed.
• Respondents who are between the ages of 18 and 64 are more likely to experience any symptom of a sleep disorder than respondentswho are 65 years or older. However, those between the ages of 30 and 64 are more likely than those between the ages of 18 and 29 to report snoring, pauses in breathing, and symptoms of restless legs symptoms.
• And, adults who are between 30 and 64 years old are more likely to snore than their older counterparts.
• However, respondents between the ages of 18 and 29 are less likely to experience restless legs symptoms than their older counterparts.
• Adults who are 65 years or older are less likely to report getting less sleep than the minimum needed to not feel sleepy the next day compared to those under the age of 65. In fact, older adults are more likely to get just the right amount of sleep on the weekdays to not feel sleepy the next day.
• Respondents 65 years or older are less likely to have a negative mood score compared to those between the ages of 18 and 64. Infact, older respondents are more likely to have very positive mood scores.

38
EMBARGOED FOR RELEASE – 6:00 A.M. (EST) – Tuesday, April 2, 2002
Profile – Age of Respondents (cont’d)
Age of Respondents
18 - 29 30 - 64 65+
n = (184) (650) (161)
H I J
Hours slept on a workday 8 hours or more 35%I 25% 48%HI Mean (# of hours) 6.9 6.7 7.3HI
Hours slept on a weekend 8 hours or more 60%I 50% 53% Mean (# of hours) 7.8I 7.4 7.5
Insomnia – at least a few nights a week
Net: Any symptoms of insomnia 68%IJ 59%J 44% Difficulty falling asleep 33IJ 24 19 Awake a lot during the night 32 38 32 Woke too early & couldn’t get back to sleep 20 26 25
Woke up feeling unrefreshed 49J 41J 25 Sleep disorders reported – at least a few nights a week
Net: Any sleep disorder 77%J 76%J 60% Any symptoms of insomnia 68%IJ 59%J 44% Snoring 26 43HJ 24 Pauses in breathing 6 10H 9 Restless legs symptoms 8 17H 18H
Actual vs. minimum hours of sleep
Less than needed 29%J 25%J 12%
Same as minimum 24 27 40HI
More than needed 44 44 40
Age of Respondents
18 - 29 30 - 64 65+
n = (184) (650) (161)
H I J
Daytime sleepiness – at least a few days a week 20%J 16% 12%
Sleep medications – at least a few nights a week
Prescription 4% 7% 6% Over-the-counter 2 5H 5
Medication to stay awake Yes 11%I 6% -%
Any task: Much harder (Net) 53% 51% 46%
Any activities: Much more likely (Net) 58%IJ 49%J 38%
Perceived effects: Completely/mostly agree (Net) 85%I 78% 78%
Mood score
Negative 25%J 21%J 12%
Neutral 29 26 20
Positive 29 33 32
Very Positive 17 21 37HI

39
EMBARGOED FOR RELEASE – 6:00 A.M. (EST) – Tuesday, April 2, 2002
The following is a profile of adults’ sleep habits based on their work schedule:
• Respondents who work regular shifts are more likely than those who are shift workers to report getting more sleep on average during the workweek. However, there are no differences in the amount of sleep these workers get on weekends.
• Shift workers are also more likely than those with regular work schedules to report having experienced symptoms of insomnia, such as difficulty falling asleep and waking up feeling unrefreshed.
Profile – Work Schedule

40
EMBARGOED FOR RELEASE – 6:00 A.M. (EST) – Tuesday, April 2, 2002
Profile – Work Schedule (cont’d)
Work Schedule
Regular Shift Shift Worker
n = (514) (177)
K L
Hours slept on a workday 8 hours or more 24% 27% Mean (# of hours) 6.8L 6.5
Hours slept on a weekend 8 hours or more 55% 52% Mean (# of hours) 7.6 7.4
Insomnia – at least a few nights a week
Net: Any symptoms of insomnia 57% 64% Difficulty falling asleep 21 31K
Awake a lot during the night 33 38 Woke too early & couldn’t get back to sleep 22 21
Woke up feeling unrefreshed 39 47K
Sleep disorders reported – at least a few nights a week
Net: Any sleep disorder 73% 79% Any symptoms of insomnia 57% 64% Snoring 38 41 Pauses in breathing 8 10 Restless Legs symptoms 12 11
Actual vs. minimum hours of sleep
Less than needed 24% 27%
Same as minimum 30 25
More than needed 43 47
Work Schedule
Regular Shift Shift Worker
n = (514) (177)
K L
Daytime sleepiness – at least a few days a week 13% 19%
Sleep medications – at least a few nights a week
Prescription 4% 3% Over-the-counter 4 5
Medication to stay awake Yes 6% 8%
Any task: Much harder (Net) 52% 46%
Any activities: Much more likely (Net) 50% 49%
Perceived effects: Completely/mostly agree (Net) 77% 80%
Mood score
Negative 21% 22%
Neutral 26 31
Positive 33 28
Very Positive 21 19

41
EMBARGOED FOR RELEASE – 6:00 A.M. (EST) – Tuesday, April 2, 2002
Profile – Children in Household
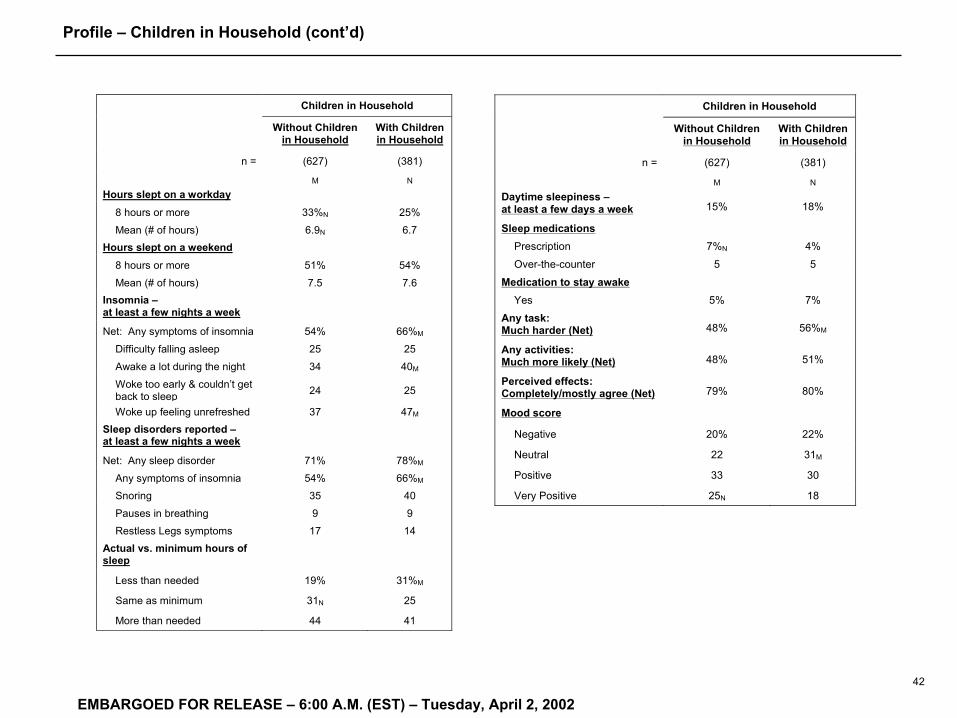
The following is a profile of adults’ sleep habits based on having children in their household:
• While respondents who do not have children in their household and those who do have children in the household report getting an average of seven hours of sleep on workdays, those without children in the household are more likely than those who do not to sleep eight hours or more. However, there are no differences in the amount of sleep these respondents get on weekends.
• In addition, those who have children in the household are more likely to report experiencing one or more symptoms of insomnia at least a few times a week. Specifically, they are more likely to experience waking a lot during the night and/or waking up feeling unrefreshed.
• In fact, these respondents are also more likely to report having any symptom of a sleep disorder compared to those who do not have children in the household.
• However, those without children in their household are more likely to report the use of a prescription medication to help them sleep.
• Adults who have children in their household are more likely to report getting less sleep than the minimum needed to not feel sleepy the next day compared to those without children. In fact, respondents without children in the household are more likely to get just the right amount of sleep on the weekdays to not feel sleepy the next day.
• Respondents who do not have children in the household are more likely to have a very positive mood score compared to those with children in the household. However, those with children are more likely to have a more neutral mood score compared to their counterparts.
42
EMBARGOED FOR RELEASE – 6:00 A.M. (EST) – Tuesday, April 2, 2002
Profile – Children in Household (cont’d)
Children in Household
Without Children
in Household With Children in Household
n = (627) (381)
M N
Hours slept on a workday 8 hours or more 33%N 25% Mean (# of hours) 6.9N 6.7
Hours slept on a weekend 8 hours or more 51% 54% Mean (# of hours) 7.5 7.6
Insomnia – at least a few nights a week
Net: Any symptoms of insomnia 54% 66%M
Difficulty falling asleep 25 25 Awake a lot during the night 34 40M
Woke too early & couldn’t get back to sleep 24 25
Woke up feeling unrefreshed 37 47M
Sleep disorders reported – at least a few nights a week
Net: Any sleep disorder 71% 78%M
Any symptoms of insomnia 54% 66%M
Snoring 35 40 Pauses in breathing 9 9 Restless Legs symptoms 17 14
Actual vs. minimum hours of sleep
Less than needed 19% 31%M
Same as minimum 31N 25
More than needed 44 41
Children in Household
Without Children
in Household With Children in Household
n = (627) (381)
M N
Daytime sleepiness – at least a few days a week 15% 18%
Sleep medications Prescription 7%N 4% Over-the-counter 5 5
Medication to stay awake Yes 5% 7%
Any task: Much harder (Net) 48% 56%M
Any activities: Much more likely (Net) 48% 51%
Perceived effects: Completely/mostly agree (Net) 79% 80%
Mood score
Negative 20% 22%
Neutral 22 31M
Positive 33 30
Very Positive 25N 18

43EMBARGOED FOR RELEASE – 6:00 A.M. (EST) – Tuesday, April 2, 2002
General Mood
Negative Neutral Positive Very
Positive B C D E
n= (203) (251) (312) (221) Hours slept on a workday 8 hours or more 25% 28% 31% 37%BC
Mean (# of hours) 6.6 6.8 7.0B 7.1BC
Hours slept on a weekend 8 hours or more 46% 55% 54% 53% Mean (# of hours) 7.2 7.6B 7.6B 7.5 Daytime sleepiness – at least a few times a week 32%CDE 19%DE 10% 7%
Insomnia – at least a few times a week
Net: Any symptoms of insomnia 81%CDE 68%DE 54%E 33 Difficulty falling asleep 41CDE 29DE 21E 10 Awake a lot during the night 57CDE 41DE 33E 15 Woke up early and couldn’t get back to sleep 38CDE 29E 22E 10 Woke up feeling unrefreshed 64CDE 45DE 35E 20 Sleep problems reported – at least a few nights a week
Net: Any sleep problem 92%CDE 79%E 72%E 52% Snoring 42E 43E 36E 26 Sleep apnea 15DE 12DE 6 5 Restless legs syndrome 21DE 21DE 12 9 Sleep problems diagnosed (% Yes) Insomnia 11%DE 8%DE 4% 2% Sleep apnea 7E 4E 5E <1 Restless legs syndrome 3E 6E 4E <1 Any task: much harder (Net) 62% 50% 49% 43%
Any mood/behavior: much more likely (Net) 62% 49% 46% 40%
Actual vs. minimum hours of sleep Less than needed 42%CDE 27%DE 18%E 10% Medication to help stay awake (% Yes) 10%DE 7%E 4% 2%
Profile – General Mood
The following is a profile of adults’ sleep habits based on their general mood and attitudeThose with positive mood scores are less likely to:
• Reported and been diagnosed with a sleep problem;• Have any symptom of insomnia at least a few nights a
week including difficulty falling asleep, awake a lot during the night, woke up too early and could not get back to sleep and woke up feeling unrefreshed;
• Have daytime sleepiness a few days a week or more;• Take medications to help them stay awake;• Find it harder to do various activities when they do not
get enough sleep; and• Find it much more likely to be difficult to complete
various tasks and activities when they do not get a full nights sleep.