Embed Size (px)
Citation preview

©2001ClaudiaGarcia-Szekely 1
Costs in the Long Run
When the firm can expand or contract the plant size
2
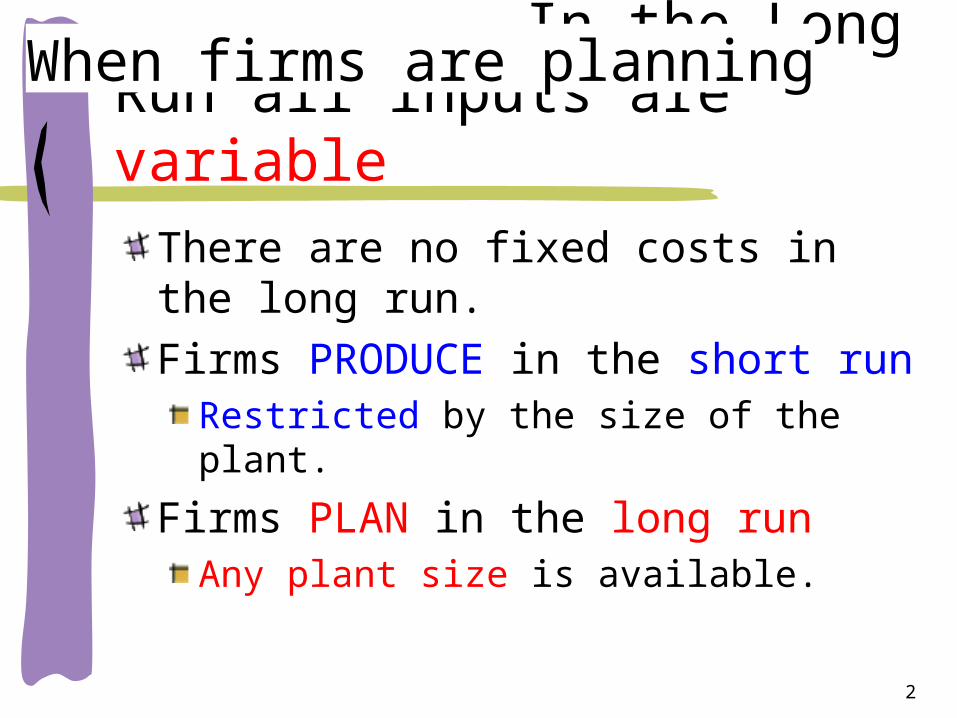
In the Long Run all inputs are variable
There are no fixed costs in the long run.Firms PRODUCE in the short run
Restricted by the size of the plant.
Firms PLAN in the long runAny plant size is available.
When firms are planning

ATC Plant 1ATC Plant 1
With this plant, we can produce any amount from zero units to 5,000.
With this plant, we can produce any amount from zero units to 5,000.
5,0005,000
The minimum ATC occurs at 2500 unitsThe minimum ATC occurs at 2500 units
2,5002,50000
$2$2
12,00012,0005,0005,000
$1$1
ATC Plant 2ATC Plant 2
With this plant, we can produce any amount from zero units to 12,000.
With this plant, we can produce any amount from zero units to 12,000.
The minimum ATC occurs at 5,000 units
The minimum ATC occurs at 5,000 units
ATC Plant 3ATC Plant 3
With this plant, we can produce any amount from zero units to 15,000.
With this plant, we can produce any amount from zero units to 15,000.
15,00015,000
The minimum ATC occurs at 10,000
units
The minimum ATC occurs at 10,000
units
10,00010,000$0.5$0.5

In the long run firms choose a plant size…
We identify the plant size with the Average Total Cost Curve.There is no single “best” plant size…Which plant is “best” depends on the volume of production.
OUTPUT PLANT 1 PLANT 2 PLANT 3
100 10 13 17
200 9 11.5 14.3
300 8.5 9.75 12.5
400 8.3 8.4 10.8
500 8.4 8.1 9.6
600 8.9 7.5 8.6
700 9.6 7.3 8.1
800 11.7 7.6 7.8
900 14.8 8.1 8
1000 17 8.9 8.3
1100 23 10.2 9
5
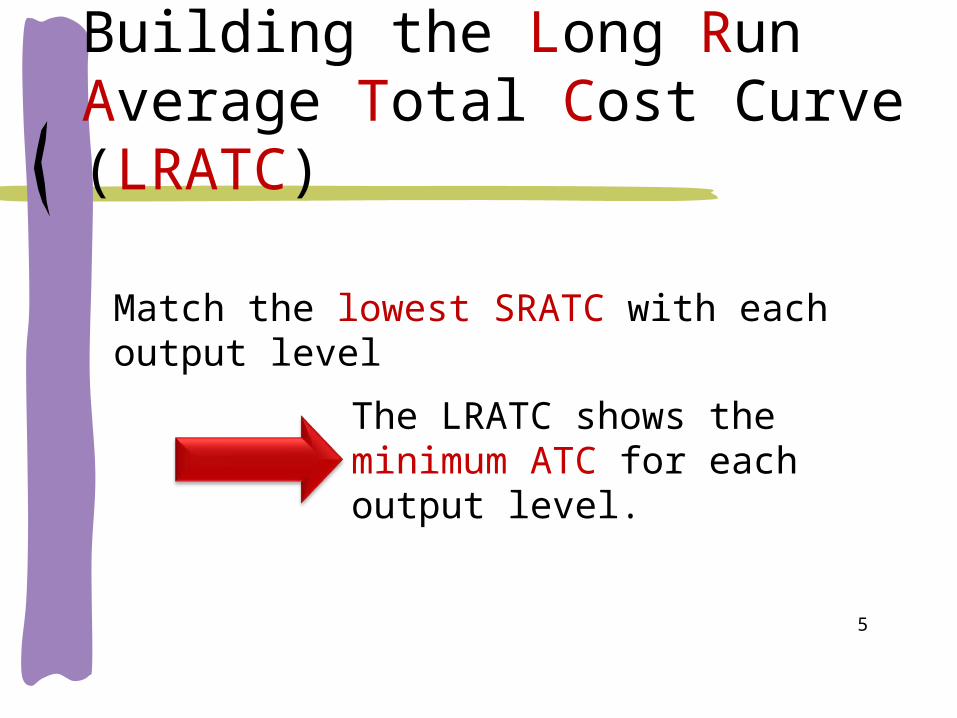
Building the Long Run Average Total Cost Curve (LRATC)
Match the lowest SRATC with each output level
The LRATC shows the minimum ATC for each output level.
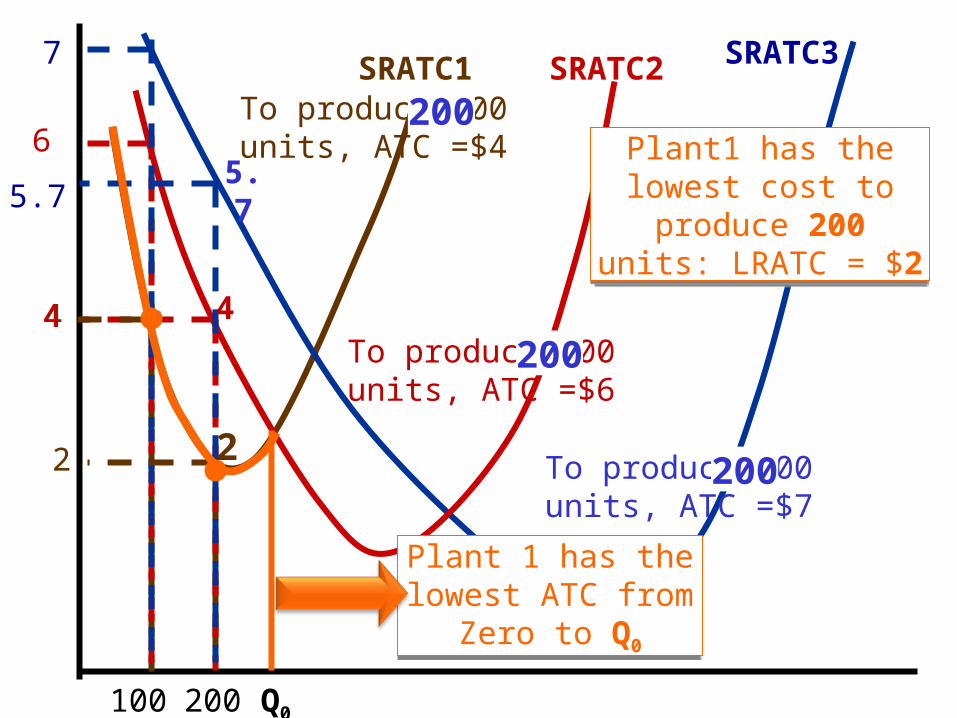
SRATC1To produce 100 units, ATC =$4
100
6
To produce 100 units, ATC =$6
SRATC2 SRATC3
To produce 100 units, ATC =$7
4
Plant1 has the lowest cost to
produce 100 units: LRATC = $4
Plant1 has the lowest cost to
produce 100 units: LRATC = $4
7
4
2
5.7
200
2200
5.7
200
4
200
Plant 1 has the lowest ATC from
Zero to Q0
Plant 1 has the lowest ATC from
Zero to Q0
Q0
Plant1 has the lowest cost to
produce 200 units: LRATC = $2
Plant1 has the lowest cost to
produce 200 units: LRATC = $2
SRATC1
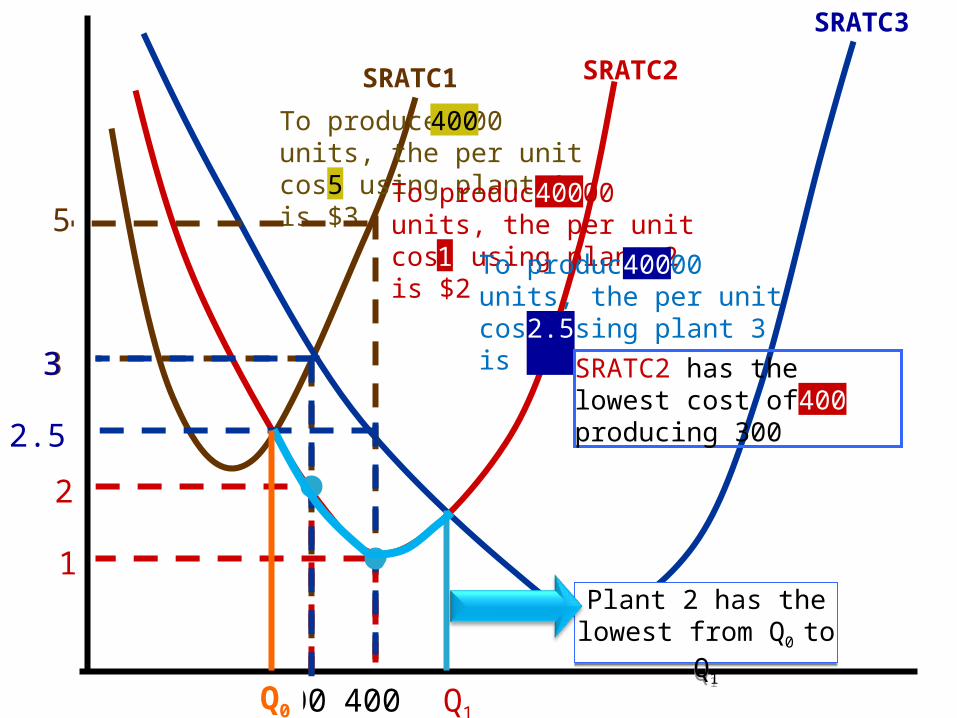
To produce 300 units, the per unit cost using plant 1 is $3
300
2
To produce 300 units, the per unit cost using plant 2 is $2
SRATC2
SRATC3
To produce 300 units, the per unit cost using plant 3 is $3
33
1
5
2.5
400
5
400
2.5
400
1
400
Plant 2 has the lowest from Q0 to
Q1
Plant 2 has the lowest from Q0 to
Q1
Q1
SRATC2 has the lowest cost of producing 300400
Q0

SRATC2SRATC3
Q1Q0
SRATC2 has the lowest cost
between Q0 and Q1
LRATC
SRATC1
SRATC3 has the lowest
cost above Q1
SRATC1 has the lowest
cost between 0 and Q0
Long Run ATC
0

LRATCThe LRATC is an envelope of SRATC curves
3 different plant sizesEach point of the LRATC tells you the lowest cost of producing a given output level when you can
change the size of the plant

The larger the number of plant size options…
The smoother the LRATC

Building the LRATC
Plant 1 has lowest cost for volumes up to 400.Plant 2 has lowest cost between 400 and 900.Plant 3 has lowest cost above 900.
LRATC
Output

Building the LRATCOUTPU
TPLANT
1PLANT
2PLANT
3 OUTPUT LRATC100 90 96 99 100 90200 84 90 93 200 84300 78 84 87 300 78400 72 78 81 400 72500 66 60 78 500 60600 72 54 75 600 54700 78 48 72 700 48800 84 42 60 800 42900 90 36 57 900 36
1000 96 30 27 1000 271100 102 36 21 1100 211200 108 42 15 1200 151300 114 48 9 1300 91400 120 54 3 1400 31500 126 60 6 1500 6
13
Increasing Returns to Scale
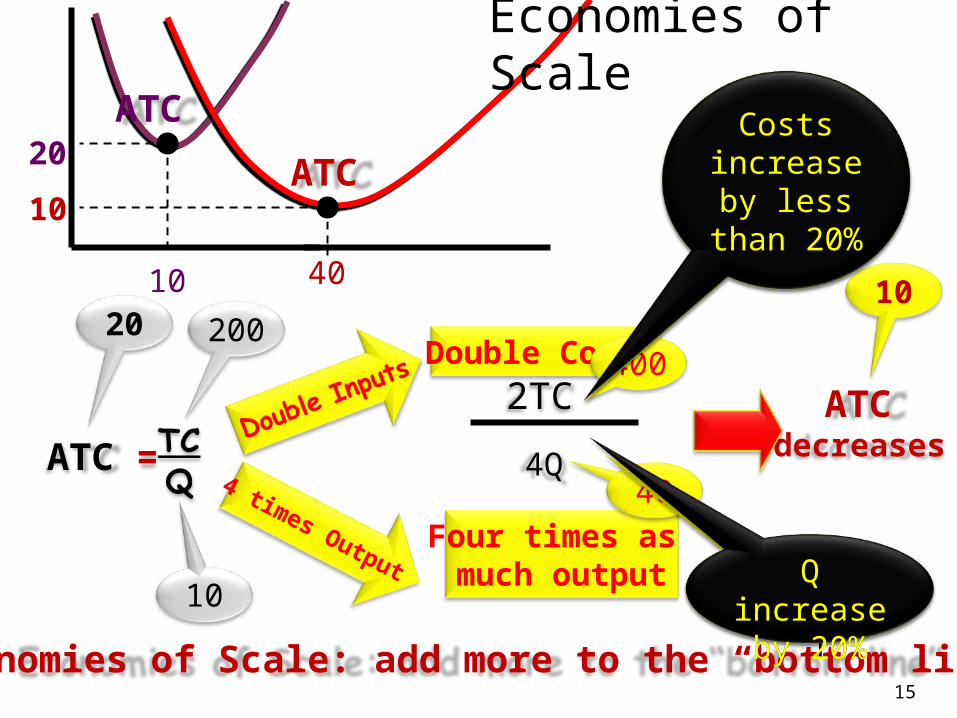
Economies of Scale
ATC drops as Plant Size
increaseATC drops as Plant Size
increase
Per unit costs decrease because
Fixed costs are spread out over more units of output. Variable costs decrease with the use of mass production technologies which increase labor productivity.
14
15
ATC =
Four times as much output
ATC decreases
2TC
4Q
Double Costs
4 times Output
200
10
20400
40
10
Economies of Scale: add more to the “bottom line”
Q increase by 10%
Costs increase by less
than 10%
Q increase by 20%
Costs increase by less
than 20%
20
10 40
10
Economies of Scale
ATC
ATC

SRATC1SRATC2
SRATC4
SRATC7SRATC8
SRATC3
output
LRATC
SRATC5SRATC6
Economies of scale or Increasing Returns to Scale
$8
$7
$6
$5
$4$3
$2
$1
Output increases by a larger percentage than
costs
Output increases by a larger percentage than
costs
ATC Drops
17
Constant Returns to Scale
The benefits of expanding the plant size eventually end..Further expansion leaves per unit costs the sameOutput increases by the SAME percentage as costs.

ATC =
Twice as much output
ATC Remains
the same
2TC
2Q
Double Costs
Double Output
20020
10
400
20
20
Constant Returns to Scale20
10 20
ATC ATC

19
Constant Returns to Scale
Horizontal LRATC
As the plant size increaseATC remains the same
ATC
Q
$2

20
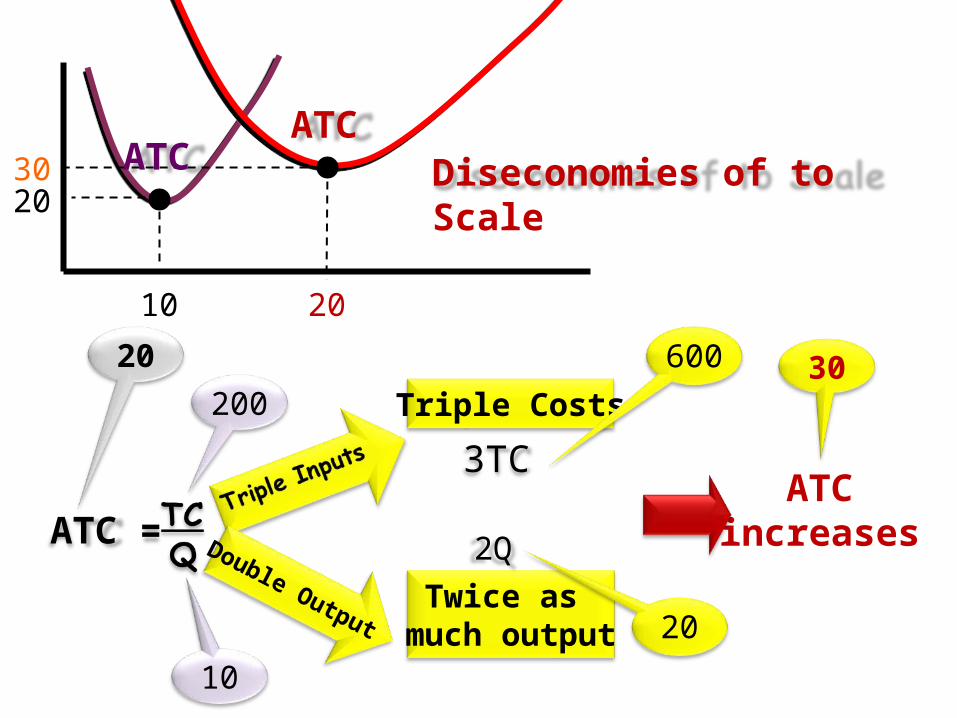
ATC =
Twice as much output
ATC increases
3TC
2Q
Triple Costs200
20
10
600
20
30
Diseconomies of to Scale20
10 20
30 ATC ATC
Double Output
SRATC1
SRATC2
SRATC4SRATC3
SRATC7
SRATC8
SRATC6
output
LRATC3
1
2
4
SRATC5
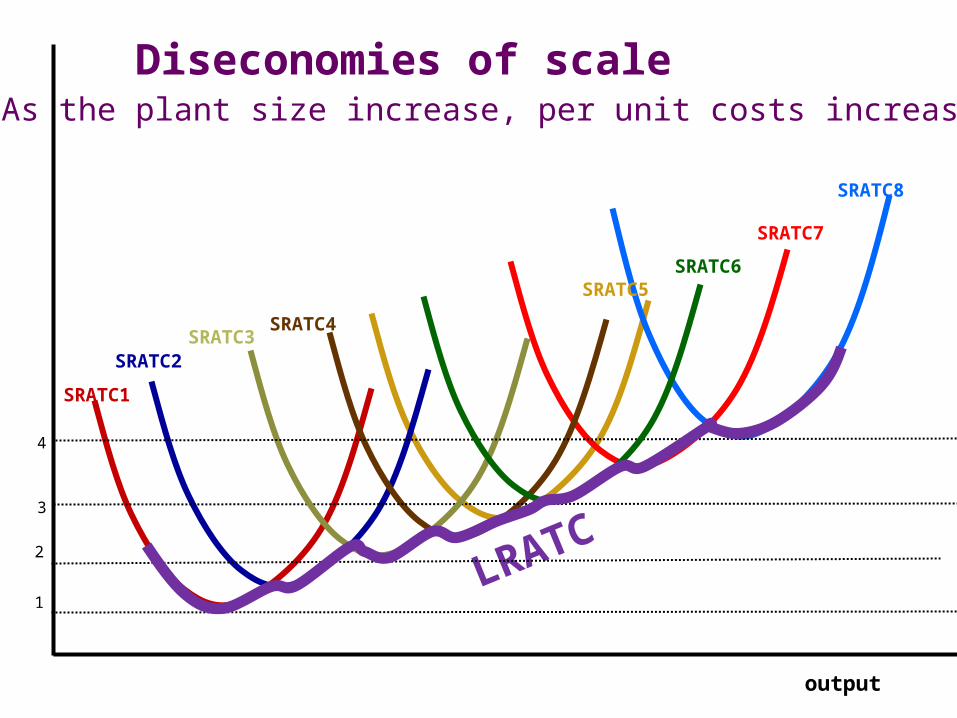
As the plant size increase, per unit costs increaseDiseconomies of scale
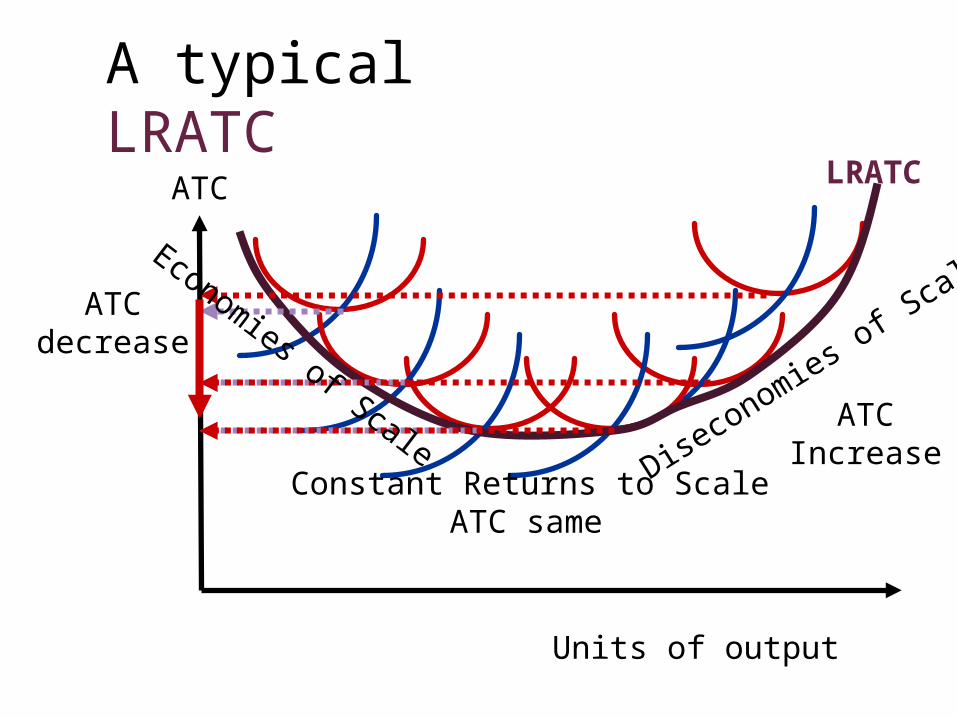
A typical LRATC
Units of output
LRATCATC
Constant Returns to ScaleDise
conomies o
f Sca
leATC
decrease
ATC same
ATC Increase
Economies of Scale

SRATC1
SRATC2
SRATC3SRATC4
SRATC5
SRATC6
SRATC7
LRATC
Increasing, Constant and Decreasing returns to scale
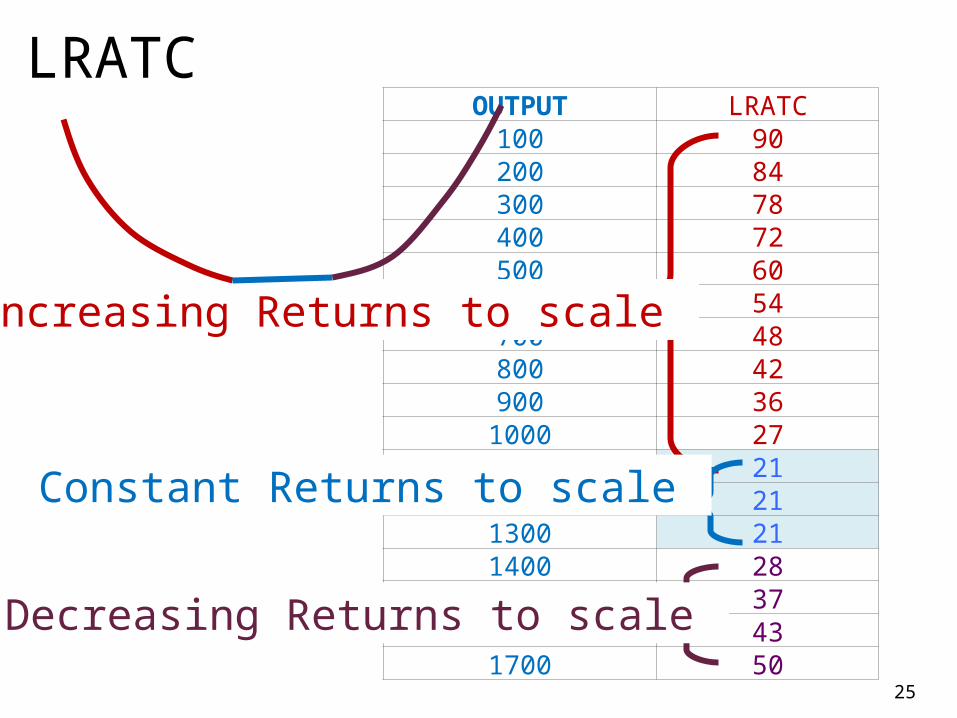
LRATC
25
OUTPUT LRATC100 90200 84300 78400 72500 60600 54700 48800 42900 36
1000 271100 211200 211300 211400 281500 371600 431700 50
Increasing Returns to scale
Constant Returns to scale
Decreasing Returns to scale
smallest plant with lowest ATC in the long run
Only firms with plants with the lowest cost will survive in the long
run.
26
Minimum Efficient Scale (MES)

500,000
SRATC1
SRATC2
SRATC3SRATC4
SRATC5
SRATC6
SRATC7
LRATC
Total Market Demand = 3,000,000
150,000
# of Firms = 3,000,000/500,000 = 6 firms each selling 500,000
# of Firms = 3,000,000/150,000 = 20 firms each one sells 150,000
10,000
# of Firms = 3,000,000/10,000 = 300 firms each sells 10,000
The smaller the size of the MES, the more competitive the industry is.
The larger the size of the MES,
the more concentrated the industry is.
The smaller the size of the MES, the larger the number of firms
MES