Embed Size (px)
Citation preview

8/2/2019 2001 Dallas Federal Reserve Annual Report
http://slidepdf.com/reader/full/2001-dallas-federal-reserve-annual-report 1/51
Federal Reserve Bank of Dallas / 2001 Annual Report
TakingStockinAmericaResiliency, Redundancy and Recoveryin the U.S.Economy
8/2/2019 2001 Dallas Federal Reserve Annual Report
http://slidepdf.com/reader/full/2001-dallas-federal-reserve-annual-report 2/51
A LETTER FROM THE PRESIDENT
The Economy in 2001
For a year that was eclipsed by the September 11 tragedy, the
economy ended 2001 on a positive note. While the economy
weakened in late 2000 and limped into 2001, overall growth
was positive for almost nine months before the terroristattacks soured the third quarter and turned it negative.
The good news is that the economic expansion lasted a
record 10 years. The National Bureau of Economic Research
put its peak at March 2001, which means the recession
began in April when total employment turned down.
Growth resumed in the fourth quarter—surprising most
forecasters—which means the recession had only one neg-
ative quarter.
Monetary Policy
The early recovery resulted largely from the most aggressive
easing of U.S. monetary policy in history. The Fed pumped
up money growth last year, cut the target federal funds rate
from 6.5 percent to 1.75 percent and reduced the discount
rate from 6 percent to 1.25 percent. While the recovery has
already begun, its strength and durability remain uncertain.
Inflation declined during the recession and seems poised to
decline further as growth accelerates in an economy with
considerable slack. Talk that monetary policy had become
ineffective—and was like pushing on a string—subsided as
fourth-quarter numbers came in. The lag in monetary policymakes it more like sipping vodka than pushing on a string.
Paradigm Lost? Or Paradigm Regained?
We can’t know yet whether the economy, once recovered,
will get its mojo back and resume the enhanced growth rates
of the late 1990s—the New Economy period—or whether
growth will retreat to the glacial pace of the previous two
decades. The hallmark of the New Economy was an acceler-
ation in productivity growth that made other good things
possible—faster output and employment growth and lower
unemployment rates with less inflation.
Even during the recession, productivity continued to grow
nicely, an encouraging sign for the future. Productivity
increased about 2 percent last year on average and at a rate
exceeding 5 percent in the fourth quarter. Aside from its
favorable implications for our standard of living in the long
run, productivity growth in the near term reduces unit labor
costs and should help restore the profitability needed for a
sustained recovery without stoking inflation.
If the new economic paradigm was lost—which I doubt—
I expect it to be regained. My new-paradigm frog, the unoffi-
cial mascot of the New Economy, may be in hibernation, butit hasn’t croaked. Looking toward the future, let me just say
that I’m up to my hip boots in tadpoles.
The Fed in the Payments System
In addition to easing monetary policy, the Federal Reserve
helped sustain the nation’s payments system in the crucial
days following September 11. With the other Fed governors
traveling, Vice Chairman Roger Ferguson exercised leader-
ship that would have made Walter Bagehot proud. Bagehot’s
1873 book, Lombard Street, recommended lending freely at
high interest rates when the central bank needed to act as
lender of last resort. We improved on that by lending freely
at low interest rates and by pushing rates down further.
In addition to providing substantial reserves through open
market operations, the Fed opened the discount window to
keep large-dollar payments flowing despite some firms’ tem-
A N N U A L R E P O R T 1 Federal Reserve Bank of Dallas
8/2/2019 2001 Dallas Federal Reserve Annual Report
http://slidepdf.com/reader/full/2001-dallas-federal-reserve-annual-report 3/51
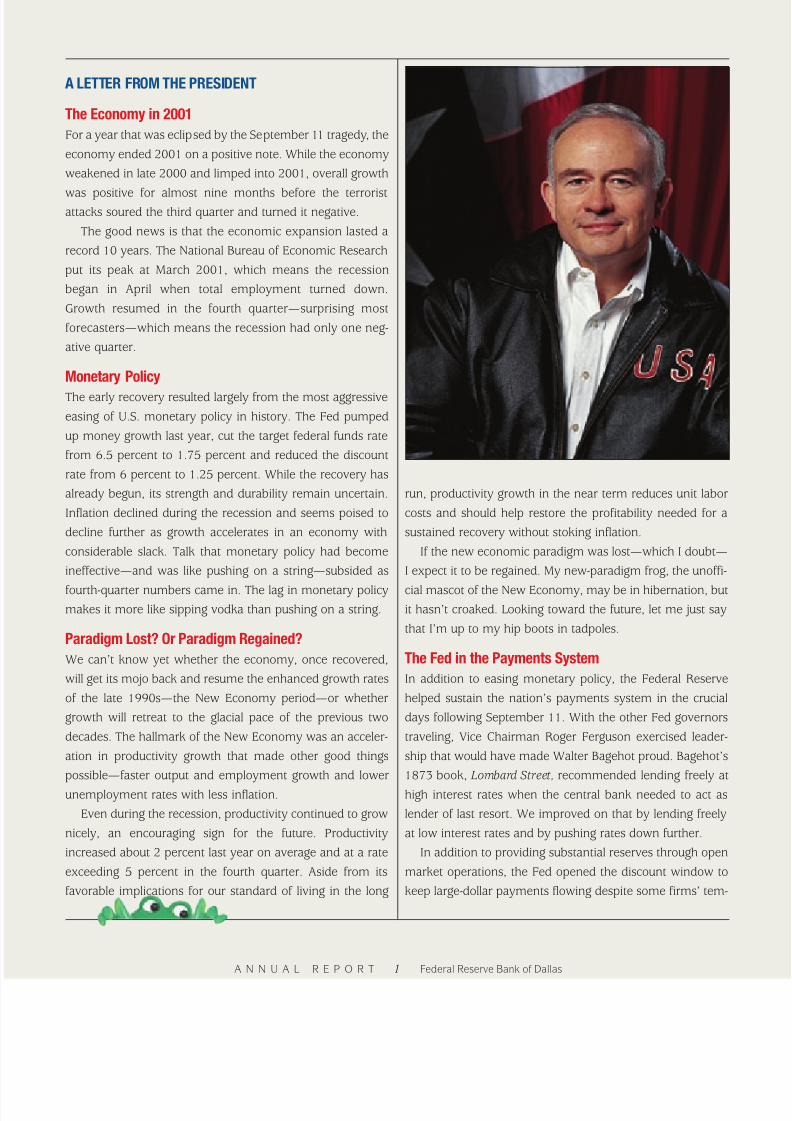
A Personal Footnote
2001 was a good year for me personally. I came out of the
closet as an aspiring drugstore cowboy poet. I made new
friends, and since September 11, I’ve changed my attitude
toward New York City. It is now one of my favorite places. I
like our renewed sense of patriotism and am delighted that
wearing and displaying the American flag is no longer politi-
cally incorrect.
I met two Texas cowboy-poet icons last year, Red Steagall
and Alan Damron, and my personal honky-tonk hero, Billy
Joe Shaver. Billy Joe had a heart attack but is still packing
them in. His buddy Waylon Jennings died recently of com-
plications from diabetes, a malady I share. I also have a per-
sonal interest and stake in a couple of others. This has
focused my mind more on the biotech industry than it might
otherwise have been. Biotech is the great hope of the future
and will likely play the same role in this decade that infor-mation and communications technology played in the last.
So, let’s get going, biotech. Time’s a’wasting!
I’ve decided that Alan Damron speaks for many of us old
boys in the large-font stage of life:
“. . . for the bleached blondes and the broncos, we try to
stand tall.”
Amen to that.
Robert D. McTeer, Jr.
porary inability to make payments because of physical dam-
age to the payments infrastructure.
Donning my Reserve Bank hat, however, I am proudest of
the Fed’s decision to credit banks for deposited checks based
on normal schedules despite our inability to deliver and col-
lect those checks while the airports were closed. The sub-
stantial increase in check float that resulted must be recov-
ered through check service fees and is a financial burden to
us. But it illustrates the benefits of central bank participation
in the payments system with a public service goal more
important than the bottom line.
The Dallas Fed in 2001
The Dallas Fed had another good year. Services to banks,
other financial institutions and the Treasury grew, and the
banks we supervise remain healthy and viable. We believe
our research, public information and education activities
continue to make valuable contributions to economic educa-
tion and financial literacy and will aid in the public under-
standing and support of sound economic policies. On the
management side of things, I didn’t gain much ground in my
lonely campaign for the use of larger fonts within the bank—
especially in e-mails to me.
The Essay
The swift recovery from the economic repercussions of Sep-
tember 11 demonstrates once again the vitality and resilience
of the U.S. economy and the American people. Thatresilience and some of the reasons for it are the theme of this
year’s annual report essay, “Taking Stock in America:
Resiliency, Redundancy and Recovery in the U.S. Economy.”
A N N U A L R E P O R T 2 Federal Reserve Bank of Dallas
8/2/2019 2001 Dallas Federal Reserve Annual Report
http://slidepdf.com/reader/full/2001-dallas-federal-reserve-annual-report 4/51
TakingStockinAmerica
A N N U A L R E P O R T 3 Federal Reserve Bank of Dallas
Resiliency,Redundancyand Recoveryin theU.S.Economy
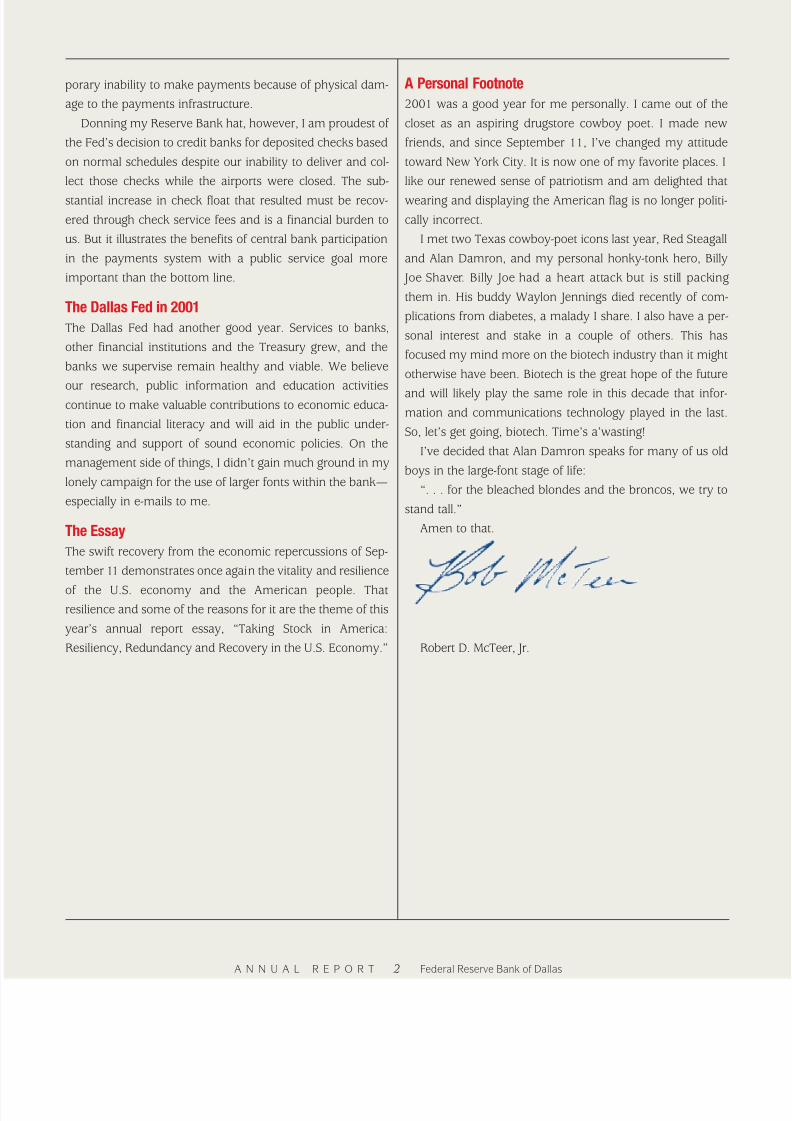
So much changed on September 11.
America sustained a terrible shock as a foreign enemy
struck on U.S. soil for the first time since Pearl Harbor. Fam-
ilies mourned for lost parents, siblings, sons and daughters.
The military went to war. Security tightened at home. The
economy, already wobbly after a 10-year expansion, reeled
as spending faltered and job losses piled up.
We suffered.
And we endured.
A diverse nation came together through outrage, mourning
and recovery. Within months of the attacks, the nation was
back on its feet, fighting a war on terrorism while everyday
life moved toward normal. Leadership, national character
and military might helped the United States rebound.
The economy played a central role, too. It hasn’t gotten as
much attention as political and military factors, but it shouldn’t
be underestimated. At a time of crisis, the most powerful
economy on earth continued to function, adapting to chang-
ing circumstances and providing the resources to handle our
national emergency.
8/2/2019 2001 Dallas Federal Reserve Annual Report
http://slidepdf.com/reader/full/2001-dallas-federal-reserve-annual-report 5/51
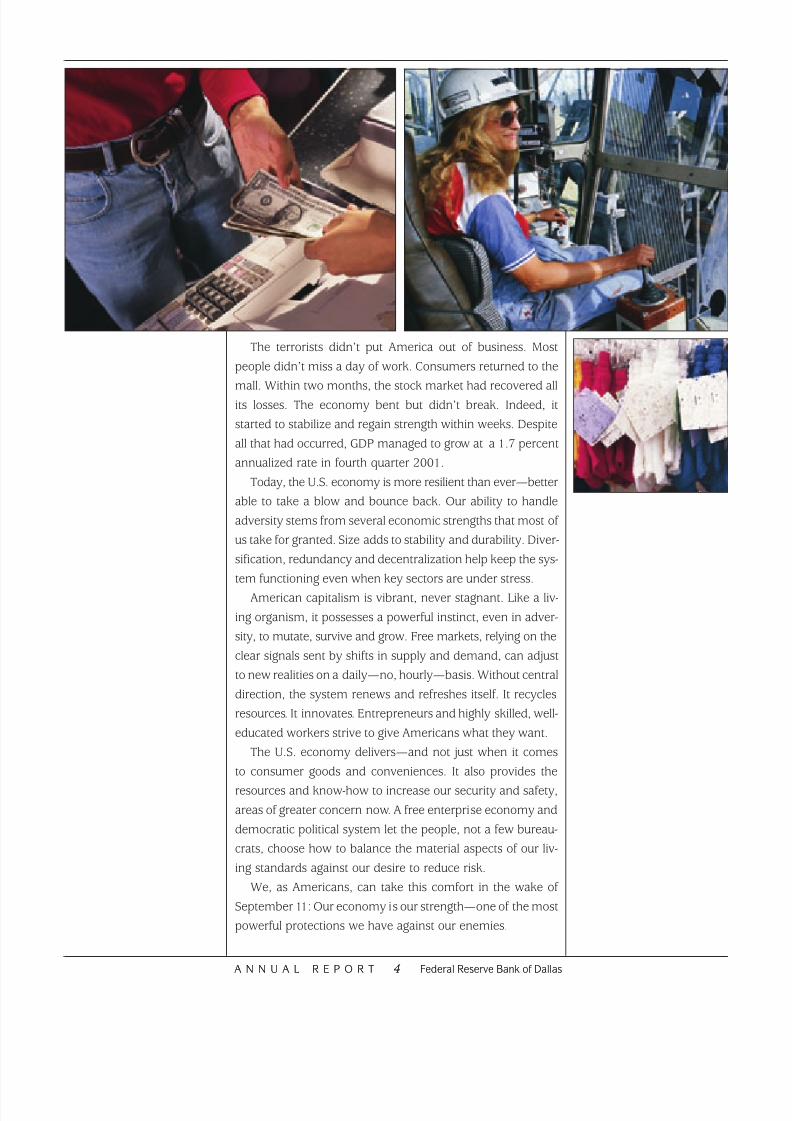
The terrorists didn’t put America out of business. Most
people didn’t miss a day of work. Consumers returned to the
mall. Within two months, the stock market had recovered all
its losses. The economy bent but didn’t break. Indeed, it
started to stabilize and regain strength within weeks. Despite
all that had occurred, GDP managed to grow at a 1.7 percent
annualized rate in fourth quarter 2001.
Today, the U.S. economy is more resilient than ever—better
able to take a blow and bounce back. Our ability to handle
adversity stems from several economic strengths that most of
us take for granted. Size adds to stability and durability. Diver-
sification, redundancy and decentralization help keep the sys-
tem functioning even when key sectors are under stress.
American capitalism is vibrant, never stagnant. Like a liv-
ing organism, it possesses a powerful instinct, even in adver-
sity, to mutate, survive and grow. Free markets, relying on the
clear signals sent by shifts in supply and demand, can adjust
to new realities on a daily—no, hourly—basis. Without central
direction, the system renews and refreshes itself. It recycles
resources. It innovates. Entrepreneurs and highly skilled, well-
educated workers strive to give Americans what they want.
The U.S. economy delivers—and not just when it comes
to consumer goods and conveniences. It also provides the
resources and know-how to increase our security and safety,
areas of greater concern now. A free enterprise economy and
democratic political system let the people, not a few bureau-
crats, choose how to balance the material aspects of our liv-
ing standards against our desire to reduce risk.
We, as Americans, can take this comfort in the wake of
September 11: Our economy is our strength—one of the most
powerful protections we have against our enemies.
A N N U A L R E P O R T 4 Federal Reserve Bank of DallasA N N U A L R E P O R T 4 Federal Reserve Bank of Dallas
8/2/2019 2001 Dallas Federal Reserve Annual Report
http://slidepdf.com/reader/full/2001-dallas-federal-reserve-annual-report 6/51
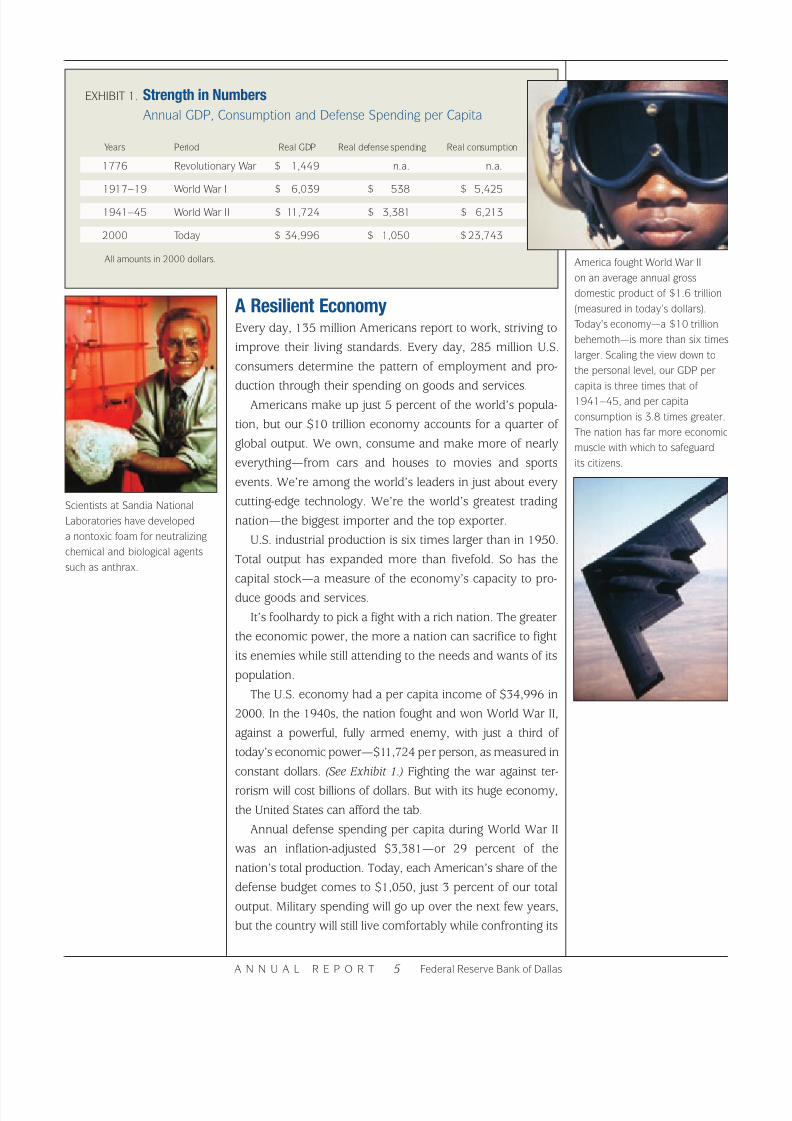
Scientists at Sandia National
Laboratories have developed
a nontoxic foam for neutralizing
chemical and biological agents
such as anthrax.
A N N U A L R E P O R T 5 Federal Reserve Bank of Dallas
EXHIBIT 1. Strength in Numbers
Annual GDP, Consumption and Defense Spending per Capita
Years Period Real GDP Real defense spending Real consumption
1776 Revolutionary War $ 1,449 n.a. n.a.
1917–19 World War I $ 6,039 $ 538 $ 5,425
1941–45 World War II $ 11,724 $ 3,381 $ 6,213
2000 Today $ 34,996 $ 1,050 $23,743
All amounts in 2000 dollars.
A Resilient EconomyEvery day, 135 million Americans report to work, striving to
improve their living standards. Every day, 285 million U.S.
consumers determine the pattern of employment and pro-
duction through their spending on goods and services.
Americans make up just 5 percent of the world’s popula-
tion, but our $10 trillion economy accounts for a quarter of
global output. We own, consume and make more of nearly
everything—from cars and houses to movies and sports
events. We’re among the world’s leaders in just about every
cutting-edge technology. We’re the world’s greatest trading
nation—the biggest importer and the top exporter.
U.S. industrial production is six times larger than in 1950.
Total output has expanded more than fivefold. So has the
capital stock—a measure of the economy’s capacity to pro-
duce goods and services.
It’s foolhardy to pick a fight with a rich nation. The greater
the economic power, the more a nation can sacrifice to fight
its enemies while still attending to the needs and wants of its
population.
The U.S. economy had a per capita income of $34,996 in
2000. In the 1940s, the nation fought and won World War II,
against a powerful, fully armed enemy, with just a third of
today’s economic power—$11,724 per person, as measured in
constant dollars. (See Exhibit 1.) Fighting the war against ter-
rorism will cost billions of dollars. But with its huge economy,
the United States can afford the tab.
Annual defense spending per capita during World War II
was an inflation-adjusted $3,381—or 29 percent of the
nation’s total production. Today, each American’s share of the
defense budget comes to $1,050, just 3 percent of our total
output. Military spending will go up over the next few years,
but the country will still live comfortably while confronting its
America fought World War II
on an average annual gross
domestic product of $1.6 trillion
(measured in today’s dollars).
Today’s economy—a $10 trillion
behemoth—is more than six times
larger. Scaling the view down to
the personal level, our GDP per
capita is three times that of
1941–45, and per capita
consumption is 3.8 times greater.
The nation has far more economic
muscle with which to safeguard
its citizens.
8/2/2019 2001 Dallas Federal Reserve Annual Report
http://slidepdf.com/reader/full/2001-dallas-federal-reserve-annual-report 7/51
Since its founding, the nation has
experienced numerous swings in
economic activity. In the predomi-
nantly agrarian 1800s—even as
late as the Dust Bowl era of the
1930s—weather conditions alone
could alter the course of GDP. As
America industrialized, farming
became less dominant, and
manufacturing grew in importance
to sometimes balance (and other
times amplify) agriculture’s cycle.
Over time, factory output grew
dominant and put its own stamp
on GDP. As recently as 1947,
manufacturing, retail trade and
agriculture made up nearly half
of GDP, together exerting a large
influence on the business cycle.
A N N U A L R E P O R T 6 Federal Reserve Bank of Dallas
enemies. One way to look at it: The nation could double its
military budget with just one year’s economic growth.
Throughout history, world powers have fallen because
their economy couldn’t support their military. The latest, of course, was the Soviet Union, whose inefficient socialist
economy couldn’t keep pace with the Cold War spending of
the United States.
Guns or butter? Yesterday’s economic lessons focused on
the consumer hardship caused when military spending
sapped production of civilian goods and services. As the
wealthiest nation in history, we have the ability to produce
both guns and butter.■
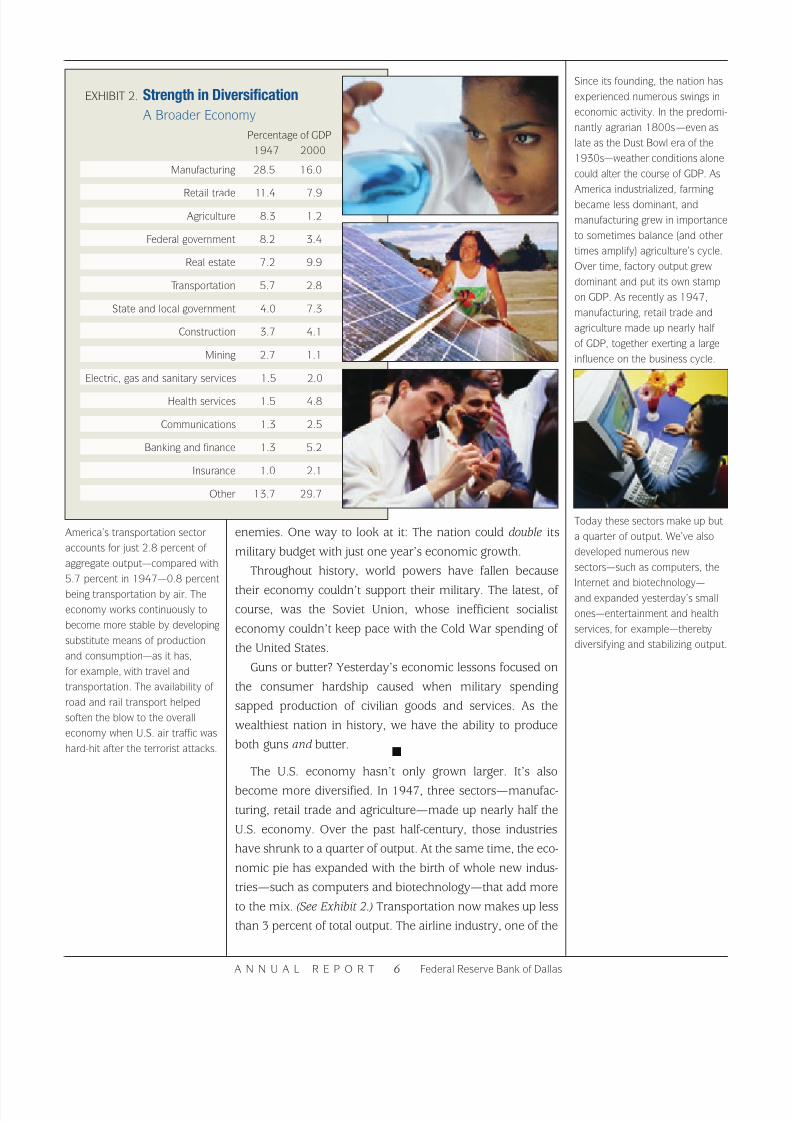
The U.S. economy hasn’t only grown larger. It’s also
become more diversified. In 1947, three sectors—manufac-
turing, retail trade and agriculture—made up nearly half the
U.S. economy. Over the past half-century, those industries
have shrunk to a quarter of output. At the same time, the eco-
nomic pie has expanded with the birth of whole new indus-
tries—such as computers and biotechnology—that add more
to the mix. (See Exhibit 2.) Transportation now makes up less
than 3 percent of total output. The airline industry, one of the
EXHIBIT 2. Strength in Diversification
A Broader Economy
Percentage of GDP
1947 2000
Manufacturing 28.5 16.0
Retail trade 11.4 7.9
Agriculture 8.3 1.2
Federal government 8.2 3.4
Real estate 7.2 9.9
Transportation 5.7 2.8
State and local government 4.0 7.3
Construction 3.7 4.1
Mining 2.7 1.1
Electric, gas and sanitary services 1.5 2.0
Health services 1.5 4.8
Communications 1.3 2.5
Banking and finance 1.3 5.2
Insurance 1.0 2.1
Other 13.7 29.7
America’s transportation sector
accounts for just 2.8 percent of
aggregate output—compared with
5.7 percent in 1947—0.8 percent
being transportation by air. The
economy works continuously to
become more stable by developing
substitute means of production
and consumption—as it has,
for example, with travel and
transportation. The availability of
road and rail transport helped
soften the blow to the overall
economy when U.S. air traffic was
hard-hit after the terrorist attacks.
Today these sectors make up but
a quarter of output. We’ve also
developed numerous new
sectors—such as computers, the
Internet and biotechnology—
and expanded yesterday’s small
ones—entertainment and health
services, for example—thereby
diversifying and stabilizing output.

8/2/2019 2001 Dallas Federal Reserve Annual Report
http://slidepdf.com/reader/full/2001-dallas-federal-reserve-annual-report 8/51
A N N U A L R E P O R T 7 Federal Reserve Bank of DallasA N N U A L R E P O R T 7 Federal Reserve Bank of Dallas
EXHIBIT 3. We Are the World
Foreign-Born Population in the United States
sectors hardest hit after the terrorist attacks, accounts for less
than 1 percent of the economy.
America’s employment base shows a similar increase in
breadth. The 15 most common occupations, including farm-
ing and carpentry, made up two-thirds of all employment in
1900. Today, the top 15 jobs include computer operators and
engineers, but together these jobs account for less than a
third of all employment.
When it comes to personal investing, financial gurus
preach diversification as a way to reduce risk. What’s good for
investors is good for nations as well. In today’s economy, jobs
are spread more evenly among a wide variety of industries,
none of them overly dominant. Trouble in one or two sectors
doesn’t create waves that swamp the economy as a whole.
Our immigrant population has become more varied
along with our economy. In 1900, during an earlier wave of
newcomers, more than half the foreign-born came from two
countries, the United Kingdom and Germany. Now, as then,
America’s prosperity, openness and freedom are magnets
for people from other nations. But today’s foreign-born pop-
ulation comes from almost every part of the globe. (See
Exhibit 3.) We are the world.
Immigration opponents might worry that we’re inviting
potential enemies into the country. America, though, has grown
America is largely a nation of
immigrants, or descendants
thereof. Our strength lies not only
in the size and diversification of
our economy but also in the
diversity of our people. A hundred
and fifty years ago, immigrants
from the British Isles and Germany
made up more than 80 percent
of our melting pot. In 1900, that
figure was still more than half.
Today, the scope of America’s
foreign-born population gives
much of the human race an
interest in our well-being. Spoken
by such a great variety of people,
the words “I am an American”
resonate strongly around
the world.
Region or country not reported
Canada
Caribbean
South America
Other Central America
Mexico
Australia, New Zealandand Pacific Islands
Asia (not elsewhere classified)
South Central Asia
South Eastern Asia
Eastern Asia
Africa
Scandinavia
Europe (not elsewhere classified)
Eastern EuropeAustria and Switzerland
Southern Europe
Portugal and Spain
France
Germany
British Isles
Key
1900 2000
8/2/2019 2001 Dallas Federal Reserve Annual Report
http://slidepdf.com/reader/full/2001-dallas-federal-reserve-annual-report 9/51
In 2001, two of America’s greatest
cities—New York and Washington—
came under attack. More than
3,000 lives were lost, and a
substantial amount of property
was destroyed. At one time,targeting such major population
centers would have crippled the
United States. But the growth of
new centers from border to
border and coast to coast gives
us strength in numbers.
rich and powerful as a nation of immigrants who create human
bridges to other nations. People from other parts of the world
can learn firsthand about us, and we can learn about them.
■
We’re more decentralized as well as more diverse. With
each decade, America’s population has dispersed across the
continent, evening out the distribution of economic activity
and thereby making the country less vulnerable to disruption.
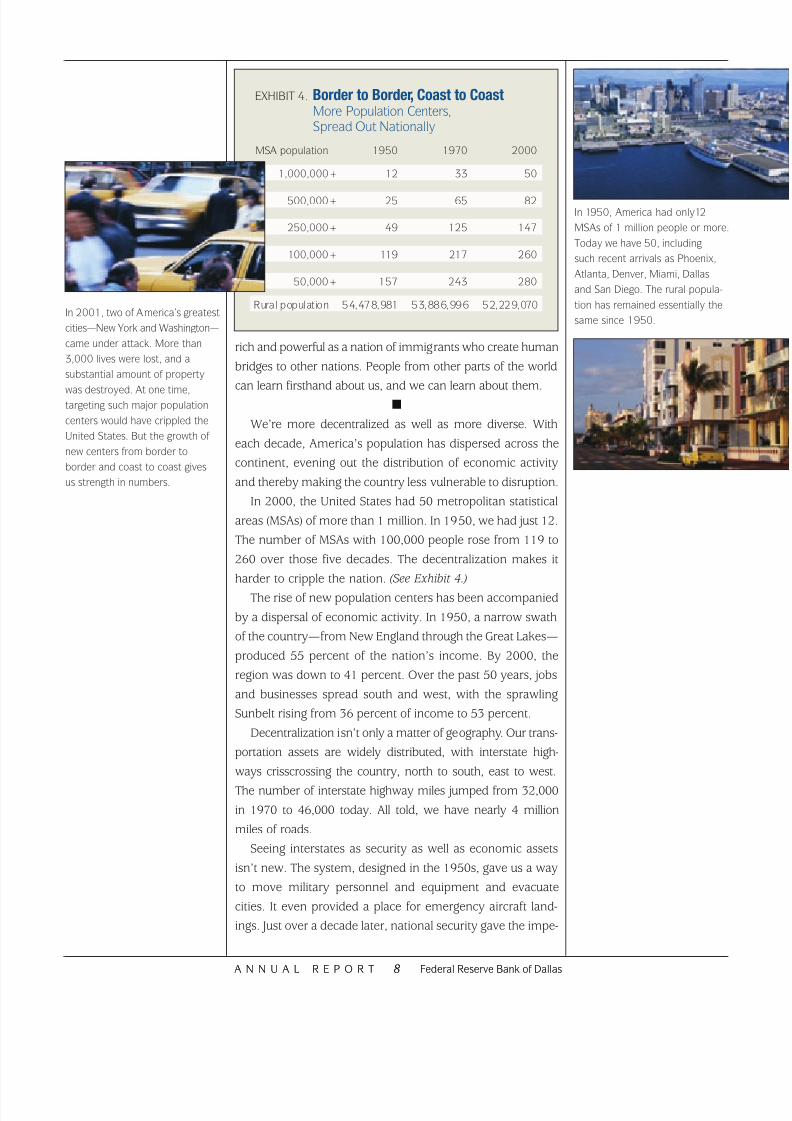
In 2000, the United States had 50 metropolitan statistical
areas (MSAs) of more than 1 million. In 1950, we had just 12.
The number of MSAs with 100,000 people rose from 119 to
260 over those five decades. The decentralization makes it
harder to cripple the nation. (See Exhibit 4.)
The rise of new population centers has been accompanied
by a dispersal of economic activity. In 1950, a narrow swath
of the country—from New England through the Great Lakes—
produced 55 percent of the nation’s income. By 2000, the
region was down to 41 percent. Over the past 50 years, jobs
and businesses spread south and west, with the sprawling
Sunbelt rising from 36 percent of income to 53 percent.
Decentralization isn’t only a matter of geography. Our trans-
portation assets are widely distributed, with interstate high-
ways crisscrossing the country, north to south, east to west.
The number of interstate highway miles jumped from 32,000
in 1970 to 46,000 today. All told, we have nearly 4 million
miles of roads.
Seeing interstates as security as well as economic assets
isn’t new. The system, designed in the 1950s, gave us a way
to move military personnel and equipment and evacuate
cities. It even provided a place for emergency aircraft land-
ings. Just over a decade later, national security gave the impe-
A N N U A L R E P O R T 8 Federal Reserve Bank of DallasA N N U A L R E P O R T 8 Federal Reserve Bank of Dallas
EXHIBIT 4. Border to Border, Coast to CoastMore Population Centers,Spread Out Nationally
MSA population 1950 1970 2000
1,000,000+ 12 33 50
500,000+ 25 65 82
250,000+ 49 125 147
100,000+ 119 217 260
50,000+ 157 243 280
Rural population 54,478,981 53,886,996 52,229,070
In 1950, America had only12
MSAs of 1 million people or more.
Today we have 50, including
such recent arrivals as Phoenix,
Atlanta, Denver, Miami, Dallas
and San Diego. The rural popula-
tion has remained essentially the
same since 1950.

8/2/2019 2001 Dallas Federal Reserve Annual Report
http://slidepdf.com/reader/full/2001-dallas-federal-reserve-annual-report 10/51
tus to what would become the Internet, a worldwide infor-
mation network that’s everywhere, with no central location.
Like diversification, decentralization strengthens the econ-
omy by making it less vulnerable to major disruptions. Even
with much of New York, a key financial center, hobbled after
September11,onlya tiny portion of America’s economic assets
were out of commission. Most disruptions were brief. We ben-
efited not only from backup and emergency systems but also
from the know-how to get commerce up and running again.
As it turned out, we received an unintended dividend from
the intensive preparations for Y2K, when, many experts
warned, a software glitch could shut down computers at the
start of the new millennium. Valuable knowledge, once
acquired, wasn’t lost. Our open, competitive system put it to
good use in reducing the economy’s vulnerability to shock.
Financial markets functioned well in a time of crisis, pro-
viding a virtually uninterrupted flow of money and credit.
The Federal Reserve did its part by settling accounts and bol-
stering confidence, keeping the payments system working
smoothly. (See “The Fed’s Response.”)
Our banking system found strength in redundancy. Com-
merce is less likely to grind to a halt in a crisis because we’ve
developed ready alternatives to trips to the bank. The nation
now operates 273,000 automated-teller machines, offering
A N N U A L R E P O R T 9 Federal Reserve Bank of Dallas
The Fed’s ResponseThe Federal Reserve moved
quickly to help keep the nation’s
financial and payments systems
running smoothly after the Sep-
tember 11 attacks. Among the
actions the Fed took:
■ The New York Trading Desk
injected an unusual amount
of liquidity into the economy
through repurchase agree-
ments, called repos.
■ The Fed lent money directly to
banks through the discount win-
dow. The $45 billion in discount
loans outstanding on Wednes-
day, September 12, dwarfed
the $59 million average of the
previous 10 Wednesdays.
■ The Federal Reserve—along
with the comptroller of the
currency—urged banks to work
with customers affected by the
events. The Fed stood ready
with additional funds to assist in
restructuring loans.
■ Because the grounding of
aircraft prevented the timely
clearing of checks, the Federal
Reserve extended almost
$23 billion in check float on
September 12—about 30 times
the average float over each of
the previous 10 Wednesdays.
■ The Fed established or
extended swap lines with
foreign central banks. Such
arrangements enable central
banks to temporarily exchange
currencies to meet liquidity
needs in foreign currencies.
For example, the Fed and the
European Central Bank agreed
on an arrangement that allowed
the ECB to draw up to $50
billion in dollar-denominated
deposits in exchange for an
equivalent amount in euro.
The dollar deposits were avail-
able to European banks whose
U.S. operations were affected
by the events of September 11.
■ The Federal Open Market
Committee reduced the federal
funds rate target by half a
percentage point, to 3 percent,
on Monday, September 17, just
before the New York Stock
Exchange reopened. The Fed’s
action was seen as an effort
to boost confidence in the
economy. In announcing the
rate cut, the Fed noted that it
A Monetary SnapshotDiscount Deposits at Federal
Repos window lending Float Reserve Banks
Wednesday averages$27,298 $ 59 $ 720 $ 19,009
7/4–9/5/01
9/12/01 $61,005 $45,528 $22,929 $102,704
9/19/01 $39,600 $ 2,587 $ 2,345 $ 13,169
Millions of dollars
would continue to supply
unusually large volumes of
liquidity to the financial markets
“until more normal market
functioning is restored.”
Deposits at Federal Reserve Banks
give us a picture of the liquidity
pumped into the economy. On
September 12, deposits totaled
nearly $103 billion, more than five
times the average of the previous
10 Wednesdays.
Adapted from C.J. Neely, “September 11,
2001,” Monetary Trends, Federal Reserve
Bank of St. Louis, November 2001.

8/2/2019 2001 Dallas Federal Reserve Annual Report
http://slidepdf.com/reader/full/2001-dallas-federal-reserve-annual-report 11/51
EXHIBIT 5. A Wealth of Resources
Our National Infrastructure1970 Current
Miles of interstate highway 32,000 46,000
Miles of public road 3,730,082 3,932,017
Number of dams 48,000 77,400
Number of bridges 571,936 590,153
Square miles of inland water area 138,319 138,989
Number of airports 11,261 19,098
Miles of fiber-optic cable 0 39,000,000
Number of utility companies 6,256 11,662
Number of cellular sites 0 114,059
Number of cellular towers 0 104,000
Number of Internet web sites 0 31,299,592
Number of web hosts 13 109,574,429
Number of U.S. satellites in orbit n.a. 700
Number of ATM terminals 1 273,000
Miles of petroleum pipeline 176,000 157,000
Miles of natural gas pipeline 1,121,178 2,039,173
A N N U A L R E P O R T 10 Federal Reserve Bank of Dallas
access to cash 24 hours a day. In 1970, the main office of
Chemical Bank in New York had the country’s only ATM, so
customers of other banks had to conduct their business dur-
ing office hours. (See Exhibit 5.)
We can continue spending with less cash in our pockets.
Just 16 percent of American families had a general-purpose
credit card in 1970. Today, nearly 70 percent do. On top of
that, the number of point-of-sale terminals, which process
transactions without cash, jumped to nearly 2.4 million in
2000, up from 53,000 a decade ago.
All across the economy, we have more than the bare min-
imum of what we need.
Until the early 1970s, delivering messages usually involved
one of two means of communication—a telephone monopoly
or the U.S. Postal Service. In today’s economy, the channels
are proliferating. In the past two decades, an innovative mar-
ketplace has added fax machines, electronic mail, Internet
chat rooms and wireless handheld devices. We have a multi-
tude of choices for telecommunications services. Business is
booming for private alternatives to the post office—such as
FedEx Corp.—that provide door-to-door service.
The nation’s infrastructure is
constantly growing, as businesses
seek profit and government
invests in public projects. The
United States has nearly 4 million
miles of roads and highways,
more than 590,000 bridges and77,000 dams, over 19,000
airports and nearly 12,000 utility
companies. Natural gas pipelines
have almost doubled since
1970 and now crisscross more
than 2 million miles.In 1970 we had no fiber-optic
cable in place, no cellular sites or
towers, no Internet sites, one lone
ATM, no point-of-sale terminals
and only a handful of satellites.
Today these tools abound,
making commerce easier, faster
and more reliable.
8/2/2019 2001 Dallas Federal Reserve Annual Report
http://slidepdf.com/reader/full/2001-dallas-federal-reserve-annual-report 12/51
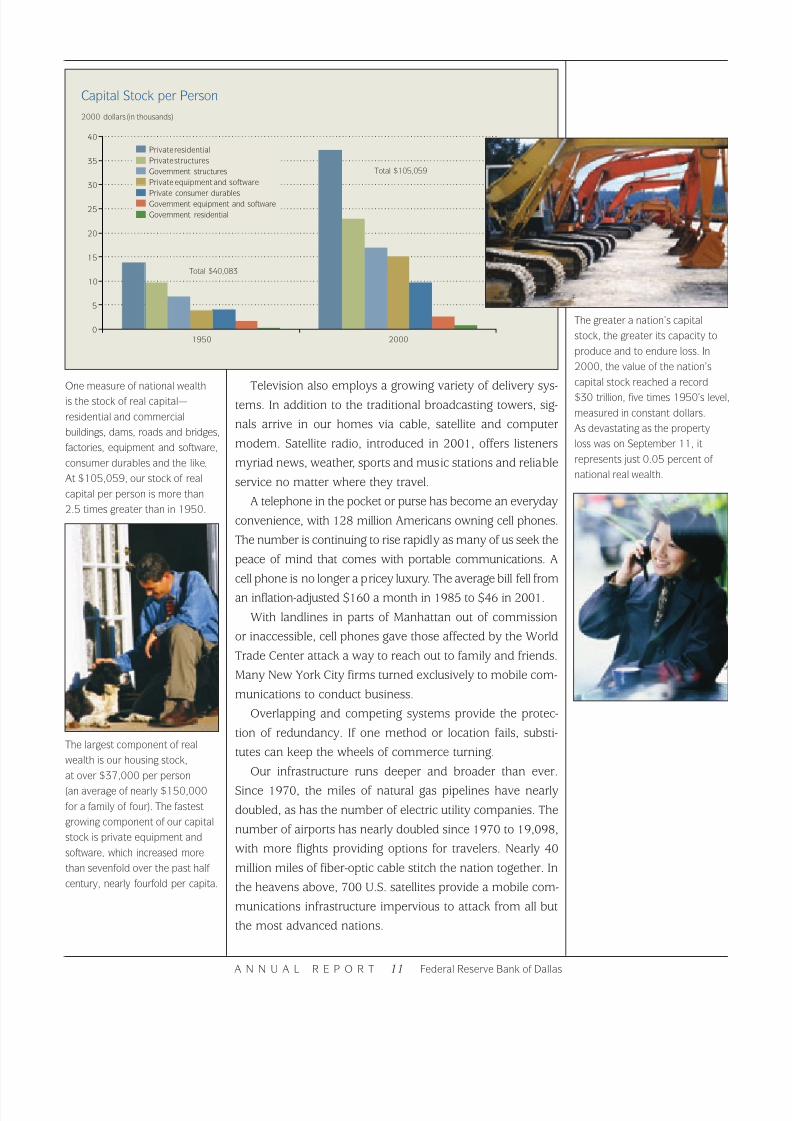
The greater a nation’s capital
stock, the greater its capacity to
produce and to endure loss. In
2000, the value of the nation’s
capital stock reached a record
$30 trillion, five times 1950’s level,
measured in constant dollars.
As devastating as the property
loss was on September 11, it
represents just 0.05 percent of
national real wealth.
Television also employs a growing variety of delivery sys-
tems. In addition to the traditional broadcasting towers, sig-
nals arrive in our homes via cable, satellite and computer
modem. Satellite radio, introduced in 2001, offers listeners
myriad news, weather, sports and music stations and reliable
service no matter where they travel.
A telephone in the pocket or purse has become an everyday
convenience, with 128 million Americans owning cell phones.
The number is continuing to rise rapidly as many of us seek the
peace of mind that comes with portable communications. A
cell phone is no longer a pricey luxury. The average bill fell from
an inflation-adjusted $160 a month in 1985 to $46 in 2001.
With landlines in parts of Manhattan out of commission
or inaccessible, cell phones gave those affected by the World
Trade Center attack a way to reach out to family and friends.
Many New York City firms turned exclusively to mobile com-
munications to conduct business.
Overlapping and competing systems provide the protec-
tion of redundancy. If one method or location fails, substi-
tutes can keep the wheels of commerce turning.
Our infrastructure runs deeper and broader than ever.
Since 1970, the miles of natural gas pipelines have nearly
doubled, as has the number of electric utility companies. The
number of airports has nearly doubled since 1970 to 19,098,
with more flights providing options for travelers. Nearly 40
million miles of fiber-optic cable stitch the nation together. In
the heavens above, 700 U.S. satellites provide a mobile com-
munications infrastructure impervious to attack from all but
the most advanced nations.
A N N U A L R E P O R T 11 Federal Reserve Bank of Dallas
Capital Stock per Person
2000 dollars (in thousands)
Total $105,059
Total $40,083
One measure of national wealth
is the stock of real capital—
residential and commercial
buildings, dams, roads and bridges,
factories, equipment and software,
consumer durables and the like.
At $105,059, our stock of real
capital per person is more than
2.5 times greater than in 1950.
The largest component of real
wealth is our housing stock,
at over $37,000 per person
(an average of nearly $150,000
for a family of four). The fastest
growing component of our capital
stock is private equipment and
software, which increased more
than sevenfold over the past half
century, nearly fourfold per capita.
0
5
10
15
20
25
30
35
40
Government residential
Government equipment and softwarePrivate consumer durables
Private equipment and software
Government structures
Private structures
Private residential
20001950
8/2/2019 2001 Dallas Federal Reserve Annual Report
http://slidepdf.com/reader/full/2001-dallas-federal-reserve-annual-report 13/51
To leverage our education,
Americans routinely use superfast
computers that can tap more
than 31 million web sites. The
United States has over a third of
the world’s computing power,
66 percent of us have access to
computers at home, business
or school, and 54 percent use
the Internet.
Human and Technological WealthThe nation is smarter than it used to be—both in its human
capital and in its infrastructure.
The United States leads all other nations with a quarter of
its population college-educated in 2000, up from just 6.2
percent in 1950. Roughly 400,000 master’s degrees are
awarded each year, nearly seven times the number in 1950
and double the 1970 rate. Doctorates and professional
degrees have been rising, too. (See Exhibit 6.)
Knowledge isn’t just a matter of formal education. It’s also
experience. The median age climbed to 35 in 2000, the high-
est ever. By comparison, the figure for 1900 was 23; for
1950, it was 30. If age is a proxy for accumulated know-how,
both on the job and off, an older population should be better
equipped to solve problems.
What’s more, knowledge isn’t just the province of humans
in today’s world. It’s embedded in the machines we use,
thanks to the spread of increasingly powerful computer chips
over the past quarter century.
The signature invention of our times, the microchip
spawned important technology spillovers. It started in the
1970s with the birth of the personal computer industry. The
1980s brought “smart” products as companies incorporated
chips into cell phones and other devices. The 1990s emerged
as the decade of the Internet, with e-mail, e-commerce and
e-entertainment.
A N N U A L R E P O R T 12 Federal Reserve Bank of Dallas
EXHIBIT 6. Knowledge Is Power
1950 1970 2000
High school education 34.3% 55.2% 84.1%
College education 6.2% 11.0% 25.6%
Number of degrees conferred:
Master’s 58,183 208,291 398,000
Doctoral 6,420 29,866 45,200
Professional 15,191 26,948 57,688
Computer in the home 0% 0% 57.6%
Households with Internet access 0% 0% 41.5%
Patents issued 47,800 67,700 175,500
Median age of population 30.2 28.1 35.3
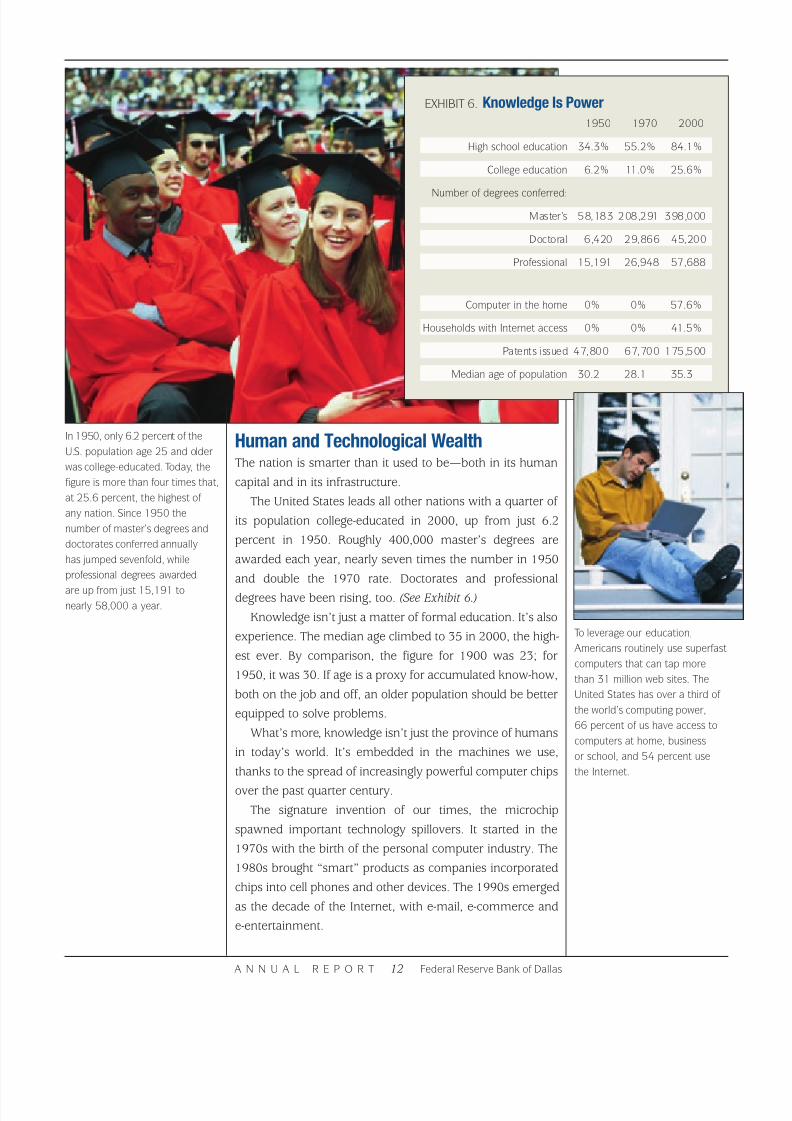
In 1950, only 6.2 percent of the
U.S. population age 25 and older
was college-educated. Today, the
figure is more than four times that,
at 25.6 percent, the highest of
any nation. Since 1950 the
number of master’s degrees and
doctorates conferred annually
has jumped sevenfold, while
professional degrees awarded
are up from just 15,191 tonearly 58,000 a year.
8/2/2019 2001 Dallas Federal Reserve Annual Report
http://slidepdf.com/reader/full/2001-dallas-federal-reserve-annual-report 14/51
Aside from a handful of
mainframe computer operators,
few Americans in 1970 had
access to a computer, and the
Internet’s forerunner—the
ARPANET (Advanced Research
Projects Agency Network)—
linked just a few researchers.
By one count, the number of
U.S. scientists and engineers
engaged in research anddevelopment today exceeds
3 million, double that of
the 1970s.
America controls nearly two-fifths of the world’s comput-
ing power. We’ve stored trillions of lines of computer code.
Our stock of business equipment and software is 20 times
higher than in 1950. It represents a store of “canned” knowl-
edge that simplifies operation, saves time, enhances reliabil-
ity, reduces human error, and works day in and day out.
Smart products are all around us. Nearly every Americanfamily enjoys a wide variety of them—microwave ovens,
VCRs and remote controls, to name a few. As amazing as
these products are, the impact of the microprocessor goes
far beyond household conveniences. In the business world,
bar-code scanners and robotic devices lower costs and
speed distribution. Important systems, such as communica-
tions, can operate with less human intervention, a factor
that allows them to continue functioning in times of stress.
Data-storage technology makes it easier and cheaper to
duplicate records and store reams of information in more
than one place.
The Internet, which became a staple of businesses and
homes in the 1990s, is revolutionizing our lives. It provides
instant access to information, making Americans better
informed than ever. Consumers have a 24-hour global mar-
ketplace at their fingertips. Companies can interact with sup-
pliers and customers to better manage their inventories. By
linking sales to inventories and suppliers, modern technology
is reducing unanticipated accumulation of unsold goods,
often a source of economic instability. Point-of-sale scanners
connect to warehouse databases and suppliers, so orders for
new stock can match sales.
The inventory-to-shipments ratio hovered at 1.7 months
from 1957, when data collection began, to the early 1990s.
With the advent of supply-chain management, the ratio con-
sistently declined in the 1990s and fell to a low of 1.3 months
at the start of this decade.
With the Internet’s power to communicate, employees are
increasingly freed from the commute to the workplace. The
number of U.S. telecommuters reached 28.8 million in 2001,
an eightfold increase in 10 years’ time. Many of us can work
from home—or just about any other place—so maintaining
the nation’s production depends less on gathering employ-
ees at particular places.
Telecommuting isn’t the only way modern technologies
keep Americans working when a shock jolts the economy.
If shifting forces lead to layoffs, the unemployed can turn to
more than 300 online job-search engines, a service that
Whether the goal is fighting
world hunger, preserving the
environment, developing new
vaccines to thwart bioterror or
tracking global flows of terrorists’
funds, knowledge is power—and
no nation forges knowledge
better than the United States.
A N N U A L R E P O R T 13 Federal Reserve Bank of Dallas
8/2/2019 2001 Dallas Federal Reserve Annual Report
http://slidepdf.com/reader/full/2001-dallas-federal-reserve-annual-report 15/51
didn’t even exist in 1990. What keeps us working keeps us
stronger.
The country’s world-class technology was on display in
the precision bombing in Afghanistan. So-called smart
bombs combine computer chips, laser guidance systems
and global-positioning satellites to deliver ordnance on tar-
get and minimize civilian casualties. Unmanned drones,
controlled from thousands of miles away, can return video
feeds or drop bombs. Spotters on the ground use handheld
computers and satellite telephones to provide real-time bat-
tlefield information.
Advances in battlefield technology are reducing the risks
for America’s fighting men and women. Including terrorist
attacks, U.S. military personnel killed or missing in all hostile
action from 1980 to 2000 total fewer than 600, a triumph of
technology and tactics. (See Exhibit 7.)
In the wake of September 11, technology will help improve
security at home. Sensors in public buildings and transport
will help secure us against chemical or biological attack.
Technology allows us to track the flow of money and freeze
the assets of our enemies.
When it comes to increasing the safety of air travel, antiter-
rorist measures will go well beyond the metal detectors and
X-ray machines now used in most terminals. Airports are
starting to deploy explosives detectors that use medicine’s CT
technology to scan luggage. New identification technologies
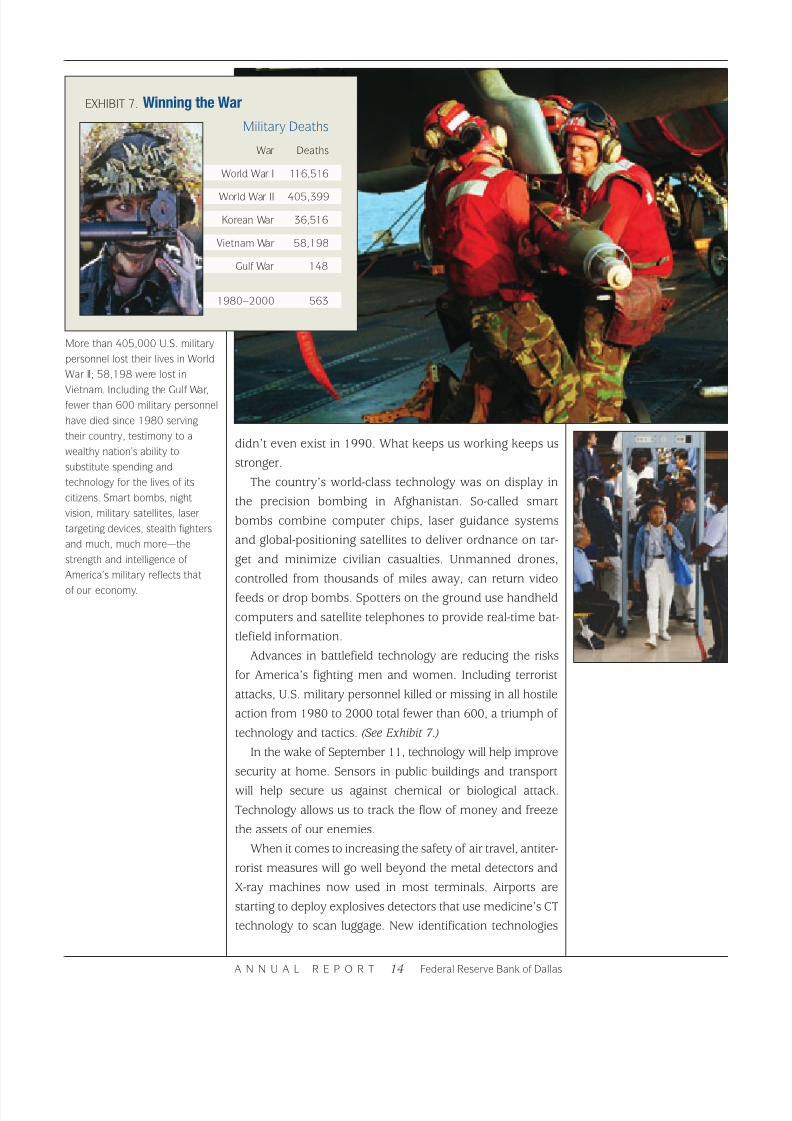
More than 405,000 U.S. military
personnel lost their lives in World
War II; 58,198 were lost in
Vietnam. Including the Gulf War,fewer than 600 military personnel
have died since 1980 serving
their country, testimony to a
wealthy nation’s ability to
substitute spending and
technology for the lives of its
citizens. Smart bombs, night
vision, military satellites, laser
targeting devices, stealth fighters
and much, much more—the
strength and intelligence of
America’s military reflects that
of our economy.
A N N U A L R E P O R T 14 Federal Reserve Bank of Dallas
EXHIBIT 7. Winning the War
Military Deaths
War Deaths
World War I 116,516
World War II 405,399
Korean War 36,516
Vietnam War 58,198
Gulf War 148
1980–2000 563
8/2/2019 2001 Dallas Federal Reserve Annual Report
http://slidepdf.com/reader/full/2001-dallas-federal-reserve-annual-report 16/51
are capable of reading fingerprints, palms and facial features.
With just a puff of air, a particle blaster can detect explosive
residue on passengers’ clothes and carry-ons.
Aboard aircraft, security could be increased with surveil-
lance cameras and silent alarms that could be tripped by
flight attendants. The technology exists to prevent planes
from flying into specified zones or to take control of an air-
craft from the ground.
On the ground, technology provides alternatives for many
of the traditional ways of doing business. For example, tele-
conferencing has become an option for American business
executives reluctant to travel. Malls are safe, but anyone who
worries about the risks of crowded shopping areas can now
buy just about anything online.
A complex, interconnected economy might seem more
open to attack because communications, banking and other
key systems are easily accessible. With technology making
the world a small place, disruptions could ripple through the
global economy. The response to September 11, though,
shows that our economy isn’t easily destabilized.
Technology can’t eliminate all risks. New devices often
have to overcome obstacles in cost, convenience and relia-
bility. Even so, the market will do what it has always done—
innovate. New safety features will help reduce the anxiety
that might slow economic activity, allowing us to raise
incomes and maintain jobs, even in a more dangerous world.
A N N U A L R E P O R T 15 Federal Reserve Bank of Dallas
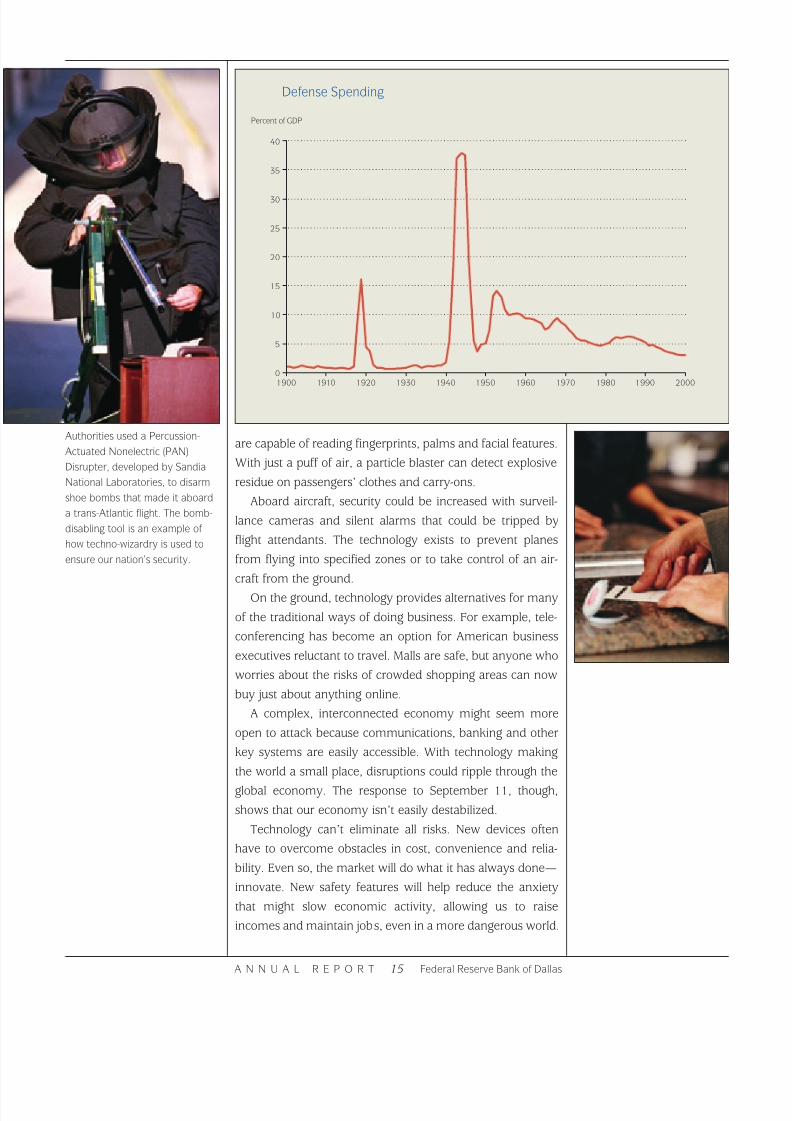
Defense Spending
Percent of GDP
0
5
10
15
20
25
30
35
40
20001990198019701960195019401930192019101900
Authorities used a Percussion-
Actuated Nonelectric (PAN)
Disrupter, developed by Sandia
National Laboratories, to disarm
shoe bombs that made it aboard
a trans-Atlantic flight. The bomb-
disabling tool is an example of
how techno-wizardry is used to
ensure our nation’s security.

8/2/2019 2001 Dallas Federal Reserve Annual Report
http://slidepdf.com/reader/full/2001-dallas-federal-reserve-annual-report 17/51
A Stable EconomyAs the nation recovers from the September 11 shocks, we’re
seeing how our economy handles hard times. A big, sprawl-
ing economy, with decentralized production, redundant sys-
tems and a deep storehouse of knowledge, runs with a
dynamism that just won’t quit.
Recessions still occur, of course. In the modern era,
though, they’re shorter and shallower than they were during
much of the nation’s history. From 1879 to the start of World
War II, a moving average of the previous 25 years shows that
the United States was in recession more than 40 percent of
the time. Since 1953, the time has been reduced to less than
20 percent. In the past quarter century, the economy has
been in recession less than 10 percent of the time. (See
Exhibit 8.)
Since 1960, the average recession has lasted 11 months.
Before 1940, only one in seven recessions was over within 11
months; a third of them hung on for at least 23 months.
Between 1887 and 1950, recessions meant an average
decline of 13 percent in industrial production. Since 1960,
the toll has been reduced to 7 percent.
If history plays out, our current recession should be rela-
tively brief. The National Bureau of Economic Research, the
arbiter of the economy’s ups and downs, has decreed that
the 10-year expansion, the longest in U.S. history, ended in
The U.S. economy has endured
many blows in its 225 years—
wars with foreign powers, our own
Civil War, the Great Depression,
the assassination of four
presidents, stock market crashes,
racial strife and more.
Nonetheless, the country has
survived, learned and emerged
stronger. Our stability is reflected
in the economy, which today
takes more steps forward and
fewer steps back than at any time
in history. A 25-year moving
average of expansion versus
contraction shows that for nearly
a century—until the 1940s—the
economy was in recession
40 to 50 percent of the time,
taking one step back for nearly
every step forward. From 1940 to
1982, our performance improved,
and the frequency of recessions
fell to an average of about
15 percent. More recently, theeconomy has shown even more
stability, marching forward up to
90 percent of the time.
A N N U A L R E P O R T 16 Federal Reserve Bank of DallasA N N U A L R E P O R T 16 Federal Reserve Bank of Dallas
EXHIBIT 8. Ten Steps Forward, One Step Back
Economic Downturns
25-year moving average
0
60
50
40
30
20
10
1999198919791969195919491939192919191909189918891879
8/2/2019 2001 Dallas Federal Reserve Annual Report
http://slidepdf.com/reader/full/2001-dallas-federal-reserve-annual-report 18/51
March 2001. As we went into 2002, though, the economy
was showing signs of revival in rising stock prices, declining
job cuts and improving consumer confidence.
Hard times always mean lost jobs, but our country’s capac-
ity to recover quickly from recession makes unemployment a
short-term pain for most workers. After the previous recession,
an eight-month interval that ended in March 1991, we made
up all the job losses in the first year of recovery. Then we went
on to create jobs for an additional 17 million workers.
In this recession, we worry about the 1.8 million Ameri-
cans who lost their jobs in 2001. What past business cycles
teach us, though, is that this economy can rapidly recycle
workers from declining to expanding industries.
Our recessions are shorter and milder than they once
were because boom-to-bust industries—such as farming,
mining, manufacturing and construction—no longer domi-
nate the economy. The volatile sectors are not only smaller
slices of the pie, but they’ve also been offset by more stable
pieces, especially services. Since 1947, goods-producing
activities have fallen from 57 percent to 37 percent of total
output. At the same time, service industries have increased
their share of the economy from 34 percent to 54 percent.
A N N U A L R E P O R T 17 Federal Reserve Bank of DallasA N N U A L R E P O R T 17 Federal Reserve Bank of Dallas
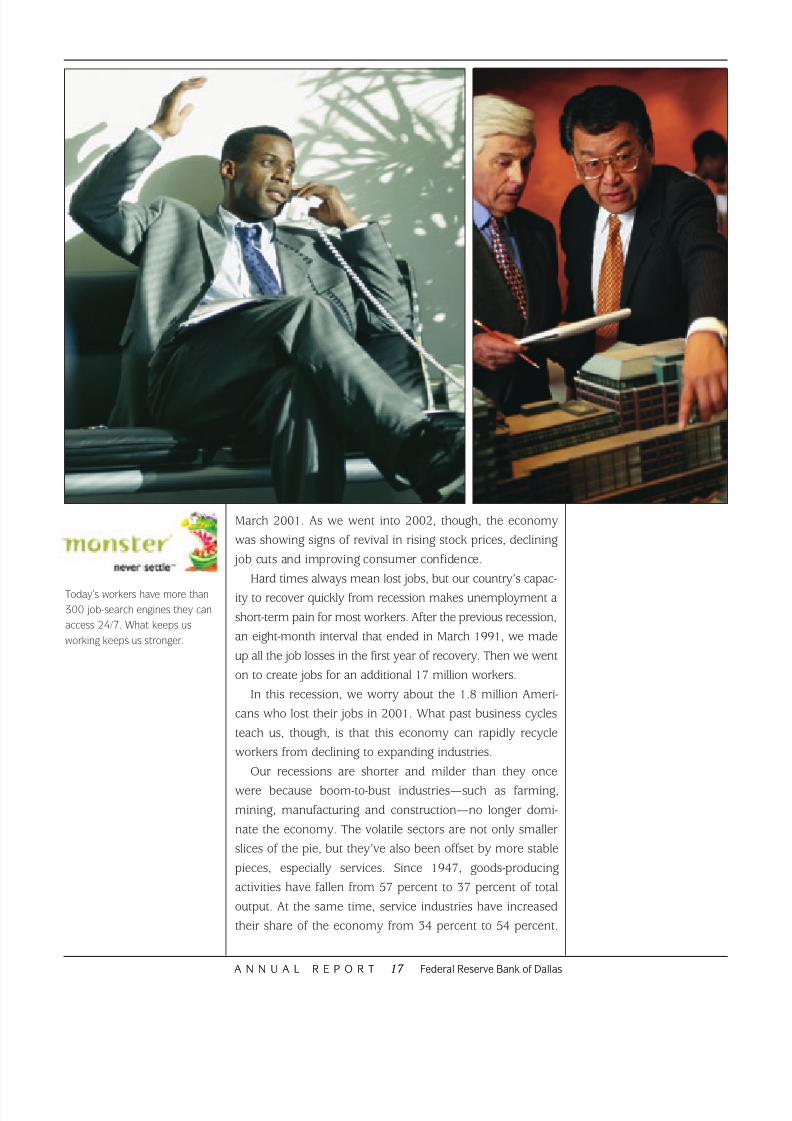
Today’s workers have more than
300 job-search engines they can
access 24/7. What keeps us
working keeps us stronger.

8/2/2019 2001 Dallas Federal Reserve Annual Report
http://slidepdf.com/reader/full/2001-dallas-federal-reserve-annual-report 19/51
The Commerce Department
divides gross domestic product
into three sectors—goods,
services and structures. The most
volatile sector is structures; the
least, services. At 1.1 percent,
the standard deviation from trend
growth in services output is less
than one-fourth that of structures
(4.6 percent) and less than half
that of goods (2.7 percent).
Two factors have helped make
GDP growth more stable. First, the
variation in each GDP component
has declined. Second, the share
of the economy owing to services
has increased. In 1947, GDPwas roughly 57 percent goods,
34 percent services and
9 percent structures. Today the
shares are 37, 54 and 9 percent,
respectively.
Over the business cycle, services exhibit less than half the
volatility of goods and about a quarter of the instability of
construction. (See Exhibit 9.)
Smoother business cycles aren’t just the result of a shift-
ing industrial base. Wealthy nations can maintain their
spending in hard times with savings, credit and social spend-
ing. They can also afford more and better economic analysis,
which should lead to sounder policies.
We’ve learned from past mistakes. Bad policies worsened
the Great Depression of the 1930s. But with the financial shocks
of 1987 (the stock market crash) and 1998 (the Asian crisis), as
well as the aftermath of September 11, steady, experienced pol-
icymakers helped contain the damage and promote recovery.
Less severe recessions are proof of the economy’s
increased resilience. Confidence in our ability to bounce back
should reduce anxiety, even if attacks or threats temporarily
disrupt our economic lives. Being able to see beyond the fear
and uncertainty bolsters consumer and business confidence,
further enhancing our economic security.
A N N U A L R E P O R T 18 Federal Reserve Bank of Dallas
EXHIBIT 9. Steady as She Goes
Deviations from Trend Real Growth
Percent
Real GDP
–10
0
10
1995 200019891983197719711965195919531947
Services
–10
0
10
Goods
–10
0
10
Structures
–20
–10
0
10
20

8/2/2019 2001 Dallas Federal Reserve Annual Report
http://slidepdf.com/reader/full/2001-dallas-federal-reserve-annual-report 20/51
America is on the go. We drive
over 2.6 trillion miles per year,
6.5 times more than in the late
1940s. We fly 630 billion miles
per year, nearly 80 times as much
as back then. But travel isn’t our
only interest—safety is, too.
Advances in auto safety have cut
deaths per billion miles drivenfrom an annual average of 82.7 in
1946–50 to 15.9 in 1996–2000,
a reduction of over 80 percent.
A N N U A L R E P O R T 19 Federal Reserve Bank of Dallas
A Balanced LifeAmid headlines about terrorist attacks, it’s easy to forget
how far the United States has come in making life safer and
more secure.
In the five-year period ending in 2000, deaths on Ameri-
can roads averaged 15.9 per billion miles driven, compared
with 53.3 in the five years ending in 1970 and 82.7 for the
immediate post–World War II period. (See Exhibit 10.) The
skies have been getting safer, too. The five-year average for
deaths per billion passenger miles flown fell from 16.7 in
1950 to 1.3 in 1970 to 0.14 in 2000.
The toll of death and disease has been dramatically
reduced. Annual deaths per 1 million people are at an all-
time low. The age-adjusted death rate has fallen by 40 per-
cent since 1950. And since 1900 it’s dropped by two-thirds,
evidence of the steady progress we’ve made. Fatalities from
nearly all major diseases have declined sharply from their
peak rates. (See Exhibit 11 on the following page.)
The rate of fatalities due to natural causes fell from 1,349
per 100,000 people in 1950 to 826 in 1999, the most recent
data available. Accidents and deaths are declining both at
home and on the job. So are fatalities associated with natural
disasters.
EXHIBIT 10. We Get Around
Transportation: Scope and Safety
U.S. Annual Averages 1946–50 1966–70 1996–2000
Billions of miles driven 398 1,020 2,624
Motor vehicle fatalities 32,966 54,318 41,755
Deaths per billion miles driven 82.7 53.3 15.9
Billions of miles flown 8 110 630
Airline fatalities 140 145 90
Deaths per billion miles flown 16.7 1.3 0.14 The advance in airline safety is
even more impressive. Including
all causes—from engine failure to
bad weather to terrorist acts—
deaths per billion miles flown by
commercial aircraft were down
from 16.7 in 1946–50 to
0.14 in 1996–2000. That’s a
reduction of over 99 percent.
With a death rate less than1 percent that of travel by car,
air travel is by far the safest
form of transportation yet.
8/2/2019 2001 Dallas Federal Reserve Annual Report
http://slidepdf.com/reader/full/2001-dallas-federal-reserve-annual-report 21/51
A N N U A L R E P O R T 20 Federal Reserve Bank of Dallas
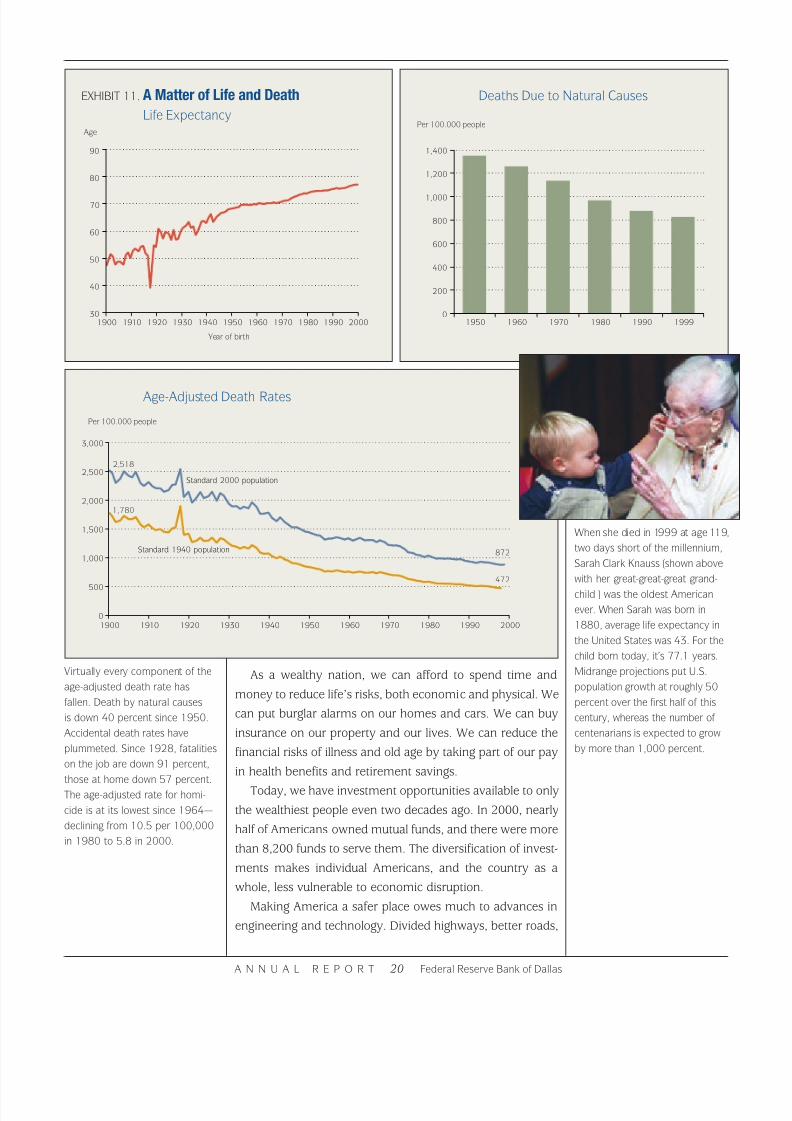
When she died in 1999 at age 119,
two days short of the millennium,
Sarah Clark Knauss (shown above
with her great-great-great grand-
child ) was the oldest American
ever. When Sarah was born in
1880, average life expectancy in
the United States was 43. For the
child born today, it’s 77.1 years.
Midrange projections put U.S.
population growth at roughly 50
percent over the first half of this
century, whereas the number of
centenarians is expected to grow
by more than 1,000 percent.
EXHIBIT 11. A Matter of Life and Death
Life ExpectancyAge
Year of birth
30
40
50
60
70
80
90
20001990198019701960195019401930192019101900
Deaths Due to Natural Causes
Per 100.000 people
Age-Adjusted Death Rates
Per 100.000 people
0
500
1,000
1,500
2,000
2,500
3,000
Standard 1940 population
Standard 2000 population
20001990198019701960195019401930192019101900
2,518
1,780
872
472
0
200
400
600
800
1,000
1,200
1,400
199919901980197019601950
As a wealthy nation, we can afford to spend time and
money to reduce life’s risks, both economic and physical. We
can put burglar alarms on our homes and cars. We can buy
insurance on our property and our lives. We can reduce the
financial risks of illness and old age by taking part of our pay
in health benefits and retirement savings.
Today, we have investment opportunities available to only
the wealthiest people even two decades ago. In 2000, nearly
half of Americans owned mutual funds, and there were more
than 8,200 funds to serve them. The diversification of invest-
ments makes individual Americans, and the country as a
whole, less vulnerable to economic disruption.
Making America a safer place owes much to advances in
engineering and technology. Divided highways, better roads,
Virtually every component of the
age-adjusted death rate has
fallen. Death by natural causes
is down 40 percent since 1950.
Accidental death rates have
plummeted. Since 1928, fatalities
on the job are down 91 percent,
those at home down 57 percent.
The age-adjusted rate for homi-
cide is at its lowest since 1964—
declining from 10.5 per 100,000
in 1980 to 5.8 in 2000.
8/2/2019 2001 Dallas Federal Reserve Annual Report
http://slidepdf.com/reader/full/2001-dallas-federal-reserve-annual-report 22/51
antilock brakes, radial tires and air bags are reducing the
highway death toll. Sophisticated weather-forecasting gear
provides warnings of severe weather, so we can take refuge
in time. New medicines and treatments have reduced the
incidence of fatal diseases.
Greater safety and security didn’t come about by acci-
dent. It’s what we, as a people, want. We put a high value on
our lives and physical well-being, and we’ll pay to protect
ourselves against the sometimes unpleasant facts of life.
Safety and security are part of a balanced life. As our
nation has grown richer, we’ve asked our economic and
political systems to deliver a wide range of benefits. As a soci-
ety, we can trade off some of one benefit to get more of
another—for example, give up material goods for more
A N N U A L R E P O R T 21 Federal Reserve Bank of Dallas
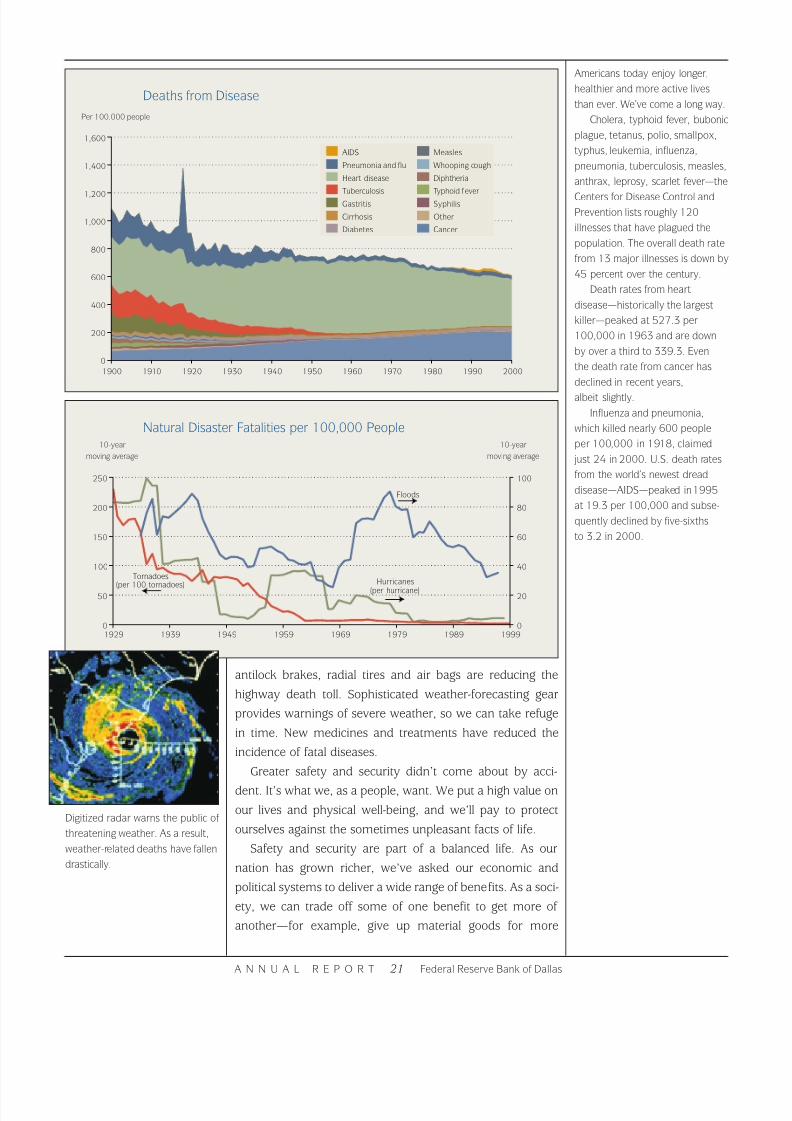
Americans today enjoy longer,
healthier and more active lives
than ever. We’ve come a long way.
Cholera, typhoid fever, bubonic
plague, tetanus, polio, smallpox,
typhus, leukemia, influenza,
pneumonia, tuberculosis, measles,
anthrax, leprosy, scarlet fever—the
Centers for Disease Control andPrevention lists roughly 120
illnesses that have plagued the
population. The overall death rate
from 13 major illnesses is down by
45 percent over the century.
Death rates from heart
disease—historically the largest
killer—peaked at 527.3 per
100,000 in 1963 and are down
by over a third to 339.3. Even
the death rate from cancer has
declined in recent years,
albeit slightly.
Influenza and pneumonia,
which killed nearly 600 people
per 100,000 in 1918, claimed
just 24 in 2000. U.S. death rates
from the world’s newest dread
disease—AIDS—peaked in1995
at 19.3 per 100,000 and subse-
quently declined by five-sixths
to 3.2 in 2000.
Deaths from Disease
Per 100.000 people
Natural Disaster Fatalities per 100,000 People10-year 10-year
moving average moving average
0
200
400
600
800
1,000
1,200
1,400
1,600
20001990198019701960195019401930192019101900
AIDS
Heart disease
Gastritis
Diabetes
Whooping cough
Typhoid fever
Other
Pneumonia and flu
Tuberculosis
Cirrhosis
Measles
Diphtheria
Syphilis
Cancer
0
50
100
150
200
250
Tornadoes(per 100 tornadoes)
199919891979196919591949193919290
20
40
60
80
100
Floods
Hurricanes
(per hurricane)
Digitized radar warns the public of
threatening weather. As a result,
weather-related deaths have fallen
drastically.
8/2/2019 2001 Dallas Federal Reserve Annual Report
http://slidepdf.com/reader/full/2001-dallas-federal-reserve-annual-report 23/51
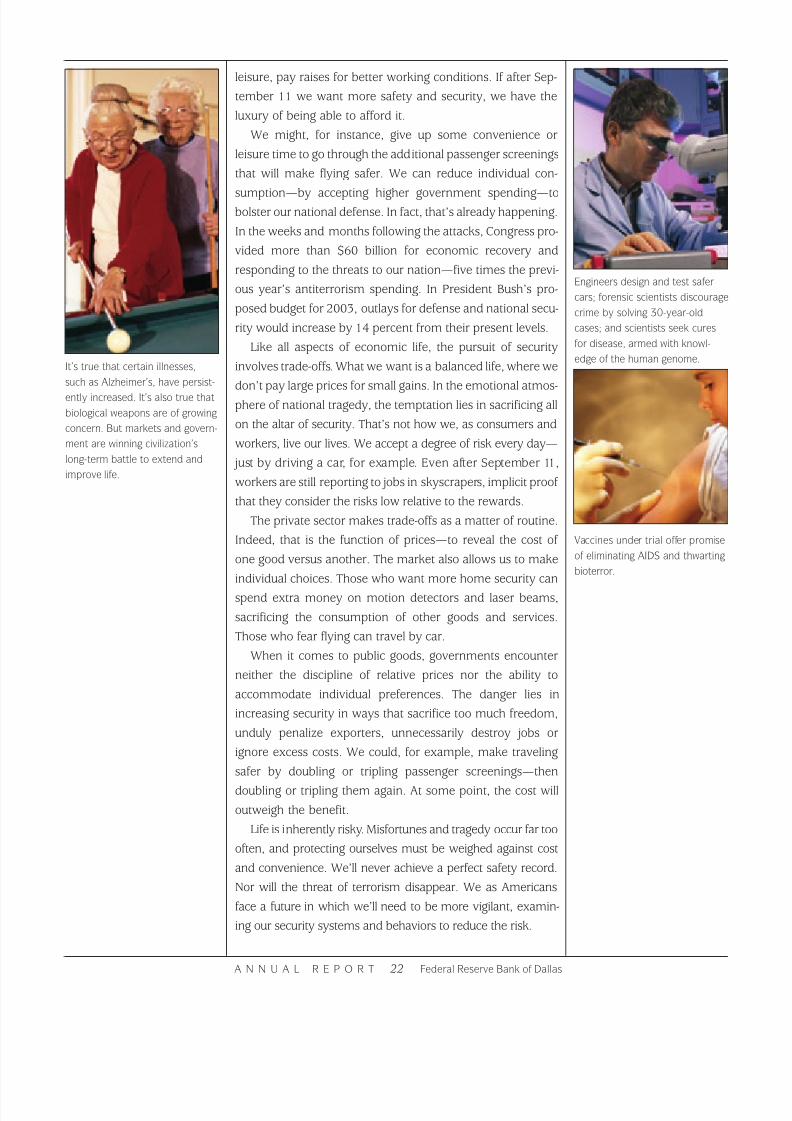
It’s true that certain illnesses,
such as Alzheimer’s, have persist-
ently increased. It’s also true that
biological weapons are of growing
concern. But markets and govern-
ment are winning civilization’s
long-term battle to extend and
improve life.
Engineers design and test safer
cars; forensic scientists discourage
crime by solving 30-year-old
cases; and scientists seek cures
for disease, armed with knowl-
edge of the human genome.
leisure, pay raises for better working conditions. If after Sep-
tember 11 we want more safety and security, we have the
luxury of being able to afford it.
We might, for instance, give up some convenience or
leisure time to go through the additional passenger screenings
that will make flying safer. We can reduce individual con-
sumption—by accepting higher government spending—tobolster our national defense. In fact, that’s already happening.
In the weeks and months following the attacks, Congress pro-
vided more than $60 billion for economic recovery and
responding to the threats to our nation—five times the previ-
ous year’s antiterrorism spending. In President Bush’s pro-
posed budget for 2003, outlays for defense and national secu-
rity would increase by 14 percent from their present levels.
Like all aspects of economic life, the pursuit of security
involves trade-offs. What we want is a balanced life, where we
don’t pay large prices for small gains. In the emotional atmos-
phere of national tragedy, the temptation lies in sacrificing all
on the altar of security. That’s not how we, as consumers and
workers, live our lives. We accept a degree of risk every day—
just by driving a car, for example. Even after September 11,
workers are still reporting to jobs in skyscrapers, implicit proof
that they consider the risks low relative to the rewards.
The private sector makes trade-offs as a matter of routine.
Indeed, that is the function of prices—to reveal the cost of
one good versus another. The market also allows us to make
individual choices. Those who want more home security can
spend extra money on motion detectors and laser beams,
sacrificing the consumption of other goods and services.
Those who fear flying can travel by car.
When it comes to public goods, governments encounter
neither the discipline of relative prices nor the ability to
accommodate individual preferences. The danger lies in
increasing security in ways that sacrifice too much freedom,
unduly penalize exporters, unnecessarily destroy jobs or
ignore excess costs. We could, for example, make traveling
safer by doubling or tripling passenger screenings—then
doubling or tripling them again. At some point, the cost will
outweigh the benefit.
Life is inherently risky. Misfortunes and tragedy occur far too
often, and protecting ourselves must be weighed against cost
and convenience. We’ll never achieve a perfect safety record.
Nor will the threat of terrorism disappear. We as Americans
face a future in which we’ll need to be more vigilant, examin-
ing our security systems and behaviors to reduce the risk.
A N N U A L R E P O R T 22 Federal Reserve Bank of Dallas
Vaccines under trial offer promise
of eliminating AIDS and thwarting
bioterror.
8/2/2019 2001 Dallas Federal Reserve Annual Report
http://slidepdf.com/reader/full/2001-dallas-federal-reserve-annual-report 24/51
A N N U A L R E P O R T 23 Federal Reserve Bank of Dallas
A Secure FutureThe U.S. economy is shock-resistant, not shockproof.
Surprise attacks that shut down transportation systems,
frightened consumers and created political uncertainty dealt
an undeniable blow. After September 11, however, our worst
fears never materialized. We avoided the cascade of economic
calamities some had envisioned. Our economy had the
strength and flexibility to prevent a day of infamy from becom-
ing an assault on the majority of Americans’ livelihoods.
Terrorism striking on our own soil may have initially made
the United States appear vulnerable. Our response, with mil-
itary might overseas and economic muscle at home, rein-
forced America’s status as the world’s greatest power.
As a nation, we’ve launched not only a war on terrorism
but also a war to protect our way of life. The tactics and the
battleground differ from those of the past. But the fight does
not. It’s a fight we’d already been winning.
A dozen years ago, what happened on September 11
would have been celebrated in the capitals of the Communist
bloc. Now, these former totalitarian nations want to be like us.
Thirty years ago, American forces retreated from Vietnam,
failing to defeat an enemy on the battlefield. Yet a moderniz-
ing Vietnam now looks forward to forging a future as a capi-
talist country. Sixty years ago, Germany and Japan might have

8/2/2019 2001 Dallas Federal Reserve Annual Report
http://slidepdf.com/reader/full/2001-dallas-federal-reserve-annual-report 25/51
fought on the terrorists’ side to destroy America. Today,
they’ve joined nearly every nation in backing our campaign.
America today has more friends around the world and fewer
enemies. The world marches to the beat of a culture that sets
the pace in music, movies and consumer goods. Around the
globe, nations are trying to emulate our economic and political
systems. The Heritage Foundation’s Index of Economic Free-dom for 2002 shows a high tide for democracy and capitalism.
The terrorist strikes were an attack on our system. The
immediate targets were the World Trade Center, a symbol of
economic power, and the Pentagon, the center of military
strength. The larger goal was to destroy our system of dem-
ocratic capitalism. It won’t succeed. America is too big, its
people too free, its economy too strong and too flexible—in
short, too resilient.
Time and again, America has been tested, either by crises
at home or by enemies overseas. No matter what the chal-
lenge—the Great Depression, the autocratic forces of Ger-
many and Japan in World War II, the communist foes in the
Cold War—we have risen above it.
And we will again.
—W. Michael Cox and Richard Alm
A N N U A L R E P O R T 24 Federal Reserve Bank of Dallas
Exhibit 2 A Broader Economy
BEA.
Exhibit 3 Foreign-Born Population
in the United States
Census Bureau; Historical Statistics. Canada
includes Canada, Bermuda and Northern
America, not elsewhere classified. British Islesincludes England, Scotland, Wales, Great
Britain not elsewhere classified, Northern
Ireland and Ireland. South Eastern Asia data
are estimated.
Exhibit 4 More Population Centers,
Spread Out Nationally
Census Bureau.
Exhibit 5 Our National Infrastructure
Interstate highways: Statistical Abstract
of the United States, 1989, 2000.
Public roads: Federal Highway Administration.
Dams: U.S. Army Corps of Engineers.
Bridges: Federal Highway Administration.
Inland water: Statistical Abstract , 1977,2000.
Airports: Statistical Abstract , 2000;
Bureau of Transportation Statistics.
Fiber-optic cable: “How the Fiber Barons
Plunged the Nation into a Telecom Glut,”
The Wall Street Journal, June 18, 2001.
Utility companies: County Business Patterns,
1970, 1999.
Cellular sites: Cellular Telephone
Industry Association.
Cellular towers: Micrologic Research estimate.
Web sites and hosts: Hobbes’ InternetTime-
line, www.zakon.org/ robert/internet/timeline.
ATM terminals:http://inventors.about.com/
library/inventors/blatm.htm; www.cardforum.
com/ html/news/071700_1.htm.
Petroleum pipeline: Statistical Abstract ,
1972, 2000.
Natural gas pipeline: Department of
Transportation. Earliest data for bridges are
for 1983. A cellular site is a configuration of
antennas that support service; site data are as
of June 30, 2001. Data are the most recent
available and vary from 1998 to 2001.
Capital Stock per Person
BEA; Census Bureau.
Exhibit 6 Knowledge Is Power
High school and college education:
Census Bureau.
Master’s, doctoral and professional degrees:
National Center for Education Statistics.
Home computer and Internet access:
Census Bureau.
Patents: U.S. Patent and Trademark Office.
Median age: Census Bureau. Professional
degrees includes D.D.S or D.M.D, M.D.,
and LL.B. or J.D. degrees. 1950 LL.B. andJ.D. degrees are estimates based on data
trends; 1955 number was 8,209.
Exhibit 7 Military Deaths
Defense Department.
Defense Spending
Historical Statistics; OMB.
Exhibit 8 Economic Downturns
National Bureau of Economic Research.
Data end in March 2001 because of ques-
tions about how to measure the economy’s
performance for the remainder of the year.
Exhibit 9 Deviations from Trend Real
Growth BEA. Deviations are derived by
applying a Hodrick–Prescott filter to the log
of each (inflation-adjusted) series under obser-
vation—structures, goods, services and GDP.
Exhibit 10 Transportation:
Scope and Safety Motor vehicle travel: Historical Statistics;
Federal Highway Administration.
Air travel: Historical Statistics, Air
Transportation Association; Census Bureau.
Exhibit 11 Life Expectancy at Birth
Centers for Disease Control and Prevention
(CDCP); Statistical Abstract , 2000.
Age-Adjusted Death Rates
Historical Statistics; Census Bureau; CDCP.
Deaths Due to Natural Causes CDCP.
Natural Disaster Fatalities per 100,000
People Statistical Abstract , various years;
Historical Statistics.
Deaths from Disease Historical Statistics;
Statistical Abstract , various years; CDCP.
Photo CreditsBoston University, p.12 left;
Douglas E. Houser, U.S. Navy, Defense
Department, p.14 upper right;
Monster.com, p.17 lower left;
Insurance Institute for Highway Safety, p.19;
©2001 Garmin Ltd., p.19 left;
Chuck Zovko, The Morning Call, p.20;
Peter Dodge, NOAA, p.21 left;
McDonald’s Corp., p.24 left;
Randy Montoya, Sandia National
Laboratories,p.5 left, p.6 center,
p.13 lower right, p.15 left.
Acknowledgments“Taking Stock in America” was written by
W. Michael Cox and Richard Alm. The essay
is based on research conducted by Cox,
senior vice president and chief economist,
Federal Reserve Bank of Dallas. Sonja Kelly
provided important research assistance
throughout the course of the project. Also
helping with research were Charlene Howell
and Fanying Kong.
Exhibit Notes and Data Sources
Exhibit 1 Annual GDP, Consumption
and Defense Spending per Capita
GDP: Introduction to Macroeconomics,
Alan C. Stockman (Fort Worth: Dryden Press,
1996); “The Estimation of Prewar Gross
National Product: Methodology and New
Evidence,” Robert J. Gordon and Nathan S.
Balke, Journal of Political Economy, February
1989; Bureau of Economic Analysis (BEA).
Defense: Historical Statistics of the United
States: Colonial Times to 1970, Census
Bureau, 1975; Office of Management and
Budget (OMB); Census Bureau.
Personal Consumption: Historical Statistics;
BEA.
Population: Historical Statistics; Census
Bureau. 1776 GDP was converted from
1994 dollars to 2000 dollars using the chain-
weighted price deflator for GDP. Data before
1929 are GNP; after 1929, data are GDP.
1900–30 defense data are national security
spending as a percentage of GNP, calendar
year basis. 1940– 2000 defense data are on
a fiscal year basis.

8/2/2019 2001 Dallas Federal Reserve Annual Report
http://slidepdf.com/reader/full/2001-dallas-federal-reserve-annual-report 26/51
Recent sources of economic strength—high tech, trade
with Mexico, energy and construction—became sources of
weakness in 2001. The high-tech sector began to slow after
Y2K and started shedding jobs in early 2001. The Mexican
economy contracted, weakening export opportunities for
Texas. The energy industry suffered as prices fell.
The region was hard hit by the economic impact of Sep-tember 11. As the hub for several major airlines, Texas was
particularly exposed to the downturn in the transportation
sector. Tourism contracted. Oil prices shifted down in
response to sharply lower world demand. Increased security
provisions made trade with Mexico more costly by increas-
ing border delays.
As the various props were knocked out from under the
regional economy, measures of aggregate economic activity
soured. By year’s end, the seasonally adjusted Texas unem-
ployment rate had climbed to 5.7 percent, up from 3.7 per-
cent in December 2000. All the jobs gained in the subpar
growth of the first quarter were lost by midyear. December
over December, job losses in the Eleventh District were com-
parable with those in the nation as a whole.
However, despite the downturn, the region’s long-term
advantages remain in place. Diverse industries, central access
to trade corridors, natural resources, affordable housing,
proximity to Mexico, limited government and a favorable
regulatory environment will continue to attract residents and
firms alike. As the nation recovers from recession, the region
should grow in 2002.
Financial ServicesThe Bank’s responsiveness allowed the Dallas Fed to provide
uninterrupted services to customers following September 11.
The Bank rose to the challenge, ensuring delivery of checks,
access to cash and continued support of Fedwire operations.
To overcome the interruption of air service across the
United States, the Dallas Fed immediately secured ground
transportation to deliver checks. In a few cases, when ground
transportation was unavailable, Bank employees used their
own vehicles to ensure delivery.
The Bank experienced a higher than usual number of calls
as customers became increasingly concerned about currency
orders and the availability of armored carriers. Personnel
were on 24-hour call and prepared to fill any emergency
order. In the end, however, the September 11 attacks did not
prompt an unusual increase in demand for cash.
A N N U A L R E P O R T 25 Federal Reserve Bank of Dallas
Had it not been for the
attacks on 9/11, the U.S. and
Eleventh District economies
would likely have avoided
recession. However, the
resiliency we have seen since
the attacks demonstrates
that America's economic
system cannot be derailed
by terrorists.
Harvey Rosenblum
Senior Vice President and
Director of Research,
who was at the World Trade
Center on the morning of
September 11
TheYear in ReviewThe Federal Reserve Bank of Dallas embarked upon the 21st
century with renewed optimism and enthusiasm for the
future of America. Although 2001 brought unprecedented
challenges, the nation’s citizens, institutions and economy
showed remarkable strength and determination in the faceof adversity. The Eleventh Federal Reserve District’s econ-
omy is resilient and rebounding, and its financial institutions
are strong. The Dallas Fed looks forward to a second century
of providing efficient services and ensuring sound banking
principles in a thriving New Economy, while remaining pre-
pared for any challenge.
Economic OverviewTen years of economic expansion came to an end in 2001.
Economic activity in the Eleventh District slowed throughout
2000 and turned negative in spring 2001, dragged down by
the national and Mexican recessions and by the shock of
September 11. However, the region’s diverse economy shows
signs of rebounding in 2002.

8/2/2019 2001 Dallas Federal Reserve Annual Report
http://slidepdf.com/reader/full/2001-dallas-federal-reserve-annual-report 27/51
As a result of disrupted communications, the main clear-
ing bank for securities transfers experienced difficulty send-
ing and receiving wires. Since the Fedwire system is critical
to the liquidity of banks and other institutions, its hours were
extended to meet the industry’s needs.
Dedication to customer service did not begin September
11. It was in place throughout 2001.The Federal Reserve System continued its effort to
streamline the way it processes and delivers check services
to financial institutions. The check modernization initiative
is the largest automation project the System has ever under-
taken. The efforts include a standard check-processing envi-
ronment for all Reserve Banks, an enterprisewide system for
check adjustments, redesign of the current image-process-
ing infrastructure based on a single platform, and remote
electronic access and delivery of check services over the
Internet. As part of the national effort, the Dallas Fed coor-
dinated the development and implementation of a suite of
software programs that allows banks to access check serv-
ices via the Internet.
In addition to checks, the Fed is making the transition to
other web-based services. Using FedLine® for the Web, the
Dallas Fed began offering cash and savings bond ordering to
District banks. Expanded services will be available in 2002.
With FedLine for the Web, products and services will be more
readily available and accessible to customers nationally.
The Dallas Fed provided leadership for the Federal
Reserve System in the implementation of standard software
for cash services. This software will be used by Federal
Reserve Banks across the nation to serve their customers.
The Bank processed record volumes of currency. Receipts
of notes from financial institutions were up 5 percent from
2000, and deliveries rose 12 percent. As a result, the Bank
added currency processing capacity. The Dallas Fed and its
Houston Branch completed auxiliary coin vault areas to store
large volumes of coin.
Additionally, the Bank began serving as the telephone-
based help desk for the U.S. Treasury’s Pay.gov web site,
which allows businesses and individuals to make payments
to federal agencies via the Internet.
The Dallas Fed continued to provide other services to the
Treasury Department. The Bank is one of three Reserve
Banks that administer the TreasuryDirect program, which
allows the public to purchase securities at auction and hold
them directly with the Treasury. The Bank also manages the
Electronic Transfer Account (ETASM) program, which provides
a low-cost bank account for federal payment receipts.
To ensure continued quality service, the Dallas Fed
enhanced communication with customers. For example, the
Bank conducted information sessions for customers on
check modernization initiatives. The Dallas Fed also used
focus groups to better understand how customers use Bank
products and services.
In an ongoing effort to reduce customers’ costs, auto-
mated clearinghouse operations in Dallas were centralized to
the Federal Reserve Bank of Minneapolis. As a result of
restructuring across the Federal Reserve System, the price for
ACH services has been lowered. Dallas Fed food coupon
operations were consolidated to the Federal Reserve Bank of
St. Louis’ Memphis Branch.
Banking Supervision; Discount and CreditSeptember 11, a slowing economy and rapidly declining inter-
est rates created a challenging environment for Eleventh Dis-
trict banks. Yet through it all, they remain financially sound
and well capitalized.
The Dallas Fed’s role as a bank supervisor is to promote a
sound financial system through fair and competent supervi-
sion of state member banks, bank holding companies and
foreign agencies operating within the Eleventh District. The
Bank also fosters consumer confidence in the banking sys-
A N N U A L R E P O R T 26 Federal Reserve Bank of Dallas
During a time of extraordi-
nary national confusion, fear
and financial quandary, our
team held fast, stayed focused
and did what we do best—
serve our country through
our customers.
Bill Morse
Assistant Vice President Cash Department
We did what we had to do to
maintain stability in the
nation’s payments system.
René Gonzales
Vice President
Payments Services
Houston Branch
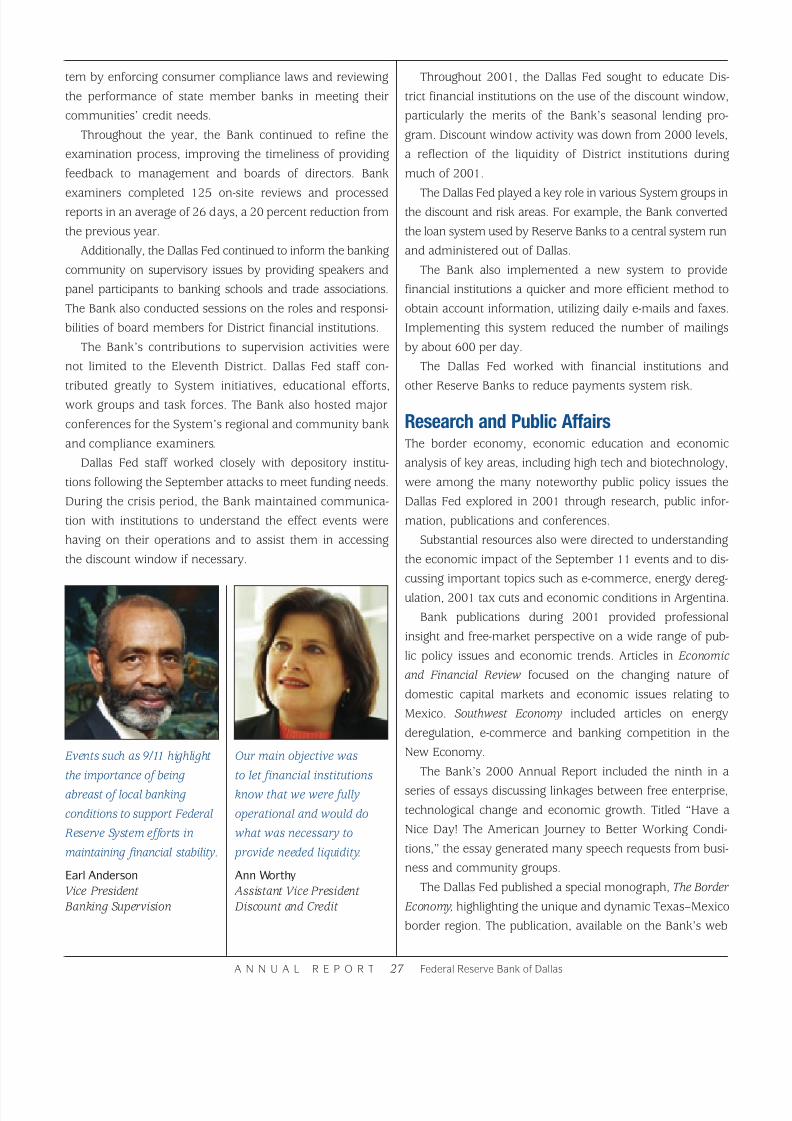
8/2/2019 2001 Dallas Federal Reserve Annual Report
http://slidepdf.com/reader/full/2001-dallas-federal-reserve-annual-report 28/51
tem by enforcing consumer compliance laws and reviewing
the performance of state member banks in meeting their
communities’ credit needs.
Throughout the year, the Bank continued to refine the
examination process, improving the timeliness of providing
feedback to management and boards of directors. Bank
examiners completed 125 on-site reviews and processedreports in an average of 26 days, a 20 percent reduction from
the previous year.
Additionally, the Dallas Fed continued to inform the banking
community on supervisory issues by providing speakers and
panel participants to banking schools and trade associations.
The Bank also conducted sessions on the roles and responsi-
bilities of board members for District financial institutions.
The Bank’s contributions to supervision activities were
not limited to the Eleventh District. Dallas Fed staff con-
tributed greatly to System initiatives, educational efforts,
work groups and task forces. The Bank also hosted major
conferences for the System’s regional and community bank
and compliance examiners.
Dallas Fed staff worked closely with depository institu-
tions following the September attacks to meet funding needs.
During the crisis period, the Bank maintained communica-
tion with institutions to understand the effect events were
having on their operations and to assist them in accessing
the discount window if necessary.
Throughout 2001, the Dallas Fed sought to educate Dis-
trict financial institutions on the use of the discount window,
particularly the merits of the Bank’s seasonal lending pro-
gram. Discount window activity was down from 2000 levels,
a reflection of the liquidity of District institutions during
much of 2001.
The Dallas Fed played a key role in various System groups inthe discount and risk areas. For example, the Bank converted
the loan system used by Reserve Banks to a central system run
and administered out of Dallas.
The Bank also implemented a new system to provide
financial institutions a quicker and more efficient method to
obtain account information, utilizing daily e-mails and faxes.
Implementing this system reduced the number of mailings
by about 600 per day.
The Dallas Fed worked with financial institutions and
other Reserve Banks to reduce payments system risk.
Research and Public AffairsThe border economy, economic education and economic
analysis of key areas, including high tech and biotechnology,
were among the many noteworthy public policy issues the
Dallas Fed explored in 2001 through research, public infor-
mation, publications and conferences.
Substantial resources also were directed to understanding
the economic impact of the September 11 events and to dis-
cussing important topics such as e-commerce, energy dereg-
ulation, 2001 tax cuts and economic conditions in Argentina.
Bank publications during 2001 provided professional
insight and free-market perspective on a wide range of pub-
lic policy issues and economic trends. Articles in Economic
and Financial Review focused on the changing nature of
domestic capital markets and economic issues relating to
Mexico. Southwest Economy included articles on energy
deregulation, e-commerce and banking competition in the
New Economy.
The Bank’s 2000 Annual Report included the ninth in a
series of essays discussing linkages between free enterprise,
technological change and economic growth. Titled “Have a
Nice Day! The American Journey to Better Working Condi-
tions,” the essay generated many speech requests from busi-
ness and community groups.
The Dallas Fed published a special monograph, The Border
Economy, highlighting the unique and dynamic Texas–Mexico
border region. The publication, available on the Bank’s web
A N N U A L R E P O R T 27 Federal Reserve Bank of Dallas
Events such as 9/11 highlight
the importance of being
abreast of local banking
conditions to support Federal
Reserve System efforts in
maintaining financial stability.
Earl Anderson
Vice President
Banking Supervision
Our main objective was
to let financial institutions
know that we were fully
operational and would do
what was necessary to
provide needed liquidity.
Ann Worthy
Assistant Vice President
Discount and Credit
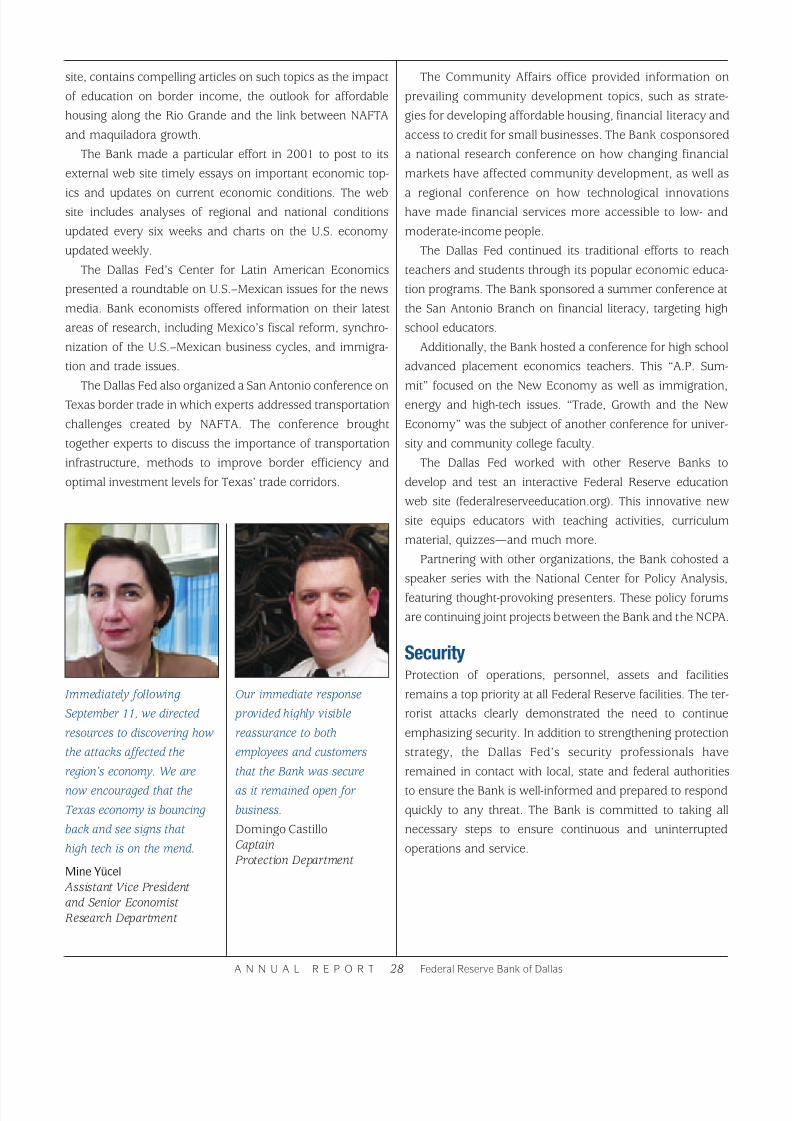
8/2/2019 2001 Dallas Federal Reserve Annual Report
http://slidepdf.com/reader/full/2001-dallas-federal-reserve-annual-report 29/51
site, contains compelling articles on such topics as the impact
of education on border income, the outlook for affordable
housing along the Rio Grande and the link between NAFTA
and maquiladora growth.
The Bank made a particular effort in 2001 to post to its
external web site timely essays on important economic top-
ics and updates on current economic conditions. The website includes analyses of regional and national conditions
updated every six weeks and charts on the U.S. economy
updated weekly.
The Dallas Fed’s Center for Latin American Economics
presented a roundtable on U.S.–Mexican issues for the news
media. Bank economists offered information on their latest
areas of research, including Mexico’s fiscal reform, synchro-
nization of the U.S.–Mexican business cycles, and immigra-
tion and trade issues.
The Dallas Fed also organized a San Antonio conference on
Texas border trade in which experts addressed transportation
challenges created by NAFTA. The conference brought
together experts to discuss the importance of transportation
infrastructure, methods to improve border efficiency and
optimal investment levels for Texas’ trade corridors.
The Community Affairs office provided information on
prevailing community development topics, such as strate-
gies for developing affordable housing, financial literacy and
access to credit for small businesses. The Bank cosponsored
a national research conference on how changing financial
markets have affected community development, as well as
a regional conference on how technological innovationshave made financial services more accessible to low- and
moderate-income people.
The Dallas Fed continued its traditional efforts to reach
teachers and students through its popular economic educa-
tion programs. The Bank sponsored a summer conference at
the San Antonio Branch on financial literacy, targeting high
school educators.
Additionally, the Bank hosted a conference for high school
advanced placement economics teachers. This “A.P. Sum-
mit” focused on the New Economy as well as immigration,
energy and high-tech issues. “Trade, Growth and the New
Economy” was the subject of another conference for univer-
sity and community college faculty.
The Dallas Fed worked with other Reserve Banks to
develop and test an interactive Federal Reserve education
web site (federalreserveeducation.org). This innovative new
site equips educators with teaching activities, curriculum
material, quizzes—and much more.
Partnering with other organizations, the Bank cohosted a
speaker series with the National Center for Policy Analysis,
featuring thought-provoking presenters. These policy forums
are continuing joint projects between the Bank and the NCPA.
SecurityProtection of operations, personnel, assets and facilities
remains a top priority at all Federal Reserve facilities. The ter-
rorist attacks clearly demonstrated the need to continue
emphasizing security. In addition to strengthening protection
strategy, the Dallas Fed’s security professionals have
remained in contact with local, state and federal authorities
to ensure the Bank is well-informed and prepared to respond
quickly to any threat. The Bank is committed to taking all
necessary steps to ensure continuous and uninterrupted
operations and service.
A N N U A L R E P O R T 28 Federal Reserve Bank of Dallas
Our immediate response
provided highly visible
reassurance to both
employees and customers
that the Bank was secure
as it remained open for
business.
Domingo Castillo
Captain
Protection Department
Immediately following
September 11, we directed
resources to discovering how
the attacks affected the
region’s economy. We are
now encouraged that the
Texas economy is bouncing
back and see signs that
high tech is on the mend.
Mine Yücel
Assistant Vice President
and Senior Economist
Research Department
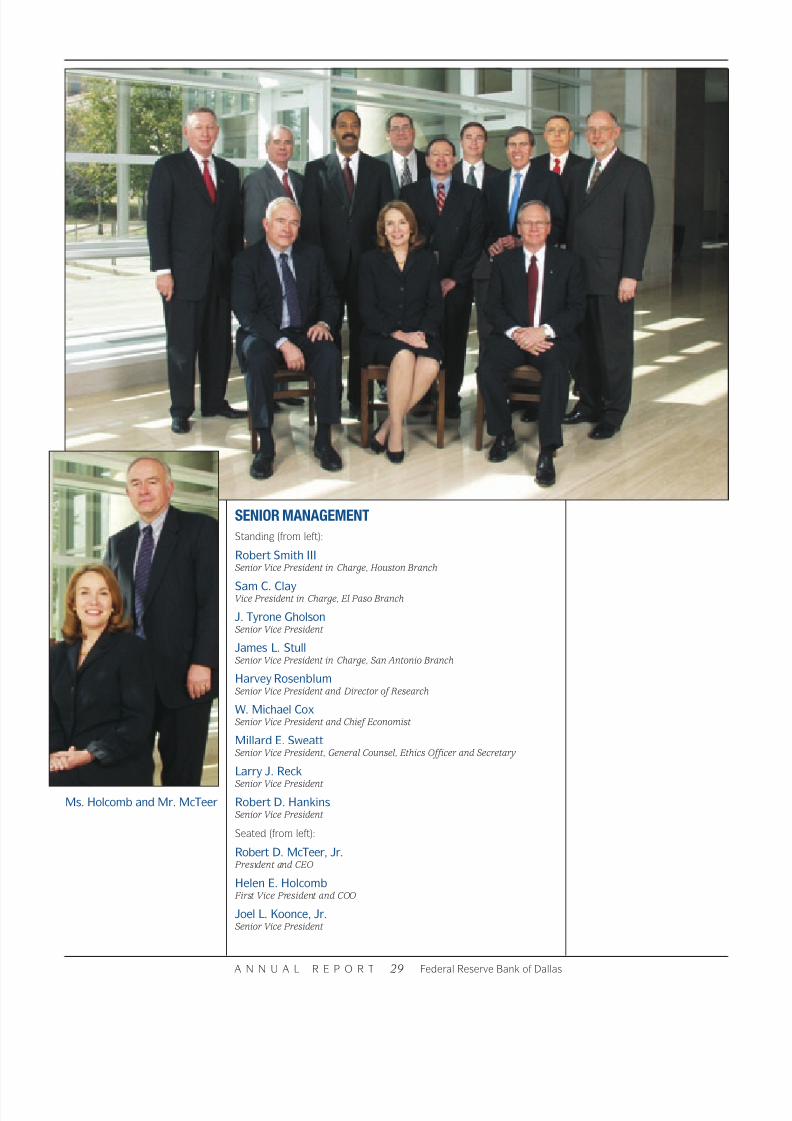
8/2/2019 2001 Dallas Federal Reserve Annual Report
http://slidepdf.com/reader/full/2001-dallas-federal-reserve-annual-report 30/51
A N N U A L R E P O R T 29 Federal Reserve Bank of Dallas
SENIOR MANAGEMENT
Standing (from left):
Robert Smith IIISenior Vice President in Charge, Houston Branch
Sam C. ClayVice President in Charge, El Paso Branch
J. Tyrone GholsonSenior Vice President
James L. StullSenior Vice President in Charge, San Antonio Branch
Harvey RosenblumSenior Vice President and Director of Research
W. Michael CoxSenior Vice President and Chief Economist
Millard E. SweattSenior Vice President, General Counsel, Ethics Officer and Secretary
Larry J. Reck
Senior Vice President
Robert D. HankinsSenior Vice President
Seated (from left):
Robert D. McTeer, Jr. President and CEO
Helen E. Holcomb First Vice President and COO
Joel L. Koonce, Jr.Senior Vice President
Ms. Holcomb and Mr. McTeer
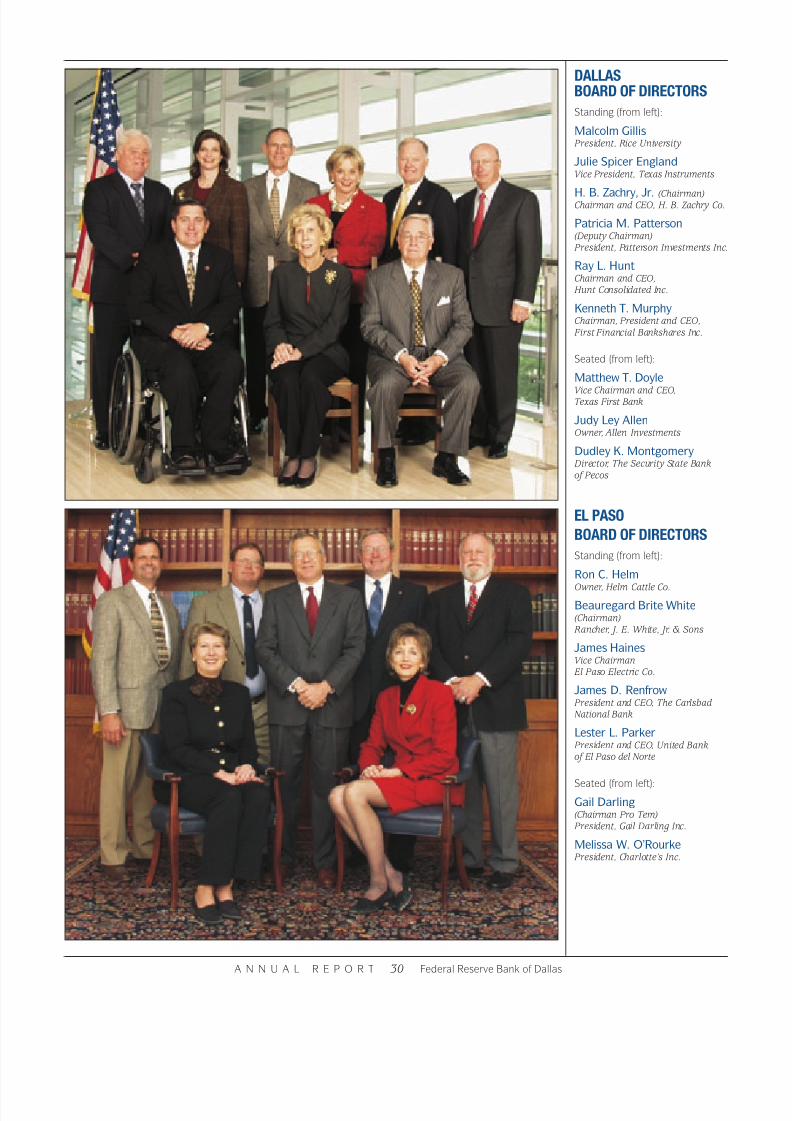
8/2/2019 2001 Dallas Federal Reserve Annual Report
http://slidepdf.com/reader/full/2001-dallas-federal-reserve-annual-report 31/51
DALLAS
BOARD OF DIRECTORS
Standing (from left):
Malcolm Gillis President, Rice University
Julie Spicer EnglandVice President, Texas Instruments
H. B. Zachry, Jr. (Chairman)Chairman and CEO, H. B. Zachry Co.
Patricia M. Patterson(Deputy Chairman) President, Patterson Investments Inc.
Ray L. HuntChairman and CEO, Hunt Consolidated Inc.
Kenneth T. MurphyChairman, President and CEO, First Financial Bankshares Inc.
Seated (from left):
Matthew T. Doyle
Vice Chairman and CEO,Texas First Bank
Judy Ley AllenOwner, Allen Investments
Dudley K. Montgomery Director, The Security State Bankof Pecos
EL PASO
BOARD OF DIRECTORS
Standing (from left):
Ron C. Helm
Owner, Helm Cattle Co.
Beauregard Brite White(Chairman) Rancher, J. E. White, Jr. & Sons
James HainesVice Chairman El Paso Electric Co.
James D. Renfrow President and CEO, The Carlsbad National Bank
Lester L. Parker President and CEO, United Bankof El Paso del Norte
Seated (from left):
Gail Darling(Chairman Pro Tem) President, Gail Darling Inc.
Melissa W. O’Rourke President, Charlotte’s Inc.
A N N U A L R E P O R T 30 Federal Reserve Bank of Dallas
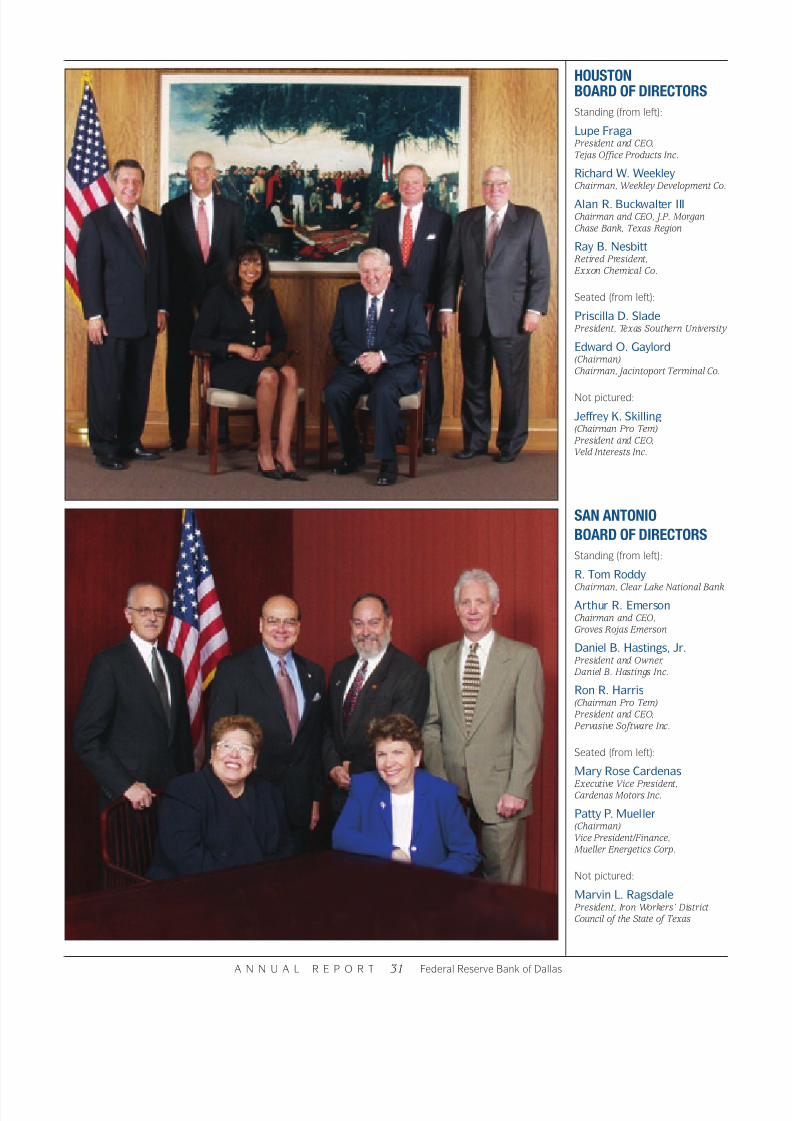
8/2/2019 2001 Dallas Federal Reserve Annual Report
http://slidepdf.com/reader/full/2001-dallas-federal-reserve-annual-report 32/51
HOUSTON
BOARD OF DIRECTORS
Standing (from left):
Lupe Fraga President and CEO,Tejas Office Products Inc.
Richard W. WeekleyChairman, Weekley Development Co.
Alan R. Buckwalter IIIChairman and CEO, J.P. MorganChase Bank, Texas Region
Ray B. Nesbitt Retired President, Exxon Chemical Co.
Seated (from left):
Priscilla D. Slade President, Texas Southern University
Edward O. Gaylord(Chairman)Chairman, Jacintoport Terminal Co.
Not pictured:
Jeffrey K. Skilling(Chairman Pro Tem) President and CEO,Veld Interests Inc.
SAN ANTONIO
BOARD OF DIRECTORS
Standing (from left):
R. Tom Roddy
Chairman, Clear Lake National Bank
Arthur R. EmersonChairman and CEO,Groves Rojas Emerson
Daniel B. Hastings, Jr. President and Owner, Daniel B. Hastings Inc.
Ron R. Harris(Chairman Pro Tem) President and CEO, Pervasive Software Inc.
Seated (from left):
Mary Rose Cardenas
Executive Vice President,Cardenas Motors Inc.
Patty P. Mueller(Chairman)Vice President/Finance,Mueller Energetics Corp.
Not pictured:
Marvin L. Ragsdale President, Iron Workers’ District Council of the State of Texas
A N N U A L R E P O R T 31 Federal Reserve Bank of Dallas

8/2/2019 2001 Dallas Federal Reserve Annual Report
http://slidepdf.com/reader/full/2001-dallas-federal-reserve-annual-report 33/51
OFFICERSFEDERAL RESERVE BANK OF DALLAS
Dallas
Robert D. McTeer, Jr. President and CEO
Helen E. Holcomb First Vice President and COO
W. Michael CoxSenior Vice President and Chief Economist
J. Tyrone GholsonSenior Vice President
Robert D. HankinsSenior Vice President
Joel L. Koonce, Jr.Senior Vice President
Larry J. ReckSenior Vice President
Harvey RosenblumSenior Vice President and Director of Research
Millard E. SweattSenior Vice President,General Counsel, Ethics Officer and Secretary
Earl AndersonVice President
Meredith N. BlackVice President
Gloria V. BrownVice President
Lyne H. Carter
Vice President
John V. DucaVice President and Senior Economist
Billy J. DusekVice President
Robert G. FeilVice President
William C. GrubenVice President and Senior Economist
Evan F. KoenigVice President and Senior Economist
Joanna O. KolsonVice President
Kenneth V. McKeeVice President and General Auditor
Larry M. SnellVice President
W. Arthur TribbleVice President
Stephen P. A. Brown
Assistant Vice President and Senior Economist
Terry B. Campbell Assistant Vice President
KaSandra Goulding Assistant Vice President
Donald L. Jackson Assistant Vice President
Johnny L. Johnson Assistant Vice President
Kathy K. Johnsrud Assistant Vice President
C. LaVor Lym
Assistant Vice President
James R. McCullin Assistant Vice President
William C. Morse, Jr. Assistant Vice President
Dean A. Pankonien Assistant Vice President
John R. Phillips Assistant Vice President
Sharon A. Sweeney Assistant Vice President, Associate General Counseland Associate Secretary
Gayle Teague Assistant Vice President
Michael N. Turner Assistant Vice President
Nancy Vickrey Assistant Vice President
Stephen M. Welch Assistant Vice President
Marion E. White Assistant Vice President
Bob W. Williams Assistant Vice President
E. Ann Worthy
Assistant Vice President
Mark A. Wynne Assistant Vice President
Mine Yücel Assistant Vice President
Jeffery W. Gunther Research Officer
Lawrence E. Hall Director of Security Operations
Diane M. HollowayOperations Officer
Harvey R. Mitchell IIIOperations Officer
Lawrence G. Rex Audit Officer
Victor A. Schreck Automation Officer
El Paso
Sam C. ClayVice President in Charge
J. Eloise Guinn Assistant Vice President
Javier R. Jimenez Assistant Vice President
Houston
Robert Smith IIISenior Vice President in Charge
Robert W. GilmerVice President
René G. GonzalesVice President
Luther E. RichardsVice President
Richard J. Burda Assistant Vice President
Daron D. Peschel Assistant Vice President
Donald N. Bowers IIOperations Officer
San Antonio
James L. StullSenior Vice President in Charge
Taylor H. Barbee Assistant Vice President
D. Karen Diaz Assistant Vice President
Richard A. Gutierrez Assistant Vice President
Effective January 1, 2002
SMALL BUSINESSAND AGRICULTUREADVISORY COUNCIL
Frank M. Aldridge III President and CEOCirca Capital Corp. Dallas
Hattie Hill
Chief Executive Officer Hattie Hill Enterprises Inc. Dallas
Johnny N. CavazosOwnerCavazos Insurance Agency Brownsville, Texas
Paula Lambert Founder and President Mozzarella Co. Dallas
Ray Joe RileyChairman and President Estacado Industries Inc. Dimmitt, Texas
Timothy A. Shell President ExecuTrain of Houston Inc. Houston
Steven R. VandegriftGeneral PartnerTechxas Ventures Austin
FEDERAL ADVISORYCOUNCIL MEMBER
Richard W. Evans, Jr.Chairman and CEO Frost National BankSan Antonio
Effective December 31, 2001
A N N U A L R E P O R T 32 Federal Reserve Bank of Dallas
8/2/2019 2001 Dallas Federal Reserve Annual Report
http://slidepdf.com/reader/full/2001-dallas-federal-reserve-annual-report 34/51
February 14, 2002
To the Board of Directors of the
Federal Reserve Bank of Dallas:
The management of the Federal Reserve Bank of Dallas (FRBD) is responsible for the preparation and
fair presentation of the Statement of Condition, Statement of Income, and Statement of Changes in
Capital as of December 31, 2001 (the “Financial Statements”). The Financial Statements have been pre-
pared in conformity with the accounting principles, policies, and practices established by the Board of
Governors of the Federal Reserve System and as set forth in the Financial Accounting Manual for the
Federal Reserve Banks, and as such, include amounts, some of which are based on judgments and esti-
mates of management.
The management of the FRBD is responsible for maintaining an effective process of internal controls
over financial reporting including the safeguarding of assets as they relate to the Financial Statements.
Such internal controls are designed to provide reasonable assurance to management and to the Board
of Directors regarding the preparation of reliable Financial Statements. This process of internal controls
contains self-monitoring mechanisms, including, but not limited to, divisions of responsibility and a
code of conduct. Once identified, any material deficiencies in the process of internal controls are
reported to management, and appropriate corrective measures are implemented.
Even an effective process of internal controls, no matter how well designed, has inherent limitations,
including the possibility of human error, and therefore can provide only reasonable assurance with
respect to the preparation of reliable Financial Statements.
The management of the FRBD assessed its process of internal controls over financial reporting includ-
ing the safeguarding of assets reflected in the Financial Statements, based upon the criteria established
in the “Internal Control–Integrated Framework” issued by the Committee of Sponsoring Organizations
of the Treadway Commission (COSO). Based on this assessment, the management of the FRBD
believes that the FRBD maintained an effective process of internal controls over financial reporting
including the safeguarding of assets as they relate to the Financial Statements.
President First Vice President
Federal Reserve Bank of Dallas Federal Reserve Bank of Dallas
A N N U A L R E P O R T 33 Federal Reserve Bank of Dallas
8/2/2019 2001 Dallas Federal Reserve Annual Report
http://slidepdf.com/reader/full/2001-dallas-federal-reserve-annual-report 35/51
REPORT OF INDEPENDENT ACCOUNTANTS
To the Board of Directors of the
Federal Reserve Bank of Dallas:
We have examined management’s assertion that the Federal Reserve Bank of Dallas (“FRB Dallas”)
maintained effective internal control over financial reporting and the safeguarding of assets as they
relate to the Financial Statements as of December 31, 2001, included in the accompanying Manage-
ment’s Assertion. The assertion is the responsibility of FRB Dallas management. Our responsibility is
to express an opinion on the assertions based on our examination.
Our examination was made in accordance with standards established by the American Institute of Cer-
tified Public Accountants, and accordingly, included obtaining an understanding of the internal control
over financial reporting, testing, and evaluating the design and operating effectiveness of the internal
control, and such other procedures as we considered necessary in the circumstances. We believe that
our examination provides a reasonable basis for our opinion.
Because of inherent limitations in any internal control, misstatements due to error or fraud may occur
and not be detected. Also, projections of any evaluation of the internal control over financial report-
ing to future periods are subject to the risk that the internal control may become inadequate because
of changes in conditions, or that the degree of compliance with the policies or procedures may dete-
riorate.
In our opinion, management’s assertion that the FRB Dallas maintained effective internal control over
financial reporting and over the safeguarding of assets as they relate to the Financial Statements as of
December 31, 2001, is fairly stated, in all material respects, based upon criteria described in “Internal
Control–Integrated Framework” issued by the Committee of Sponsoring Organizations of the Tread-
way Commission.
March 4, 2002
Dallas, Texas
A N N U A L R E P O R T 34 Federal Reserve Bank of Dallas

8/2/2019 2001 Dallas Federal Reserve Annual Report
http://slidepdf.com/reader/full/2001-dallas-federal-reserve-annual-report 36/51
REPORT OF INDEPENDENT ACCOUNTANTS
To the Board of Governors of the Federal Reserve System
and the Board of Directors of the Federal Reserve Bank of Dallas:
We have audited the accompanying statements of condition of the Federal Reserve Bank of Dallas
(the “Bank”) as of December 31, 2001 and 2000, and the related statements of income and changes
in capital for the years then ended. These financial statements are the responsibility of the Bank’s
management. Our responsibility is to express an opinion on these financial statements based on
our audits.
We conducted our audits in accordance with auditing standards generally accepted in the United States
of America. Those standards require that we plan and perform the audits to obtain reasonable assur-
ance about whether the financial statements are free of material misstatement. An audit includes exam-
ining, on a test basis, evidence supporting the amounts and disclosures in the financial statements. An
audit also includes assessing the accounting principles used and significant estimates made by man-
agement, as well as evaluating the overall financial statement presentation. We believe that our audits
provide a reasonable basis for our opinion.
As discussed in Note 3, the financial statements were prepared in conformity with the accounting prin-
ciples, policies, and practices established by the Board of Governors of the Federal Reserve System.
These principles, policies, and practices, which were designed to meet the specialized accounting and
reporting needs of the Federal Reserve System, are set forth in the “Financial Accounting Manual for
Federal Reserve Banks” and constitute a comprehensive basis of accounting other than accounting prin-
ciples generally accepted in the United States of America.
In our opinion, the financial statements referred to above present fairly, in all material respects, the
financial position of the Bank as of December 31, 2001 and 2000, and results of its operations for the
years then ended, on the basis of accounting described in Note 3.
March 4, 2002
Dallas, Texas
A N N U A L R E P O R T 35 Federal Reserve Bank of Dallas

8/2/2019 2001 Dallas Federal Reserve Annual Report
http://slidepdf.com/reader/full/2001-dallas-federal-reserve-annual-report 37/51
Statements of Condition (in millions)
December 31, 2001 December 31, 2000
ASSETS
Gold certificates $ 477 $ 514
Special drawing rights certificates 98 98
Coin 128 91
Items in process of collection 202 334
Loans to depository institutions — 4
U.S. government and federal agency securities, net 10,183 15,341
Investments denominated in foreign currencies 398 513
Accrued interest receivable 103 179
Interdistrict settlement account 4,041 —
Bank premises and equipment, net 164 168
Other assets 49 48___________ ___________
Total assets $ 15,843 $ 17,290___________ ______________________ ___________
LIABILITIES AND CAPITAL
Liabilities
Federal Reserve notes outstanding, net $ 14,378 $ 9,754
Deposits:
Depository institutions 695 939
Other deposits 3 3
Deferred credit items 350 298
Interest on Federal Reserve notes due U.S. Treasury 29 30
Interdistrict settlement account — 5,829
Accrued benefit costs 54 53
Other liabilities 6 8___________ ___________
Total liabilities $ 15,515 $ 16,914___________ ___________
Capital
Capital paid-in 164 188
Surplus 164 188___________ ___________
Total capital $ 328 $ 376___________ ___________
Total liabilities and capital $ 15,843 $ 17,290___________ ______________________ ___________
The accompanying notes are an integral part
of these financial statements.
A N N U A L R E P O R T 36 Federal Reserve Bank of Dallas
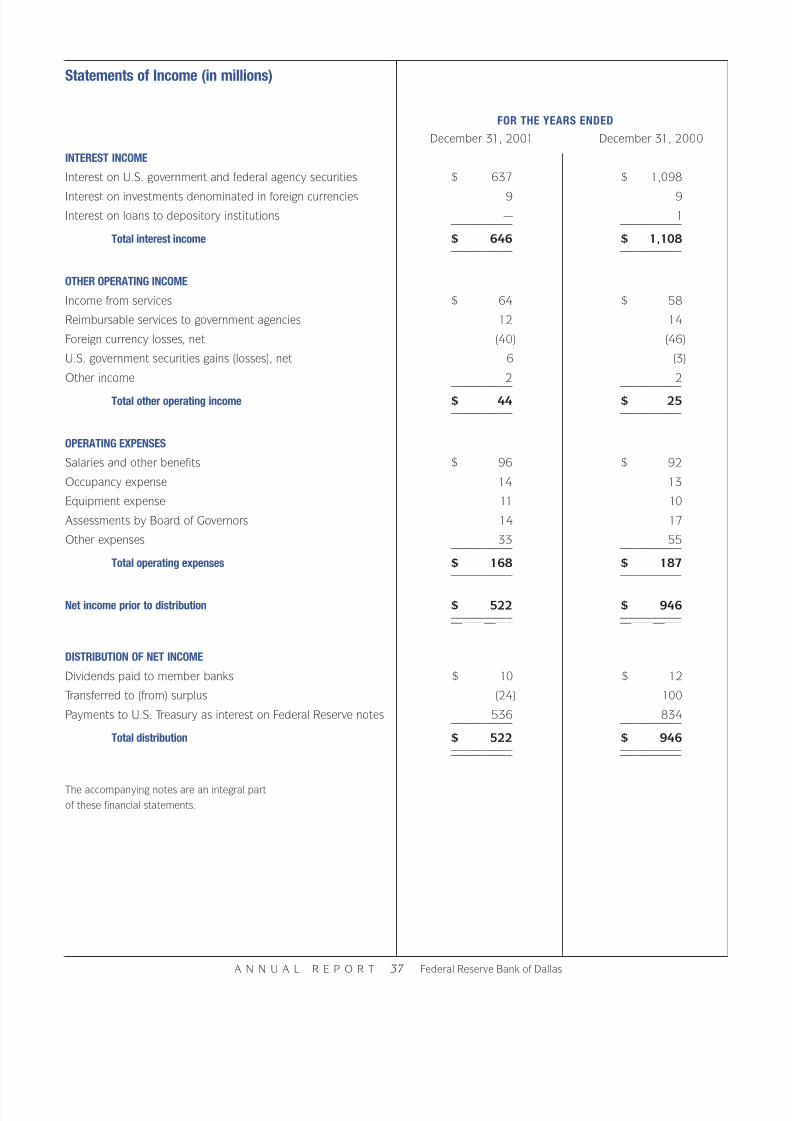
8/2/2019 2001 Dallas Federal Reserve Annual Report
http://slidepdf.com/reader/full/2001-dallas-federal-reserve-annual-report 38/51
Statements of Income (in millions)
FOR THE YEARS ENDED
December 31, 2001 December 31, 2000
INTEREST INCOME
Interest on U.S. government and federal agency securities $ 637 $ 1,098
Interest on investments denominated in foreign currencies 9 9
Interest on loans to depository institutions — 1___________ ___________
Total interest income $ 646 $ 1,108___________ ___________
OTHER OPERATING INCOME
Income from services $ 64 $ 58
Reimbursable services to government agencies 12 14
Foreign currency losses, net (40) (46)
U.S. government securities gains (losses), net 6 (3)
Other income 2 2___________ ___________
Total other operating income $ 44 $ 25___________ ___________
OPERATING EXPENSES
Salaries and other benefits $ 96 $ 92
Occupancy expense 14 13
Equipment expense 11 10
Assessments by Board of Governors 14 17
Other expenses 33 55___________ ___________
Total operating expenses $ 168 $ 187___________ ___________
Net income prior to distribution $ 522 $ 946___________ ______________________ ___________
DISTRIBUTION OF NET INCOME
Dividends paid to member banks $ 10 $ 12
Transferred to (from) surplus (24) 100
Payments to U.S. Treasury as interest on Federal Reserve notes 536 834___________ ___________
Total distribution $ 522 $ 946___________ ______________________ ___________
The accompanying notes are an integral part
of these financial statements.
A N N U A L R E P O R T 37 Federal Reserve Bank of Dallas
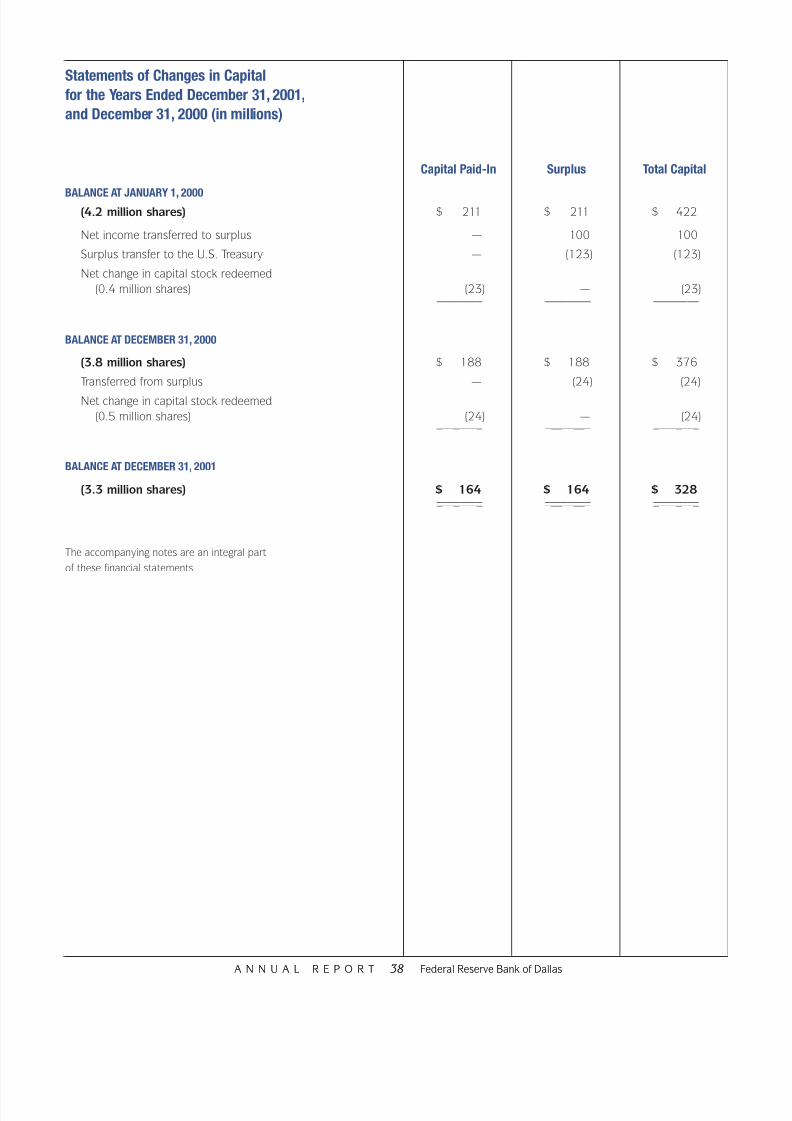
8/2/2019 2001 Dallas Federal Reserve Annual Report
http://slidepdf.com/reader/full/2001-dallas-federal-reserve-annual-report 39/51
A N N U A L R E P O R T 38 Federal Reserve Bank of Dallas
Statements of Changes in Capital
for the Years Ended December 31, 2001,
and December 31, 2000 (in millions)
Capital Paid-In Surplus Total Capital
BALANCE AT JANUARY 1, 2000(4.2 million shares) $ 211 $ 211 $ 422
Net income transferred to surplus — 100 100
Surplus transfer to the U.S. Treasury — (123) (123)
Net change in capital stock redeemed
(0.4 million shares) (23) — (23)________ ________ ________
BALANCE AT DECEMBER 31, 2000
(3.8 million shares) $ 188 $ 188 $ 376
Transferred from surplus — (24) (24)
Net change in capital stock redeemed
(0.5 million shares) (24) — (24)________ ________ ________
BALANCE AT DECEMBER 31, 2001
(3.3 million shares) $ 164 $ 164 $ 328________ ________ ________________ ________ ________
The accompanying notes are an integral part
of these financial statements.
A N N U A L R E P O R T 38 Federal Reserve Bank of Dallas
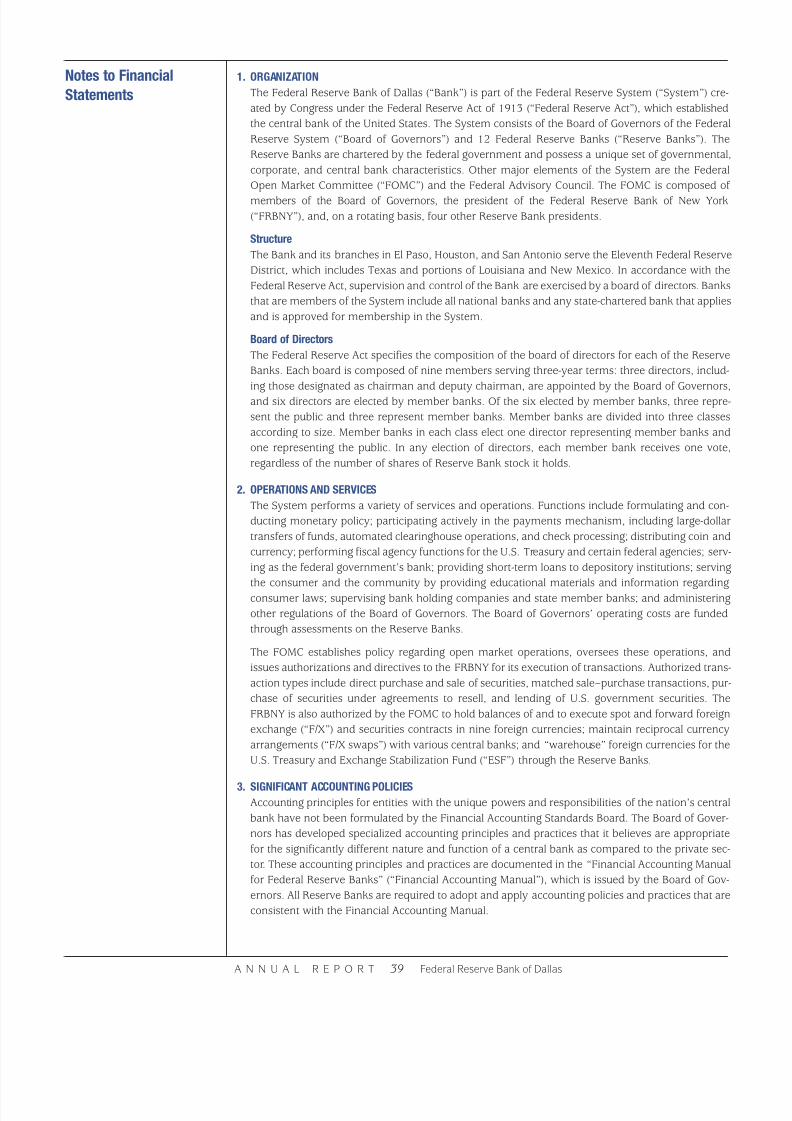
8/2/2019 2001 Dallas Federal Reserve Annual Report
http://slidepdf.com/reader/full/2001-dallas-federal-reserve-annual-report 40/51
Notes to Financial
Statements
1. ORGANIZATION
The Federal Reserve Bank of Dallas (“Bank”) is part of the Federal Reserve System (“System”) cre-
ated by Congress under the Federal Reserve Act of 1913 (“Federal Reserve Act”), which established
the central bank of the United States. The System consists of the Board of Governors of the Federal
Reserve System (“Board of Governors”) and 12 Federal Reserve Banks (“Reserve Banks”). The
Reserve Banks are chartered by the federal government and possess a unique set of governmental,
corporate, and central bank characteristics. Other major elements of the System are the Federal
Open Market Committee (“FOMC”) and the Federal Advisory Council. The FOMC is composed of
members of the Board of Governors, the president of the Federal Reserve Bank of New York
(“FRBNY”), and, on a rotating basis, four other Reserve Bank presidents.
Structure
The Bank and its branches in El Paso, Houston, and San Antonio serve the Eleventh Federal Reserve
District, which includes Texas and portions of Louisiana and New Mexico. In accordance with the
Federal Reserve Act, supervision and control of the Bank are exercised by a board of directors. Banks
that are members of the System include all national banks and any state-chartered bank that applies
and is approved for membership in the System.
Board of Directors
The Federal Reserve Act specifies the composition of the board of directors for each of the Reserve
Banks. Each board is composed of nine members serving three-year terms: three directors, includ-
ing those designated as chairman and deputy chairman, are appointed by the Board of Governors,
and six directors are elected by member banks. Of the six elected by member banks, three repre-
sent the public and three represent member banks. Member banks are divided into three classes
according to size. Member banks in each class elect one director representing member banks and
one representing the public. In any election of directors, each member bank receives one vote,
regardless of the number of shares of Reserve Bank stock it holds.
2. OPERATIONS AND SERVICES
The System performs a variety of services and operations. Functions include formulating and con-
ducting monetary policy; participating actively in the payments mechanism, including large-dollar
transfers of funds, automated clearinghouse operations, and check processing; distributing coin and
currency; performing fiscal agency functions for the U.S. Treasury and certain federal agencies; serv-
ing as the federal government’s bank; providing short-term loans to depository institutions; serving
the consumer and the community by providing educational materials and information regarding
consumer laws; supervising bank holding companies and state member banks; and administering
other regulations of the Board of Governors. The Board of Governors’ operating costs are funded
through assessments on the Reserve Banks.
The FOMC establishes policy regarding open market operations, oversees these operations, and
issues authorizations and directives to the FRBNY for its execution of transactions. Authorized trans-
action types include direct purchase and sale of securities, matched sale–purchase transactions, pur-
chase of securities under agreements to resell, and lending of U.S. government securities. The
FRBNY is also authorized by the FOMC to hold balances of and to execute spot and forward foreign
exchange (“F/X”) and securities contracts in nine foreign currencies; maintain reciprocal currency
arrangements (“F/X swaps”) with various central banks; and “warehouse” foreign currencies for the
U.S. Treasury and Exchange Stabilization Fund (“ESF”) through the Reserve Banks.
3. SIGNIFICANT ACCOUNTING POLICIESAccounting principles for entities with the unique powers and responsibilities of the nation’s central
bank have not been formulated by the Financial Accounting Standards Board. The Board of Gover-
nors has developed specialized accounting principles and practices that it believes are appropriate
for the significantly different nature and function of a central bank as compared to the private sec-
tor. These accounting principles and practices are documented in the “Financial Accounting Manual
for Federal Reserve Banks” (“Financial Accounting Manual”), which is issued by the Board of Gov-
ernors. All Reserve Banks are required to adopt and apply accounting policies and practices that are
consistent with the Financial Accounting Manual.
A N N U A L R E P O R T 39 Federal Reserve Bank of Dallas

8/2/2019 2001 Dallas Federal Reserve Annual Report
http://slidepdf.com/reader/full/2001-dallas-federal-reserve-annual-report 41/51

8/2/2019 2001 Dallas Federal Reserve Annual Report
http://slidepdf.com/reader/full/2001-dallas-federal-reserve-annual-report 42/51
c. Loans to Depository Institutions
The Depository Institutions Deregulation and Monetary Control Act of 1980 provides that all depos-
itory institutions that maintain reservable transaction accounts or nonpersonal time deposits, as
defined in Regulation D issued by the Board of Governors, have borrowing privileges at the discre-
tion of the Reserve Banks. Borrowers execute certain lending agreements and deposit sufficient col-
lateral before credit is extended. Loans are evaluated for collectibility, and currently all are consid-
ered collectible and fully collateralized. If any loans were deemed to be uncollectible, an appropri-
ate reserve would be established. Interest is accrued using the applicable discount rate established
at least every 14 days by the boards of directors of the Reserve Banks, subject to review by the Board
of Governors. Reserve Banks retain the option to impose a surcharge above the basic rate in certain
circumstances.
d. U.S. Government and Federal Agency Securities and Investments Denominated in Foreign Currencies
The FOMC has designated the FRBNY to execute open market transactions on its behalf and to hold
the resulting securities in the portfolio known as the System Open Market Account (“SOMA”). In
addition to authorizing and directing operations in the domestic securities market, the FOMC
authorizes and directs the FRBNY to execute operations in foreign markets for major currencies in
order to counter disorderly conditions in exchange markets or to meet other needs specified by the
FOMC in carrying out the System’s central bank responsibilities. Such authorizations are reviewed
and approved annually by the FOMC.
Matched sale–purchase transactions are accounted for as separate sale and purchase transactions.
Matched sale–purchase transactions are transactions in which the FRBNY sells a security and buys
it back at the rate specified at the commencement of the transaction.
The FRBNY has sole authorization by the FOMC to lend U.S. government securities held in the
SOMA to U.S. government securities dealers and to banks participating in U.S. government securi-
ties clearing arrangements on behalf of the System, in order to facilitate the effective functioning of
the domestic securities market. These securities-lending transactions are fully collateralized by
other U.S. government securities. FOMC policy requires FRBNY to take possession of collateral in
excess of the market values of the securities loaned. The market values of the collateral and the secu-
rities loaned are monitored by FRBNY on a daily basis, with additional collateral obtained as neces-
sary. The securities loaned continue to be accounted for in the SOMA.
Foreign exchange contracts are contractual agreements between two parties to exchange specified
currencies, at a specified price, on a specified date. Spot foreign contracts normally settle two daysafter the trade date, whereas the settlement date on forward contracts is negotiated between the
contracting parties, but will extend beyond two days from the trade date. The FRBNY generally
enters into spot contracts, with any forward contracts generally limited to the second leg of a
swap/warehousing transaction.
The FRBNY, on behalf of the Reserve Banks, maintains renewable, short-term F/X swap arrange-
ments with two authorized foreign central banks. The parties agree to exchange their currencies up
to a prearranged maximum amount and for an agreed-upon period of time (up to 12 months) at an
agreed-upon interest rate. These arrangements give the FOMC temporary access to foreign curren-
cies that it may need for intervention operations to support the dollar and give the partner foreign
central bank temporary access to dollars it may need to support its own currency. Drawings under
the F/X swap arrangements can be initiated by either the FRBNY or the partner foreign central bank,
and must be agreed to by the drawee. The F/X swaps are structured so that the party initiating thetransaction (the drawer) bears the exchange rate risk upon maturity. The FRBNY will generally invest
the foreign currency received under an F/X swap in interest-bearing instruments.
Warehousing is an arrangement under which the FOMC agrees to exchange, at the request of the
Treasury, U.S. dollars for foreign currencies held by the Treasury or ESF over a limited period of time.
The purpose of the warehousing facility is to supplement the U.S. dollar resources of the Treasury
and ESF for financing purchases of foreign currencies and related international operations.
In connection with its foreign currency activities, the FRBNY, on behalf of the Reserve Banks, may
enter into contracts that contain varying degrees of off-balance-sheet market risk, because they rep-
A N N U A L R E P O R T 41 Federal Reserve Bank of Dallas

8/2/2019 2001 Dallas Federal Reserve Annual Report
http://slidepdf.com/reader/full/2001-dallas-federal-reserve-annual-report 43/51
resent contractual commitments involving future settlement and counterparty credit risk. The
FRBNY controls credit risk by obtaining credit approvals, establishing transaction limits, and per-
forming daily monitoring procedures.
While the application of current market prices to the securities currently held in the SOMA portfolio
and investments denominated in foreign currencies may result in values substantially above or
below their carrying values, these unrealized changes in value would have no direct effect on the
quantity of reserves available to the banking system or on the prospects for future Reserve Bank
earnings or capital. Both the domestic and foreign components of the SOMA portfolio from time totime involve transactions that can result in gains or losses when holdings are sold prior to maturity.
However, decisions regarding the securities and foreign currencies transactions, including their pur-
chase and sale, are motivated by monetary policy objectives rather than profit. Accordingly, earn-
ings and any gains or losses resulting from the sale of such currencies and securities are incidental
to the open market operations and do not motivate its activities or policy decisions.
U.S. government and federal agency securities and investments denominated in foreign currencies
comprising the SOMA are recorded at cost, on a settlement-date basis, and adjusted for amortiza-
tion of premiums or accretion of discounts on a straight-line basis. Interest income is accrued on a
straight-line basis and is reported as “Interest on U.S. government and federal agency securities” or
“Interest on investments denominated in foreign currencies,” as appropriate. Income earned on
securities-lending transactions is reported as a component of “Other income.” Gains and losses
resulting from sales of securities are determined by specific issues based on average cost. Gains and
losses on the sales of U.S. government and federal agency securities are reported as “U.S. govern-
ment securities gains (losses), net.” Foreign currency-denominated assets are revalued daily at cur-
rent market exchange rates in order to report these assets in U.S. dollars. Realized and unrealized
gains and losses on investments denominated in foreign currencies are reported as “Foreign cur-
rency losses, net.” Foreign currencies held through F/X swaps, when initiated by the counterparty,
and warehousing arrangements are revalued daily, with the unrealized gain or loss reported by the
FRBNY as a component of “Other assets” or “Other liabilities,” as appropriate.
Balances of U.S. government and federal agency securities bought outright, securities loaned, invest-
ments denominated in foreign currency, interest income, securities lending fee income, amortiza-
tion of premiums and discounts on securities bought outright, gains and losses on sales of securi-
ties, and realized and unrealized gains and losses on investments denominated in foreign curren-
cies, excluding those held under an F/X swap arrangement, are allocated to each Reserve Bank.
Income from securities lending transactions undertaken by the FRBNY are also allocated to each
Reserve Bank. Securities purchased under agreements to resell and unrealized gains and losses on
the revaluation of foreign currency holdings under F/X swaps and warehousing arrangements are
allocated to the FRBNY and not to other Reserve Banks.
Statement of Financial Accounting Standards No. 133, as amended and interpreted, became effec-
tive on January 1, 2001. For the periods presented, the Reserve Banks had no derivative instruments
required to be accounted for under the Standard.
e. Bank Premises and Equipment
Bank premises and equipment are stated at cost less accumulated depreciation. Depreciation is cal-
culated on a straight-line basis over estimated useful lives of assets ranging from 2 to 50 years. New
assets, major alterations, renovations, and improvements are capitalized at cost as additions to the
asset accounts. Maintenance, repairs, and minor replacements are charged to operations in the yearincurred. Internally developed software is capitalized based on the cost of direct materials and serv-
ices and those indirect costs associated with developing, implementing, or testing software.
f. Interdistrict Settlement Account
At the close of business each day, all Reserve Banks and branches assemble the payments due to or
from other Reserve Banks and branches as a result of transactions involving accounts residing in
other Districts that occurred during the day’s operations. Such transactions may include funds set-
tlement, check clearing and automated clearinghouse operations, and allocations of shared
expenses. The cumulative net amount due to or from other Reserve Banks is reported as the “Inter-
district settlement account.”
A N N U A L R E P O R T 42 Federal Reserve Bank of Dallas

8/2/2019 2001 Dallas Federal Reserve Annual Report
http://slidepdf.com/reader/full/2001-dallas-federal-reserve-annual-report 44/51
g. Federal Reserve Notes
Federal Reserve notes are the circulating currency of the United States. These notes are issued
through the various Federal Reserve agents to the Reserve Banks upon deposit with such agents of
certain classes of collateral security, typically U.S. government securities. These notes are identified
as issued to a specific Reserve Bank. The Federal Reserve Act provides that the collateral security
tendered by the Reserve Bank to the Federal Reserve agent must be equal to the sum of the notes
applied for by such Reserve Bank. In accordance with the Federal Reserve Act, gold certificates, spe-
cial drawing rights certificates, U.S. government and federal agency securities, tri-party agreements,
loans to depository institutions, and investments denominated in foreign currencies are pledged as
collateral for net Federal Reserve notes outstanding. The collateral value is equal to the book value
of the collateral tendered, with the exception of securities, whose collateral value is equal to the par
value of the securities tendered. The Board of Governors may, at any time, call upon a Reserve Bank
for additional security to adequately collateralize the Federal Reserve notes. The Reserve Banks have
entered into an agreement that provides for certain assets of the Reserve Banks to be jointly pledged
as collateral for the Federal Reserve notes of all Reserve Banks in order to satisfy their obligation of
providing sufficent collateral for outstanding Federal Reserve notes. In the event that this collateral
is insufficient, the Federal Reserve Act provides that Federal Reserve notes become a first and para-
mount lien on all the assets of the Reserve Banks. Finally, as obligations of the United States, Fed-
eral Reserve notes are backed by the full faith and credit of the U.S. government.
The “Federal Reserve notes outstanding, net” account represents Federal Reserve notes reduced by
currency held in the vaults of the Bank of $19,062 million and $22,713 million at December 31,2001, and December 31, 2000, respectively.
h. Capital Paid-in
The Federal Reserve Act requires that each member bank subscribe to the capital stock of the
Reserve Bank in an amount equal to 6 percent of the capital and surplus of the member bank. As a
member bank’s capital and surplus change, its holdings of the Reserve Bank’s stock must be
adjusted. Member banks are those state-chartered banks that apply and are approved for member-
ship in the System and all national banks. Currently, only one-half of the subscription is paid-in, and
the remainder is subject to call. These shares are nonvoting with a par value of $100. They may not
be transferred or hypothecated. By law, each member bank is entitled to receive an annual dividend
of 6 percent on the paid-in capital stock. This cumulative dividend is paid semiannually. A member
bank is liable for Reserve Bank liabilities up to twice the par value of stock subscribed by it.
i. Surplus
The Board of Governors requires Reserve Banks to maintain a surplus equal to the amount of capi-
tal paid-in as of December 31. This amount is intended to provide additional capital and reduce the
possibility that the Reserve Banks would be required to call on member banks for additional capi-
tal. Reserve Banks are required by the Board of Governors to transfer to the U.S. Treasury excess
earnings, after providing for the costs of operations, payment of dividends, and reservation of an
amount necessary to equate surplus with capital paid-in.
The Consolidated Appropriations Act of 2000 (Public Law 106-113, Section 302) directed the Reserve
Banks to transfer to the U.S. Treasury additional surplus funds of $3,752 million during the federal gov-
ernment’s 2000 fiscal year. The Federal Reserve Bank of Dallas transferred $123 million to the U.S. Trea-
sury. Reserve Banks were not permitted to replenish surplus for these amounts during fiscal year 2000,
which ended September 30, 2000; however, the surplus was replenished by December 31, 2000.
In the event of losses or a substantial increase in capital, payments to the U.S. Treasury are sus-
pended until such losses are recovered through subsequent earnings. Weekly payments to the U.S.
Treasury may vary significantly.
j. Income and Costs Related to Treasury Services
The Bank is required by the Federal Reserve Act to serve as fiscal agent and depository of the United
States. By statute, the Department of the Treasury is permitted, but not required, to pay for these
services. The costs of providing fiscal agency and depository services to the Treasury Department
that have been billed but not paid are immaterial and included in “Other expenses.”
A N N U A L R E P O R T 43 Federal Reserve Bank of Dallas
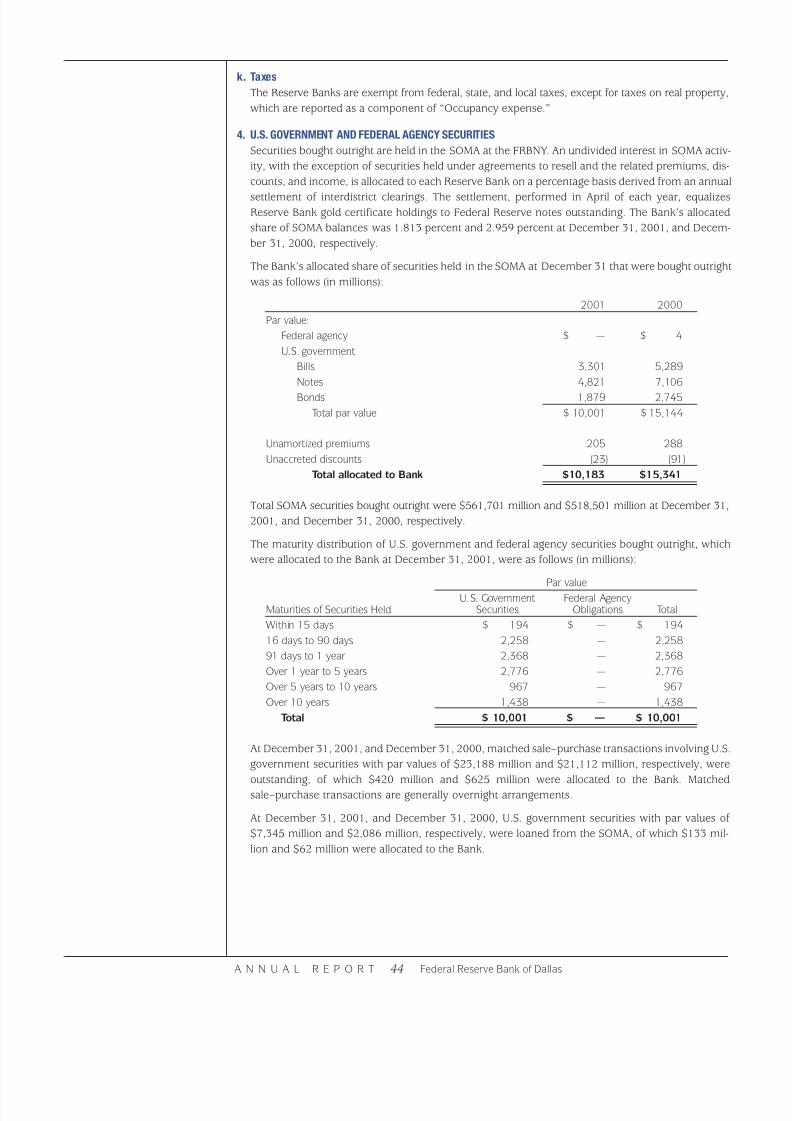
8/2/2019 2001 Dallas Federal Reserve Annual Report
http://slidepdf.com/reader/full/2001-dallas-federal-reserve-annual-report 45/51
k. Taxes
The Reserve Banks are exempt from federal, state, and local taxes, except for taxes on real property,
which are reported as a component of “Occupancy expense.”
4. U.S. GOVERNMENT AND FEDERAL AGENCY SECURITIES
Securities bought outright are held in the SOMA at the FRBNY. An undivided interest in SOMA activ-
ity, with the exception of securities held under agreements to resell and the related premiums, dis-
counts, and income, is allocated to each Reserve Bank on a percentage basis derived from an annual
settlement of interdistrict clearings. The settlement, performed in April of each year, equalizesReserve Bank gold certificate holdings to Federal Reserve notes outstanding. The Bank’s allocated
share of SOMA balances was 1.813 percent and 2.959 percent at December 31, 2001, and Decem-
ber 31, 2000, respectively.
The Bank’s allocated share of securities held in the SOMA at December 31 that were bought outright
was as follows (in millions):
2001 2000
Par value:
Federal agency $ — $ 4
U.S. government
Bills 3,301 5,289
Notes 4,821 7,106
Bonds 1,879 2,745
Total par value $ 10,001 $ 15,144
Unamortized premiums 205 288
Unaccreted discounts (23) (91)
Total allocated to Bank $10,183 $15,341
Total SOMA securities bought outright were $561,701 million and $518,501 million at December 31,
2001, and December 31, 2000, respectively.
The maturity distribution of U.S. government and federal agency securities bought outright, which
were allocated to the Bank at December 31, 2001, were as follows (in millions):
Par value
U.S. Government Federal AgencyMaturities of Securities Held Securities Obligations Total
Within 15 days $ 194 $ — $ 194
16 days to 90 days 2,258 — 2,258
91 days to 1 year 2,368 — 2,368
Over 1 year to 5 years 2,776 — 2,776
Over 5 years to 10 years 967 — 967
Over 10 years 1,438 — 1,438
Total $ 10,001 $ — $ 10,001
At December 31, 2001, and December 31, 2000, matched sale–purchase transactions involving U.S.
government securities with par values of $23,188 million and $21,112 million, respectively, were
outstanding, of which $420 million and $625 million were allocated to the Bank. Matchedsale–purchase transactions are generally overnight arrangements.
At December 31, 2001, and December 31, 2000, U.S. government securities with par values of
$7,345 million and $2,086 million, respectively, were loaned from the SOMA, of which $133 mil-
lion and $62 million were allocated to the Bank.
A N N U A L R E P O R T 44 Federal Reserve Bank of Dallas

8/2/2019 2001 Dallas Federal Reserve Annual Report
http://slidepdf.com/reader/full/2001-dallas-federal-reserve-annual-report 46/51
5. INVESTMENTS DENOMINATED IN FOREIGN CURRENCIES
The FRBNY, on behalf of the Reserve Banks, holds foreign currency deposits with foreign central
banks and the Bank for International Settlements and invests in foreign government debt instru-
ments. Foreign government debt instruments held include both securities bought outright and secu-
rities held under agreements to resell. These investments are guaranteed as to principal and inter-
est by the foreign governments.
Each Reserve Bank is allocated a share of foreign currency-denominated assets, the related interest
income, and realized and unrealized foreign currency gains and losses, with the exception of unreal-ized gains and losses on F/X swaps and warehousing transactions. This allocation is based on the ratio
of each Reserve Bank’s capital and surplus to aggregate capital and surplus at the preceding Decem-
ber 31. The Bank’s allocated share of investments denominated in foreign currencies was approxi-
mately 2.731 percent and 3.275 percent at December 31, 2001, and December 31, 2000, respectively.
The Bank’s allocated share of investments denominated in foreign currencies, valued at current
exchange rates at December 31, was as follows (in millions):
2001 2000
European Union euro:
Foreign currency deposits $125 $152
Government debt instruments including agreements to resell 74 89
Japanese yen:
Foreign currency deposits 52 90Government debt instruments including agreements to resell 145 180
Accrued interest 2 2
Total $398 $513
Total investments denominated in foreign currencies were $14,559 million and $15,670 million at
December 31, 2001, and December 31, 2000, respectively.
The maturity distribution of investments denominated in foreign currencies that were allocated to
the Bank at December 31, 2001, were as follows (in millions):
Maturities of Investments Denominated in Foreign Currencies
Within 1 year $ 375
Over 1 year to 5 years 11Over 5 years to 10 years 12
Over 10 years —
Total $ 398
At December 31, 2001, and December 31, 2000, there were no open foreign exchange contracts or
outstanding F/X swaps.
At December 31, 2001, and December 31, 2000, the warehousing facility was $5 billion, with zero
outstanding.
6. BANK PREMISES AND EQUIPMENT
A summary of bank premises and equipment at December 31 is as follows (in millions):
2001 2000Bank premises and equipment:
Land $ 30 $ 30
Buildings 115 114
Building machinery and equipment 24 24
Construction in progress 3 —
Furniture and equipment 76 79
248 247
Accumulated depreciation (84) (79)
Bank premises and equipment, net $164 $168
A N N U A L R E P O R T 45 Federal Reserve Bank of Dallas
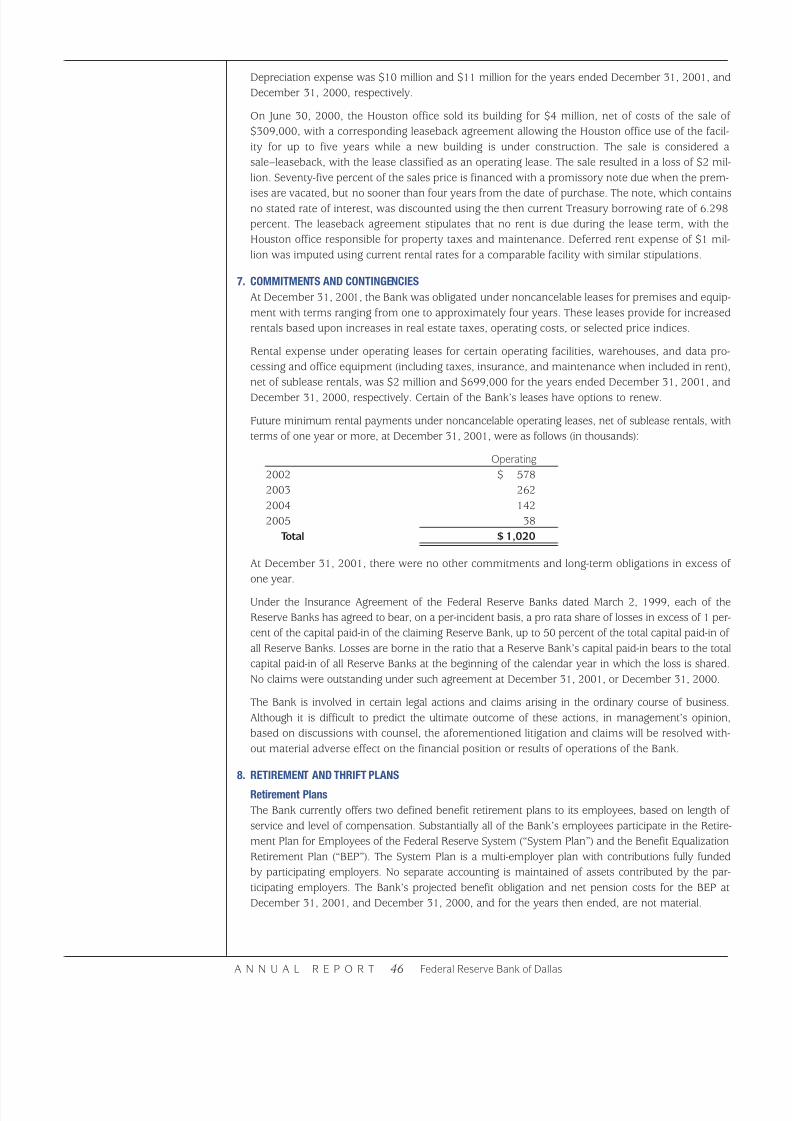
8/2/2019 2001 Dallas Federal Reserve Annual Report
http://slidepdf.com/reader/full/2001-dallas-federal-reserve-annual-report 47/51
Depreciation expense was $10 million and $11 million for the years ended December 31, 2001, and
December 31, 2000, respectively.
On June 30, 2000, the Houston office sold its building for $4 million, net of costs of the sale of
$309,000, with a corresponding leaseback agreement allowing the Houston office use of the facil-
ity for up to five years while a new building is under construction. The sale is considered a
sale–leaseback, with the lease classified as an operating lease. The sale resulted in a loss of $2 mil-
lion. Seventy-five percent of the sales price is financed with a promissory note due when the prem-
ises are vacated, but no sooner than four years from the date of purchase. The note, which containsno stated rate of interest, was discounted using the then current Treasury borrowing rate of 6.298
percent. The leaseback agreement stipulates that no rent is due during the lease term, with the
Houston office responsible for property taxes and maintenance. Deferred rent expense of $1 mil-
lion was imputed using current rental rates for a comparable facility with similar stipulations.
7. COMMITMENTS AND CONTINGENCIES
At December 31, 2001, the Bank was obligated under noncancelable leases for premises and equip-
ment with terms ranging from one to approximately four years. These leases provide for increased
rentals based upon increases in real estate taxes, operating costs, or selected price indices.
Rental expense under operating leases for certain operating facilities, warehouses, and data pro-
cessing and office equipment (including taxes, insurance, and maintenance when included in rent),
net of sublease rentals, was $2 million and $699,000 for the years ended December 31, 2001, and
December 31, 2000, respectively. Certain of the Bank’s leases have options to renew.
Future minimum rental payments under noncancelable operating leases, net of sublease rentals, with
terms of one year or more, at December 31, 2001, were as follows (in thousands):
Operating
2002 $ 578
2003 262
2004 142
2005 38
Total $ 1,020
At December 31, 2001, there were no other commitments and long-term obligations in excess of
one year.
Under the Insurance Agreement of the Federal Reserve Banks dated March 2, 1999, each of the
Reserve Banks has agreed to bear, on a per-incident basis, a pro rata share of losses in excess of 1 per-
cent of the capital paid-in of the claiming Reserve Bank, up to 50 percent of the total capital paid-in of
all Reserve Banks. Losses are borne in the ratio that a Reserve Bank’s capital paid-in bears to the total
capital paid-in of all Reserve Banks at the beginning of the calendar year in which the loss is shared.
No claims were outstanding under such agreement at December 31, 2001, or December 31, 2000.
The Bank is involved in certain legal actions and claims arising in the ordinary course of business.
Although it is difficult to predict the ultimate outcome of these actions, in management’s opinion,
based on discussions with counsel, the aforementioned litigation and claims will be resolved with-
out material adverse effect on the financial position or results of operations of the Bank.
8. RETIREMENT AND THRIFT PLANS
Retirement Plans
The Bank currently offers two defined benefit retirement plans to its employees, based on length of
service and level of compensation. Substantially all of the Bank’s employees participate in the Retire-
ment Plan for Employees of the Federal Reserve System (“System Plan”) and the Benefit Equalization
Retirement Plan (“BEP”). The System Plan is a multi-employer plan with contributions fully funded
by participating employers. No separate accounting is maintained of assets contributed by the par-
ticipating employers. The Bank’s projected benefit obligation and net pension costs for the BEP at
December 31, 2001, and December 31, 2000, and for the years then ended, are not material.
A N N U A L R E P O R T 46 Federal Reserve Bank of Dallas
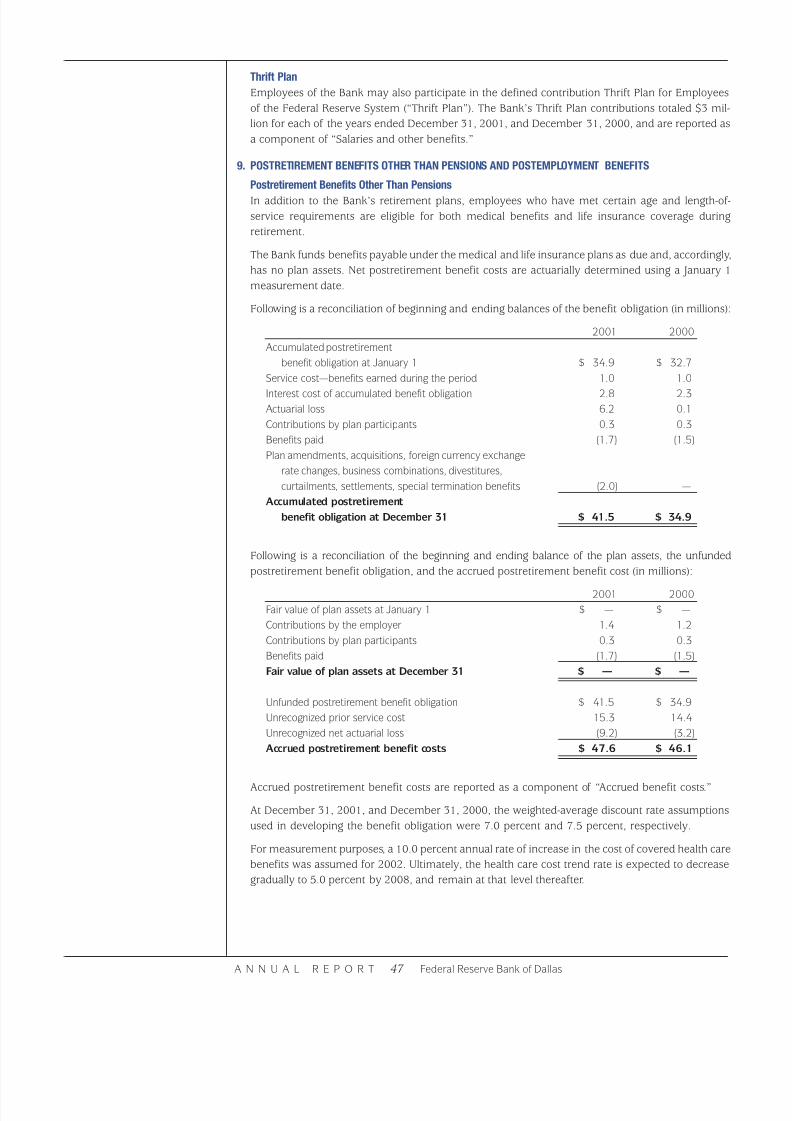
8/2/2019 2001 Dallas Federal Reserve Annual Report
http://slidepdf.com/reader/full/2001-dallas-federal-reserve-annual-report 48/51
Thrift Plan
Employees of the Bank may also participate in the defined contribution Thrift Plan for Employees
of the Federal Reserve System (“Thrift Plan”). The Bank’s Thrift Plan contributions totaled $3 mil-
lion for each of the years ended December 31, 2001, and December 31, 2000, and are reported as
a component of “Salaries and other benefits.”
9. POSTRETIREMENT BENEFITS OTHER THAN PENSIONS AND POSTEMPLOYMENT BENEFITS
Postretirement Benefits Other Than Pensions
In addition to the Bank’s retirement plans, employees who have met certain age and length-of-
service requirements are eligible for both medical benefits and life insurance coverage during
retirement.
The Bank funds benefits payable under the medical and life insurance plans as due and, accordingly,
has no plan assets. Net postretirement benefit costs are actuarially determined using a January 1
measurement date.
Following is a reconciliation of beginning and ending balances of the benefit obligation (in millions):
2001 2000
Accumulated postretirement
benefit obligation at January 1 $ 34.9 $ 32.7
Service cost—benefits earned during the period 1.0 1.0
Interest cost of accumulated benefit obligation 2.8 2.3Actuarial loss 6.2 0.1
Contributions by plan participants 0.3 0.3
Benefits paid (1.7) (1.5)
Plan amendments, acquisitions, foreign currency exchange
rate changes, business combinations, divestitures,
curtailments, settlements, special termination benefits (2.0) —
Accumulated postretirement
benefit obligation at December 31 $ 41.5 $ 34.9
Following is a reconciliation of the beginning and ending balance of the plan assets, the unfunded
postretirement benefit obligation, and the accrued postretirement benefit cost (in millions):
2001 2000
Fair value of plan assets at January 1 $ — $ —
Contributions by the employer 1.4 1.2
Contributions by plan participants 0.3 0.3
Benefits paid (1.7) (1.5)
Fair value of plan assets at December 31 $ — $ —
Unfunded postretirement benefit obligation $ 41.5 $ 34.9
Unrecognized prior service cost 15.3 14.4
Unrecognized net actuarial loss (9.2) (3.2)
Accrued postretirement benefit costs $ 47.6 $ 46.1
Accrued postretirement benefit costs are reported as a component of “Accrued benefit costs.”
At December 31, 2001, and December 31, 2000, the weighted-average discount rate assumptions
used in developing the benefit obligation were 7.0 percent and 7.5 percent, respectively.
For measurement purposes, a 10.0 percent annual rate of increase in the cost of covered health care
benefits was assumed for 2002. Ultimately, the health care cost trend rate is expected to decrease
gradually to 5.0 percent by 2008, and remain at that level thereafter.
A N N U A L R E P O R T 47 Federal Reserve Bank of Dallas

8/2/2019 2001 Dallas Federal Reserve Annual Report
http://slidepdf.com/reader/full/2001-dallas-federal-reserve-annual-report 49/51
Assumed health care cost trend rates have a significant effect on the amounts reported for health
care plans. A 1 percentage point change in assumed health care cost trend rates would have the fol-
lowing effects for the year ended December 31, 2001 (in millions):
1 Percentage 1 PercentagePoint Increase Point Decrease
Effect on aggregate of service and interest
cost components of net periodic
postretirement benefit costs $ 0.1 $ (0.1)
Effect on accumulated postretirement benefit obligation 1.2 (1.1)
The following is a summary of the components of net periodic postretirement benefit costs for the
years ended December 31 (in millions):
2001 2000
Service cost—benefits earned during the period $ 1.0 $ 1.0
Interest cost of accumulated benefit obligation 2.8 2.3
Amortization of prior service cost (1.0) (1.0)
Recognized net actuarial loss 0.1 —
Net periodic postretirement benefit costs $ 2.9 $ 2.3
Net periodic postretirement benefit costs are reported as a component of “Salaries and other
benefits.”
Postemployment Benefits
The Bank offers benefits to former or inactive employees. Postemployment benefit costs are actu-
arially determined and include the cost of medical and dental insurance, survivor income, and dis-
ability benefits. Costs were projected using the same discount rate and health care trend rates as
were used for projecting postretirement costs. The accrued postemployment benefit costs recog-
nized by the Bank at December 31, 2001, and December 31, 2000, were $6 million each year. This
cost is included as a component of “Accrued benefit costs.” Net periodic postemployment benefit
costs included in 2001 and 2000 operating expenses were $1 million each year.
A N N U A L R E P O R T 48 Federal Reserve Bank of Dallas
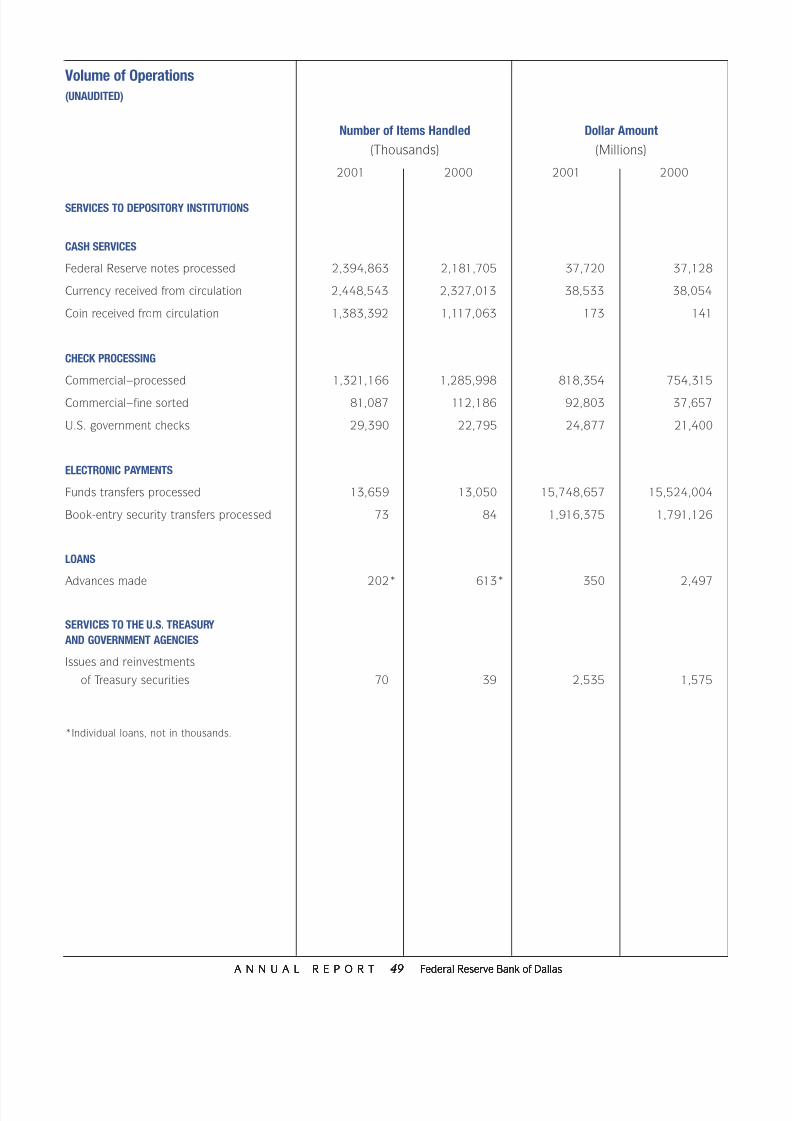
8/2/2019 2001 Dallas Federal Reserve Annual Report
http://slidepdf.com/reader/full/2001-dallas-federal-reserve-annual-report 50/51
A N N U A L R E P O R T 49 Federal Reserve Bank of Dallas
Volume of Operations
(UNAUDITED)
Number of Items Handled Dollar Amount
(Thousands) (Millions)
2001 2000 2001 2000
SERVICES TO DEPOSITORY INSTITUTIONS
CASH SERVICES
Federal Reserve notes processed 2,394,863 2,181,705 37,720 37,128
Currency received from circulation 2,448,543 2,327,013 38,533 38,054
Coin received from circulation 1,383,392 1,117,063 173 141
CHECK PROCESSING
Commercial–processed 1,321,166 1,285,998 818,354 754,315
Commercial–fine sorted 81,087 112,186 92,803 37,657
U.S. government checks 29,390 22,795 24,877 21,400
ELECTRONIC PAYMENTS
Funds transfers processed 13,659 13,050 15,748,657 15,524,004
Book-entry security transfers processed 73 84 1,916,375 1,791,126
LOANS
Advances made 202* 613* 350 2,497
SERVICES TO THE U.S. TREASURY
AND GOVERNMENT AGENCIES
Issues and reinvestments
of Treasury securities 70 39 2,535 1,575
*Individual loans, not in thousands.
A N N U A L R E P O R T 49 Federal Reserve Bank of DallasA N N U A L R E P O R T 49 Federal Reserve Bank of DallasA N N U A L R E P O R T 49 Federal Reserve Bank of DallasA N N U A L R E P O R T 49 Federal Reserve Bank of Dallas
8/2/2019 2001 Dallas Federal Reserve Annual Report
http://slidepdf.com/reader/full/2001-dallas-federal-reserve-annual-report 51/51
About the Dallas Fed
The Federal Reserve Bank of Dallas is one of
12 regional Federal Reserve Banks in the United
States. Together with the Board of Governors in
Washington, D.C., these organizations form the
Federal Reserve System and function as the nation’s
central bank. The System’s basic purpose is toprovide a flow of money and credit that will foster
orderly economic growth and a stable dollar. In
addition, Federal Reserve Banks supervise banks
and bank holding companies and provide certain
financial services to the banking industry, the
federal government and the public.
The Federal Reserve Bank of Dallas has served
the financial institutions in the Eleventh District since
1914. The district encompasses 350,000 square
miles and comprises the state of Texas, northernLouisiana and southern New Mexico. The three
branch offices of the Dallas Fed are in El Paso,
Houston and San Antonio.
Gloria V. Brown, Vice President, Public Affairs
James Hoard, Corporate Communications Director
Kay Champagne, Publications Director
Monica Reeves, Editor
Patti Holland, Art Director
Laura J. Bell, Chart Designer
Gene Autry, Photographer
Robin Sachs, Photographer
Federal Reserve Bank
of Dallas
2200 North Pearl Street
Dallas, TX 75201
(214) 922-6000
El Paso Branch301 East Main Street
El Paso, TX 79901
(915) 544-4730
Houston Branch
1701 San Jacinto Street
Houston, TX 77002
(713) 659-4433
San Antonio Branch
126 East Nueva Street
San Antonio, TX 78204
(210) 978-1200
Web Site
www.dallasfed.org