Embed Size (px)
Citation preview

K I A M O T O R S C O R P O R AT I O N
2OO1ANNUAL REPORT
2001 AN
NU
AL REPO
RT KIA
MO
TORS CO
RPORA
TION
231, Yangjae-Dong, Seocho-Gu,Seoul, 137-938, KoreaTEL: 82-2-3464-1114 http : //www.kia.co.krhttp : //www.kmcir.com

c o n t e n t s01. Financial Highlights
03. Setting the Goals
06. Message from the President & CEO
09. Setting the Standard
10. Domestic Business Activities
12. Overseas Business Activities
14. After-sales Service
16. Production & Quality
19. Setting the Pace
20. Top 10 Events
24. Operational Report
33. Auditor's Report
34. Report of Independent Public Accountants
36. Financial Statements & Notes
68. Kia Motors' Major Export Lineup
70. Corporate History
Sales
Net Income
Total Assets
Shareholders' Equity
Earnings Per Share (\, US$)
Return On Equity (%)
Area
\ 10,806
331
8,169
3,062
743
10.7
2000
\ 12,356
552
8,438
3,393
1,424
17.1
Korea Wonin Billions
U.S. Dollarsin Millions
2001
\ 7,931
136
7,681
3,097
493
4.4
1999
$ 9,318
416
6,363
2,559
1.07
17.1
For the ended December 31,2001, 2000 and 1999
2001
F i nanc i a l H i gh l i g h t s
1999 2000 2001
Earnings Per Share(Korean Won, U.S. Dollars)
\ 493
\ 743
\ 1,424$ 1.07
1999 2000 2001
Return On Equity(%)
4.4
10.7
17.1
1999 2000 2001
Sales(Korean Won in Billions, U.S. Dollars in Millions)
\ 7,931
\ 10,806
\ 12,356$ 9,318
1999 2000 2001
Net Income(Korean Won in Billions, U.S. Dollars in Millions)
\ 136
\ 331
\ 552$ 416
1999 2000 2001
Total Assets(Korean Won in Billions, U.S. Dollars in Millions)
7,6818,169
8,4386,363
1999 2000 2001
Shareholders' Equity(Korean Won in Billions, U.S. Dollars in Millions)
\ 3,097 \ 3,062
\ 3,393$ 2,559
NEWDREAM Part 1
After three consecutive years in the black, Kia's goal of joining the ranks of the world's top five automakers islooking increasingly attainable. Solid financials, a range of quality products and a proven track record of providingworld class quality at value prices has made Kia Motors the fastest growing brand in key strategic markets includ-ing the United States.
Setting the Goals
recorded the best year in the company's history. Inits third consecutive year of profitable operations,Kia recorded 12.4 trillion won in sales and 552 bil-lion won in net income. Domestic sales reached410,000 units, representing 1% year-on-yeargrowth. Exports increased by 12% year-on-year to610,000 units.
In 2001 Kia Motors
These strong figures are helping to raise Kia's profile and competitiveness
in the global marketplace. At the same time, a growing reputation for
safety and outstanding value is making Kia the brand of choice for an
increasing number of discerning motorists around the world.
Kia Motors has been a cornerstone of the Korean automobile industry for
more than 50 years. Today, Kia is developing into a true global player. 2000 saw
another milestone in the company's development when Chairman Chung, Mong
Koo was awarded the DSC from the U.S. Automotive Hall of Fame.
The DSC has been awarded since 1940 by the Automotive Hall of Fame, estab-
lished by a group of automotive leaders in New York in 1939. The award recog-
nizes individuals who make outstanding contributions to the development of
the industry. During the past 60 years, the 360 recipients of the DSC have includ-
ed Henry Ford, Lester Colbert (Chrysler) and Lee Ioccoca. Chairman Chung,
Mong Koo is only the second Asian to receive the award after Honda's Hiroyuki
Yoshino in 1998. The DSC establishes Kia's credentials as a world-class player and
will strengthen the company's position in both the Korean and U.S. automobile
markets.
Chairman & CEO of Kia Motors, Chung, Mong Koo
Chairman Chung, Mong Koo becomes the first Korean to receive the Distinguished Service Citation
from the U.S. Automotive Hall of Fame
For Kia Motors, 2001 was an extraordinarily successful year. While the global automotive industry experienced a
pronounced downturn, we achieved our best operational results ever. Sales of 902,409 units generated 12.4 trillion
won in sales, which translated into 552 billion won in net income.
Much of our success was in overseas markets. The U.S. market recorded particularly strong results after the launch of an
upgraded Carnival(Sedona) generated astonishing sales growth. Sales in the United States as a whole increased by 47%
year on year, making Kia one of the fastest growing brands in that market. Kia also expanded the scope of its operations
in the potentially lucrative China market.
The company's operations have also received their share of recognition. Kia was awarded the Korea Quality Grand
Prize and the Personnel Management Grand Prize in 2001, strengthening our position at the forefront of the Korean
automotive industry. On the international stage, Kia's products have begun to collect a range of awards and citations
for quality. The Carnival in particular has significantly raised the awareness and prestige of the Kia brand.
We also delivered on our promise to shareholders by completing the cancellation of 80 million treasury stocks as
promised to the shareholders. This underscores Kia Motors' financial soundness and highlights our continued commit-
ment to provide real shareholder value.
Brand recognition on the international market was raised by our agreement at the end of 2001 to act as major
sponsor for the 2002 and 2003 Australian Tennis Open. This is a groundbreaking move for Kia, and is a part of a glob-
al sports marketing strategy that will seek to leverage high-profile international sporting events to raise awareness of
the Kia brand. In the domestic market, we also founded the Kia Tigers professional baseball team, increasing our
exposure in this very popular spectator sport.
Every accomplishment listed above, and indeed every success that Kia has had, is the result of a committed team
effort. The support of our shareholders has made an outstanding contribution to that team effort and has instilled a
renewed sense of confidence throughout the company.
2002 will be a period of consolidation as Kia completes the groundwork that will enable us to join the world's top
five manufacturers. Solid leadership, improved quality management and a focus on global customer satisfaction will be
key components in that process. The introduction of a Six Sigma program, an integrated quality system and other ini-
tiatives are intended to raise quality levels company-wide.
Kia is pursuing both quantitative and qualitative market growth through an aggressive, diversified sales strategy com-
bining expanded sales of lower-priced, high-volume models with an increased emphasis on higher value-added and lux-
ury products. The launch of the Sorento will strengthen our sales in the important SUV market while improving our cor-
porate image through the development of more premium models. Restyled editions of existing models including the
Rio, Carens and Optima will further bolster our product competitiveness across the entire Kia range. The new and
upgrade models will be supported by increased overseas advertising and sales promotions to raise brand recognition.
Our global sales target for 2002 is 1,092,000 units. - 552,000 exports and 440,000 for the domestic market. The
remaining 130,000 units will be produced by our overseas assembly operations on a knock-down basis.
Of course, producing and marketing quality vehicles is only half the battle in building a global automotive brand.
The other half is providing a service offering that matches the quality of the product. Unfortunately, this is an area in
which Kia has lagged behind its competitor in the past. We have already taken steps to address this. The introduction
of our Kia Q-Service offering has increased after-sales service capabilities of our dealerships and begun generating
greater levels of consumer trust in Kia Motors. Kia after-sales service will take on a new look this year with the expan-
sion of the 24-hour-a-day emergency service, the provision of online maintenance services via the Kia homepage, a
new compensation program for dissatisfied customers and upgraded maintenance technology. We are also expanding
investment in R&D to continue improving the quality and technical standards of the vehicles we produce.
Kia Motors has had a very successful few years. However, there is no time to rest on our laurels. If we are to realize
our goal of joining the world's top 5 automakers by 2010, we need to hone our competencies still further and strive
for continuous growth. Kia's product line is improving all the time, and receiving industry recognition for quality and
value. Customers are increasingly seeing in Kia cars a product that they can be proud to own.
The task ahead of us is to build on that momentum and to reproduce Kia's success in the U.S. market and in other
markets around the world. That is a goal to which everyone at Kia is fully committed. I am confident that the results
will more than justify the faith and trust of all our shareholders.
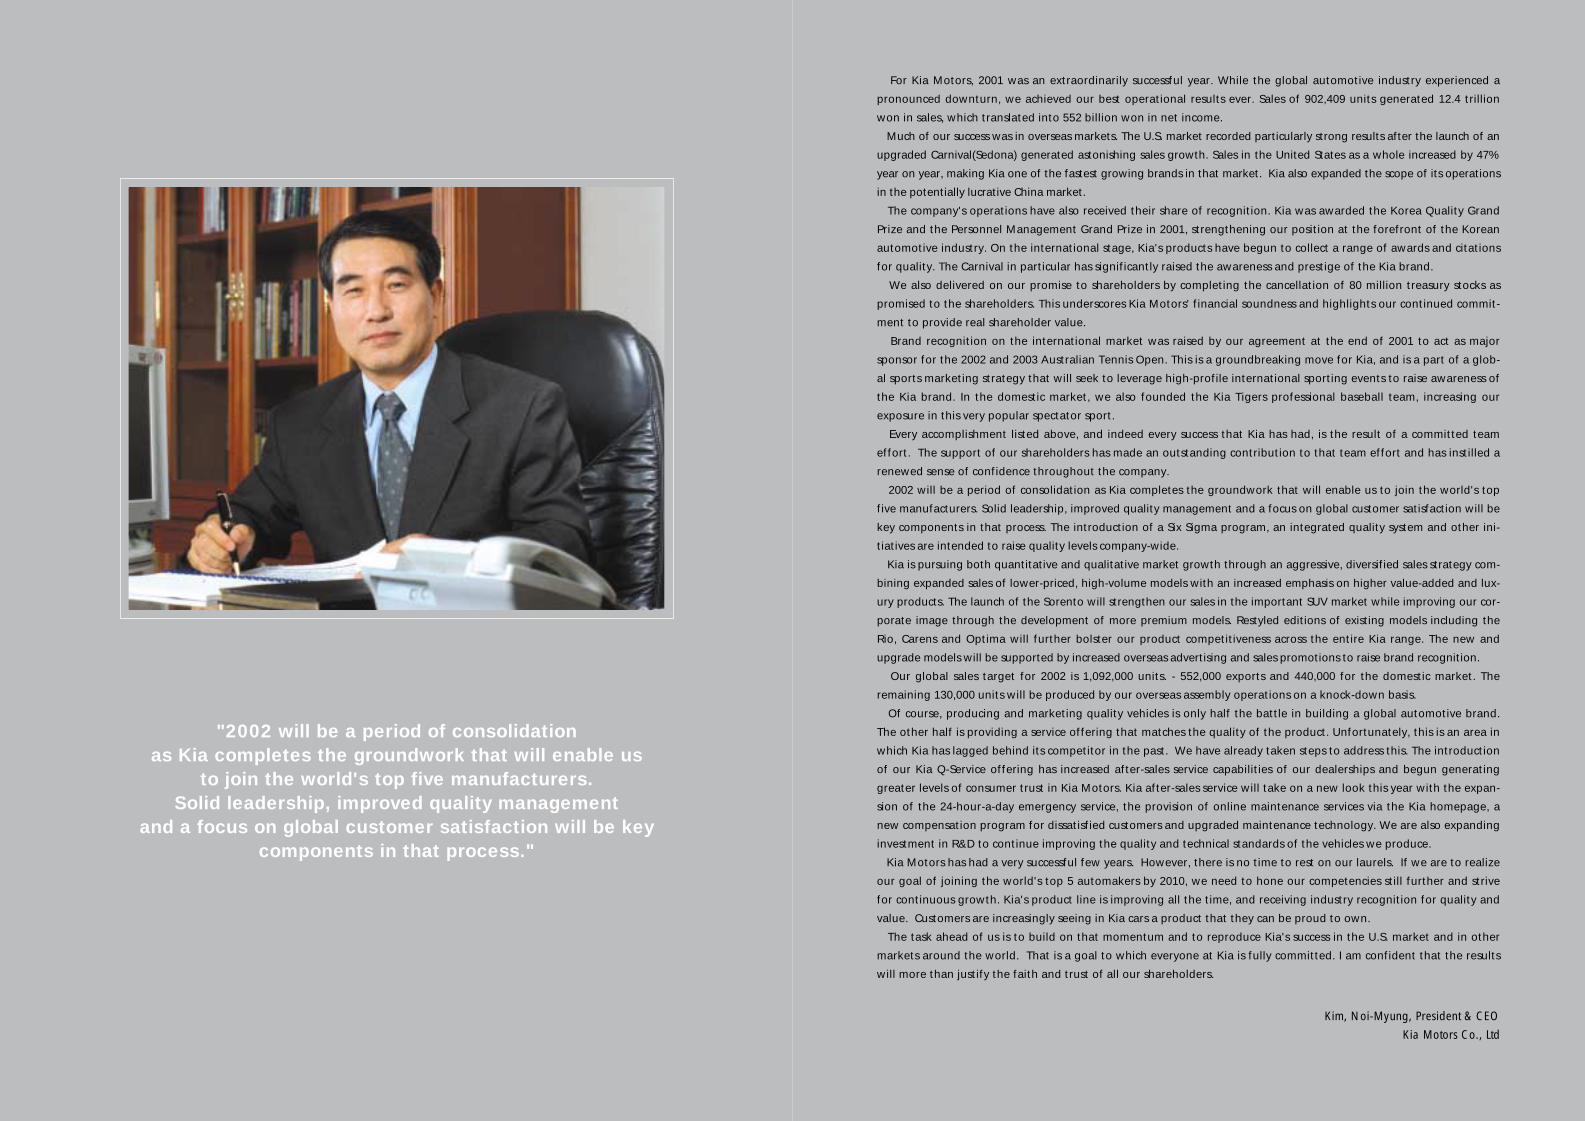
"2002 will be a period of consolidation as Kia completes the groundwork that will enable us
to join the world's top five manufacturers. Solid leadership, improved quality management
and a focus on global customer satisfaction will be keycomponents in that process."
Kim, Noi-Myung, President & CEOKia Motors Co., Ltd

NEWACTION Part 2
Kia is rapidly developing a global reputation for developing vehicles that meet or exceed international standardsfor safety and quality. Further initiatives in 2002 and beyond will build on this reputation, making the Kia brandsynonymous with quality.
Setting the Standard
After a contraction early in the year, domestic demand forautomobiles in 2001 gradually recovered to eventuallyrecord a 1.4% year-on-year increase at 1,451,000 units.Demand for RVs decreased slightly, despite an increase inSUV demand. The fall in minivan sales is attributed to theweakened economic advantage offered by LPG vehicles inthe domestic market.Demand for passenger cars increased, particularly for mid-size and larger models. Mid-sized vehicles recorded a 5.2%year-on-year increase, reaching 657,000 units. On the backof the economic recovery, commercial vehicle salesincreased by 3.8% to 384,000 units due to greater demandfor small buses and light trucks.In the passenger car market, Kia sold 134,000 units tosecure more than 20% of the market. Sales of the Spectraand Optima were particularly healthy. Sales of commercialvehicles also increased dramatically to 118,000 units, a13.5% year on year increase. This increase is mainly attrib-uted to an intensive effort aimed at making each model thetop-selling vehicle in its class through a focus on quality andcompetitiveness. In the RV category the exceptional qualityof the new Carnival continues to boost sales. Kia is alsoaggressively promoting of the Carens and the Carstar,models that maximize the strengths of LPG vehicles andcontribute to expanding the market share for minivans.Kia is establishing a unique brand image while maximizingsales via diverse marketing channels. Strategic partnershipswith related firms such as Daum Communications are beingexpanded to increase the scope and reach of Kia's cus-tomer messaging. Increased use of marketing databases isimproving sales efficiency by targeting key market seg-ments. Kia has also generated greater demand for its prod-ucts by promoting Kia's excellent safety record as attestedby certified domestic and overseas institutions.Increased internal competition is bolstering performancewithin our sales network. An ongoing campaign aimed atimproving overall sales productivity by 10% throughstronger training and on-site support for all employees ishelping to develop organizational and personnel capabili-
ties. Various PR events encourage consumers to visit deal-erships, and customer satisfaction is being raised throughcustomer-oriented service support based on speed, cour-tesy, precision and trust. We have also reduced sales lossesand promoted sound, profit-oriented management by con-stantly reducing payment delinquencies.In 2002, the domestic automobile market is expected tosee 5% growth with demand reaching about 1,525,000units. This forecast is based on factors including a steadyrecovery of the economy, expanded consumption sparkedby upcoming events such as the World Cup, the continuinggrowth trend in domestic demand and new model launchesby local manufacturers.Kia has set a domestic sales goal of 440,000 units, repre-senting a 6% increase over 2001. Performance will beaided by the launch of the Sorento, which will be highlycompetitive in the SUV market, and increased marketingactivities for the Carnival and the Carens. Kia will also con-solidate its leadership of the domestic RV and improve com-petitiveness in both the passenger and commercial vehicleareas through the introduction of new models.Improvements in productivity and customer satisfactionwill also be a priority for 2002. An in-house sales qualifica-tion system has been introduced and Kia is cultivating elitesales specialists capable of handling every aspect of anautomobile's life cycle, from sales and insurance to mainte-nance and disposal. Kia will also aim to provide an opti-mum level of service by maintaining a one-to-one ratiobetween sales and maintenance personnel.Kia is stepping up sports marketing activities by utilizingthe Kia Tigers professional baseball team and developingprograms around the World Cup. The company is alsostrengthening joint marketing activities to expand opportu-nities for customers to learn about Kia and its products.Database marketing efforts will be improved to better serveindividual customers. Kia's "Noblesse ManagementSystem" already offers benefits to long-term customers toencourage repeat purchase of Kia cars.
KIA MOTORS Domestic business activities
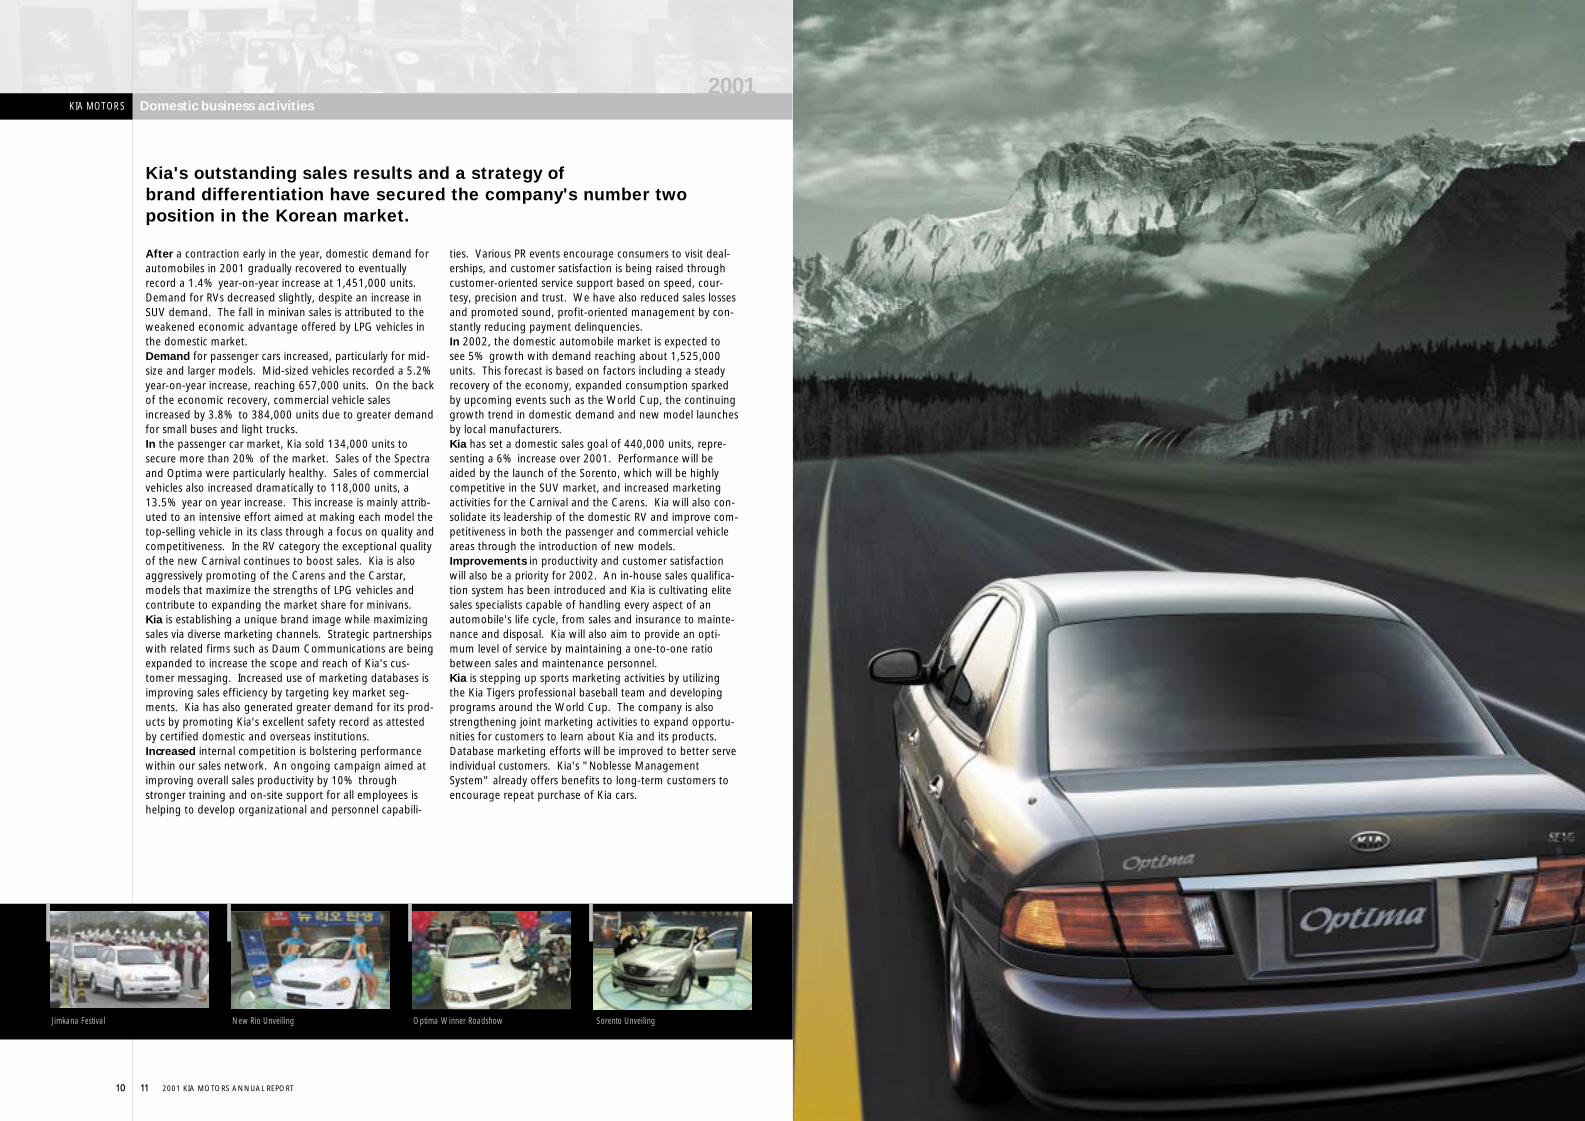
Kia's outstanding sales results and a strategy of brand differentiation have secured the company's number twoposition in the Korean market.
10 11
2001
Jimkana Festival New Rio Unveiling Optima Winner Roadshow Sorento Unveiling
2001 KIA MOTORS ANNUAL REPORT

2001 KIA MOTORS ANNUAL REPORT
Last year, Kia achieved its best results ever, exporting a total of 614,000 cars including 488,000 fin-
ished vehicles. The figure represents an 11.7% year-on-year increase, and is even more remarkable
given the weakened purchasing sentiment due to the global economic downturn following the
September 11 terrorist attacks in the U.S.
Export success is largely attribute to rapid growth in the U.S. market. This growth was led by sales of
the Sephia and the Sportage, introduction of the Optima mid-sized sedan and the Carnival(Sedona)
minivan, an improved image for sub-compacts, and an aggressive warranty program. Kia also diversi-
fied its export market, expanding sales in Western Europe through aggressive marketing activities, and
concluding large contracts for commercial vehicles in the Middle East.
To build on export successes in 2001, Kia is targeting sales of 652,000 units in 2002, including 522,000
finished cars. To achieve this goal, the company is distinguishing between volume-oriented and profit-
oriented models and initiating a diversified sales strategy. Brand recognition will be bolstered through
improved advertising, PR and sales promotions. Kia will also maximize logistics efficiency by means of
an integrated export management system. The successful international launch of the Sorento, the
introduction of a diesel option for the Carens, expanded production of the Carnival and improvements
in dealership management capabilities will increase sales.
Increased sales in North America and other markets contributed to Kia's best results since the company was estab-lished, with exports growing 11.7% to 614,000 units.
12 13
2001
Kia Motors' U.K. Branch Chicago Auto Show Export Shipment of Carnivals to North America Kia Vision21 Overseas
KIA MOTORS Overseas Business Activities
2001 KIA MOTORS ANNUAL REPORT 14 15
2001
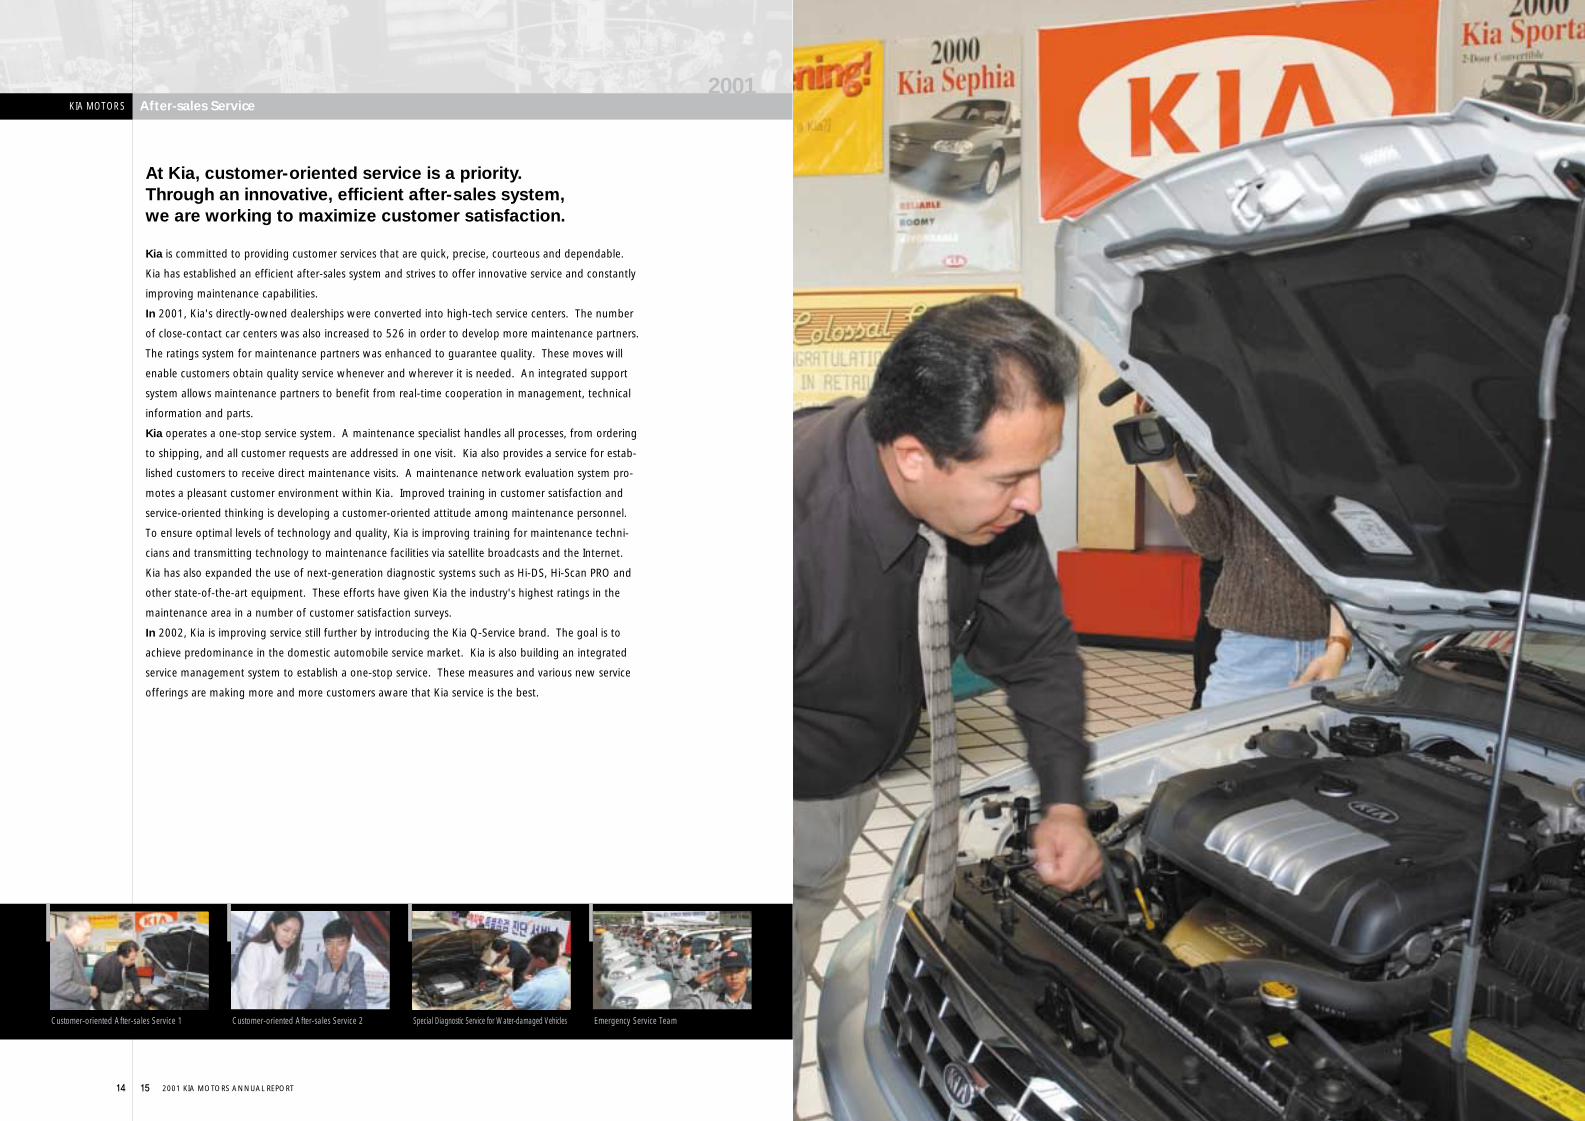
Customer-oriented After-sales Service 1 Customer-oriented After-sales Service 2 Special Diagnostic Service for Water-damaged Vehicles Emergency Service Team
Kia is committed to providing customer services that are quick, precise, courteous and dependable.
Kia has established an efficient after-sales system and strives to offer innovative service and constantly
improving maintenance capabilities.
In 2001, Kia's directly-owned dealerships were converted into high-tech service centers. The number
of close-contact car centers was also increased to 526 in order to develop more maintenance partners.
The ratings system for maintenance partners was enhanced to guarantee quality. These moves will
enable customers obtain quality service whenever and wherever it is needed. An integrated support
system allows maintenance partners to benefit from real-time cooperation in management, technical
information and parts.
Kia operates a one-stop service system. A maintenance specialist handles all processes, from ordering
to shipping, and all customer requests are addressed in one visit. Kia also provides a service for estab-
lished customers to receive direct maintenance visits. A maintenance network evaluation system pro-
motes a pleasant customer environment within Kia. Improved training in customer satisfaction and
service-oriented thinking is developing a customer-oriented attitude among maintenance personnel.
To ensure optimal levels of technology and quality, Kia is improving training for maintenance techni-
cians and transmitting technology to maintenance facilities via satellite broadcasts and the Internet.
Kia has also expanded the use of next-generation diagnostic systems such as Hi-DS, Hi-Scan PRO and
other state-of-the-art equipment. These efforts have given Kia the industry's highest ratings in the
maintenance area in a number of customer satisfaction surveys.
In 2002, Kia is improving service still further by introducing the Kia Q-Service brand. The goal is to
achieve predominance in the domestic automobile service market. Kia is also building an integrated
service management system to establish a one-stop service. These measures and various new service
offerings are making more and more customers aware that Kia service is the best.
At Kia, customer-oriented service is a priority. Through an innovative, efficient after-sales system, we are working to maximize customer satisfaction.
KIA MOTORS After-sales Service

2001 KIA MOTORS ANNUAL REPORT 16 17
2001
BL Collision Test PDI Quality Inspection Center Belgian-type Road Test Sorento on the High-speed Test Track
Kia has a total production capacity of 1.15 million units. The company produced 852,000 finished
vehicles in 2001, the highest level in Kia's history. The Sohari Plant increased production of the
Carnival to 180,000 units while the main Hwasung Plant produced 388,000 units, out of an annu-
al output capacity of 600,000 units.
In particular, The Production Division recorded a remarkable quality improvement. The Rio and
Carnival II acquired top ratings in safety tests at home and abroad. Sales of these models expand-
ed in North America, attracting U.S. drivers with an unprecedented warranty program and
improved product quality.
Efforts are underway to achieve a new production record in 2002. Kia is establishing a sales-ori-
ented, flexible production management system with the goal of producing 287,000 units at
Sohari, 450,000 units at Hwasung and 201,000 units at the Kwangju Plant for a total of 938,000
vehicles, marking a 10% year-on-year increase. Kia Motors is setting the industry standard in
terms of quality. Improved quality-oriented production management, the launch of new models
while minimizing production snags and re-organized quality management systems company-wide
set Kia apart from its domestic competitors. Kia was ISO re-certified by the Korea Standards
Association and the British Standards Association in June, and facilities were retooled to meet new
model quality standards. A new quality guarantee system covers six selected areas including new
and mass-produced model quality improvement, and a corporate-wide quality innovation cam-
paign achieved strong results. An overall commitment to quality improvement enabled Kia to
become the first Korean automaker to receive the Korea Quality Management Award, the first
time the award has been given to an automobile company.
Kia's 5-point quality management policy in 2002 will be to:
■apply stringent new quality standards and strengthen inspection activities for quality endurance;
■ respond more quickly to customer problems and proactively prevent problems;
■ improve the company's quality image by identifying problems, following up immediately and bolstering
inspection programs;
■empower lower organizational levels with greater responsibility and decision making so that the Six Sigma
quality initiative proceeds automatically; and
■ respond more rapidly to product liability issues and surveys of automotive quality to protect our reputation.
Kia achieved the highest production levels in the history of the company in 2001. Kia has grown qualitatively and quantitativelywith the re-establishment of a corporate-wide quality management system and the winning of the Korea Quality Prize.
KIA MOTORS Production & Quality
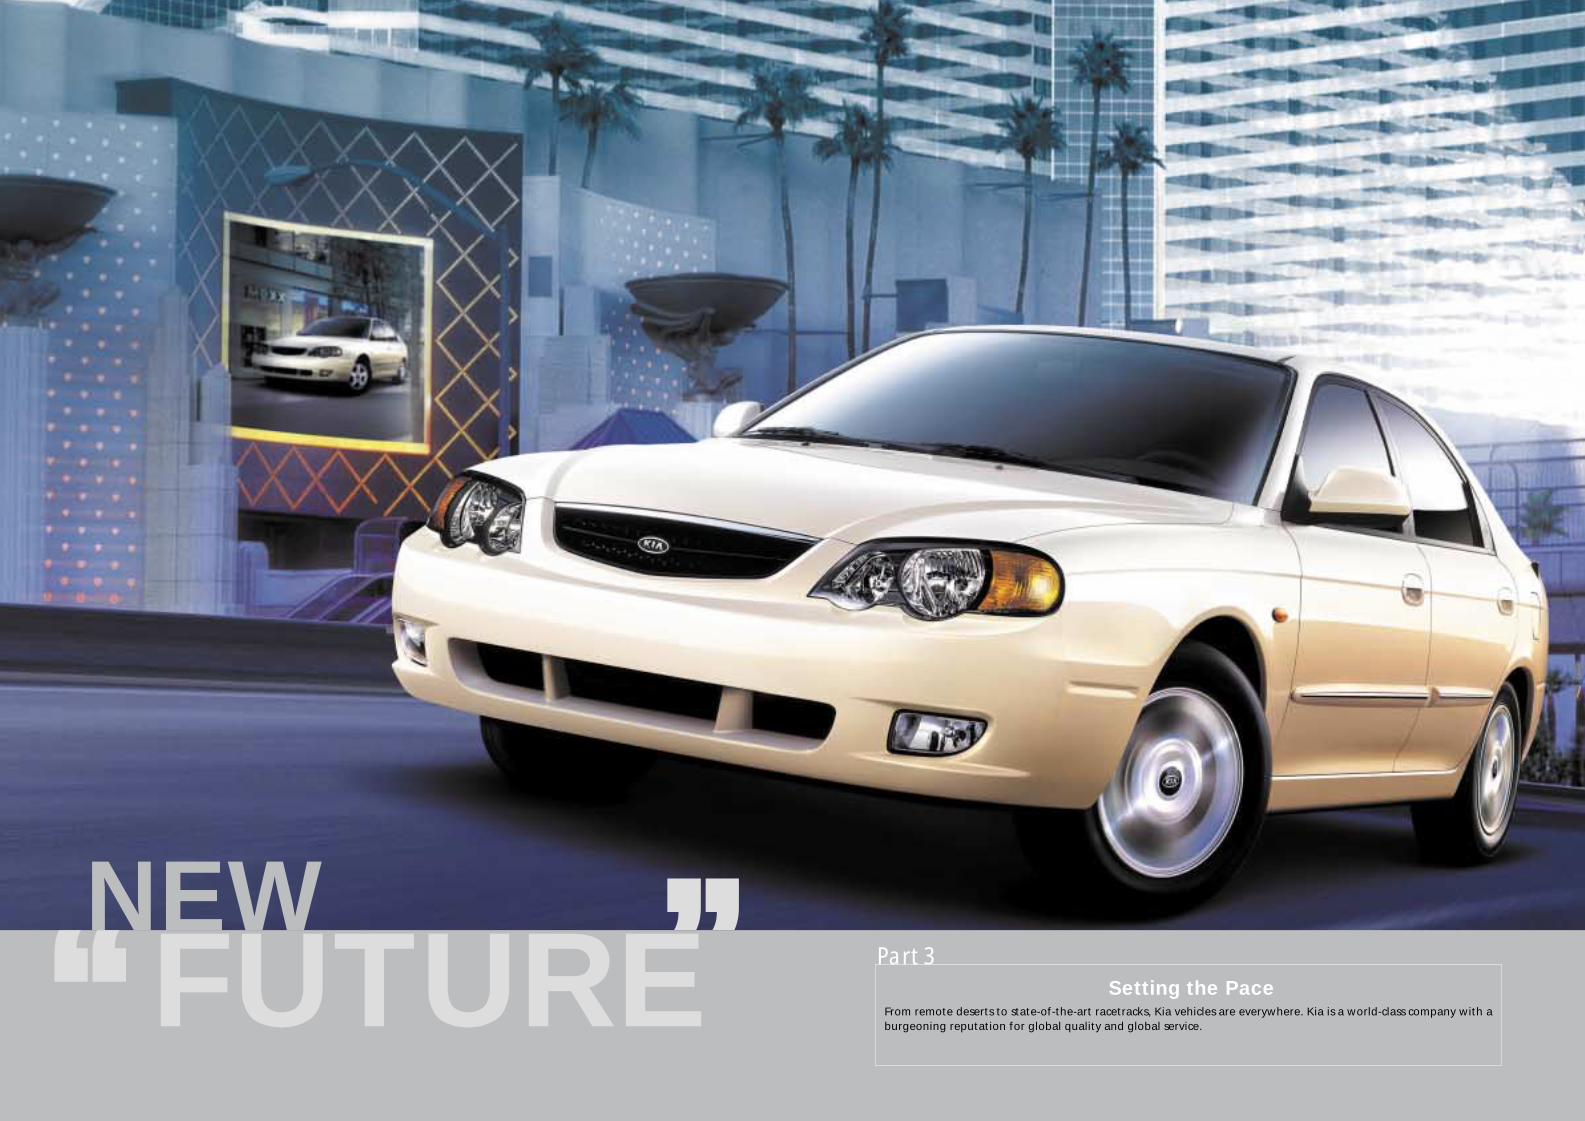
NEWFUTURE Part 3
From remote deserts to state-of-the-art racetracks, Kia vehicles are everywhere. Kia is a world-class company with aburgeoning reputation for global quality and global service.
Setting the Pace

In April, the Korea Fair Trade Commission officially recognized the Hyundai
Motor Group as a corporate entity. On an assets basis, Hyundai rose to 4th
place in the domestic financial rankings. At the time of its separation, the
auto specialist Hyundai Group consisted of 16 subsidiaries, with Hyundai
Motor and Kia Motors at the center and including Hyundai Mobis, INI Steel,
Hyundai Capital and Hyundai Hysco. To strengthen its position in the
financial sector, Hyundai acquired Diner's Card in October and then
re-launched the company as Hyundai Card. Hyundai also bolstered synergy
effects by acquiring ROTEM, which business has a mutually complementary
relationship with the automotive industry. As of December 2001, the
Hyundai Group consists of 21 subsidiaries.
Hyundai Motor Group Ranked 4th amongKorean Corporate Entities
After corporate rebirth, Kia achieved the best quantitative
and qualitative results ever,ensuring its emergence as a
world-class automaker.
20 21
K i a M o t o r s a n n u a l r e p o r t 2001
Kia consolidated its reputation for safety by winning top rat-
ings in various safety tests both at home and abroad. In tests conducted
by the U.S. National Highway Transportation & Safety Administration,
the Carnival outperformed U.S. and German models to receive five-star
ratings in both front, side and collision tests. In September, Korea's
Ministry of Construction and Transportation rated the Rio the safest
amongst compact passenger cars in collision tests. In addition to the
Carnival and Rio, the Optima, Carens and Carstar have received excellent
marks for safety in collision tests conducted this year.
Kia's Reputation for Safety Established in U.S. Market
2
3
KIA MOTORS
Top 10 Events in 2001
After being in the black for 3 consecutive years, Kia achieved its best
results ever in 2001. The figures break down to sales volume of
1,027,491 units (domestic: 413,942 units, export: 613,549 units), 12.4
trillion won in sales, (domestic: 6.354 trillion won, export: 6.002 trillion
won), operating income of 522.2 billion won, ordinary income of 424.2
billion won and net income of 552.2 billion won. Higher sales of
value-added vehicles such as the profitable Optima and Carnival II
contributed greatly to sales expansion.
Kia Achieves Best Results Ever
4Kim, Noi-Myong appointed Kia Motors President & CEO
in a ceremony on August 21, emphasized the sales
strength, uniqueness, and competitiveness of Kia motors.
President Kim urged every employee to work toward
"adapting all company processes - production, sales,
service and quality - to the customer's point of view." He
also stressed they should "have confidence and pride as
employees of a world-class company." President Kim
gained his international experience working for many years
in Hyundai motor's overseas business division.
Appointment of Kim, Noi-Myongas President & CEO
1

K i a M o t o r s a n n u a l r e p o r t 2001
22 23
Kia completed the purchase and cancellation of 80 million shares of its
treasury stocks, delivering on a promise to the general stockholders
meeting held in November 2000. The stocks amounted to 17.8% of all
issued shares. This cancellation of treasury stock served to build greater
trust with the shareholders. The move reduces the number of shares in
circulation, increases earnings per share and return on equity and raises
actual corporate value. It is also expected to have a very positive effect
on boosting the share price.
Stock Cancellation Increases Corporate Value
Kia Motors acquired national favorite Haitai Tigers professional base-
ball team and re-launched it as the Kia Tigers, the 14th team in the domestic
pro league. From early on, Kia stirred excitement among the players with ambi-
tious investment while Lee Jong-beom, the team's star player, brought in droves
of fans and helped rekindle the sparkle of the domestic professional baseball
diamond. At an inauguration ceremony at the Shinyang Park Hotel in Kwangju
on August 6, Chairman Chung, Mong-Koo announced he would spare no sup-
port in making the Kia Tigers the best in the league.
Kia Tigers Professional Baseball TeamExtremely Popular
On February 4, Chairman Chung, Mong-Koo received the Distinguished
Service Citation from the U.S. Automotive Hall of Fame. The award recognizes
his contribution to establishing the Korean automobile industry as a global
force. Under his leadership, Hyundai/Kia Motors' exports to North America
increased by almost 50% year on year in 2001, Kia operations were quickly
normalized, and Hyundai/Kia achieved its best results ever while maintaining
stability in management and hiring.
Chairman Chung, Mong-Koo awardedthe Distinguished Service Citation
Kia Motors was awarded the grand prize at the 27th National Korea
Quality Management Awards on November 7, 2001, the first time an
automobile manufacturer has received the award. Kia was also award-
ed the Personnel Management Award, the most prestigious domestic
prize for personnel development. The awards will serve to instill higher
levels of trust in Kia customers and greater confidence among Kia
employees and will contribute to the company's global quality
competitiveness.
First Automaker to Win Korea Quality Management and PersonnelManagement Awards
Despite overall stagnation in the global automobile market, Kia maintained a
12% growth rate in exports. In the U.S. market, the world's largest, Kia
launched the Carnival(Sedona) minivan and recorded the highest sales growth
rate among Korean automakers. Kia's recent export success is attributed to bold
marketing, improved customer satisfaction from quality improvements, and
expanded product lines. The introduction of the Sedona and Optima has
dramatically raised consumers' awareness of Kia quality and brand image, and
has been favorably covered by the local media.
New Sales Records in the U.S. Market
On November 27, Kia held a signing ceremony to establish a joint
venture with Dongfeng, one of China's 3 major automakers, for operations in
the Chinese passenger car market. Under the agreement, Kia will produce and
sell all types of passenger vehicles in China. Kia will invest 50%, while
Dongfeng and Yueda will each contribute 25% of the equity capital for
Dongfeng Yueda Kia Motors Co., Ltd, which will produce the latest Kia
passenger car models in China. The existing plant, with a current annual
production of 50,000 vehicles, will be expanded to a capacity of 300,000
units. The newly established joint venture will be independently managed.
Kia Moves intothe Chinese Passenger Car Market
5
6
7
8
9
10
KIA MOTORS
Top 10 Events in 2001

Operational Report
1. Corporate Purposes
2. Main Business
24 25
I. The Company
1.2.3.4.5.6.7.8.9.
10.11.12.13.14.15.16.17.18.19.20.21.22.
23.24.25.26.27.28.29.30.
3. Plants, Research Centers and Sales Offices
4. Employees
5. Corporate Stock
Production and sale of automobiles, transportation equipment, and related parts.Production and sale of military vehicles and related parts.Production and sale of machinery, tools and related parts.Production and sale of heavy equipment and related parts.Production and sale of engines and engine parts.Production and sale of automotive accessories.Production and sale of electronic devices and related parts.Production and sale of chemical products.Production and sale of agricultural machinery and tools.Automotive repair and inspection services.Export / Import.Issuance of product sales agreements.Distribution and service industries.Wholesaling and retailing.Sale of petroleum products.Automotive registration services.Leisure industry.Information processing and sale.Forestry and livestock raising.Landscaping.Port cargo handling.Automobile management. (buying and selling of used cars; automobile auctions, rental, and disposal.)Establishment and operation of youth training facilities.Operation of a professional basketball team.Real estate leasing and sale.Production and sale of information equipment.Marine shipping.Insurance proxy and broker.E-commerce and online-related businesses.Businesses incidental to those listed above.
Production and sale of automobiles and automotive parts.
January 1, 2001 ~ December 31, 2001
Name Particulars Location
Sohari Plant
Hwasung Plant
Kwangju Plant
Sohari R&D Center
Apgujeong Branch & 341 Other Locations
Production of the Carnival and Rio
Production of the Enterprise, Optima Regal, Optima, Spectra, Spectra Wing, Carens,Sportage, and Sorento
Production of the Retona, Pregio, Frontier,Rhino, Trade, Grace, Combi and Large buses
Automotive Development and Testing
Automobile Sales
781-1 Soha-dong,Gyangmyeong, GyeonggiProvince
1122 Ihwa-ri, Woojeong-myeon,Hwasung-gun, GyeonggiProvince
700 Naebang-dong, Seo-gu,Kwangju City
1232 Soha-dong,Gwangmyeong, GyeonggiProvince
518 Apgujeong-dong, Gangnam-gu, Seoul
Classification Administration Sales Production Other Total
Male 5,890 3,465 17,437 1,878 28,670
Female 604 27 5 183 819
Total 6,494 3,492 17,442 2,061 29,489
As of December 31, 2001
1. Number of shares issued
Type Number Value Composition Remarks
Registered common stock 369,597,455 \ 1,847,987,275 100%
(shares, thousands of Won)
( Person)

Operational Report
26 27
2. Business Performance
6. Corporate Bonds
1. Overall Performance
2. Production
January 1, 2001 ~ December 31, 2001
Category Issue Date Issue Amount Interest Balance Maturity Guarantor
Refer to the CEO's Message.
Main Product Categories Production
Units Value
2001 2000 2001 2000
501,117 445,670 3,083,598 2,505,041
271,722 318,728 2,925,601 3,263,438
90,772 63,143 827,408 445,693
99,811 77,463 928,412 827,131
963,422 905,004 7,765,019 7,041,303
Passenger cars
RVs
Vans
Other
Total▶ Includes CKD production
(units, millions of Won)
(shares, thousands of Won)
(millions of Won)Date Stock Type No. of Shares CapitalIncrease
Total Capitalafter Increase Details
14 Aug. 1997 Common
02 Feb. 1999 Common
30 Mar. 1999 Common
30 Mar. 1999 Common
30 Mar. 1999 Common
30 Jun. 1999 Common
30 Jun. 1999 Common
20 Nov. 1999 Common
07 Dec. 2000 Common
30 Jan. 2001 Common
09 Apr. 2001 Common
06 Nov. 2001 Common
Conversion of convertiblebonds
Capital reduction
Capital increase with consideration (Hyundai)
Debt-equity swap byfinancial institutions
Rights offering
Merger (5 affiliates)
Debt-equity swap byfinancial institutions
Rights offering
Debt-equity swap byfinancial institutions
Voluntary retirement ofstocks
Voluntary retirement ofstocks
Voluntary retirement ofstocks
2. Changes in Equity (Capital)
61,696 308,480 378,693,080
△68,169,666 △340,848,330 37,844,750
153,000,000 765,000,000 802,844,750
119,999,932 599,999,660 1,402,844,410
19,431,118 97,155,590 1,500,000,000
76,104,823 380,524,115 1,880,524,115
162,447 812,235 1,881,336,350
73,187,232 365,936,160 2,247,272,510
142,953 714,765 2,247,987,275
△43,287,110 △216,435,550 2,031,551,725
△16,712,890 △83,564,450 1,947,987,275
△20,000,000 △100,000,000 1,847,987,275
3. Stock Particulars
lassification ContentsDecember 31
Within 3 months after close of fiscal year
Between January 1 and 31
1, 5, 10, 50, 100, 500, 1,000, and 10,000 shares (8 types)
Seoul Bank
Securies Agency Division, 43 Yeoeuido-dong, Yeongdeungpo-Gu, Seoul
Korea Economic Daily
None
Closing date
General shareholders' meeting
Shareholder register closure period
Stock certificate denominations
Agent for stock-related affairs
Name
Address
Newspaper for public notices
Shareholder privileges
258th general issue
259th general issue
260th general issue
261st general issue
None
None
None
None
26 Dec. 2000 \ 200,000 7.00% \ 200,000 Dec. 26, 2002
15 Feb. 2001 \ 250,000 7.00% \ 250,000 Feb. 15, 2004
11 Jul. 2001 US$200 mn. 9.375% US$190 mn. Jul. 11, 2006
10 Dec. 2001 US$100 mn. Floating US$100 mn. Dec. 10, 2004
Operational Report
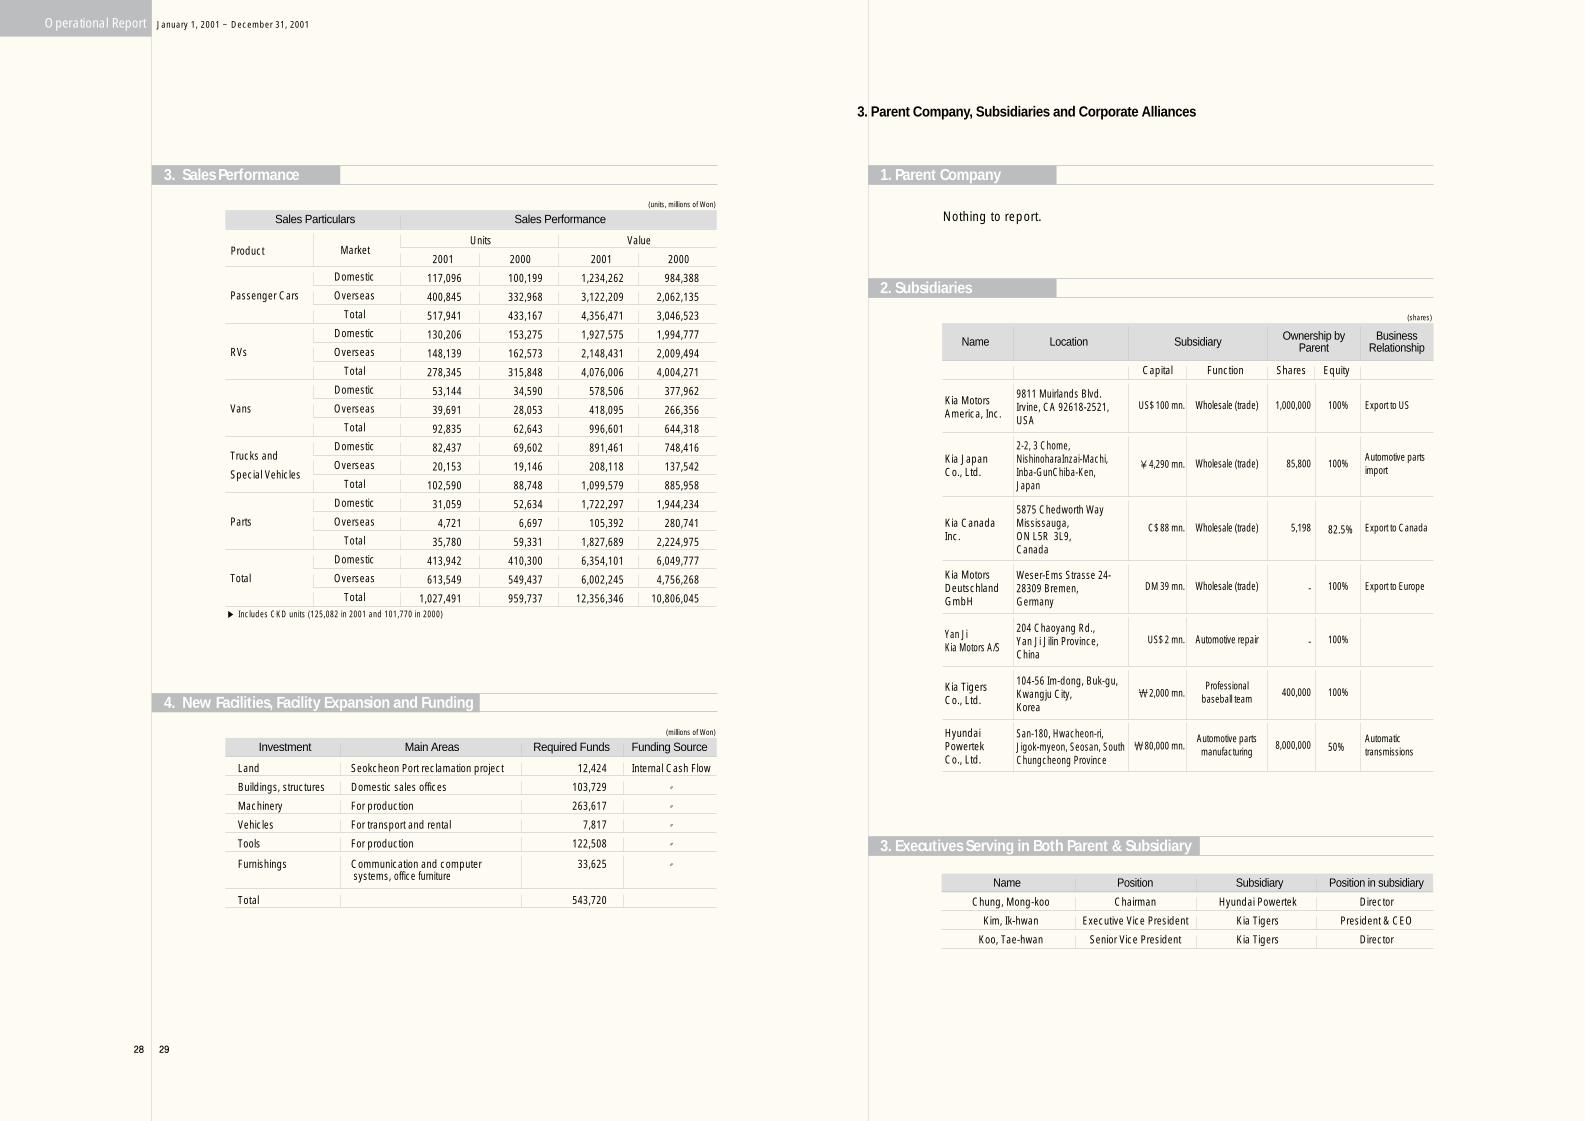
3. Sales Performance
28 29
3. Parent Company, Subsidiaries and Corporate Alliances
1. Parent Company
3. Executives Serving in Both Parent & Subsidiary
January 1, 2001 ~ December 31, 2001
Nothing to report.
Name Position Subsidiary Position in subsidiary
Chung, Mong-koo Chairman Hyundai Powertek Director
Kim, Ik-hwan Executive Vice President Kia Tigers President & CEO
Koo, Tae-hwan Senior Vice President Kia Tigers Director
Sales Particulars Sales Performance
Units Value
2001 2000 2001 2000
117,096 100,199 1,234,262 984,388
400,845 332,968 3,122,209 2,062,135
517,941 433,167 4,356,471 3,046,523
130,206 153,275 1,927,575 1,994,777
148,139 162,573 2,148,431 2,009,494
278,345 315,848 4,076,006 4,004,271
53,144 34,590 578,506 377,962
39,691 28,053 418,095 266,356
92,835 62,643 996,601 644,318
82,437 69,602 891,461 748,416
20,153 19,146 208,118 137,542
102,590 88,748 1,099,579 885,958
31,059 52,634 1,722,297 1,944,234
4,721 6,697 105,392 280,741
35,780 59,331 1,827,689 2,224,975
413,942 410,300 6,354,101 6,049,777
613,549 549,437 6,002,245 4,756,268
1,027,491 959,737 12,356,346 10,806,045
Land Seokcheon Port reclamation project 12,424 Internal Cash Flow
Buildings, structures Domestic sales offices 103,729 〃
Machinery For production 263,617 〃
Vehicles For transport and rental 7,817 〃
Tools For production 122,508 〃
Total 543,720
Furnishings Communication and computer 33,625 〃systems, office furniture
Product Market
Domestic
Passenger Cars Overseas
Total
Domestic
RVs Overseas
Total
Domestic
Vans Overseas
Total
Domestic
Overseas
Total
Trucks and
Special Vehicles
Domestic
Parts Overseas
Total
Domestic
Total Overseas
Total
(units, millions of Won)
4. New Facilities, Facility Expansion and Funding
Investment Main Areas Required Funds Funding Source(millions of Won)
(shares)
▶ Includes CKD units (125,082 in 2001 and 101,770 in 2000)
2. Subsidiaries
Name Location Subsidiary Ownership byParent
BusinessRelationship
Kia Motors America, Inc.
Kia JapanCo., Ltd.
Kia CanadaInc.
Kia MotorsDeutschlandGmbH
Yan Ji Kia Motors A/S
Kia TigersCo., Ltd.
HyundaiPowertekCo., Ltd.
Capital Function Shares Equity
9811 Muirlands Blvd.Irvine, CA 92618-2521,USA
2-2, 3 Chome,NishinoharaInzai-Machi,Inba-GunChiba-Ken, Japan
5875 Chedworth WayMississauga, ON L5R 3L9, Canada
Weser-Ems Strasse 24-28309 Bremen,Germany
204 Chaoyang Rd., Yan Ji Jilin Province, China
104-56 Im-dong, Buk-gu,Kwangju City,Korea
San-180, Hwacheon-ri,Jigok-myeon, Seosan, SouthChungcheong Province
US$100 mn.
¥4,290 mn.
C$88 mn.
DM 39 mn.
US$2 mn.
\2,000 mn.
\80,000 mn.
Wholesale (trade)
Wholesale (trade)
Wholesale (trade)
Wholesale (trade)
Automotive repair
Professional baseball team
Automotive parts manufacturing
1,000,000
85,800
5,198
-
-
400,000
8,000,000
100%
100%
82.5%
100%
100%
100%
50%
Export to US
Automotive partsimport
Export to Canada
Export to Europe
Automatic transmissions

Status Name Position Responsibility Business Ties with Kia
Hyundai Motor Automobile production on commission
Hyundai Capital
Hanvit Bank Major creditor
Korea Development Bank "
NPL Management Fund
134,285,491 36.33
36,180,000 9.79
51,539,932 13.94
18,242,390 4.94
10,060,863 2.72
Operational Report
1. Business Performance
30 31
4. Assets & Business Performance for Past 3 years 5. Key Issues Facing the Company
Key Issues Facing the Company
January 1, 2001 ~ December 31, 2001
Standing Chung, Mong-koo Chairman & CEO None
" Kim, Noi-myung President & CEO "
" Chung, Tae-young Executive Vice President Procurement Division "
Non-standing Choi, Yul Outside Director "
" Cho, Dong-sung Outside Director "
" Kim, Jong-chang Outside Director "
" Chung, Jong-am Outside Director "
Classification 2001 2000 1999
12,356,346 10,806,045 7,930,638
9,758,758 8,926,092 6,742,758
2,597,588 1,879,953 1,187,880
2,075,347 1,526,826 1,139,033
522,241 353,127 48,847
404,375 669,298 967,250
502,465 652,712 788,234
424,151 369,713 227,863
197,301 155,451
200,874
621,452 369,713 182,440
69,217 39,009 46,695
552,235 330,704 135,745
Total sales
Cost of sales
Gross profit
Selling & administrative expenses
Operating income
Non-operating income
Non-operating expenses
Ordinary income
Extraordinary income
Extraordinary losses
Income before income tax
Income tax expense
Net income
2. Assets
2001 2000 1999
2,419,877 2,542,022 2,374,999
6,018,589 5,627,259 5,306,296
1,538,269 1,018,450 904,319
4,303,437 4,518,991 4,384,586
176,883 89,818 17,391
8,438,466 8,169,281 7,681,295
2,540,899 2,601,221 2,371,448
2,504,551 2,506,543 2,212,634
5,045,450 5,107,764 4,584,082
1,847,987 2,247,987 2,247,273
1,699,924 1,920,913 1,921,058
△324,952 △783,887 △1,044,503
170,057 △323,496 △26,614
3,393,016 3,061,517 3,097,213
8,438,466 8,169,281 7,681,295
Assets
I. Current assets
II. Non-current assets
(1) Investment assets
(2) Tangible assets
(3) Intangible assets
Total assets
Liabilities
I. Current liabilities
II. Long-term liabilities
Total liabilities
Shareholders' equity
I. Capital stock
II. Capital surplus
III. Accumulated deficit
IV. Capital adjustments
Total shareholders' equity
Total liabilities and shareholders' equity
Summarized Income Statement Refer to the CEO's Message.
6. Directors & Auditors
Directors & Auditors
Name Shares Held Equity Share(%) Business Ties with Kia
7. Major Shareholders
Major Shareholders
Korea Development Bank 230,395 18,242,390 4.94
Korea Asset Management Corporation 77,264 10,060,863 2.72
Cho Hung Bank 72,425 395,059 0.11
Hanvit Bank 65,141 51,539,932 13.94
Shinhan Bank 37,666 1,716,818 0.46
Name Credit Outstanding Shares Held Equity Share
8. Major Creditors
Major Creditors
Summarized Balance Sheet
(millions of Won)
(millions of Won)
(shares, millions of Won)

Operational Report Auditor's Report
32 33
No key issues to report.
January 1, 2001 ~ December 31, 2001
Name of Company Invested Company No. of Shares owned Equity Share(%)
Kia Motors America, Inc.
Kia Japan Co., Ltd.
Yanji Kia Motors Maintenance & Repair Ltd.
Kia Motors Deutschland GmbH
Kia Canada, Inc.
Asia Motors Do Brazil
PT. Kia Timor Motors
Yancheng Yueda-Kia Moters
Kia Service Philippines
Kia-Ihlas Motor A.S.
Kia Tigers
Hyundai Powertek
WIA
Cheju Dynasty
Bontek
Korea DTS
TRW Steering
e-HD.com
NGVTEK.com
Hyundai Hysco
Autoever
Dongyoung Industries
Dong-hee Auto
Hyundai Mobis
INI Steel
9. Investment by Kia Motors in Other Companies
Investment by Kia Motors in Other Companies
10. Key Issues after Fiscal Year Closure
Key Issues after Fiscal Year Closure
No key issues to report.
11. Important Points Related to Other Business
Important Points Related to Other Business
Kia Motors 1,000,000 100.0
〃 85,800 100.0
〃 100.0
〃 100.0
〃 5,198 82.5
〃 87,206,990 43.0
〃 30,000 30.0
〃 30.0
〃 60,000 20.0
〃 5.0
〃 400,000 100.0
〃 8,000,000 50.0
〃 3,474,738 45.3
〃 1,240,000 40.0
〃 390,000 39.0
〃 6,024,286 30.1
〃 357,242 29.0
〃 540,000 27.0
〃 50,000 24.4
〃 19,294,680 21.6
〃 200,000 20.0
〃 115,382 19.2
〃 100,000 19.2
〃 13,858,120 17.6
〃 14,009,517 11.5
We, members of the Kia Motors Auditing Committee, hereby submit the results of our audit ofthe Company's accounting and business operations for the 58th Fiscal Year, starting on January1, 2001 and ending on December 31, 2001.
1. Auditing Approach
The accounting audit was conducted by reading the account books and related documents and carefully examining the financial reports and their attached statements.Contrastive, documentary, admissive, referential and other appropriate auditing procedureswere applied whenever deemed necessary in the conduct this audit.
We attended the Board of Directors' meetings and other important meetings to in the performance of our operational audit, and we received reports from the directors whendeemed necessary. We also carefully examined documents related to all major operational activities.
2. Notes on the Balance Sheet & Income Statement
The Balance Sheet and Income Statement accurately present the Company's assets andprofitability in accordance with the Articles of Incorporation and Korean Law.
3. Notes on the Report on Loan Loss Provisions
The Report on Loan Loss Provisions has been prepared in accordance with the Articles ofIncorporation and Korean Law to fairly reflect the Company's financial status.
4. Notes on the Annual Report
The Annual Report accurately presents the Company's operational status in accordancewith the Articles of Incorporation and Korean Law.
February 20, 2002 Kia Motors Coporation Audit CommitteeChairman of Audit Committee Kim, Jong-changMember of Audit Committee Chung, Jong-amMember of Audit Committee Choi, Yul

To the Shareholders and Board of Directors of Kia Motors Corporation:
We have audited the accompanying non-consolidated balance sheets of Kia Motors Corporation as ofDecember 31, 2001 and 2000, and the related non-consolidated statements of income, dispositions ofaccumulated deficit and cash flows for the years then ended, all expressed in Korean won. These non-consolidated financial statements are the responsibility of the Company's management. Our responsibili-ty is to express an opinion on these non-consolidated financial statements based on our audits.
We conducted our audits in accordance with auditing standards generally accepted in the Republic ofKorea. Those standards require that we plan and perform the audit to obtain reasonable assuranceabout whether the financial statements are free of material misstatement. An audit includes examining,on a test basis, evidence supporting the amounts and disclosures in the financial statements. An auditalso includes assessing the accounting principles used and significant estimates made by manage-ment, as well as evaluating the overall financial statements presentation. We believe that our audits pro-vide a reasonable basis for our opinion.
In our opinion, the non-consolidated financial statements referred to above present fairly, in all materialrespects, the financial position of Kia Motors Corporation as of December 31, 2001 and 2000, and theresults of its operations, changes in its accumulated deficit and its cash flows for the years then ended inconformity with financial accounting standards in the Republic of Korea (see Note 2).
The translated amounts in the accompanying non-consolidated financial statements have been translat-ed into U.S. dollars, solely for the convenience of the reader, on the basis set forth in Note 2 to the finan-cial statements.
Without qualifying our opinion, we draw attention to Note 1 of the non-consolidated financial statementswhich states that the operations of the Company have been affected, and may continue to be affectedfor the foreseeable future, by the general unstable economic conditions in the Republic of Korea and inthe Asia Pacific region. The ultimate effect of these uncertainties on the financial position of the Companyas of the balance sheet dates cannot presently be determined.
As explained in Note 12 to the non-consolidated financial statements, on November 4, 2000, the share-holders of the Company approved the retirement by December 31, 2001 of 80 million shares, or 17.8percent of total common stock issued at the date of shareholders' meeting. In accordance with the con-sensus reached during the shareholders' meeting and the provisions of the Korean Commercial Code, in2001, the Company concluded the stock retirement covering 80 million treasury shares, which had been
REPORT OF INDEPENDENT PUBLIC ACCOUNTANTS
reacquired for retirement purposes since the date of the shareholders' meeting. As a result of the stockretirement, the number of the Company's total common shares issued has been reduced to 369,597,455shares as of December 31, 2001.
As discussed in Note 16 to the non-consolidated financial statements, on January 31, 2001, the NationalTax Tribunal accepted the Company's assertion and issued its decision on the reassessment of theCompany's prior years' taxable income. Pursuant to the decision of the National Tax Tribunal, the taxauthorities reassessed the Company's tax loss carryforward and determined the deductible amount fortax loss carryforward as \640,589 million ($483,062 million) as of January 1, 2001. In prior years, thefuture tax benefits from the tax loss carryforward were not recorded by the Company as deferred incometax assets pending the outcome of the tax litigation. Accordingly, in 2001, the Company recognized thetax benefits from the reassessed tax loss carryforward as an extraordinary gain in the amount of\197,301 million ($148,783 million).
As discussed in Note 2 to the non-consolidated financial statements, through December 31, 2000, theaccounting for certain investments accounted for using the equity method was based on the financialstatements of investees as of a date earlier than the Company's balance sheet date since the investeeshad not yet prepared financial statements as of that date. In 2001, the Company used financial state-ments of investees, which are the same as the Company's balance sheet date in applying the equitymethod. As a result of this change, in 2001, the Company's beginning accumulated deficit increased by\39,555 million ($29,828 thousand), net income increased by \59,026 million ($44,511 thousand), andearning per share increased by \152 ($0.11), in comparison with previous accounting method.
As discussed in Note 18 to the non-consolidated financial statements, effective December 1, 2000, theCompany sold its Parts Sales Division, the main function of which had been the selling and distribution ofmotor parts for after-sales services, to Hyundai MOBIS. The book value of the disposed Division's netassets was \264,805 million ($199,687 thousand) as of December 1, 2000. The total consideration forthe sale of the Division consists of a fixed amount of \310,105 million ($233,847 thousand) as compen-sation for the Division's net assets and goodwill of \45,300 million ($34,160 thousand), plus 10 percentof ordinary income from the Division's operations which will be received every year for a ten-year periodstarting in 2001.
Accounting principles and auditing standards and their application in practice vary among countries.The accompanying non-consolidated financial statements are not intended to present the financial posi-tion, results of operations and cash flows in accordance with accounting principles and practices gener-ally accepted in countries and jurisdictions other than the Republic of Korea. In addition, the proceduresand practices utilized in the Republic of Korea to audit such financial statements may differ from thosegenerally accepted and applied in other countries. Accordingly, this report and the accompanying non-consolidated financial statements are intended for use by those knowledgeable about Korean account-ing procedures and auditing standards and their application in practice.
Seoul, Korea,
February 14, 2002
English Translation of a Report Originally Issued in Korean
34 35
Report of Independent Public Accountants

2001 2000 2001 2000
ASSETS
Current assets:
Cash and cash equivalents (Notes 9 and 10)
Short-term financial instruments (Notes 9 and 10)
Marketable securities (Note 4)
Trade notes and accounts receivable, net of
unamortized present value discount of \2,921 million
in 2001 and \4,188 million in 2000, and allowance
for doubtful accounts of \238,079 million in 2001 and
\134,287 million in 2000 (Note 2)
Inventories (Notes 3 and 5)
Other receivables, net of unamortized present value
discount of \14,539 million in 2001,
and \22,943 million in 2000 and allowance for
doubtful accounts of \105,816 million in 2001
and \101,671 million in 2000
Advances and other current assets, net of
allowance for doubtful accounts of \87,061 million
in 2001 and \15,881 million in 2000
Total current assets
Non-current assets:
Investments, net of unamortized present value
discount of \25,545 million in 2001 and
\27,446 million in 2000 (Note 4)
Property, plant and equipment, net of accumulated
depreciation of \1,534,632 million in 2001 and
\1,149,780 million in 2000 (Notes 5 and 6)
Intangibles, net of amortization (Note 7)
Other assets (Note 8)
Deferred income tax assets (Note 17)
Total non-current assets
Total assets
\ 250,849 \ 31,633 $ 189,163 $ 23,854
399,990 77,429 301,629 58,388
30,620 204,519 23,090 154,226
877,845 956,862 661,975 721,561
420,417 646,245 317,033 487,328
254,064 335,271 191,587 252,825
186,092 290,063 140,330 218,734
2,419,877 2,542,022 1,824,807 1,916,916
625,658 313,362 471,803 236,303
4,303,437 4,518,991 3,245,183 3,407,730
176,883 89,818 133,386 67,731
251,707 238,134 189,810 179,575
660,904 466,954 498,382 352,126
6,018,589 5,627,259 4,538,564 4,243,465
\\ 8,438,466 \\ 8,169,281 $$ 6,363,371 $$ 6,160,381
Korean won (In millions) Translation into U.S. dollars (Note 2) (in thousands) Korean won (In millions) Translation into U.S. dollars (Note 2) (in thousands)
Financial Statements & Notes
NON-CONSOLIDATED BALANCE SHEETS AS OF DECEMBER 31, 2001 AND 2000
2001 2000 2001 2000
\ 53,519 \ 74,390 $ 40,358 $ 56,097
362,415 692 273,294 522
1,293,692 1,737,587 975,561 1,310,299
231,208 181,234 174,352 136,667
418,309 390,409 315,443 294,404
181,756 216,909 137,062 163,568
2,540,899 2,601,221 1,916,070 1,961,557
1,638,933 1,743,066 1,235,905 1,314,430
413,407 385,919 311,746 291,018
- 65,278 - 49,226
436,099 300,578 328,858 226,663
16,112 11,702 12,150 8,824
2,504,551 2,506,543 1,888,659 1,890,161
5,045,450 5,107,764 3,804,729 3,851,718
1,847,987 2,247,987 1,393,550 1,695,187
1,699,924 1,920,913 1,281,897 1,448,543
(324,952) (783,887) (245,043) (591,122)
170,057 (323,496) 128,238 (243,945)
3,393,016 3,061,517 2,558,642 2,308,663
\\ 8,438,466 \\ 8,169,281 $$ 6,363,371 $$ 6,160,381
NON-CONSOLIDATED BALANCE SHEETS (CONTINUED) AS OF DECEMBER 31, 2001 AND 2000
LIABILITIES AND SHAREHOLDERS' EQUITY
Current liabilities:
Short-term borrowings (Note 9)
Current maturities of long-term debt and debentures,
net of discount on debentures issued of
\5,264 million in 2001 (Note 10)
Trade notes and accounts payable
Accrued warranties
Accounts payable-other
Accrued expenses and other current liabilities
Total current liabilities
Long-term liabilities:
Long-term debt and debentures, net of current
maturities and net of discount on debentures issued of
\11,995 million in 2001 and \10,112 million
in 2000 (Note 10)
Accrued severance benefits, net of National
Pension paid for employees of \ 51,078million in 2001
and \55,726 million in 2000, and individual severance
insurance deposits of \562,044 million in 2001 and
\472,421 million in 2000 (Note 2)
Derivative instruments credit (Note 2)
Long-term accrued warranties
Other long-term liabilities
Total long-term liabilities
Total liabilities
Commitments and contingencies (Note 11)
Shareholders' equity:
Capital stock (Note 12)
Capital surplus (Note 13)
Accumulated deficit (Note 14)
(Net income of \ 552,235 million in 2001 and
\330,704 million in 2000)
Capital adjustments (Note 15)
Total shareholders' equity
Total liabilities and shareholders' equity
36
(continued)
The accompanying notes are an integral part of these statements.
37

2001 2000 2001 2000
Sales (Note 23)
Cost of sales
Gross profit
Selling and administrative expenses (Note 22)
Operating income
Other income (expenses), net:
Interest expense, net
Foreign exchange loss, net
Reversal of allowance for doubtful accounts
Loss on valuation of marketable securities, net
Loss on valuation of inventories
Gain on valuation of investments securities
accounted for using equity method (Note 4)
Loss on disposal of accounts receivable
Gain(loss) on disposal of marketable securities, net
Loss on impairment of investments
Loss on disposal of property, plant and equipment
Gain on disposal of Parts Sales Division (Note 18)
Other
Ordinary income
Extraordinary item:
Other extraordinary income (Note 16)
Income before income tax
Income tax expense (Note 17)
Net income
Ordinary income per common share (Note 2)
Earnings per common share (Note 2)
\12,356,346 \ 10,806,045 $ 9,317,809 $ 8,148,741
9,758,758 8,926,092 7,358,991 6,731,085
2,597,588 1,879,953 1,958,818 1,417,656
2,075,347 1,526,826 1,565,001 1,151,366
522,241 353,127 393,817 266,290
(75,455) (98,623) (56,900) (74,371)
(28,179) (18,469) (21,250) (13,927)
- 171,684 - 129,465
- (89,546) - (67,526)
(10,432) (3,706) (7,867) (2,795)
11,996 25,765 9,046 19,429
(93,249) (53,822) (70,318) (40,587)
20,143 (11,057) 15,190 (8,338)
- (11,901) - (8,974)
(6,848) (27,369) (5,164) (20,639)
- 45,300 - 34,160
83,934 88,330 63,294 66,610
(98,090) 16,586 (73,969) 12,507
424,151 369,713 319,848 278,797
- - - -
197,301 - 148,783 -
197,301 - 148,783 -
621,452 369,713 468,631 278,797
69,217 39,009 52,196 29,416
\\ 552,235 \\ 330,704 $$ 416,435 $$ 249,381
\\ 916 \\ 743 $$ 0.69 $$ 0.56
\\ 1,424 \\ 743 $$ 1.07 $$0.56
Financial Statements & Notes
NON-CONSOLIDATED STATEMENTS OF INCOME FOR THE YEARS ENDED DECEMBER 31, 2001 AND 2000
2001 2000 2001 2000
\ (783,887) \ (1,044,503) $ (591,122) $ (787,650)
(39,555) - (29,828) -
(12,212) - (9,208) -
(41,533) (70,088) (31,320) (52,853)
(877,187) (1,114,591) (661,478) (840,503)
552,235 330,704 416,435 249,381
(324,952) (783,887) (245,043) (591,122)
- - - -
\\ (324,952) \\ (783,887) $$ (245,043) $$ (591,122)
NON-CONSOLIDATED STATEMENTS OF DISPOSITION OF ACCUMULATED DEFICIT FOR THE YEARS ENDED DECEMBER 31, 2001 AND 2000
Accumulated deficit before disposition:
Undisposed accumulated deficit, beginning of year
Beginning balance adjustments:
Cumulative effects of accounting change (Note 2)
Asset Revaluation Tax (Note 16)
Adjustments in investment securities using the
equity method and others (Note 4)
Adjusted beginning balance of accumulated deficit
Net income
Disposition
Undisposed accumulated deficit, end of year
Korean won Translation into U. S. dollars (Note 2) (in millions, except per share amounts) (in thousands, except per share amounts) Korean won (In millions) Translation into U.S. dollars (Note 2) (in thousands)
The accompanying notes are an integral part of these statements.
The accompanying notes are an integral part of these statements.
38 39

40 41
2001 2000 2001 2000
Cash flows from operating activities:
Net income
Adjustments to reconcile net income to net cash provided
by operating activities:
Depreciation and amortization
Provision for doubtful accounts
Provision for severance benefits
Provision for warranties
Reversal of allowance for doubtful accounts
Loss on foreign currency translation, net
Loss on valuation of marketable securities, net
Loss on valuation of inventories
Gain on valuation of investments accounted
for using equity method, net
Loss (gain) on disposal of marketable securities, net
Loss on impairment of investments
Loss on disposal of property, plant and equipment, net
Gain on disposal of Parts Sales Division
Amortization of present value discount
Other extraordinary income
Write-off of receivables
Changes in operating assets and liabilities:
Increase in trade notes and accounts receivable
Decrease in long-term notes and accounts receivable
Increase (Decrease) in inventories
Increase (Decrease) in advances and other receivables
Decrease (Increase) in other current assets
Decrease in deferred income tax assets
Increase (Decrease) in trade notes and accounts payable
Increase in accounts payable-other
Decrease in other current liabilities
Decrease in derivative instruments credit
Payment of warranties
Payment of severance benefits
Other
Cash flows from investing activities:
Cash inflows from investing activities:
Proceeds from disposal of marketable securities
Proceeds from disposal of investments
\ 552,235 \ 330,704 $ 416,435 $ 249,381
452,117 418,229 340,937 315,383
168,676 - 127,197 -
180,715 219,718 136,276 165,687
462,202 249,039 348,542 187,798
- (171,684) - (129,465)
3,702 16,030 2,792 12,088
- 89,546 - 67,526
10,432 3,706 7,867 2,795
(11,996) (25,765) (9,046) (19,429)
(20,143) 11,057 (15,190) 8,338
- 11,901 - 8,974
6,848 27,369 5,164 20,639
- (45,300) - (34,160)
(16,629) (24,845) (12,540) (18,735)
(197,301) - (148,783) -
- (76,788) - (57,905)
(10,053) (33,284) (7,581) (25,099)
6,084 56,637 4,588 42,709
215,397 (124,561) 162,429 (93,930)
51,234 (234,421) 38,635 (176,775)
53,891 (119,831) 40,639 (90,363)
69,218 39,009 52,197 29,416
(441,026) 77,564 (332,574) 58,490
26,958 109,538 20,329 82,602
(35,152) (95,555) (26,508) (72,058)
(39,207) - (29,566) -
(276,707) (210,171) (208,662) (158,488)
(68,529) (85,435) (51,677) (64,426)
19,199 10,306 14,477 7,771
1,162,165 422,713 876,377 318,764
228,858 309,322 172,580 233,257
28,865 3,057 21,767 2,305
Korean won (In millions) Translation into U.S. dollars (Note 2) (in thousands)
Financial Statements & Notes
NON-CONSOLIDATED STATEMENTS OF CASH FLOWS FOR THE YEARS ENDED DECEMBER 31, 2001 AND 2000
2001 2000 2001 2000
\ 3,047 \ 141,137 $ 2,298 $ 106,430
87,635 133,215 66,085 100,456
- 310,105 - 233,847
325,553 37,520 245,497 28,293
673,958 934,356 508,227 704,588
(34,816) (57,232) (26,254) (43,158)
(322,561) (37,267) (243,240) (28,103)
(280,310) (284,853) (211,379) (214,805)
(215,383) (162,883) (162,418) (122,829)
(543,720) (695,803) (410,014) (524,699)
(112,332) (79,945) (84,709) (60,285)
(1,509,122) (1,317,983) (1,138,014) (993,879)
(835,164) (383,627) (629,787) (289,291)
- 73,841 - 55,683
610,602 191,503 460,449 144,411
22,044 - 16,623 -
6,856 7,128 5,170 5,375
639,502 272,472 482,242 205,469
(20,286) - (15,297) -
(692) (5,849) (522) (4,410)
(380,531) (7,111) (286,955) (5,362)
- (145) - (109)
(343,331) (277,658) (258,903) (209,379)
(2,447) (2,509) (1,846) (1,892)
(747,287) (293,272) (563,522) (221,152)
(107,785) (20,800) (81,281) (15,683)
219,216 18,286 165,309 13,789
31,633 13,347 23,854 10,065
\\ 250,849 \\ 31,633 $$189,164 $$ 23,854
Korean won (In millions) Translation into U.S. dollars (Note 2) (in thousands)
NON-CONSOLIDATED STATEMENTS OF CASH FLOWS (CONTINUED) FOR THE YEARS ENDED DECEMBER 31, 2001 AND 2000
Reduction in other current assets
Reduction in other assets
Proceeds from disposal of Sales Parts Division
Proceeds from disposal of property, plant
and equipment
Cash outflows from investing activities:
Acquisition of marketable securities
Additions to other current assets
Acquisition of investments
Additions to other assets
Acquisition of property, plant and equipment
Acquisition of intangible assets
Cash flows from financing activities:
Cash inflows from financing activities:
Proceeds from short-term borrowings
Proceeds from long-term debt
Refund of asset revaluation tax
Other
Cash outflows from financing activities:
Repayment of short-term borrowings
Repayment of current maturities
Repayment of long-term debt
Payment of stock issuance costs
Acquisition of treasury stock
Other
Net increase in cash
Cash, beginning of year
Cash, end of year
(continued)
The accompanying notes are an integral part of these statements.
Financial Statements & Notes
NOTES TO NON-CONSOLIDATED FINANCIAL STATEMENTS DECEMBER 31, 2001 AND 2000 NOTES TO NON-CONSOLIDATED FINANCIAL STATEMENTS DECEMBER 31, 2001 AND 2000
42 43
Kia Motors Corporation (the "Company") was incorporated in December 1944, under the laws of theRepublic of Korea, to engage initially in the manufacture and sale of bicycles. The Company is now oneof the leading motor vehicle manufacturers in Korea producing and offering for sale a range of passen-ger cars, recreational vehicles, and commercial vehicles both in the domestic and the export markets.The Company owns and operates three principal automobile production plants: the Sohari plant, theHwasung plant, and the Kwangju plant. The shares of the Company have been listed on the Korea StockExchange since 1973.
The Company was under the court receivership on April 15, 1998, as the court ruled in favor of com-mencement of in-court reorganization procedures for the Company. Effective February 16, 2000, thecourt receivership was terminated as the managerial committee of the competent court and the credi-tors' conference have favorably decided on the completion of the Company's performance of in-courtreorganization procedures and the normalization of its finance and management.
The Company entered into a take-over contract with Hyundai Motor Company, representing the HyundaiMotor Consortium, effective December 1, 1999. Hyundai Motor Company holds 36.3 percent of theCompany's stock as of December 31, 2001.
Beginning in 1997, Korea and other countries in the Asia Pacific region experienced a severe contrac-tion in substantially all aspects of their economies. This situation is commonly referred to as the 1997Asian Financial Crisis. In response to this situation, the Korean government and the private sector beganimplementing structural reforms to historical business practices.
The Korean economy continues to experience difficulties, particularly in the areas of restructuring privateenterprises and reforming the banking industry. The Korean government continues to apply pressure toKorean companies to restructure into more efficient and profitable firms. The banking industry is currentlyundergoing consolidation and uncertainty exists with regard to the continued availability of financing. TheCompany may be either directly or indirectly affected by the situation described above. The accompany-ing non-consolidated financial statements reflect management's current assessment of the impact todate of the economic situation on the financial position of the Company. Actual results may differ materi-ally from management's current assessment.
Basis of Financial Statement PresentationThe Company maintains its official accounting records in Korean won and prepares statutory non-con-solidated financial statements in the Korean language (Hangul) in conformity with the accounting princi-ples generally accepted in the Republic of Korea. Certain accounting principles applied by theCompany that conform with financial accounting standards and accounting principles in the Republic ofKorea may not conform with generally accepted accounting principles in other countries. Accordingly,these non-consolidated financial statements are intended for use by those who are informed about
Korean accounting principles and practices. The accompanying non-consolidated financial statementshave been condensed, restructured and translated into English (with certain expanded descriptions)from the Korean language financial statements. Certain information attached to the Korean languagefinancial statements, but not required for a fair presentation of the Company's financial position, results ofoperations or cash flows, is not presented in the accompanying non-consolidated financial statements.
The US dollar amounts presented in these non-consolidated financial statements were computed bytranslating the Koran won into US dollars based on the Bank of Korea Basic Rate of \1326.10 to US$1.00 at December 31, 2001, solely for the convenience of the reader. This convenience translation intoUS dollars should not be construed as a representation that the Korean won amounts have been, couldhave been, or could in the future be, converted at this or any other rate of exchange.
The significant accounting policies followed by the Company in the preparation of its non-consolidatedfinancial statements are summarized below.
Revenue RecognitionRevenue, including long-term installment sales, is recognized at the time of shipping motor vehicles andparts. However, interest income arising from long-term installment sales contracts is recognized usingthe level yield method.
Valuation of Marketable SecuritiesMarketable securities are recorded at purchase price plus incidental costs. However, if the fair value ofmarketable securities differs from the book value determined by the moving average method, the securi-ties are stated at fair value and the valuation gain or loss is recognized in current operations.
Allowance for Doubtful AccountsThe Company provides an allowance for doubtful accounts based on management's estimate of the col-lectibility of the receivables.
InventoriesInventories are stated at the lower of cost or net realizable value, cost being determined by the movingaverage method except for materials in-transit for which cost is determined using the specific identifica-tion method.
Investment SecuritiesEquity securities held for investment (excluding those accounted for using the equity method discussedin the next paragraph) that are not actively traded (unlisted security) are stated at acquisition cost, asdetermined by the moving average method. Actively quoted (listed) securities, including those tradedover-the-counter, are stated at fair value, with the resulting valuation gain or loss reported as a capitaladjustment within shareholders' equity. If the fair value of a listed equity security or the net equity value ofan unlisted security held for investment declines compared to acquisition cost and is not expected torecover (impaired investment security), the carrying value of the equity security is adjusted to fair valueor net equity value, with the resulting valuation loss charged to current operations. If the net equity value
NOTES TO NON-CONSOLIDATED FINANCIAL STATEMENTS DECEMBER 31, 2001 AND 2000 NOTES TO NON-CONSOLIDATED FINANCIAL STATEMENTS DECEMBER 31, 2001 AND 2000
1. THE COMPANY:
2. SUMMARY OF SIGNIFICANT ACCOUNTING POLICIES:
Financial Statements & Notes
44 45
or fair value subsequently recovers, in the case of an unlisted security, the increase in value is recordedin current operations, up the amount of the previously recognized impairment loss, and in the case of alisted security, the increase in value is recorded in capital adjustments.
Equity securities held for investment that are in companies in which the Company is able to exercise sig-nificant influence over the operating and financial policies of the investees are accounted for using theequity method, except investment equity securities in affiliates whose total assets (non-consolidatedbasis) are less than the required level of \7,000 million and the differences arising from the use of theequity method are not considered material which are stated at cost. The Company's share in the netincome or net loss of investees is reflected in current operations. Changes in the retained earnings, capi-tal surplus or other capital accounts of investees are accounted for as an adjustment to retained earn-ings or to capital adjustments.
Through December 31, 2000, the accounting for certain investments accounted for using the equitymethod was based on the financial statements of investees as of a date earlier than the Company's bal-ance sheet date since the investees had not yet prepared financial statements as of that date. In 2001,the Company used financial statements of investees, which are the same as the Company's balancesheet date in applying the equity method. As a result of this change, in 2001, the Company's beginningaccumulated deficit increased by \39,555 million ($29,828 thousand), net income increased by\59,026 million ($44,511 thousand), and earnings per share increased by \152 ($0.11), in comparisonwith previous accounting method.
Debt securities held for investment are classified as either held-to-maturity investment debt securities oravailable for sale investment debt securities at the time of purchase. Held-to-maturity debt securities arestated at acquisition cost, as determined by the moving average method. When the face value of a held-to-maturity investment debt security differs from its acquisition cost, the effective interest method isapplied to amortize the difference over the remaining term of the security. Available-for-sale investmentdebt securities are stated at fair value, resulting valuation gain or loss reported as a capital adjustmentwithin shareholder' equity.
However, if the fair value of a held-to-maturity or an available-for-sale investment debt security declinescompared to the acquisition cost and is not expected to recover (impaired investment security), the car-rying value of the debt security is adjusted to fair value, with the resulting valuation gain or loss chargedto current operations. If the fair value of the security subsequently recovers, in the case of a held-to-maturity debt security, the increase in value is recorded in current operations, up to the amount of thepreviously recognized impairment loss, and in the case of an available-for-sale debt security, theincrease in value is recorded in capital adjustments.
The lower of acquisition cost of investments in treasury stock funds and the fair value of treasury stockincluded in a fund is accounted for as treasury stock in capital adjustments.
Property, Plant and Equipment and Related DepreciationProperty, plant and equipment are stated at cost, except for the effects of upward revaluations in accor-dance with the Asset Revaluation Law of Korea to give accounting recognition to the loss in purchasingpower of the Korean won. Routine maintenance and repairs are expensed as incurred. Expenditures thatresult in the enhancement of the value or extension of the useful lives of the facilities involved are treatedas additions to property, plant and equipment.
The Company capitalizes interest as part of the cost of constructing major facilities and equipment. Theinterest expense capitalized is \21,344 million ($16,095 thousand) and \22,092 million ($16,659thousand) in 2001 and 2000, respectively.
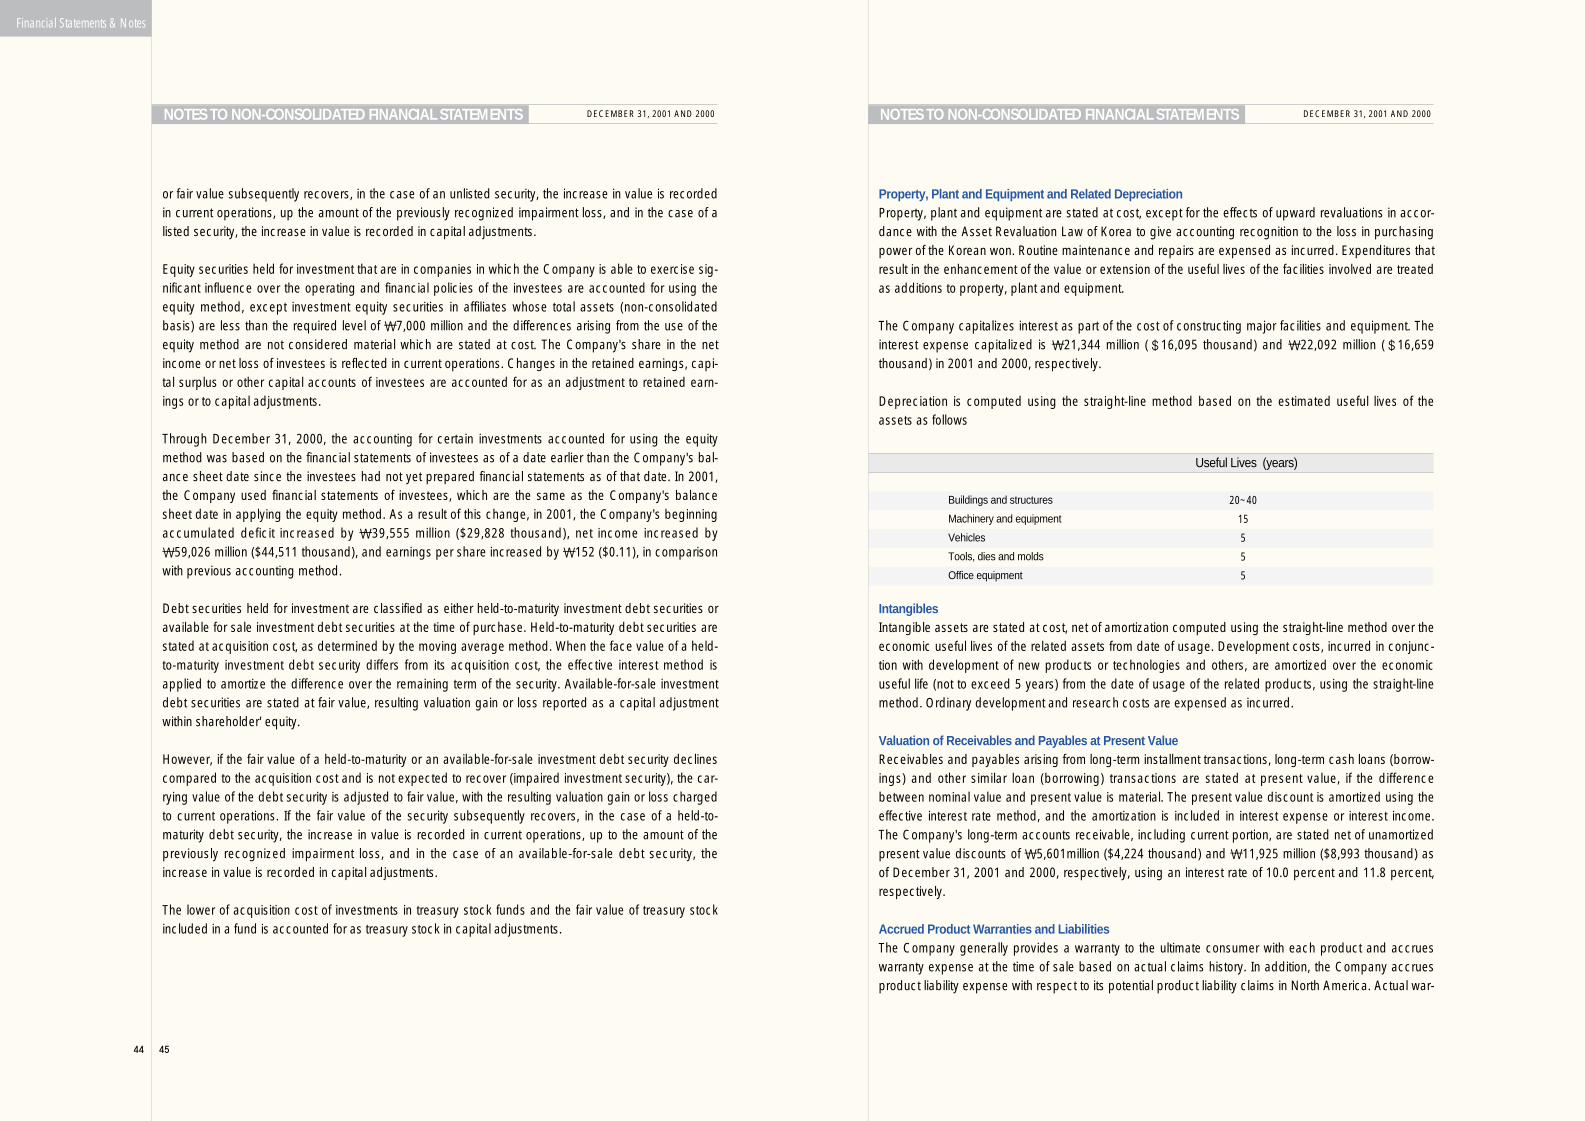
Depreciation is computed using the straight-line method based on the estimated useful lives of theassets as follows
IntangiblesIntangible assets are stated at cost, net of amortization computed using the straight-line method over theeconomic useful lives of the related assets from date of usage. Development costs, incurred in conjunc-tion with development of new products or technologies and others, are amortized over the economicuseful life (not to exceed 5 years) from the date of usage of the related products, using the straight-linemethod. Ordinary development and research costs are expensed as incurred.
Valuation of Receivables and Payables at Present ValueReceivables and payables arising from long-term installment transactions, long-term cash loans (borrow-ings) and other similar loan (borrowing) transactions are stated at present value, if the differencebetween nominal value and present value is material. The present value discount is amortized using theeffective interest rate method, and the amortization is included in interest expense or interest income.The Company's long-term accounts receivable, including current portion, are stated net of unamortizedpresent value discounts of \5,601million ($4,224 thousand) and \11,925 million ($8,993 thousand) asof December 31, 2001 and 2000, respectively, using an interest rate of 10.0 percent and 11.8 percent,respectively.
Accrued Product Warranties and LiabilitiesThe Company generally provides a warranty to the ultimate consumer with each product and accrueswarranty expense at the time of sale based on actual claims history. In addition, the Company accruesproduct liability expense with respect to its potential product liability claims in North America. Actual war-
NOTES TO NON-CONSOLIDATED FINANCIAL STATEMENTS DECEMBER 31, 2001 AND 2000 NOTES TO NON-CONSOLIDATED FINANCIAL STATEMENTS DECEMBER 31, 2001 AND 2000
20~40
15
5
5
5
Buildings and structures
Machinery and equipment
Vehicles
Tools, dies and molds
Office equipment
Useful Lives (years)
Financial Statements & Notes
46 47
ranty costs incurred are charged against the accrual when paid.
Accrued Severance BenefitsEmployees and directors with more than one year of service are entitled to receive a lump-sum paymentupon termination of their service with the Company, based on their length of service and rate of pay atthe time of termination. The accrued severance benefits which would be payable, assuming all eligibleemployees were to resign as of December 31, 2001 and 2000 amount to \1,026,529 million ($774,096thousand) and \914,066 million ($689,289 thousand), respectively.
Accrued severance benefits are approximately 55 percent and 52 percent funded at December 31,2001 and 2000, respectively, through an individual severance insurance plan. Individual severanceinsurance deposits, in which the beneficiary is a respective employee, are presented as deduction fromaccrued severance benefits.
Before April 1999, the Company and the employees paid 3 percent and 6 percent, respectively, ofmonthly pay (as defined) to the National Pension Fund in accordance with the National Pension Law ofKorea. The Company paid half of the employees' 6 percent portion and is paid back at the termination ofservice by offsetting the receivable against the severance payment. Such receivables, totalling \51,078million ($38,517 thousand) and \55,726 million ($42,022 thousand) as of December 31, 2001 and 2000,respectively, are presented as a deduction from accrued severance benefits. Since April 1999, accord-ing to a revision in the National Pension Law, the Company and the employees each pay 4.5 percent ofmonthly pay to the Fund.
Stock OptionsThe Company computes total compensation expense to stock options, which are granted to employeesand directors, by fair value method using the option-pricing model. The compensation expense hasbeen accounted for as a charge to current operations and a credit to capital adjustment from the grantdate using the straight-line method.
Derivative InstrumentsAll derivative instruments are accounted for at fair value with the valuation gain or loss recorded as anasset or liability. If the derivative instrument is not part of a transaction qualifying as a hedge, the adjust-ment to fair value is reflected in current operations. The accounting for derivative transactions that arepart of a qualified hedge, based both on the purpose of the transaction and on meeting the specified cri-teria for hedge accounting, differs depending on whether the transaction is a fair value hedge or a cashflow hedge. Fair value hedge accounting is applied to a derivative instrument designated as hedging theexposure to changes in the fair value of an asset or a liability or a firm commitment (hedged item) that isattributable to a particular risk. The gain or loss both on the hedging derivative instruments and on thehedged item attributable to the hedged risk is reflected in current operations. Cash flow hedge account-ing is applied to a derivative instrument designated as hedging the exposure to variability in expectedfuture cash flows of an asset or a liability or a forecasted transaction that is attributable to a particular risk.The effective portion of gain or loss on a derivative instrument designated as a cash flow hedge isrecorded as a capital adjustment and the ineffective portion is recorded in current operations. The effec-
tive portion of gain or loss recorded as a capital adjustment is reclassified to current earnings in thesame period during which the hedged forecasted transaction affects earnings. If the hedged transactionresults in the acquisition of an asset or the incurrence of a liability, the gain or loss in capital adjustment isadded to or deducted from the asset or the liability.
In 2000, the Company entered into foreign currency forward contracts to hedge the exposure tochanges in the fair value of recognized foreign currency denominated asset and liabilities. The Companyrecognized gain and losses arising from changes in the fair value of the foreign currency forward con-tracts in net income on a current basis, the ineffective portion of which was \2,417 million ($1,823 thou-sand) as of December 31, 2000, with related liabilities of \39,207 million ($29,566 thousand) includedin derivative instruments-credit.
In addition, the Company deferred the losses on the effective portion of foreign currency forward con-tracts for cash flow hedging purpose from forecasted exports as capital adjustments, amounting\26,071 million ($19,660 thousand) as of December 31, 2000, all of which were included in the deter-mination of net income in 2001.
Accounting for Foreign Currency Transactions and TranslationThe Company maintains its accounts in Korea won. Transactions in foreign currencies are recorded inKorean won based on the prevailing rates of exchange on the transaction date. Monetary accounts withbalances denominated in foreign currencies are recorded and reported in the accompanying non-con-solidated financial statements at the exchange rates prevailing at the balance sheet dates. The balanceshave been translated using the Bank of Korea Basic Rate which was \1,326.10 and \1,259.70 to US$1.00 at December 31, 2001 and 2000, respectively, and the translation loss and gain is reflected in cur-rent operations
Income Tax ExpenseThe Company recognizes deferred income taxes. Accordingly, income tax expense is determined byadding or deducting the total income tax and surtaxes to be paid for the current period and the changesin deferred income tax debits (credits). The difference between the income tax expense and the amountof income tax shown in the current period's tax return will be offset against the deferred income tax cred-its (debits), which will occur in subsequent periods.
Earnings Per ShareBasic ordinary income per common share and basic earnings per common share are computed bydividing ordinary income (after deduction for tax effect) and net income, respectively, by the weightedaverage number of common shares outstanding during the year. The number of shares used in comput-ing ordinary income per share and earnings per share is 387,672,624 in 2001 and 444,940,373 in 2000.Diluted ordinary income per share and diluted earnings per share are computed by dividing ordinaryincome and net income, after addition for the effect of expenses related to diluted securities on netincome, by the number of the weighted average number of common shares plus the number of dilutivepotential common shares. As the Company has not issued any diluted securities and the stock optionshave no dilutive effect on basic ordinary income per share and basic earnings per share in 2001 and
NOTES TO NON-CONSOLIDATED FINANCIAL STATEMENTS DECEMBER 31, 2001 AND 2000 NOTES TO NON-CONSOLIDATED FINANCIAL STATEMENTS DECEMBER 31, 2001 AND 2000

Financial Statements & Notes
2000, basic ordinary income per share and basic earnings per share are equal to diluted ordinaryincome per share and diluted earnings per share, respectively.
Inventories as of December 31, 2001 and 2000 consist of the following:
(1) Marketable securities as of December 31, 2001 and 2000 are stated at fair value and consist of the follow-ing:
As of December 31, 2001 the Company pledged part of its marketable securities as collateral for the var-ious borrowings. The book value of those pledged marketable securities amounts to \9,749 million($7,352 thousand) as of December 31, 2001.
(2) Investment securities as of December 31, 2001 and 2000 consist of the following:
Equity securities accounted for using the equity method as of December 31, 2001, consist of the following:
Equity securities accounted for using the equity method as of December 31, 2000, consist of the following:
NOTES TO NON-CONSOLIDATED FINANCIAL STATEMENTS DECEMBER 31, 2001 AND 2000 NOTES TO NON-CONSOLIDATED FINANCIAL STATEMENTS DECEMBER 31, 2001 AND 2000
3. INVENTORIES:
4. MARKETABLE SECURITIES AND INVESTMENT SECURITIES:
2001 2000 2001 2000
\ 193,775 \ 357,225 $ 146,124 $ 269,380
88,076 77,811 66,418 58,676
106,628 134,740 80,407 101,607
31,938 76,469 24,084 57,665
\ 420,417 \ 646,245 $ 317,033 $ 487,328
Finished goods and merchandise
Semifinished goods and work in process
Raw materials and supplies
Materials in transit
Korean won (In millions) Translation into U.S. dollars (Note 2) (in thousands)
2001 2000 2001 2000
\ 30,620 \ 25,672 $ 23,090 $ 19,359
- 178,847 - 134,867
\ 30,620 \ 204,519 $ 23,090 $ 154,226
Debt securities
Beneficiary certificates
Korean won (In millions) Translation into U.S. dollars (Note 2) (in thousands)
Companies Acquisition cost Equity value Equity value Percentage ofOwnership
\ 66,798 \ - $ - 100.0%
53,139 - - 100.0%
33,197 23,598 17,795 100.0%
20,300 18,221 13,740 100.0%
1,792 1,792 1,351 100.0%
58,507 - - 82.5%
40,000 34,393 25,935 50.0%
347 347 262 45.3%
8,520 4,828 3,641 40.0%
1,950 1,950 1,470 39.0%
30,850 31,531 23,777 30.1%
10,908 11,205 8,450 30.0%
5,503 267 201 30.0%
8,952 8,952 6,750 29.0%
2,700 1,505 1,135 27.0%
250 250 189 24.4%
64,829 91,320 68,864 21.6%
1,000 1,000 754 20.0%
185 185 140 20.0%
\ 409,727 \ 231,344 $ 174,454
Kia Motors America, Inc.
Kia Motors Deutschland GmbH
Kia Japan Co., Ltd.
Kia Tigers Co., Ltd.
Yan Ji Kia Motors A/S(*)
Kia Canada, Inc.
Hyundai Powertek Co., Ltd.
WIA Corporation
Cheju Dinasty Co., Ltd.
Bontek
Korea D.T.S Co., Ltd.
PT. Kia Timor Motors
Yancheng Yueda-Kia
Motors Co., Ltd.
TRW Steering Co., Ltd.
e-HD.com Inc.
NGVTEK.Com (*)
Hyundai Hysco Co., Ltd.
Autoever Co., Ltd.(*)
Kia Service Philipines Co.(*)
Korean won (In millions) U.S. dollars (Note2)(in thousands)
Companies Acquisition cost Equity value Equity value Percentage ofOwnership
Korean won (In millions) U.S. dollars (Note2)(in thousands)
2001 2000 2001 2000
\ 231,344 \ 189,091 $ 174,454 $ 142,592
354,356 94,558 267,217 71,305
16,605 8,261 12,522 6,229
23,353 21,452 17,610 16,177
\\ 625,658 \\ 313,362 $$ 471,803 $$ 236,303
Equity securities accounted for using
the equity method
Marketable investment equity
Securities
Unlisted equity securities
Debt securities
Korean won (In millions) Translation into U.S. dollars (Note 2) (in thousands)
\ 66,798 \ 27,992 $21,109 100.0%
33,197 29,636 22,348 100.0%
1,792 1,792 1,351 100.0%
22,324 22,192 16,735 64.5%
2,521 2,521 1,901 40.0%
10,908 12,570 9,479 30.0%
5,503 5,503 4,150 30.0%
2,700 2,700 2,036 27.0%
79,214 82,750 62,401 26.1%
250 250 189 24.4%
1,000 1,000 754 20.0%
185 185 139 20.0%
\ 226,392 \ 189,091 $ 142,592
Kia Motors America, Inc.
Kia Japan Co., Ltd.
Yan Ji Kia Motors A/S(*)
Kia Canada, Inc.
Cheju Dynasty Co., Ltd.(*)
PT. Kia Timor Motors
Yancheng Yueda-Kia
Motors Co., Ltd.(*)
e-HD.com Inc.(*)
Hyundai Hysco Co., Ltd.
NGVTEK.Com(*)
Autoever Co., Ltd.(*)
Kia Service Philipines Co.(*)48 49

Marketable investment equity securities as of December 31, 2001 consist of the following:
Marketable investment equity securities were stated at fair value and the difference of \189,455 million($142,866 thousand) between book value and fair value was recorded as gain on valuation of invest-ments equity securities in capital adjustments, excluding \1,515 million ($1,142 thousand) of treasurystock included in the treasury stock fund which was recorded in treasury stock in capital adjustments asof December 31, 2001.
Marketable equity securities as of December 31, 2000 consist of the following:
Marketable investment equity securities were stated at fair value and the difference of \4,307 million($3,248 thousand) between book value and fair value was recorded as loss on valuation of investmentsequity securities in capital adjustments, excluding \1,592 million ($1,201 thousand) of treasury stockincluded in the treasury stock fund which was recorded in treasury stock in capital adjustments and thedifference of \11,901 million ($8,974 thousand) between book value and fair value of Stock MarketStabilization Fund as of December 31, 2000.
Companies Acquisition cost Book value Book value Percentage ofOwnership
Korean won (In millions) U.S. dollars (Note2)(in thousands)
Companies Acquisition cost Book value Book value Percentage ofOwnership
Korean won (In millions) U.S. dollars (Note2)(in thousands)
Financial Statements & Notes
50 51
(*) Excluded from using the equity method as individual beginning balance of assets are less than therequired assets level of \7,000 million or the period of operation since the investee's inception isless than one year and the differences arising from the use of the equity method are not consideredmaterial which are stated at cost.
The difference between the acquisition cost and the Company's portion of an investee's net equity at thedate the Company was considered to be able to exercise significant influence over the operating andfinancial policy of an investee is amortized (positive goodwill) or reversed (negative goodwill) over 5years, using the straight-line method. As of December 31, 2001, the unamortized balance of the positivegoodwill was \30,783 million ($23,213 thousand) and the unreversed balance of the negative goodwillwas \122,431 million ($92,324 thousand). As of December 31, 2000, the unamortized balance of thepositive goodwill was \7,788 million ($5,873 thousand) and the unreversed balance of the negativegoodwill was \127,353 million ($96,036 thousand). Significant unrealized profit (loss) on intercompanytransactions is eliminated.
In 2000, the Company resumed applying the equity method for investments in Kia Japan Co., Ltd andKia Motors America Inc., since capital increases on those investees' were made in excess of their accu-mulated deficits. The Company recognized those investees' cumulative losses attributable to theCompany but not recorded after the discontinuance of use of the equity method, by charging the lossesto the value of investment securities and accumulated deficit.
As of December 31, 2001, the difference between acquisition cost and equity value of \178,383 million($134,517 thousand) was accounted for as a charge to beginning accumulated deficit for \29,721 mil-lion ($22,412 thousand) up to prior year, a charge to accumulated deficit for \146,954 million ($110,817thousand) in the current year, gain on valuation of \11,996 million ($9,046 thousand) reflected in currentoperations, and loss on valuation of investment equity securities of \13,704 million ($10,334 thousand)reflected in capital adjustments.
As of December 31, 2000, the difference between acquisition cost and equity value of \37,301 million($28,128 thousand) was accounted for as a credit to beginning accumulated deficit for \12,263 million($9,247 thousand) up to prior year, a charge to accumulated deficit for \67,750 million ($51,089 thou-sand) in the current year, gain on valuation of \25,765 million ($19,429 thousand) reflected in currentoperations, and loss on valuation of investment equity securities of \7,579 million ($5,715 thousand)reflected in capital adjustments.
The value of investments in equity securities of Kia Motors Deutchland GmbH and Asia Motors Do BrasilSA has declined and is not expected to recover; accordingly, the difference between the book value andthe fair value has been charged to current operations in 1998 as an investment impairment loss. Thebook value of these investments is zero and the net equity value has not been recovered as ofDecember 31, 2001. In addition, although the capital injection in Kia Motors Deutchland GmbH by theCompany was made in 2001, the increased capital was accounted for as a charge to accumulateddeficit, since such amount was less than the accumulated losses not recognized during the period ofsuspending the valuation of investment using the equity method.
NOTES TO NON-CONSOLIDATED FINANCIAL STATEMENTS DECEMBER 31, 2001 AND 2000 NOTES TO NON-CONSOLIDATED FINANCIAL STATEMENTS DECEMBER 31, 2001 AND 2000
\ 70,046 \ 261,919 $ 197,511 17.55%
67,680 55,338 41,730 11.52%
10,056 15,191 11,455 0.59%
96 130 98 0.52%
346 120 90 0.38%
14,843 21,173 15,967 -
2,000 485 366 -
\\165,067 \\ 354,356 $$ 267,217
Hyundai MOBIS
I INI Steel Co., Ltd.
LG. Telecom. Co., Ltd.
Kia Steel Co., Ltd.
Kanglim Co., Ltd.
Stock Market Stabilization Fund
Treasury Stock Funds
\ 79,751 \ 78,654 $ 59,312 19.99%
96 100 75 1.36%
3,491 2,037 1,536 0.59%
346 115 87 0.38%
25,145 13,244 9,987
2,000 408 308
\\ 110,829 \\ 94,558 $$ 71,305
Hyundai MOBIS
Kia Steel Co., Ltd.
LG. Telecom. Co., Ltd.
Kanglim Co., Ltd.
Stock Market Stabilization Fund
Treasury Stock Funds

Financial Statements & Notes
Unlisted equity securities as of December 31, 2001 consist of the following:
Unlisted equity securities as of December 31, 2000 consist of the following:
Unlisted investment equity securities are stated at cost, except where an investee's net equity value hasdeclined and is not expected to recover. Total net equity value of unlisted investment equity securities asat December 31, 2001 and 2000, amounted to \16,020 million ($12,081 thousand) and \8,688 million($6,552 thousand), respectively, based on the investees' latest financial statements.
Debt securities as of December 31, 2001 consist of the following:
Debt securities as of December 31, 2000 consist of the following:
As the interest rates and repayment periods of corporate bonds were changed by mutual agreement in1999, the difference between nominal value and present value was presented as bad debt expense,and amortized using the effective interest method over the remaining period.
The Company has pledged part of its investment equity securities as collateral for various short-term andlong-term borrowings outstanding as of December 31, 2001 as follows:
As of December 31, 2001 inventories and property, plant and equipment are insured for \3,320,367million ($2,503,859 thousand). In addition, the Company carries general insurance for vehicles and work-ers' compensation and casualty insurance for employees. Also, the Company has insurance to coverpotential product liability arising from its product liability claims in North America with maximum coverageof $50,000 thousand.
NOTES TO NON-CONSOLIDATED FINANCIAL STATEMENTS DECEMBER 31, 2001 AND 2000 NOTES TO NON-CONSOLIDATED FINANCIAL STATEMENTS DECEMBER 31, 2001 AND 2000
\ 7,200 \ 7,200 $ 5,430 0.40%
3,000 3,000 2,262 4.62%
2,000 2,000 1,508 3.33%
837 837 631 0.41%
700 700 528 2.41%
600 600 452 6.02%
550 550 415 9.20%
500 500 377 19.20%
240 240 181 19.23%
200 200 151 8.00%
168 168 127 0.22%
610 610 460
\\ 16,605 \\ 16,605 $$ 12,522
Korea Telecom I Com Co., Ltd.
Dongwon Capital Co., Ltd.
Daeshin Factoring Co., Ltd.
Shinsegi Telecom. Co., Ltd.
Kihyup Technology Banking Corp.
Mobil com. Co., Ltd.
A.P. Co., Ltd.
Donghui Auto Co., Ltd.
Dongyung Industries Co., Ltd.
Namyang Industrial Co., Ltd.
The Korea Economic Daily Co., Ltd.
Other
\ 3,000 \ 3,000 $ 2,262 4.62%
2,000 2,000 1,508 3.33%
837 837 631 0.27%
700 700 528 2.41%
600 600 452 5.20%
240 240 181 19.23%
200 200 151 8.00%
168 168 127 0.25%
516 516 389
\\ 8,261 \\ 8,261 $$ 6,229
Dongwon Capital Co., Ltd.
Daeshin Factoring Co., Ltd.
Shinsegi Telecom. Co., Ltd.
Kihyup Technology Banking Corp.
Mobil com. Co., Ltd.
Dongyung Industries Co., Ltd.
Namyang Industrial Co., Ltd.
The Korea Economic Daily Co., Ltd.
Other
Companies Acquisition cost Present Value Discount Book value Ownership
\ 32,698 \ 18,253 \ 14,445 $ 10,893
16,200 7,292 8,908 6,717
\\ 48,898 \\ 25,545 \\ 23,353 $$ 17,610
Corporate bonds:
Kia Steel Co., Ltd.
Seoul Guarantee Insurance Company
Korean won (In millions) U.S. dollars (Note2)(in thousands)
Companies Acquisition cost Present Value Discount Book value Ownership
\ 32,698 \ 19,438 \ 3,260 $ 9,999
16,200 8,008 8,192 6,178
\\ 48,898 \\ 27,446 \\ 21,452 $$ 16,177
Corporate bonds:
Kia Steel Co., Ltd.
Seoul Guarantee Insurance Company
Korean won (In millions) U.S. dollars (Note2)(in thousands)
175,100
3,474,738
306,160
1,500
Kia Steel Co., Ltd.
Wia Corporation
Kisan Mutual Saving's & Finance
Other
No. of shares pledgedCompany
5. INSURANCE:
Companies Acquisition cost Book value Book value Percentage ofOwnership
Korean won (In millions) U.S. dollars (Note2)(in thousands)
Companies Acquisition cost Book value Book value Percentage ofOwnership
Korean won (In millions) U.S. dollars (Note2)(in thousands)
52 53
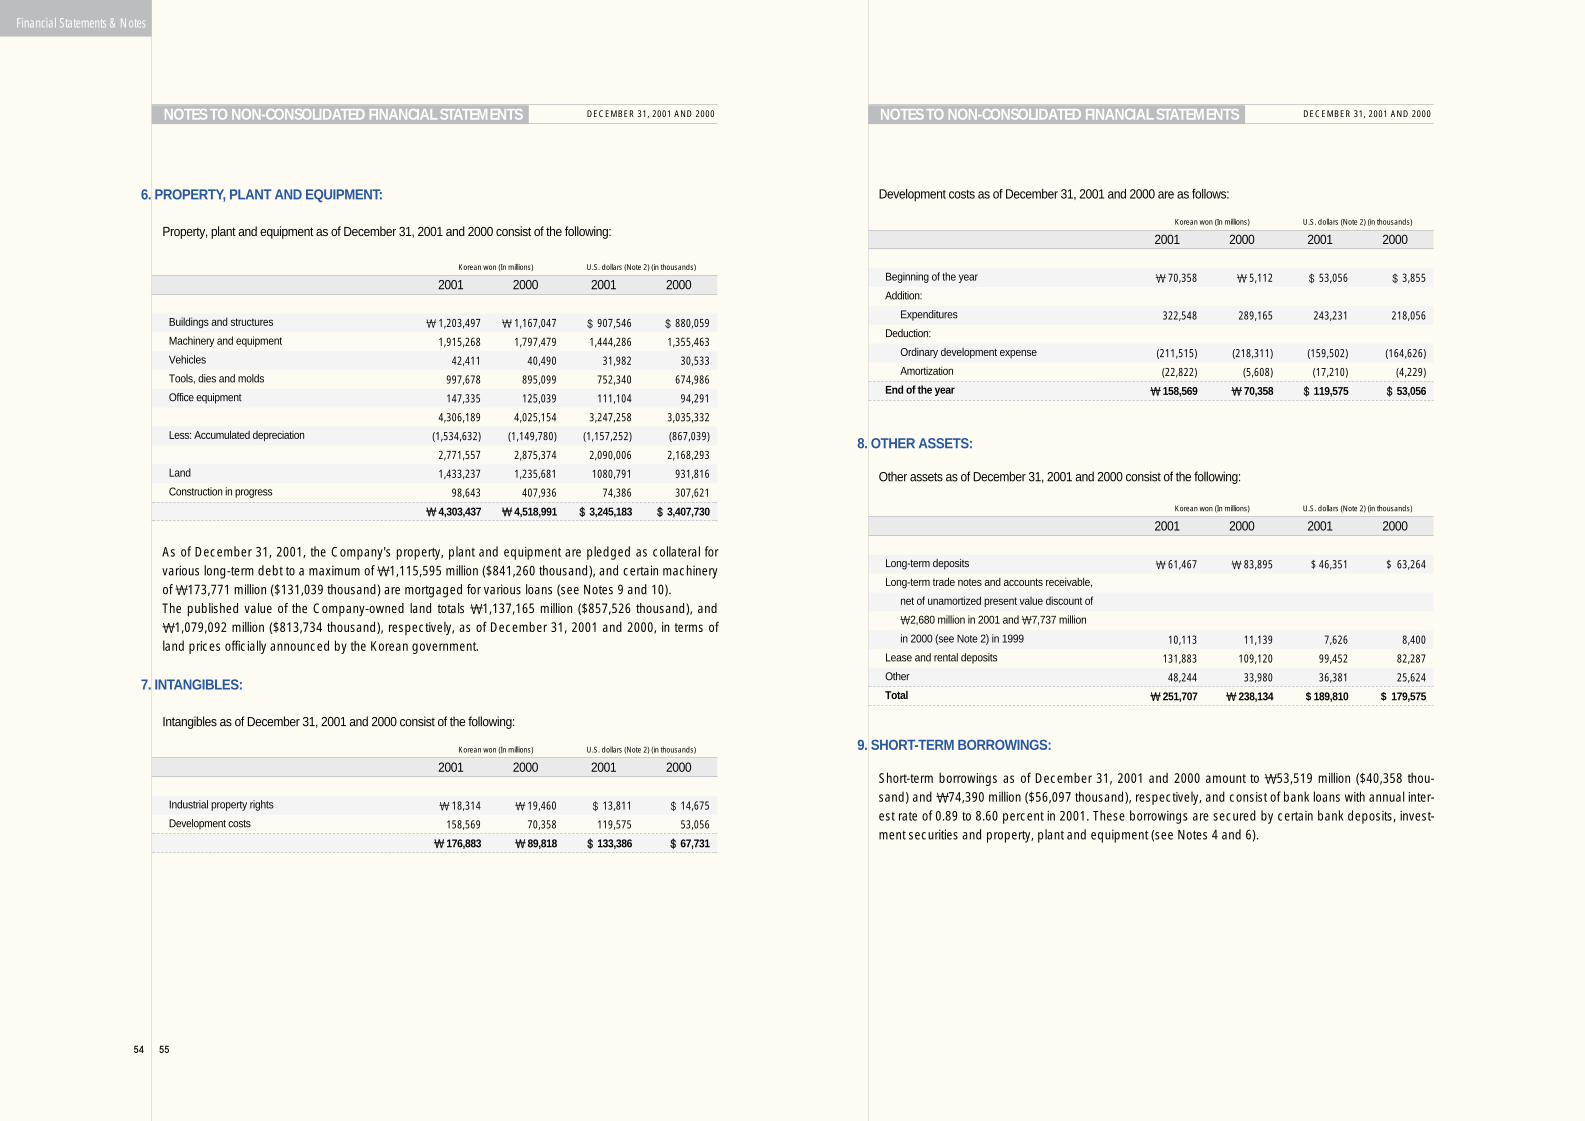
Financial Statements & Notes
54 55
Property, plant and equipment as of December 31, 2001 and 2000 consist of the following:
As of December 31, 2001, the Company's property, plant and equipment are pledged as collateral forvarious long-term debt to a maximum of \1,115,595 million ($841,260 thousand), and certain machineryof \173,771 million ($131,039 thousand) are mortgaged for various loans (see Notes 9 and 10).The published value of the Company-owned land totals \1,137,165 million ($857,526 thousand), and\1,079,092 million ($813,734 thousand), respectively, as of December 31, 2001 and 2000, in terms ofland prices officially announced by the Korean government.
Intangibles as of December 31, 2001 and 2000 consist of the following:
Development costs as of December 31, 2001 and 2000 are as follows:
Other assets as of December 31, 2001 and 2000 consist of the following:
Short-term borrowings as of December 31, 2001 and 2000 amount to \53,519 million ($40,358 thou-sand) and \74,390 million ($56,097 thousand), respectively, and consist of bank loans with annual inter-est rate of 0.89 to 8.60 percent in 2001. These borrowings are secured by certain bank deposits, invest-ment securities and property, plant and equipment (see Notes 4 and 6).
NOTES TO NON-CONSOLIDATED FINANCIAL STATEMENTS DECEMBER 31, 2001 AND 2000 NOTES TO NON-CONSOLIDATED FINANCIAL STATEMENTS DECEMBER 31, 2001 AND 2000
6. PROPERTY, PLANT AND EQUIPMENT:
7. INTANGIBLES:
2001 2000 2001 2000
\ 1,203,497 \ 1,167,047 $ 907,546 $ 880,059
1,915,268 1,797,479 1,444,286 1,355,463
42,411 40,490 31,982 30,533
997,678 895,099 752,340 674,986
147,335 125,039 111,104 94,291
4,306,189 4,025,154 3,247,258 3,035,332
(1,534,632) (1,149,780) (1,157,252) (867,039)
2,771,557 2,875,374 2,090,006 2,168,293
1,433,237 1,235,681 1080,791 931,816
98,643 407,936 74,386 307,621
\\ 4,303,437 \\ 4,518,991 $$ 3,245,183 $$ 3,407,730
Buildings and structures
Machinery and equipment
Vehicles
Tools, dies and molds
Office equipment
Less: Accumulated depreciation
Land
Construction in progress
Korean won (In millions) U.S. dollars (Note 2) (in thousands)
2001 2000 2001 2000
\ 18,314 \ 19,460 $ 13,811 $ 14,675
158,569 70,358 119,575 53,056
\\ 176,883 \\ 89,818 $$ 133,386 $$ 67,731
Industrial property rights
Development costs
Korean won (In millions) U.S. dollars (Note 2) (in thousands)
2001 2000 2001 2000
\ 70,358 \ 5,112 $ 53,056 $ 3,855
322,548 289,165 243,231 218,056
(211,515) (218,311) (159,502) (164,626)
(22,822) (5,608) (17,210) (4,229)
\\ 158,569 \\ 70,358 $$ 119,575 $$ 53,056
Beginning of the year
Addition:
Expenditures
Deduction:
Ordinary development expense
Amortization
End of the year
Korean won (In millions) U.S. dollars (Note 2) (in thousands)
2001 2000 2001 2000
\ 61,467 \ 83,895 $ 46,351 $ 63,264
10,113 11,139 7,626 8,400
131,883 109,120 99,452 82,287
48,244 33,980 36,381 25,624
\\ 251,707 \\ 238,134 $ 189,810 $ 179,575
Long-term deposits
Long-term trade notes and accounts receivable,
net of unamortized present value discount of
\2,680 million in 2001 and \7,737 million
in 2000 (see Note 2) in 1999
Lease and rental deposits
Other
Total
Korean won (In millions) U.S. dollars (Note 2) (in thousands)
8. OTHER ASSETS:
9. SHORT-TERM BORROWINGS:
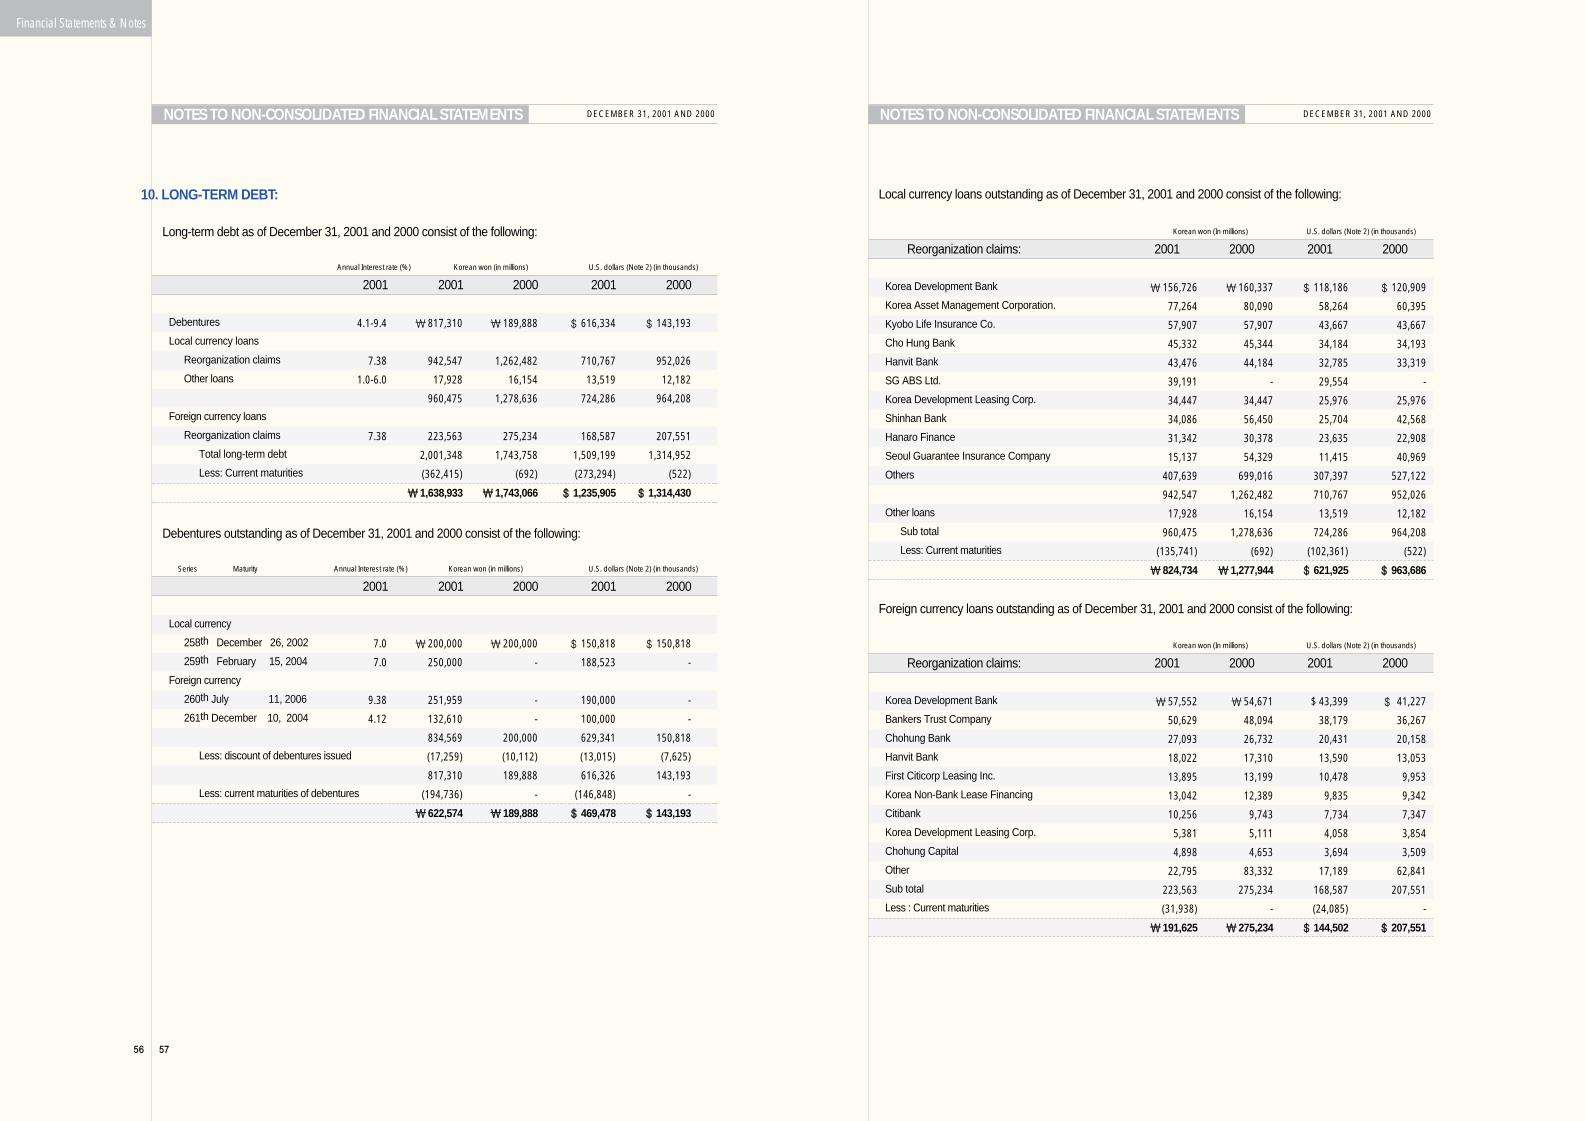
Financial Statements & Notes
56 57
Long-term debt as of December 31, 2001 and 2000 consist of the following:
Debentures outstanding as of December 31, 2001 and 2000 consist of the following:
Local currency loans outstanding as of December 31, 2001 and 2000 consist of the following:
Foreign currency loans outstanding as of December 31, 2001 and 2000 consist of the following:
NOTES TO NON-CONSOLIDATED FINANCIAL STATEMENTS DECEMBER 31, 2001 AND 2000 NOTES TO NON-CONSOLIDATED FINANCIAL STATEMENTS DECEMBER 31, 2001 AND 2000
10. LONG-TERM DEBT:
2001 2001 2000 2001 2000
4.1-9.4 \ 817,310 \ 189,888 $ 616,334 $ 143,193
7.38 942,547 1,262,482 710,767 952,026
1.0-6.0 17,928 16,154 13,519 12,182
960,475 1,278,636 724,286 964,208
7.38 223,563 275,234 168,587 207,551
2,001,348 1,743,758 1,509,199 1,314,952
(362,415) (692) (273,294) (522)
\\ 1,638,933 \\ 1,743,066 $$ 1,235,905 $$ 1,314,430
Debentures
Local currency loans
Reorganization claims
Other loans
Foreign currency loans
Reorganization claims
Total long-term debt
Less: Current maturities
Annual Interest rate (%) Korean won (in millions) U.S. dollars (Note 2) (in thousands)
2001 2001 2000 2001 2000
Local currency
258th December 26, 2002
259th February 15, 2004
Foreign currency
260th July 11, 2006
261th December 10, 2004
Less: discount of debentures issued
Less: current maturities of debentures
Series Maturity Annual Interest rate (%) Korean won (in millions) U.S. dollars (Note 2) (in thousands)
7.0 \ 200,000 \ 200,000 $ 150,818 $ 150,818
7.0 250,000 - 188,523 -
9.38 251,959 - 190,000 -
4.12 132,610 - 100,000 -
834,569 200,000 629,341 150,818
(17,259) (10,112) (13,015) (7,625)
817,310 189,888 616,326 143,193
(194,736) - (146,848) -
\\ 622,574 \\ 189,888 $$ 469,478 $$ 143,193
Reorganization claims: 2001 2000 2001 2000
\ 156,726 \ 160,337 $ 118,186 $ 120,909
77,264 80,090 58,264 60,395
57,907 57,907 43,667 43,667
45,332 45,344 34,184 34,193
43,476 44,184 32,785 33,319
39,191 - 29,554 -
34,447 34,447 25,976 25,976
34,086 56,450 25,704 42,568
31,342 30,378 23,635 22,908
15,137 54,329 11,415 40,969
407,639 699,016 307,397 527,122
942,547 1,262,482 710,767 952,026
17,928 16,154 13,519 12,182
960,475 1,278,636 724,286 964,208
(135,741) (692) (102,361) (522)
\\ 824,734 \\ 1,277,944 $$ 621,925 $$ 963,686
Korea Development Bank
Korea Asset Management Corporation.
Kyobo Life Insurance Co.
Cho Hung Bank
Hanvit Bank
SG ABS Ltd.
Korea Development Leasing Corp.
Shinhan Bank
Hanaro Finance
Seoul Guarantee Insurance Company
Others
Other loans
Sub total
Less: Current maturities
Korean won (In millions) U.S. dollars (Note 2) (in thousands)
Reorganization claims: 2001 2000 2001 2000
\ 57,552 \ 54,671 $ 43,399 $ 41,227
50,629 48,094 38,179 36,267
27,093 26,732 20,431 20,158
18,022 17,310 13,590 13,053
13,895 13,199 10,478 9,953
13,042 12,389 9,835 9,342
10,256 9,743 7,734 7,347
5,381 5,111 4,058 3,854
4,898 4,653 3,694 3,509
22,795 83,332 17,189 62,841
223,563 275,234 168,587 207,551
(31,938) - (24,085) -
\\ 191,625 \\ 275,234 $$ 144,502 $$ 207,551
Korea Development Bank
Bankers Trust Company
Chohung Bank
Hanvit Bank
First Citicorp Leasing Inc.
Korea Non-Bank Lease Financing
Citibank
Korea Development Leasing Corp.
Chohung Capital
Other
Sub total
Less : Current maturities
Korean won (In millions) U.S. dollars (Note 2) (in thousands)

Financial Statements & Notes
58 59
In accordance with the court-approved reorganization plan, the above reorganization claims, with theexception of current maturities, will be repaid over seven years beginning 2002 to 2008, after a 3-yeargrace period. The applicable interest rate is variable depending on the 3-year non-guaranteed bond cir-culating earnings rate.
In addition to the pledged assets explained in Note 6 to the financial statements, cash equivalents andbank deposits of \99 million ($75 thousand), 109 blank checks, 203 blank promissory notes, and 2promissory notes totalling \1,820 million ($1,372 thousand) are pledged as collateral for the short-termborrowings and the long-term local currency and foreign currency loans.
The maturities of long-term debt outstanding as of December 31, 2001 are as follows:
(1) At December 31, 2001, the outstanding balance of accounts receivable from export sales discountedwith recourse amounts to \1,129,803 million ($851,974 thousand).
(2) The Company is contingently liable for payment guarantees of indebtedness, primarily of the follow-ing companies as of December 31, 2001.
(3) The Company uses a customer financing system related to a long-term installment sales system andhas provided guarantees of \202,641 million ($152,810 thousand) to the banks concerned as ofDecember 31, 2001. These guarantees are all covered by insurance contracts, which specifies acustomer and the Company as contractor and beneficiary, respectively.
(4) The Company is a defendant to 2 lawsuits pertaining to the Company's denial of creditors' claim inthe in-court reorganization proceedings amounting to \112,109 million ($84,540 thousand) as ofDecember 31, 2001. In addition, the Company is a defendant in 7 lawsuits for compensation of loss-
es or damages amounting to \7,625 million ($5,750 thousand) as of December 31, 2001. The out-come of those lawsuits is not currently determinable.
Capital stock as of December 31, 2001 and 2000 consist of the following:
In accordance with the court-approved reorganization plan, on February 2, 1999 all issued shares ofcommon stock, except those owned by specific related persons, were reduced by a ratio of 10 to 1, andthe shares owned by the specific related persons were extinguished.
Also, under the court-approved reorganization plan, on March 30, 1999, \5,482,181 million ($4,134,063 thousand) of the Company's debt was forgiven, including its guaranteed obligations, and anadditional \1,799,999 million ($1,357,363 thousand) of its liabilities was converted into capital stock forwhich 119,999,932 new shares were issued at \15,000 per share.
On December 7, 2000, \714 million ($538 thousand) of a creditor's claims in dispute was additionallydetermined by the court as the Company's reorganization claim and converted into capital stock forwhich 142,953 new shares were issued.
In accordance with the take-over contract with the Hyundai Motor Company, representing the HyundaiMotor Consortium, effective December 1, 1998, the Company issued new common stock of 172,431,118shares amounting to \938,656 million ($707,832 thousand) and the Hyundai Motor Consortiumacquired 153,000,000 shares amounting to \841,500 million ($634,568 thousand) for 51 percent as atMarch 30, 1999.
On November 4, 2000, the shareholders of the Company approved the retirement by December 31,2001 of 80 million shares, or 17.8 percent of total common stock issued at the date of shareholders'meeting. In accordance with the consensus reached during the said shareholders' meeting and the pro-visions of the Korean Commercial Code, the Company concluded the stock retirement covering 80 mil-lion treasury shares, which had been reacquired for retirement purposes since the date of the sharehold-ers' meeting. As a result of the stock retirement, the number of the Company's total common sharesissued has been reduced to 369,597,455 shares as of December 31, 2001.
Financial institutions, with loans to the Company which had been forgiven or converted into theCompany's common stock, and Hyundai Motor Consortium were granted rights to subscribe to the reg-istered non-voting preferred stock with a par value of \5,000. On December 28, 1998, the financial insti-tutions acquired rights equal to 10 percent of the forgiven debt and liabilities converted into new capital
NOTES TO NON-CONSOLIDATED FINANCIAL STATEMENTS DECEMBER 31, 2001 AND 2000 NOTES TO NON-CONSOLIDATED FINANCIAL STATEMENTS DECEMBER 31, 2001 AND 2000
Year DebenturesLocal Foreign
Total Total Currency Loans Currency Loans
\ - \ 136,185 \ 31,938 \ 168,123 $ 126,780
382,610 136,825 31,938 551,373 415,785
- 136,572 31,938 168,510 127,072
251,959 415,152 95,811 762,922 575,313
\\ 634,569 \\ 824,734 \\ 191,625 \\ 1,650,928 $$ 1,244,950
2003
2004
2005
Thereafter
Korean won (in millions) U.S. dollars (Note 2) (in thousands)
11. COMMITMENTS AND CONTINGENCIES:
\ 5 $ 4
2,140 1,614
\\ 2,145 $$ 1,618
Kisan Corporation
A.P. Co., Ltd.
Korean won (In millions) U.S. dollars (Note 2) (in thousands)
820,000,000 shares 369,597,455 shares \5,000 \1,847,987 $1,393,550
900,000,000 shares 449,597,455 shares \5,000 \2,247,987 $1,695,187
2001
2000
Authorized Issued Par value
12. CAPITAL STOCK:
Korean won (in millions) U.S. dollars (Note 2) (in thousands)
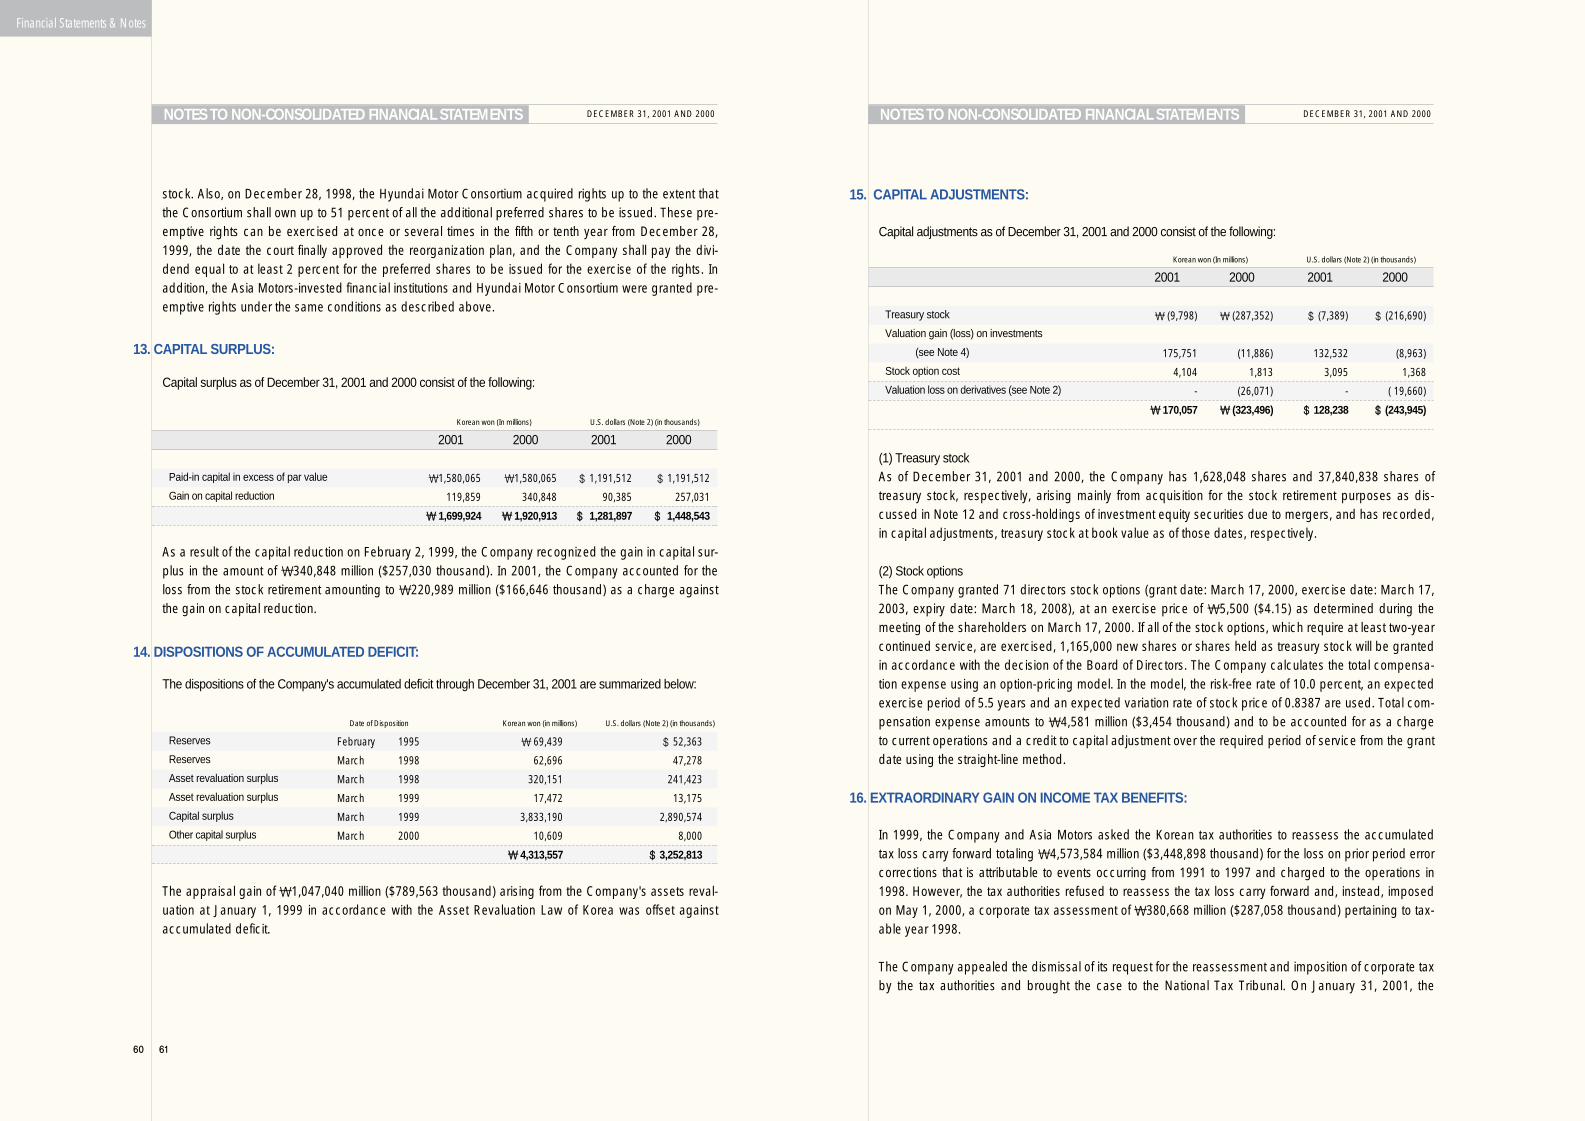
Financial Statements & Notes
60 61
stock. Also, on December 28, 1998, the Hyundai Motor Consortium acquired rights up to the extent thatthe Consortium shall own up to 51 percent of all the additional preferred shares to be issued. These pre-emptive rights can be exercised at once or several times in the fifth or tenth year from December 28,1999, the date the court finally approved the reorganization plan, and the Company shall pay the divi-dend equal to at least 2 percent for the preferred shares to be issued for the exercise of the rights. Inaddition, the Asia Motors-invested financial institutions and Hyundai Motor Consortium were granted pre-emptive rights under the same conditions as described above.
Capital surplus as of December 31, 2001 and 2000 consist of the following:
As a result of the capital reduction on February 2, 1999, the Company recognized the gain in capital sur-plus in the amount of \340,848 million ($257,030 thousand). In 2001, the Company accounted for theloss from the stock retirement amounting to \220,989 million ($166,646 thousand) as a charge againstthe gain on capital reduction.
The dispositions of the Company's accumulated deficit through December 31, 2001 are summarized below:
The appraisal gain of \1,047,040 million ($789,563 thousand) arising from the Company's assets reval-uation at January 1, 1999 in accordance with the Asset Revaluation Law of Korea was offset againstaccumulated deficit.
Capital adjustments as of December 31, 2001 and 2000 consist of the following:
(1) Treasury stock As of December 31, 2001 and 2000, the Company has 1,628,048 shares and 37,840,838 shares oftreasury stock, respectively, arising mainly from acquisition for the stock retirement purposes as dis-cussed in Note 12 and cross-holdings of investment equity securities due to mergers, and has recorded,in capital adjustments, treasury stock at book value as of those dates, respectively.
(2) Stock options The Company granted 71 directors stock options (grant date: March 17, 2000, exercise date: March 17,2003, expiry date: March 18, 2008), at an exercise price of \5,500 ($4.15) as determined during themeeting of the shareholders on March 17, 2000. If all of the stock options, which require at least two-yearcontinued service, are exercised, 1,165,000 new shares or shares held as treasury stock will be grantedin accordance with the decision of the Board of Directors. The Company calculates the total compensa-tion expense using an option-pricing model. In the model, the risk-free rate of 10.0 percent, an expectedexercise period of 5.5 years and an expected variation rate of stock price of 0.8387 are used. Total com-pensation expense amounts to \4,581 million ($3,454 thousand) and to be accounted for as a chargeto current operations and a credit to capital adjustment over the required period of service from the grantdate using the straight-line method.
In 1999, the Company and Asia Motors asked the Korean tax authorities to reassess the accumulatedtax loss carry forward totaling \4,573,584 million ($3,448,898 thousand) for the loss on prior period errorcorrections that is attributable to events occurring from 1991 to 1997 and charged to the operations in1998. However, the tax authorities refused to reassess the tax loss carry forward and, instead, imposedon May 1, 2000, a corporate tax assessment of \380,668 million ($287,058 thousand) pertaining to tax-able year 1998.
The Company appealed the dismissal of its request for the reassessment and imposition of corporate taxby the tax authorities and brought the case to the National Tax Tribunal. On January 31, 2001, the
NOTES TO NON-CONSOLIDATED FINANCIAL STATEMENTS DECEMBER 31, 2001 AND 2000 NOTES TO NON-CONSOLIDATED FINANCIAL STATEMENTS DECEMBER 31, 2001 AND 2000
13. CAPITAL SURPLUS:
15. CAPITAL ADJUSTMENTS:
16. EXTRAORDINARY GAIN ON INCOME TAX BENEFITS:
14. DISPOSITIONS OF ACCUMULATED DEFICIT:
2001 2000 2001 2000
\1,580,065 \1,580,065 $ 1,191,512 $ 1,191,512
119,859 340,848 90,385 257,031
\\ 1,699,924 \\ 1,920,913 $$ 1,281,897 $$ 1,448,543
Paid-in capital in excess of par value
Gain on capital reduction
Korean won (In millions) U.S. dollars (Note 2) (in thousands)
February 1995 \ 69,439 $ 52,363
March 1998 62,696 47,278
March 1998 320,151 241,423
March 1999 17,472 13,175
March 1999 3,833,190 2,890,574
March 2000 10,609 8,000
\\ 4,313,557 $$ 3,252,813
Reserves
Reserves
Asset revaluation surplus
Asset revaluation surplus
Capital surplus
Other capital surplus
Date of Disposition Korean won (in millions) U.S. dollars (Note 2) (in thousands)
2001 2000 2001 2000
\ (9,798) \ (287,352) $ (7,389) $ (216,690)
175,751 (11,886) 132,532 (8,963)
4,104 1,813 3,095 1,368
- (26,071) - ( 19,660)
\\ 170,057 \\ (323,496) $$ 128,238 $$ (243,945)
Treasury stock
Valuation gain (loss) on investments
(see Note 4)
Stock option cost
Valuation loss on derivatives (see Note 2)
Korean won (In millions) U.S. dollars (Note 2) (in thousands)
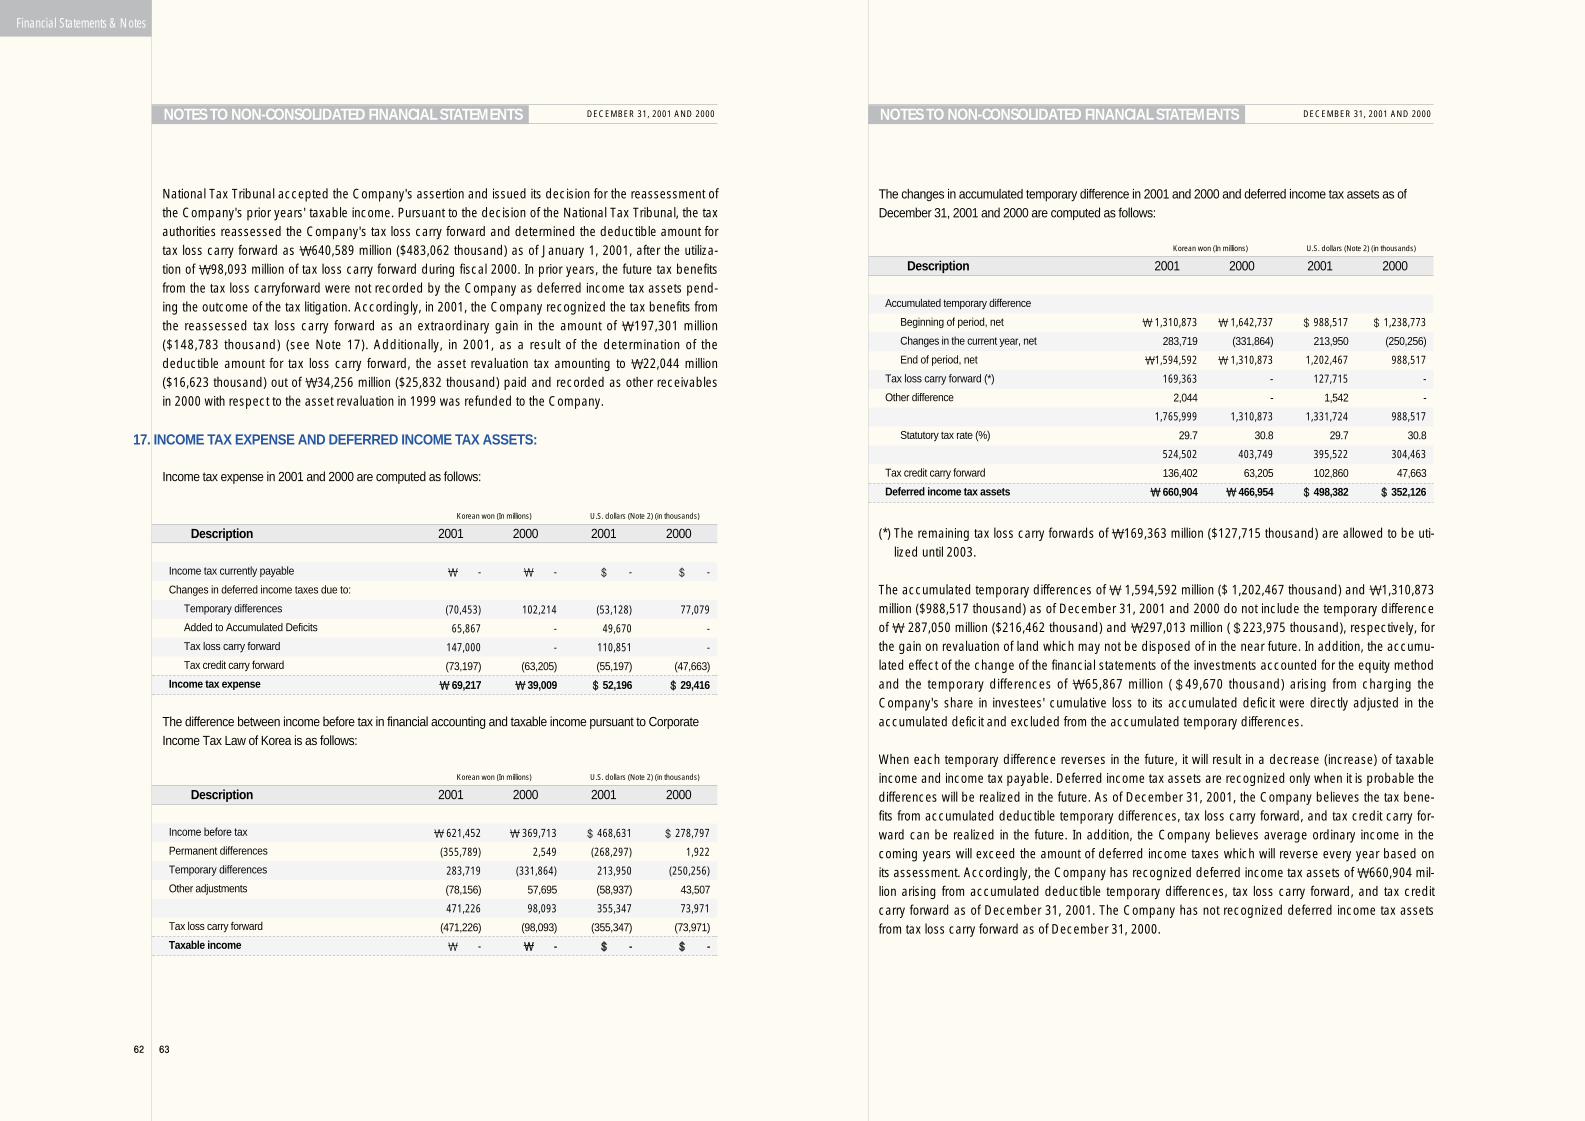
Financial Statements & Notes
62 63
National Tax Tribunal accepted the Company's assertion and issued its decision for the reassessment ofthe Company's prior years' taxable income. Pursuant to the decision of the National Tax Tribunal, the taxauthorities reassessed the Company's tax loss carry forward and determined the deductible amount fortax loss carry forward as \640,589 million ($483,062 thousand) as of January 1, 2001, after the utiliza-tion of \98,093 million of tax loss carry forward during fiscal 2000. In prior years, the future tax benefitsfrom the tax loss carryforward were not recorded by the Company as deferred income tax assets pend-ing the outcome of the tax litigation. Accordingly, in 2001, the Company recognized the tax benefits fromthe reassessed tax loss carry forward as an extraordinary gain in the amount of \197,301 million($148,783 thousand) (see Note 17). Additionally, in 2001, as a result of the determination of thedeductible amount for tax loss carry forward, the asset revaluation tax amounting to \22,044 million($16,623 thousand) out of \34,256 million ($25,832 thousand) paid and recorded as other receivablesin 2000 with respect to the asset revaluation in 1999 was refunded to the Company.
Income tax expense in 2001 and 2000 are computed as follows:
The difference between income before tax in financial accounting and taxable income pursuant to CorporateIncome Tax Law of Korea is as follows:
The changes in accumulated temporary difference in 2001 and 2000 and deferred income tax assets as ofDecember 31, 2001 and 2000 are computed as follows:
(*) The remaining tax loss carry forwards of \169,363 million ($127,715 thousand) are allowed to be uti-lized until 2003.
The accumulated temporary differences of \ 1,594,592 million ($ 1,202,467 thousand) and \1,310,873million ($988,517 thousand) as of December 31, 2001 and 2000 do not include the temporary differenceof \ 287,050 million ($216,462 thousand) and \297,013 million ($223,975 thousand), respectively, forthe gain on revaluation of land which may not be disposed of in the near future. In addition, the accumu-lated effect of the change of the financial statements of the investments accounted for the equity methodand the temporary differences of \65,867 million ($49,670 thousand) arising from charging theCompany's share in investees' cumulative loss to its accumulated deficit were directly adjusted in theaccumulated deficit and excluded from the accumulated temporary differences.
When each temporary difference reverses in the future, it will result in a decrease (increase) of taxableincome and income tax payable. Deferred income tax assets are recognized only when it is probable thedifferences will be realized in the future. As of December 31, 2001, the Company believes the tax bene-fits from accumulated deductible temporary differences, tax loss carry forward, and tax credit carry for-ward can be realized in the future. In addition, the Company believes average ordinary income in thecoming years will exceed the amount of deferred income taxes which will reverse every year based onits assessment. Accordingly, the Company has recognized deferred income tax assets of \660,904 mil-lion arising from accumulated deductible temporary differences, tax loss carry forward, and tax creditcarry forward as of December 31, 2001. The Company has not recognized deferred income tax assetsfrom tax loss carry forward as of December 31, 2000.
NOTES TO NON-CONSOLIDATED FINANCIAL STATEMENTS DECEMBER 31, 2001 AND 2000 NOTES TO NON-CONSOLIDATED FINANCIAL STATEMENTS DECEMBER 31, 2001 AND 2000
17. INCOME TAX EXPENSE AND DEFERRED INCOME TAX ASSETS:
Description 2001 2000 2001 2000
\ - \ - $ - $ -
(70,453) 102,214 (53,128) 77,079
65,867 - 49,670 -
147,000 - 110,851 -
(73,197) (63,205) (55,197) (47,663)
\\ 69,217 \\ 39,009 $$ 52,196 $$ 29,416
Income tax currently payable
Changes in deferred income taxes due to:
Temporary differences
Added to Accumulated Deficits
Tax loss carry forward
Tax credit carry forward
Income tax expense
Korean won (In millions) U.S. dollars (Note 2) (in thousands)
Description 2001 2000 2001 2000
\ 621,452 \ 369,713 $ 468,631 $ 278,797
(355,789) 2,549 (268,297) 1,922
283,719 (331,864) 213,950 (250,256)
(78,156) 57,695 (58,937) 43,507
471,226 98,093 355,347 73,971
(471,226) (98,093) (355,347) (73,971)
\ - \\ - $$ - $$ -
Income before tax
Permanent differences
Temporary differences
Other adjustments
Tax loss carry forward
Taxable income
Korean won (In millions) U.S. dollars (Note 2) (in thousands)
Description 2001 2000 2001 2000
\ 1,310,873 \ 1,642,737 $ 988,517 $ 1,238,773
283,719 (331,864) 213,950 (250,256)
\1,594,592 \ 1,310,873 1,202,467 988,517
169,363 - 127,715 -
2,044 - 1,542 -
1,765,999 1,310,873 1,331,724 988,517
29.7 30.8 29.7 30.8
524,502 403,749 395,522 304,463
136,402 63,205 102,860 47,663
\\ 660,904 \\ 466,954 $$ 498,382 $$ 352,126
Accumulated temporary difference
Beginning of period, net
Changes in the current year, net
End of period, net
Tax loss carry forward (*)
Other difference
Statutory tax rate (%)
Tax credit carry forward
Deferred income tax assets
Korean won (In millions) U.S. dollars (Note 2) (in thousands)
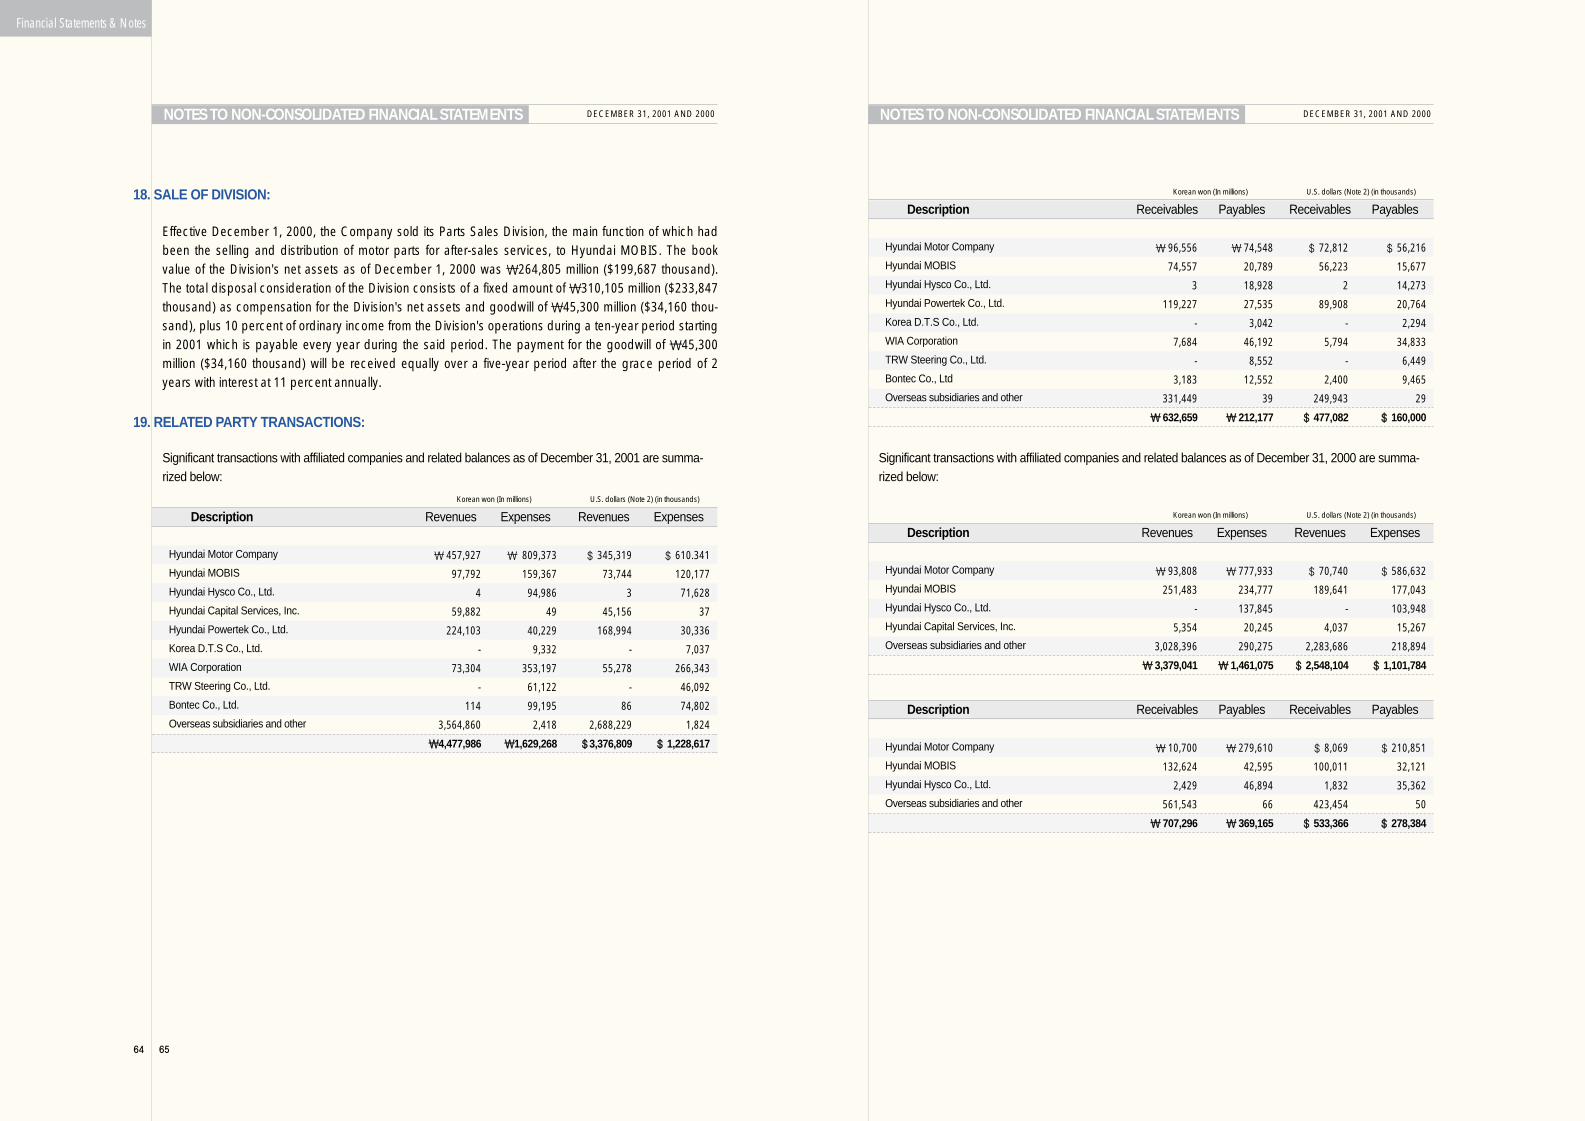
Financial Statements & Notes
64 65
Effective December 1, 2000, the Company sold its Parts Sales Division, the main function of which hadbeen the selling and distribution of motor parts for after-sales services, to Hyundai MOBIS. The bookvalue of the Division's net assets as of December 1, 2000 was \264,805 million ($199,687 thousand).The total disposal consideration of the Division consists of a fixed amount of \310,105 million ($233,847thousand) as compensation for the Division's net assets and goodwill of \45,300 million ($34,160 thou-sand), plus 10 percent of ordinary income from the Division's operations during a ten-year period startingin 2001 which is payable every year during the said period. The payment for the goodwill of \45,300million ($34,160 thousand) will be received equally over a five-year period after the grace period of 2years with interest at 11 percent annually.
Significant transactions with affiliated companies and related balances as of December 31, 2001 are summa-rized below:
Significant transactions with affiliated companies and related balances as of December 31, 2000 are summa-rized below:
NOTES TO NON-CONSOLIDATED FINANCIAL STATEMENTS DECEMBER 31, 2001 AND 2000 NOTES TO NON-CONSOLIDATED FINANCIAL STATEMENTS DECEMBER 31, 2001 AND 2000
18. SALE OF DIVISION:
19. RELATED PARTY TRANSACTIONS:
Description Revenues Expenses Revenues Expenses
\ 457,927 \ 809,373 $ 345,319 $ 610.341
97,792 159,367 73,744 120,177
4 94,986 3 71,628
59,882 49 45,156 37
224,103 40,229 168,994 30,336
- 9,332 - 7,037
73,304 353,197 55,278 266,343
- 61,122 - 46,092
114 99,195 86 74,802
3,564,860 2,418 2,688,229 1,824
\\4,477,986 \\1,629,268 $$3,376,809 $$ 1,228,617
Hyundai Motor Company
Hyundai MOBIS
Hyundai Hysco Co., Ltd.
Hyundai Capital Services, Inc.
Hyundai Powertek Co., Ltd.
Korea D.T.S Co., Ltd.
WIA Corporation
TRW Steering Co., Ltd.
Bontec Co., Ltd.
Overseas subsidiaries and other
Korean won (In millions) U.S. dollars (Note 2) (in thousands)
Description Receivables Payables Receivables Payables
\ 96,556 \ 74,548 $ 72,812 $ 56,216
74,557 20,789 56,223 15,677
3 18,928 2 14,273
119,227 27,535 89,908 20,764
- 3,042 - 2,294
7,684 46,192 5,794 34,833
- 8,552 - 6,449
3,183 12,552 2,400 9,465
331,449 39 249,943 29
\\ 632,659 \\ 212,177 $$ 477,082 $$ 160,000
Hyundai Motor Company
Hyundai MOBIS
Hyundai Hysco Co., Ltd.
Hyundai Powertek Co., Ltd.
Korea D.T.S Co., Ltd.
WIA Corporation
TRW Steering Co., Ltd.
Bontec Co., Ltd
Overseas subsidiaries and other
Korean won (In millions) U.S. dollars (Note 2) (in thousands)
Description Revenues Expenses Revenues Expenses
\ 93,808 \ 777,933 $ 70,740 $ 586,632
251,483 234,777 189,641 177,043
- 137,845 - 103,948
5,354 20,245 4,037 15,267
3,028,396 290,275 2,283,686 218,894
\\ 3,379,041 \\ 1,461,075 $$ 2,548,104 $$ 1,101,784
Hyundai Motor Company
Hyundai MOBIS
Hyundai Hysco Co., Ltd.
Hyundai Capital Services, Inc.
Overseas subsidiaries and other
Korean won (In millions) U.S. dollars (Note 2) (in thousands)
Description Receivables Payables Receivables Payables
\ 10,700 \ 279,610 $ 8,069 $ 210,851
132,624 42,595 100,011 32,121
2,429 46,894 1,832 35,362
561,543 66 423,454 50
\\ 707,296 \\ 369,165 $$ 533,366 $$ 278,384
Hyundai Motor Company
Hyundai MOBIS
Hyundai Hysco Co., Ltd.
Overseas subsidiaries and other

Financial Statements & Notes
66 67
The following is a summary of the assets and liabilities denominated in foreign currencies as ofDecember 31, 2001 and 2000.
The accounts and amounts needed for calculation of value added are as follows:
Selling and administrative expenses are as follows:
The following is a summary of sales by geographic area in 2001 and 2000.
NOTES TO NON-CONSOLIDATED FINANCIAL STATEMENTS DECEMBER 31, 2001 AND 2000 NOTES TO NON-CONSOLIDATED FINANCIAL STATEMENTS DECEMBER 31, 2001 AND 2000
20. FOREIGN CURRENCY DENOMINATED ASSETS AND LIABILITIES: 22. SELLING AND ADMINISTRATIVE EXPENSE:
21. SUPPLEMENTARY INFORMATION FOR COMPUTATION OF VALUE ADDED:
2001 2000 2001 2000
US $ 400,114 US $ 556,088 \ 530,560 \ 700,504
DEM 150,392 DEM 133,485 90,166 81,031
JP¥ - JP¥ 48,996 - 540
CAD 63,866 CAD 124,647 53,222 104,741
EU 24,096 - 28,254 -
US $ 518,527 US $ 247,138 \ 687,620 \ 311,320
DEM 9,416 DEM 9,202 5,644 5,586
JP¥ 11,019,940 JP¥ 10,532,248 111,235 116,015
FRF 15,116 FRF 145 2,702 26
EU 14,960 - 17,543 -
Assets
Liabilities
Foreign Currency (in thousand) Korean won (in millions)
2001 2000 2001 2000
\ 424,151 \ 369,713 $ 319,848 $ 278,797
1,362,850 1,364,367 1,027,713 1,028,857
75,455 98,623 56,900 74,371
10,580 9,380 7,978 7,073
20,373 19,598 15,363 14,779
452,117 418,229 340,937 315,383
\\ 2,345,526 \\ 2,279,910 $$ 1,768,739 $$ 1,719,260
Ordinary income
Labor costs
Interest expense, net
Rent
Taxes and dues
Depreciation
Korean won (In millions) U.S. dollars (Note 2) (in thousands)
2001 2000 2001 2000
\ 340,762 \ 343,113 $ 256,966 $ 258,738
209,699 193,540 158,132 145,947
14,996 14,916 11,308 11,248
11,471 13,386 8,650 10,094
7,548 8,642 5,692 6,517
9,148 9,143 6,898 6,895
10,147 8,594 7,652 6,481
23,905 25,602 18,027 19,306
2,936 2,927 2,214 2,207
71,273 77,629 53,746 58,539
35,693 42,126 26,916 31,767
5,196 5,265 3,918 3,970
67,161 54,879 50,646 41,384
5,674 5,366 4,279 4,046
73,425 64,708 55,370 48,796
192,761 83,497 145,359 62,964
293,532 270,872 221,350 204,262
521,095 290,392 392,953 218,982
168,676 - 127,197 -
10,249 12,229 7,728 9,223
\\ 2,075,347 \\1,526,826 $$ 1,565,001 $$1,151,366
Salaries and wages
Sales promotion
Travel
Communications
Utilities
Taxes and dues
Rent
Depreciation and amortization
Repairs and maintenance
Advertising
Freight
Supplies and stationery
Commissions and fees
Education and training
Ordinary research and development
Overseas marketing
Export expenses
Warranty
Provision for doubtful accounts
Miscellaneous
Korean won (In millions) U.S. dollars (Note 2) (in thousands)
23. GEOGRAPHIC SEGMENT INFORMATION:
2001 2000 2001 2000
\ 6,354,101 \ 6,049,776 $ 4,791,570 $ 4,562,081
3,326,627 2,380,400 2,508,579 1,795,038
473,826 366,400 357,308 276,299
1,022,245 902,100 770,866 680,266
1,179,547 1,107,369 889,486 835,057
6,002,245 4,756,269 4,526,239 3,586,660
\\ 12,356,346 \\ 10,806,045 $$ 9,317,809 $$8,148,741
Domestic sales
Export sales
North America
Middle and south America
Europe
Other
Korean won (In millions) U.S. dollars (Note 2) (in thousands)

K i a M o t o r s a n n u a l r e p o r t 2001Kia Motors' Major Export Lineup
■Optima Regal
■Optima / Magentis
■Spectra / Sephia II
■Rio
■Sorento
■Sportage
■Carens
■Carnival / Sedona
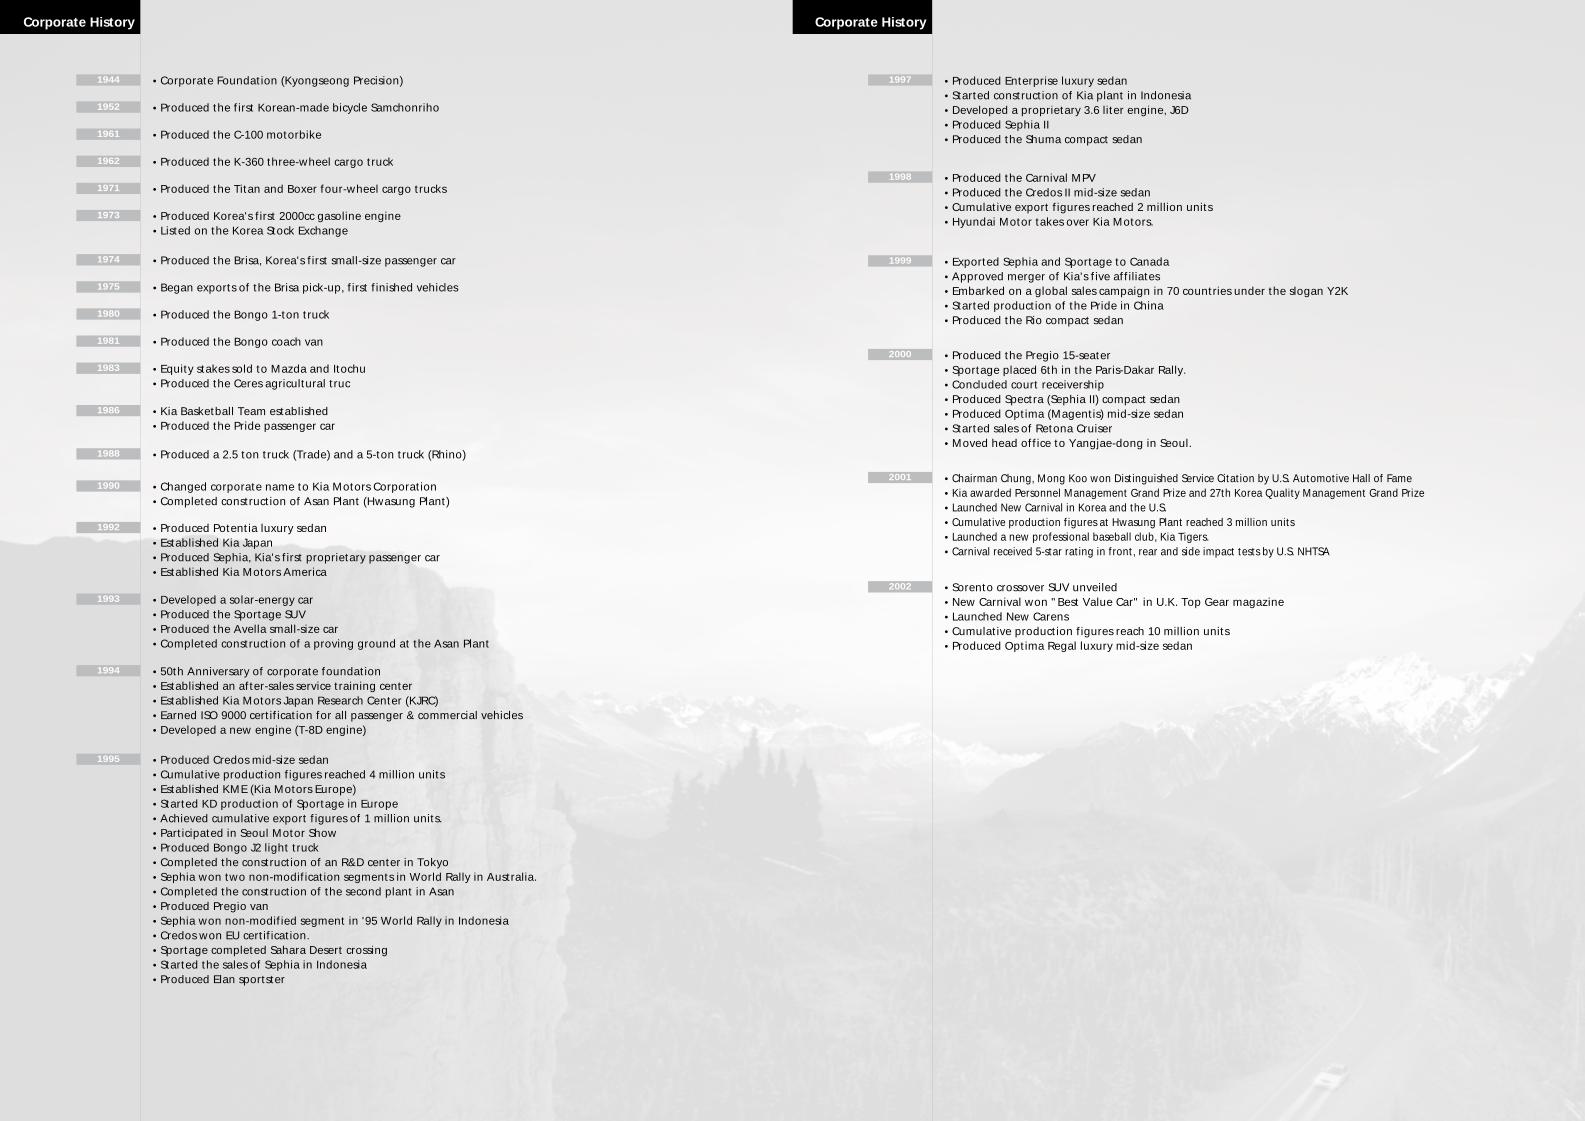
1944 �Corporate Foundation (Kyongseong Precision)
1952 �Produced the first Korean-made bicycle Samchonriho
1961 �Produced the C-100 motorbike
1962 �Produced the K-360 three-wheel cargo truck
1971 �Produced the Titan and Boxer four-wheel cargo trucks
1973 �Produced Korea's first 2000cc gasoline engine �Listed on the Korea Stock Exchange
1974 �Produced the Brisa, Korea's first small-size passenger car
1975 �Began exports of the Brisa pick-up, first finished vehicles
1980 �Produced the Bongo 1-ton truck
1981 �Produced the Bongo coach van
1983 �Equity stakes sold to Mazda and Itochu �Produced the Ceres agricultural truc
1986 �Kia Basketball Team established �Produced the Pride passenger car
1988 �Produced a 2.5 ton truck (Trade) and a 5-ton truck (Rhino)
1990 �Changed corporate name to Kia Motors Corporation�Completed construction of Asan Plant (Hwasung Plant)
1992 �Produced Potentia luxury sedan �Established Kia Japan�Produced Sephia, Kia's first proprietary passenger car �Established Kia Motors America
1993 �Developed a solar-energy car �Produced the Sportage SUV �Produced the Avella small-size car �Completed construction of a proving ground at the Asan Plant
1994 �50th Anniversary of corporate foundation�Established an after-sales service training center�Established Kia Motors Japan Research Center (KJRC) �Earned ISO 9000 certification for all passenger & commercial vehicles �Developed a new engine (T-8D engine)
1995 �Produced Credos mid-size sedan�Cumulative production figures reached 4 million units�Established KME (Kia Motors Europe)�Started KD production of Sportage in Europe�Achieved cumulative export figures of 1 million units.�Participated in Seoul Motor Show�Produced Bongo J2 light truck�Completed the construction of an R&D center in Tokyo�Sephia won two non-modification segments in World Rally in Australia.�Completed the construction of the second plant in Asan�Produced Pregio van�Sephia won non-modified segment in '95 World Rally in Indonesia�Credos won EU certification.�Sportage completed Sahara Desert crossing�Started the sales of Sephia in Indonesia �Produced Elan sportster
Corporate History Corporate History
1997 �Produced Enterprise luxury sedan�Started construction of Kia plant in Indonesia�Developed a proprietary 3.6 liter engine, J6D�Produced Sephia II�Produced the Shuma compact sedan
1998 �Produced the Carnival MPV�Produced the Credos II mid-size sedan�Cumulative export figures reached 2 million units�Hyundai Motor takes over Kia Motors.
1999 �Exported Sephia and Sportage to Canada�Approved merger of Kia's five affiliates�Embarked on a global sales campaign in 70 countries under the slogan Y2K�Started production of the Pride in China�Produced the Rio compact sedan
2000 �Produced the Pregio 15-seater�Sportage placed 6th in the Paris-Dakar Rally.�Concluded court receivership�Produced Spectra (Sephia II) compact sedan�Produced Optima (Magentis) mid-size sedan�Started sales of Retona Cruiser�Moved head office to Yangjae-dong in Seoul.
2001
2002
�Chairman Chung, Mong Koo won Distinguished Service Citation by U.S. Automotive Hall of Fame �Kia awarded Personnel Management Grand Prize and 27th Korea Quality Management Grand Prize�Launched New Carnival in Korea and the U.S.�Cumulative production figures at Hwasung Plant reached 3 million units�Launched a new professional baseball club, Kia Tigers.�Carnival received 5-star rating in front, rear and side impact tests by U.S. NHTSA
�Sorento crossover SUV unveiled�New Carnival won "Best Value Car" in U.K. Top Gear magazine�Launched New Carens�Cumulative production figures reach 10 million units�Produced Optima Regal luxury mid-size sedan