Embed Size (px)
Citation preview

20 February 2020
Our Reference: 64014-19-BILR-1Rev0_200220
Harriet Davie Specialist Biological Sciences Roy Hill Pty Ltd 5 Whitham Road Perth Airport WA 6105
Dear Harriet,
Re: Remote Managed Aquifer Recharge Baseline and South West Injection Borefield Annual Vegetation Health Monitoring – Groundwater Dependent Vegetation Classification, February 2020
1 Introduction
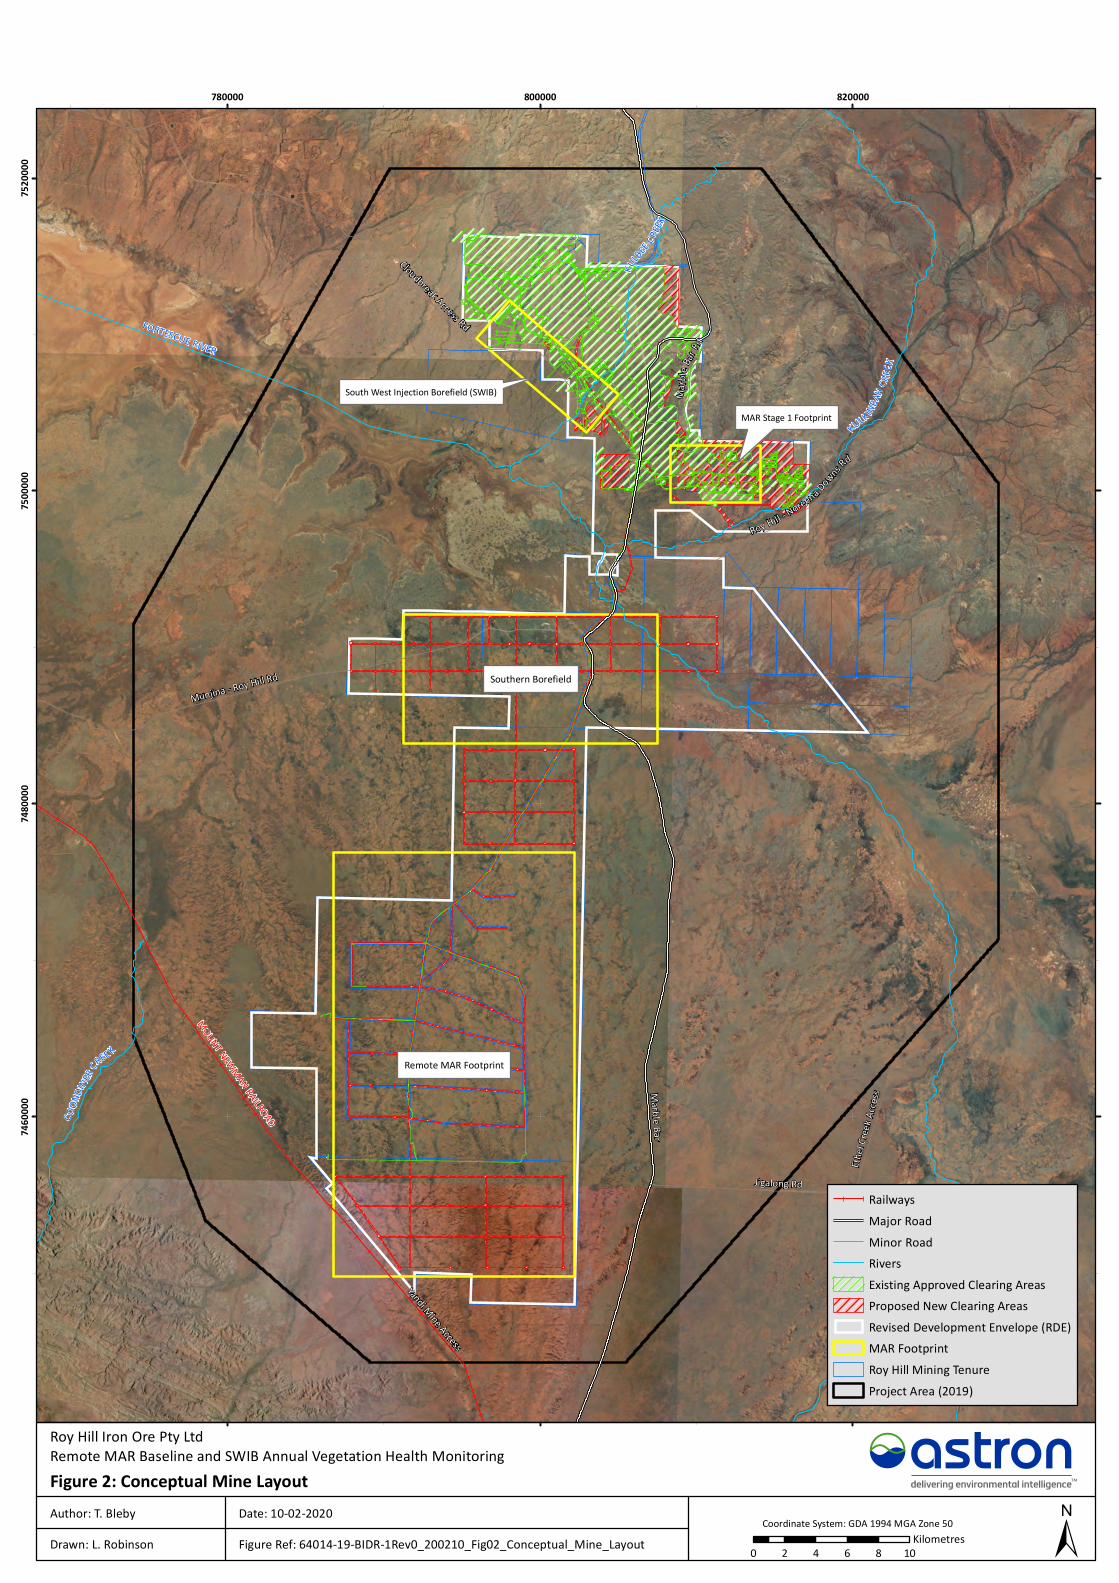
Since 2015, Astron has developed a series of groundwater dependent vegetation (GDV) classifications for Roy Hill to support vegetation mapping and health and condition monitoring via remote sensing. The most recent GDV classification was completed in 2017 over an area of 27,642 ha using Worldview 2 satellite imagery (see Figure 1). In 2018 and 2019 Roy Hill captured a larger area of Worldview 3 (WV3) imagery (338,943 ha) to cover the entire area for the Life of Mine (LOM) Water Management Strategy Vegetation Risk Assessment (Astron Environmental Services 2019) (see Figure 1). This area is referred to as the 'project area' in this report. Figure 2 also shows the conceptual mine layout in the project area. Roy Hill has requested Astron to re-run the GDV classification across the project area for 2019 using the latest WV3 imagery.
GDV is defined as vegetation that is dependent on the presence of groundwater to meet some or all of its water requirements (Orellana et al. 2012). It is commonly associated with riparian zones where groundwater is present at shallower depth. Key tree species that occur in riparian areas and are known to be potential GDV include Eucalyptus camaldulensis (River Red Gum), Eucalyptus victrix (Coolibah) and Melaleuca argentea. There are also other species in the Pilbara which may be groundwater dependent which may occur outside the riparian zone in areas where groundwater is shallow enough (generally within 10 m to 15 m of the surface) to be potentially accessible by plant roots. By far the most common GDV species present in the Roy Hill region is E. victrix, with relatively fewer scattered populations of E. camaldulensis and very few if any known occurrences of M. argentea.
Astron has developed a methodology to map the three most common species of GDV across large zones within the Pilbara. This report details the methodology used and provides example maps of the outputs for the Roy Hill project area.

MAR Stage 1 Footprint
MOUNT NEWMAN RAILROAD
Marble Bar
Jigalong Rd
Yandi Mine Access
Cloudbreak Access Rd
Munjina - Roy Hill Rd
Roy Hill - NoreenaDo
wnsRd
Marb l
e Bar R
d
Ethel C
reek A
ccess
FORTESCUE RIVER
K ULKINB
AHCR
EEK
COON
DINER
CREEK
South West Injection Borefield (SWIB)
Remote MAR Footprint
Southern Borefield
780000 800000 820000
74600
00748
0000
75000
00752
0000
±0 2 4 6 8 10Kilometres
Figure 1: Project Area LocationAuthor: T. Bleby Date: 10-02-2020 Coordinate System: GDA 1994 MGA Zone 50Drawn: L. Robinson Figure Ref: 64014-19-BIDR-1Rev0_200210_Fig01_Locn
Roy Hill Iron Ore Pty LtdRemote MAR Baseline and SWIB Annual Vegetation Health Monitoring
Major RoadMinor RoadRailwaysRiversFortescue MarshRevised Development Envelope (RDE)MAR FootprintRoy Hill Mining TenureProject Area (2017)Project Area (2019)
MAR Stage 1 Footprint
South West Injection Borefield (SWIB)
MOUNT NEWMAN RAILROAD
Marble Bar
Yandi Mine Access
Jigalong Rd
Cloudbreak Access Rd
Munjina - Roy Hill Rd
Roy Hill - Noreena Downs Rd
Marbl
e Bar R
d
Ethel C
reek A
ccess
FORTESCUE RIVER
KULK INBAH
CREEK
KULBEE CREE
K
COON
DINER
CREEK
Remote MAR Footprint
Southern Borefield
780000 800000 820000
74600
00748
0000
75000
00752
0000
±0 2 4 6 8 10Kilometres
Figure 2: Conceptual Mine LayoutAuthor: T. Bleby Date: 10-02-2020 Coordinate System: GDA 1994 MGA Zone 50Drawn: L. Robinson Figure Ref: 64014-19-BIDR-1Rev0_200210_Fig02_Conceptual_Mine_Layout
Roy Hill Iron Ore Pty LtdRemote MAR Baseline and SWIB Annual Vegetation Health Monitoring
RailwaysMajor RoadMinor RoadRiversExisting Approved Clearing AreasProposed New Clearing AreasRevised Development Envelope (RDE)MAR FootprintRoy Hill Mining TenureProject Area (2019)

Roy Hill Iron Ore Remote Managed Aquifer Recharge Baseline and South West Injection Borefield Annual Vegetation Health Monitoring – Groundwater Dependent Vegetation Classification, February 2020
Page | 4
2 Methods
2.1 Satellite Imagery
WV3 satellite data was captured over the area of interest (338,943 ha) on 6 October 2019 and 25 October 2019. These images were combined to produce a mosaic to classify GDV. The WV3 imagery is captured at 1.2 m resolution across eight multispectral bands and complimented with a 0.3 m panchromatic band used to create a 0.3 m ‘enhanced’ Red-Green-Blue (RGB) image for viewing purposes. Data capture and image pre-processing was completed by Geoimage Pty Ltd. Imagery was initially provided to Roy Hill, and then to Astron. Pre-processing included orthorectification, atmospheric correction and colour balancing.
2.2 Classification of GDV
There are four main stages in the classification workflow used for this project, shown in Figure 2. These include:
1. calculation of the Modified Soil Adjusted Vegetation Index (MSAVI)
2. segmentation into tree canopies
3. classification of GDV using machine learning
4. manual quality checking of machine learning outputs.
Figure 3: Workflow for GDV classification (left) and example output of classification results displayed with MSAVI values.
2.2.1 Calculation of Vegetation Indices (Stage 1)
Remote sensing vegetation indices combine different portions of the electromagnetic spectrum to enable classification and quantification of amounts of vegetation. MSAVI uses the red and near-infrared portions of the electromagnetic spectrum, and relies on vegetation with photosynthetically active leaves having a higher reflectance in the near-infrared spectral band and lower red reflectance. MSAVI was developed to account for the effect of soil brightness on the reflectance
Roy Hill Iron Ore Remote Managed Aquifer Recharge Baseline and South West Injection Borefield Annual Vegetation Health Monitoring – Groundwater Dependent Vegetation Classification, February 2020
Page | 5
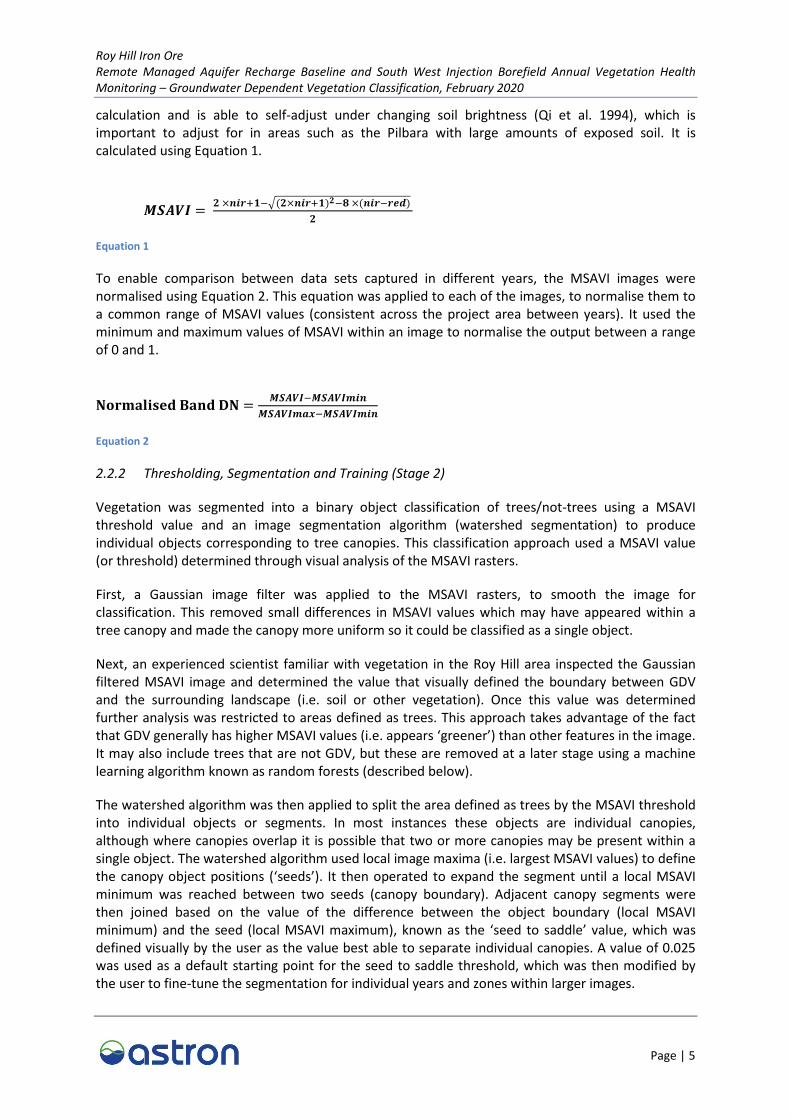
calculation and is able to self-adjust under changing soil brightness (Qi et al. 1994), which is important to adjust for in areas such as the Pilbara with large amounts of exposed soil. It is calculated using Equation 1.
𝑴𝑴𝑴𝑴𝑴𝑴𝑴𝑴𝑴𝑴 = 𝟐𝟐 ×𝒏𝒏𝒏𝒏𝒏𝒏+𝟏𝟏−�(𝟐𝟐×𝒏𝒏𝒏𝒏𝒏𝒏+𝟏𝟏)𝟐𝟐−𝟖𝟖 ×(𝒏𝒏𝒏𝒏𝒏𝒏−𝒏𝒏𝒓𝒓𝒓𝒓) 𝟐𝟐
Equation 1
To enable comparison between data sets captured in different years, the MSAVI images were normalised using Equation 2. This equation was applied to each of the images, to normalise them to a common range of MSAVI values (consistent across the project area between years). It used the minimum and maximum values of MSAVI within an image to normalise the output between a range of 0 and 1.
𝐍𝐍𝐍𝐍𝐍𝐍𝐍𝐍𝐍𝐍𝐍𝐍𝐍𝐍𝐍𝐍𝐍𝐍𝐍𝐍 𝐁𝐁𝐍𝐍𝐁𝐁𝐍𝐍 𝐃𝐃𝐍𝐍 = 𝑴𝑴𝑴𝑴𝑴𝑴𝑴𝑴𝑴𝑴−𝑴𝑴𝑴𝑴𝑴𝑴𝑴𝑴𝑴𝑴𝑴𝑴𝒏𝒏𝒏𝒏𝑴𝑴𝑴𝑴𝑴𝑴𝑴𝑴𝑴𝑴𝑴𝑴𝑴𝑴𝑴𝑴−𝑴𝑴𝑴𝑴𝑴𝑴𝑴𝑴𝑴𝑴𝑴𝑴𝒏𝒏𝒏𝒏
Equation 2
2.2.2 Thresholding, Segmentation and Training (Stage 2)
Vegetation was segmented into a binary object classification of trees/not-trees using a MSAVI threshold value and an image segmentation algorithm (watershed segmentation) to produce individual objects corresponding to tree canopies. This classification approach used a MSAVI value (or threshold) determined through visual analysis of the MSAVI rasters.
First, a Gaussian image filter was applied to the MSAVI rasters, to smooth the image for classification. This removed small differences in MSAVI values which may have appeared within a tree canopy and made the canopy more uniform so it could be classified as a single object.
Next, an experienced scientist familiar with vegetation in the Roy Hill area inspected the Gaussian filtered MSAVI image and determined the value that visually defined the boundary between GDV and the surrounding landscape (i.e. soil or other vegetation). Once this value was determined further analysis was restricted to areas defined as trees. This approach takes advantage of the fact that GDV generally has higher MSAVI values (i.e. appears ‘greener’) than other features in the image. It may also include trees that are not GDV, but these are removed at a later stage using a machine learning algorithm known as random forests (described below).
The watershed algorithm was then applied to split the area defined as trees by the MSAVI threshold into individual objects or segments. In most instances these objects are individual canopies, although where canopies overlap it is possible that two or more canopies may be present within a single object. The watershed algorithm used local image maxima (i.e. largest MSAVI values) to define the canopy object positions (‘seeds’). It then operated to expand the segment until a local MSAVI minimum was reached between two seeds (canopy boundary). Adjacent canopy segments were then joined based on the value of the difference between the object boundary (local MSAVI minimum) and the seed (local MSAVI maximum), known as the ‘seed to saddle’ value, which was defined visually by the user as the value best able to separate individual canopies. A value of 0.025 was used as a default starting point for the seed to saddle threshold, which was then modified by the user to fine-tune the segmentation for individual years and zones within larger images.

Roy Hill Iron Ore Remote Managed Aquifer Recharge Baseline and South West Injection Borefield Annual Vegetation Health Monitoring – Groundwater Dependent Vegetation Classification, February 2020
Page | 6
Once the thresholds for MSAVI masking and segmentation were determined, images were processed to create vector canopy shapefiles for each zone-epoch.
2.2.3 Classification of Groundwater Dependent Vegetation (Stage 3)
In stage 3, a machine learning approach was used to classify canopies into potentially groundwater dependent tree species or other vegetation.
Training data for the machine learning algorithm was collected from the previous GDV pre-classification completed for Roy Hill in late 2018 (Astron Environmental Services 2018) using a random sample of 4,000 segments with a 50-50 percent split between GDV and non-GDV. An additional 7,000 segments were manually selected that captured tree boundaries in the areas outside the previous Roy Hill GDV classification, the values of which were set to either GDV or non-GDV based on visual inspection. In total, 11,000 segments of GDV and non-GDV data were produced as training data. These segments were used to extract the average and standard deviation values for each of the eight WV3 image bands plus the MSAVI image. These values were then fed into the machine learning classifier for GDV.
The machine learning approach used was an ensemble method that used multiple techniques in sequence to produce an output classification probability. The advantage of this approach is that each classifier is able to explain different portions of variability in the classifier model, and that by combining the classifiers a better overall result is achieved. The methods used in this case were: Gaussian Naive Bayes; k-Nearest Neighbours; Logistic Regression; Multi-layer Perceptron Neural Network; Gradient Boosting Classifier and Random Forests. The input training data was further split into a test data set used for assessing the accuracy of the output classifier model (n = 1,100 features), with this data withheld from the classifier for training. The Super Learner algorithm was then used to determine the optimal weighted average of each model (the ensemble) to produce the final classification probability for each segment being GDV.
Finally, a probability threshold was visually identified and used as the cut-off for including segments as GDV. Segments with probabilities below this default threshold were excluded from the classification.
2.2.4 Quality Assurance Checks (between Stage 3 and Stage 4)
A quality assurance check was undertaken which involved ensuring that the vector datasets were representative of the underlying imagery, and that the classification results were acceptable. Quality assurance checking was also carried out to ensure that other plant species captured at the MSAVI thresholding and segmentation stage were removed by the classification stage in the majority of cases. In certain instances, the spectral signature, i.e. the individual band and MSAVI values, were too similar, and additional manual ‘cleaning’ of the canopy vectors was required. This was completed for the Roy Hill data set to remove obviously incorrectly classified canopies and to include any significant and obvious GDV tree canopies that were otherwise missed, using expert site knowledge from the Astron field team (Dr Tim Bleby, Dr Paul Drake and Kyle Mart).
2.2.5 Population of Attributes (Stage 4)
In stage 4, GIS files containing the tree canopy vectors were updated with attributes including MSAVI values, ready for use in future Roy Hill projects and on-going projects such as the annual vegetation health monitoring program.

Roy Hill Iron Ore Remote Managed Aquifer Recharge Baseline and South West Injection Borefield Annual Vegetation Health Monitoring – Groundwater Dependent Vegetation Classification, February 2020
Page | 7
3 Results
Example maps showing the final Roy Hill GDV classification for areas of interest in the LOM area are shown in Figures 4 to 6. Note that the display of canopy boundaries in Figure 4 has the effect of exaggerating the area of GDV trees in the scene. Figure 5 and Figure 6 display a more accurate representation of the GDV trees in the area. The total area of GDV classified in 2019 was 872.9 ha (0.26%) of the project area (Table 1).
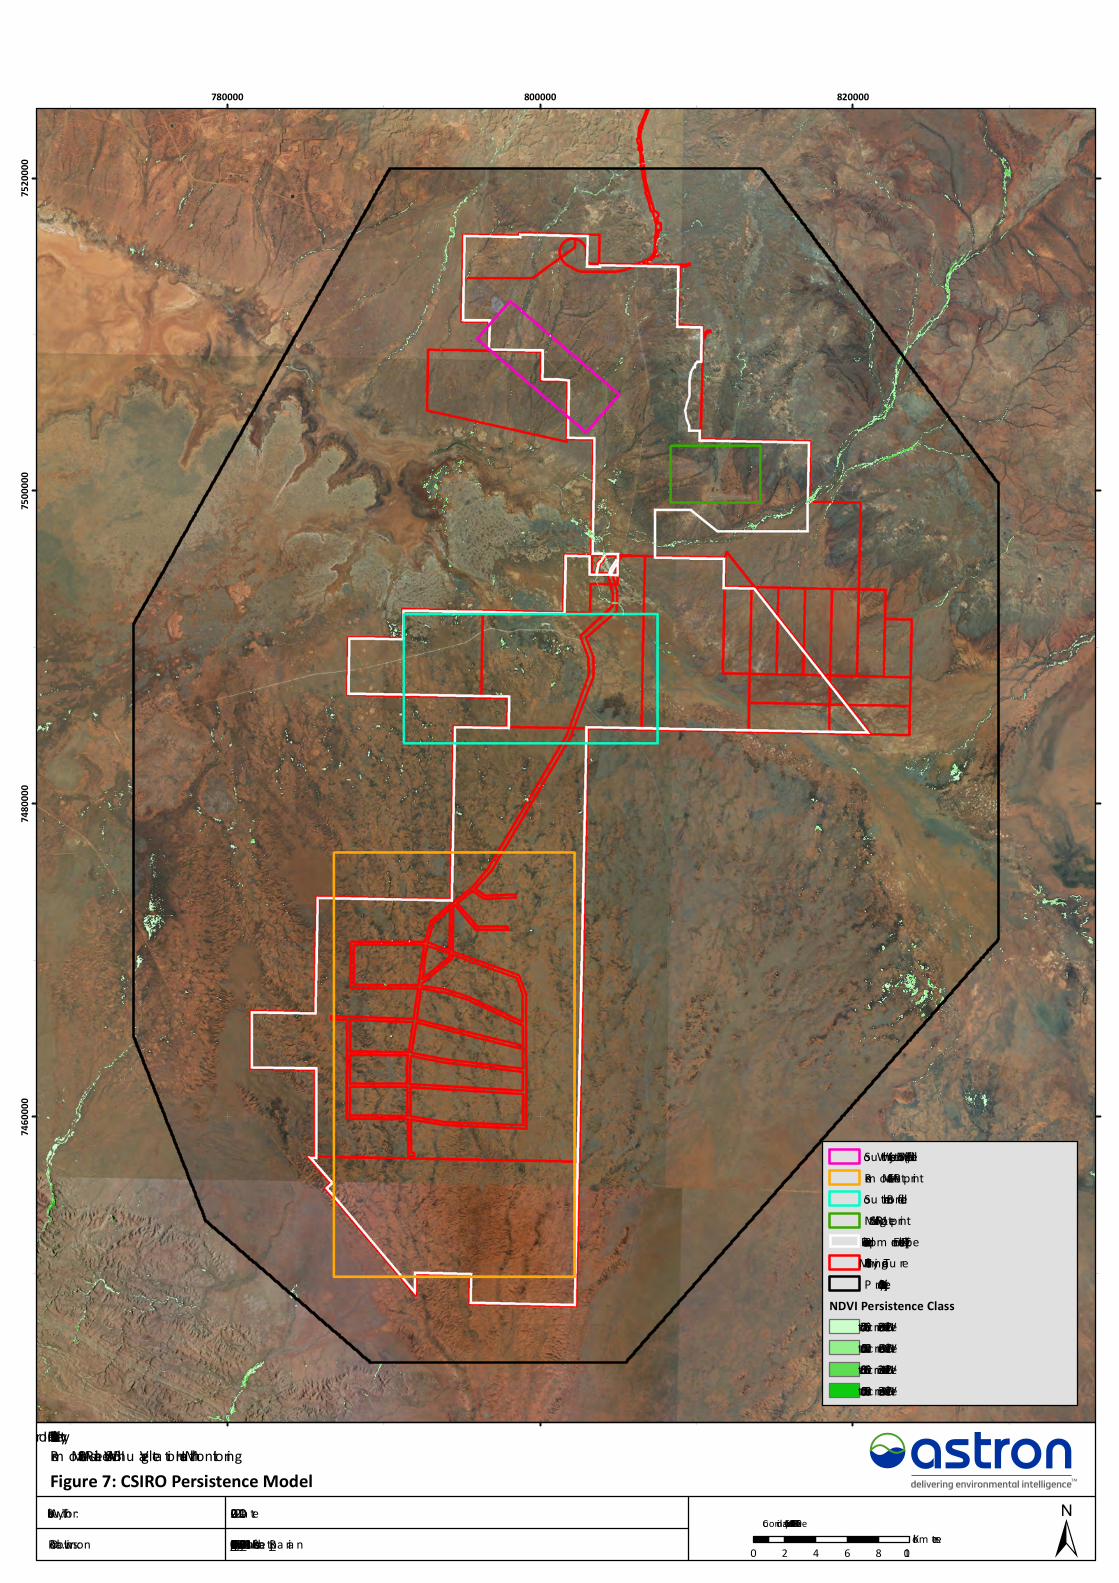
A CSIRO model of potential GDV derived from Landsat imagery (Figure 7) is included for comparison with the final Roy Hill GDV classification. Details of the CSIRO riparian vegetation model based on categories of persistence of Normalised Difference Vegetation Index (NDVI) values are summarised in Attachment A.
Table 1: Area of GDV canopy across the project area.
Description of area Total area (ha) GDV (ha) % GDV of total area
Project Area (2017 WV2 capture area) 27,641.8 70.7 0.3
Project Area (2019 WV3 capture area) 338,942.8 872.8 0.3
Revised Development Envelope 97,946.8 310.8 0.3
Mining tenure (total area)^ 112,773.1 339.8 0.3
Mining tenure (area to be retained and not disturbed) * 95,383.2 324.8 0.3
Southern Borefield 13,373.8 38.5 0.3
Remote MAR 41,700.4 0.8 <0.1
^ Mining tenure area, clipped to the 2019 project area. *Mining tenure area as above, with “existing approved clearing” and “proposed new clearing” areas excluded.

MAR Stage 1 Footprint
South West Injection Borefield (SWIB)
FORTESCUE RIVER
KULKINB AHCRE
EK
COON
DINER
CREEK
Remote MAR Footprint
Southern Borefield
780000 800000 820000
74600
00748
0000
75000
00752
0000
±0 2 4 6 8 10Kilometres
Figure 4: Overview of GDV ClassificationAuthor: T. Bleby Date: 10-02-2020 Coordinate System: GDA 1994 MGA Zone 50Drawn: L. Robinson Figure Ref: 64014-19-BIDR-1Rev0_200210_Fig04_Overview_GDV
Roy Hill Iron Ore Pty LtdRemote MAR Baseline and SWIB Annual Vegetation Health Monitoring
RiversFortescue MarshGDV ClassificationRevised Development Envelope (RDE)Roy Hill Mining TenureProject Area (2019)

FORTESCUE RIVER
KULKINBAH CREE K
KULBEE C
REEK
790000 800000 810000 820000
75000
00751
0000
75200
00
±0 1 2 3 4 5KilometresFigure 5: GDV Classification North of Fortescue Marsh
Author: T. Bleby Date: 10-02-2020
Coordinate System: GDA 1994 MGA Zone 50
Drawn: L. Robinson Figure Ref: 64014-19-BIDR-1Rev0_200210_Fig05_North_Fortescue_Marsh
Roy Hill Iron Ore Pty LtdRemote MAR Baseline and SWIB Annual Vegetation Health Monitoring
RiversFortescue MarshGDV ClassificationRevised Development Envelope (RDE)Roy Hill Mining TenureSouth West Injection Borefield (SWIB)MAR Stage 1 FootprintProject Area (2019)
Map Extent

FOR TESCUE RIVER
COON
DINER C
REEK
CARA
MULLA
CREEK
JIMBLE
BAR CREEK
770000 780000 790000 800000 810000 820000 830000 840000
74500
00746
0000
74700
00748
0000
74900
00
±0 2 4 6 8 10KilometresFigure 6: GDV Classification South of Fortescue Marsh
Author: T. Bleby Date: 10-02-2020
Coordinate System: GDA 1994 MGA Zone 50
Drawn: L. Robinson Figure Ref: 64014-19-BIDR-1Rev0_200210_Fig06_South_Fortescue Marsh
Roy Hill Iron Ore Pty LtdRemote MAR Baseline and SWIB Annual Vegetation Health Monitoring
RiversFortescue MarshGDV ClassificationRemote MAR FootprintMAR Stage 1 FootprintRevised Development Envelope (RDE)Roy Hill Mining TenureProject Area (2019)
Map Extent
780000 800000 820000
74600
00748
0000
75000
00752
0000
±0 2 4 6 8 10Kilom etres
Figure 7: CSIRO Persistence ModelAu thor: T. Bleby Da te: 10-02-2020 Coordina te System : GDA 1994 MGA Zone 50Drawn: L. Rob inson Fig u re Ref: 64014-19-BIDR-1Rev0_200210_Fig07_La ndsa t_Ripa ria n
Roy Hill Iron Ore P ty LtdRem ote MAR Ba seline a nd SWIB Annu a l Vegeta tion Hea lth Monitoring
Sou th West Injection Borefield (SWIB)Rem ote MAR FootprintSou thern BorefieldMAR Sta g e 1 FootprintRevised Developm ent Envelope (RDE)Roy Hill Mining Tenu reP roject Area (2019)
NDVI Persistence Class50 to 70% occu rrence of NDVI ≥ 0.2670 to 100% occu rrence of NDVI ≥ 0.2650 to 80% occu rrence of NDVI ≥ 0.3280 to 100% occu rrence of NDVI ≥ 0.32

Roy Hill Iron Ore Remote Managed Aquifer Recharge Baseline and South West Injection Borefield Annual Vegetation Health Monitoring – Groundwater Dependent Vegetation Classification, February 2020
Page | 12
4 Discussion
The previously classified area of GDV (Astron Environmental Services 2018) delivered was 70.7 ha, whereas the new 2019 GDV classification yielded 872.9 ha over the expanded 2019 analysis area. The percent of area occupied by GDV is the same in both the 2017 and 2019 classifications (0.3%) for their respective project areas. The revised 2019 GDV area also encompasses the previous 2017 GDV classification area.
Within the overlap area, there has been an overall decrease in the number of segments in the 2019 classification compared to the 2017 classification. However, the 2017 classification overclassified GDV trees (2017 classification correctly identified ‘trees’, but classified them as GDV trees when they were not), most notably along the Fortescue River. The present 2019 classification resolves a lot of these issues and more closely reflects the locations of GDV trees, especially along the river. A reduction in the area of GDV is also consistent with the CSIRO model which identified a much smaller extent of GDV than was indicated by the 2017 classification.
The project area subject to classification in this 2019 analysis extended further than the 2017 project area, which was confined to the mining lease and surrounds (Figure 4 to Figure 6). The new classifier identifies sparser areas of GDV trees outside the mining lease despite the lack of training data in these areas. If ground truthing shows that these areas support tree species different to E. victrix or E. camaldulensis, then a further update of the GDV mapping can be undertaken to more define the areas of GDV..
The CSIRO persistence model shown in Figure 7 uses Landsat data to classify potential GDV areas using a time series of NDVI from Landsat imagery. The 2019 Worldview classification has identified GDV in the majority of the areas identified in the CSIRO model. There are some differences due to the 2019 WV3 classification having a much higher resolution of 1.2 m, allowing classification of individual trees. The coarser resolution of the Landsat data (25 m) used in the CSIRO classification restricts classification to larger areas of GDV. Notably, the CSIRO model also identifies areas of GDV that have not been identified using WV3. At this stage, it is difficult to resolve this discrepancy as many of these areas have not been ground-truthed previously. In and around the Marsh, it appears the CSIRO model has classified Melaleuca species (possibly M. xerophila and/or Melaleuca glomerata) associated with high NDVI persistence, as GDV. However, these species were not included in the WV3 GDV classification model as there is little information available on the groundwater requirements of these species. This is also likely to be an issue with classification of GDV from other freely available satellite imagery. Even at the 10 m resolution of Sentinel-2, the resolution in relation to individual tree size, means it is not possible to separate individual trees based on unique spectral reflectance. This is important, as GDV are often scattered amongst other vegetation. In addition, NDVI persistence (used by CSIRO) is likely to occur in other species that are not GDV.
The assumption underlying the CSIRO persistence model (Figure 7) is that vegetation with access to a reliable water source (groundwater) will maintain a relatively stable greenness index during periods of water deficit in the unsaturated zone of the soil profile. In contrast, the GDV classification process used in this report identifies potentially groundwater dependent vegetation based on training data. The classification method selects for tree canopies with characteristic reflectance (typically brighter green in true colour imagery) indicative of known potential GDV species. From this, the large majority of classified vegetation at Roy Hill is likely to consist of Eucalyptus spp., and predominantly E. victrix and E. camaldulensis, rather than vegetation with a persistent greenness index. However, it is important to note that the final classification makes no inferences regarding the

Roy Hill Iron Ore Remote Managed Aquifer Recharge Baseline and South West Injection Borefield Annual Vegetation Health Monitoring – Groundwater Dependent Vegetation Classification, February 2020
Page | 13
ecological or physiological status of the vegetation, and it does not automatically imply groundwater dependency, but rather ‘potential’ groundwater dependency. Further refinement of the classification is necessary to accurately identify true GDV, through detailed ground-truthing based on physiological studies that demonstrate actual groundwater dependence. Although ground truthing will likely indicate that the true area of GDV is smaller than the final classification, it will not significantly alter current knowledge on the distribution of GDV across the project area.

Roy Hill Iron Ore Remote Managed Aquifer Recharge Baseline and South West Injection Borefield Annual Vegetation Health Monitoring – Groundwater Dependent Vegetation Classification, February 2020
Page | 14
5 Conclusions
The 2019 classification of GDV trees appears to produce more accurate results, especially in the overlap covered by the previous 2017 project area. When comparing this 2019 classification to the 2017 classification, it appears to remove the majority of over-classification problems. Ongoing refinements to the classification will occur over time as additional imagery is captured and any areas of uncertainty that are accessible locations are groundtruthed. Any other spatial data relevant to the identification of GDV could also be used to validate and refine the classification.
This report was prepared by Liam Robinson and Dr Jasmine Muir and reviewed by Dr Robert Archibald and Dr Tim Bleby. If you have any queries, please do not hesitate to contact Jasmine.
Yours sincerely ASTRON ENVIRONMENTAL SERVICES
Dr Stuart Pearse General Manager
Attachments
Attachment A: CSIRO Groundwater Dependent Vegetation Models

Roy Hill Iron Ore Remote Managed Aquifer Recharge Baseline and South West Injection Borefield Annual Vegetation Health Monitoring – Groundwater Dependent Vegetation Classification, February 2020
Page | 15
References
Astron Environmental Services. 2018. Vegetation Health Monitoring 2018 Annual Report. unpublished report to Roy Hill Iron Ore Pty Ltd, Perth WA.
Astron Environmental Services. 2019. Life of Mine Water Management Strategy Vegetation Risk Assessment. unpublished report to Roy Hill Pty Ltd.
Orellana, F., P. Verma, S. P. Loheide II, and E. Daly. 2012. Monitoring and modelling water-vegetation interactions in groundwater-dependent ecosystems. Reviews of Geophysics 50:RG3003, doi:10.1029/2011RG000383.
Qi, J., A. Chehbouni, A. Huete, Y. Kerr, and S. Sorooshian. 1994. A Modified Soil Adjusted Vegetation Index. Remote Sensing of Environment 42:119–126.

Roy Hill Iron Ore Remote Managed Aquifer Recharge Baseline and South West Injection Borefield Annual Vegetation Health Monitoring – Groundwater Dependent Vegetation Classification, February 2020
Page | 16
This page has been left blank intentionally.

Roy Hill Iron Ore Remote Managed Aquifer Recharge Baseline and South West Injection Borefield Annual Vegetation Health Monitoring – Groundwater Dependent Vegetation Classification, February 2020
Attachment A: CSIRO Groundwater Dependent Vegetation Models

Roy Hill Iron Ore Remote Managed Aquifer Recharge Baseline and South West Injection Borefield Annual Vegetation Health Monitoring – Groundwater Dependent Vegetation Classification, February 2020
This page has been left blank intentionally.

Roy Hill Iron Ore Remote Managed Aquifer Recharge Baseline and South West Injection Borefield Annual Vegetation Health Monitoring – Groundwater Dependent Vegetation Classification, February 2020
1 Landsat remote sensing indices for identifying vegetation
The Landsat satellite is an example of a remote sensing platform that captures imagery across a number of spectral bands including across visible (VIS) and near infrared (NIR) wavelengths. The capture of wavelengths in the NIR band is an important tool used in vegetation health monitoring primarily because healthy, green leaves strongly reflect NIR wavelengths. At the same time, chlorophyll in plant leaves absorbs red light. Therefore, where leaves are healthy and foliage is dense, there is greater absorption of red light and greater reflection of NIR per unit area. Comparing the NIR and VIS red bands of Landsat imagery provides the Normalised Difference Vegetation Index (NDVI), an index that is widely used for measuring vegetation cover and condition. NDVI is calculated as: NDVI = (NIR – R) / (NIR + R), where NIR is the near infrared spectral band and R is the red spectral band.
The NDVI indicates the 'greenness' of target vegetation and ranges between -1 (snow and ice) to +1 (100% healthy and dense vegetation cover). In this way, NDVI is highly correlated with per cent canopy closure: if there is more reflected light in the NIR wavelengths then the vegetation of interest is likely to be dense. Thus, the difference between NIR and R reflectance from vegetation will reduce as vegetation health, or vegetation cover proportion within a pixel, reduces (Tucker 1979; Jensen et al. 1991; Heute 2012). A decline in live plant cover will therefore be reflected by a decrease in NDVI. Similarly, the ‘persistence’ of high NDVI values can be used to identify vegetation that remains consistently green and in good condition over time with little fluctuation in response to changes in climate (rainfall and drought), which by inference suggests access to reliable, consistent water sources, including groundwater.
2 CSIRO models for identifying riparian and potential groundwater dependent vegetation
The CSIRO developed a model for Roy Hill using the Landsat data archive that was aimed at identifying the ‘greenest’ vegetation across the project area. The model output was based on the first Principal Component (PC1) of a Principal Component Analysis of the stack of NDVI grids (images) for the Landsat scene covering the Mine area (Path 111, Row 76) for the baseline period 1995 to 1999. The output was a three-class vegetation map showing 30 m x 30 m pixel units greater than the 85th, 90th and 95th percentiles of NDVI PC1. These areas were simply classified as being ‘riparian’ vegetation, with no inferences about the taxonomic, ecological or physiological status of the vegetation involved. Broadly speaking, potential GDV may likely be considered to occur within pixel areas greater than the 85th percentile of NDVI PC1.
The CSIRO also developed a more refined model aimed at identifying potential groundwater dependent vegetation (GDV), based on the Groundwater Dependent Ecosystem Mapping (GEM) method of Barron et al. (2014). Briefly, the general concept of the GEM methods is as follows:
• Areas where vegetation has permanent access to groundwater are likely to sustain comparatively high levels of greenness (amount of green vegetation), even after a prolonged dry period. NDVI is used for indirect evaluation of greenness and areas of invariant greenness are mapped as GDV.
• In areas where the root zone is never connected to groundwater, greenness can be dramatically reduced at the end of a prolonged dry period due to the complete depletion of soil moisture stores; these are considered not possible to contain GDV.

Roy Hill Iron Ore Remote Managed Aquifer Recharge Baseline and South West Injection Borefield Annual Vegetation Health Monitoring – Groundwater Dependent Vegetation Classification, February 2020
For the CSIRO analysis, a time series analysis of NDVI for the Mine was conducted using Landsat 5 Thematic Mapper datasets. The analysis assessed temporal variation in NDVI to identify areas of high ‘persistence’ in NDVI above established threshold values determined from a broader regional analysis (Pilbara Water Resources Assessment). Threshold values indicate the presence of vegetation that has remained consistently green over time with little fluctuation in response to changes in climate (rainfall and drought), which are mapped as GDV (CSIRO 2015).
The analysis was conducted from a stack of 151 NDVI grids (images) for the Landsat scene covering the Mine (Path 111, Row 76 in the Landsat global grid system) for the baseline period 1986 to 2011. The output was an 11-class ‘NDVI persistence’ map showing the percentage of time (percentage of images in the time series) for each pixel (30 m x 30 m) where NDVI was greater than or equal to threshold values of 0.32 and 0.26. Potential GDV status corresponding to these time percentages is listed in Table 1.
Table 1: Likelihood of 30 m x 30 m Landsat pixels containing potential groundwater dependent vegetation based on Normalised Difference Vegetation Index (NDVI) persistence classes.
GDV likelihood NDVI persistence class
Very High 90 to 100% occurrence of NDVI ≥ 0.32 80 to 90% occurrence of NDVI ≥ 0.32
High 70 to 80% occurrence of NDVI ≥ 0.32 60 to 70% occurrence of NDVI ≥ 0.32 50 to 60% occurrence of NDVI ≥ 0.32
Moderate 90 to 100% occurrence of NDVI ≥ 0.26 80 to 90% occurrence of NDVI ≥ 0.26 70 to 80% occurrence of NDVI ≥ 0.26
Low 60 to 70% occurrence of NDVI ≥ 0.26 50 to 60% occurrence of NDVI ≥ 0.26
None < 50% occurrence of NDVI ≥ 0.26 and NDVI < 0.26

Roy Hill Iron Ore Remote Managed Aquifer Recharge Baseline and South West Injection Borefield Annual Vegetation Health Monitoring – Groundwater Dependent Vegetation Classification, February 2020
References
Barron, OV, Emelyanova, I, Van Niel, TG, Pollock, D & Hodgson, G 2014, 'Mapping groundwater-dependent ecosystems using remote sensing measures of vegetation and moisture dynamics', Hydrological Processes, vol. 28, no. 2, pp. 372-85.
CSIRO 2015, Assessment of potential groundwater-dependent vegetation on the Roy Hill mine site, unpublished report to Roy Hill Iron Ore Pty Ltd.
Heute, A 2012, 'Vegetation Indices, Remote Sensing and Forest Monitoring', Geography Compass, vol. 6, pp. 513-32.
Jensen, J, Lin, H, Yang, X, Ramsey, E, Davis, B & Thoemke, C 1991, 'The measurement of mangrove characteristics in southwest Florida using spot multispectral data', Geocarto International, vol. 6, pp. 13-21.
Tucker, C 1979, 'Red and photographic infrared linear combinations for monitoring vegetation', Remote Sensing of Environment, vol. 8, pp. 127-50