Embed Size (px)
Citation preview

4
2.0 Demographics
2.1 Introduction
Generally regional travel demand is closely related to the region’s population size, characteristics, and
employment. Travel demand is the combined effect of the need to make trips to satisfy personal,
household, commercial, and community needs. However, in Maine, well over 70 percent of all
employment, retail sales and all services, such as hospitals, social services, education institutions, cultural
activities, and government occur within just over 14 percent of the State’s municipalities. These cities
and towns are referred to as service centers.
The BACTS area is one of the State’s service centers, providing services to a populous much larger than
that which resides within the area. Services in the greater Bangor area are regularly utilized by and, in
many cases, are the closest services for residents living in almost half of the State. Therefore, travel
demand for the area is inflated by the daily influx of individuals making their way into the region for
employment, education, health care and retail services.
2.2 Geographical Distribution
In land area, Maine is the largest state in New England, representing almost half of the region’s total area.
In 2016, the U.S. Census Bureau reported Maine is the least densely populated state on the eastern
seaboard, with just 43.1 people per square mile. Maine is nearly 90 percent forested which causes the
population to be unevenly distributed. The most populated county in the State, Cumberland County, is
home to 22 percent of the State’s total population but covers only 4 percent of the State’s land area; and
although the four counties to the east and north of Penobscot County make up 50 percent of the State’s
land area, only 13 percent of the population inhabit those areas.
The State is divided into 16 counties and 491 municipalities - 431 towns, 34 plantations, 23 cities, as well
as 3 Indian Nations. Bangor, the third largest city in Maine, is the county seat of Penobscot County, the
third most populated county of Maine. There are 60 municipalities within Penobscot County’s 3,397
square miles, accounting for 12.2 percent of the State’s municipalities, 11.0 percent of the land area and
11.6 percent of the population.
The BACTS metropolitan planning area
consists of 11 municipalities (3 cities, 7
towns and 1 Indian Nation), which make up
the 2010 Census designated Greater Bangor
urbanized area (UZA). There are only three
UZAs in Maine – the Greater Portland Area,
Lewiston-Auburn Area, and the Greater
Bangor Area. The designated Greater
Bangor UZA has changed with each
decennial census, as shown in Figure 2.1.
A UZA is a census-designated urban area
with 50,000 or more residents. An urban
area is defined by the census is an area
consisting of a central core and adjacent densely settled area that together contain at least 2,500 residents.
The Federal Highway Administration (FHWA) defines an urban area as an area having a population of
5,000 or more.
Veazie
Bangor
Brewer
Hampden
Old Town
Orono
Veazie
Bangor
Bradley
Brewer
Eddington
Hampden
Milford
Old Town
Orono
Orrington
Penobscot Indian Island
Veazie
Milford
Old Town
Orono
Orrington
Penobscot Indian Island
Bangor
Bradley
Brewer
Hampden
Hermon
2010 2000 1990
BACTS
METROPOLITAN PLANNING AREA MUNICIPALITIES
1990 - 2010
Figure 2.1

5
In total, the 11 municipalities in the BACTS metropolitan planning
area have a combined land area of 318 square miles and a total
(2010) population of 84,220. These 11 communities represent
18.33 percent of the municipalities in Penobscot County, 9.35
percent of land area and 54.72 percent of the population. Although
all 11 municipalities make up the metropolitan planning area, the
UZA includes only the urban portions of these communities. The
UZA contains .14 percent of the State’s land area, 1.25 percent of
Penobscot County and 13.37 percent of the metropolitan planning
area; and represents 4.61 percent of the total Maine population,
39.77 percent of Penobscot County and 72.68 percent of the
metropolitan planning area. (Figure 2.2)
The density in the Greater Bangor UZA is 1,440 persons per square
mile, compared to 265 for the Metropolitan Planning Area, 45 for
Penobscot County and 43 for the State. (Figure 2.3) In 2010, 42.4
percent of Penobscot County residents lived in urban areas, the
majority located within the BACTS area. Slightly more than one-
third (38.7%) of the State of Maine’s residents live within an urban area. As shown in Figure 2.3, the
percentage of residents living in urban areas of BACTS municipalities varies greatly from community to
community. More than 90 percent of residents in Bangor, Orono and Penobscot Indian Island
live in urban areas, while less than 50 percent of residents in Bradley, Hampden, Hermon
and Orrington live in urban areas.
Square Miles Density
Bangor 34 965.2
Bradley 51 29.5
Brewer 15 622.6
Hampden 38 190.5
Hermon 37 147.3
Milford 46 66.6
Old Town 45 175.0
Orono 20 529.2
Orrington 26 141.5
Indian Island 3 217.1
Veazie 3 613.1
Greater Bangor UZA 43 1,440.2
Penobscot County 3,397 45.3
Maine 30,843 43.1
Land Area and Density
2010
Land Area Population Municipalities Land Area Population Municipalities Land Area Population Municipalities
Greater Bangor UZA 0.14% 4.61% 2.24% 1.25% 39.77% 18.33% 13.37% 72.68% 100%
BACTS Metropolitan Planning Area 1.03% 6.34% 2.24% 9.35% 54.72% 18.33%
Penobscot County 11.02% 11.59% 12.22%
Percent of Penobscot County
GEOGRAPHICAL DISTRIBUTION
Percent of
Metropolitan Planning AreaPercent of State
2010 2000 Change 2010 2000 Change 2010 2000 Change 2010 2000 Change
Bangor 33,039 31,473 4.98% 30,949 29,736 4.08% 2,090 1,737 20.32% 93.67% 94.48% -0.81%
Bradley 1,492 1,242 20.13% 461 436 5.73% 1,031 806 27.92% 30.90% 35.10% -4.21%
Brewer 9,482 8,987 5.51% 7,803 7,552 3.32% 1,679 1,435 17.00% 82.29% 84.03% -1.74%
Hampden 7,257 6,327 14.70% 2,659 2,868 -7.29% 4,598 3,459 32.93% 36.64% 45.33% -8.69%
Hermon 5,416 4,437 22.06% 14 0 NA 5,402 4,437 21.75% 0.26% 0.00% 0.26%
Milford 3,070 2,950 4.07% 1,854 1,696 9.32% 1,216 1,254 -3.03% 60.39% 57.49% 2.90%
Old Town 7,840 8,130 -3.57% 5,754 6,298 -8.64% 2,086 1,832 13.86% 73.39% 77.47% -4.07%
Orono 10,362 9,112 13.72% 9,372 8,138 15.16% 990 974 1.64% 90.45% 89.31% 1.14%
Orrington 3,733 3,526 5.87% 473 400 18.25% 3,260 3,126 4.29% 12.67% 11.34% 1.33%
Penobscot Indian Island 610 562 8.54% 608 560 8.57% 2 2 0.00% 99.67% 99.64% 0.03%
Veazie 1,919 1,744 10.03% 1,263 1,177 7.31% 656 567 15.70% 65.82% 67.49% -1.67%
BACTS Area 84,220 78,490 7.30% 61,210 58,861 3.99% 23,010 19,629 17.22% 72.68% 74.99% -2.31%
Penobscot County 153,923 144,919 6.21% 65,186 63,784 2.20% 88,737 81,135 9.37% 42.35% 44.01% -1.66%
Maine 1,328,361 1,274,923 4.19% 513,542 512,878 0.13% 814,819 762,045 6.93% 38.66% 40.23% -1.57%Source: U.S. Decennial Census 2000, 2010 SF1
Total Urban Rural
Percent of Total Population
in Urban Area
Urban and Rual Population Changes
2000-2010
Figure 2.2
Figure 2.3
Figure 2.4
6
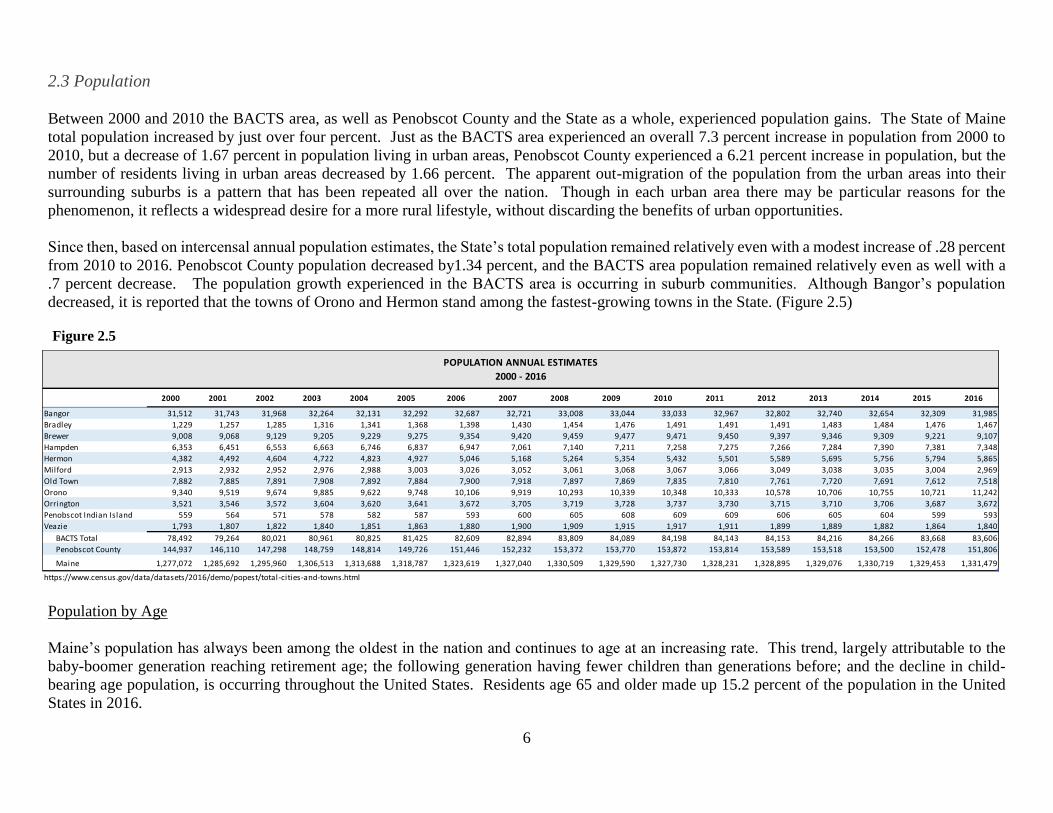
2.3 Population
Between 2000 and 2010 the BACTS area, as well as Penobscot County and the State as a whole, experienced population gains. The State of Maine
total population increased by just over four percent. Just as the BACTS area experienced an overall 7.3 percent increase in population from 2000 to
2010, but a decrease of 1.67 percent in population living in urban areas, Penobscot County experienced a 6.21 percent increase in population, but the
number of residents living in urban areas decreased by 1.66 percent. The apparent out-migration of the population from the urban areas into their
surrounding suburbs is a pattern that has been repeated all over the nation. Though in each urban area there may be particular reasons for the
phenomenon, it reflects a widespread desire for a more rural lifestyle, without discarding the benefits of urban opportunities.
Since then, based on intercensal annual population estimates, the State’s total population remained relatively even with a modest increase of .28 percent
from 2010 to 2016. Penobscot County population decreased by1.34 percent, and the BACTS area population remained relatively even as well with a
.7 percent decrease. The population growth experienced in the BACTS area is occurring in suburb communities. Although Bangor’s population
decreased, it is reported that the towns of Orono and Hermon stand among the fastest-growing towns in the State. (Figure 2.5)
Population by Age
Maine’s population has always been among the oldest in the nation and continues to age at an increasing rate. This trend, largely attributable to the
baby-boomer generation reaching retirement age; the following generation having fewer children than generations before; and the decline in child-
bearing age population, is occurring throughout the United States. Residents age 65 and older made up 15.2 percent of the population in the United
States in 2016.
2000 2001 2002 2003 2004 2005 2006 2007 2008 2009 2010 2011 2012 2013 2014 2015 2016
Bangor 31,512 31,743 31,968 32,264 32,131 32,292 32,687 32,721 33,008 33,044 33,033 32,967 32,802 32,740 32,654 32,309 31,985
Bradley 1,229 1,257 1,285 1,316 1,341 1,368 1,398 1,430 1,454 1,476 1,491 1,491 1,491 1,483 1,484 1,476 1,467
Brewer 9,008 9,068 9,129 9,205 9,229 9,275 9,354 9,420 9,459 9,477 9,471 9,450 9,397 9,346 9,309 9,221 9,107
Hampden 6,353 6,451 6,553 6,663 6,746 6,837 6,947 7,061 7,140 7,211 7,258 7,275 7,266 7,284 7,390 7,381 7,348
Hermon 4,382 4,492 4,604 4,722 4,823 4,927 5,046 5,168 5,264 5,354 5,432 5,501 5,589 5,695 5,756 5,794 5,865
Milford 2,913 2,932 2,952 2,976 2,988 3,003 3,026 3,052 3,061 3,068 3,067 3,066 3,049 3,038 3,035 3,004 2,969
Old Town 7,882 7,885 7,891 7,908 7,892 7,884 7,900 7,918 7,897 7,869 7,835 7,810 7,761 7,720 7,691 7,612 7,518
Orono 9,340 9,519 9,674 9,885 9,622 9,748 10,106 9,919 10,293 10,339 10,348 10,333 10,578 10,706 10,755 10,721 11,242
Orrington 3,521 3,546 3,572 3,604 3,620 3,641 3,672 3,705 3,719 3,728 3,737 3,730 3,715 3,710 3,706 3,687 3,672
Penobscot Indian Island 559 564 571 578 582 587 593 600 605 608 609 609 606 605 604 599 593
Veazie 1,793 1,807 1,822 1,840 1,851 1,863 1,880 1,900 1,909 1,915 1,917 1,911 1,899 1,889 1,882 1,864 1,840
BACTS Total 78,492 79,264 80,021 80,961 80,825 81,425 82,609 82,894 83,809 84,089 84,198 84,143 84,153 84,216 84,266 83,668 83,606
Penobscot County 144,937 146,110 147,298 148,759 148,814 149,726 151,446 152,232 153,372 153,770 153,872 153,814 153,589 153,518 153,500 152,478 151,806
Maine 1,277,072 1,285,692 1,295,960 1,306,513 1,313,688 1,318,787 1,323,619 1,327,040 1,330,509 1,329,590 1,327,730 1,328,231 1,328,895 1,329,076 1,330,719 1,329,453 1,331,479
https://www.census.gov/data/datasets/2016/demo/popest/total-cities-and-towns.html
POPULATION ANNUAL ESTIMATES
2000 - 2016
Figure 2.5

7
In 2016, the U.S. Census Bureau stated the median age
in Maine is the highest in Nation at 44.6 years,
followed by New Hampshire (43.0) and Vermont
(42.7). Maine’s median age is high because of the
lower percentage of residents between the ages of 15
and 44 and the higher percentage of residents over 45
years old.
The median age of all residents in the BACTS area has
consistently been younger than that of the State as a
whole. Based on the 2015 5-year population estimates,
the Town of Orono has the youngest population in
Penobscot County and the fourth youngest population
in the State with a median age of 21.7 years. The
community in Penobscot County with the oldest
median age, 63.2, is the unorganized township of
Kingman. In the BACTS area, Orrington has the
oldest population with a median age of 48.6. (Figure
2.6)
School age and senior populations require services
that are dependent on local, state and federal funding
programs. With limited resources, it is essential that
programs and services that will best serve the
community, region, and state as a whole are identified
and strategies to use available funding in the most
cost-effective and efficient manner are implemented
to ensure proper care and services for our most
dependent population segments. (Figure 2.7)
Funding for education is shared by the State and
municipality. (Figure 2.8) In fiscal year 2016, the
Maine Department of Education reported a statewide
average operating cost of $11,349 per pupil, an
increase of 17.5 percent from 2010. In the BACTS
area the average operating cost per pupil was $12,285,
with the highest cost per pupil for Penobscot Indian
Island and the lowest cost per pupil
in Hermon. More than 18 percent
Total 5 - 17 65+
2000 31,473 15.52% 14.08%
2010 33,039 12.28% 14.39%
2015 32,695 13.51% 15.27%
2000 1,242 16.75% 14.33%
2010 1,492 15.68% 14.68%
2015 1,471 13.12% 19.51%
2000 8,987 16.96% 16.67%
2010 9,482 14.89% 17.11%
2015 9,341 14.57% 16.34%
2000 6,327 21.51% 10.72%
2010 7,257 18.88% 12.99%
2015 7,329 18.77% 14.33%
2000 4,437 21.34% 9.92%
2010 5,416 17.74% 12.00%
2015 5,664 17.14% 10.82%
2000 2,950 18.47% 10.85%
2010 3,070 14.10% 12.05%
2015 3,043 13.64% 13.11%
2000 8,130 15.04% 13.86%
2010 7,840 12.60% 13.79%
2015 7,726 9.20% 14.30%
2000 9,112 9.02% 9.30%
2010 10,362 6.48% 10.37%
2015 10,617 5.81% 12.37%
2000 3,526 18.04% 12.08%
2010 3,733 17.12% 13.47%
2015 3,714 17.91% 16.18%
2000 562 26.51% 9.61%
2010 610 20.49% 8.69%
2015 789 18.88% 11.66%
2000 1,744 18.41% 14.56%
2010 1,919 14.90% 16.68%
2015 2,045 18.63% 17.26%
2000 78,490 16.08% 13.06%
All BACTS Communities 2010 84,220 13.27% 13.76%
2015 84,434 13.33% 14.60%
2000 144,919 21.18% 13.06%
Penobscot County 2010 153,923 18.63% 14.46%
2015 153,437 17.70% 16.0%
2000 1,274,923 20.77% 14.39%
Maine 2010 1,328,361 18.18% 15.89%
2015 1,329,100 17.50% 17.60%
School-Age and Senior Population
as Percentage of Total Population
2000 - 2015
Orono
Orrington
Penobscot Indian Island
Veazie
Bangor
Bradley
Brewer
Hampden
Hermon
Milford
Old Town
Median Age Ranking
Orono 21.7 4
Old Town 33.5 13
Bangor 35.4 16
Penobscot Indian Island 37.2 24
Hermon 40.7 72
Brewer 41.7 91
Hampden 42.6 115
Veazie 43.0 126
Milford 45.0 199
Bradley 48.5 315
Orrington 48.6 319
BACTS Municipalities Median Age
Youngest to Oldest Ranking in the State
2015
\ Elementary Secondary Total
STATE TOTALS $10,682.37 $12,858.13 $11,348.78
Bangor $10,516.96 $10,889.68 $10,621.06
Brewer $9,201.05 $13,100.73 $10,349.31
Hermon $8,798.54 $10,943.77 $9,418.30
Indian Island $26,134.26 $10,458.93 $22,802.57
Milford $10,915.47 $11,181.08 $11,002.18
Orrington $8,364.17 $12,196.37 $9,422.14
RSU 22 $9,124.15 $11,767.21 $9,905.30
RSU 26 $13,923.16 $13,143.63 $13,670.88
RSU 34 $10,702.20 $13,118.06 $11,378.79
Veazie Public Schools $15,521.61 $12,232.25 $14,275.12
Source: http://www.maine.gov/education/data/ppcosts/index.html
Per Pupil Operating Costs
Figure 2.6
Figure 2.7
Figure 2.8

8
of the total population in each community of Hampden, Penobscot Indian Island and Veazie are school
age and less than ten percent of the population in both Old Town and Orono are school age.
Maine’s State Plan on Aging 2016-2020, indicates that nearly two-thirds of all individuals age 65 and
older will need long-term services. With an aging population, the State is facing a high dependency ratio
which strains resources and services and creates a serious consequence to the economy and available
workforce. A smaller number of residents will be available to pay the increasing amount of services
needed for the senior population. The baby boomer generation is beginning to retire and leaving the
workforce with a smaller population available to fill the positions left vacant. This situation will make
maintaining the current workforce of the State difficult, and create obstacles to attracting development
and new business. Businesses tend to base relocation and expansion decisions on the
availability of a skilled workforce.
In 2015, while the State and Penobscot County averaged 3.8
working persons for every senior person, the BACTS area as
a whole averaged 4.6 working age persons for every senior
person. The towns of Hermon, Milford, Old Town, Orono
and Penobscot Indian Island all had the lowest working-age
to senior ratios in the BACTS area. In the 2015 report on
Economic Implications of Maine’s Changing Age Structure,
the data showed that a common thread among the counties
with a higher percentage of workers to seniors was the
proximity to Interstate 95 and a metropolitan area. (Figure
2.9)
Geographic Mobility
Society is very mobile.
A higher percentage of
residents report living in
a different community
from the past year in the
BACTS area than in
Penobscot County and
the State. This may be
attributable to the
concentration of higher
education institutions in
the BACTS area, as
evidenced in the high
rates shown in Orono,
the host community to
the University of Maine flagship campus.
The BACTS area is attracting in-migration of residents from
other states at a higher rate than Penobscot County and the
State. (Figure 2.10) Again, this may be attributable to the influx of students to the area. In 2015, of the
residents of BACTS area communities living in a different home than the previous year, 3.37 percent
report they lived in a state other than Maine, compared to 2.66 percent in Penobscot County and 2.83
percent of the State. Bangor, Hermon and Orono all have a higher percentage of out of state in-migration
Median
Age
Working Age
to Senior
Ratio
2000 36.1 4.6
2010 36.7 4.7
2015 35.4 4.3
2000 38.9 4.4
2010 40.0 4.3
2015 48.5 3.3
2000 39.2 3.7
2010 41.1 3.7
2015 41.7 3.9
2000 38.8 5.8
2010 40.8 4.8
2015 42.6 4.4
2000 36.8 6.4
2010 40.4 5.4
2015 40.7 6.1
2000 35.9 6.0
2010 39.7 5.7
2015 45.0 5.3
2000 33.8 4.8
2010 33.0 5.0
2015 33.5 4.9
2000 22.3 8.5
2010 21.8 7.8
2015 21.7 6.4
2000 40.3 5.3
2010 43.5 4.8
2015 48.6 4.0
2000 32.0 5.9
2010 33.6 7.0
2015 37.2 5.4
2000 40.3 4.2
2010 43.4 3.8
2015 43.0 3.5
2000 36.8 5.0
2010 40.0 4.9
2015 41.7 4.6
2000 37.2 4.6
2010 39.9 4.3
2015 41.3 3.8
2000 38.6 4.6
2010 42.7 4.2
2015 43.8 3.8
Old Town
Orono
Orrington
Penobscot Indian Island
Veazie
Median Age
and Working Age Population to Senior Population Ratio
Bangor
Bradley
Brewer
Hampden
Hermon
Milford
BACTS Area Total
Penobscot County
Maine
Bangor 3.66%
Bradley 0.75%
Brewer 2.10%
Hampden 0.75%
Hermon 3.85%
Milford 0.53%
Old Town 2.20%
Orono 8.68%
Orrington 0.54%
Penobscot Indian Island 0.77%
Veazie 1.58%
Total BACTS Communities 3.37%
Penobscot County 2.66%
Maine 2.83%
Percent of Residents Who Lived Outside
Maine in the Previous Year
2015
Figure 2.9
Figure 2.10

9
than Penobscot County and the State as a whole. Hermon and Orono have been reported among the fastest
growing towns in the State; however, the total population in Bangor has decreased annually since 2009.
(Figure 2.11)
TotalSame
House
Same City
or Town
Same
County
Same
State
Different
StateAbroad
Residing in
Same
Community
Residing in
Different
Community
Bangor
2010 32,562 24,459 3,126 1,986 1,888 856 247 84.72% 15.28%2015 32,353 24,709 2,207 1,901 2,353 1,082 101 83.19% 16.81%
Bradley
2010 1,384 1,174 0 182 5 23 0 84.83% 15.17%2015 1,468 1,353 0 58 46 11 0 92.17% 7.83%
Brewer
2010 9,372 8,014 453 380 220 297 8 90.34% 9.66%2015 9,241 8,095 230 575 147 194 0 90.09% 9.91%
Hampden
2010 7,002 6,448 12 358 104 56 24 92.26% 7.74%2015 7,295 6,306 215 377 342 55 0 89.39% 10.61%
Hermon
2010 5,220 4,711 0 293 39 167 10 90.25% 9.75%2015 5,583 4,857 0 421 90 201 14 87.00% 13.00%
Milford
2010 3,024 2,481 165 333 45 0 0 87.50% 12.50%2015 3,028 2,742 0 270 0 16 0 90.55% 9.45%
Old Town
2010 7,804 6,117 424 727 267 232 37 83.82% 16.18%2015 7,623 6,062 327 854 212 111 57 83.81% 16.19%
Orono
2010 10,130 5,344 1,543 822 1,796 550 75 67.99% 32.01%2015 10,561 6,486 688 837 1,633 849 68 67.93% 32.07%
Orrington
2010 3,682 3,440 0 225 0 17 0 93.43% 6.57%2015 3,714 3,552 0 131 11 20 0 95.64% 4.36%
Penobscot Indian Island
2010 592 510 0 54 19 9 0 86.15% 13.85%2015 779 680 0 84 9 6 0 87.29% 12.71%
Veazie
2010 1,992 1,656 0 255 73 8 0 83.13% 16.87%2015 2,021 1,753 0 212 24 32 0 86.74% 13.26%
Total BACTS Communities
2010 82,764 64,354 5,723 5,615 4,456 2,215 401 84.67% 15.33%2015 83,666 66,595 3,667 5,720 4,867 2,577 240 83.98% 16.02%
Penobscot County
2010 151,307 125,450 6,259 10,001 5,906 3,210 481 87.05% 12.95%2015 152,011 127,655 4,384 9,811 6,123 3,698 340 86.86% 13.14%
Maine
2010 1,313,667 1,132,559 37,598 69,180 39,221 31,621 3,488 89.08% 10.92%2015 1,316,671 1,131,604 35,701 72,585 39,472 32,716 4,593 88.66% 11.34%
Source: American Community Survey 5 - Year Estimates, 2006-2010 and 2011-2015
Geographic Mobility
in the Past Year for Current Residence
2010 and 2015

10
An amalgamation of factors such as the aging population, decline in native births due in part to the limited
numbers of child-bearing aged residents, and young adults migrating to larger cities for educational and
career opportunities, is causing the growth to stagnate at best, and decline in many cases. These trends
are warning indicators of a potential distressed economic situation developing. It demonstrates the
urgency of developing effective strategies for attracting an in-migration of young workers who can power
businesses, pay taxes, and won't dip into social security for decades.
Population Forecasts
Population forecasts were
determined using a linear
regression formula based on the
reported Decennial Census
values from 1980 to 2010. The
trends predict growth between
now and 2040 strictly by formula
and does not account for the
many ambiguities and
uncertainties created by the
aging population, decline in
births and limited in-migration,
which have the potential to
significantly affect rates of
growth. Nor, does the formula account for potential of increased in-migration of working and child-
bearing age individuals to the area with the potential to multiply forecasted growth over the next couple
decades.
The overall population in the BACTS area is forecasted to increase by 6.36 percent between 2010 and
2040, with the majority of growth happening in the suburb communities. The most significant change is
predicted in Hermon, with a 40.32 percent forecasted increase in population. (Figure 2.12)
The current local population trends do not necessarily adhere to the same principles and analysis as other
areas. For example, the City of Bangor is experiencing an overall decrease in population. However it has
a lower median age, a lower percentage of dependent population (population aged 0-17 and 65+), a greater
number of worker to senior population ratio, and a higher percentage of in-migration from out of state.
(Figure 2.13)
2010
Decennial
2015
Estimated
2010- 2015
Change
Density
(sq. mi.)
Median
Age
Dependent
Population
Senior
Dependancy
Ratio
Out of State
In-Migration
Bangor 33,039 32,695 (344) 965.2 35.4 33.80% 4.3 3.66%
Bradley 1,492 1,471 (21) 29.5 48.5 35.76% 3.3 0.75%
Brewer 9,482 9,341 (141) 622.6 41.7 35.85% 3.9 2.10%
Hampden 7,257 7,329 72 190.5 42.6 36.73% 4.4 0.75%
Hermon 5,416 5,664 248 147.3 40.7 33.72% 6.1 3.85%
Milford 3,070 3,043 (27) 66.6 45.0 30.83% 5.3 0.53%
Old Town 7,840 7,726 (114) 175.0 33.5 30.51% 4.9 2.20%
Orono 10,362 10,617 255 529.2 21.7 20.76% 6.4 8.68%
Orrington 3,733 3,714 (19) 141.5 48.6 35.35% 4.0 0.54%
Penobscot Indian Island 610 789 179 217.1 37.2 37.01% 5.4 0.77%
Veazie 1,919 2,045 126 613.1 43.0 39.56% 3.5 1.58%
Total 84,220 84,434 214 1,440.2 41.7 32.50% 4.6 3.37%
Penobscot County 153,923 153,437 (486) 45.3 41.3 38.50% 3.8 2.66%
Maine 1,328,361 1,329,100 739 43.1 43.8 40.00% 3.8 2.83%
Population Analysis Summary
2015
2015Count
Figure 2.12
1980 1990 2000 2010 2020 2030 2040
Bangor 31,643 33,181 31,473 33,039 32,735 33,008 33,281
Bradley 1,149 1,136 1,242 1,492 1,573 1,691 1,810
Brewer 9,017 9,021 8,987 9,482 9,529 9,676 9,822
Hampden 5,250 5,974 6,327 7,257 7,828 8,472 9,116
Hermon 3,170 3,755 4,437 5,416 6,101 6,850 7,600
Milford 2,160 2,884 2,950 3,070 3,381 3,653 3,924
Old Town 8,422 8,317 8,130 7,840 7,670 7,473 7,276
Orono 10,578 10,573 9,112 10,362 9,881 9,707 9,532
Orrington 3,244 3,309 3,526 3,733 3,894 4,064 4,234
Penobscot Indian Island 458 476 562 610 662 713 763
Veazie 1,610 1,633 1,744 1,919 2,006 2,113 2,219
Total 76,701 80,259 78,490 84,220 85,259 87,419 89,579
BACTS Area Population Forecast to 2040

11
2.4 Bangor Metropolitan Labor Market Area
The Bangor Metropolitan Labor
Market Area (LMA) gained 10,081
individuals between 2000 and 2010,
compared to 2,975 persons between
1990 and 2000. From 2000 to 2010,
most of the communities in the
Bangor Metropolitan LMA
experienced increases in population,
including all communities within the
urban region. The majority of
population losses in the LMA
occurred in communities clustered
along Route 155 (Enfield, Howland,
Lagrange, Passadumkeag and
Southeast Piscatquis UT). This area
experienced a loss in population of
737. These losses may be attributed
to the turmoil and decline of Maine’s
pulp and paper industry. Since then,
five of Maine’s paper mills shut
down, four of which were located in
Penobscot County. Verso in
Bucksport, Expera in Old Town, and
Great Northern Paper in East
Millinocket all closed their facilities
in 2014; Lincoln Paper and Tissue
closed its facility in 2015; and
Madison Paper Industries closed its
Madison facility in 2016. (Figure
2.14)
1980 1990 2000 2010 2020 2030 2040
Bangor 31,643 33,181 31,473 33,039 32,735 33,008 33,281
Bradley 1,149 1,136 1,242 1,492 1,573 1,691 1,810
Brewer 9,017 9,021 8,987 9,482 9,529 9,676 9,822
Hampden 5,250 5,974 6,327 7,257 7,828 8,472 9,116
Hermon 3,170 3,755 4,437 5,416 6,101 6,850 7,600
Milford 2,160 2,884 2,950 3,070 3,381 3,653 3,924
Old Town 8,422 8,317 8,130 7,840 7,670 7,473 7,276
Orono 10,578 10,573 9,112 10,362 9,881 9,707 9,532
Orrington 3,244 3,309 3,526 3,733 3,894 4,064 4,234
Indian Island 458 476 562 610 662 713 763
Veazie 1,610 1,633 1,744 1,919 2,006 2,113 2,219
Total 76,701 80,259 78,490 84,220 85,259 87,419 89,579
1980 1990 2000 2010 2020 2030 2040
Alton 468 771 816 890 1,032 1,146 1,254
Amherst 203 226 230 265 281 300 319
Argyle 225 202 253 277 291 308 324
Aurora 110 82 121 114 119 121 123
Bradford 888 1,103 1,186 1,290 1,423 1,551 1,679
Burlington 322 360 351 363 378 391 405
Carmel 1,695 1,905 2,416 2,794 3,154 3,519 3,884
Charleston 1,037 1,187 1,397 1,409 1,565 1,695 1,824
Clifton 462 607 743 921 1,067 1,219 1,371
Corinth 1,711 2,177 2,511 2,878 3,277 3,669 4,061
Dedham 841 1,229 1,422 1,681 1,971 2,254 2,536
Dixmont 812 1,007 1,065 1,181 1,308 1,432 1,555
EC Penobscot 12 324 343 546 723 901
Eddington 1,769 1,947 2,052 2,225 2,363 2,510 2,658
Edinburg 126 107 98 131 124 125 127
Enfield 1,397 1,476 1,616 1,107 1,142 1,057 971
Etna 758 977 1,012 1,246 1,364 1,516 1,668
Exeter 823 937 997 1,092 1,179 1,269 1,358
Garland 718 1,064 990 1,105 1,242 1,373 1,504
Glenburn 2,319 3,198 3,964 4,594 5,384 6,138 6,893
Greenbush 1,064 1,309 1,421 1,491 1,646 1,782 1,919
Holden 2,554 2,952 2,827 3,076 3,218 3,384 3,550
Howland 1,602 1,435 1,362 1,241 1,121 1,000 880
Hudson 797 1,048 1,393 1,536 1,810 2,063 2,317
Kenduskeag 1,210 1,234 1,171 1,348 1,356 1,395 1,434
Lagrange 509 557 747 708 812 888 964
Levant 1,117 1,627 2,171 2,851 3,400 3,978 4,556
Newburg 1,228 1,317 1,394 1,551 1,643 1,749 1,855
Newport 2,755 3,036 3,017 3,275 3,389 3,545 3,701
Osborn 47 72 69 67 74 80 85
Otis 307 355 543 672 790 911 1,031
Passadumkeag 430 428 441 374 368 351 334
SE Piscataquis UT 183 247 254 253 280 300 321
Stetson 618 847 981 1,202 1,378 1,567 1,756
Winterport 2,675 3,175 3,602 3,757 4,176 4,536 4,897
Total 33,780 40,213 44,957 49,308 54,671 59,846 65,014
Bangor Metropolitan LMA 110,481 120,472 123,447 133,528 139,930 147,265 154,593
Municipalities within the Greater Bangor UZA
Municipalities Outside of the Greater Bangor UZA
Bangor Metropolitan Labor Market Area
Population Forecasted to 2040
Sources: U.S. Decennial Census 1980, 1990, 2000, 2010
2015 Labor Market Area as defined by U.S. OMB Bulletin No. 15-01 and provided by Maine Department of Labor at
http://www.maine.gov/labor/cwri/LMADefinitions.html.
*Populations were forecasted using a linear regression formula based on the reported Decennial
Census values from 1980-2010.

12
Labor Force and Economic Characteristics
The employment market in the Greater Bangor area is a reflection of the major role that the Bangor area
plays as the major service center for eastern and central Maine. The market is expected to continue to
focus on services as shown in Figure 2.15.
2010 2011 2012 2013 2014 2015
EMPLOYMENT STATUS
Population 16 years and over 69,836 70,494 71,022 71,369 71,234 71,330
In labor force 46,152 46,369 46,578 46,200 45,610 45,089
Civilian labor force 46,018 46,277 46,465 46,058 45,435 44,928
Employed 43,770 43,392 43,418 42,593 42,049 41,420
Unemployed 2,248 2,885 3,047 3,465 3,386 3,508
Armed Forces 134 92 113 142 175 161
Not in labor force 23,684 24,125 24,444 25,169 25,624 26,241
OCCUPATION - Civilian employed population
Management, business, science, and arts occupations 15,974 15,831 16,314 16,316 16,354 16,300
Service occupations 8,671 8,872 8,972 9,083 8,887 9,320
Sales and office occupations 11,959 11,817 11,261 10,814 10,620 10,061
Natural resources, construction, and maintenance occupations 3,245 3,250 3,143 2,923 2,916 2,644
Production, transportation, and material moving occupations 3,921 3,622 3,728 3,457 3,272 3,095
INDUSTRY - Civilian employed population
Agriculture, forestry, fishing and hunting, and mining 536 472 488 379 293 277
Construction 2,161 2,205 2,209 2,043 2,041 2,048
Manufacturing 2,113 2,047 1,917 1,901 1,682 1,680
Wholesale trade 1,103 974 912 931 923 772
Retail trade 6,225 6,356 6,450 6,144 6,132 6,284
Transportation and warehousing, and utilities 1,745 1,599 1,842 1,665 1,547 1,527
Information 907 861 876 721 718 704
Finance and insurance, and real estate and rental and leasing 2,366 2,225 1,819 1,860 2,077 2,049
Professional, scientific, and management, and administrative and
waste management services 3,492 3,680 3,493 3,346 3,418 3,298
Educational services, and health care and social assistance 15,056 14,972 15,679 15,843 15,409 15,128
Arts, entertainment, and recreation, and accommodation and food
services 4,496 4,297 4,245 4,274 4,390 4,252
Other services, except public administration 1,762 1,913 2,004 1,870 1,849 1,757
Public administration 1,808 1,791 1,484 1,616 1,570 1,644
CLASS OF WORKER - Civilian employed population
Private wage and salary workers 33,731 33,767 33,829 33,148 32,634 32,091
Government workers 7,483 6,906 7,040 7,271 7,219 7,154
Self-employed in own not incorporated business workers 2,477 2,627 2,494 2,121 2,166 2,150
Unpaid family workers 79 92 55 53 30 25
INCOME AND BENEFITS
Total households 33,915 33,994 34,157 34,280 34,023 33,795
Median household income (dollars) $48,676 $47,832 $48,387 $48,541 $49,853 $48,317
Mean household income (dollars) $58,542 $59,266 $60,170 $61,585 $62,668 $62,009
With earnings 26,092 26,173 26,233 26,137 25,678 25,436
Mean earnings (dollars) $59,701 $60,225 $61,383 $62,938 $64,569 $64,425
With Social Security 9,687 9,761 9,941 10,623 11,015 10,935
Mean Social Security income (dollars) $14,985 $15,669 $16,055 $16,107 $16,050 $15,854
With retirement income 5,904 5,763 5,665 5,599 5,711 5,550
Mean retirement income (dollars) $17,480 $18,059 $18,110 $20,075 $20,530 $20,019
With Supplemental Security Income 1,762 1,842 2,086 2,291 2,262 2,356
Mean Supplemental Security Income (dollars) $7,985 $9,019 $8,511 $9,549 $11,984 $10,617
With cash public assistance income 1,991 1,887 2,017 1,955 1,829 1,764
Mean cash public assistance income (dollars) $3,121 $3,800 $3,522 $2,958 $2,636 $2,105
With Food Stamp/SNAP benefits in the past 12 months 4,662 5,154 5,932 6,476 6,533 6,551
Per capita income (dollars) $23,852 $23,699 $24,123 $25,016 $25,646 $25,604
Median earnings for workers (dollars) $24,748 $24,851 $25,119 $26,047 $26,132 $26,291
Median earnings for male full-time, year-round workers (dollars) $43,021 $45,121 $43,319 $44,873 $46,962 $47,388
Median earnings for female full-time, year-round workers (dollars) $34,272 $35,739 $36,174 $36,340 $37,397 $37,514
Source: DP03 American Community Survey 5-Year Estimates 2010, 2011, 2012, 2013, 2014, 2015
BACTS MEMBER MUNICIPALITIES
LABOR FORCE AND ECONOMIC CHARACTERISTICS
2010 - 2015

13
In 2016, BACTS residents made up 63.64
percent of the total workforce in the
Bangor Labor Market Area, 58.36 percent
of Penobscot County and 6.5 percent of
the State. These percentages have
remained fairly consistent since 2010.
The Greater Bangor area serves as an
employment hub for population greater
than that of the area and immediate
surrounding communities. In the City of
Bangor, there are 36,462 jobs and a
civilian labor force of 16,827. (Figure
2.16)
Labor Force Projections
Just like the population forecasts,
forecasts for the labor force predicts
growth between now and 2040 strictly by
formula and does not account for the
natural and manufactured dynamic that
have the potential to significantly affect
economic growth. Based on the formula
forecast, the civilian workforce of the
Bangor Labor Market Area is expected to
increase by 11.68 percent between now
and 2040. (Figure 2.17)
There has been a growing emphasis and concern on
the effects of the aging population, stagnant in-
migration and decline in birth rates on the available
workforce, and ultimate potential for an economic
crisis in the State. This is the result of conditions
that have been developing over a number of years.
There is great concern that the implications of
population trends are lower tax revenue, greater
demands on services, smaller school populations
and an inadequate workforce. In order to attract new and expanding enterprises to the area, businesses
will require an available, skilled workforce. If the workforce is unavailable, locating here will not be
attractive and economic growth will not occur.
Employment
In 2016, BACTS residents made up 63.64 percent of the total workforce in the Bangor Labor Market Area,
58.36 percent of Penobscot County and 6.5 percent of the State. These percentages have remained fairly
consistent since 2010. The Greater Bangor area serves as an employment hub for population greater than
that of the area and immediate surrounding communities. In the City of Bangor, there are 36,462 jobs and
a civilian labor force of 16,827. (Figure 2.16)
Bangor
LMA
Penobscot
CountyMaine
1990 42,322 63,220 74,551 633,069 66.94% 56.77% 6.69%
1991 42,501 64,013 75,492 645,139 66.39% 56.30% 6.59%
1992 41,864 63,914 75,427 644,489 65.50% 55.50% 6.50%
1993 41,504 62,995 73,758 628,854 65.88% 56.27% 6.60%
1994 40,495 62,059 72,535 621,684 65.25% 55.83% 6.51%
1995 41,693 63,591 74,131 637,534 65.56% 56.24% 6.54%
1996 42,325 64,967 75,547 656,737 65.15% 56.02% 6.44%
1997 42,280 64,680 74,793 656,709 65.37% 56.53% 6.44%
1998 42,212 65,123 74,997 653,210 64.82% 56.28% 6.46%
1999 43,401 67,430 77,190 668,497 64.36% 56.23% 6.49%
2000 42,578 66,426 75,494 678,164 64.10% 56.40% 6.28%
2001 42,772 66,725 75,763 674,319 64.10% 56.45% 6.34%
2002 42,963 67,119 76,195 675,232 64.01% 56.39% 6.36%
2003 43,646 68,226 76,852 683,535 63.97% 56.79% 6.39%
2004 43,187 67,899 75,961 686,000 63.60% 56.85% 6.30%
2005 43,970 69,202 77,286 697,153 63.54% 56.89% 6.31%
2006 44,199 69,491 77,596 701,541 63.60% 56.96% 6.30%
2007 44,891 70,406 78,551 700,468 63.76% 57.15% 6.41%
2008 45,083 70,726 78,814 701,646 63.74% 57.20% 6.43%
2009 44,701 70,411 78,535 696,219 63.49% 56.92% 6.42%
2010 45,091 70,944 79,052 695,182 63.56% 57.04% 6.49%
2011 45,506 71,590 79,570 699,281 63.56% 57.19% 6.51%
2012 45,852 72,143 79,865 702,636 63.56% 57.41% 6.53%
2013 46,180 72,639 80,294 707,368 63.57% 57.51% 6.53%
2014 45,567 71,695 78,962 696,593 63.56% 57.71% 6.54%
2015 44,575 70,088 76,761 682,701 63.60% 58.07% 6.53%
2016 44,910 70,566 76,955 690,624 63.64% 58.36% 6.50%
Source: http://www.maine.gov/labor/cwri/laus1.html
BACTSBangor
LMA
Penobscot
CountyMaine
Total Civilian Workforce by Geography BACTS Perentage of Workforce
Civilian Labor Force
1990 - 2016
Figure 2.16
Civilian Labor
ForceEmployed Unemployed
Unemployment
Rate
2020 71,865 68,768 3,096 4.3%
2025 73,868 70,396 3,472 4.7%
2030 75,514 71,581 3,933 5.2%
2035 77,160 72,766 4,394 5.7%
2040 78,806 73,951 4,855 6.2%
BANGOR LABOR MARKET AREA
FORECASTED LABOR FORCE STATISTICS
2020 - 2040
Forecasts were calculated using 2000 - 2016 historical values provided by the Maine
Department of Labor and the AAA version of the Exponential Smoothing (ETS) algorithm.

14
The Bangor LMA, as well as the State and Penobscot
County, are experiencing the lowest unemployment rates in
15 years. Since 2010, the unemployment rate has decreased
from 8.10 percent to 3.90 percent for the State as a whole
and from 7.80 percent to 3.80 percent for the Bangor LMA.
In 2016, BACTS communities had some of the lowest
unemployment rates in Penobscot County. Edinburg had
the lowest unemployment rate (1 out of 78 people in the
labor force are unemployed), followed by Orono at 2.7. At
5.1 Penobscot Indian Island had the highest unemployment
rate of all BACTS communities; however, lower than 54
percent of all the communities in Penobscot County.
According to the Maine Development Foundation, 24,300
nonfarm payroll jobs were created in the State between 2010 and 2016. Of those jobs, 27.6 percent, or
6,700 jobs, were created between 2015 and 2016. With unemployment rates at 15-year lows, employers
are reporting difficulty in finding an adequate workforce. (Figure 2.18)
Of Penobscot County’s top 25 largest employers, only one, Millinocket Regional Hospital, is not based in
the Greater Bangor area. Eight of the top 25 largest employers in Penobscot County are also among the
top 50 private employers in the State.
Rank Name Employment Range Business Description
1 EASTERN MAINE MEDICAL CENTER 4,001 to 4,500 General medical and surgical hospitals
2 ST JOSEPH HOSPITAL INC 1,001 to 1,500 General medical and surgical hospitals
3 WAL MART / SAM'S CLUB 1,001 to 1,500 Warehouse clubs and supercenters
4 HANNAFORD BROS CO 501 to 1,000 Supermarkets and other grocery stores
5 EMHS 501 to 1,000 Office administrative services
6 PENOBSCOT COMMUNITY HEALTH CARE 501 to 1,000 Offices of physicians, except mental health
7 HUSSON UNIVERSITY 501 to 1,000 Colleges and universities
8 ACADIA HOSPITAL CORP 501 to 1,000 Psychiatric and substance abuse hospitals
9 BANGOR SAVINGS BANK 501 to 1,000 Savings institutions
10 GENERAL ELECTRIC CO 1 to 500 Switchgear and switchboard apparatus mfg.
11 HC BANGOR LLC 1 to 500 Casino hotels
12 PENQUIS C.A.P., INC. 1 to 500 Other individual and family services
13 EMERA MAINE 1 to 500 Electric power distribution
14 OHI 1 to 500 Services for the elderly and disabled
15 DYSARTS SERVICE INC 1 to 500 Other gasoline stations
16 GLOBAL SPECTRUM LP 1 to 500 Promoters with facilities
17 COMMUNITY HEALTH AND COUNSELING SVC 1 to 500 Other individual and family services
18 SARGENT CORPORATION 1 to 500 Nonresidential site preparation contractors
19 DARLINGS 1 to 500 New car dealers
20 JOHN T CYR AND SON INC 1 to 500 School and employee bus transportation
21 LOWES HOME CENTERS LLC 1 to 500 Home centers
22 UPS SOLUTIONS 1 to 500 Couriers and express delivery services
23 VERIZON WIRELESS 1 to 500 Electronics stores
24 MICRODYNE OUTSOURCING INC 1 to 500 Telemarketing and other contact centers
25 MILLINOCKET REGIONAL HOSPITAL 1 to 500 General medical and surgical hospitals
Source: http://www.maine.gov/labor/cwri/qcew3.html
Top 25 Largest Emplyers
Penobscot County
2016
Labor Force EmploymentUnemployment
Rate
Bangor 16,827 16,207 3.7
Bradley 779 741 4.9
Brewer 5,062 4,894 3.3
Hampden 4,398 4,276 2.8
Hermon 3,415 3,310 3.1
Milford 1,640 1,557 5.1
Old Town 4,226 4,075 3.6
Orono 5,220 5,079 2.7
Orrington 2,127 2,060 3.1
Penobscot Indian Island 255 242 5.1
Veazie 961 929 3.3
Bangor Labor Market Area 70,570 67,890 3.8
Penobscot County 76,955 73,593 4.4
Maine 690,624 664,010 3.9
2016 Annual Average Civilian Labor Force
Figure 2.18
Figure 2.19

15
Occupations
The occupations with the highest percentage of positions in Penobscot County include Administrative,
Sales and Related, Education, and Management. The Maine Center for Workforce Research and
Information estimates that the top five highest growing occupations between now and 2024 in the State
will be Healthcare Practitioners and Technical Occupations, Healthcare Support Occupations, Food
Preparation and Serving Related Occupations, Personal Care and Service Occupations and Computer and
Mathematical Occupations. The highest paying occupations in 2016 for the Bangor Labor Market Area
were Management Occupations, Computer and Mathematical Occupations and Healthcare Practitioner
and Technical Occupations.
Industry
The highest percentage of jobs in Penobscot County are in Healthcare, Retail, and Education Industries.
That largest sector is Healthcare, and is expected to be the sector with the highest growth rate through
2024. The State projects that the highest growth will occur in Health Care and Social Assistance,
Professional and Business Services, Educational Services, Leisure and Hospitality and Service-
Providing industries.
Travel to Work
As is the case throughout the State of Maine, the majority of workers in the BACTS area, travel
individually by passenger automobile. However, compared to the State and Penobscot County, a higher
percentage of the worker population in the BACTS area use alternate transportation modes of
transportation. Workers from Old Town (14.0%) and Penobscot Indian Island (23.90%) carpool to work
at a significantly higher percentage of all BACTS communities, Penobscot County and the States.
Occupation
Estimated
Employment
Mean
(Average)
Median
(50th Percentile)
Total all occupations 64,230 $20.01 $15.76
Management Occupations 3,300 $41.94 $36.10
Business and Financial Operations Occupations 2,210 $27.81 $25.68
Computer and Mathematical Occupations 1,090 $35.28 $30.11
Architecture and Engineering Occupations 600 $27.31 $24.55
Life, Physical, and Social Science Occupations 390 $28.74 $24.37
Community and Social Services Occupations 1,760 $22.01 $20.28
Legal Occupations 390 $31.24 $23.99
Education, Training, and Library Occupations 4,700 $23.16 $20.53
Arts, Design, Entertainment, Sports, and Media Occupations 840 $18.69 $15.94
Healthcare Practitioners and Technical Occupations 5,050 $36.86 $29.20
Healthcare Support Occupations 2,670 $13.66 $12.89
Protective Service Occupations 1,430 $16.66 $15.21
Food Preparation and Serving-Related Occupations 6,160 $10.52 $9.40
Building and Grounds Cleaning and Maintenance Occupations 2,580 $12.49 $11.34
Personal Care and Service Occupations 2,930 $11.67 $10.92
Sales and Related Occupations 6,790 $14.92 $10.97
Office and Administrative Support Occupations 9,810 $16.09 $15.08
Farming, Fishing, and Forestry Occupations 150 $17.07 $16.92
Construction and Extraction Occupations 2,580 $18.60 $17.57
Installation, Maintenance, and Repair Occupations 2,770 $20.86 $19.12
Production Occupations 2,320 $16.28 $14.53
Transportation and Material Moving Occupations 3,720 $16.28 $14.72
Source: http://www.maine.gov/labor/cwri/oes1.html
2016
Hourly Wage by Occupation
Bangor MSA
Figure 2.20

16
The percentage of Orono residents who use alternate modes (transit, walk and bicycle) of transportation
to get to work is significantly higher than any other community. More than 20 percent of the civilian
workforce walk to work, and almost 2 percent bicycle to work. Penobscot Indian Island and Bangor
residents also have a higher percentage of workers walking to work at 7.6% and 5.2%, respectively. Old
Town residents have a notable percentage (2.3%) of workers using bicycles as a means of transportation
to work. Veazie residents use public transit at a higher rate (2.6%) than of workers of any of the other
communities. (Figure 2.21)
The average of all BACTS area residents spend less time traveling to work than the County and State as
a whole. Between 2010 and 2015, mean travel time to work for residents of BACTS communities
decreased slightly, but increased for Penobscot County and the State as a whole over the same time
period. In 2015, workers from both Bradley and Milford spent more than 23 minutes traveling to work,
the highest in the BACTS area, but consistent with the State as a whole. The most significant changes in
mean travel time between 2010 and 2015 for BACTS area residents include a decrease of 6.20 minutes
for Milford residents and an increase of 2.6 minutes for Penobscot Indian Island residents. (Figure 2.22)
2010 2011 2012 2013 2014 2015
2010-2015
Change
Bangor 15.20 15.70 15.40 15.20 14.60 14.70 -0.50
Bradley 22.70 23.60 24.40 22.60 21.90 23.70 1.00
Brewer 16.70 17.90 18.20 16.90 17.70 18.40 1.70
Hampden 20.00 20.40 19.80 20.30 19.50 20.40 0.40
Hermon 20.40 19.80 21.90 19.60 19.50 19.70 -0.70
Milford 29.50 28.80 25.30 25.90 25.90 23.30 -6.20
Old Town 18.90 19.50 18.90 19.80 19.50 19.90 1.00
Orono 16.40 16.90 16.00 16.30 15.50 15.30 -1.10
Orrington 20.00 20.40 20.20 20.10 18.80 20.70 0.70
Penobscot Indian Island 14.80 14.50 16.00 16.40 17.80 17.40 2.60
Veazie 20.10 20.50 20.10 21.70 22.70 19.00 -1.10
BACTS Municipalities (Average) 19.52 19.82 19.65 19.53 19.40 19.32 -0.20
Penobscot County 21.50 22.10 22.00 22.00 21.90 22.30 0.80
Maine 22.80 23.00 23.30 23.30 23.50 23.60 0.80
Source: DP03 American Community Survey 5-Year Estimates 2010, 2011, 2012, 2013, 2014, 2015
MEAN TRAVEL TIME TO WORK
(in minutes)
2010 - 2015
Total 2-person 3-person 4-person Walked Bicycle
Bangor 14,942 12,940 11,371 1,584 1,330 164 90 15,988 224 777 30 299 672
Bradley 726 675 632 43 43 0 0 748 0 14 0 0 37
Brewer 4,941 4,481 3,973 509 445 30 35 5,237 25 44 5 168 222
Hampden 4,009 3,776 3,508 269 204 0 60 4,169 0 24 0 0 208
Hermon 3,040 2,909 2,642 264 198 36 33 3,192 0 0 0 36 97
Milford 1,620 1,523 1,374 147 105 44 0 1,717 0 11 0 60 28
Old Town 3,758 3,217 2,694 526 477 34 15 4,096 34 98 86 210 113
Orono 4,617 3,333 2,881 452 351 65 37 4,986 46 951 83 18 180
Orrington 1,887 1,757 1,628 128 128 0 0 1,962 0 17 0 0 113
Penobscot Indian Island 330 291 212 79 61 14 4 383 3 25 0 3 8
Veazie 934 867 782 85 66 18 1 990 24 7 0 14 22
BACTS Total 40,804 35,770 31,697 4,087 3,409 404 275 43,470 356 1,968 204 809 1,701
Penobscot County 70,797 63,434 56,496 6,938 5,947 637 425 75,045 425 2,761 212 1,062 2,903Maine 635,475 561,124 495,671 65,454 54,015 6,355 4,448 679,958 3,813 25,419 2,542 7,626 34,316
Source: S0801 2011-2015 American Community Survey 5-Year Estimates
Car, Truck or Van
Carpool
Alternate Transportation
Active Transportation
MEANS OF TRANSPORTATION TO WORK
2015
Public
Transit
Taxicab,
motorcycle
or other
Total SOV
Workers per
car, truck, or
van
Total
Workers
(16 years
and older)
Worked
at home
Figure 2.21

17
The Maine Department of Labor reports that within a 30-mile range of Bangor, there is a total of 185,239
residents; a civilian labor force of 97,311; and 82,626 jobs. As shown in Figure 2.23, in 2015 there was
a 58,169 worker population in the BACTS area, with only 16,978 BACTS area residents filling those jobs.
Meaning 41,191 individuals travel into and within the BACTS area on a daily basis for employment.
Although, not necessarily in the same community of their residence, 88 percent of BACTS area residents
are also employed within the BACTS area. Twelve percent travel outside of the BACTS area for
employment.
2.6 Demographic Challenges
Both employment and population in the BACTS area are expected to grow very slowly. While the
majority of population growth will occur outside the BACTS area, most of the job growth will occur
within it. This imbalance will accentuate the current trend of increasing numbers of vehicular trips to the
urban area originating outside the urban area.
Workforce challenges are expected to become more acute in the near future, as the population ages and
the current workforce retires. Many of the baby boomers that are still in the labor force will be retiring.
If current conditions persist, there will be a lack of available workers to maintain, much less grow, the
workforce in the coming years.
While the overall outlook for the State’s economy is fairly concerning because of the potential
workforce shortages that will be experienced should nothing change, the BACTS area is poised to be an
attractive area for economic and business development opportunities if proactive measures are taken to
induce in-migration of out of state residents to the area. The BACTS area is a metropolitan area, located
along the Interstate 95 corridor, with available public transportation and a lower than average median
age (for Maine). Transportation assets should be improved and expanded to ensure that the area remains
attractive for business development.
2.7 Recommendations
Increase transportation alternatives for senior populations
Implement strategies to attract in-migration of non-native residents to the area
Increase the availability, reliability and accessibility of public transportation
Resources:
Worker
Population Resident In Flow
Worker
Population Resident In Flow
Worker
Population Resident In Flow
Bangor 36,311 10,776 25,535 35,485 10,349 25,136 35,165 10,014 25,151
Bradley 265 69 196 300 76 224 286 93 193
Brewer 6,057 1,490 4,567 6,482 1,459 5,023 6,621 1,478 5,143
Hampden 2,409 580 1,829 2,240 613 1,627 2,241 540 1,701
Hermon 2,423 618 1,805 2,522 615 1,907 2,415 645 1,770
Milford 597 280 317 541 237 304 460 176 284
Old Town 2,733 1,070 1,663 2,980 1,171 1,809 2,905 1,056 1,849
Orono 6,724 2,300 4,424 6,922 2,447 4,475 7,048 2,535 4,513
Orrington 511 269 242 553 279 274 508 232 276
Penobscot Indian Island 206 147 59 204 149 55 221 139 82
Veazie 280 42 238 278 51 227 299 70 229
Total 58,516 17,641 40,875 58,507 17,446 41,061 58,169 16,978 41,191
WORKERS COMMUTING TO BACTS AREA MUNICIPALITIES BY PLACE OF EMPLOYMENT
2013 - 2015
2013 2014 2015
Source: U.S. Census Bureau, 2009-2013 American Community Survey
Figure 2.23

18
https://statisticalatlas.com/metro-area/Maine/Bangor/Overview
https://datausa.io/profile/geo/penobscot-county-me/
Maine State Plan on Aging 2016 - 2020.
http://www.maine.gov/dhhs/oads/trainings-resources/documents/STATEPLANONAGING2016-
2020DRAFT.pdf
https://onthemap.ces.census.gov/