Embed Size (px)
Citation preview
2020
2020 Results Announcement31 December 2020

3
Bank of Ireland 2020 Results Announcement
Group CEOFrancesca McDonagh

5
Bank of Ireland 2020 Results AnnouncementSummary
2020 Performance
Transformation
Asset Quality
Capital
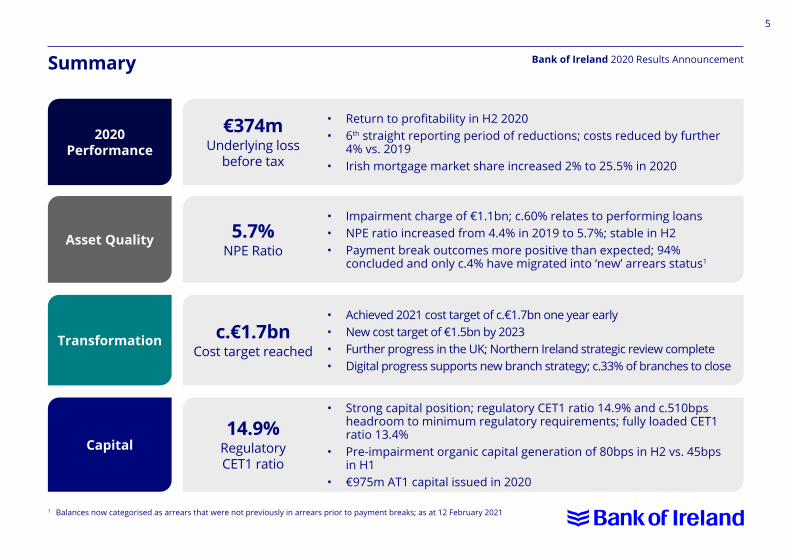
• Return to profitability in H2 2020• 6th straight reporting period of reductions; costs reduced by further
4% vs. 2019 • Irish mortgage market share increased 2% to 25.5% in 2020
• Impairment charge of €1.1bn; c.60% relates to performing loans• NPE ratio increased from 4.4% in 2019 to 5.7%; stable in H2• Payment break outcomes more positive than expected; 94%
concluded and only c.4% have migrated into ‘new’ arrears status1
• Achieved 2021 cost target of c.€1.7bn one year early• New cost target of €1.5bn by 2023• Further progress in the UK; Northern Ireland strategic review complete• Digital progress supports new branch strategy; c.33% of branches to close
• Strong capital position; regulatory CET1 ratio 14.9% and c.510bps headroom to minimum regulatory requirements; fully loaded CET1 ratio 13.4%
• Pre-impairment organic capital generation of 80bps in H2 vs. 45bps in H1
• €975m AT1 capital issued in 2020
€374mUnderlying loss
before tax
5.7%NPE Ratio
c.€1.7bnCost target reached
14.9%Regulatory CET1 ratio
1 Balances now categorised as arrears that were not previously in arrears prior to payment breaks; as at 12 February 2021
6
Bank of Ireland 2020 Results Announcement
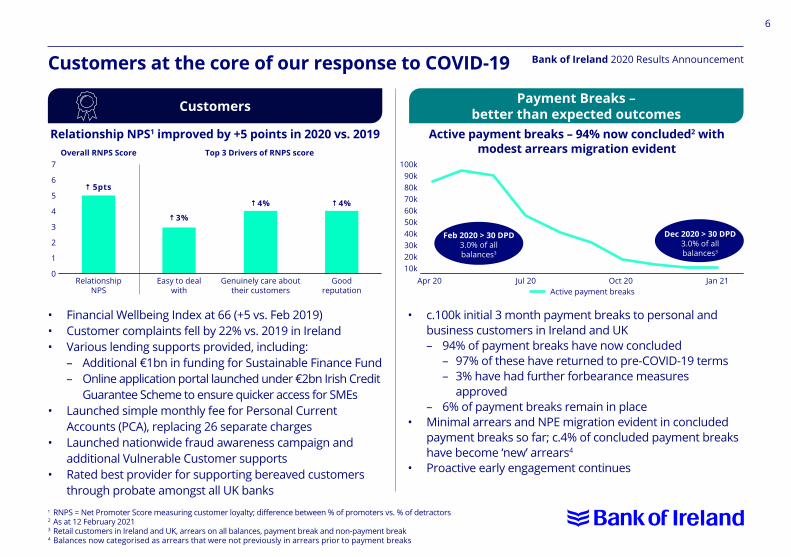
• Financial Wellbeing Index at 66 (+5 vs. Feb 2019) • Customer complaints fell by 22% vs. 2019 in Ireland• Various lending supports provided, including: – Additional €1bn in funding for Sustainable Finance Fund – Online application portal launched under €2bn Irish Credit
Guarantee Scheme to ensure quicker access for SMEs • Launched simple monthly fee for Personal Current
Accounts (PCA), replacing 26 separate charges• Launched nationwide fraud awareness campaign and
additional Vulnerable Customer supports• Rated best provider for supporting bereaved customers
through probate amongst all UK banks
Customers Payment Breaks – better than expected outcomes
Customers at the core of our response to COVID-19
1 RNPS = Net Promoter Score measuring customer loyalty; difference between % of promoters vs. % of detractors2 As at 12 February 20213 Retail customers in Ireland and UK, arrears on all balances, payment break and non-payment break4 Balances now categorised as arrears that were not previously in arrears prior to payment breaks
• c.100k initial 3 month payment breaks to personal and business customers in Ireland and UK
– 94% of payment breaks have now concluded – 97% of these have returned to pre-COVID-19 terms – 3% have had further forbearance measures
approved – 6% of payment breaks remain in place• Minimal arrears and NPE migration evident in concluded
payment breaks so far; c.4% of concluded payment breaks have become ‘new’ arrears4
• Proactive early engagement continues
Relationship NPS1 improved by +5 points in 2020 vs. 2019 Active payment breaks – 94% now concluded2 with modest arrears migration evidentOverall RNPS Score Top 3 Drivers of RNPS score
Relationship NPS
Apr 20Easy to deal with
Jul 20Good reputation
Jan 21Genuinely care about their customers
Oct 20
7 100k90k
70k
340k
5
60k
1 20k
680k
2 30k
450k
010k
3%
4% 4%
5pts
Active payment breaks
Feb 2020 > 30 DPD3.0% of all balances3
Dec 2020 > 30 DPD3.0% of all balances3
7
Bank of Ireland 2020 Results Announcement
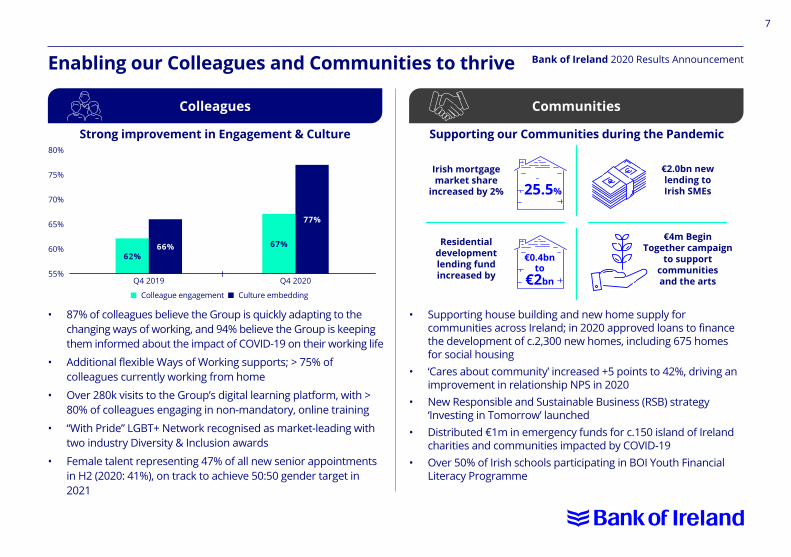
67%
77%
• 87% of colleagues believe the Group is quickly adapting to the changing ways of working, and 94% believe the Group is keeping them informed about the impact of COVID-19 on their working life
• Additional flexible Ways of Working supports; > 75% of colleagues currently working from home
• Over 280k visits to the Group’s digital learning platform, with > 80% of colleagues engaging in non-mandatory, online training
• “With Pride” LGBT+ Network recognised as market-leading with two industry Diversity & Inclusion awards
• Female talent representing 47% of all new senior appointments in H2 (2020: 41%), on track to achieve 50:50 gender target in 2021
Colleagues Communities
Enabling our Colleagues and Communities to thrive
• Supporting house building and new home supply for communities across Ireland; in 2020 approved loans to finance the development of c.2,300 new homes, including 675 homes for social housing
• ‘Cares about community’ increased +5 points to 42%, driving an improvement in relationship NPS in 2020
• New Responsible and Sustainable Business (RSB) strategy ‘Investing in Tomorrow’ launched
• Distributed €1m in emergency funds for c.150 island of Ireland charities and communities impacted by COVID-19
• Over 50% of Irish schools participating in BOI Youth Financial Literacy Programme
Strong improvement in Engagement & Culture Supporting our Communities during the Pandemic
Q4 2020
70%
80%
60%
65%
75%
55%
Irish mortgage market share
increased by 2%
Residential development lending fund increased by
€4m Begin Together campaign
to support communities and the arts
n Colleague engagement n Culture embedding
62%66%
25.5%
€2.0bn new lending to Irish SMEs
€0.4bn to
€2bnQ4 2019
8
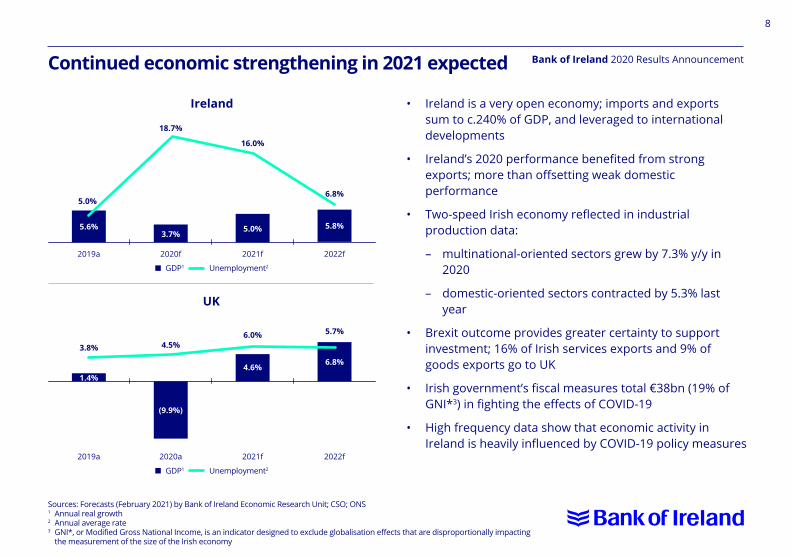
Bank of Ireland 2020 Results AnnouncementContinued economic strengthening in 2021 expected
• Ireland is a very open economy; imports and exports sum to c.240% of GDP, and leveraged to international developments
• Ireland’s 2020 performance benefited from strong exports; more than offsetting weak domestic performance
• Two-speed Irish economy reflected in industrial production data:
– multinational-oriented sectors grew by 7.3% y/y in 2020
– domestic-oriented sectors contracted by 5.3% last year
• Brexit outcome provides greater certainty to support investment; 16% of Irish services exports and 9% of goods exports go to UK
• Irish government’s fiscal measures total €38bn (19% of GNI*3) in fighting the effects of COVID-19
• High frequency data show that economic activity in Ireland is heavily influenced by COVID-19 policy measures
Ireland
n GDP1 Unemployment2
n GDP1 Unemployment2
Sources: Forecasts (February 2021) by Bank of Ireland Economic Research Unit; CSO; ONS1 Annual real growth2 Annual average rate3 GNI*, or Modified Gross National Income, is an indicator designed to exclude globalisation effects that are disproportionally impacting the measurement of the size of the Irish economy
5.0%
3.8%
18.7%
4.5%6.0%
16.0%
5.7%
3.7%
(9.9%)
5.0%
6.8%4.6%
5.6%
1.4%
UK
2019a 2021f2020f 2022f
2019a 2021f2020a 2022f
5.8%
6.8%
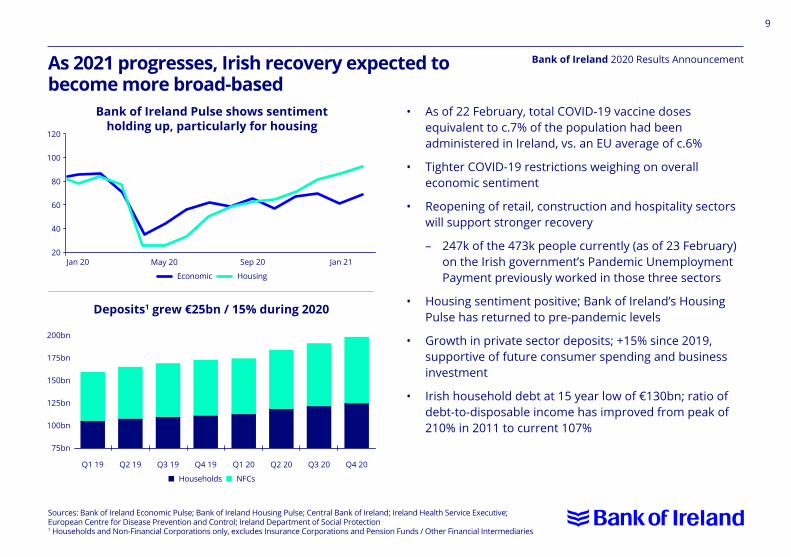
9
Bank of Ireland 2020 Results AnnouncementAs 2021 progresses, Irish recovery expected to become more broad-based
• As of 22 February, total COVID-19 vaccine doses equivalent to c.7% of the population had been administered in Ireland, vs. an EU average of c.6%
• Tighter COVID-19 restrictions weighing on overall economic sentiment
• Reopening of retail, construction and hospitality sectors will support stronger recovery
– 247k of the 473k people currently (as of 23 February) on the Irish government’s Pandemic Unemployment Payment previously worked in those three sectors
• Housing sentiment positive; Bank of Ireland’s Housing Pulse has returned to pre-pandemic levels
• Growth in private sector deposits; +15% since 2019, supportive of future consumer spending and business investment
• Irish household debt at 15 year low of €130bn; ratio of debt-to-disposable income has improved from peak of 210% in 2011 to current 107%
Bank of Ireland Pulse shows sentiment holding up, particularly for housing
Economic Housing
n Households n NFCs
Sources: Bank of Ireland Economic Pulse; Bank of Ireland Housing Pulse; Central Bank of Ireland; Ireland Health Service Executive; European Centre for Disease Prevention and Control; Ireland Department of Social Protection1 Households and Non-Financial Corporations only, excludes Insurance Corporations and Pension Funds / Other Financial Intermediaries
Deposits1 grew €25bn / 15% during 2020
Jan 20 Sep 20May 20 Jan 21
Q1 19 Q3 19Q2 19 Q4 19 Q1 20 Q3 20Q2 20 Q4 20
20
80
60
40
75bn
100bn
125bn
150bn
175bn
200bn
100
120
10
Bank of Ireland 2020 Results Announcement
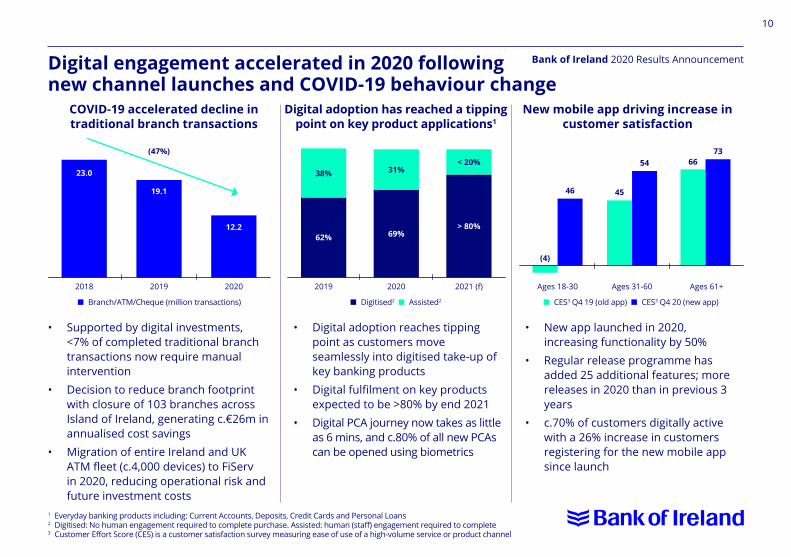
(4)
46
66
45
5473
Digital engagement accelerated in 2020 following new channel launches and COVID-19 behaviour change
• Supported by digital investments, <7% of completed traditional branch transactions now require manual intervention
• Decision to reduce branch footprint with closure of 103 branches across Island of Ireland, generating c.€26m in annualised cost savings
• Migration of entire Ireland and UK ATM fleet (c.4,000 devices) to FiServ in 2020, reducing operational risk and future investment costs
• Digital adoption reaches tipping point as customers move seamlessly into digitised take-up of key banking products
• Digital fulfilment on key products expected to be >80% by end 2021
• Digital PCA journey now takes as little as 6 mins, and c.80% of all new PCAs can be opened using biometrics
• New app launched in 2020, increasing functionality by 50%
• Regular release programme has added 25 additional features; more releases in 2020 than in previous 3 years
• c.70% of customers digitally active with a 26% increase in customers registering for the new mobile app since launch
COVID-19 accelerated decline in traditional branch transactions
Digital adoption has reached a tipping point on key product applications1
New mobile app driving increase in customer satisfaction
1 Everyday banking products including: Current Accounts, Deposits, Credit Cards and Personal Loans 2 Digitised: No human engagement required to complete purchase. Assisted: human (staff) engagement required to complete3 Customer Effort Score (CES) is a customer satisfaction survey measuring ease of use of a high-volume service or product channel
2018 2019 Ages 18-30 Ages 31-60 Ages 61+2019 20202020 2021 (f)
n Branch/ATM/Cheque (million transactions) n Digitised2 n Assisted2 n CES3 Q4 19 (old app) n CES3 Q4 20 (new app)
62%
38%23.0
19.1
12.2
(47%)
69%> 80%
31%< 20%
11
Bank of Ireland 2020 Results Announcement
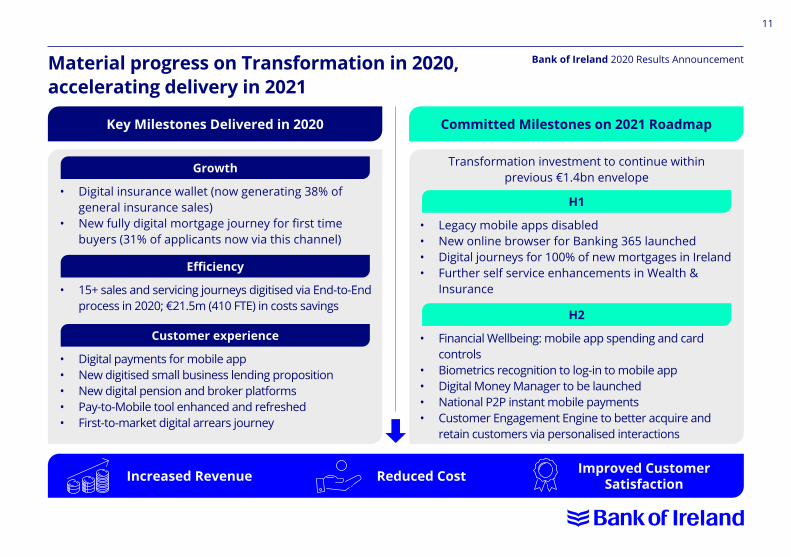
• Legacy mobile apps disabled• New online browser for Banking 365 launched• Digital journeys for 100% of new mortgages in Ireland• Further self service enhancements in Wealth &
Insurance
• Financial Wellbeing: mobile app spending and card controls
• Biometrics recognition to log-in to mobile app• Digital Money Manager to be launched• National P2P instant mobile payments• Customer Engagement Engine to better acquire and
retain customers via personalised interactions
Transformation investment to continue within previous €1.4bn envelope
Key Milestones Delivered in 2020
Increased Revenue Reduced Cost Improved Customer Satisfaction
Committed Milestones on 2021 Roadmap
H1
H2
Material progress on Transformation in 2020, accelerating delivery in 2021
• Digital insurance wallet (now generating 38% of general insurance sales)
• New fully digital mortgage journey for first time buyers (31% of applicants now via this channel)
• 15+ sales and servicing journeys digitised via End-to-End process in 2020; €21.5m (410 FTE) in costs savings
Growth
Efficiency
• Digital payments for mobile app• New digitised small business lending proposition• New digital pension and broker platforms• Pay-to-Mobile tool enhanced and refreshed• First-to-market digital arrears journey
Customer experience
12
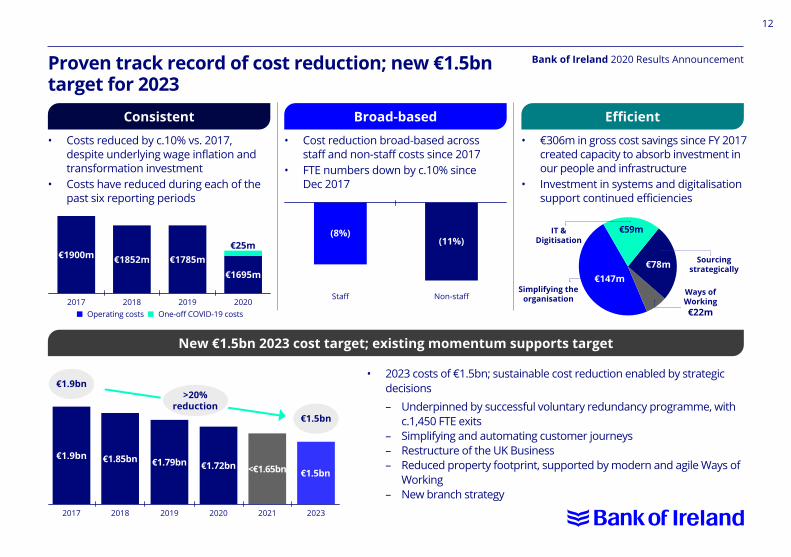
Bank of Ireland 2020 Results AnnouncementProven track record of cost reduction; new €1.5bn target for 2023
• Costs reduced by c.10% vs. 2017, despite underlying wage inflation and transformation investment
• Costs have reduced during each of the past six reporting periods
• 2023 costs of €1.5bn; sustainable cost reduction enabled by strategic decisions
– Underpinned by successful voluntary redundancy programme, with c.1,450 FTE exits
– Simplifying and automating customer journeys – Restructure of the UK Business – Reduced property footprint, supported by modern and agile Ways of
Working – New branch strategy
• Cost reduction broad-based across staff and non-staff costs since 2017
• FTE numbers down by c.10% since Dec 2017
• €306m in gross cost savings since FY 2017 created capacity to absorb investment in our people and infrastructure
• Investment in systems and digitalisation support continued efficiencies
Consistent
New €1.5bn 2023 cost target; existing momentum supports target
Broad-based Efficient
Non-staffStaff
2017 20192018 2020 2021 2023
€1.9bn €1.85bn €1.79bn €1.72bn€1.5bn<€1.65bn
€1.9bn
€1.5bn
(8%)(11%)
Simplifying the organisation
IT & Digitisation
Sourcing strategically
Ways of Working €22m
€147m€78m
€59m
2017 20192018 2020
€25m€1900m €1852m €1785m
€1695m
n Operating costs n One-off COVID-19 costs
>20% reduction
13
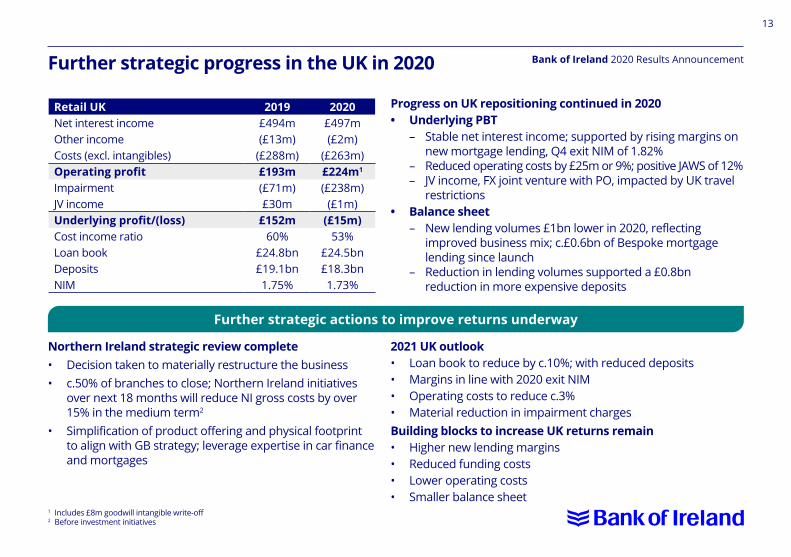
Bank of Ireland 2020 Results AnnouncementFurther strategic progress in the UK in 2020
Northern Ireland strategic review complete• Decision taken to materially restructure the business • c.50% of branches to close; Northern Ireland initiatives
over next 18 months will reduce NI gross costs by over 15% in the medium term2
• Simplification of product offering and physical footprint to align with GB strategy; leverage expertise in car finance and mortgages
Progress on UK repositioning continued in 2020• Underlying PBT – Stable net interest income; supported by rising margins on
new mortgage lending, Q4 exit NIM of 1.82% – Reduced operating costs by £25m or 9%; positive JAWS of 12% – JV income, FX joint venture with PO, impacted by UK travel
restrictions• Balance sheet – New lending volumes £1bn lower in 2020, reflecting
improved business mix; c.£0.6bn of Bespoke mortgage lending since launch
– Reduction in lending volumes supported a £0.8bn reduction in more expensive deposits
2021 UK outlook• Loan book to reduce by c.10%; with reduced deposits• Margins in line with 2020 exit NIM• Operating costs to reduce c.3%• Material reduction in impairment chargesBuilding blocks to increase UK returns remain• Higher new lending margins• Reduced funding costs• Lower operating costs• Smaller balance sheet
Further strategic actions to improve returns underway
Retail UK 2019 2020Net interest income £494m £497mOther income (£13m) (£2m)Costs (excl. intangibles) (£288m) (£263m)Operating profit £193m £224m1
Impairment (£71m) (£238m)JV income £30m (£1m)Underlying profit/(loss) £152m (£15m)Cost income ratio 60% 53%Loan book £24.8bn £24.5bnDeposits £19.1bn £18.3bnNIM 1.75% 1.73%
1 Includes £8m goodwill intangible write-off2 Before investment initiatives
14
Bank of Ireland 2020 Results Announcement
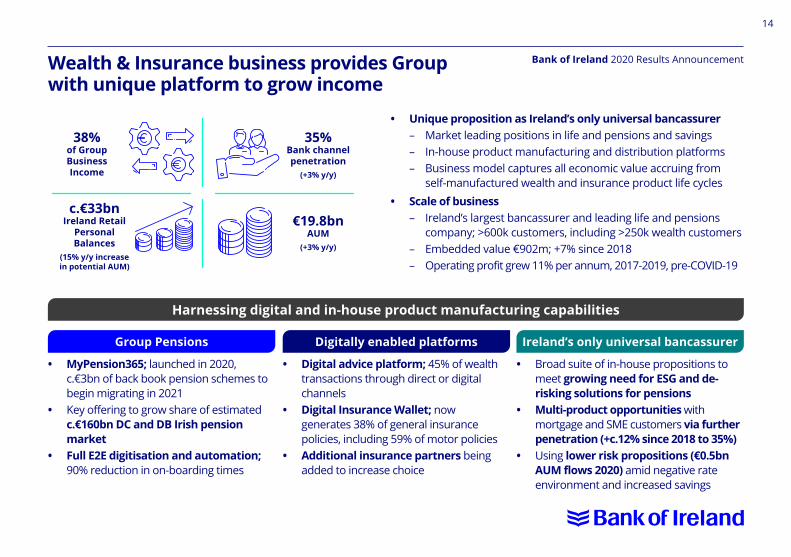
38% of Group Business Income
c.€33bnIreland Retail
Personal Balances
(15% y/y increase in potential AUM)
€19.8bnAUM
(+3% y/y)
35% Bank channel penetration
(+3% y/y)
Wealth & Insurance business provides Group with unique platform to grow income
• Unique proposition as Ireland’s only universal bancassurer – Market leading positions in life and pensions and savings – In-house product manufacturing and distribution platforms – Business model captures all economic value accruing from
self-manufactured wealth and insurance product life cycles• Scale of business – Ireland’s largest bancassurer and leading life and pensions
company; >600k customers, including >250k wealth customers – Embedded value €902m; +7% since 2018 – Operating profit grew 11% per annum, 2017-2019, pre-COVID-19
• MyPension365; launched in 2020, c.€3bn of back book pension schemes to begin migrating in 2021
• Key offering to grow share of estimated c.€160bn DC and DB Irish pension market
• Full E2E digitisation and automation; 90% reduction in on-boarding times
• Digital advice platform; 45% of wealth transactions through direct or digital channels
• Digital Insurance Wallet; now generates 38% of general insurance policies, including 59% of motor policies
• Additional insurance partners being added to increase choice
• Broad suite of in-house propositions to meet growing need for ESG and de-risking solutions for pensions
• Multi-product opportunities with mortgage and SME customers via further penetration (+c.12% since 2018 to 35%)
• Using lower risk propositions (€0.5bn AUM flows 2020) amid negative rate environment and increased savings
Harnessing digital and in-house product manufacturing capabilities
Group Pensions Digitally enabled platforms Ireland’s only universal bancassurer
15
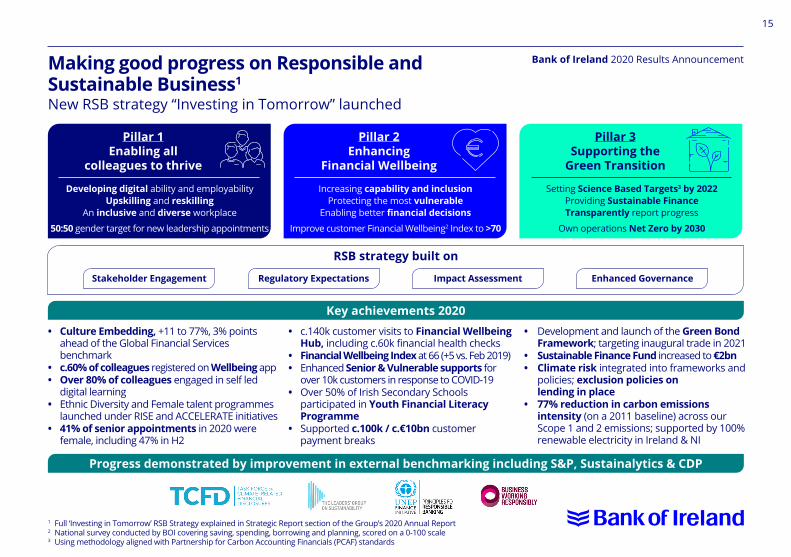
Bank of Ireland 2020 Results AnnouncementMaking good progress on Responsible and Sustainable Business1
New RSB strategy “Investing in Tomorrow” launched
Key achievements 2020
Progress demonstrated by improvement in external benchmarking including S&P, Sustainalytics & CDP
1 Full ‘Investing in Tomorrow’ RSB Strategy explained in Strategic Report section of the Group’s 2020 Annual Report2 National survey conducted by BOI covering saving, spending, borrowing and planning, scored on a 0-100 scale3 Using methodology aligned with Partnership for Carbon Accounting Financials (PCAF) standards
Pillar 1Enabling all
colleagues to thrive
Pillar 2Enhancing
Financial Wellbeing
Pillar 3Supporting the
Green Transition
Developing digital ability and employabilityUpskilling and reskilling
An inclusive and diverse workplace
50:50 gender target for new leadership appointments
Increasing capability and inclusionProtecting the most vulnerable
Enabling better financial decisionsImprove customer Financial Wellbeing2 Index to >70
Setting Science Based Targets3 by 2022Providing Sustainable FinanceTransparently report progress
Own operations Net Zero by 2030
RSB strategy built on
Stakeholder Engagement Impact AssessmentRegulatory Expectations Enhanced Governance
• Culture Embedding, +11 to 77%, 3% points ahead of the Global Financial Services benchmark
• c.60% of colleagues registered on Wellbeing app• Over 80% of colleagues engaged in self led
digital learning• Ethnic Diversity and Female talent programmes
launched under RISE and ACCELERATE initiatives• 41% of senior appointments in 2020 were
female, including 47% in H2
• c.140k customer visits to Financial Wellbeing Hub, including c.60k financial health checks
• Financial Wellbeing Index at 66 (+5 vs. Feb 2019)• Enhanced Senior & Vulnerable supports for
over 10k customers in response to COVID-19• Over 50% of Irish Secondary Schools
participated in Youth Financial Literacy Programme
• Supported c.100k / c.€10bn customer payment breaks
• Development and launch of the Green Bond Framework; targeting inaugural trade in 2021
• Sustainable Finance Fund increased to €2bn• Climate risk integrated into frameworks and
policies; exclusion policies on lending in place
• 77% reduction in carbon emissions intensity (on a 2011 baseline) across our Scope 1 and 2 emissions; supported by 100% renewable electricity in Ireland & NI

17
Bank of Ireland 2020 Results Announcement
Group CFOMyles O’Grady
18
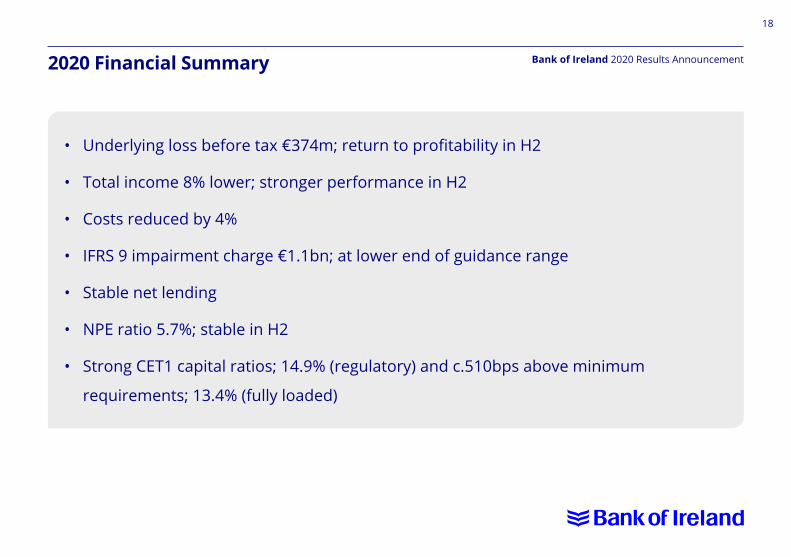
Bank of Ireland 2020 Results Announcement2020 Financial Summary
• Underlying loss before tax €374m; return to profitability in H2
• Total income 8% lower; stronger performance in H2
• Costs reduced by 4%
• IFRS 9 impairment charge €1.1bn; at lower end of guidance range
• Stable net lending
• NPE ratio 5.7%; stable in H2
• Strong CET1 capital ratios; 14.9% (regulatory) and c.510bps above minimum
requirements; 13.4% (fully loaded)
19
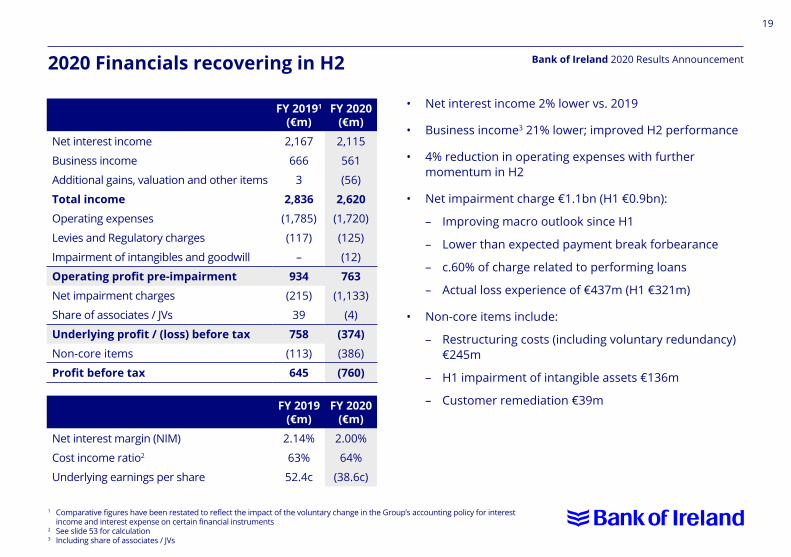
Bank of Ireland 2020 Results Announcement2020 Financials recovering in H2
• Net interest income 2% lower vs. 2019
• Business income3 21% lower; improved H2 performance
• 4% reduction in operating expenses with further momentum in H2
• Net impairment charge €1.1bn (H1 €0.9bn):
– Improving macro outlook since H1
– Lower than expected payment break forbearance
– c.60% of charge related to performing loans
– Actual loss experience of €437m (H1 €321m)
• Non-core items include:
– Restructuring costs (including voluntary redundancy) €245m
– H1 impairment of intangible assets €136m
– Customer remediation €39m
FY 20191
(€m)FY 2020
(€m)
Net interest income 2,167 2,115
Business income 666 561
Additional gains, valuation and other items 3 (56)
Total income 2,836 2,620
Operating expenses (1,785) (1,720)
Levies and Regulatory charges (117) (125)
Impairment of intangibles and goodwill – (12)
Operating profit pre-impairment 934 763
Net impairment charges (215) (1,133)
Share of associates / JVs 39 (4)
Underlying profit / (loss) before tax 758 (374)
Non-core items (113) (386)
Profit before tax 645 (760)
FY 2019(€m)
FY 2020(€m)
Net interest margin (NIM) 2.14% 2.00%
Cost income ratio2 63% 64%
Underlying earnings per share 52.4c (38.6c)
1 Comparative figures have been restated to reflect the impact of the voluntary change in the Group’s accounting policy for interest income and interest expense on certain financial instruments
2 See slide 53 for calculation3 Including share of associates / JVs
20
Bank of Ireland 2020 Results Announcement
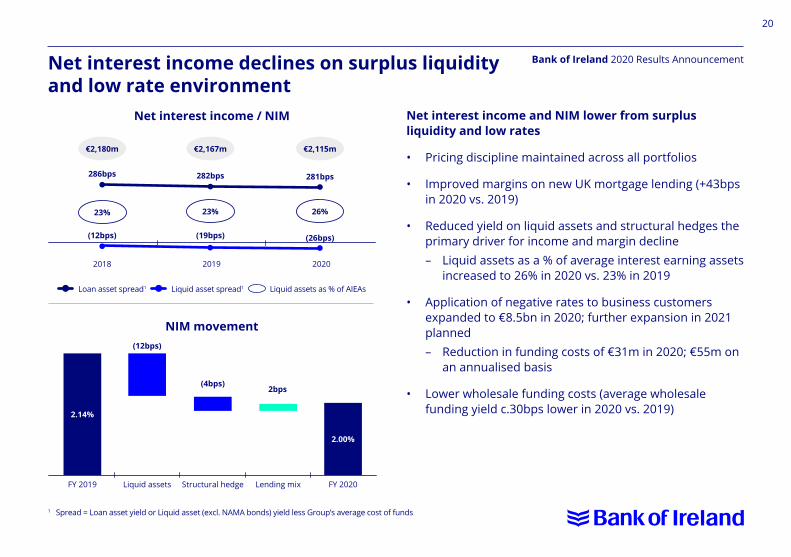
NIM movement
FY 2019 Structural hedgeLiquid assets Lending mix FY 2020
2.14%
2.00%
(12bps)
(4bps)2bps
€2,180m
23% 23% 26%
€2,167m €2,115m
Net interest income / NIM
286bps
(12bps) (19bps)
282bps 281bps
(26bps)
2018 2019 2020
Loan asset spread1 Liquid asset spread1 Liquid assets as % of AIEAs
Net interest income declines on surplus liquidity and low rate environment
Net interest income and NIM lower from surplus liquidity and low rates
• Pricing discipline maintained across all portfolios
• Improved margins on new UK mortgage lending (+43bps in 2020 vs. 2019)
• Reduced yield on liquid assets and structural hedges the primary driver for income and margin decline
– Liquid assets as a % of average interest earning assets increased to 26% in 2020 vs. 23% in 2019
• Application of negative rates to business customers expanded to €8.5bn in 2020; further expansion in 2021 planned
– Reduction in funding costs of €31m in 2020; €55m on an annualised basis
• Lower wholesale funding costs (average wholesale funding yield c.30bps lower in 2020 vs. 2019)
1 Spread = Loan asset yield or Liquid asset (excl. NAMA bonds) yield less Group’s average cost of funds
21
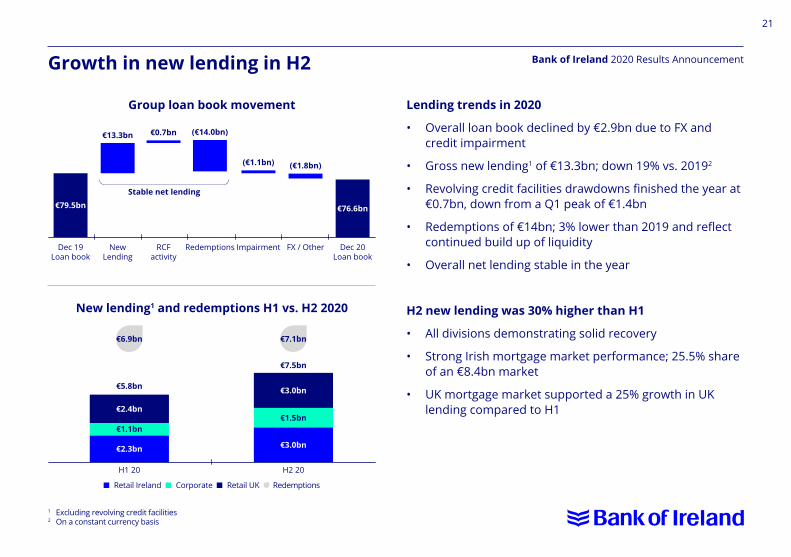
Bank of Ireland 2020 Results AnnouncementGrowth in new lending in H2
Lending trends in 2020
• Overall loan book declined by €2.9bn due to FX and credit impairment
• Gross new lending1 of €13.3bn; down 19% vs. 20192
• Revolving credit facilities drawdowns finished the year at €0.7bn, down from a Q1 peak of €1.4bn
• Redemptions of €14bn; 3% lower than 2019 and reflect continued build up of liquidity
• Overall net lending stable in the year
H2 new lending was 30% higher than H1
• All divisions demonstrating solid recovery
• Strong Irish mortgage market performance; 25.5% share of an €8.4bn market
• UK mortgage market supported a 25% growth in UK lending compared to H1
Group loan book movement
New lending1 and redemptions H1 vs. H2 2020
€79.5bn €76.6bn
€13.3bn
€5.8bn
€7.5bn
Stable net lending
(€1.1bn) (€1.8bn)
H1 20 H2 20
Dec 19 Loan book
New Lending
Impairment
€0.7bn
RCF activity
(€14.0bn)
Redemptions FX / Other Dec 20 Loan book
€2.4bn
€3.0bn
€1.1bn€1.5bn
€2.3bn €3.0bn
n Retail Ireland n Corporate n Retail UK Redemptions
1 Excluding revolving credit facilities2 On a constant currency basis
€6.9bn €7.1bn
22
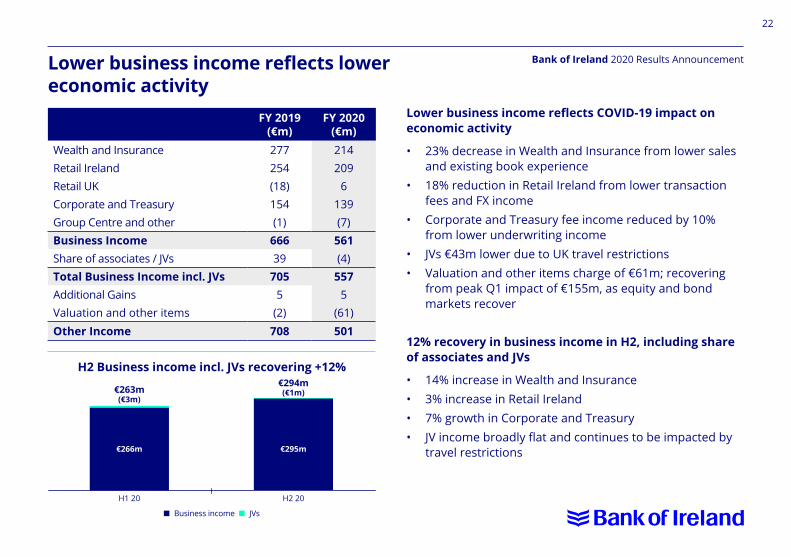
Bank of Ireland 2020 Results AnnouncementLower business income reflects lower economic activity
Lower business income reflects COVID-19 impact on economic activity
• 23% decrease in Wealth and Insurance from lower sales and existing book experience
• 18% reduction in Retail Ireland from lower transaction fees and FX income
• Corporate and Treasury fee income reduced by 10% from lower underwriting income
• JVs €43m lower due to UK travel restrictions• Valuation and other items charge of €61m; recovering
from peak Q1 impact of €155m, as equity and bond markets recover
12% recovery in business income in H2, including share of associates and JVs
• 14% increase in Wealth and Insurance• 3% increase in Retail Ireland• 7% growth in Corporate and Treasury• JV income broadly flat and continues to be impacted by
travel restrictions
FY 2019(€m)
FY 2020(€m)
Wealth and Insurance 277 214Retail Ireland 254 209Retail UK (18) 6Corporate and Treasury 154 139Group Centre and other (1) (7)Business Income 666 561Share of associates / JVs 39 (4)Total Business Income incl. JVs 705 557Additional Gains 5 5Valuation and other items (2) (61)Other Income 708 501
€263m€294m
(€3m)(€1m)
H1 20 H2 20
H2 Business income incl. JVs recovering +12%
n Business income n JVs
€266m €295m
23
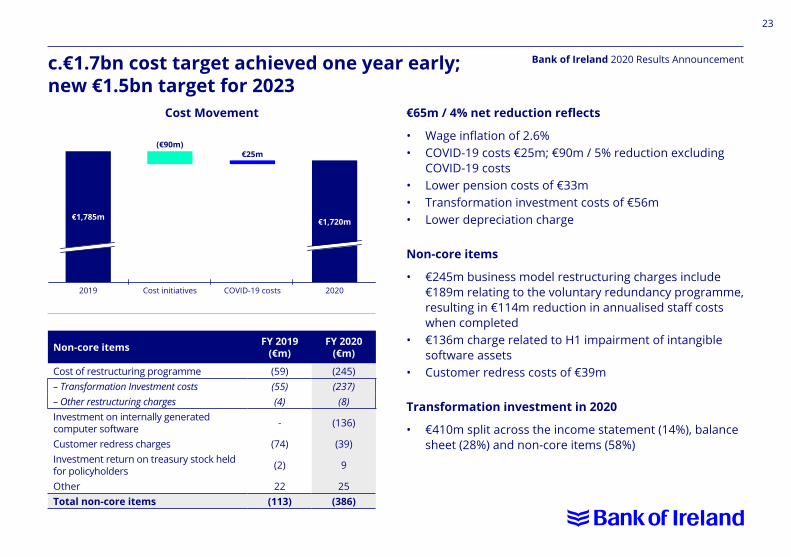
Bank of Ireland 2020 Results Announcementc.€1.7bn cost target achieved one year early; new €1.5bn target for 2023
€65m / 4% net reduction reflects
• Wage inflation of 2.6%• COVID-19 costs €25m; €90m / 5% reduction excluding
COVID-19 costs• Lower pension costs of €33m• Transformation investment costs of €56m• Lower depreciation charge
Non-core items
• €245m business model restructuring charges include €189m relating to the voluntary redundancy programme, resulting in €114m reduction in annualised staff costs when completed
• €136m charge related to H1 impairment of intangible software assets
• Customer redress costs of €39m
Transformation investment in 2020
• €410m split across the income statement (14%), balance sheet (28%) and non-core items (58%)
Non-core items FY 2019(€m)
FY 2020(€m)
Cost of restructuring programme (59) (245)– Transformation Investment costs (55) (237)– Other restructuring charges (4) (8)Investment on internally generated computer software - (136)
Customer redress charges (74) (39)Investment return on treasury stock held for policyholders (2) 9
Other 22 25Total non-core items (113) (386)
(€90m)€25m
€1,785m €1,720m
2019 COVID-19 costsCost initiatives 2020
Cost Movement
24
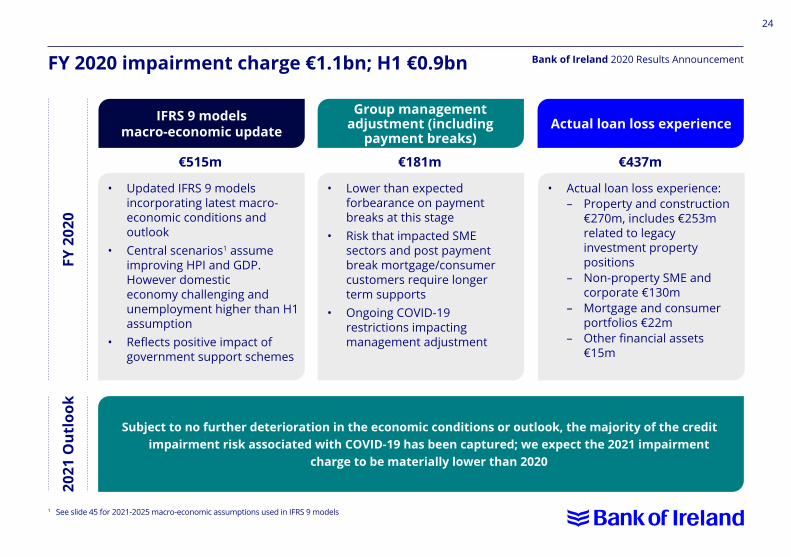
Bank of Ireland 2020 Results AnnouncementFY 2020 impairment charge €1.1bn; H1 €0.9bn
IFRS 9 models macro-economic update
FY 2
020
Group management adjustment (including
payment breaks)Actual loan loss experience
2021
Out
look
1 See slide 45 for 2021-2025 macro-economic assumptions used in IFRS 9 models
• Updated IFRS 9 models incorporating latest macro-economic conditions and outlook
• Central scenarios1 assume improving HPI and GDP. However domestic economy challenging and unemployment higher than H1 assumption
• Reflects positive impact of government support schemes
Subject to no further deterioration in the economic conditions or outlook, the majority of the credit impairment risk associated with COVID-19 has been captured; we expect the 2021 impairment
charge to be materially lower than 2020
• Lower than expected forbearance on payment breaks at this stage
• Risk that impacted SME sectors and post payment break mortgage/consumer customers require longer term supports
• Ongoing COVID-19 restrictions impacting management adjustment
• Actual loan loss experience: – Property and construction
€270m, includes €253m related to legacy investment property positions
– Non-property SME and corporate €130m
– Mortgage and consumer portfolios €22m
– Other financial assets €15m
€515m €181m €437m
25
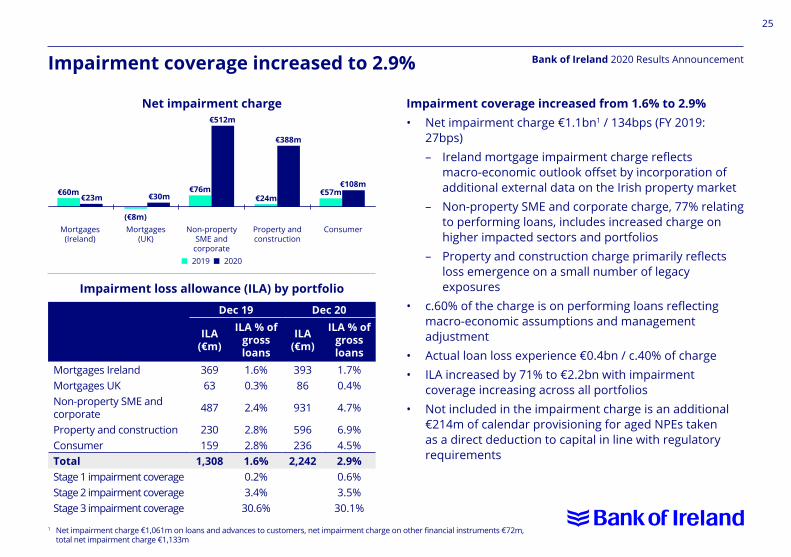
Bank of Ireland 2020 Results AnnouncementImpairment coverage increased to 2.9%
Impairment coverage increased from 1.6% to 2.9% • Net impairment charge €1.1bn1 / 134bps (FY 2019:
27bps) – Ireland mortgage impairment charge reflects
macro-economic outlook offset by incorporation of additional external data on the Irish property market
– Non-property SME and corporate charge, 77% relating to performing loans, includes increased charge on higher impacted sectors and portfolios
– Property and construction charge primarily reflects loss emergence on a small number of legacy exposures
• c.60% of the charge is on performing loans reflecting macro-economic assumptions and management adjustment
• Actual loan loss experience €0.4bn / c.40% of charge• ILA increased by 71% to €2.2bn with impairment
coverage increasing across all portfolios• Not included in the impairment charge is an additional
€214m of calendar provisioning for aged NPEs taken as a direct deduction to capital in line with regulatory requirements
Dec 19 Dec 20
ILA(€m)
ILA % of gross loans
ILA(€m)
ILA % of gross loans
Mortgages Ireland 369 1.6% 393 1.7%Mortgages UK 63 0.3% 86 0.4%Non-property SME and corporate 487 2.4% 931 4.7%
Property and construction 230 2.8% 596 6.9%Consumer 159 2.8% 236 4.5%Total 1,308 1.6% 2,242 2.9%Stage 1 impairment coverage 0.2% 0.6%Stage 2 impairment coverage 3.4% 3.5%Stage 3 impairment coverage 30.6% 30.1%
€60m €76m
(€8m)
€23m
€512m
€388m
€108m€57m
€24m€30m
Mortgages (Ireland)
Non-property SME and
corporate
Mortgages (UK)
Property and construction
Consumer
Net impairment charge
Impairment loss allowance (ILA) by portfolio
1 Net impairment charge €1,061m on loans and advances to customers, net impairment charge on other financial instruments €72m, total net impairment charge €1,133m
n 2019 n 2020
26
Bank of Ireland 2020 Results Announcement
€5.6bn
€15.8bn
€80.5bn1€78.5bn1
€3.1bn€4.5bn
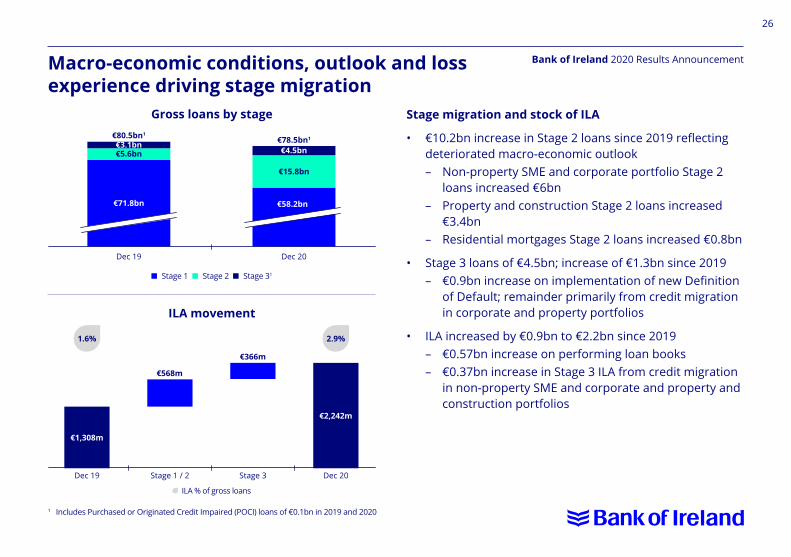
Macro-economic conditions, outlook and loss experience driving stage migration
Stage migration and stock of ILA
• €10.2bn increase in Stage 2 loans since 2019 reflecting deteriorated macro-economic outlook
– Non-property SME and corporate portfolio Stage 2 loans increased €6bn
– Property and construction Stage 2 loans increased €3.4bn
– Residential mortgages Stage 2 loans increased €0.8bn
• Stage 3 loans of €4.5bn; increase of €1.3bn since 2019 – €0.9bn increase on implementation of new Definition
of Default; remainder primarily from credit migration in corporate and property portfolios
• ILA increased by €0.9bn to €2.2bn since 2019 – €0.57bn increase on performing loan books – €0.37bn increase in Stage 3 ILA from credit migration
in non-property SME and corporate and property and construction portfolios
Gross loans by stage
ILA movement
€71.8bn €58.2bn
€568m
€366m
Dec 19 Stage 3Stage 1 / 2 Dec 20
Dec 19 Dec 20
€1,308m
€2,242m
ILA % of gross loans
n Stage 1 n Stage 2 n Stage 31
1.6% 2.9%
1 Includes Purchased or Originated Credit Impaired (POCI) loans of €0.1bn in 2019 and 2020
27
Bank of Ireland 2020 Results Announcement
n Dec 19 n Dec 20
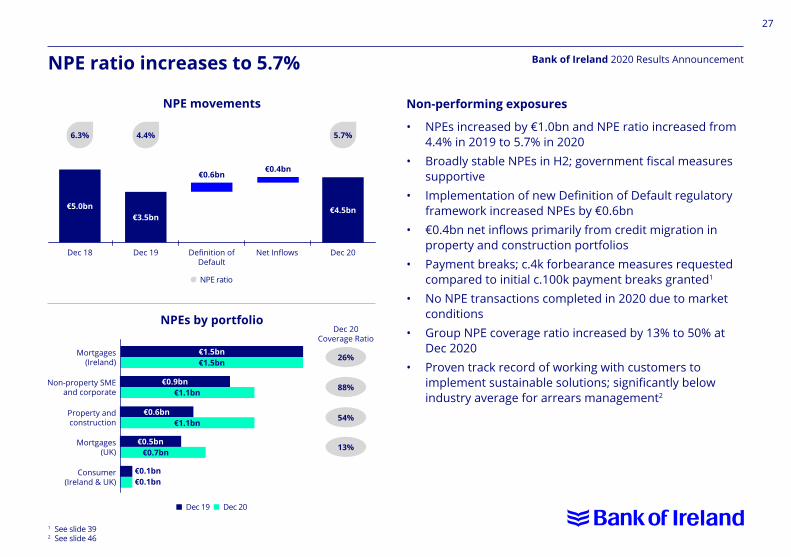
NPE ratio increases to 5.7%
Non-performing exposures
• NPEs increased by €1.0bn and NPE ratio increased from 4.4% in 2019 to 5.7% in 2020
• Broadly stable NPEs in H2; government fiscal measures supportive
• Implementation of new Definition of Default regulatory framework increased NPEs by €0.6bn
• €0.4bn net inflows primarily from credit migration in property and construction portfolios
• Payment breaks; c.4k forbearance measures requested compared to initial c.100k payment breaks granted1
• No NPE transactions completed in 2020 due to market conditions
• Group NPE coverage ratio increased by 13% to 50% at Dec 2020
• Proven track record of working with customers to implement sustainable solutions; significantly below industry average for arrears management2
NPEs by portfolio
€0.9bn€1.1bn
€0.5bn€0.7bn
€0.1bn€0.1bn
€0.6bn€1.1bn
€1.5bn€1.5bn
Dec 20Coverage Ratio
Mortgages (Ireland)
Property and construction
Non-property SME and corporate
Mortgages (UK)
Consumer (Ireland & UK)
26%
54%
88%
13%
NPE movements
€5.0bn€3.5bn
€4.5bn
€0.6bn€0.4bn
Dec 18 Dec 19 Definition of Default
Dec 20Net Inflows
NPE ratio
6.3% 4.4% 5.7%
1 See slide 392 See slide 46
28
Bank of Ireland 2020 Results Announcement
13.8%
75bps
125bps40bps
(10bps)
(75bps)
(110bps)
(65bps)(20bps)
Loan growth / RWA2
Dec 19 Dividend removalOrganic capital1 Credit deterioration
Regulatory change
SME & Software Transformation investment
Other / Pension Dec 20
Fully loaded CET1 ratio
Headroom to 2021 CET1 regulatory capital requirements
13.4%
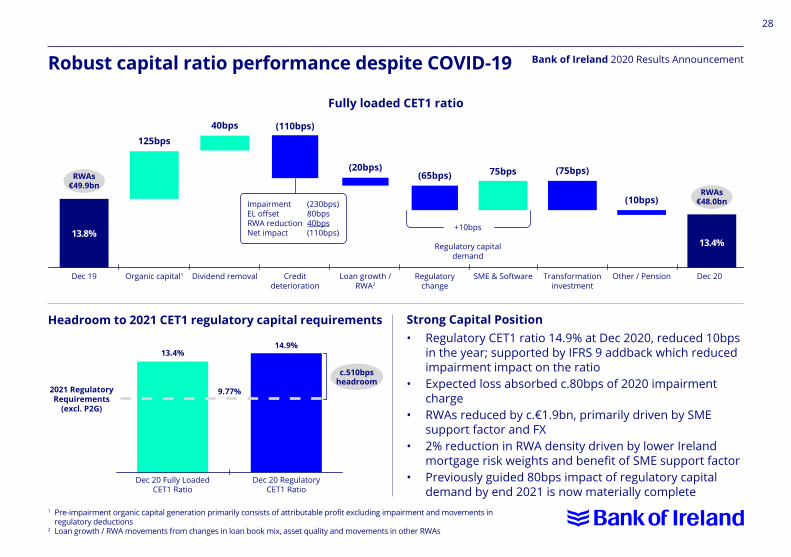
Robust capital ratio performance despite COVID-19
Strong Capital Position• Regulatory CET1 ratio 14.9% at Dec 2020, reduced 10bps
in the year; supported by IFRS 9 addback which reduced impairment impact on the ratio
• Expected loss absorbed c.80bps of 2020 impairment charge
• RWAs reduced by c.€1.9bn, primarily driven by SME support factor and FX
• 2% reduction in RWA density driven by lower Ireland mortgage risk weights and benefit of SME support factor
• Previously guided 80bps impact of regulatory capital demand by end 2021 is now materially complete
1 Pre-impairment organic capital generation primarily consists of attributable profit excluding impairment and movements in regulatory deductions
2 Loan growth / RWA movements from changes in loan book mix, asset quality and movements in other RWAs
RWAs€49.9bn
c.510bps headroom
RWAs€48.0bnImpairment (230bps)
EL offset 80bpsRWA reduction 40bpsNet impact (110bps)
+10bps
Regulatory capital demand
13.4%
9.77%
14.9%
2021 Regulatory Requirements
(excl. P2G)
Dec 20 Fully Loaded CET1 Ratio
Dec 20 Regulatory CET1 Ratio
29
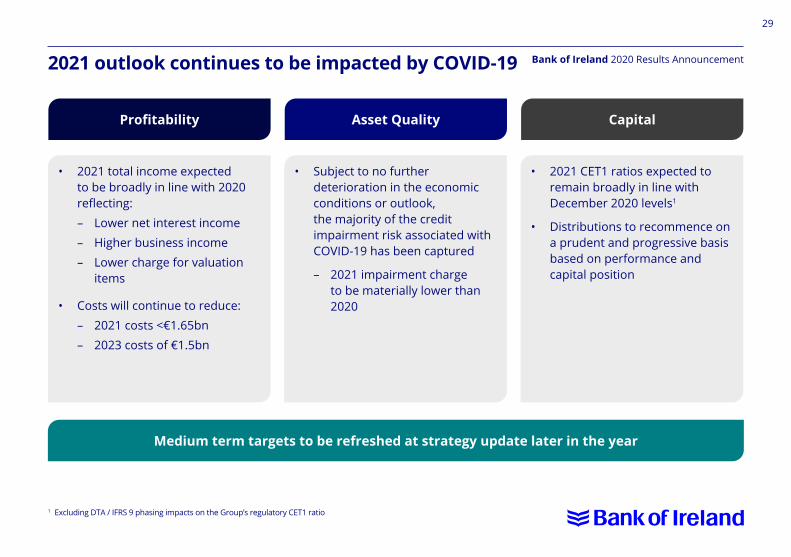
Bank of Ireland 2020 Results Announcement2021 outlook continues to be impacted by COVID-19
Profitability
Medium term targets to be refreshed at strategy update later in the year
• 2021 total income expected to be broadly in line with 2020 reflecting:
– Lower net interest income – Higher business income – Lower charge for valuation
items
• Costs will continue to reduce:
– 2021 costs <€1.65bn – 2023 costs of €1.5bn
Asset Quality
• Subject to no further deterioration in the economic conditions or outlook, the majority of the credit impairment risk associated with COVID-19 has been captured
– 2021 impairment charge to be materially lower than 2020
Capital
• 2021 CET1 ratios expected to remain broadly in line with December 2020 levels1
• Distributions to recommence on a prudent and progressive basis based on performance and capital position
1 Excluding DTA / IFRS 9 phasing impacts on the Group’s regulatory CET1 ratio
30
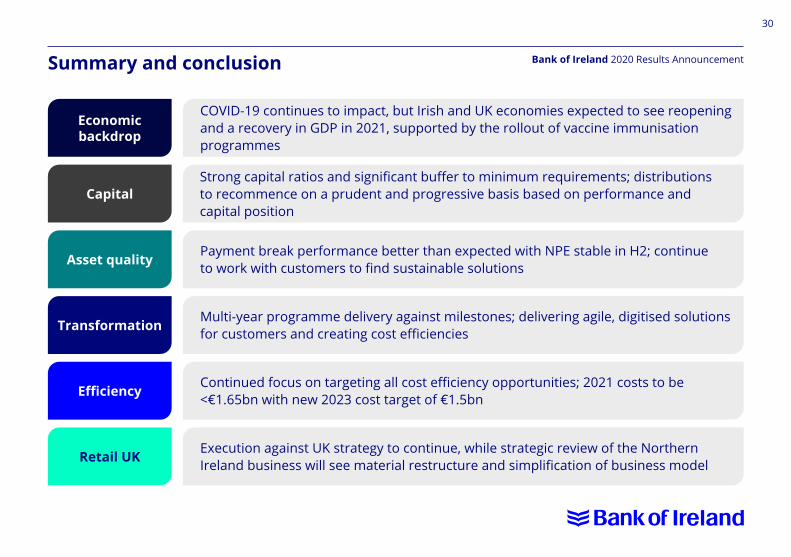
Bank of Ireland 2020 Results AnnouncementSummary and conclusion
Economic backdrop
COVID-19 continues to impact, but Irish and UK economies expected to see reopening and a recovery in GDP in 2021, supported by the rollout of vaccine immunisation programmes
Asset quality Payment break performance better than expected with NPE stable in H2; continue to work with customers to find sustainable solutions
Efficiency Continued focus on targeting all cost efficiency opportunities; 2021 costs to be <€1.65bn with new 2023 cost target of €1.5bn
CapitalStrong capital ratios and significant buffer to minimum requirements; distributions to recommence on a prudent and progressive basis based on performance and capital position
Transformation Multi-year programme delivery against milestones; delivering agile, digitised solutions for customers and creating cost efficiencies
Retail UK Execution against UK strategy to continue, while strategic review of the Northern Ireland business will see material restructure and simplification of business model

32
Bank of Ireland 2020 Results Announcement
Appendix

33
Bank of Ireland 2020 Results AnnouncementAppendix Slide No.• BOI overview – customer loans / new lending volumes 34• Ireland mortgage loan book 35• Income Statement – Net interest income analysis 36 – Structural hedge, liquid assets and negative rate deposits 37 – Interest rate sensitivity 38• Asset Quality – Payment breaks 39 – Non-performing exposures by portfolio 40 – Portfolio by stage 41 – Non-property SME and corporate by stage 42 – Residential mortgages & consumer loans 43 – Non-property SME and corporate & Property and construction 44 – Forward Looking Information – macro-economic scenarios 45 – Ireland Mortgages 46• Capital and liquidity 47• Ordinary shareholders’ equity and TNAV 48• Capital – CET1 ratios 49 – Regulatory capital requirements 50 – Risk weighted assets 51• Transformation investment / operating expenses 52• Cost income ratio: Dec 2020 53• Defined Benefit Pension Schemes 54• Forward-Looking statement 55• Contact details 56
34
Bank of Ireland 2020 Results Announcement
Composition (Dec 20) Ireland(€bn)
UK(€bn)
RoW(€bn)
Total(€bn)
Total(%)
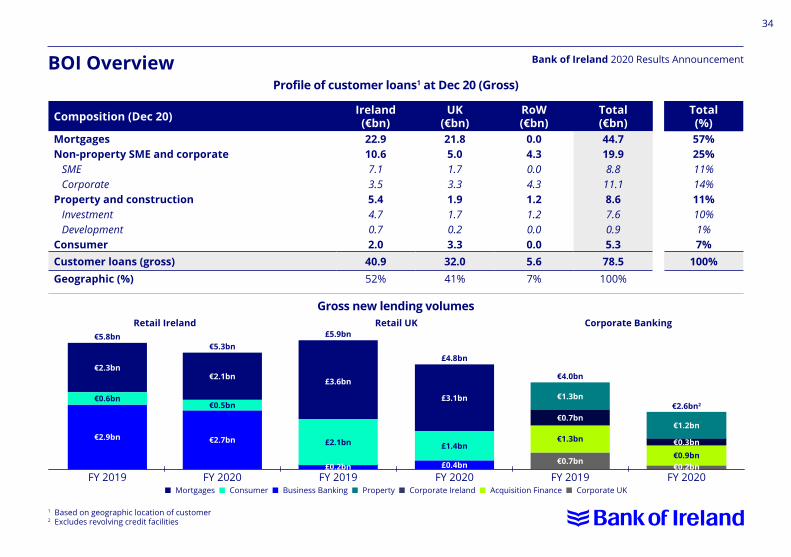
Mortgages 22.9 21.8 0.0 44.7 57%Non-property SME and corporate 10.6 5.0 4.3 19.9 25% SME 7.1 1.7 0.0 8.8 11% Corporate 3.5 3.3 4.3 11.1 14%Property and construction 5.4 1.9 1.2 8.6 11% Investment 4.7 1.7 1.2 7.6 10% Development 0.7 0.2 0.0 0.9 1%Consumer 2.0 3.3 0.0 5.3 7%Customer loans (gross) 40.9 32.0 5.6 78.5 100%Geographic (%) 52% 41% 7% 100%
BOI Overview
1 Based on geographic location of customer2 Excludes revolving credit facilities
€2.7bn
€5.3bn
€2.1bn
€0.5bn€0.7bn
€0.3bn
€1.3bn
€1.2bn
€0.7bn
€4.0bn
€2.6bn2
Corporate Banking
FY 2020FY 2019 FY 2020FY 2019 FY 2019 FY 2020
£5.9bnRetail UK
£3.6bn
£3.1bn
£0.4bn
£2.1bn £1.4bn€1.3bn
€0.9bn
Retail Ireland€5.8bn
€2.3bn
€2.9bn
n Mortgages n Consumer n Business Banking n Property n Corporate Ireland n Acquisition Finance n Corporate UK
£4.8bn
€0.6bn
Gross new lending volumes
Profile of customer loans1 at Dec 20 (Gross)
€0.2bn£0.2bn
35
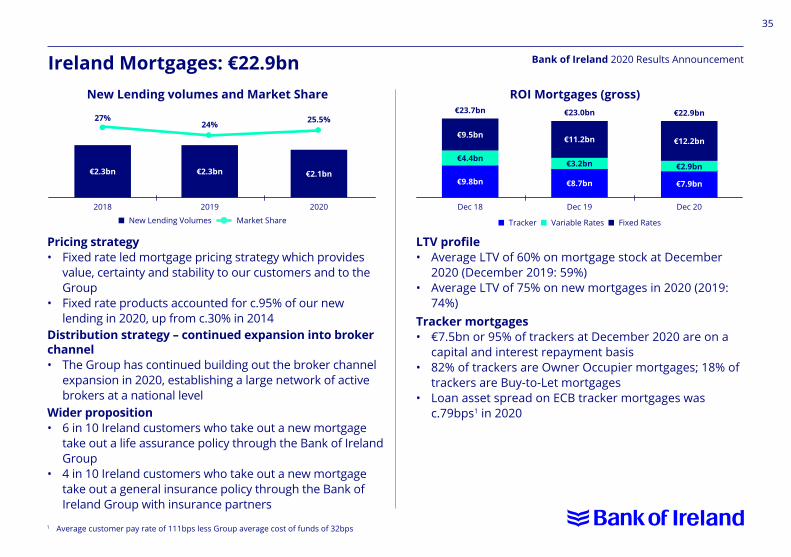
Bank of Ireland 2020 Results AnnouncementIreland Mortgages: €22.9bnNew Lending volumes and Market Share
LTV profile• Average LTV of 60% on mortgage stock at December
2020 (December 2019: 59%)• Average LTV of 75% on new mortgages in 2020 (2019:
74%)Tracker mortgages• €7.5bn or 95% of trackers at December 2020 are on a
capital and interest repayment basis• 82% of trackers are Owner Occupier mortgages; 18% of
trackers are Buy-to-Let mortgages• Loan asset spread on ECB tracker mortgages was
c.79bps1 in 2020
Pricing strategy• Fixed rate led mortgage pricing strategy which provides
value, certainty and stability to our customers and to the Group
• Fixed rate products accounted for c.95% of our new lending in 2020, up from c.30% in 2014
Distribution strategy – continued expansion into broker channel• The Group has continued building out the broker channel
expansion in 2020, establishing a large network of active brokers at a national level
Wider proposition• 6 in 10 Ireland customers who take out a new mortgage
take out a life assurance policy through the Bank of Ireland Group
• 4 in 10 Ireland customers who take out a new mortgage take out a general insurance policy through the Bank of Ireland Group with insurance partners
ROI Mortgages (gross)€23.7bn €23.0bn €22.9bn
€9.8bn
€4.4bn
€9.5bn €11.2bn €12.2bn
€3.2bn €2.9bn
€8.7bn €7.9bn
n New Lending Volumes Market Share
€2.3bn €2.3bn €2.1bn
1 Average customer pay rate of 111bps less Group average cost of funds of 32bps
Dec 18 Dec 192019 20202018 Dec 20
25.5%27%24%
n Tracker n Variable Rates n Fixed Rates
36
Bank of Ireland 2020 Results Announcement
H1 2019 H2 2019 H1 2020 H2 2020Average Volumes
(€bn)
Gross Interest
(€m)
Gross Rate(%)
Average Volumes
(€bn)
Gross Interest
(€m)
Gross Rate(%)
Average Volumes
(€bn)
Gross Interest
(€m)
Gross Rate(%)
Average Volumes
(€bn)
Gross Interest
(€m)
Gross Rate(%)
Ireland Loans1
UK Loans2
C&T 2
Total Loans and Advances to CustomersLiquid AssetsNAMA Sub DebtTotal Liquid Assets
34.227.515.877.522.90.1
23.0
582395296
1,273332
35
3.43%2.90%3.78%3.31%0.29%5.40%0.31%
33.728.016.878.523.90.1
24.0
583393312
1,288302
32
3.43%2.79%3.69%3.26%0.25%5.26%0.27%
33.428.517.479.326.60.0
26.6
561371309
1,241161
17
3.38%2.62%3.57%3.15%0.12%5.22%0.13%
33.027.116.977.028.70.0
28.7
546349292
1,187(5)(-)(5)
3.29%2.56%3.44%3.07%(0.03%)0.00%
(0.03%)Total Interest Earning Assets 100.5 1,308 2.62% 102.5 1,320 2.56% 105.9 1,258 2.36% 105.6 1,183 2.22%Ireland DepositsCredit Balances3
UK DepositsC&T DepositsTotal DepositsWholesale Funding4
Subordinated Liabilities
20.734.518.35.1
78.610.32.0
(7)3
(91)(9)
(104)(54)(49)
(0.07%)0.02%
(1.00%)(0.35%)(0.27%)(1.06%)(4.85%)
21.036.618.65.0
81.29.91.5
(5)6
(103)(9)
(111)(62)(41)
(0.05%)0.03%
(1.09%)(0.34%)(0.27%)(1.24%)(5.44%)
21.339.618.74.7
84.29.71.5
(2)8
(90)(4)
(88)(55)(34)
(0.02%)0.04%
(0.97%)(0.16%)(0.21%)(1.13%)(4.61%)
21.643.816.54.2
86.19.11.4
(-)12
(60)2
(46)(36)(28)
(0.00%)0.06%
(0.72%)0.09%
(0.11%)(0.78%)(4.02%)
Total Interest Bearing Liabilities 90.9 (207) (0.46%) 92.6 (214) (0.46%) 95.4 (177) (0.37%) 96.6 (110) (0.23%)Other5 (22) (18) (18) (20)
Net Interest Margin as reported 100.5 1,079 2.16% 102.5 1,088 2.11% 105.9 1,063 2.02% 105.6 1,052 1.98%Average ECB Base rateAverage 3 month EuriborAverage BOE Base rateAverage 3 month LIBOR
0.00%(0.31%)0.75%0.84%
0.00%(0.40%)0.75%0.78%
0.00%(0.31%)0.36%0.35%
0.00%(0.50%)0.10%0.06%
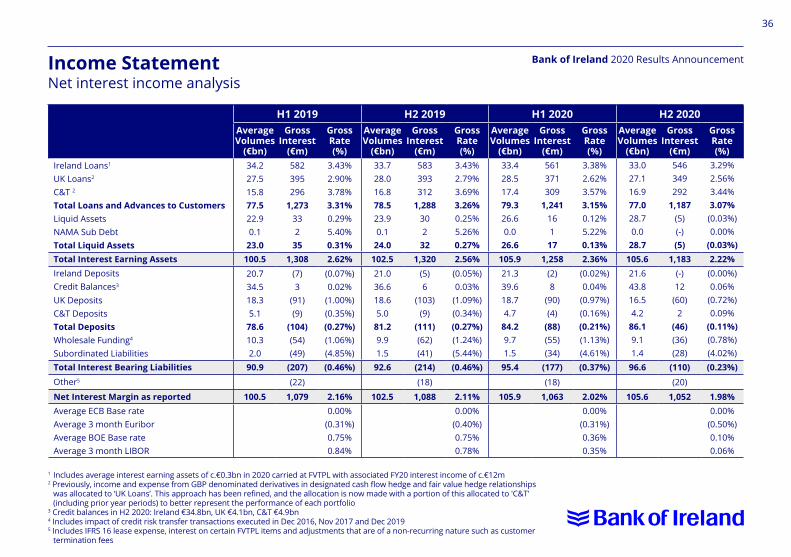
Income StatementNet interest income analysis
1 Includes average interest earning assets of c.€0.3bn in 2020 carried at FVTPL with associated FY20 interest income of c.€12m 2 Previously, income and expense from GBP denominated derivatives in designated cash flow hedge and fair value hedge relationships
was allocated to ‘UK Loans’. This approach has been refined, and the allocation is now made with a portion of this allocated to 'C&T' (including prior year periods) to better represent the performance of each portfolio
3 Credit balances in H2 2020: Ireland €34.8bn, UK €4.1bn, C&T €4.9bn 4 Includes impact of credit risk transfer transactions executed in Dec 2016, Nov 2017 and Dec 2019 5 Includes IFRS 16 lease expense, interest on certain FVTPL items and adjustments that are of a non-recurring nature such as customer
termination fees
37
Bank of Ireland 2020 Results Announcement
€13m
€18m €31m
€55m
2020
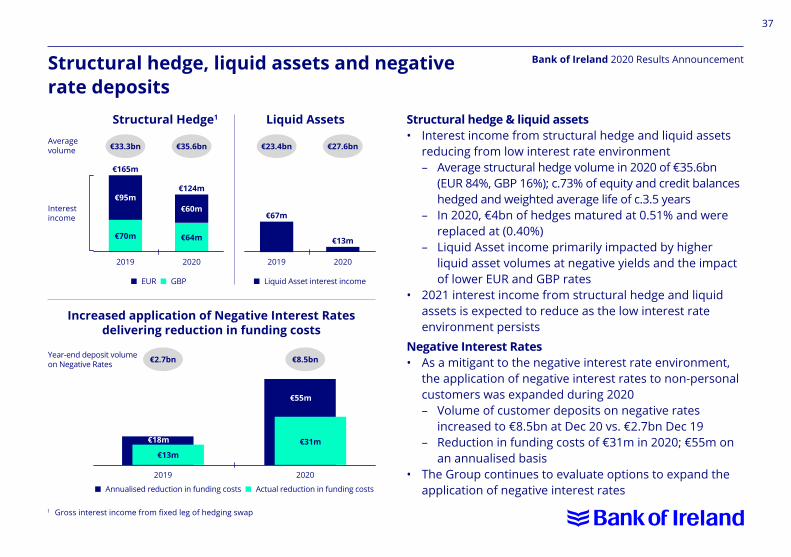
Increased application of Negative Interest Rates delivering reduction in funding costs
Structural hedge, liquid assets and negative rate deposits
Structural Hedge1 Liquid Assets
€70m €64m
€95m€60m
€165m
€67m
Average volume
Year-end deposit volume on Negative Rates
Interest income
€124m
€13m
2019
2019
20192020 2020
n EUR n GBP
n Annualised reduction in funding costs n Actual reduction in funding costs
n Liquid Asset interest income
Structural hedge & liquid assets• Interest income from structural hedge and liquid assets
reducing from low interest rate environment – Average structural hedge volume in 2020 of €35.6bn
(EUR 84%, GBP 16%); c.73% of equity and credit balances hedged and weighted average life of c.3.5 years
– In 2020, €4bn of hedges matured at 0.51% and were replaced at (0.40%)
– Liquid Asset income primarily impacted by higher liquid asset volumes at negative yields and the impact of lower EUR and GBP rates
• 2021 interest income from structural hedge and liquid assets is expected to reduce as the low interest rate environment persists
Negative Interest Rates• As a mitigant to the negative interest rate environment,
the application of negative interest rates to non-personal customers was expanded during 2020
– Volume of customer deposits on negative rates increased to €8.5bn at Dec 20 vs. €2.7bn Dec 19
– Reduction in funding costs of €31m in 2020; €55m on an annualised basis
• The Group continues to evaluate options to expand the application of negative interest rates
€33.3bn
€2.7bn
€23.4bn€35.6bn
€8.5bn
€27.6bn
1 Gross interest income from fixed leg of hedging swap
38
Bank of Ireland 2020 Results AnnouncementInterest Rate Sensitivity
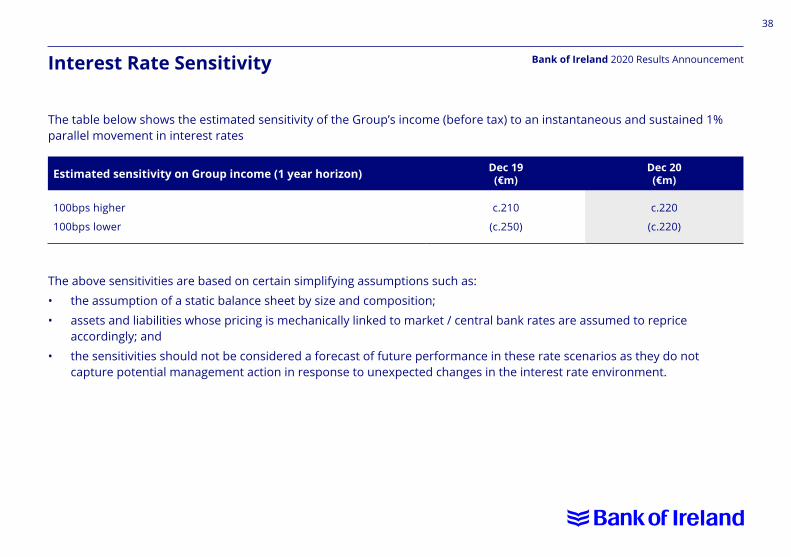
The table below shows the estimated sensitivity of the Group’s income (before tax) to an instantaneous and sustained 1% parallel movement in interest rates
The above sensitivities are based on certain simplifying assumptions such as:• the assumption of a static balance sheet by size and composition;• assets and liabilities whose pricing is mechanically linked to market / central bank rates are assumed to reprice
accordingly; and• the sensitivities should not be considered a forecast of future performance in these rate scenarios as they do not
capture potential management action in response to unexpected changes in the interest rate environment.
Estimated sensitivity on Group income (1 year horizon) Dec 19 (€m)
Dec 20 (€m)
100bps higher
100bps lower
c.210
(c.250)
c.220
(c.220)
39
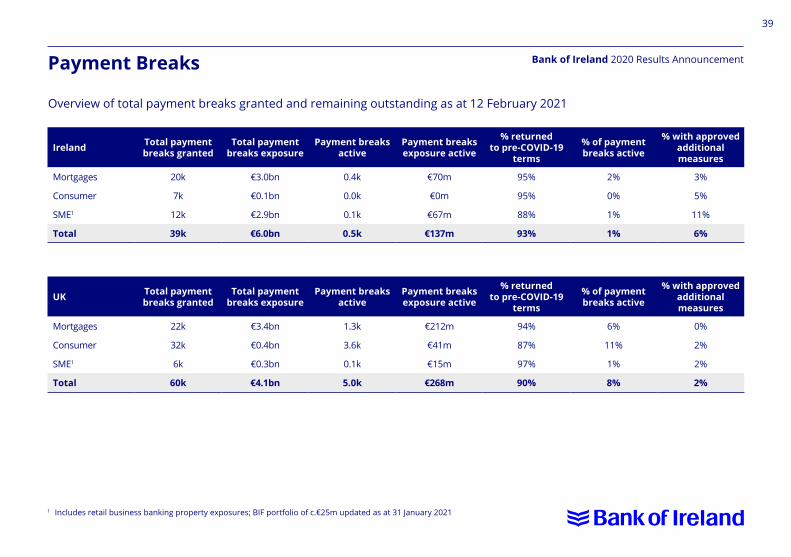
Bank of Ireland 2020 Results AnnouncementPayment Breaks
Overview of total payment breaks granted and remaining outstanding as at 12 February 2021
Ireland Total payment breaks granted
Total payment breaks exposure
Payment breaks active
Payment breaks exposure active
% returned to pre-COVID-19
terms
% of payment breaks active
% with approved additional measures
Mortgages 20k €3.0bn 0.4k €70m 95% 2% 3%
Consumer 7k €0.1bn 0.0k €0m 95% 0% 5%
SME1 12k €2.9bn 0.1k €67m 88% 1% 11%
Total 39k €6.0bn 0.5k €137m 93% 1% 6%
UK Total payment breaks granted
Total payment breaks exposure
Payment breaks active
Payment breaks exposure active
% returned to pre-COVID-19
terms
% of payment breaks active
% with approved additional measures
Mortgages 22k €3.4bn 1.3k €212m 94% 6% 0%
Consumer 32k €0.4bn 3.6k €41m 87% 11% 2%
SME1 6k €0.3bn 0.1k €15m 97% 1% 2%
Total 60k €4.1bn 5.0k €268m 90% 8% 2%
1 Includes retail business banking property exposures; BIF portfolio of c.€25m updated as at 31 January 2021
40
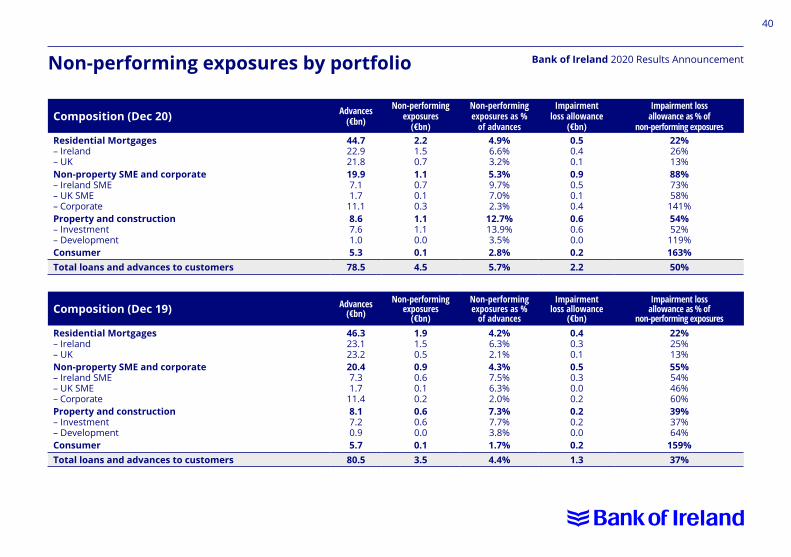
Bank of Ireland 2020 Results Announcement
Composition (Dec 20) Advances(€bn)
Non-performing exposures
(€bn)
Non-performing exposures as %
of advances
Impairment loss allowance
(€bn)
Impairment loss allowance as % of
non-performing exposuresResidential Mortgages – Ireland– UKNon-property SME and corporate– Ireland SME– UK SME– CorporateProperty and construction– Investment– DevelopmentConsumer
44.722.921.819.97.11.7
11.18.67.61.05.3
2.21.50.71.10.70.10.31.11.10.00.1
4.9%6.6%3.2%5.3%9.7%7.0%2.3%
12.7%13.9%3.5%2.8%
0.50.40.10.90.50.10.40.60.60.00.2
22%26%13%88%73%58%
141%54%52%
119%163%
Total loans and advances to customers 78.5 4.5 5.7% 2.2 50%
Composition (Dec 19) Advances(€bn)
Non-performing exposures
(€bn)
Non-performing exposures as %
of advances
Impairment loss allowance
(€bn)
Impairment loss allowance as % of
non-performing exposuresResidential Mortgages – Ireland– UKNon-property SME and corporate– Ireland SME– UK SME– CorporateProperty and construction– Investment– DevelopmentConsumer
46.323.123.220.47.31.7
11.48.17.20.95.7
1.91.50.50.90.60.10.20.60.60.00.1
4.2%6.3%2.1%4.3%7.5%6.3%2.0%7.3%7.7%3.8%1.7%
0.40.30.10.50.30.00.20.20.20.00.2
22%25%13%55%54%46%60%39%37%64%
159%Total loans and advances to customers 80.5 3.5 4.4% 1.3 37%
Non-performing exposures by portfolio
41
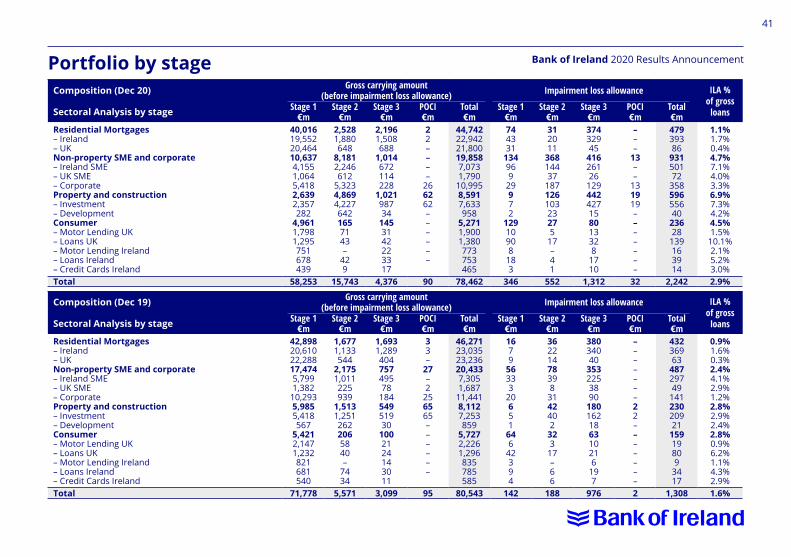
Bank of Ireland 2020 Results AnnouncementPortfolio by stageComposition (Dec 20) Gross carrying amount
(before impairment loss allowance) Impairment loss allowance ILA % of gross
loansSectoral Analysis by stage Stage 1 €m
Stage 2 €m
Stage 3 €m
POCI €m
Total €m
Stage 1 €m
Stage 2 €m
Stage 3 €m
POCI €m
Total €m
Residential Mortgages– Ireland– UKNon-property SME and corporate– Ireland SME– UK SME– CorporateProperty and construction– Investment– DevelopmentConsumer– Motor Lending UK– Loans UK– Motor Lending Ireland– Loans Ireland– Credit Cards Ireland
40,01619,55220,46410,6374,1551,0645,4182,6392,357282
4,9611,7981,295751678439
2,5281,880648
8,1812,246612
5,3234,8694,2276421657143–
429
2,1961,508688
1,014672114228
1,02198734
1453142223317
22––––
266262––––––
44,74222,94221,80019,8587,0731,790
10,9958,5917,633958
5,2711,9001,380773753465
744331
134969
29972
12910908
183
312011
36814437
18712610323275
17–41
37432945
41626126
129442427158013328
1710
–––
13––
131919–––––––
47939386
93150172
35859655640
23628
139163914
1.1%1.7%0.4%4.7%7.1%4.0%3.3%6.9%7.3%4.2%4.5%1.5%
10.1%2.1%5.2%3.0%
Total 58,253 15,743 4,376 90 78,462 346 552 1,312 32 2,242 2.9%
Composition (Dec 19) Gross carrying amount(before impairment loss allowance) Impairment loss allowance ILA %
of gross loansSectoral Analysis by stage Stage 1
€mStage 2
€mStage 3
€mPOCI €m
Total €m
Stage 1 €m
Stage 2 €m
Stage 3 €m
POCI €m
Total €m
Residential Mortgages– Ireland– UKNon-property SME and corporate– Ireland SME– UK SME– CorporateProperty and construction– Investment– DevelopmentConsumer– Motor Lending UK– Loans UK– Motor Lending Ireland– Loans Ireland– Credit Cards Ireland
42,89820,61022,28817,4745,7991,382
10,2935,9855,418567
5,4212,1471,232821681540
1,6771,133544
2,1751,011225939
1,5131,2512622065840–
7434
1,6931,28940475749578
18454951930
1002124143011
33–
27–2
256565––––––
46,27123,03523,23620,4337,3051,687
11,4418,1127,253859
5,7272,2261,296835785585
1679
56333
20651
646
42394
36221478398
3142402
323
17–66
38034040
3532253890
180162186310216
197
–––––––22–––––––
43236963
48729749
14123020921
15919809
3417
0.9%1.6%0.3%2.4%4.1%2.9%1.2%2.8%2.9%2.4%2.8%0.9%6.2%1.1%4.3%2.9%
Total 71,778 5,571 3,099 95 80,543 142 188 976 2 1,308 1.6%
42
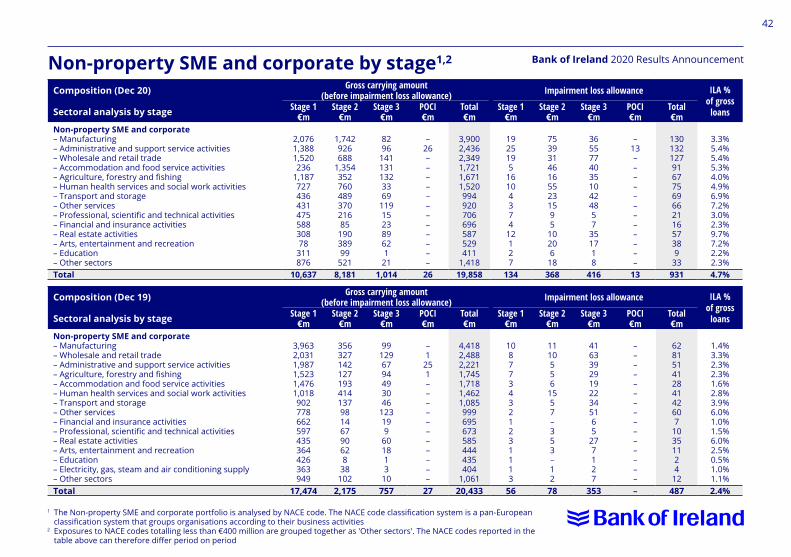
Bank of Ireland 2020 Results AnnouncementNon-property SME and corporate by stage1,2
1 The Non-property SME and corporate portfolio is analysed by NACE code. The NACE code classification system is a pan-European classification system that groups organisations according to their business activities
2 Exposures to NACE codes totalling less than €400 million are grouped together as 'Other sectors'. The NACE codes reported in the table above can therefore differ period on period
Composition (Dec 20) Gross carrying amount(before impairment loss allowance) Impairment loss allowance ILA %
of gross loansSectoral analysis by stage Stage 1
€mStage 2
€mStage 3
€mPOCI €m
Total €m
Stage 1 €m
Stage 2 €m
Stage 3 €m
POCI €m
Total €m
Non-property SME and corporate– Manufacturing– Administrative and support service activities– Wholesale and retail trade– Accommodation and food service activities– Agriculture, forestry and fishing– Human health services and social work activities– Transport and storage– Other services– Professional, scientific and technical activities– Financial and insurance activities– Real estate activities– Arts, entertainment and recreation– Education– Other sectors
2,0761,3881,520236
1,18772743643147558830878
311876
1,742926688
1,35435276048937021685
19038999
521
8296
1411311323369
119152389621
21
–26––––––––––––
3,9002,4362,3491,7211,6711,520994920706696587529411
1,418
1925195
16104374
12127
753931461655231595
10206
18
365577403510424857
351718
–13––––––––––––
1301321279167756966211657389
33
3.3%5.4%5.4%5.3%4.0%4.9%6.9%7.2%3.0%2.3%9.7%7.2%2.2%2.3%
Total 10,637 8,181 1,014 26 19,858 134 368 416 13 931 4.7%
Composition (Dec 19) Gross carrying amount(before impairment loss allowance) Impairment loss allowance ILA %
of gross loansSectoral analysis by stage Stage 1
€mStage 2
€mStage 3
€mPOCI €m
Total €m
Stage 1 €m
Stage 2 €m
Stage 3 €m
POCI €m
Total €m
Non-property SME and corporate– Manufacturing– Wholesale and retail trade– Administrative and support service activities– Agriculture, forestry and fishing– Accommodation and food service activities– Human health services and social work activities– Transport and storage– Other services– Financial and insurance activities– Professional, scientific and technical activities– Real estate activities– Arts, entertainment and recreation– Education– Electricity, gas, steam and air conditioning supply– Other sectors
3,9632,0311,9871,5231,4761,018902778662597435364426363949
35632714212719341413798146790628
38102
991296794493046
123199
601813
10
–1
251–––––––––– –
4,4182,4882,2211,7451,7181,4621,085999695673585444435404
1,061
1087734321231113
1110556
1557–353–12
416339291922345165
277127
–––––––––––––– –
62815141284142607
10351124
12
1.4%3.3%2.3%2.3%1.6%2.8%3.9%6.0%1.0%1.5%6.0%2.5%0.5%1.0%1.1%
Total 17,474 2,175 757 27 20,433 56 78 353 – 487 2.4%
43
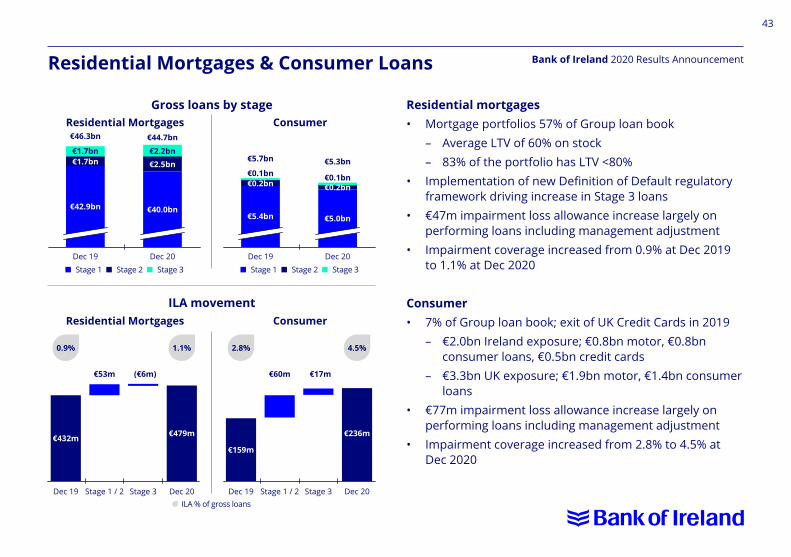
Bank of Ireland 2020 Results AnnouncementResidential Mortgages & Consumer Loans
Residential mortgages• Mortgage portfolios 57% of Group loan book – Average LTV of 60% on stock – 83% of the portfolio has LTV <80% • Implementation of new Definition of Default regulatory
framework driving increase in Stage 3 loans• €47m impairment loss allowance increase largely on
performing loans including management adjustment• Impairment coverage increased from 0.9% at Dec 2019
to 1.1% at Dec 2020
Consumer• 7% of Group loan book; exit of UK Credit Cards in 2019 – €2.0bn Ireland exposure; €0.8bn motor, €0.8bn
consumer loans, €0.5bn credit cards – €3.3bn UK exposure; €1.9bn motor, €1.4bn consumer
loans• €77m impairment loss allowance increase largely on
performing loans including management adjustment• Impairment coverage increased from 2.8% to 4.5% at
Dec 2020
Gross loans by stageResidential Mortgages
Residential Mortgages
Consumer
ConsumerILA movement
€42.9bn€5.4bn
€40.0bn€5.0bn
€1.7bn
€0.1bn
€2.2bn
€0.1bn
€46.3bn
€53m €60m(€6m) €17m
€5.7bn
€44.7bn
€5.3bn€1.7bn
€0.2bn
€2.5bn
€0.2bn
Dec 19 Dec 19Stage 3 Stage 3Stage 1 / 2 Stage 1 / 2Dec 20 Dec 20
Dec 19 Dec 19Dec 20 Dec 20
€432m€159m
€479m €236m
ILA % of gross loans
n Stage 1 n Stage 2 n Stage 3 n Stage 1 n Stage 2 n Stage 3
0.9% 2.8%1.1% 4.5%
44
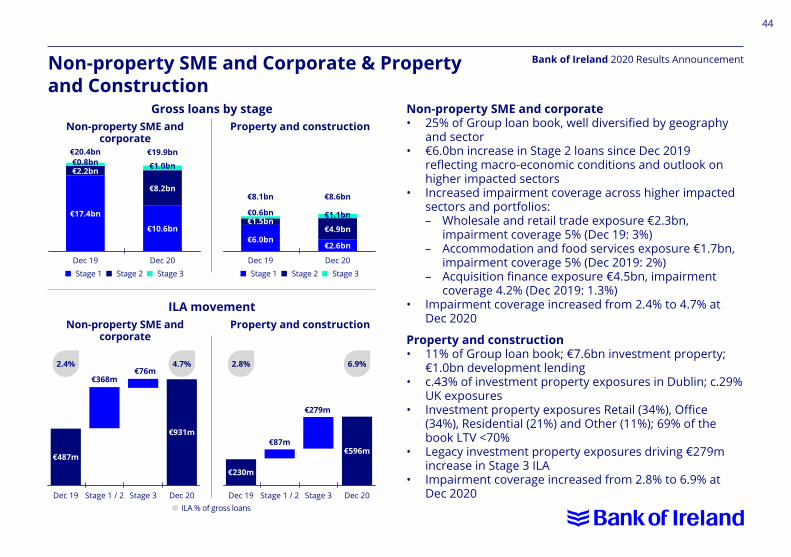
Bank of Ireland 2020 Results AnnouncementNon-property SME and Corporate & Property and Construction
Non-property SME and corporate• 25% of Group loan book, well diversified by geography
and sector • €6.0bn increase in Stage 2 loans since Dec 2019
reflecting macro-economic conditions and outlook on higher impacted sectors
• Increased impairment coverage across higher impacted sectors and portfolios:
– Wholesale and retail trade exposure €2.3bn, impairment coverage 5% (Dec 19: 3%)
– Accommodation and food services exposure €1.7bn, impairment coverage 5% (Dec 2019: 2%)
– Acquisition finance exposure €4.5bn, impairment coverage 4.2% (Dec 2019: 1.3%)
• Impairment coverage increased from 2.4% to 4.7% at Dec 2020
Property and construction• 11% of Group loan book; €7.6bn investment property;
€1.0bn development lending• c.43% of investment property exposures in Dublin; c.29%
UK exposures• Investment property exposures Retail (34%), Office
(34%), Residential (21%) and Other (11%); 69% of the book LTV <70%
• Legacy investment property exposures driving €279m increase in Stage 3 ILA
• Impairment coverage increased from 2.8% to 6.9% at Dec 2020
Gross loans by stageNon-property SME and
corporate
Non-property SME and corporate
Property and construction
Property and constructionILA movement
€17.4bn
€6.0bn€10.6bn
€2.6bn
€0.8bn
€0.6bn
€1.0bn
€1.1bn
€20.4bn
€368m
€87m
€76m
€279m
€8.1bn
€19.9bn
€8.6bn
€2.2bn
€1.5bn
€8.2bn
€4.9bn
Dec 19 Dec 19Stage 3 Stage 3Stage 1 / 2 Stage 1 / 2Dec 20 Dec 20
Dec 19 Dec 19Dec 20 Dec 20
€487m
€230m
€931m
€596m
ILA % of gross loans
n Stage 1 n Stage 2 n Stage 3 n Stage 1 n Stage 2 n Stage 3
2.4% 2.8%4.7% 6.9%
45
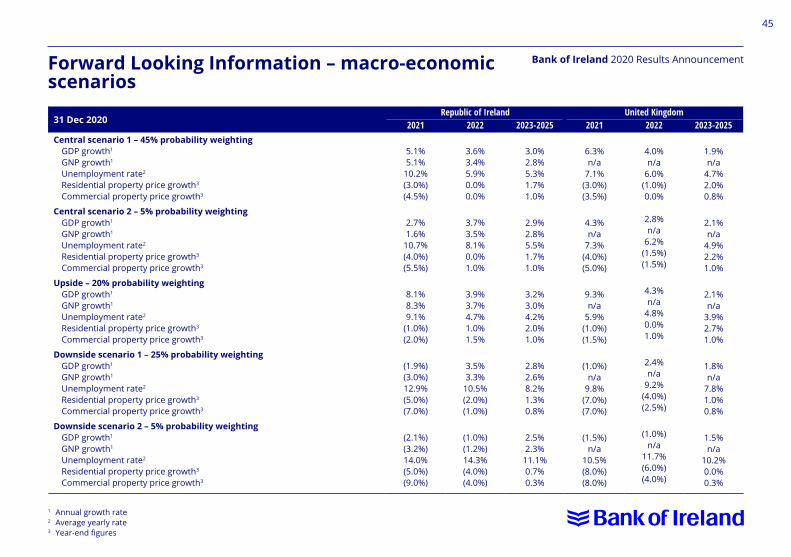
Bank of Ireland 2020 Results AnnouncementForward Looking Information – macro-economic scenarios
31 Dec 2020Republic of Ireland United Kingdom
2021 2022 2023-2025 2021 2022 2023-2025Central scenario 1 – 45% probability weighting GDP growth1
GNP growth1
Unemployment rate2
Residential property price growth3
Commercial property price growth3
Central scenario 2 – 5% probability weighting GDP growth1
GNP growth1
Unemployment rate2
Residential property price growth3
Commercial property price growth3
Upside – 20% probability weighting GDP growth1
GNP growth1
Unemployment rate2
Residential property price growth3
Commercial property price growth3
Downside scenario 1 – 25% probability weighting GDP growth1
GNP growth1
Unemployment rate2
Residential property price growth3
Commercial property price growth3
Downside scenario 2 – 5% probability weighting GDP growth1
GNP growth1
Unemployment rate2
Residential property price growth3
Commercial property price growth3
5.1%5.1%
10.2%(3.0%)(4.5%)
2.7%1.6%
10.7%(4.0%)(5.5%)
8.1%8.3%9.1%
(1.0%)(2.0%)
(1.9%)(3.0%)12.9%(5.0%)(7.0%)
(2.1%)(3.2%)14.0%(5.0%)(9.0%)
3.6%3.4%5.9%0.0%0.0%
3.7%3.5%8.1%0.0%1.0%
3.9%3.7%4.7%1.0%1.5%
3.5%3.3%
10.5%(2.0%)(1.0%)
(1.0%)(1.2%)14.3%(4.0%)(4.0%)
3.0%2.8%5.3%1.7%1.0%
2.9%2.8%5.5%1.7%1.0%
3.2%3.0%4.2%2.0%1.0%
2.8%2.6%8.2%1.3%0.8%
2.5%2.3%
11.1%0.7%0.3%
6.3%n/a
7.1%(3.0%)(3.5%)
4.3%n/a
7.3%(4.0%)(5.0%)
9.3%n/a
5.9%(1.0%)(1.5%)
(1.0%)n/a
9.8%(7.0%)(7.0%)
(1.5%)n/a
10.5%(8.0%)(8.0%)
4.0%n/a
6.0%(1.0%)0.0%
2.8%n/a
6.2%(1.5%)(1.5%)
4.3%n/a
4.8%0.0%1.0%
2.4%n/a
9.2%(4.0%)(2.5%)
(1.0%)n/a
11.7%(6.0%)(4.0%)
1.9%n/a
4.7%2.0%0.8%
2.1%n/a
4.9%2.2%1.0%
2.1%n/a
3.9%2.7%1.0%
1.8%n/a
7.8%1.0%0.8%
1.5%n/a
10.2%0.0%0.3%
1 Annual growth rate2 Average yearly rate3 Year-end figures
46
Bank of Ireland 2020 Results Announcement
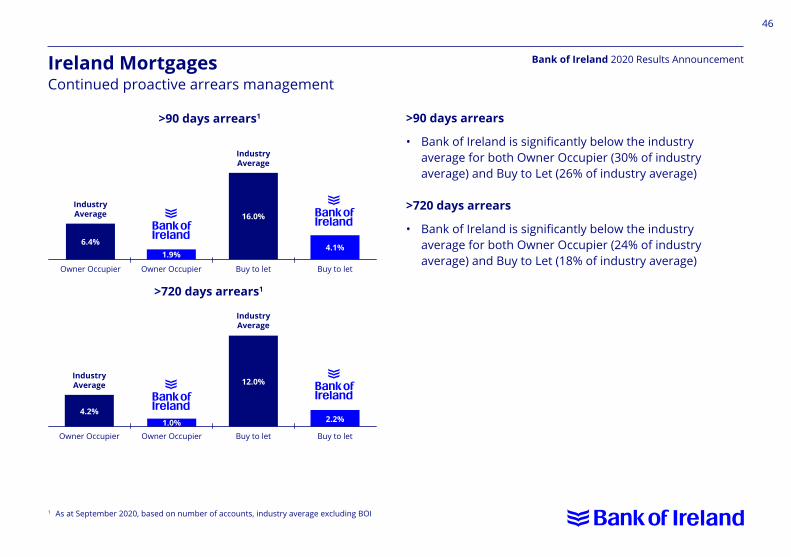
>90 days arrears
• Bank of Ireland is significantly below the industry average for both Owner Occupier (30% of industry average) and Buy to Let (26% of industry average)
>720 days arrears
• Bank of Ireland is significantly below the industry average for both Owner Occupier (24% of industry average) and Buy to Let (18% of industry average)
Ireland MortgagesContinued proactive arrears management
Owner Occupier Buy to letOwner Occupier Buy to let
Industry Average
4.2%
Industry Average
12.0%
1.0% 2.2%
>720 days arrears1
>90 days arrears1
Owner Occupier Buy to letOwner Occupier Buy to let
Industry Average
6.4%
Industry Average
16.0%
1.9%4.1%
1 As at September 2020, based on number of accounts, industry average excluding BOI
47
Bank of Ireland 2020 Results AnnouncementCapital and liquidity
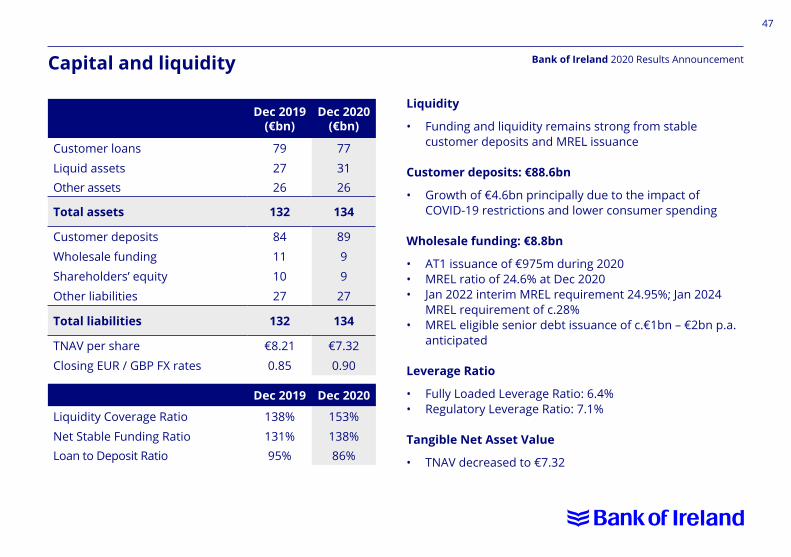
Liquidity
• Funding and liquidity remains strong from stable customer deposits and MREL issuance
Customer deposits: €88.6bn
• Growth of €4.6bn principally due to the impact of COVID-19 restrictions and lower consumer spending
Wholesale funding: €8.8bn
• AT1 issuance of €975m during 2020• MREL ratio of 24.6% at Dec 2020• Jan 2022 interim MREL requirement 24.95%; Jan 2024
MREL requirement of c.28%• MREL eligible senior debt issuance of c.€1bn – €2bn p.a.
anticipated
Leverage Ratio
• Fully Loaded Leverage Ratio: 6.4%• Regulatory Leverage Ratio: 7.1%
Tangible Net Asset Value
• TNAV decreased to €7.32
Dec 2019(€bn)
Dec 2020(€bn)
Customer loans 79 77
Liquid assets 27 31Other assets 26 26
Total assets 132 134
Customer deposits 84 89
Wholesale funding 11 9
Shareholders’ equity 10 9
Other liabilities 27 27
Total liabilities 132 134
TNAV per share €8.21 €7.32
Closing EUR / GBP FX rates 0.85 0.90
Dec 2019 Dec 2020
Liquidity Coverage Ratio 138% 153%
Net Stable Funding Ratio 131% 138%Loan to Deposit Ratio 95% 86%
48
Bank of Ireland 2020 Results AnnouncementOrdinary shareholders’ equity and TNAV
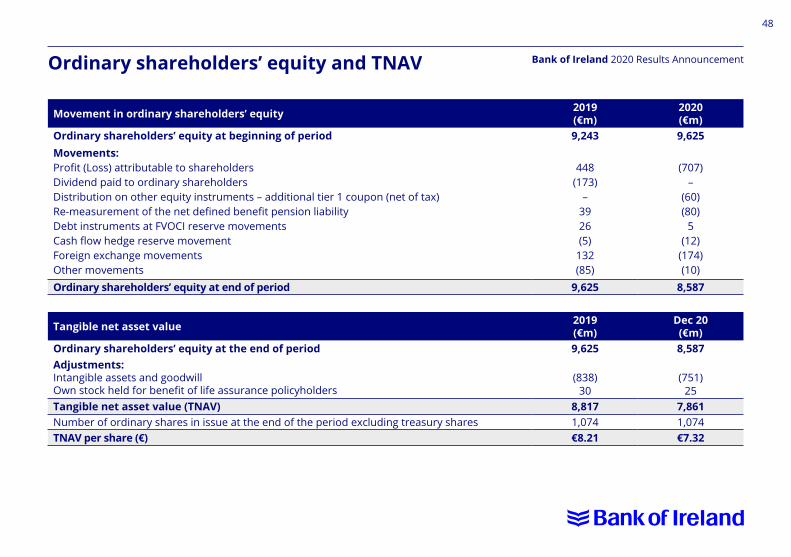
Movement in ordinary shareholders’ equity 2019(€m)
2020(€m)
Ordinary shareholders’ equity at beginning of period 9,243 9,625Movements:Profit (Loss) attributable to shareholdersDividend paid to ordinary shareholdersDistribution on other equity instruments – additional tier 1 coupon (net of tax)Re-measurement of the net defined benefit pension liability Debt instruments at FVOCI reserve movementsCash flow hedge reserve movementForeign exchange movementsOther movements
448(173)
–3926(5)
132(85)
(707)–
(60)(80)
5(12)
(174)(10)
Ordinary shareholders’ equity at end of period 9,625 8,587
Tangible net asset value 2019(€m)
Dec 20(€m)
Ordinary shareholders’ equity at the end of period 9,625 8,587Adjustments:Intangible assets and goodwillOwn stock held for benefit of life assurance policyholders
(838)30
(751)25
Tangible net asset value (TNAV) 8,817 7,861Number of ordinary shares in issue at the end of the period excluding treasury shares 1,074 1,074TNAV per share (€) €8.21 €7.32
49
Bank of Ireland 2020 Results Announcement
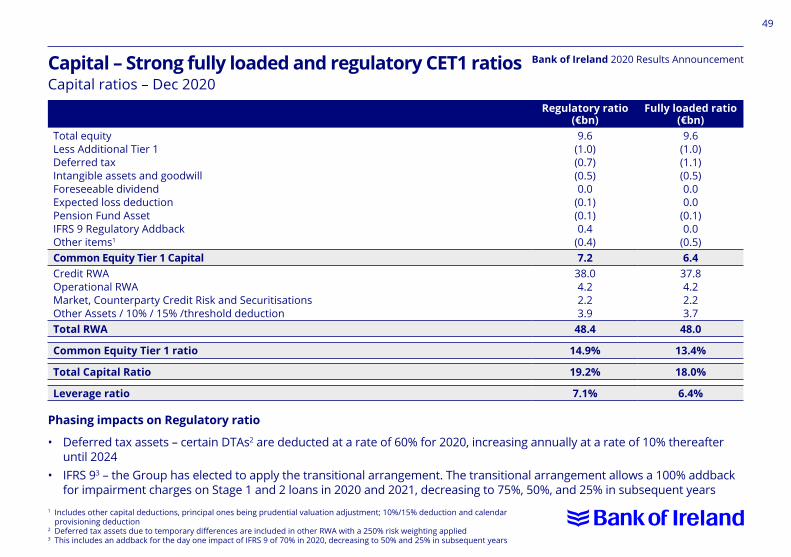
Phasing impacts on Regulatory ratio
• Deferred tax assets – certain DTAs2 are deducted at a rate of 60% for 2020, increasing annually at a rate of 10% thereafter until 2024
• IFRS 93 – the Group has elected to apply the transitional arrangement. The transitional arrangement allows a 100% addback for impairment charges on Stage 1 and 2 loans in 2020 and 2021, decreasing to 75%, 50%, and 25% in subsequent years
Capital – Strong fully loaded and regulatory CET1 ratiosCapital ratios – Dec 2020
Regulatory ratio(€bn)
Fully loaded ratio(€bn)
Total equityLess Additional Tier 1Deferred taxIntangible assets and goodwillForeseeable dividendExpected loss deductionPension Fund AssetIFRS 9 Regulatory AddbackOther items1
9.6(1.0)(0.7)(0.5)0.0
(0.1)(0.1)0.4
(0.4)
9.6(1.0)(1.1)(0.5)0.00.0
(0.1)0.0
(0.5)Common Equity Tier 1 Capital 7.2 6.4Credit RWAOperational RWAMarket, Counterparty Credit Risk and SecuritisationsOther Assets / 10% / 15% /threshold deduction
38.04.22.23.9
37.84.22.23.7
Total RWA 48.4 48.0
Common Equity Tier 1 ratio 14.9% 13.4%
Total Capital Ratio 19.2% 18.0%
Leverage ratio 7.1% 6.4%
1 Includes other capital deductions, principal ones being prudential valuation adjustment; 10%/15% deduction and calendar provisioning deduction
2 Deferred tax assets due to temporary differences are included in other RWA with a 250% risk weighting applied3 This includes an addback for the day one impact of IFRS 9 of 70% in 2020, decreasing to 50% and 25% in subsequent years
50
Bank of Ireland 2020 Results AnnouncementRegulatory Capital Requirements
Regulatory Capital Requirements
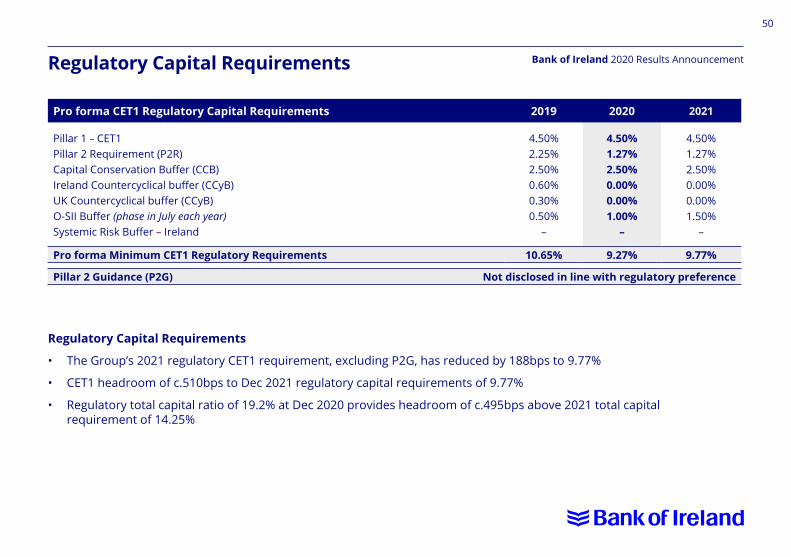
• The Group’s 2021 regulatory CET1 requirement, excluding P2G, has reduced by 188bps to 9.77%
• CET1 headroom of c.510bps to Dec 2021 regulatory capital requirements of 9.77%
• Regulatory total capital ratio of 19.2% at Dec 2020 provides headroom of c.495bps above 2021 total capital requirement of 14.25%
Pro forma CET1 Regulatory Capital Requirements 2019 2020 2021
Pillar 1 – CET1Pillar 2 Requirement (P2R) Capital Conservation Buffer (CCB)Ireland Countercyclical buffer (CCyB)UK Countercyclical buffer (CCyB)O-SII Buffer (phase in July each year)Systemic Risk Buffer – Ireland
4.50%2.25%2.50%0.60%0.30%0.50%
–
4.50%1.27%2.50%0.00%0.00%1.00%
–
4.50%1.27%2.50%0.00%0.00%1.50%
–
Pro forma Minimum CET1 Regulatory Requirements 10.65% 9.27% 9.77%
Pillar 2 Guidance (P2G) Not disclosed in line with regulatory preference
51
Bank of Ireland 2020 Results AnnouncementRisk Weighted Assets (RWAs) / Leverage Ratio
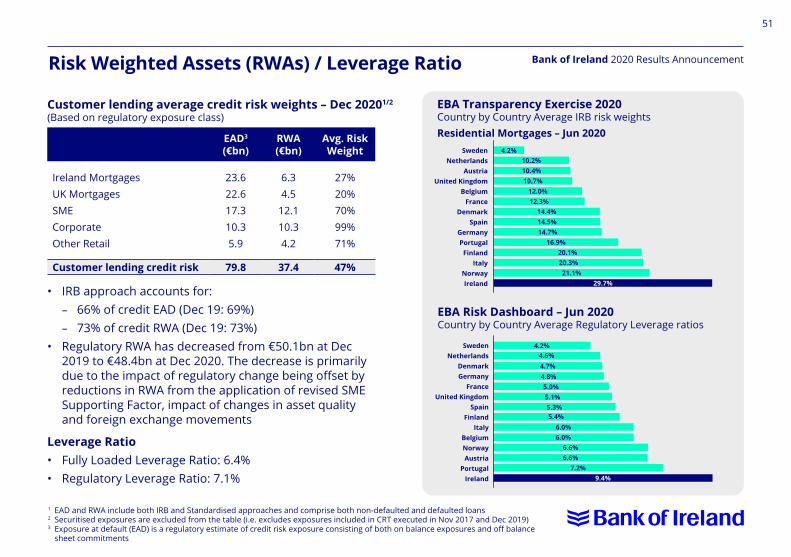
Customer lending average credit risk weights – Dec 20201/2
(Based on regulatory exposure class)
• IRB approach accounts for: – 66% of credit EAD (Dec 19: 69%) – 73% of credit RWA (Dec 19: 73%)• Regulatory RWA has decreased from €50.1bn at Dec
2019 to €48.4bn at Dec 2020. The decrease is primarily due to the impact of regulatory change being offset by reductions in RWA from the application of revised SME Supporting Factor, impact of changes in asset quality and foreign exchange movements
Leverage Ratio• Fully Loaded Leverage Ratio: 6.4%• Regulatory Leverage Ratio: 7.1%
EAD3
(€bn)RWA(€bn)
Avg. Risk Weight
Ireland MortgagesUK MortgagesSMECorporateOther Retail
23.622.617.310.35.9
6.34.5
12.110.34.2
27%20%70%99%71%
Customer lending credit risk 79.8 37.4 47%
EBA Transparency Exercise 2020Country by Country Average IRB risk weightsResidential Mortgages – Jun 2020
EBA Risk Dashboard – Jun 2020Country by Country Average Regulatory Leverage ratios
Sweden Netherlands
DenmarkGermany
FranceUnited Kingdom
Spain Finland
ItalyBelgiumNorway Austria
PortugalIreland
1 EAD and RWA include both IRB and Standardised approaches and comprise both non-defaulted and defaulted loans2 Securitised exposures are excluded from the table (i.e. excludes exposures included in CRT executed in Nov 2017 and Dec 2019)3 Exposure at default (EAD) is a regulatory estimate of credit risk exposure consisting of both on balance exposures and off balance
sheet commitments
9.4%7.2%
6.6%6.6%
6.0%6.0%
5.4%5.3%
5.1%5.0%
4.8%4.7%4.6%
4.2%
Sweden Netherlands
AustriaUnited Kingdom
BelgiumFrance
DenmarkSpain
GermanyPortugal
FinlandItaly
NorwayIreland
4.2%10.2%10.4%10.7%
12.0%12.3%
14.4%14.5%14.7%
16.9%20.1%20.3%21.1%
29.7%
52
Bank of Ireland 2020 Results Announcement
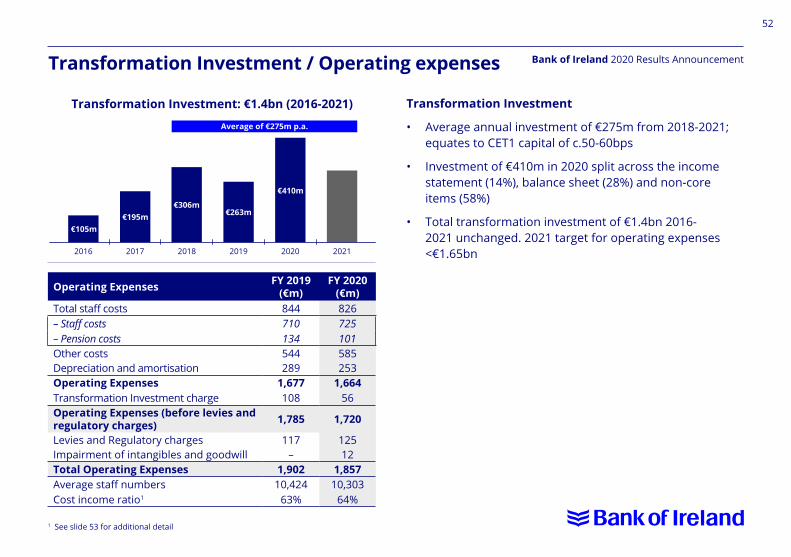
Average of €275m p.a.
€306m€263m
€410m
€195m€105m
Transformation Investment: €1.4bn (2016-2021)
2016 2017 2018 2019 2020 2021
Transformation Investment / Operating expenses
Transformation Investment
• Average annual investment of €275m from 2018-2021; equates to CET1 capital of c.50-60bps
• Investment of €410m in 2020 split across the income statement (14%), balance sheet (28%) and non-core items (58%)
• Total transformation investment of €1.4bn 2016-2021 unchanged. 2021 target for operating expenses <€1.65bn
Operating Expenses FY 2019(€m)
FY 2020(€m)
Total staff costs 844 826– Staff costs 710 725– Pension costs 134 101Other costs 544 585Depreciation and amortisation 289 253Operating Expenses 1,677 1,664Transformation Investment charge 108 56Operating Expenses (before levies and regulatory charges) 1,785 1,720
Levies and Regulatory charges 117 125Impairment of intangibles and goodwill – 12Total Operating Expenses 1,902 1,857Average staff numbers 10,424 10,303Cost income ratio1 63% 64%
1 See slide 53 for additional detail
53
Bank of Ireland 2020 Results AnnouncementCost income ratio: Dec 2020Headline vs. Adjusted
FY 2020Headline
(€m)
Pro forma adjustments
(€m)
FY 2020 Pro forma
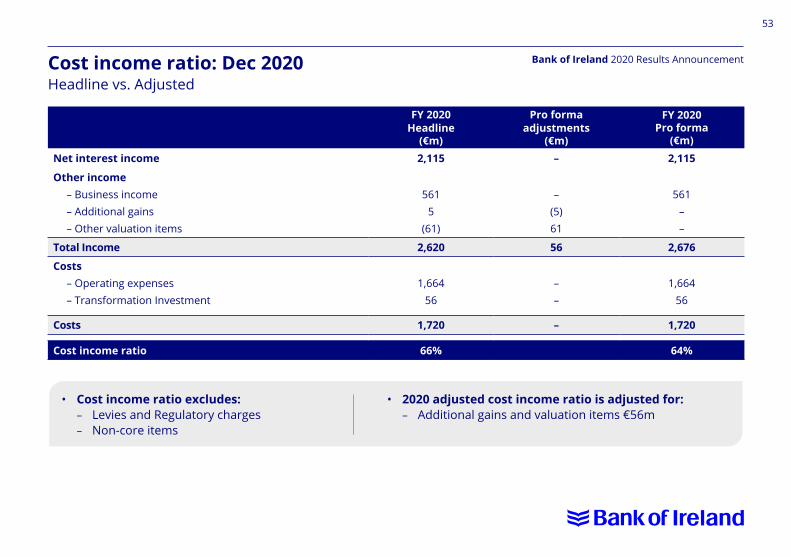
(€m)Net interest income 2,115 – 2,115
Other income– Business income– Additional gains– Other valuation items
5615
(61)
–(5)61
561––
Total Income 2,620 56 2,676
Costs– Operating expenses– Transformation Investment
1,66456
––
1,66456
Costs 1,720 – 1,720
Cost income ratio 66% 64%
• Cost income ratio excludes: – Levies and Regulatory charges – Non-core items
• 2020 adjusted cost income ratio is adjusted for: – Additional gains and valuation items €56m
54
Bank of Ireland 2020 Results AnnouncementDefined Benefit Pension Schemes
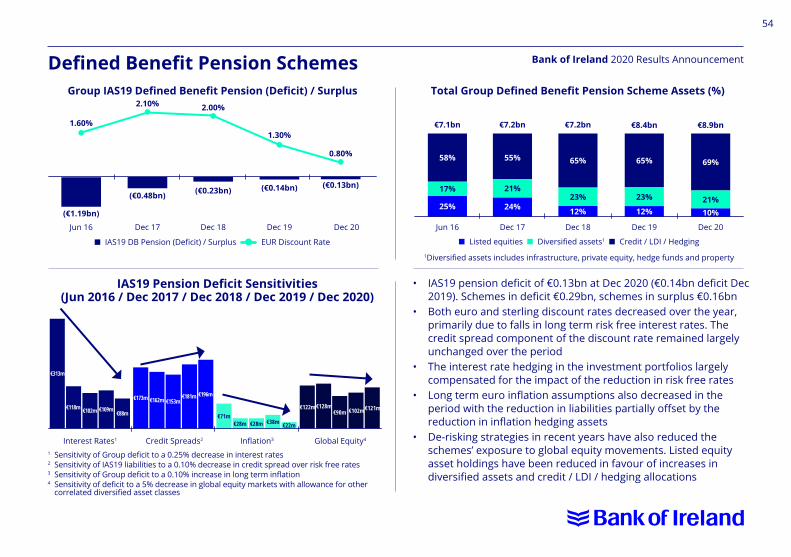
• IAS19 pension deficit of €0.13bn at Dec 2020 (€0.14bn deficit Dec 2019). Schemes in deficit €0.29bn, schemes in surplus €0.16bn
• Both euro and sterling discount rates decreased over the year, primarily due to falls in long term risk free interest rates. The credit spread component of the discount rate remained largely unchanged over the period
• The interest rate hedging in the investment portfolios largely compensated for the impact of the reduction in risk free rates
• Long term euro inflation assumptions also decreased in the period with the reduction in liabilities partially offset by the reduction in inflation hedging assets
• De-risking strategies in recent years have also reduced the schemes’ exposure to global equity movements. Listed equity asset holdings have been reduced in favour of increases in diversified assets and credit / LDI / hedging allocations
Group IAS19 Defined Benefit Pension (Deficit) / Surplus Total Group Defined Benefit Pension Scheme Assets (%)
n IAS19 DB Pension (Deficit) / Surplus EUR Discount Rate n Listed equities n Diversified assets1 n Credit / LDI / Hedging
1Diversified assets includes infrastructure, private equity, hedge funds and property
(€0.48bn)
€7.2bn €7.2bn
(€0.23bn)
€8.4bn €8.9bn
(€0.14bn) (€0.13bn)
Jun 16 Dec 17 Dec 18 Dec 19 Dec 20 Jun 16 Dec 17 Dec 18 Dec 19 Dec 20
(€1.19bn)
€7.1bn
25% 24% 12% 12% 10%
17%
58% 55% 65% 65% 69%
1.60%
2.10% 2.00%
1.30%
0.80%
IAS19 Pension Deficit Sensitivities(Jun 2016 / Dec 2017 / Dec 2018 / Dec 2019 / Dec 2020)
Interest Rates1 Credit Spreads2 Inflation3 Global Equity4
1 Sensitivity of Group deficit to a 0.25% decrease in interest rates2 Sensitivity of IAS19 liabilities to a 0.10% decrease in credit spread over risk free rates3 Sensitivity of Group deficit to a 0.10% increase in long term inflation4 Sensitivity of deficit to a 5% decrease in global equity markets with allowance for other
correlated diversified asset classes
€313m
€173m €162m €153m€181m €196m
€118m €102m €109m €88m €71m€22m€38m€28m €28m
€122m€128m€90m €102m€121m
21%23% 23% 21%
55
Bank of Ireland 2020 Results AnnouncementForward – Looking statement
This document contains forward-looking statements with respect to certain of the Bank of Ireland Group plc (the ‘Company’ or ‘BOIG plc’) and its subsidiaries’ (collectively the ‘Group’ or ‘BOIG plc Group’) plans and its current goals and expectations relating to its future financial condition and performance, the markets in which it operates and its future capital requirements. These forward-looking statements often can be identified by the fact that they do not relate only to historical or current facts. Generally, but not always, words such as ‘may,’ ‘could,’ ‘should,’ ‘will,’ ‘expect,’ ‘intend,’ ‘estimate,’ ‘anticipate,’ ‘assume,’ ‘believe,’ ‘plan,’ ‘seek,’ ‘continue,’ ‘target,’ ‘goal,’ ‘would,’ or their negative variations or similar expressions identify forward-looking statements, but their absence does not mean that a statement is not forward-looking.
Examples of forward-looking statements include, among others: statements regarding the Group’s near term and longer term future capital requirements and ratios, level of ownership by the Irish Government, loan to deposit ratios, expected impairment charges, the level of the Group’s assets, the Group’s financial position, future income, business strategy, projected costs, margins, future payment of dividends, the implementation of changes in respect of certain of the Group’s pension schemes, estimates of capital expenditures, discussions with Irish, United Kingdom, European and other regulators and plans and objectives for future operations. Such forward-looking statements are inherently subject to risks and uncertainties, and hence actual results may differ materially from those expressed or implied by such forward-looking statements.
Such risks and uncertainties include, but are not limited to, those as set out in the Risk Management Report in the Group’s Annual Report for the year ended 31 December 2020. Investors should also read ‘Principal Risks and Uncertainties’ in the Group’s Annual Report for the year ended 31 December 2020 beginning on page 135.
Nothing in this document should be considered to be a forecast of future profitability, dividends or financial position of the Group and none of the information in this document is or is intended to be a profit forecast, dividend forecast or profit estimate. Any forward-looking statement speaks only as at the date it is made. The Group does not undertake to release publicly any revision to these forward-looking statements to reflect events, circumstances or unanticipated events occurring after the date hereof.

56
Bank of Ireland 2020 Results AnnouncementContact Details
For further information please contact:
• Group Chief Financial Officer Myles O’Grady tel: +353 12 50 8900 ext. 43291 [email protected]
• Investor Relations Darach O’Leary tel: +353 12 50 8900 ext. 44711 [email protected] Owen Callan tel: +353 12 50 8900 ext. 45092 [email protected] Philip O’Sullivan tel: +353 12 50 8900 ext. 35328 [email protected] Catriona Hickey tel: +353 12 50 8900 ext. 49051 [email protected]
• Group Treasury Tony Morley tel: +353 12 50 8900 ext. 41974 [email protected] Alan Elliott tel: +353 12 50 8900 ext. 44371 [email protected] Alan McNamara tel: +353 12 50 8900 ext. 48725 [email protected]
• Group Communications Damien Garvey tel: +353 12 50 8900 ext. 46716 [email protected]
• Investor Relations website www.bankofireland.com/investor