Embed Size (px)
Citation preview

20 International Journal of Petroleum Technology, 2020, 7, 20-33
E-ISSN: 2409-787X/20 © 2020 Avanti Publishers
The Effect of Well Completion Fluid Loss on Productivity Evaluation in Tight Sand Gas Reservoir: A Case Study from East China Sea Gas Well
Kechao Gao1,*, Suogui Shang1, Xuan Wu2, Liang Tao2 and Yutang Jin2
1Exploration Dept. CNOOC. Tianjin Branch;
2Cosl-Expro Testing Services (Tianjin) Co. Ltd.
Abstract: Fluid loss is inevitable in the well drilling and completion, which may cause series of formation damage such as clay swelling, solid plugging and water blocking. In tight sand gas reservoir, water blocking has become the major damage factor for economical developing. In deliverability test, water blocking will bring an inaccurate productivity test result to affect the following development strategy. With the development of East China Sea gas field, well drilling is focusing on the deeper tight sand formation. The tiny pore throat and high capillary pressure can bring out serious water blocking damage during well drilling and completion. The damaged zone can mislead the resource assessment and productivity evaluation. In this paper, an exploration well X in East China Sea gas field is selected as the research target to investigate the water blocking mechanism and physical process during well drilling and completion process. This study compares the productivity performance of X well with fluid loss and no fluid loss models through numerical modeling approach based on the actual data. Sensitive studies are also performed in the simulation. Results show that the excessive fluid invasion pressure and lower matrix permeability will result in serious water blocking damage to mislead the resource assessment and productivity evaluation even in underbalanced well drilling. Interestingly, extending shut-in time can make the gas production rate quickly reach the peak value in the early production stage, while it can decrease the cumulative gas production in whole production process. This study can provide an avenue to initiate quantitative analysis on resource assessment, and gas productivity evaluation strategy after water invasion during the well drilling and completion in tight sand gas reservoir of East China Sea.
Keywords: Tight gas reservoir; Fluid loss; Well completion; Water blocking; Deliverability test.
1. INTRODUCTION
Major breakthroughs of deep tight gas exploration
were made at the East China Sea region in recent
years and ten billion stored gas resources have been
confirmed. But the main formation of this reservoir is
usually at the depth of 3500~4500m with high tempe-
rature and high pressure (HTHP), low permeability and
micro pores characterization, which allows the forma-
tion to be easily damaged during well drilling and com-
pletion. The most crucial damage is the water blocking
and jamin effect caused by capillary resistance, which
can dramatically decrease gas relative permeability
and bring out inaccurate productivity evaluation for the
tight sand gas layer. The most general phenomenon in
exploration is that the gas layer is active, but the layer
character in the test is of low permeability with low gas
production, little water output and no commercial
exploitation value. Well logging interpretation often
gives an unusually high-water saturation, and the gas
reserve calculation deviation is large. For deep tight
gas reservoir, the effective development is difficult
because of the harsh abysmal sea condition, while the
tight gas reservoir at East China Sea is a typical
example.
*Address correspondence to this author at the Exploration Dept. CNOOC. Tianjin Branch; E-mail: [email protected]
To make a proper development strategy and
achieve the maximum economic benefits of tight sand
gas reservoir, the correct resource assessment and
productivity evaluation become critically important. In
tight sand gas reservoir, water blocking has become
the major damage factor for economical developing. If
we do not take any method to lower water blocking
damage during well drilling and completion process, it
will mislead project design and even lead to the failure
of investment. Hence, it is usually a high-risk job for the
exploration well drilling and completion in tight sand
gas reservoir.
Hydraulic fracturing in vertical or horizontal wells is
the common strategy in order to efficiently develop tight
sand gas reservoirs [1]. However, hydraulic fracturing
cannot be easily performed in offshore drilling platform
due to the limited space in offshore platform. Due to
different influence factor, especially the unavoidable
well completion fluid loss, we usually get the abnormal
high-water saturation and ultra-low productivity, which
cause the delay of gas layer found and inaccuracy of
productivity estimation. The issue of fluid loss/invasion
has been widely studied in the past, Keelan and Koepf
[2] noted that the reason for the decreasing of gas
relative permeability is the occurence of water blocking.
Holdicht [3] indicated that if the water saturation in
pores is too high, the pressure of reservoir couldn’t

The Effect of Well Completion Fluid Loss on Productivity Evaluation International Journal of Petroleum Technology, 2020, Vol. 7 21
overcome the capillary pressure after the well
completion hence the ideal productivity cannot be
obtained unless the water in pores is completely driven
out. Bennion et al. [4] discussed the mechanism of
water blocking in tight gas reservoir, the study pointed
out that the controlling factor of water blocking is the
gathering and retention of liquid in gas reservoir. The
lower the permeability is, the greater the damage is.
Zhou et al. [5] investigated the impact of different water
saturation, flowing differential pressure, and wettability
on water blocking through Poiseuille law. Wills et al. [6]
used a two phase 3-D numerical simulation model to
investigate hydraulic fracture cleanup for both slick
water and gelled fluids, showing that the pressure
drawdown, shut-in times, and perforation placement all
had significant effect on fracture face damage and
clean-up potential. Tsar et al. [7] studied the trap
damage with water-based fluid compared with oil-
based fluid in a tight gas reservoir. Bahrami et al. [8]
analyzed the productivity with different initial water
saturation and critical water saturation, indicating that
Swi(initial water saturation)might be normal, or in
some cases, lower than Swc(critical water saturation)
due to water phase vaporization into the gas phase.
The simulation study confirmed that the water blocking
damage will be more serious with greater different value
between the Swi and Swc. Ghanbari and Dehghanpour
[9] indicated that controlling the fluid loss is the key to
exploit a tight sand gas reservoir successfully.
As is shown in above studies, many different factors
can affect the water invasion in the tight formation,
which can cause serious formation damage to lower
gas productivity. How and why the engineering factors
and formation condition affect the resource assessment
and productivity evaluation of East China Sea tight gas
field is an interesting topic. In the deliverability test,
accurate gas productivity will determine the economical
production strategy. Hence, it is important to under-
stand the actual deliverability and correct the product-
ivity under the damage of water invasion.
In this paper, an exploration well X in East China
Sea gas filed is selected as the research target to
investigate the water blocking mechanism and physical
process during well drilling and completion process.
The influence of well completion fluid density, shut-in
time, matrix permeability on water invasion, flow back
and regained gas productivity are investigated. To
achieve the goal of this study, a 3-D reservoir model for
exploration well X is designed based on real data. The
gas productivity with and without water block are
simulated. Sensitive studies are performed to
comprehend how the well completion fluid density,
shut-in time and matrix permeability affect the gas
production under water blocking in this tight gas
reservoir. This study aims at quantitative analysis on
how the well completion fluid loss affects the
productivity data in deliverability test in tight gas sand
reservoir. Technique results can be used a guideline to
rectify deliverability test result and obtain the real
reserves evaluation in exploration well.
2. FLUID LOSS IN WELL DRILLING AND COM- PLETION
Water saturation is a key index in reserves evalu-
ation and productivity assessment. Tight gas reservoir
usually has a low initial water saturation (Swi) because
of evaporation and compaction before exploitation,
amount of irreducible and immobile water saturation
will be much higher due to the reduction in porosity and
abundant micro-porosity. In initial situation, water in the
pores can’t flow until the water saturation exceeds the
critical saturation (Swc).When the tight gas reservoir is
put into development, the drilling and completion fluid
invasion can cause water saturation near the wellbore
to increase from low value (Swi) to mobility state.
Holditch [3] studied the relative permeability in tight gas
reservoir, the relationship between permeability and
water saturation in tight gas reservoir was revealed.
Ward and Morrow [10] did some work on capillary
pressure and relative permeability in low permeability
sandstones, they concluded that the capillary imbibition
plays a key role in the water invasion.
As is shown in above figures, the water blocking
mechanism can be briefly illustrated; the matrix of tight
gas reservoir is filled with gas at the initial condition
with a low water saturation due to vaporization and
compaction. Once the formation is opened, the drilling
and completion fluid invasion is unavoidable and
relative gas permeability near the borehole will
decrease sharply with the water saturation increasing.
After the shut-in time, the retained water in pore throat
is difficult to be driven out by gas flow due to the strong
capillary pressure. Hence, the water saturation will stay
at the irreducible section to bring out inefficient gas flow
ability, and the deliverability test is not accurate and
cannot reflect the real gas productivity.
3. RESERVOIR MODEL DESCRIPTION
3.1. Model Set-Up
Tight gas reservoirs normally have production
problems due to very low matrix permeability and they

22 International Journal of Petroleum Technology, 2020, Vol. 7 Gao et al.
may not produce gas with real rates under water
blocking damage [11]. The damage is difficult to relieve
without stimulation and advanced completion
techniques, so we usually get inaccurate productivity in
the deliverability test. In this paper, we use CMG-IMEX
simulator to study the effect of well completion fluid
loss in the tight gas reservoir based on the real data of
the exploration well X from the East China Sea. The
simulator is a widely recognized software to model gas
production based on black oil model. Exploration well X
is at the depth of 4200 m under the sea level. To
restore the real formation condition, we set the matrix
permeability according to the reservoir core analysis
data which shows that the formation permeability
ranges from 0.17mD to 0.67 mD at different depths.
The initial pressure and temperature is 53.5 MPa and
170.8℃ respectively, indicating that the gas reservoir is
a typical HPHT tight sand gas reservoir. The model is
based on a 19×19×13 cartesian grid in the X, Y, and Z
direction, respectively. Figure 1 shows the total
reservoir volume is 170m×170m×100m. An injection
well is set at the center of the model (grid 10, 10,
1to11) to simulate the well completion fluid loss
process. Figure 4 shows a producing well X is set at
the same location to simulate deliverability test.
The local grid refinement (LGR) with logarithmic cell
spacing method is employed to reduce the numerical
dispersion effect especially for capturing accurate
water distribution during well completion fluid loss and
flow back. Capillary pressure is the crucial factor for
water suction and retention, capillary hysteresis is also
observed in the lab experiment. We set the capillary
pressure and capillary hysteresis in the model referring
to the lab data (Figure 2). The flooding experiment is
conducted in the lab. Figure 3 depicts the relative
Figure 1: Reservoir model 3-D view and planform (showing grid sizes in X, Y and Z directions).
Figure 2: The relationship between water saturation and capillary pressure (data from tight gas reservoir in East China Sea,
2013).

The Effect of Well Completion Fluid Loss on Productivity Evaluation International Journal of Petroleum Technology, 2020, Vol. 7 23
permeability curve in this model after summarizing the
expatiatory lab data. More details about this model are
summarized in Table 1.
3.2. The Model Calibration
The deliverability test lasts about one month, after
20 days of shut in time, the well is opened three times
with four different diameter flow nozzles to observe gas
productivity and monitor bottom hole flow pressure. To
match the deliverability test data, we mainly adjust the
uncertainty parameters such as relative permeability
curves, capillary pressure and capillary hysteresis to
perform model calibration. Figure 5 shows that the
model validation result matches well with the historical
Figure 3: Relative permeability curves used for simulation (data from tight gas reservoir in East China Sea, 2013).
Figure 4: X well position in the model (injection and production well are in the same perforated zone).
Table 1: Base Parameters of Simulation Model
No. of Grids in x, y and z Directions
Reservoir height (m)
Reservoir Permeability (mD)
Matrix Porosity (%)
Gas S.G (air=1)
19*19*13 100 0.17-0.67 9 0.7
Critical water saturation Initial water saturation Initial pressure (kPa) Reservoir temperature (oC) Gas-water contact
0.55 0.25 53500 170.8 4500m

24 International Journal of Petroleum Technology, 2020, Vol. 7 Gao et al.
pressure data. More details are summarized in Table 2.
Hence, the calibrated model can be used for the
subsequent study.
3.3. Productivity Evaluation under the Fluid Loss
The small amount of well completion fluid invasion
can induce serious formation damage in tight sand gas
reservoir. We observe the water invasion in the 3-D
result, which shows that the invasion water is difficult to
be removed even in the great drawdown pressure of
production. In the deliverability test, the water satura-
tion near the borehole increased from initial 25% to the
peak value of 68% after 3 days fluid loss. Figure 6
shows that the water saturation keeps at about 45%
during the whole deliverability test, which is obviously
higher than the initial water saturation and the gas
relativity permeability is seriously damaged.
Figure 7 compares the difference of absolute open-
flow capacity for the two scenarios, indicating that the
absolute open-flow capacity without fluid loss is almost
three times as fluid loss considering case. The gas rate
from the simulation indicates the gas reservoir is
expected to have favourable productivity without the
fluid loss in the depletion development.
Figure 8 shows the variation of well bottom-hole
pressure after well completion when production with
constant gas rate of 50000m3/d in 10 days. We can see
that the fluid loss model needs more pressure drop to
maintain the gas rate comparing with the no fluid loss
model.In Figure 9, after 7 years production with gas
rate of 50000m3/d, the cumlative gas without fluid loss
reaches at 5.5×10⁷m
3 and the model with fluid loss can
only reaches at 4.9×10⁷m
3. For no fluid loss model, the
Figure 5: Test history data match of well bottom pressure.
Table 2: Pressure and Production History Match with Four Different Flow Nozzles
Flow Nozzles (mm)
Test Pressure (kPa)
Simulation Pressure (kPa)
Error
4.76 21472 20500 4%
6.35 14366 14680 2%
3.18 30654 29500 3%
7.14 11420 11900 4%
Cumulative gas production
test cumulative gas production (m
3)
simulation cumulative gas production (m
3)
error
83892 89910 7%

The Effect of Well Completion Fluid Loss on Productivity Evaluation International Journal of Petroleum Technology, 2020, Vol. 7 25
stable gas production period lasts about 700days, while
only last about 350 days for fluid loss considering
model as shown in Figure 10. What is interesting is that
the productivity drop rate of the model with fluid loss is
slower than the no fluid loss model and it keeps a
higher gas rate in the last period of production.The
possible reason is that the retention water in the pores
offer the potential pressurization of gas reservoir to
withstand pressure decline.
4. SENSITIVITY ANALYSIS
4.1. Effect of Well Fluid Density on Productivity Evaluation
Proper choice of working fluid can guaranty the
success of well drilling and completion, different density
fluids mean different wellbore pressure, which can be
used to determine the invasion volume, depth and
Figure 6: Change of the water saturation near the wellbore (grid10,10,1) in the simulation.

26 International Journal of Petroleum Technology, 2020, Vol. 7 Gao et al.
velocity to evaluate formation damage [12]. In normal
well completion process, the fluid loss rate increases
with the increasing of positive pressure differential, the
high quality filter cake cannot be formed if the positive
pressure differential is too low or may be breakdown by
a higher positive pressure differential to make a greater
invasion of the solid and water. In balanced and
overbalanced drilling, the water is more easily to be
sucked by the strong capillary pressure, resulting in
serious water blocking [13].
Several models of different invasion pressure are
built to represent the different fluid density. We set the
53500 kPa as the reference and balanced drilling
pressure, underbalanced pressure is set at 53400kPa,
53300kPa, 53200kPa and 52500kPa, respectively.
Figure 7: Absolute open-flow capacity without fluid loss and with fluid loss.
Figure 8: The change of well bottom-hole pressure with constant gasrate of 50000m3/d in short time.

The Effect of Well Completion Fluid Loss on Productivity Evaluation International Journal of Petroleum Technology, 2020, Vol. 7 27
Overbalanced pressure is set at 53600 kPa, 53700
kPa, 53800 kPa and 54500 kPa, respectively.
According to the simulation result, we can see that the
water loss still exists even the invasion pressure below
the initial reservoir pressure. This is because of the
capillary pressure has a strong suction ability and the
negative pressure during underbalanced well drilling
still cannot overcome the imbibition. Figure 11 shows
that the fluid loss volume is increased with the
increasing of invasion pressure. Figure 12 shows that
the gas rate drops down obviously with the increasing
of fluid invasion pressure, we can see the gas rates are
almost the same after the overbalanced drilling. It infers
that when the invasion pressure increases to a certain
value (equal to well completion fluid density increases
to a certain value), the gas rate will keep at stable
value, which means that the invasion pressure is no
more the influence factor for the gas production when it
exceeds this critical value.
Figure 9: The cumulative gas production with the constant gasrate of 50000m3/d in long time.
Figure 10: The change of well bottom-hole pressure with the constant gas rate of 50000m3/d in long time.

28 International Journal of Petroleum Technology, 2020, Vol. 7 Gao et al.
4.2. Effect of Shut-in Time on Productivity Evaluation
There is always shut-in time between the opening of
formation and deliverability test, the shut-in time is
controlled by the climate, human resource, equipment
and working efficiency, so the shut-in time is an
uncertainty factor. In this section, we investigate the
effect of different shut-in time on the gas production
during deliverability test. Therefore, four different
simulation cases with 50, 100, 150 and 200 days of
Figure 11: The fluid loss volume with the change of wellbore pressure.
Figure 12: The gas rate with the change of wellbore pressure.

The Effect of Well Completion Fluid Loss on Productivity Evaluation International Journal of Petroleum Technology, 2020, Vol. 7 29
shut-in time are established. 20 days of shut-in time is
set as the reference(actual shut-in time for exploration
well X). Figures 13 and 14 show that the cumulative
water production and gas production rate after different
shut-in time. With the increasing of shut-in time from 50
days to 200 days, the water production decreases
significantly as shown in Table 3, which means more
water is restricted in the pore throat. The simulation
result shows that the water recovery ratio is ultra-low
due to water blocking. So much water near the wellbore
Figure 13: The cumulative water production afterdifferent shut-in time.
Figure 14: The gas rate after different shut-in time.
30 International Journal of Petroleum Technology, 2020, Vol. 7 Gao et al.
is supposed to cause serious damage to the gas flow.
But in the early production stage, Figure 14 illustrates a
interesting phenomenon which a longer shut-in time
brings a faster gas rate peak, this is due to strong
counter-current water imbibition which can result in
more free gas to be driven from the micro pores to the
bigger throat during the longer shut-in period. This is
like the gas production performance after fracturing
fluid flow black reported by Ghanbari and Dehghanpour
[9]. Considering that the mobility of gas is higher than
water, when the well is opened for deliverability test,
more free gas will be extracted in the early production
time after longer shut-in time. Hence, the “abnormal” peak gas rate is exhibited. This phenomenon can be
used as reference to improve the understanding of
peak oil or gas rate shown during fracturing fluid flow
back in tight reservoir.
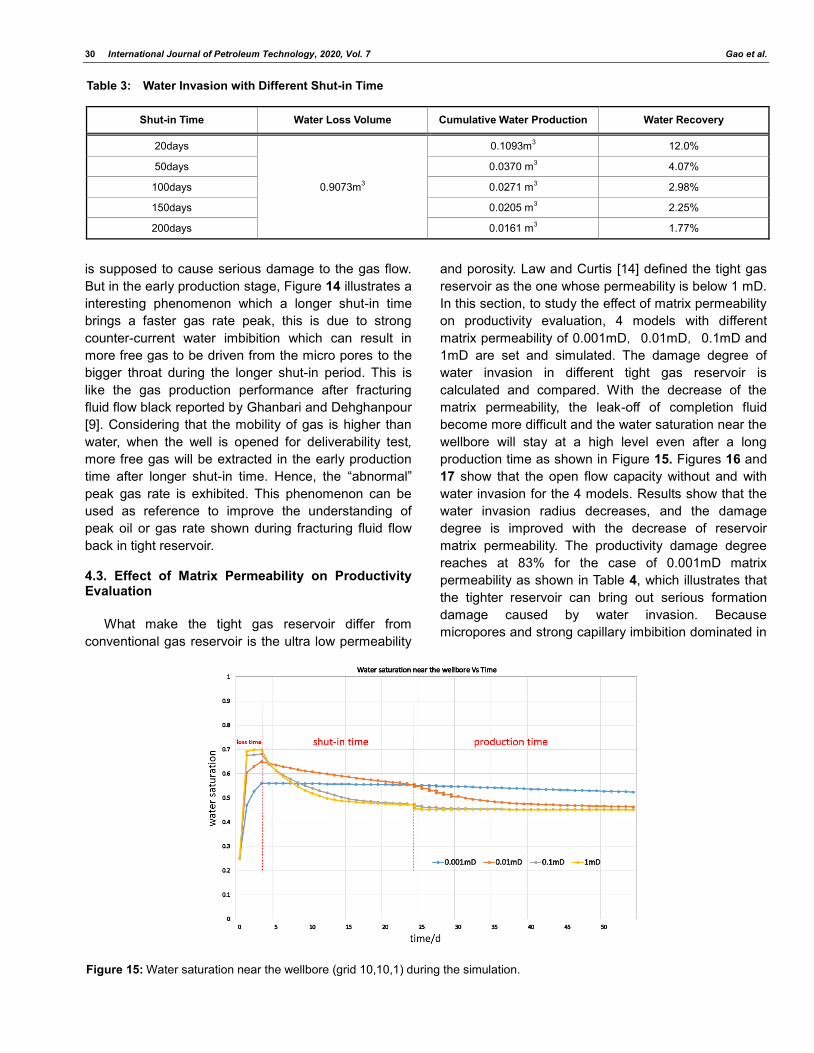
4.3. Effect of Matrix Permeability on Productivity Evaluation
What make the tight gas reservoir differ from
conventional gas reservoir is the ultra low permeability
and porosity. Law and Curtis [14] defined the tight gas
reservoir as the one whose permeability is below 1 mD.
In this section, to study the effect of matrix permeability
on productivity evaluation, 4 models with different
matrix permeability of 0.001mD, 0.01mD, 0.1mD and
1mD are set and simulated. The damage degree of
water invasion in different tight gas reservoir is
calculated and compared. With the decrease of the
matrix permeability, the leak-off of completion fluid
become more difficult and the water saturation near the
wellbore will stay at a high level even after a long
production time as shown in Figure 15. Figures 16 and
17 show that the open flow capacity without and with
water invasion for the 4 models. Results show that the
water invasion radius decreases, and the damage
degree is improved with the decrease of reservoir
matrix permeability. The productivity damage degree
reaches at 83% for the case of 0.001mD matrix
permeability as shown in Table 4, which illustrates that
the tighter reservoir can bring out serious formation
damage caused by water invasion. Because
micropores and strong capillary imbibition dominated in
Table 3: Water Invasion with Different Shut-in Time
Shut-in Time Water Loss Volume Cumulative Water Production Water Recovery
20days
0.9073m3
0.1093m3 12.0%
50days 0.0370 m3 4.07%
100days 0.0271 m3 2.98%
150days 0.0205 m3 2.25%
200days 0.0161 m3 1.77%
Figure 15: Water saturation near the wellbore (grid 10,10,1) during the simulation.

The Effect of Well Completion Fluid Loss on Productivity Evaluation International Journal of Petroleum Technology, 2020, Vol. 7 31
the ultra-low permeability reservoir and it is difficult to
drive the retention water out from the trap zone even
with large pressure drop.
5. CONCLUSIONS
- Well completion fluid loss is unavoidable during
well drilling and completion in tight sand reservoir,
which can cause water blocking and other potential
damage. Hence, the deliverability test is often
inaccurate, and it will mislead the resource assess-
ment and productivity evaluation. Reservoir simula-
tion is a useful tool to rectify the evaluation result.
- For the target exploration well X in East China Sea,
the simulation result shows that the absolute open-
flow capacity with no fluid loss is about three times
as the case with fluid loss. The inaccurate deliver-
ability test could make us take wrong development
strategies.
Figure 16: The open flow capacity without water invasion.
Figure 17: The open flow capacity with water invasion.

32 International Journal of Petroleum Technology, 2020, Vol. 7 Gao et al.
- The positive pressure in wellbore depends on well
completion fluid density, which can affect the
invasion of water through the wellbore pressure it
offers. Underbalanced drilling might help to reduce
the water blocking. However, due to the strong
capillary suction in the formations and weak mud
cake, the water will invade the near wellbore zone
even in the underbalanced drilling if the negative
pressure is not high enough to overcome the
capillary imbibition. However, balanced drilling and
overbalanced drilling can aggravate the invasion
depth, resulting in more serious damage to the
productivity. While the positive pressure is no more
the influence factor for the gas production when it
exceeds a critical value
- Longer shut-in time means longer loss fluid
diffusion, larger invasion range, and further water
invasion near the wellbore. The retention water will
impede gas flow and reduce the productivity, but in
the early time of production, the gas rate will
quickly reach the peak value with longer shut-in
time. Because the longer shut-in time means more
gas in the micro pores can be driven into the bigger
throat through capillary imbibitions during water
invasion. This phenomenon can be used as
reference to improve the understanding of peak oil
or gas rate shown during fracturing fluid flow back
in tight reservoir.
- With the decrease of matrix permeability in tight
gas reservoir, the water invasion radius decreases,
and the productivity damage becomes more
serious. The productivity damage degree can reach
at 83% for the case of 0.001mD matrix perme-
ability. Ultralow permeability and porosity mean
more micro pores and strong capillary imbibition,
once the fluid loss occurred, the water is easily to
be imbibed into the pores and difficulty to be clean
up.
REFERENCES
[1] Bahrami H, Reza Rezaee M, Nazhat D, et al. Effect of Water Blocking Damage on Flow Efficiency and Productivity in Tight Gas Reservoirs. SPE Production and Operations Sympo- sium, Oklahoma City, Oklahoma, 2011; 27–29 March.
https://doi.org/10.2118/142283-MS
[2] Keelan DK, Koepf EH. The role of cores and core analysis in evaluation of formation damage. J Petrol Technol. 1977; 29(05): 482-490.
https://doi.org/10.2118/5696-PA
[3] Holditch SA., Factors affecting water blocking and gas flow from hydraulically fractured gas wells. J Petrol Technol. 1979; 31(12): 1,515-1,524.
https://doi.org/10.2118/7561-PA
[4] Bennion DB, Thomas FB, Bietz RF. Low permeability gas reservoirs: problems, opportunities and solutions for drilling, completion, stimulation and production. SPE Gas Technology Symposium. 1996.
https://doi.org/10.2118/35577-MS
Zhou XP, Sun L, Cheng CG. Study on water blocking of low permeability gas reservoir. Special Oil & Gas Reservoirs, 2005; 12(5): 52-54. (In Chinese).
[5] Wills HA, Miskimins JL, Kazemi H. Coupled 3D Numerical Investigation of Hydraulic Fracture Cleanup for Both Slickwater and Gelled Fluids. SPE Annual Technical Conference and Exhibition. 2009.
https://doi.org/10.2118/124327-MS
[6] Tsar M, Bahrami H, Rezaee R., et al. Effect of drilling fluid (water-based vs oil-based) on phase trap damage in tight sand gas reservoirs.SPE Europec/EAGE Annual Conference. 2012.
https://doi.org/10.2118/154652-MS
[7] Bahrami H, Rezaee R, Clennell B. Water blocking damage in hydraulically fractured tight sand gas reservoirs: An example from Perth Basin, Western Australia. J of Petrol Sci Eng. 2012; 88: 100-106.
https://doi.org/10.1016/j.petrol.2012.04.002
[8] Ghanbari E, Dehghanpour H. The fate of fracturing water: A field and simulation study. Fuel 2015; 163: 282-294.
https://doi.org/10.1016/j.fuel.2015.09.040
[9] Ward JS, Morrow NR. Capillary pressures and gas relative permeabilities of low-permeability sandstone. SPE Format Evaluat. 1987; 2(03): 345-356.
https://doi.org/10.2118/13882-PA
[10] Fairhurst DL, Indriati S, Reynolds BW, et al. Advanced technology completion strategies for marginal tight gas sand reservoirs: a production optimization case study in South Texas. SPE Annual Technical Conference and Exhibition. 2007.
https://doi.org/10.2118/109863-MS
Table 4: Different Damage Degree of Different Permeability
Permeability
(mD)
Density of Completion Fluid
(g/cm3)
Invasion Radius
(m)
Productivity without Water Invasion
(m3/d)
Productivity with Water Invasion
(m3/d)
Damage
degree(%)
0.001 1.35 0.2 1212.32 208.747 83
0.01 1.35 0.5 11769.5 3861.18 68
0.1 1.35 1.8 106595 43243.4 60
1 1.35 3.5 511700 319519 38

The Effect of Well Completion Fluid Loss on Productivity Evaluation International Journal of Petroleum Technology, 2020, Vol. 7 33
[11] Wells JD, Amaefule JO., Capillary pressure and permeability relationships in tight gas sands. SPE/DOE Low Permeability Gas Reservoirs Symposium. 1985.
https://doi.org/10.2118/13879-MS
[12] Bahrami N. Evaluating factors controlling damage and productivity in tight gas reservoirs. Springer Science & Business Media. 2013; 24-26.
https://doi.org/10.1007/978-3-319-02481-3
[13] Law BE, Curtis JB. Introduction to unconventional petroleum systems. AAPG Bullet. 2002; 86(11): 1851-1852.
https://doi.org/10.1306/61EEDDA0-173E-11D7-8645000102C1865D
Received on 11-05-2020 Accepted on 29-06-2020 Published on 09-12-2020
DOI: https://doi.org/10.15377/2409-787X.2020.07.3
© 2020 Gao et al.; Avanti Publishers. This is an open access article licensed under the terms of the Creative Commons Attribution Non-Commercial License (http://creativecommons.org/licenses/by-nc/3.0/) which permits unrestricted, non-commercial use, distribution and reproduction in any medium, provided the work is properly cited.


![What the Frack?...Hydraulic Fracturing Fluid ( Frac Fluid): Associated Press. (2011, June 20). [Graphic frac fluid]. Texas becomes first state to require frac fluid disclosure](https://img.dokumen.tips/doc/110x75/60bb9d1e474a5212830aa9cb/what-the-frack-hydraulic-fracturing-fluid-frac-fluid-associated-press.jpg)