Embed Size (px)
Citation preview

2018
ABSTRACTSINFORMATICS(1627-1673)
LI LABORATORY INVESTIGATIONTHE BASIC AND TRANSLATIONAL PATHOLOGY RESEARCH JOURNAL
VOLUME 98 | SUPPLEMENT 1 | MARCH 2018
ANNUAL MEETING107TH
GEAREDLEARNTO
MARCH 17-23, 2018 Vancouver Convention CentreVancouver, BC, Canada
ABSTRACTS2018 PLATFORM & POSTER PRESENTATIONS
EDUCATION COMMITTEE
ABSTRACT REVIEW BOARD
Jason L. Hornick, Chair Rhonda Yantiss, Chair, Abstract Review Board
and Assignment CommitteeLaura W. Lamps, Chair, CME Subcommittee
Steven D. Billings, Chair, Interactive MicroscopyShree G. Sharma, Chair, Informatics Subcommittee
Raja R. Seethala, Short Course CoordinatorIlan Weinreb, Chair, Subcommittee for
Unique Live Course Offerings David B. Kaminsky, Executive Vice President
(Ex-Officio)Aleodor (Doru) Andea
Zubair BalochOlca Basturk
Gregory R. Bean, Pathologist-in-TrainingDaniel J. Brat
Amy ChadburnAshley M. Cimino-Mathews
James R. CookCarol F. Farver
Meera R. HameedMichelle S. Hirsch
Anna Marie MulliganRish Pai
Vinita ParkashAnil ParwaniDeepa Patil
Lakshmi Priya KunjuJohn D. Reith
Raja R. SeethalaKwun Wah Wen, Pathologist-in-Training
Narasimhan AgaramChristina Arnold
Dan BerneyRitu Bhalla
Parul BhargavaJustin BishopJennifer BlackThomas Brenn
Fadi BrimoNatalia BuzaYingbei Chen
Benjamin ChenRebecca Chernock
Andres Chiesa-VotteroJames ConnerClaudiu CottaTim D’AlfonsoLeona DoyleDaniel Dye
Andrew EvansAlton Farris
Dennis FirchauAnn Folkins
Karen FritchieKaruna GargJames Gill
Anthony GillRyan Gill
Tamara GiorgadzeRaul Gonzalez
Anuradha GopalanJennifer Gordetsky
Ilyssa GordonAlejandro Gru
Mamta GuptaOmar HabeebMarc Halushka
Krisztina HanleyDouglas Hartman
Yael HeherWalter Henricks
John HigginsJason Hornick
Mojgan HosseiniDavid Hwang
Michael IdowuPeter Illei
Kristin JensenVickie JoKirk Jones
Chia-Sui KaoAshraf KhanMichael Kluk
Kristine KonopkaGregor Krings
Asangi KumarapeliFrank Kuo
Alvaro LagaRobin LeGallo
Melinda LerwillRebecca Levy
Zaibo LiYen-Chun LiuTamara Lotan
Joe MaleszewskiAdrian Marino-Enriquez
Jonathan MarottiJerri McLemore
David MeredithDylan Miller
Roberto MirandaElizabeth Morgan
Juan-Miguel MosqueraAtis Muehlenbachs
Raouf NakhlehEricka Olgaard
Horatiu OlteanuKay Park
Rajiv PatelYan Peng
David PisapiaJenny Pogoriler
Alexi PolydoridesSonam PrakashManju Prasad
Bobbi PrittPeter Pytel
Charles QuickJoseph Rabban
Raga RamachandranPreetha Ramalingam
Priya RaoVijaya ReddyRobyn Reed
Michelle ReidNatasha Rekhtman
Michael RiveraMike Roh
Marianna RuzinovaPeter SadowSafia Salaria
Steven Salvatore
Souzan SanatiSandro Santagata
Anjali SaqiFrank SchneiderMichael Seidman
Shree SharmaJeanne ShenSteven Shen
Jiaqi ShiWun-Ju Shieh
Konstantin ShiloSteven SmithLauren SmithAliyah Sohani
Heather Stevenson-LernerKhin ThwayEvi Vakiani
Sonal VarmaMarina ViveroYihong Wang
Christopher WeberOlga WeinbergAstrid Weins
Maria WesterhoffSean Williamson
Laura WoodWei Xin
Mina XuRhonda YantissAkihiko YoshidaXuefeng ZhangDebra Zynger
To cite abstracts in this publication, please use the following format: Author A, Author B, Author C, et al. Abstract title (abs#). Laboratory Investigation 2018; 98 (suppl 1): page#
USCAP ABSTRACTSGEARED LEARNTO107TH ANNUAL MEETING 583
INFORMATICS
1627 Head-Tracking as an Interface Device for Image Manipulation in Digital Pathology: A Comparative Study
Eduardo Alcaraz-Mateos1, Iva Turic2, Andres Nieto-Olivares3, Miguel Perez-Ramos3, Ignacio Martinez Gonzalez-Moro4, Enrique Poblet5. 1Hospital Universitario Morales Meseguer, Murcia, 2University of Split Croatia, 3Morales Meseguer University Hospital, Murcia, Spain, 4University of Murcia, Spain, 5Reina Sofía University Hospital, Murcia, University of Murcia, Spain
Background: Inasmuch as the conventional mouse is not an ideal input device for digital pathology, the aim of this study was to evaluate alternative systems, with the goal of identifying a natural user interface (NUI) for controlling whole slide images (WSI). As such, 3 Head-tracking webcam-based programs were compared.
Design: Four experienced pathologists evaluated three head-tracking systems: Enable Viacam (eViacam, CREA Software), Nouse (JLG Health Solutions Inc), and Camera Mouse (CM Solutions Inc). Twenty WSI of different dermatopathology cases selected at random from a general pool of average difficulty cases were examined with Image Viewer (Ventana, AZ, USA). The NASA Task Load Index was used to rate the perceived workload while using these systems to reach a diagnosis as time was recorded. In addition, a 5-point scale Likert satisfaction survey was used.
Results: The mean total time needed for diagnosis with Camera Mouse, eViacam, and Nouse systems was 18’57”, 19’37” and 24’48”, respectively (56, 58 and 67 seconds per case, respectively). The NASA-TLX weighted average workload score, where lower scores are better, was 49.7 for eViacam, 54.3 for Nouse and 68.2 for Camera Mouse, which correlated with the pathologists’ degree of satisfaction on a Likert scale of 1-5: 3.4 for eViacam, 2.8 for Nouse, and 2.4 for Camera Mouse. The NASA-TLX score estimated the physical and mental demand scales as the maximum and minimum scores among the 6 subscales (figure 1).
Conclusions: - Head-tracking systems enable pathologists to control the computer cursor and virtual slides hands-free, using only a webcam as an input device while moving the head.
- Among the three systems, eViacam seems to be the best software evaluated in this study, followed by Nouse and, finally, Camera Mouse.
- Head-tracking webcam-based software can be used not only by pathologists with physical impairments but also by health care professionals who seek to avoid musculoskeletal disorders or have some sort of difficulty when using a conventional mouse.
- Further studies, integrating speech recognition systems, should be performed in conjunction with software developments to achieve the ideal device for digital pathology.
1628 A Future for “BitBiopsy” and “CryptoSpecimen”? Proposed Use Cases of Blockchain Technology in Anatomical and Clinical Pathology
Alaa Alsadi1, Roger Boodoo2, Justin Taylor3, Monique Diaz, Manmeet Singh4, Tushar Patel5. 1University of Illinois in Chicago, Chicago, IL, 2University of Illinois in Chicago, 3Walter Reed National Military Medical Center, Bethesda, MD, 4University of Illinois at Chicago, Chicago, IL, 5University of Illinois at Chicago
Background: Blockchain is a distributed database using computer codes that automatically execute a rule (smart contract) as a solution for replacing intermediaries. Bitcoin is an example which bypasses the need for a bank to achieve transparent transactions. Industrial applications are asset tracking, authentication, and the Internet of Things (IOT).
Design: We reviewed commercially available Blockchain systems (IBM, Microsoft), emerging platforms (GemOS), and published literature on Blockchain within healthcare. Taking into account the limits and power of Blockchain, we proposed innovative pathology
applications through the following use cases.
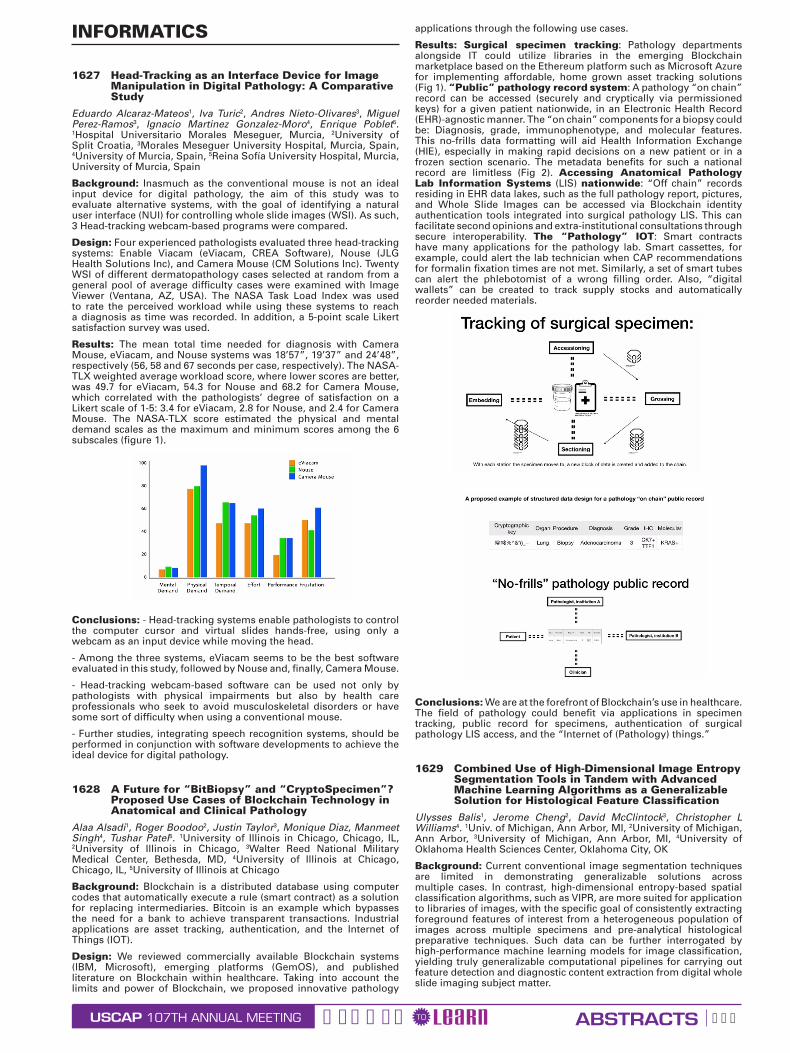
Results: Surgical specimen tracking: Pathology departments alongside IT could utilize libraries in the emerging Blockchain marketplace based on the Ethereum platform such as Microsoft Azure for implementing affordable, home grown asset tracking solutions (Fig 1). “Public” pathology record system: A pathology “on chain” record can be accessed (securely and cryptically via permissioned keys) for a given patient nationwide, in an Electronic Health Record (EHR)-agnostic manner. The “on chain” components for a biopsy could be: Diagnosis, grade, immunophenotype, and molecular features. This no-frills data formatting will aid Health Information Exchange (HIE), especially in making rapid decisions on a new patient or in a frozen section scenario. The metadata benefits for such a national record are limitless (Fig 2). Accessing Anatomical Pathology Lab Information Systems (LIS) nationwide: “Off chain” records residing in EHR data lakes, such as the full pathology report, pictures, and Whole Slide Images can be accessed via Blockchain identity authentication tools integrated into surgical pathology LIS. This can facilitate second opinions and extra-institutional consultations through secure interoperability. The “Pathology” IOT: Smart contracts have many applications for the pathology lab. Smart cassettes, for example, could alert the lab technician when CAP recommendations for formalin fixation times are not met. Similarly, a set of smart tubes can alert the phlebotomist of a wrong filling order. Also, “digital wallets” can be created to track supply stocks and automatically reorder needed materials.
Conclusions: We are at the forefront of Blockchain’s use in healthcare. The field of pathology could benefit via applications in specimen tracking, public record for specimens, authentication of surgical pathology LIS access, and the “Internet of (Pathology) things.”
1629 Combined Use of High-Dimensional Image Entropy Segmentation Tools in Tandem with Advanced Machine Learning Algorithms as a Generalizable Solution for Histological Feature Classification
Ulysses Balis1, Jerome Cheng2, David McClintock3, Christopher L Williams4. 1Univ. of Michigan, Ann Arbor, MI, 2University of Michigan, Ann Arbor, 3University of Michigan, Ann Arbor, MI, 4University of Oklahoma Health Sciences Center, Oklahoma City, OK
Background: Current conventional image segmentation techniques are limited in demonstrating generalizable solutions across multiple cases. In contrast, high-dimensional entropy-based spatial classification algorithms, such as VIPR, are more suited for application to libraries of images, with the specific goal of consistently extracting foreground features of interest from a heterogeneous population of images across multiple specimens and pre-analytical histological preparative techniques. Such data can be further interrogated by high-performance machine learning models for image classification, yielding truly generalizable computational pipelines for carrying out feature detection and diagnostic content extraction from digital whole slide imaging subject matter.
USCAP ABSTRACTSGEARED LEARNTO107TH ANNUAL MEETING 584
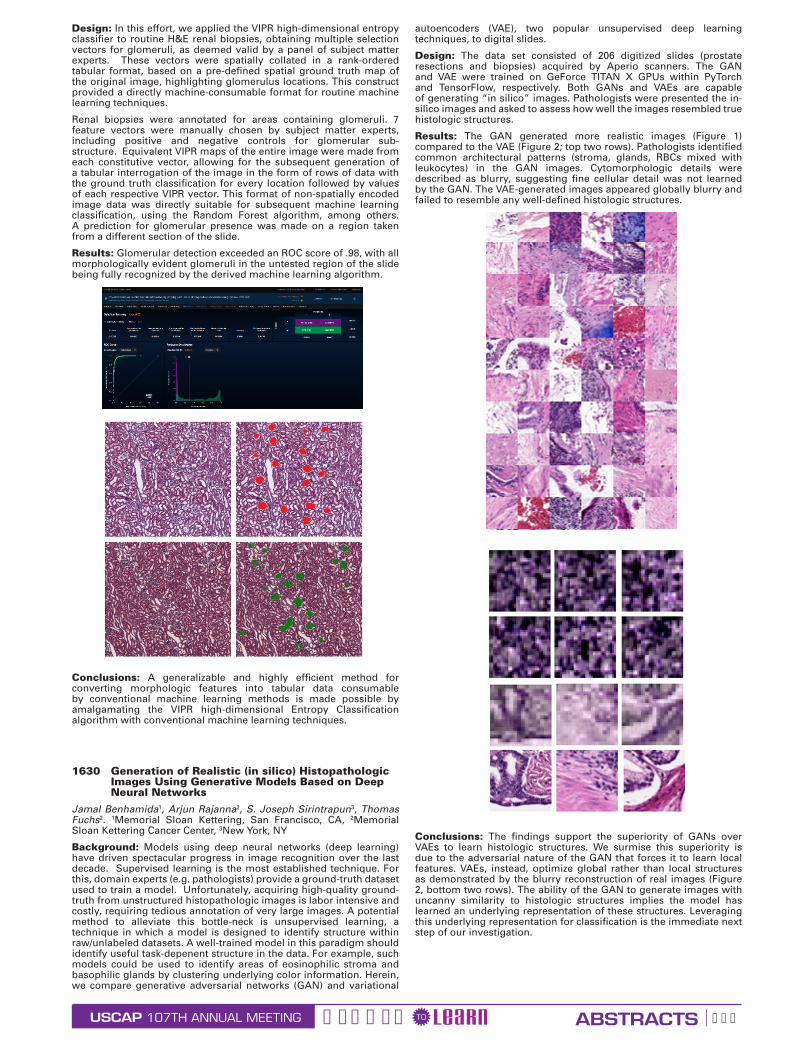
Design: In this effort, we applied the VIPR high-dimensional entropy classifier to routine H&E renal biopsies, obtaining multiple selection vectors for glomeruli, as deemed valid by a panel of subject matter experts. These vectors were spatially collated in a rank-ordered tabular format, based on a pre-defined spatial ground truth map of the original image, highlighting glomerulus locations. This construct provided a directly machine-consumable format for routine machine learning techniques.
Renal biopsies were annotated for areas containing glomeruli. 7 feature vectors were manually chosen by subject matter experts, including positive and negative controls for glomerular sub-structure. Equivalent VIPR maps of the entire image were made from each constitutive vector, allowing for the subsequent generation of a tabular interrogation of the image in the form of rows of data with the ground truth classification for every location followed by values of each respective VIPR vector. This format of non-spatially encoded image data was directly suitable for subsequent machine learning classification, using the Random Forest algorithm, among others. A prediction for glomerular presence was made on a region taken from a different section of the slide.
Results: Glomerular detection exceeded an ROC score of .98, with all morphologically evident glomeruli in the untested region of the slide being fully recognized by the derived machine learning algorithm.
Conclusions: A generalizable and highly efficient method for converting morphologic features into tabular data consumable by conventional machine learning methods is made possible by amalgamating the VIPR high-dimensional Entropy Classification algorithm with conventional machine learning techniques.
1630 Generation of Realistic (in silico) Histopathologic Images Using Generative Models Based on Deep Neural Networks
Jamal Benhamida1, Arjun Rajanna2, S. Joseph Sirintrapun3, Thomas Fuchs2. 1Memorial Sloan Kettering, San Francisco, CA, 2Memorial Sloan Kettering Cancer Center, 3New York, NY
Background: Models using deep neural networks (deep learning) have driven spectacular progress in image recognition over the last decade. Supervised learning is the most established technique. For this, domain experts (e.g. pathologists) provide a ground-truth dataset used to train a model. Unfortunately, acquiring high-quality ground-truth from unstructured histopathologic images is labor intensive and costly, requiring tedious annotation of very large images. A potential method to alleviate this bottle-neck is unsupervised learning, a technique in which a model is designed to identify structure within raw/unlabeled datasets. A well-trained model in this paradigm should identify useful task-depenent structure in the data. For example, such models could be used to identify areas of eosinophilic stroma and basophilic glands by clustering underlying color information. Herein, we compare generative adversarial networks (GAN) and variational
autoencoders (VAE), two popular unsupervised deep learning techniques, to digital slides.
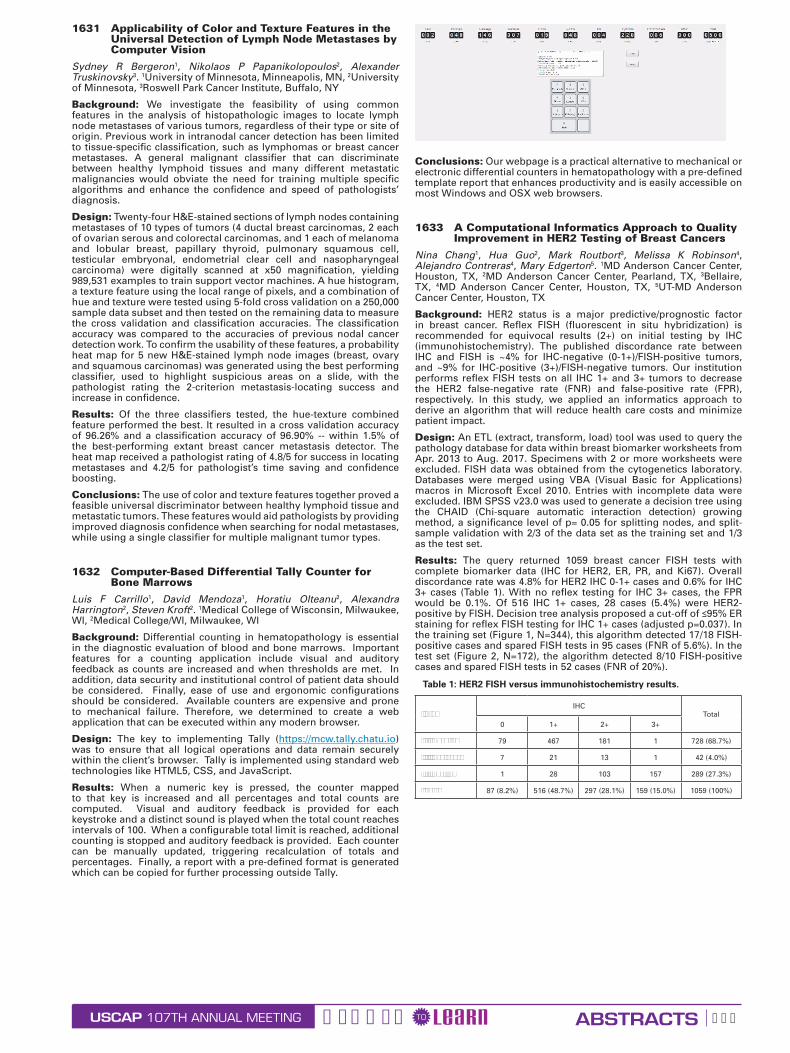
Design: The data set consisted of 206 digitized slides (prostate resections and biopsies) acquired by Aperio scanners. The GAN and VAE were trained on GeForce TITAN X GPUs within PyTorch and TensorFlow, respectively. Both GANs and VAEs are capable of generating “in silico” images. Pathologists were presented the in-silico images and asked to assess how well the images resembled true histologic structures.
Results: The GAN generated more realistic images (Figure 1) compared to the VAE (Figure 2; top two rows). Pathologists identified common architectural patterns (stroma, glands, RBCs mixed with leukocytes) in the GAN images. Cytomorphologic details were described as blurry, suggesting fine cellular detail was not learned by the GAN. The VAE-generated images appeared globally blurry and failed to resemble any well-defined histologic structures.
Conclusions: The findings support the superiority of GANs over VAEs to learn histologic structures. We surmise this superiority is due to the adversarial nature of the GAN that forces it to learn local features. VAEs, instead, optimize global rather than local structures as demonstrated by the blurry reconstruction of real images (Figure 2, bottom two rows). The ability of the GAN to generate images with uncanny similarity to histologic structures implies the model has learned an underlying representation of these structures. Leveraging this underlying representation for classification is the immediate next step of our investigation.
USCAP ABSTRACTSGEARED LEARNTO107TH ANNUAL MEETING 585
1631 Applicability of Color and Texture Features in the Universal Detection of Lymph Node Metastases by Computer Vision
Sydney R Bergeron1, Nikolaos P Papanikolopoulos2, Alexander Truskinovsky3. 1University of Minnesota, Minneapolis, MN, 2University of Minnesota, 3Roswell Park Cancer Institute, Buffalo, NY
Background: We investigate the feasibility of using common features in the analysis of histopathologic images to locate lymph node metastases of various tumors, regardless of their type or site of origin. Previous work in intranodal cancer detection has been limited to tissue-specific classification, such as lymphomas or breast cancer metastases. A general malignant classifier that can discriminate between healthy lymphoid tissues and many different metastatic malignancies would obviate the need for training multiple specific algorithms and enhance the confidence and speed of pathologists’ diagnosis.
Design: Twenty-four H&E-stained sections of lymph nodes containing metastases of 10 types of tumors (4 ductal breast carcinomas, 2 each of ovarian serous and colorectal carcinomas, and 1 each of melanoma and lobular breast, papillary thyroid, pulmonary squamous cell, testicular embryonal, endometrial clear cell and nasopharyngeal carcinoma) were digitally scanned at x50 magnification, yielding 989,531 examples to train support vector machines. A hue histogram, a texture feature using the local range of pixels, and a combination of hue and texture were tested using 5-fold cross validation on a 250,000 sample data subset and then tested on the remaining data to measure the cross validation and classification accuracies. The classification accuracy was compared to the accuracies of previous nodal cancer detection work. To confirm the usability of these features, a probability heat map for 5 new H&E-stained lymph node images (breast, ovary and squamous carcinomas) was generated using the best performing classifier, used to highlight suspicious areas on a slide, with the pathologist rating the 2-criterion metastasis-locating success and increase in confidence.
Results: Of the three classifiers tested, the hue-texture combined feature performed the best. It resulted in a cross validation accuracy of 96.26% and a classification accuracy of 96.90% -- within 1.5% of the best-performing extant breast cancer metastasis detector. The heat map received a pathologist rating of 4.8/5 for success in locating metastases and 4.2/5 for pathologist’s time saving and confidence boosting.
Conclusions: The use of color and texture features together proved a feasible universal discriminator between healthy lymphoid tissue and metastatic tumors. These features would aid pathologists by providing improved diagnosis confidence when searching for nodal metastases, while using a single classifier for multiple malignant tumor types.
1632 Computer-Based Differential Tally Counter for Bone Marrows
Luis F Carrillo1, David Mendoza1, Horatiu Olteanu2, Alexandra Harrington2, Steven Kroft2. 1Medical College of Wisconsin, Milwaukee, WI, 2Medical College/WI, Milwaukee, WI
Background: Differential counting in hematopathology is essential in the diagnostic evaluation of blood and bone marrows. Important features for a counting application include visual and auditory feedback as counts are increased and when thresholds are met. In addition, data security and institutional control of patient data should be considered. Finally, ease of use and ergonomic configurations should be considered. Available counters are expensive and prone to mechanical failure. Therefore, we determined to create a web application that can be executed within any modern browser.
Design: The key to implementing Tally (https://mcw.tally.chatu.io) was to ensure that all logical operations and data remain securely within the client’s browser. Tally is implemented using standard web technologies like HTML5, CSS, and JavaScript.
Results: When a numeric key is pressed, the counter mapped to that key is increased and all percentages and total counts are computed. Visual and auditory feedback is provided for each keystroke and a distinct sound is played when the total count reaches intervals of 100. When a configurable total limit is reached, additional counting is stopped and auditory feedback is provided. Each counter can be manually updated, triggering recalculation of totals and percentages. Finally, a report with a pre-defined format is generated which can be copied for further processing outside Tally.
Conclusions: Our webpage is a practical alternative to mechanical or electronic differential counters in hematopathology with a pre-defined template report that enhances productivity and is easily accessible on most Windows and OSX web browsers.
1633 A Computational Informatics Approach to Quality Improvement in HER2 Testing of Breast Cancers
Nina Chang1, Hua Guo2, Mark Routbort3, Melissa K Robinson4, Alejandro Contreras4, Mary Edgerton5. 1MD Anderson Cancer Center, Houston, TX, 2MD Anderson Cancer Center, Pearland, TX, 3Bellaire, TX, 4MD Anderson Cancer Center, Houston, TX, 5UT-MD Anderson Cancer Center, Houston, TX
Background: HER2 status is a major predictive/prognostic factor in breast cancer. Reflex FISH (fluorescent in situ hybridization) is recommended for equivocal results (2+) on initial testing by IHC (immunohistochemistry). The published discordance rate between IHC and FISH is ~4% for IHC-negative (0-1+)/FISH-positive tumors, and ~9% for IHC-positive (3+)/FISH-negative tumors. Our institution performs reflex FISH tests on all IHC 1+ and 3+ tumors to decrease the HER2 false-negative rate (FNR) and false-positive rate (FPR), respectively. In this study, we applied an informatics approach to derive an algorithm that will reduce health care costs and minimize patient impact.
Design: An ETL (extract, transform, load) tool was used to query the pathology database for data within breast biomarker worksheets from Apr. 2013 to Aug. 2017. Specimens with 2 or more worksheets were excluded. FISH data was obtained from the cytogenetics laboratory. Databases were merged using VBA (Visual Basic for Applications) macros in Microsoft Excel 2010. Entries with incomplete data were excluded. IBM SPSS v23.0 was used to generate a decision tree using the CHAID (Chi-square automatic interaction detection) growing method, a significance level of p= 0.05 for splitting nodes, and split-sample validation with 2/3 of the data set as the training set and 1/3 as the test set.
Results: The query returned 1059 breast cancer FISH tests with complete biomarker data (IHC for HER2, ER, PR, and Ki67). Overall discordance rate was 4.8% for HER2 IHC 0-1+ cases and 0.6% for IHC 3+ cases (Table 1). With no reflex testing for IHC 3+ cases, the FPR would be 0.1%. Of 516 IHC 1+ cases, 28 cases (5.4%) were HER2-positive by FISH. Decision tree analysis proposed a cut-off of ≤95% ER staining for reflex FISH testing for IHC 1+ cases (adjusted p=0.037). In the training set (Figure 1, N=344), this algorithm detected 17/18 FISH-positive cases and spared FISH tests in 95 cases (FNR of 5.6%). In the test set (Figure 2, N=172), the algorithm detected 8/10 FISH-positive cases and spared FISH tests in 52 cases (FNR of 20%).
Table 1: HER2 FISH versus immunohistochemistry results.
FISHIHC
Total0 1+ 2+ 3+
Negative 79 467 181 1 728 (68.7%)
Equivocal 7 21 13 1 42 (4.0%)
Positive 1 28 103 157 289 (27.3%)
Total 87 (8.2%) 516 (48.7%) 297 (28.1%) 159 (15.0%) 1059 (100%)

USCAP ABSTRACTSGEARED LEARNTO107TH ANNUAL MEETING 586
Conclusions: By discontinuing reflex FISH tests on HER2 IHC 3+ cases and using an algorithm-proposed cut-off of 95% ER staining for reflex testing on IHC 1+ cases, our institution could reduce the number of FISH tests by 30% and health care costs by ~$137,000/year over the study period ($1526 per test). HER2-overexpressed patients missed by the algorithm would be 1.2%, less than the accepted 4% discordance rate.
1634 Automatic Pathology Diagnosis on Large Slide Image Using Patch Aggregation
Pingjun Chen1, Yuanpu Xie1, Su Hai1, Lin Yang1. 1University of Florida
Background: Pathological examination is the gold standard in cancer diagnosis. However, it is time consuming to inspect all regions across slide by pathologists, whose assesments might also be subjective due to fine-grained variability between benign and malignant regions.
FISHIHC
Total0 1+ 2+ 3+
Negative 79 467 181 1 728 (68.7%)
Equivocal 7 21 13 1 42 (4.0%)
Positive 1 28 103 157 289 (27.3%)
Total 87 (8.2%)
516 (48.7%)
297 (28.1%)
159 (15.0%)
1059 (100%)
Convolutional neural network (CNN) exhibiting great success on most image analysis tasks can automatically learn feature representations from raw images for analysis. Inspired by it, we present a novel CNN framework to automatically diagnose large slide images using patch aggregation strategy.
Design: Our main procedures contain classifier learning for image patches, image patches classification and aggregating prediction results of all patches for the final diagnosis. The whole framework is shown is Fig. 1.
In the positive and negative training patch generation process, positive patches are sampled from labelled malignant regions. Circumscribed rectangle would first be extracted from each labelled contour. Positive patch samples are then randomly cropped from these circumscribed rectangles with fixed width and height. Negative patch samples are
randomly sampled from benign cases.
We utilize a popular network InceptionV3 to train patch classification model, with changing the last fully connected layer for the two-class classification task. We split test large slides into patches with the same size as training patches, and then ship them to the learned model.
With the prediction of test image patches, we count the number of positive patches on each test slide in order to obtain the prediction result of slides. The slide is regarded as a malignant one if the number of predicted positive patches larger than a pre-defined threshold; otherwise, it is considered to a benign one.
Results: We conduct experiments on a stomach cancer dataset including 700 training and 300 testing slides, 80% are malignant cases with expert annotation of malignant regions. Finally, we achieve 95.1% F1 score. It demonstrates the effectiveness of our method.
FISHIHC
Total0 1+ 2+ 3+
Negative 79 467 181 1 728 (68.7%)
Equivocal 7 21 13 1 42 (4.0%)
Positive 1 28 103 157 289 (27.3%)
Total 87 (8.2%) 516 (48.7%) 297 (28.1%) 159 (15.0%) 1059 (100%)
Conclusions: We propose a general and automatic deep learning framework for large slides diagnosis. The prediction performance can be further improved by using our aggregation strategy, with combining previous prediction results in a probability manner.
1635 Platelet Transfusion Practices in Immune Thrombocytopenic Purpura Related Hospitalizations: Results from a Nationally Representative Database; An Innovative Model for Application of Pathology Informatics
Saurav Chopra1, Aayushi Garg2, Aaron Tobian3, Paul Ness3, Melissa Cushing4, Ljiljana Vasovic5, Shipra Kaicker5, Clifford Takemoto3, Cassandra Josephson6, James Bussel5, Lakshmanan Krishnamurti6, Ruchika Goel7. 1Weill Cornell Medical College, Jagadhri, Haryana, 2All India Institute of Medical Sciences, New Delhi, India, 3Johns Hopkins University, 4New York, NY, 5Weill Cornell Medical College, 6Emory University School of Medicine, 7Weill Cornell Medical College, New York, NY
Background: Role of platelet transfusions in management of immune thrombocytopenic purpura (ITP) remains controversial. Current guidelines recommend platelet transfusions in ITP be reserved for catastrophic hemorrhage or invasive surgical procedures. This study assesses nationwide platelet transfusion practices in hospitalized children and adults with ITP.
Design: Hospitalizations with ITP as primary admitting diagnosis from 2010-2014 in National Inpatient Sample (NIS), the largest all-payer inpatient database, were studied. Univariate and multivariable logistic regression analyses were used to determine factors predicting platelet transfusions. Sampling weights were applied to generate nationally representative estimates. Propensity score matching was used to perform sensitivity analyses.
Results: Between 2010-2014, there were 78,376 admissions with ITP as primary admission diagnosis (mean±SD age: 44.6±27.1 years; females 56.1%, children 22/.1%). Overall, 27.4% admissions documented at least one platelet transfusion. On multivariable adjustment adult age(adjOR=9.03,95%CI=7.40-11.02), male gender(adjOR=1.21,95%CI=1.11-1.31), bleeding occurrence (intracranial /gastrointestinal /genitourinary /epistaxis )

USCAP ABSTRACTSGEARED LEARNTO107TH ANNUAL MEETING 587
(adjOR=1.78,95%CI=1.61-1.96), admission to rural non-teaching hospital (adjOR=1.85, 95%CI=1.52-2.22), small bed-size hospital (adjOR=1.23, 95%CI=1.05-1.45) and worsening disease severity were associated with higher odds of platelet transfusion. Of admissions reporting platelet transfusions, only 26.0% reported a bleeding complication and 10.5% had a major operating-room surgery/procedure. Overall, 65.4% of transfused patients had neither bleeding nor a major operative procedure during the hospitalization. Admissions with platelet transfusions had significantly higher mean length of hospitalization and higher total hospital charges (p<0.001). Sensitivity analysis performed using propensity score matching revealed similar results.
FOR TABLE DATA, SEE PAGE 604, FIG. 1635
Conclusions: This nationally representative database provides evidence that platelets are frequently administered in hospitalized ITP patients. In the majority of cases, usage does not appear to be concordant with the current national guidelines or associated with improvement in clinical outcomes.
This novel use of a multidimensional electronic health record-based database and pathology laboratory information system derived database lays down a model for future innovations in pathology informatics potentially applicable to both anatomic and clinical pathology fields.
1636 Molecular Biopsy of Human Malignancies, a Resource for Precision Medicine
Paul Fontelo1, Fang Liu2. 1National Library of Medicine, National Institutes of Health, Bethesda, MD, 2National Library of Medicine
Background: The goal of Precision Medicine in cancer is to tailor treatment strategies to the tumor’s molecular profile obtained through DNA sequencing, biomarkers, hormonal status, and genetic expression. For example, the success of recent immunotherapies, like anti-PD1 checkpoint inhibitors, depends greatly on the expression of its ligand PDL1 on the cancer cell’s surface. PDL1 positive tumors tend to respond better to checkpoint inhibitors. The goal of this research was to develop a tool for discovering studies that could provide the molecular characterization of tumors essential in determining the clinical outcome, diagnosis, prognosis, staging, and treatment of tumors.
Design: We created a list of more that 650 tumor markers, biomarkers and oncogenes, and 22 cancer types and 66 subtypes. An algorithm was developed to search PubMed for each of the 651 biomarkers, cancer type and subtype, biomarkers and its aliases. We limited the search to only retrieve human studies and those with abstracts. We refined the search further to include filters for clinical outcome, diagnosis, prognosis, staging, and treatment. We created a database of retrieved articles and analyzed the data to determine the top biomarkers in each cancer type. The database will grow as more biomarkers are added to the list. A free-text search for tumor types and/or biomarkers was added.
Results: The database now includes more than 1.3 million entries. Of all biomarkers on the list, TP53 or P53 is the top biomarker (52,104 entries) of all cancer types. The top 20 biomarkers list (Table 1) also includes: estrogen receptor protein, EGFR, BCL2, ERBB2 (HER2/neu), progesterone receptor protein, and PSA. The Molecular Biopsy of Human Tumors website is https://go.usa.gov/xRmHK. Screenshots of the index page (Figure 1) and results of a search for biomarkers for gastric cancer (Figure 2) are shown. The top biomarkers with the most number of journal articles retrieved are shown first. Links to articles related to clinical outcome, diagnosis, prognosis, staging, and treatment are provided. Each article has a “TBL” (“the bottom line”) summary to quickly review its contents.
Top 20 Biomarkers in All Cancers
TP53 52104
ER 31749
ESR1 30806
EGFR 26022
AKT1 24381
BCL2 24263
ERBB2 22634
NR4A3 21707
PR 21564
PSA 18196
MAPK1 16494
BCR 15655
MYC 14551
AR 13304
PIK3CA 13116
CDKN2A 12422
Ki-67 11793
CEACAM5 11696
MS4A1 11530
BRCA1 10332
FISHIHC
Total0 1+ 2+ 3+
Negative 79 467 181 1 728 (68.7%)
Equivocal 7 21 13 1 42 (4.0%)
Positive 1 28 103 157 289 (27.3%)
Total 87 (8.2%) 516 (48.7%) 297 (28.1%)
159 (15.0%)
1059 (100%)
FISHIHC
Total0 1+ 2+ 3+
Negative 79 467 181 1 728 (68.7%)
Equivocal 7 21 13 1 42 (4.0%)
Positive 1 28 103 157 289 (27.3%)
Total 87 (8.2%) 516 (48.7%) 297 (28.1%)
159 (15.0%)
1059 (100%)
USCAP ABSTRACTSGEARED LEARNTO107TH ANNUAL MEETING 588
Conclusions: We developed a tool that may be useful for researchers and clinicians in developing strategies for Precision Medicine. We will continue to analyze the data for associations and interactions among the biomarkers, oncogenes, proteins, and receptors that may be useful in determining the clinical outcome, diagnosis, prognosis, staging, and treatment of tumors.
1637 Computer-Assisted Image Analysis Offers Accurate Diagnostic Aid; Differentiating Chromophobe Renal Cell Carcinoma from Renal Oncocytoma
Mohammad Haeri1, Neda Zarrin-Khameh1, Deborah Citron1, Christie J Finch2, Thomas Wheeler1. 1Baylor College of Medicine, Houston, TX, 2Baylor College of Medicine
Background: Renal cell carcinoma (RCC) is the most common malignant renal neoplasm. Chromophobe RCC (chRCC) subtype constitutes about 5% of all RCCs. A well-known mimicker of chRCC, renal oncocytoma (RO), accounts for up to 7% of all adult renal tumors. Proper differentiation between chRCC and benign RO is still a challenge, as they have similar histomorphological features possibly because they originate from the same cell; intercalated cells of the collecting ducts. There is still no reliable molecular method for accurate differentiation and a recent article suggested a combination of 10 biomarkers to help discriminating the two entities (Ng et al., J Clin Pathol. 2016 Aug;69(8):661-71. doi: 10.1136). Computer assisted diagnosis have shown promising results in breast and lung cancer diagnosis. We utilized similar approach to assist differentiation of malignant chRCC and RO, which have different clinical management.
Design: We reviewed all cases with diagnoses of chRCC and RO in our institution between 2001 and 2016. Multiple images from different foci of each tumor were captured and analyzed by image processing software performing nuclear segmentation followed by detecting nearest-neighbor, nuclear shape/size and nuclear densities/area algorithms. Overall score for each was calculated, analyzed and compared.
FISHIHC
Total0 1+ 2+ 3+
Negative 79 467 181 1 728 (68.7%)
Equivocal 7 21 13 1 42 (4.0%)
Positive 1 28 103 157 289 (27.3%)
Total 87 (8.2%) 516 (48.7%) 297 (28.1%) 159 (15.0%) 1059 (100%)
FISHIHC
Total0 1+ 2+ 3+
Negative 79 467 181 1 728 (68.7%)
Equivocal 7 21 13 1 42 (4.0%)
Positive 1 28 103 157 289 (27.3%)
Total 87 (8.2%) 516 (48.7%) 297 (28.1%) 159 (15.0%) 1059 (100%)
FISHIHC
Total0 1+ 2+ 3+
Negative 79 467 181 1 728 (68.7%)
Equivocal 7 21 13 1 42 (4.0%)
Positive 1 28 103 157 289 (27.3%)
Total 87 (8.2%) 516 (48.7%) 297 (28.1%) 159 (15.0%) 1059 (100%)
Results: The nuclear segmentation step approached 94% accuracy for both chRCC and RO using binary mode or Fourier transform/band pass filter setting. Cell boundaries detection showed similar results. A scoring system utilizing a combination of nearest-neighbor, nuclear shape/size and nuclear densities/area was also used and showed 93% accuracy in differentiation between chRCC and RO in well-fixed/prepared section. On the other hand, the diagnostic accuracy was reduced when the image contained normal renal tissue adjacent to the tumor.
FISHIHC
Total0 1+ 2+ 3+
Negative 79 467 181 1 728 (68.7%)
Equivocal 7 21 13 1 42 (4.0%)
Positive 1 28 103 157 289 (27.3%)
Total 87 (8.2%) 516 (48.7%) 297 (28.1%) 159 (15.0%) 1059 (100%)
Conclusions: Computer assisted diagnosis can be used as an ancillary tool to diagnose chromophobe RCC and RO and to reduce the cost of immunohistochemical stains. Our current image processing algorithm has managed to differentiate chRCC and RO with high accuracy in well-fixed/prepared sections. Adoption of additional nuclear/cellular features to modify this algorithm will improve the specificity of this method. To our knowledge this is the first report of utilizing image processing algorithm to differentiate between the two entities.
1638 Implementation of Digital Pathology Offers Clinical and Operational Increase in Efficiency and Cost Savings
Matthew G Hanna1, Victor Reuter1, Jennifer Samboy1, Christine England2, Lorraine Corsale2, Samson W Fine1, Narasimhan Agaram3, Evangelos Stamelos1, Meera Hameed4, David Klimstra5, S. Joseph Sirintrapun6. 1Memorial Sloan Kettering Cancer Center, New York, NY, 2Memorial Sloan Kettering Cancer Center, 3Memorial Sloan Kettering CC, New York, NY, 4Memorial Sloan-Kettering CC, New York, NY, 5Memorial Sloan-Kettering, New York, NY, 6New York, NY
Background: Digital pathology (DP) has had relatively slow adoption despite tremendous potential. The few institutions leveraging DP encounter high overhead while few published studies justify return on investment (ROI) with meaningful metrics. This study aims to establish practical DP metrics and benchmark data that demonstrates clinical and operational utility of DP in a large anatomic pathology laboratory.
Design: Retrospective whole slide scanning was initiated for consultations (8/2015), biopsies (1/2016), and surgical resections (2/2017). Requisition forms were tabulated to identify the total number of cases, slides, and blocks requested from the slide archive over time. Intraoperative consultations request for prior pathology material in an off-campus surgery center were recorded starting January 2016. Documented review of prior whole slide images (WSI) from the laboratory information system was queried to evaluate whether ancillary tests were ordered. Offsite physical pathology asset storage costs were comparatively calculated from 2015. Turnaround time (TAT) was analyzed for cases with and without patients’ prior WSI. A digital pathology experience survey was distributed within our department.
Results: As of August 2017, a total of 317,539 slides were scanned. Archival glass slide requisitions had a 94% decrease in requests (12,336 vs 696 average per year). Intraoperative consultation requests for prior archived pathology material showed an average 67% decrease due to remote access to WSI. Pathologist clinical case review of prior pathology has shown 1714 documented comparisons to prior material since 2015. Pathologists ordered less ancillary studies by up to 62% when WSI were available. Given an average cost of $50 per immunohistochemical slide (IHC); an anticipated savings of $10,341 if only one IHC was ordered per case, per year. Slide storage costs projected savings of $274,000/year secondary to decreased vendor services (i.e. asset retrieval, storage proximity, labor). Review of average TAT from 59,571 surgical cases showed those with prior WSI were reported 25% sooner (1 day). Digital pathology experience survey results from 71 respondents were recorded.
Figure 1. a, Intradepartmental glass slide requests compared to digital slide availability; b, Review of prior digital pathology for clinical cases shows reduced ancillary testing; c, Offsite physical storage expenses with decreased vendor services for pathology assets; d, Decrease in intraoperative consultation slide requests at off-campus surgery center
USCAP ABSTRACTSGEARED LEARNTO107TH ANNUAL MEETING 589
Figure 2. Digital Pathology Survey Results
FISHIHC
Total
0 1+ 2+ 3+
Negative 79 467 181 1 728 (68.7%)
Equivocal 7 21 13 1 42 (4.0%)
Positive 1 28 103 157 289 (27.3%)
Total 87 (8.2%) 516 (48.7%) 297 (28.1%) 159 (15.0%) 1059 (100%)
Conclusions: Our digital pathology implementation has shown a noteworthy increase in efficiency and operational utility. Metrics to practically evaluate digital pathology ROI include: glass slide requests, decrease in ancillary workup for patients to demonstrate ROI to justify adoption of DP.
FISHIHC
Total0 1+ 2+ 3+
Negative 79 467 181 1 728 (68.7%)
Equivocal 7 21 13 1 42 (4.0%)
Positive 1 28 103 157 289 (27.3%)
Total 87 (8.2%) 516 (48.7%) 297 (28.1%) 159 (15.0%) 1059 (100%)
FISHIHC
Total0 1+ 2+ 3+
Negative 79 467 181 1 728 (68.7%)
Equivocal 7 21 13 1 42 (4.0%)
Positive 1 28 103 157 289 (27.3%)
Total 87 (8.2%) 516 (48.7%) 297 (28.1%) 159 (15.0%) 1059 (100%)
1639 Developing a Deep Learning Image Analysis Pipeline for Benign Breast Disease
Yujing Jan Heng1, Adithya D Vellal2, Korsuk Sirinukunwattana3, Gabrielle Baker1, Andreea Stancu3, Michael Pyle3, Kevin Kensler4, Stuart Schnitt5, James Connolly6, Laura Collins1, Rulla Tamimi7. 1Beth Israel Deaconess Medical Center, Boston, MA, 2Beth Israel Deaconess Medical Center, Westford, MA, 3Beth Israel Deaconess Medical Center, 4Harvard T.H. Chan School of Public Health, Boston, MA, 5Brigham and Women’s Hospital; Dana Farber Cancer Institute, Boston, MA,
6Jamaica Plain, MA, 7Harvard T.H. Chan School of Public Health
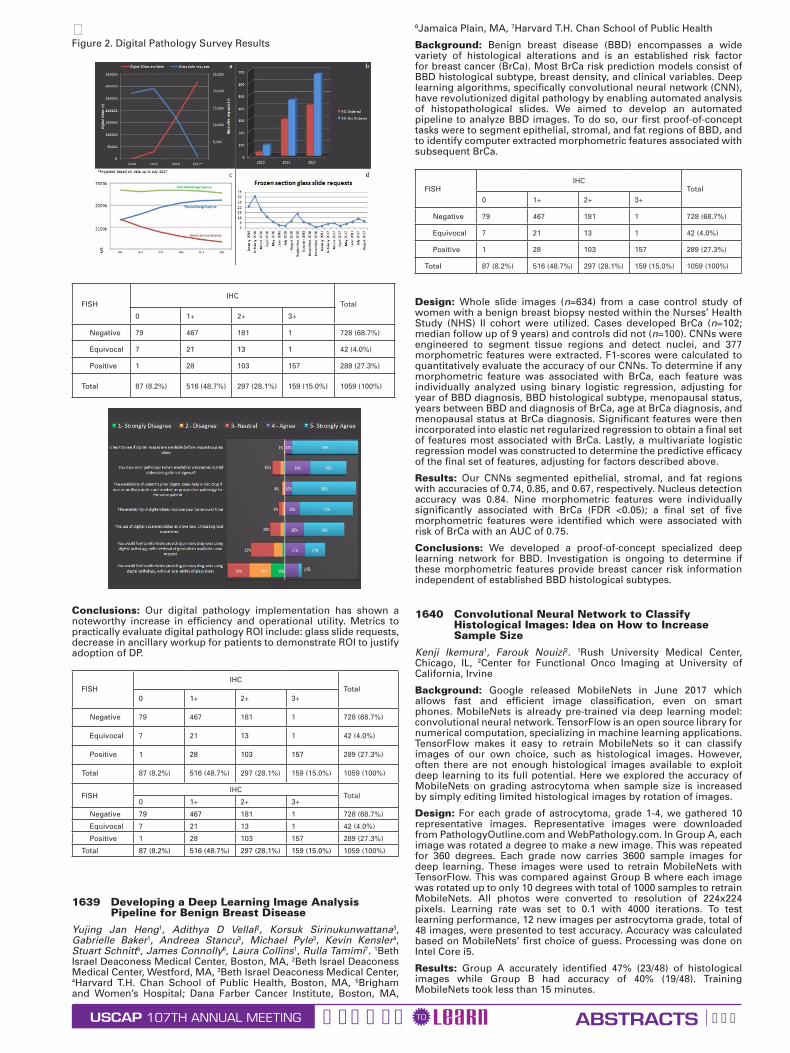
Background: Benign breast disease (BBD) encompasses a wide variety of histological alterations and is an established risk factor for breast cancer (BrCa). Most BrCa risk prediction models consist of BBD histological subtype, breast density, and clinical variables. Deep learning algorithms, specifically convolutional neural network (CNN), have revolutionized digital pathology by enabling automated analysis of histopathological slides. We aimed to develop an automated pipeline to analyze BBD images. To do so, our first proof-of-concept tasks were to segment epithelial, stromal, and fat regions of BBD, and to identify computer extracted morphometric features associated with subsequent BrCa.
FISHIHC
Total0 1+ 2+ 3+
Negative 79 467 181 1 728 (68.7%)
Equivocal 7 21 13 1 42 (4.0%)
Positive 1 28 103 157 289 (27.3%)
Total 87 (8.2%) 516 (48.7%) 297 (28.1%) 159 (15.0%) 1059 (100%)
Design: Whole slide images (n=634) from a case control study of women with a benign breast biopsy nested within the Nurses’ Health Study (NHS) II cohort were utilized. Cases developed BrCa (n=102; median follow up of 9 years) and controls did not (n=100). CNNs were engineered to segment tissue regions and detect nuclei, and 377 morphometric features were extracted. F1-scores were calculated to quantitatively evaluate the accuracy of our CNNs. To determine if any morphometric feature was associated with BrCa, each feature was individually analyzed using binary logistic regression, adjusting for year of BBD diagnosis, BBD histological subtype, menopausal status, years between BBD and diagnosis of BrCa, age at BrCa diagnosis, and menopausal status at BrCa diagnosis. Significant features were then incorporated into elastic net regularized regression to obtain a final set of features most associated with BrCa. Lastly, a multivariate logistic regression model was constructed to determine the predictive efficacy of the final set of features, adjusting for factors described above.
Results: Our CNNs segmented epithelial, stromal, and fat regions with accuracies of 0.74, 0.85, and 0.67, respectively. Nucleus detection accuracy was 0.84. Nine morphometric features were individually significantly associated with BrCa (FDR <0.05); a final set of five morphometric features were identified which were associated with risk of BrCa with an AUC of 0.75.
Conclusions: We developed a proof-of-concept specialized deep learning network for BBD. Investigation is ongoing to determine if these morphometric features provide breast cancer risk information independent of established BBD histological subtypes.
1640 Convolutional Neural Network to Classify Histological Images: Idea on How to Increase Sample Size
Kenji Ikemura1, Farouk Nouizi2. 1Rush University Medical Center, Chicago, IL, 2Center for Functional Onco Imaging at University of California, Irvine
Background: Google released MobileNets in June 2017 which allows fast and efficient image classification, even on smart phones. MobileNets is already pre-trained via deep learning model: convolutional neural network. TensorFlow is an open source library for numerical computation, specializing in machine learning applications. TensorFlow makes it easy to retrain MobileNets so it can classify images of our own choice, such as histological images. However, often there are not enough histological images available to exploit deep learning to its full potential. Here we explored the accuracy of MobileNets on grading astrocytoma when sample size is increased by simply editing limited histological images by rotation of images.
Design: For each grade of astrocytoma, grade 1-4, we gathered 10 representative images. Representative images were downloaded from PathologyOutline.com and WebPathology.com. In Group A, each image was rotated a degree to make a new image. This was repeated for 360 degrees. Each grade now carries 3600 sample images for deep learning. These images were used to retrain MobileNets with TensorFlow. This was compared against Group B where each image was rotated up to only 10 degrees with total of 1000 samples to retrain MobileNets. All photos were converted to resolution of 224x224 pixels. Learning rate was set to 0.1 with 4000 iterations. To test learning performance, 12 new images per astrocytoma grade, total of 48 images, were presented to test accuracy. Accuracy was calculated based on MobileNets’ first choice of guess. Processing was done on Intel Core i5.
Results: Group A accurately identified 47% (23/48) of histological images while Group B had accuracy of 40% (19/48). Training MobileNets took less than 15 minutes.

USCAP ABSTRACTSGEARED LEARNTO107TH ANNUAL MEETING 590
Conclusions: Though there were only 10 original sample images for each astrocytoma grade, MobileNets’ accuracy to identify grading improved by 7% simply by increasing sample size by rotating the original histological images. Theoretically, it should be possible to further improve accuracy by adding more sample images by flipping the original images vertically, or horizontally, and then by rotation. This will allow us to overcome limited supply of original histological images. Considering MobileNets is a low power model optimized for efficiency on smart-phones and laptops, there is great potential in deep learning to improve performance by using more computationally heavy model such as Inception V3. Age of artificial intelligence assisted medical diagnosis is near.
1641 A Convolutional Approach to Automating Histopathologic Detection of Melanocytic Atypia: Bridging the Gap
Elizabeth S Keiser1, Garrett T Gaskins1, Al Naklowycz2, Thaddeus Mully1, Michael J Keiser1. 1Univ. of California, San Francisco, San Francisco, CA, 2Univ. of California, San Francisco
Background: Melanocytic atypia is histopathologically challenging, with melanoma in situ (MIS) in particular contributing to diagnostic discordance. Pathologist interobserver agreement for melanocytic atypia ranges from 60-88%; nodular and superficial spreading melanomas are often missed on first biopsy. With a 5-year survival for Stage 4 melanoma at 12% and diagnostic errors contributing to 10% of patient deaths, MIS is an ideal target for diagnostic improvement. In April 2017, the FDA approved marketing of a whole slide imaging (WSI) system for clinical review and interpretation of digital surgical pathology slides prepared from biopsied tissue, before which WSIs could be used for non-clinical purposes only. Pathologists previously explored this technology with varying results. We use a combined supervised-unsupervised machine learning approach to categorize dermatopathology whole slide images of wet tissue cutaneous biopsies as “benign” or “suspicious for MIS” and determined the model of best fit for this approach.
Design: We train a convolutional neural network (CNN) to recognize melanocyte atypia solely from WSIs using over 60,000 image tiles (137 x 137 pixels each) containing elements of benign cutaneous tissue, incidental lesions, and MIS melanocytic atypia. The gold standard is defined as the dermatopathologist’s final report. This dataset derives from 40 H&E tissue sections from seven WSIs of patients aged 40-73 years old seen on UCSF’s dermatopathology service in 2011-2015, excluding excisional and previously biopsied specimens. We use a randomly selected subset of 24,631 tiles with a 1:1 ratio of benign to malignant labels to train the CNN on 80% (19,705 tiles) and test on 20% (4,926 tiles), refining over 30 epochs. Using variations on stochastic gradient descent, we explore CNN architectures and hyperparameters to achieve practical convergence and minimize overfitting. We evaluate the CNN’s accuracy by area under the receiver operating characteristic curve (AUROC) for a set of 1,634 tiles from an eighth WSI containing MIS.
Results: The AUROC for the validation set was 0.84 (0.80 AUPRC), which is comparable to published histopathologic diagnostic concordance for nevomelanocytic neoplasms.
Figure 1. Sample tiles corresponding with the CNN’s degree of certainty that a tile contains melanocytic atypia. “High” corresponds with a high degree of suspicion for melanoma in situ (MIS); “low” corresponds with benign.
References
1. Gilmore S. Melanoma screening: Informing public health policy with quantitative modelling. PLoS One. 2017;12(9):e0182349.
2. Cicchiello M, Lin MJ, Pan Y, McLean C, Kelly JW. An assessment of clinical pathways and missed opportunities for the diagnosis of nodular melanoma versus superficial spreading melanoma. Australas J Dermatol. 2016;57(2):97-101.
3. FDA allows marketing of first whole slide imaging system for digital pathology [press release]. 4/12/2017 2017.
4. National Academies of Sciences E, and Medicine. Improving diagnosis in health care. Washington, DC: The National Academies Press. 2015.
5. Elmore JG, Barnhill RL, Elder DE, et al. Pathologists’ diagnosis of invasive melanoma and melanocytic proliferations: observer accuracy and reproducibility study. The BMJ. 2017;357:j2813.
6. Gerami P, Busam K, Cochran A, et al. Histomorphologic assessment and interobserver diagnostic reproducibility of atypical spitzoid melanocytic neoplasms with long-term follow-up. The American journal of surgical pathology. 2014;38(7):934-940.
FISHIHC
Total0 1+ 2+ 3+
Negative 79 467 181 1 728 (68.7%)
Equivocal 7 21 13 1 42 (4.0%)
Positive 1 28 103 157 289 (27.3%)
Total 87 (8.2%) 516 (48.7%) 297 (28.1%) 159 (15.0%) 1059 (100%)
7. Duncan LM, Berwick M, Bruijn JA, Byers HR, Mihm MC, Barnhill RL. Histopathologic recognition and grading of dysplastic melanocytic nevi: an interobserver agreement study. J Invest Dermatol. 1993;100(3):318s-321s.
8. Duray PH, DerSimonian R, Barnhill R, et al. An analysis of interobserver recognition of the histopathologic features of dysplastic nevi from a mixed group of nevomelanocytic lesions. J Am Acad Dermatol. 1992;27(5 Pt 1):741-749.
9. Esteva A, Kuprel B, Novoa RA, et al. Dermatologist-level classification of skin cancer with deep neural networks. Nature. 2017;542(7639):115-118.
10. Wang, H. et al. Mitosis detection in breast cancer pathology images by combining handcrafted and convolutional neural network features. Journal of Medical Imaging 1, 034003–034003 (2014).
11. Litjens, G. et al. Deep learning as a tool for increased accuracy and efficiency of histopathological diagnosis. Sci. Rep. 6, 26286; doi: 10.1038/srep26286 (2016).
12. Ertosun, MG, Rubin, DL. Automated grading of gliomas using deep learning in digital pathology images: A modular approach with ensemble of convolutional neural networks. In AMIA Annual Symposium Proceedings vol. 2015, 1899 (American Medical Informatics Association, 2015).
13. Cruz-Roa, A. et al. Automatic detection of invasive ductal carcinoma in whole slide images with convolutional neural networks. In SPIE Medical Imaging 904103–904103 (International Society for Optics and Photonics, 2014).
14. Ciresan, DC, Giusti, A, Gambardella, LM, Schmidhuber, J. Mitosis detection in breast cancer histology images with deep neural networks. Med Image Comput Comput Assist Interv. 8150, 411–418 (2013).
Conclusions: These findings suggest deep CNNs may assist pathologists to reach better consensus regarding new MIS diagnoses in cutaneous biopsies. Caution is warranted, however, as WSI preparation prior to analysis and edge artifact may introduce diagnostic error without appropriate oversight.
FISHIHC
Total0 1+ 2+ 3+
Negative 79 467 181 1 728 (68.7%)
Equivocal 7 21 13 1 42 (4.0%)
Positive 1 28 103 157 289 (27.3%)
Total 87 (8.2%) 516 (48.7%) 297 (28.1%) 159 (15.0%) 1059 (100%)
USCAP ABSTRACTSGEARED LEARNTO107TH ANNUAL MEETING 591
1642 Computer Science Approaches to Extract Immunohistochemistry (IHC) Results from Surgical Pathology Full Text Reports Using Machine Learning and Natural Language Processing (NLP) Techniques
Young suk Kim1, Michael H Roehrl1. 1Memorial Sloan Kettering Cancer Center, New York, NY
Background: Natural language processing (NLP) and Artificial Intelligence (AI) methods are attractive Computer Science tools for unstructured full text parsing and extraction. Pathology reports, like most reports in current clinical care, remain largely free text with wide stylistic and contextual variability. We set out to use cutting-edge NLP algorithms to have a computer “learn” to parse and extract key information elements from pathology reports. Here we focus on extracting protein expression patterns of tumors as measured by IHC.
Design: We explore and develop an NLP algorithm using R/Python open-source libraries started by Google (scikit-learn and Word2vec), as well as in-house Machine Learning algorithms that invoke text data mining techniques. We cleaned and pre-processed data by using Apache cTakes (NLP system for clinical free-text) to capture a common ontology by identifying synonyms, word ambiguation, and variation. Having pre-processed data lets us manipulate and focus on IHC-related information for each part of a patient’s tissue specimen using the standard ML and NLP libraries, namely dplyr, tidytext, scikit-learn, and other text analysis tools. We trained our algorithm with fixed training sets of labeled data using supervised classification at the sentence level and paragraph level.
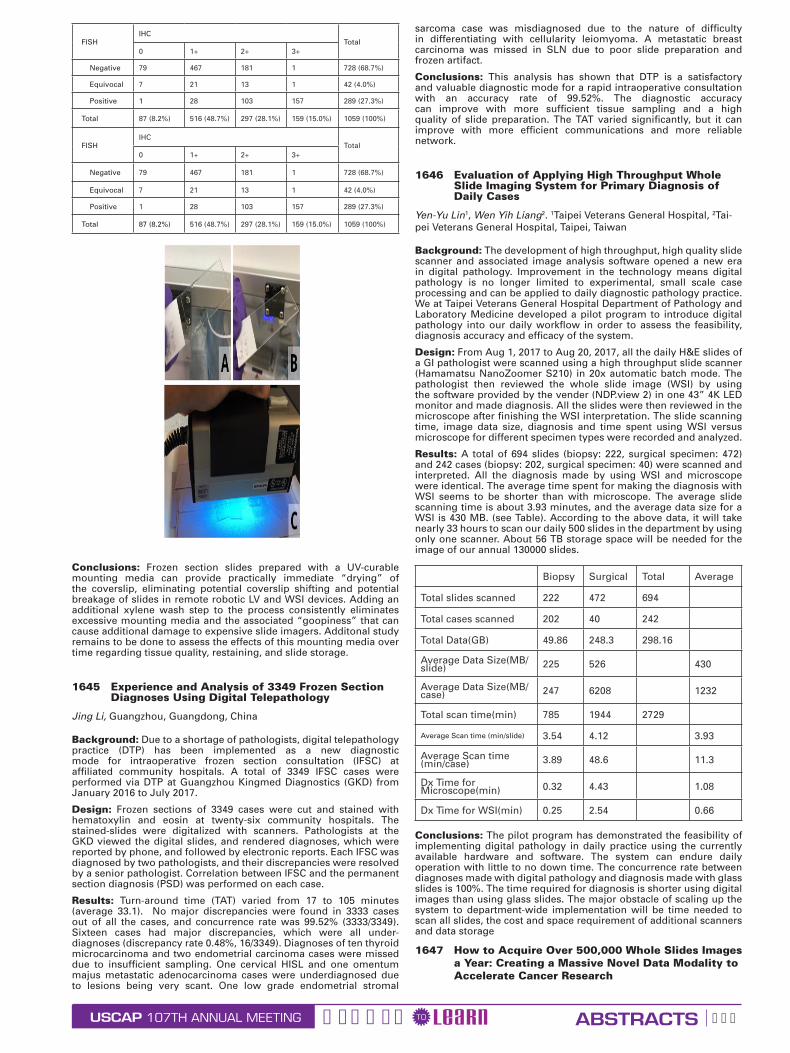
Results: We assess surgical pathology reports (36,431) between 2015 and 2017. Our large cancer center has developed an oncology-focused machine-learning algorithm and Application Programming Interfaces (API). We did not consciously exclude complex cases. Each report is divided and categorized into different sections. We converted free text into text data in tidy format structure (a table with one-token-per-row; Wickham 2014). This process is more efficient than using the whole free text, as it often contains irrelevant information such as a physicians’ name, a patient’s clinical diagnosis or specimen size, or additional information not of interest for this study. Figure 1 illustrates a high-level data flow to refine the scoring function by fitting training data sets to return the highest score.
Conclusions: We have developed initial NLP tools for extraction of IHC-based protein expression in cancers using unstructured full text pathology reports as input. These are powerful tools for rendering otherwise “hidden” IHC observations massively accessible for biomarker discovery and correlation with genomic changes.
1643 The Big Data Opportunity in Research Biobanking: Design and Development of a Web-Based Application to Unify and Connect Biospecimen Information and to Overcome Data Silo Challenges
Young suk Kim1, Joachim Silber2, Stuart Gardos1, Michael H Roehrl1. 1Memorial Sloan Kettering Cancer Center, New York, NY, 2Memorial Sloan Kettering Cancer Center
Background: Biobanks play a crucial role in cancer research. Robust linkage of physical research specimens (tissues, bloods, other samples, and derivatives) to associated information (genomics, outcomes, treatment, clinical trial enrollment, etc.) has tremendous potential but remains a difficult task worldwide, even at the largest Cancer Centers. The smart application of Computer Science and advanced database strategies promises to unlock Big Data for research biobanks and will be a prerequisite for next gen use of these resources for pathology-driven drug and companion diagnostics development.
Design: To unite disparate data, we developed an integrated data model using an in-house healthcare warehouse solution which connects to RDBMS (A Relational Database Management System: Oracle and IBM DB2) via Open Database Connectivity (ODBC), IBM DB2 Connect, and Oracle Gateway. We also implemented a centralized large-scale data visualization system using the Tableau data interactive tool for users to explore real-time data visually using a click and drop interface. Once the data model was validated, we federated all structured and unstructured data such as clinical, operational and molecular data sets by filtering an appropriate amount of information to improve biobank workflows. We then developed additional plugins: (1) a powerful reporting tool and (2) an interactive web-based dashboard.
Results: This application successfully consolidated 227,237 research biobank specimen accession cases including related billing and
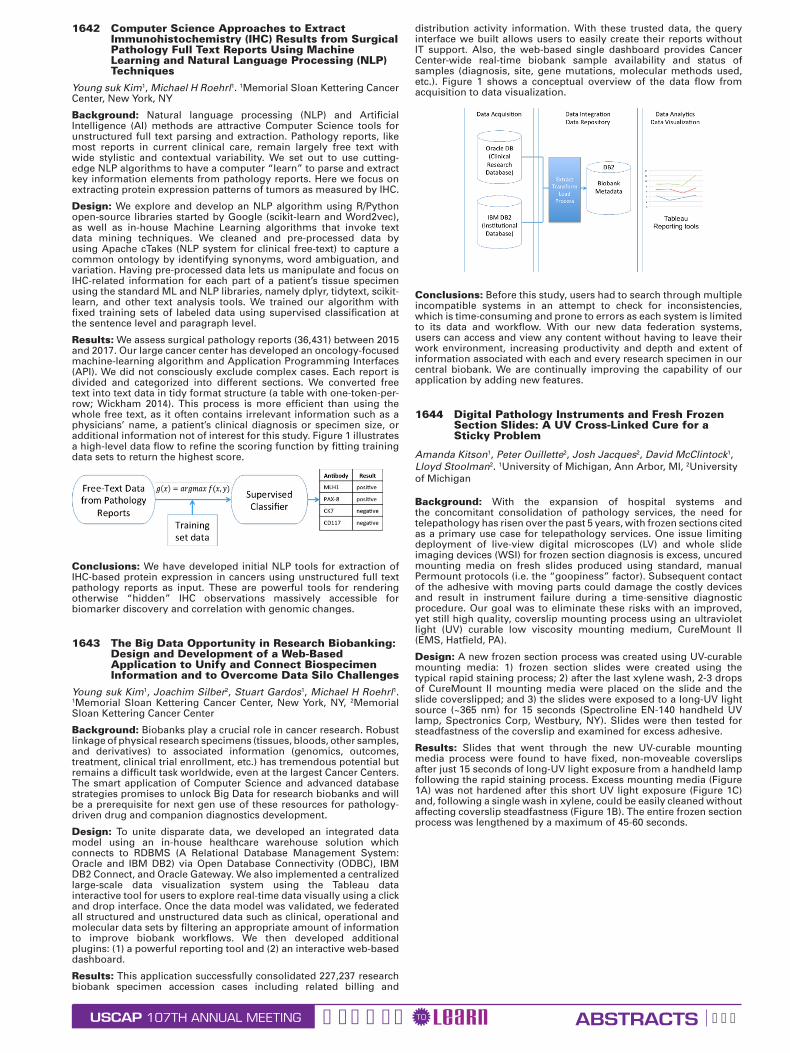
distribution activity information. With these trusted data, the query interface we built allows users to easily create their reports without IT support. Also, the web-based single dashboard provides Cancer Center-wide real-time biobank sample availability and status of samples (diagnosis, site, gene mutations, molecular methods used, etc.). Figure 1 shows a conceptual overview of the data flow from acquisition to data visualization.
Conclusions: Before this study, users had to search through multiple incompatible systems in an attempt to check for inconsistencies, which is time-consuming and prone to errors as each system is limited to its data and workflow. With our new data federation systems, users can access and view any content without having to leave their work environment, increasing productivity and depth and extent of information associated with each and every research specimen in our central biobank. We are continually improving the capability of our application by adding new features.
1644 Digital Pathology Instruments and Fresh Frozen Section Slides: A UV Cross-Linked Cure for a Sticky Problem
Amanda Kitson1, Peter Ouillette2, Josh Jacques2, David McClintock1, Lloyd Stoolman2. 1University of Michigan, Ann Arbor, MI, 2University of Michigan
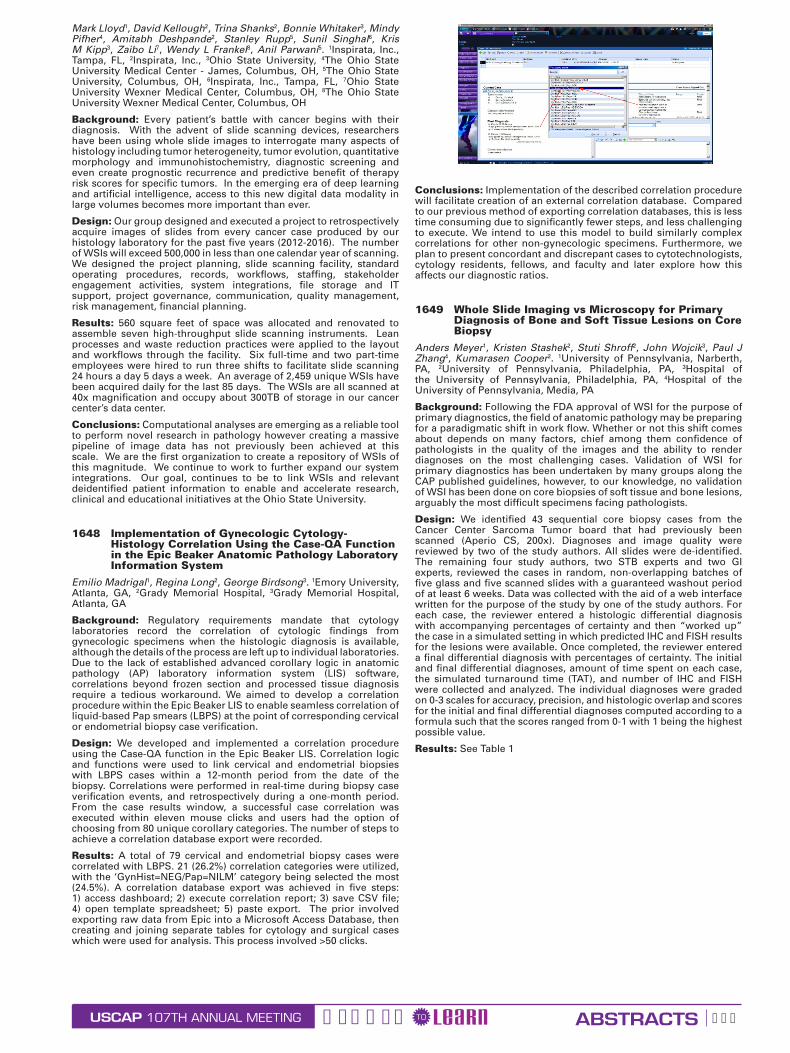
Background: With the expansion of hospital systems and the concomitant consolidation of pathology services, the need for telepathology has risen over the past 5 years, with frozen sections cited as a primary use case for telepathology services. One issue limiting deployment of live-view digital microscopes (LV) and whole slide imaging devices (WSI) for frozen section diagnosis is excess, uncured mounting media on fresh slides produced using standard, manual Permount protocols (i.e. the “goopiness” factor). Subsequent contact of the adhesive with moving parts could damage the costly devices and result in instrument failure during a time-sensitive diagnostic procedure. Our goal was to eliminate these risks with an improved, yet still high quality, coverslip mounting process using an ultraviolet light (UV) curable low viscosity mounting medium, CureMount II (EMS, Hatfield, PA).
Design: A new frozen section process was created using UV-curable mounting media: 1) frozen section slides were created using the typical rapid staining process; 2) after the last xylene wash, 2-3 drops of CureMount II mounting media were placed on the slide and the slide coverslipped; and 3) the slides were exposed to a long-UV light source (~365 nm) for 15 seconds (Spectroline EN-140 handheld UV lamp, Spectronics Corp, Westbury, NY). Slides were then tested for steadfastness of the coverslip and examined for excess adhesive.
Results: Slides that went through the new UV-curable mounting media process were found to have fixed, non-moveable coverslips after just 15 seconds of long-UV light exposure from a handheld lamp following the rapid staining process. Excess mounting media (Figure 1A) was not hardened after this short UV light exposure (Figure 1C) and, following a single wash in xylene, could be easily cleaned without affecting coverslip steadfastness (Figure 1B). The entire frozen section process was lengthened by a maximum of 45-60 seconds.
USCAP ABSTRACTSGEARED LEARNTO107TH ANNUAL MEETING 592
FISHIHC
Total0 1+ 2+ 3+
Negative 79 467 181 1 728 (68.7%)
Equivocal 7 21 13 1 42 (4.0%)
Positive 1 28 103 157 289 (27.3%)
Total 87 (8.2%) 516 (48.7%) 297 (28.1%) 159 (15.0%) 1059 (100%)
FISHIHC
Total0 1+ 2+ 3+
Negative 79 467 181 1 728 (68.7%)
Equivocal 7 21 13 1 42 (4.0%)
Positive 1 28 103 157 289 (27.3%)
Total 87 (8.2%) 516 (48.7%) 297 (28.1%) 159 (15.0%) 1059 (100%)
Conclusions: Frozen section slides prepared with a UV-curable mounting media can provide practically immediate “drying” of the coverslip, eliminating potential coverslip shifting and potential breakage of slides in remote robotic LV and WSI devices. Adding an additional xylene wash step to the process consistently eliminates excessive mounting media and the associated “goopiness” that can cause additional damage to expensive slide imagers. Additonal study remains to be done to assess the effects of this mounting media over time regarding tissue quality, restaining, and slide storage.
1645 Experience and Analysis of 3349 Frozen Section Diagnoses Using Digital Telepathology
Jing Li, Guangzhou, Guangdong, China
Background: Due to a shortage of pathologists, digital telepathology practice (DTP) has been implemented as a new diagnostic mode for intraoperative frozen section consultation (IFSC) at affiliated community hospitals. A total of 3349 IFSC cases were performed via DTP at Guangzhou Kingmed Diagnostics (GKD) from January 2016 to July 2017.
Design: Frozen sections of 3349 cases were cut and stained with hematoxylin and eosin at twenty-six community hospitals. The stained-slides were digitalized with scanners. Pathologists at the GKD viewed the digital slides, and rendered diagnoses, which were reported by phone, and followed by electronic reports. Each IFSC was diagnosed by two pathologists, and their discrepancies were resolved by a senior pathologist. Correlation between IFSC and the permanent section diagnosis (PSD) was performed on each case.
Results: Turn-around time (TAT) varied from 17 to 105 minutes (average 33.1). No major discrepancies were found in 3333 cases out of all the cases, and concurrence rate was 99.52% (3333/3349). Sixteen cases had major discrepancies, which were all under-diagnoses (discrepancy rate 0.48%, 16/3349). Diagnoses of ten thyroid microcarcinoma and two endometrial carcinoma cases were missed due to insufficient sampling. One cervical HISL and one omentum majus metastatic adenocarcinoma cases were underdiagnosed due to lesions being very scant. One low grade endometrial stromal
sarcoma case was misdiagnosed due to the nature of difficulty in differentiating with cellularity leiomyoma. A metastatic breast carcinoma was missed in SLN due to poor slide preparation and frozen artifact.
Conclusions: This analysis has shown that DTP is a satisfactory and valuable diagnostic mode for a rapid intraoperative consultation with an accuracy rate of 99.52%. The diagnostic accuracy can improve with more sufficient tissue sampling and a high quality of slide preparation. The TAT varied significantly, but it can improve with more efficient communications and more reliable network.
1646 Evaluation of Applying High Throughput Whole Slide Imaging System for Primary Diagnosis of Daily Cases
Yen-Yu Lin1, Wen Yih Liang2. 1Taipei Veterans General Hospital, 2Tai-pei Veterans General Hospital, Taipei, Taiwan
Background: The development of high throughput, high quality slide scanner and associated image analysis software opened a new era in digital pathology. Improvement in the technology means digital pathology is no longer limited to experimental, small scale case processing and can be applied to daily diagnostic pathology practice. We at Taipei Veterans General Hospital Department of Pathology and Laboratory Medicine developed a pilot program to introduce digital pathology into our daily workflow in order to assess the feasibility, diagnosis accuracy and efficacy of the system.
Design: From Aug 1, 2017 to Aug 20, 2017, all the daily H&E slides of a GI pathologist were scanned using a high throughput slide scanner (Hamamatsu NanoZoomer S210) in 20x automatic batch mode. The pathologist then reviewed the whole slide image (WSI) by using the software provided by the vender (NDP.view 2) in one 43” 4K LED monitor and made diagnosis. All the slides were then reviewed in the microscope after finishing the WSI interpretation. The slide scanning time, image data size, diagnosis and time spent using WSI versus microscope for different specimen types were recorded and analyzed.
Results: A total of 694 slides (biopsy: 222, surgical specimen: 472) and 242 cases (biopsy: 202, surgical specimen: 40) were scanned and interpreted. All the diagnosis made by using WSI and microscope were identical. The average time spent for making the diagnosis with WSI seems to be shorter than with microscope. The average slide scanning time is about 3.93 minutes, and the average data size for a WSI is 430 MB. (see Table). According to the above data, it will take nearly 33 hours to scan our daily 500 slides in the department by using only one scanner. About 56 TB storage space will be needed for the image of our annual 130000 slides.
Biopsy Surgical Total Average
Total slides scanned 222 472 694
Total cases scanned 202 40 242
Total Data(GB) 49.86 248.3 298.16
Average Data Size(MB/slide) 225 526 430
Average Data Size(MB/case) 247 6208 1232
Total scan time(min) 785 1944 2729
Average Scan time (min/slide) 3.54 4.12 3.93
Average Scan time (min/case) 3.89 48.6 11.3
Dx Time for Microscope(min) 0.32 4.43 1.08
Dx Time for WSI(min) 0.25 2.54 0.66
Conclusions: The pilot program has demonstrated the feasibility of implementing digital pathology in daily practice using the currently available hardware and software. The system can endure daily operation with little to no down time. The concurrence rate between diagnoses made with digital pathology and diagnosis made with glass slides is 100%. The time required for diagnosis is shorter using digital images than using glass slides. The major obstacle of scaling up the system to department-wide implementation will be time needed to scan all slides, the cost and space requirement of additional scanners and data storage
1647 How to Acquire Over 500,000 Whole Slides Images a Year: Creating a Massive Novel Data Modality to Accelerate Cancer Research
USCAP ABSTRACTSGEARED LEARNTO107TH ANNUAL MEETING 593
Mark Lloyd1, David Kellough2, Trina Shanks2, Bonnie Whitaker3, Mindy Pifher4, Amitabh Deshpande2, Stanley Rupp5, Sunil Singhal6, Kris M Kipp3, Zaibo Li7, Wendy L Frankel8, Anil Parwani5. 1Inspirata, Inc., Tampa, FL, 2Inspirata, Inc., 3Ohio State University, 4The Ohio State University Medical Center - James, Columbus, OH, 5The Ohio State University, Columbus, OH, 6Inspirata, Inc., Tampa, FL, 7Ohio State University Wexner Medical Center, Columbus, OH, 8The Ohio State University Wexner Medical Center, Columbus, OH
Background: Every patient’s battle with cancer begins with their diagnosis. With the advent of slide scanning devices, researchers have been using whole slide images to interrogate many aspects of histology including tumor heterogeneity, tumor evolution, quantitative morphology and immunohistochemistry, diagnostic screening and even create prognostic recurrence and predictive benefit of therapy risk scores for specific tumors. In the emerging era of deep learning and artificial intelligence, access to this new digital data modality in large volumes becomes more important than ever.
Design: Our group designed and executed a project to retrospectively acquire images of slides from every cancer case produced by our histology laboratory for the past five years (2012-2016). The number of WSIs will exceed 500,000 in less than one calendar year of scanning. We designed the project planning, slide scanning facility, standard operating procedures, records, workflows, staffing, stakeholder engagement activities, system integrations, file storage and IT support, project governance, communication, quality management, risk management, financial planning.
Results: 560 square feet of space was allocated and renovated to assemble seven high-throughput slide scanning instruments. Lean processes and waste reduction practices were applied to the layout and workflows through the facility. Six full-time and two part-time employees were hired to run three shifts to facilitate slide scanning 24 hours a day 5 days a week. An average of 2,459 unique WSIs have been acquired daily for the last 85 days. The WSIs are all scanned at 40x magnification and occupy about 300TB of storage in our cancer center’s data center.
Conclusions: Computational analyses are emerging as a reliable tool to perform novel research in pathology however creating a massive pipeline of image data has not previously been achieved at this scale. We are the first organization to create a repository of WSIs of this magnitude. We continue to work to further expand our system integrations. Our goal, continues to be to link WSIs and relevant deidentified patient information to enable and accelerate research, clinical and educational initiatives at the Ohio State University.
1648 Implementation of Gynecologic Cytology-Histology Correlation Using the Case-QA Function in the Epic Beaker Anatomic Pathology Laboratory Information System
Emilio Madrigal1, Regina Long2, George Birdsong3. 1Emory University, Atlanta, GA, 2Grady Memorial Hospital, 3Grady Memorial Hospital, Atlanta, GA
Background: Regulatory requirements mandate that cytology laboratories record the correlation of cytologic findings from gynecologic specimens when the histologic diagnosis is available, although the details of the process are left up to individual laboratories. Due to the lack of established advanced corollary logic in anatomic pathology (AP) laboratory information system (LIS) software, correlations beyond frozen section and processed tissue diagnosis require a tedious workaround. We aimed to develop a correlation procedure within the Epic Beaker LIS to enable seamless correlation of liquid-based Pap smears (LBPS) at the point of corresponding cervical or endometrial biopsy case verification.
Design: We developed and implemented a correlation procedure using the Case-QA function in the Epic Beaker LIS. Correlation logic and functions were used to link cervical and endometrial biopsies with LBPS cases within a 12-month period from the date of the biopsy. Correlations were performed in real-time during biopsy case verification events, and retrospectively during a one-month period. From the case results window, a successful case correlation was executed within eleven mouse clicks and users had the option of choosing from 80 unique corollary categories. The number of steps to achieve a correlation database export were recorded.
Results: A total of 79 cervical and endometrial biopsy cases were correlated with LBPS. 21 (26.2%) correlation categories were utilized, with the ‘GynHist=NEG/Pap=NILM’ category being selected the most (24.5%). A correlation database export was achieved in five steps: 1) access dashboard; 2) execute correlation report; 3) save CSV file; 4) open template spreadsheet; 5) paste export. The prior involved exporting raw data from Epic into a Microsoft Access Database, then creating and joining separate tables for cytology and surgical cases which were used for analysis. This process involved >50 clicks.
Conclusions: Implementation of the described correlation procedure will facilitate creation of an external correlation database. Compared to our previous method of exporting correlation databases, this is less time consuming due to significantly fewer steps, and less challenging to execute. We intend to use this model to build similarly complex correlations for other non-gynecologic specimens. Furthermore, we plan to present concordant and discrepant cases to cytotechnologists, cytology residents, fellows, and faculty and later explore how this affects our diagnostic ratios.
1649 Whole Slide Imaging vs Microscopy for Primary Diagnosis of Bone and Soft Tissue Lesions on Core Biopsy
Anders Meyer1, Kristen Stashek2, Stuti Shroff2, John Wojcik3, Paul J Zhang4, Kumarasen Cooper2. 1University of Pennsylvania, Narberth, PA, 2University of Pennsylvania, Philadelphia, PA, 3Hospital of the University of Pennsylvania, Philadelphia, PA, 4Hospital of the University of Pennsylvania, Media, PA
Background: Following the FDA approval of WSI for the purpose of primary diagnostics, the field of anatomic pathology may be preparing for a paradigmatic shift in work flow. Whether or not this shift comes about depends on many factors, chief among them confidence of pathologists in the quality of the images and the ability to render diagnoses on the most challenging cases. Validation of WSI for primary diagnostics has been undertaken by many groups along the CAP published guidelines, however, to our knowledge, no validation of WSI has been done on core biopsies of soft tissue and bone lesions, arguably the most difficult specimens facing pathologists.
Design: We identified 43 sequential core biopsy cases from the Cancer Center Sarcoma Tumor board that had previously been scanned (Aperio CS, 200x). Diagnoses and image quality were reviewed by two of the study authors. All slides were de-identified. The remaining four study authors, two STB experts and two GI experts, reviewed the cases in random, non-overlapping batches of five glass and five scanned slides with a guaranteed washout period of at least 6 weeks. Data was collected with the aid of a web interface written for the purpose of the study by one of the study authors. For each case, the reviewer entered a histologic differential diagnosis with accompanying percentages of certainty and then “worked up” the case in a simulated setting in which predicted IHC and FISH results for the lesions were available. Once completed, the reviewer entered a final differential diagnosis with percentages of certainty. The initial and final differential diagnoses, amount of time spent on each case, the simulated turnaround time (TAT), and number of IHC and FISH were collected and analyzed. The individual diagnoses were graded on 0-3 scales for accuracy, precision, and histologic overlap and scores for the initial and final differential diagnoses computed according to a formula such that the scores ranged from 0-1 with 1 being the highest possible value.
Results: See Table 1

USCAP ABSTRACTSGEARED LEARNTO107TH ANNUAL MEETING 594
Reviewer Expertise
Cases reviewed to date
Mean time spent (minutes)
p
Glass WSI Glass WSI
1 GI 10 10 7.6 12.4 0.14
2 GI 10 10 4.5 4.2 0.81
3 ST 10 10 2.6 4.4 0.24
4 ST 20 20 5.5 4.7 0.69
IHC ordered per case
p
FISH ordered per case
pMean TAT
p
Glass WSI Glass WSI Glass WSI
1 6.1 5.70 0.82 0.3 0.2 0.63 3.1 3.2 0.87
2 5.3 3.9 0.23 0.3 1 0.15 3 3.2 0.80
3 2.5 4.60 0.17 0.8 1.1 0.56 3.0 4.0 0.29
4 5.0 3.50 0.11 0.5 0.3 0.35 2.7 2.1 0.23
Initial diagnostic score (0-1) p
Final diagnostic score (0-1) p
Difference in final and initial scores (0-1) p
Glass WSI Glass WSI Glass WSI
1 0.50 0.36 0.39 0.72 0.49 0.17 0.23 0.13 0.44
2 0.37 0.38 0.93 0.67 0.70 0.85 0.30 0.32 0.89
3 0.68 0.49 0.22 0.80 0.80 0.99 0.12 0.30 0.29
4 0.44 0.71 0.01 0.88 0.92 0.47 0.44 0.21 0.01
Conclusions: This is the first study to examine the effect of WSI on the diagnosis of soft tissue and bone small biopsies. This is also the first study to attempt to simulate real-life measures such as TAT and ancillary test ordering in an effort to quantitate the effect of the diag-nostic medium. Data acquisition is ongoing at the time of submis-sion. Preliminary data, however, indicate that WSI scanned at 200x is non-inferior to glass slides for the evaluation of these challenging specimens.
1650 Application of cBioPortal Local Platform for Quality Assurance and Quality Control of Next Generation Sequencing Mutation Data on Lung Adenocarcinomas
Nhu T Ngo1, Maohua Xie2, Amro Almradi3, Geoffrey Smith4, Charles Hill5, Linsheng Zhang6. 1Emory School of Medicine, Atlanta, GA, 2Emory University, 3Emory University Hospital, Decatur, GA, 4Emory University School of Medicine - Pathology, Atlanta, GA, 5Emory Univ/Medicine, Lilburn, GA, 6Emory University Hospital, Norcross, GA
Background: cBioPortal is an open source database platform created by Memorial Sloan-Kettering which is capable of handling large-scale data from cancer genomic profiling studies. Any institution can install cBioPortal as a local instance, upload in-house data, and utilize the data mining and annotation capabilities of cBioPortal. We built a local cBioPortal study to monitor our next generation sequencing (NGS) mutation profiling data and compare them with the public cBioPortal Cancer Genome Atlas (TCGA) database.
Design: The processes used to create the local cBioPortal study are summarized in Figure 1. NGS with Illumina TruSight Cancer 26 targeted gene panel was performed on 724 solid tumors accessioned from 7/27/15 to 7/24/17. De-identified somatic variants data were uploaded to the local cBioPortal study. Primary tumor type, anatomic site, and tumor cell percentage were included. We performed parallel searches on the local and public cBioPortal sites to compare the mutation profiles of in-house lung adenocarcinoma cases (353) with TCGA’s Pan-Lung Cancer 2016 cohort (660). The cumulative data were used for monthly quality review and presented at Molecular Tumor Board.
Results: There were striking similarities between our data and TCGA data (Table 1, Figure 2), including somatic mutation frequencies, driver mutation types, protein domains/coding regions involved, and co-occurrence / mutual exclusivity of mutations. We identified 5 EGFR, 13 MET, 2 KRAS, and 20 TP53 variants that were not reported in TCGA. These alterations were reviewed manually in Integrated Genome Viewer (IGV) and confirmed to be real variants. The main source of differences between our data and TCGA’s, particularly for EGFR and MET alterations, can be attributed to the different methodologies used. We performed targeted NGS (specific exons and mutation hotspots were sequenced), while TCGA performed whole exome sequencing.
Measure Specific Genes & Parameters
TCGA Pan-Lung 2016
N=660 pts.
Local
2015-2017
N=353 pts.
Somatic Muta-tion Frequencies
TP53
KRAS
EGFR
MET
54%
32%
16%
4%
46%
30%
13%
6%
Distribution of Driver
Mutation Types
TP53
• Missense
• Truncating
• In-frame ins/del
60%
38%
2%
70%
27%
3%
KRAS
• Missense
• In-frame ins/del
99.5%
0.5%
100%
0%
EGFR
• Missense
• Truncating
• In-frame ins/del
57%
3%
40%
55%
0%
45%
MET
• Missense
• Truncating
57%
43%
90%
10%
Distribution of Mutations Across Coding/Protein Domains
TP53
DNA-binding domain81% 79%
KRAS - Codon 12
(Catalytic G domain)86% 92%
EGFR
Tyrosine kinase domain
• Exon 19 del
• L858R
• T790M
81%
33%
22%
2%
98%
37%
31%
8%
MET
• Exon 14 alter-ations
• Kinase domain
39%
10%
48%
11%
Co-occurrence of Mutations
EGFR mutation + pts. with TP53 mutation(s) 60% 60%
Mutual Exclusivity
of Mutations
EGFR mutation + pts. with KRAS mutation(s)
EGFR mutation + pts. with MET mutation(s)
0%
0%
0%
0%
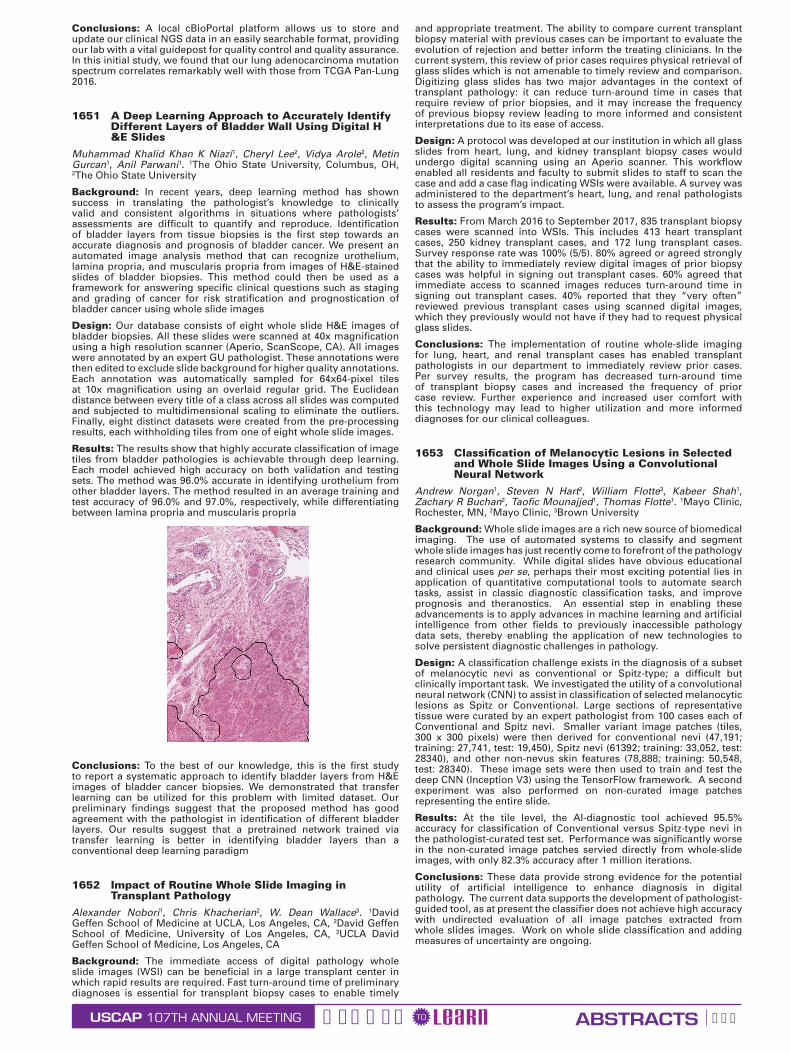
USCAP ABSTRACTSGEARED LEARNTO107TH ANNUAL MEETING 595
Conclusions: A local cBioPortal platform allows us to store and update our clinical NGS data in an easily searchable format, providing our lab with a vital guidepost for quality control and quality assurance. In this initial study, we found that our lung adenocarcinoma mutation spectrum correlates remarkably well with those from TCGA Pan-Lung 2016.
1651 A Deep Learning Approach to Accurately Identify Different Layers of Bladder Wall Using Digital H &E Slides
Muhammad Khalid Khan K Niazi1, Cheryl Lee2, Vidya Arole2, Metin Gurcan1, Anil Parwani1. 1The Ohio State University, Columbus, OH, 2The Ohio State University
Background: In recent years, deep learning method has shown success in translating the pathologist’s knowledge to clinically valid and consistent algorithms in situations where pathologists’ assessments are difficult to quantify and reproduce. Identification of bladder layers from tissue biopsies is the first step towards an accurate diagnosis and prognosis of bladder cancer. We present an automated image analysis method that can recognize urothelium, lamina propria, and muscularis propria from images of H&E-stained slides of bladder biopsies. This method could then be used as a framework for answering specific clinical questions such as staging and grading of cancer for risk stratification and prognostication of bladder cancer using whole slide images
Design: Our database consists of eight whole slide H&E images of bladder biopsies. All these slides were scanned at 40x magnification using a high resolution scanner (Aperio, ScanScope, CA). All images were annotated by an expert GU pathologist. These annotations were then edited to exclude slide background for higher quality annotations. Each annotation was automatically sampled for 64x64-pixel tiles at 10x magnification using an overlaid regular grid. The Euclidean distance between every title of a class across all slides was computed and subjected to multidimensional scaling to eliminate the outliers. Finally, eight distinct datasets were created from the pre-processing results, each withholding tiles from one of eight whole slide images.
Results: The results show that highly accurate classification of image tiles from bladder pathologies is achievable through deep learning. Each model achieved high accuracy on both validation and testing sets. The method was 96.0% accurate in identifying urothelium from other bladder layers. The method resulted in an average training and test accuracy of 96.0% and 97.0%, respectively, while differentiating between lamina propria and muscularis propria
Conclusions: To the best of our knowledge, this is the first study to report a systematic approach to identify bladder layers from H&E images of bladder cancer biopsies. We demonstrated that transfer learning can be utilized for this problem with limited dataset. Our preliminary findings suggest that the proposed method has good agreement with the pathologist in identification of different bladder layers. Our results suggest that a pretrained network trained via transfer learning is better in identifying bladder layers than a conventional deep learning paradigm
1652 Impact of Routine Whole Slide Imaging in Transplant Pathology
Alexander Nobori1, Chris Khacherian2, W. Dean Wallace3. 1David Geffen School of Medicine at UCLA, Los Angeles, CA, 2David Geffen School of Medicine, University of Los Angeles, CA, 3UCLA David Geffen School of Medicine, Los Angeles, CA
Background: The immediate access of digital pathology whole slide images (WSI) can be beneficial in a large transplant center in which rapid results are required. Fast turn-around time of preliminary diagnoses is essential for transplant biopsy cases to enable timely
and appropriate treatment. The ability to compare current transplant biopsy material with previous cases can be important to evaluate the evolution of rejection and better inform the treating clinicians. In the current system, this review of prior cases requires physical retrieval of glass slides which is not amenable to timely review and comparison. Digitizing glass slides has two major advantages in the context of transplant pathology: it can reduce turn-around time in cases that require review of prior biopsies, and it may increase the frequency of previous biopsy review leading to more informed and consistent interpretations due to its ease of access.
Design: A protocol was developed at our institution in which all glass slides from heart, lung, and kidney transplant biopsy cases would undergo digital scanning using an Aperio scanner. This workflow enabled all residents and faculty to submit slides to staff to scan the case and add a case flag indicating WSIs were available. A survey was administered to the department’s heart, lung, and renal pathologists to assess the program’s impact.
Results: From March 2016 to September 2017, 835 transplant biopsy cases were scanned into WSIs. This includes 413 heart transplant cases, 250 kidney transplant cases, and 172 lung transplant cases. Survey response rate was 100% (5/5). 80% agreed or agreed strongly that the ability to immediately review digital images of prior biopsy cases was helpful in signing out transplant cases. 60% agreed that immediate access to scanned images reduces turn-around time in signing out transplant cases. 40% reported that they “very often” reviewed previous transplant cases using scanned digital images, which they previously would not have if they had to request physical glass slides.
Conclusions: The implementation of routine whole-slide imaging for lung, heart, and renal transplant cases has enabled transplant pathologists in our department to immediately review prior cases. Per survey results, the program has decreased turn-around time of transplant biopsy cases and increased the frequency of prior case review. Further experience and increased user comfort with this technology may lead to higher utilization and more informed diagnoses for our clinical colleagues.
1653 Classification of Melanocytic Lesions in Selected and Whole Slide Images Using a Convolutional Neural Network
Andrew Norgan1, Steven N Hart2, William Flotte3, Kabeer Shah1, Zachary R Buchan2, Taofic Mounajjed1, Thomas Flotte1. 1Mayo Clinic, Rochester, MN, 2Mayo Clinic, 3Brown University
Background: Whole slide images are a rich new source of biomedical imaging. The use of automated systems to classify and segment whole slide images has just recently come to forefront of the pathology research community. While digital slides have obvious educational and clinical uses per se, perhaps their most exciting potential lies in application of quantitative computational tools to automate search tasks, assist in classic diagnostic classification tasks, and improve prognosis and theranostics. An essential step in enabling these advancements is to apply advances in machine learning and artificial intelligence from other fields to previously inaccessible pathology data sets, thereby enabling the application of new technologies to solve persistent diagnostic challenges in pathology.
Design: A classification challenge exists in the diagnosis of a subset of melanocytic nevi as conventional or Spitz-type; a difficult but clinically important task. We investigated the utility of a convolutional neural network (CNN) to assist in classification of selected melanocytic lesions as Spitz or Conventional. Large sections of representative tissue were curated by an expert pathologist from 100 cases each of Conventional and Spitz nevi. Smaller variant image patches (tiles, 300 x 300 pixels) were then derived for conventional nevi (47,191; training: 27,741, test: 19,450), Spitz nevi (61392; training: 33,052, test: 28340), and other non-nevus skin features (78,888; training: 50,548, test: 28340). These image sets were then used to train and test the deep CNN (Inception V3) using the TensorFlow framework. A second experiment was also performed on non-curated image patches representing the entire slide.
Results: At the tile level, the AI-diagnostic tool achieved 95.5% accuracy for classification of Conventional versus Spitz-type nevi in the pathologist-curated test set. Performance was significantly worse in the non-curated image patches servied directly from whole-slide images, with only 82.3% accuracy after 1 million iterations.
Conclusions: These data provide strong evidence for the potential utility of artificial intelligence to enhance diagnosis in digital pathology. The current data supports the development of pathologist-guided tool, as at present the classifier does not achieve high accuracy with undirected evaluation of all image patches extracted from whole slides images. Work on whole slide classification and adding measures of uncertainty are ongoing.

USCAP ABSTRACTSGEARED LEARNTO107TH ANNUAL MEETING 596
1654 Comparison of a Medical Grade Display Versus Commercial Off-The-Shelf Display for Mitotic Figure Enumeration and Small Object (Helicobacter Pylori) Detection
Andrew Norgan1, Vera J Suman2, Charlene L Brown2, Thomas Flotte1, Taofic Mounajjed1. 1Mayo Clinic, Rochester, MN, 2Mayo Clinic
Background: As the field of radiology transitioned to digital images, it was determined that use of calibrated grayscale medical-grade displays improved the quality of diagnostic interpretation. With the advent of clinical whole slide imaging, it must now determine which display and image characteristics impact the quality of pathologic diagnosis. To examine this question in part, we assessed the impact of using a medical grade versus commercial off-the-shelf monitor on the ability of pathologists to identify and quantify small, but clinically relevant, diagnostic features: mitotic figure enumeration in malignant melanoma and Helicobacter pylori quantification in stomach biopsies.
Design: Pathologists’ performance and preferences using a medical-grade color-calibrated display versus commercial off-the-shelf display were assessed using regions of interest selected from 35 skin biopsies (diagnosis: melanoma) and 35 gastric biopsies. Pathologists reviewed the melanoma or gastric biopsy cases in a blinded fashion using the two displays, with a two-week washout period. Mitotic figure (melanoma) or H. pylori (gastric) enumerations were compared with reference counts determined by an expert dermatopathologist or gastrointestinal pathologist using a light microscope. Subjective evaluations of color, brightness and overall quality were also recorded.
Results: Substantial agreement was observed between the mitotic counts obtained by the evaluating pathologists using either monitor and the expert mitotic or H. pylori counts. Substantial agreement was also seen between the mitotic counts or H. pylori burden assessments obtained with the two monitors. Six of the nine evaluating pathologists evaluated the monitors as equivocal in terms of color, brightness and overall quality.
Conclusions: These findings are consistent with those of prior studies that demonstrated a limited role for color calibration in diagnostic pathology accuracy, and suggest no significant negative impact in using non-calibrated displays for either of these detailed assessment tasks. Medical-grade color-calibrated displays and commercial off-the-shelf displays be subjectively equivalent in color and other characteristics when viewed by pathologists.
1655 Low-Cost Compute Cluster for Production-Grade Molecular Informatics Applications - Is It Realistic?
Somak Roy1, Yuri Nikiforov2, Marina Nikiforova3, Liron Pantanowitz4 1University of Pittsburgh Medical Center, Allison Park, PA, 2University of Pittsburgh Medical Center, Pittsburgh, PA, 3University of Pittsburgh Medical Center, 4Wexford, PA
Background: High-performance computing (HPC) is a requirement for processing genomic data in clinical and research applications. Typically, a production-grade HPC environment can be provided by a multi-core, high memory standalone server or a HPC cluster. HPC resources, regardless of the hardware type, are expensive and thus require substantial capital investment for acquisition and maintenance. During the past few years, credit card-sized single board computers (e.g. Raspberry Pi and alternatives) have gained immense popularity for rapid prototyping and educational use cases, including cluster computing.
Design: We constructed a 5 node compute cluster using Raspberry Pi 3 Model B+ and a 10/100Mbps Ethernet network (Figures 1 and 2). The cost for the entire hardware setup was $267. We deployed a simple web application (Python and Flask) to demonstrate DNA sequence variant annotation using ANNOVAR. RefSeq gene and ExAC databases were used for variant annotation. Standard libraries for Python v2.7 and Perl v5 were employed as dependencies for web application and ANNOVAR, respectively. The web application was deployed using a production-grade container orchestration platform, Docker Swarm.
Results: The final cluster configuration yielded a total of 20 single threaded CPUs with 5GB RAM and 96GB HCSD disk space. There were 1 head (master) node, 3 worker nodes and 1 NFS share node for storage. The entire cluster was powered using a low voltage (5 volts, 12 amp) USB power supply. For variant annotation, standard ANNOVAR compatible VCF input was used. The output consisted of gene name, variant location, cytoband and ExAC population minor allele frequency information for each variant. A total of 21 variants were submitted in a single batch job over 5 iterations. Average time to annotate all 21 variants was 51.4 seconds. Upon submitting the job repeatedly, the performance remained unchanged. CPU and memory usage across the cluster were approximately 10% and 25%, respectively, of the total capacity. Average base and operational CPU temperatures were approximately 36C and 45.6C, respectively.
Conclusions: This use case example demonstrates the capability of exploiting a cheap, small compute cluster to effectively perform a basic, but commonly used, bioinformatics task of variant annotation in NGS assays. It is possible to also use production-grade web application deployment tools, such as Docker Swarm, in a cheap multi-node cluster to orchestrate web application deployment and management.
1656 Leveraging Digital Pathology to Identify Biomarkers in Ewing Sarcoma
Daryoush Saeed-Vafa1, Andrew S Brohl1, Yin Xiong2, Anthony Magliocco3, Marilyn Bui3. 1H. Lee Moffitt Cancer Center & Research Institute, Tampa, FL, 2Moffitt Cancer Center, 3H. Lee Moffitt Cancer Ctr, Tampa, FL
Background: With the advancement of multispectral immunofluorescence (IF) scanners, IF staining assays on formalin-fixed paraffin-embedded tissue, whole slide imaging (WSI), and DIA (digital image analysis) software, extremely precise measurements of protein biomarkers can be made in a unique way not previously available. We intended to develop an approach to use the above methods to evaluate a biomarker in Ewing sarcoma (ES), a devastating disease with a lack of predictive and prognostic biomarkers, in order to lend validity to this process of biomarker discovery in a Clinical Laboratory Improvement Amendments (CLIA) certified environment.
Design: Metallopanstimulin-1 (RPS27) has been shown to be increased expression in a variety of cancers and as such was selected as our ES biomarker of interest. A tissue microarray slide with 21 unique ES patient’s biopsies was chosen. RPS27 expression was studied via an IF assay. A virtual slide was created via the Aperio ScanScope FL scanner. DIA was used to quantify RPS27 expression via Automated Quantitative Software Analysis (AQUA) with a specific algorithm targeting ES cells. An optimal cutoff point for RPS27 AQUA scores for disease-free survival (DFS) was determined (254, the median); therefore, the patients were grouped as low (0-254) or high (>254) expressers. Survival endpoints were compared between expression subgroups using Kaplan-Meier analysis. Multivariate survival analysis was performed utilizing RPS27 AQUA scores, age, sex, stage, and treatments with surgery, radiation, and/or chemotherapy.
Results: Twenty-one unique patients ranging from 17-72 years (mean=43.6, median=40.5), along with the clinical data, were analyzed. DFS significantly differed between the low as compared to high expressers, with median DFS times of 56.8 months and 10.7 months, respectively (HR:3.64, 95% CI:1.27-10.48, p=0.004, Figure 1). By multivariate analysis, an increasing RPS27 level significantly correlated with a decreasing chance of overall survival (HR:1.01, p=0.002).
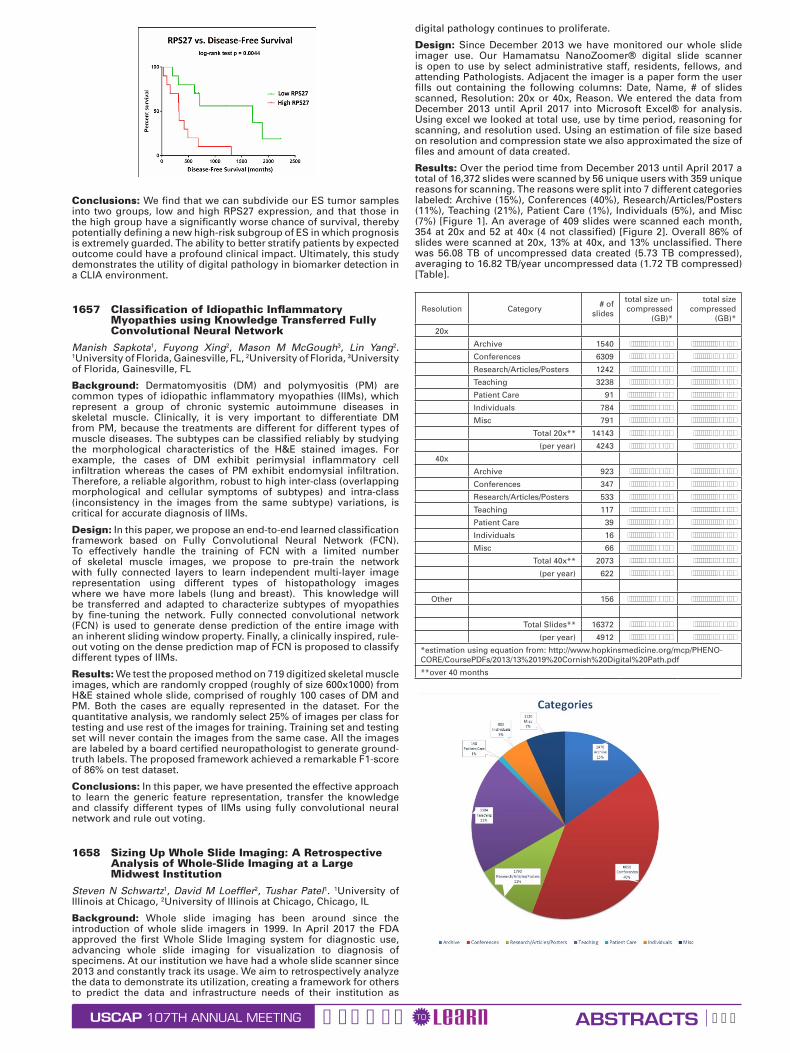
USCAP ABSTRACTSGEARED LEARNTO107TH ANNUAL MEETING 597
Conclusions: We find that we can subdivide our ES tumor samples into two groups, low and high RPS27 expression, and that those in the high group have a significantly worse chance of survival, thereby potentially defining a new high-risk subgroup of ES in which prognosis is extremely guarded. The ability to better stratify patients by expected outcome could have a profound clinical impact. Ultimately, this study demonstrates the utility of digital pathology in biomarker detection in a CLIA environment.
1657 Classification of Idiopathic Inflammatory Myopathies using Knowledge Transferred Fully Convolutional Neural Network
Manish Sapkota1, Fuyong Xing2, Mason M McGough3, Lin Yang2. 1University of Florida, Gainesville, FL, 2University of Florida, 3University of Florida, Gainesville, FL
Background: Dermatomyositis (DM) and polymyositis (PM) are common types of idiopathic inflammatory myopathies (IIMs), which represent a group of chronic systemic autoimmune diseases in skeletal muscle. Clinically, it is very important to differentiate DM from PM, because the treatments are different for different types of muscle diseases. The subtypes can be classified reliably by studying the morphological characteristics of the H&E stained images. For example, the cases of DM exhibit perimysial inflammatory cell infiltration whereas the cases of PM exhibit endomysial infiltration. Therefore, a reliable algorithm, robust to high inter-class (overlapping morphological and cellular symptoms of subtypes) and intra-class (inconsistency in the images from the same subtype) variations, is critical for accurate diagnosis of IIMs.
Design: In this paper, we propose an end-to-end learned classification framework based on Fully Convolutional Neural Network (FCN). To effectively handle the training of FCN with a limited number of skeletal muscle images, we propose to pre-train the network with fully connected layers to learn independent multi-layer image representation using different types of histopathology images where we have more labels (lung and breast). This knowledge will be transferred and adapted to characterize subtypes of myopathies by fine-tuning the network. Fully connected convolutional network (FCN) is used to generate dense prediction of the entire image with an inherent sliding window property. Finally, a clinically inspired, rule-out voting on the dense prediction map of FCN is proposed to classify different types of IIMs.
Results: We test the proposed method on 719 digitized skeletal muscle images, which are randomly cropped (roughly of size 600x1000) from H&E stained whole slide, comprised of roughly 100 cases of DM and PM. Both the cases are equally represented in the dataset. For the quantitative analysis, we randomly select 25% of images per class for testing and use rest of the images for training. Training set and testing set will never contain the images from the same case. All the images are labeled by a board certified neuropathologist to generate ground-truth labels. The proposed framework achieved a remarkable F1-score of 86% on test dataset.
Conclusions: In this paper, we have presented the effective approach to learn the generic feature representation, transfer the knowledge and classify different types of IIMs using fully convolutional neural network and rule out voting.
1658 Sizing Up Whole Slide Imaging: A Retrospective Analysis of Whole-Slide Imaging at a Large Midwest Institution
Steven N Schwartz1, David M Loeffler2, Tushar Patel1. 1University of Illinois at Chicago, 2University of Illinois at Chicago, Chicago, IL
Background: Whole slide imaging has been around since the introduction of whole slide imagers in 1999. In April 2017 the FDA approved the first Whole Slide Imaging system for diagnostic use, advancing whole slide imaging for visualization to diagnosis of specimens. At our institution we have had a whole slide scanner since 2013 and constantly track its usage. We aim to retrospectively analyze the data to demonstrate its utilization, creating a framework for others to predict the data and infrastructure needs of their institution as
digital pathology continues to proliferate.
Design: Since December 2013 we have monitored our whole slide imager use. Our Hamamatsu NanoZoomer® digital slide scanner is open to use by select administrative staff, residents, fellows, and attending Pathologists. Adjacent the imager is a paper form the user fills out containing the following columns: Date, Name, # of slides scanned, Resolution: 20x or 40x, Reason. We entered the data from December 2013 until April 2017 into Microsoft Excel® for analysis. Using excel we looked at total use, use by time period, reasoning for scanning, and resolution used. Using an estimation of file size based on resolution and compression state we also approximated the size of files and amount of data created.
Results: Over the period time from December 2013 until April 2017 a total of 16,372 slides were scanned by 56 unique users with 359 unique reasons for scanning. The reasons were split into 7 different categories labeled: Archive (15%), Conferences (40%), Research/Articles/Posters (11%), Teaching (21%), Patient Care (1%), Individuals (5%), and Misc (7%) [Figure 1]. An average of 409 slides were scanned each month, 354 at 20x and 52 at 40x (4 not classified) [Figure 2]. Overall 86% of slides were scanned at 20x, 13% at 40x, and 13% unclassified. There was 56.08 TB of uncompressed data created (5.73 TB compressed), averaging to 16.82 TB/year uncompressed data (1.72 TB compressed) [Table].
Resolution Category # of slides
total size un-compressed
(GB)*
total size compressed
(GB)*
20x
Archive 1540 3,849.58 394.20
Conferences 6309 15,773.33 1,615.19
Research/Articles/Posters 1242 3,104.38 317.89
Teaching 3238 8,094.58 828.89
Patient Care 91 226.88 23.23
Individuals 784 1,960.00 200.70
Misc 791 1,976.25 202.37
Total 20x** 14143 35,357.50 3,620.61
(per year) 4243 10,607.25 1,086.18
40x
Archive 923 9,225.00 922.50
Conferences 347 3,465.00 346.50
Research/Articles/Posters 533 5,327.50 532.75
Teaching 117 1,168.33 116.83
Patient Care 39 389.17 38.92
Individuals 16 155.00 15.50
Misc 66 660.00 66.00
Total 40x** 2073 20,730.00 2,073.00
(per year) 622 6,219.00 621.90
Other 156 390.00 39.94
Total Slides** 16372 56,087.50 5,733.54
(per year) 4912 16,826.25 1,720.06
*estimation using equation from: http://www.hopkinsmedicine.org/mcp/PHENO-CORE/CoursePDFs/2013/13%2019%20Cornish%20Digital%20Path.pdf
**over 40 months
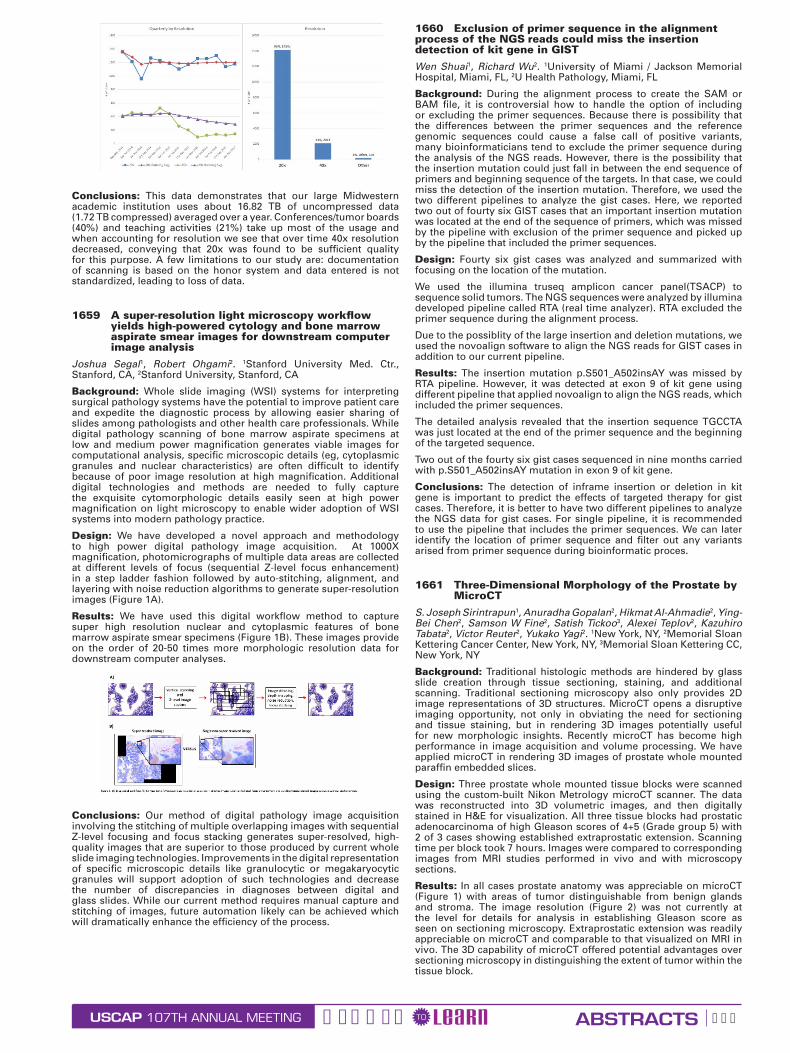
USCAP ABSTRACTSGEARED LEARNTO107TH ANNUAL MEETING 598
Conclusions: This data demonstrates that our large Midwestern academic institution uses about 16.82 TB of uncompressed data (1.72 TB compressed) averaged over a year. Conferences/tumor boards (40%) and teaching activities (21%) take up most of the usage and when accounting for resolution we see that over time 40x resolution decreased, conveying that 20x was found to be sufficient quality for this purpose. A few limitations to our study are: documentation of scanning is based on the honor system and data entered is not standardized, leading to loss of data.
1659 A super-resolution light microscopy workflow yields high-powered cytology and bone marrow aspirate smear images for downstream computer image analysis
Joshua Segal1, Robert Ohgami2. 1Stanford University Med. Ctr., Stanford, CA, 2Stanford University, Stanford, CA
Background: Whole slide imaging (WSI) systems for interpreting surgical pathology systems have the potential to improve patient care and expedite the diagnostic process by allowing easier sharing of slides among pathologists and other health care professionals. While digital pathology scanning of bone marrow aspirate specimens at low and medium power magnification generates viable images for computational analysis, specific microscopic details (eg, cytoplasmic granules and nuclear characteristics) are often difficult to identify because of poor image resolution at high magnification. Additional digital technologies and methods are needed to fully capture the exquisite cytomorphologic details easily seen at high power magnification on light microscopy to enable wider adoption of WSI systems into modern pathology practice.
Design: We have developed a novel approach and methodology to high power digital pathology image acquisition. At 1000X magnification, photomicrographs of multiple data areas are collected at different levels of focus (sequential Z-level focus enhancement) in a step ladder fashion followed by auto-stitching, alignment, and layering with noise reduction algorithms to generate super-resolution images (Figure 1A).
Results: We have used this digital workflow method to capture super high resolution nuclear and cytoplasmic features of bone marrow aspirate smear specimens (Figure 1B). These images provide on the order of 20-50 times more morphologic resolution data for downstream computer analyses.
Conclusions: Our method of digital pathology image acquisition involving the stitching of multiple overlapping images with sequential Z-level focusing and focus stacking generates super-resolved, high-quality images that are superior to those produced by current whole slide imaging technologies. Improvements in the digital representation of specific microscopic details like granulocytic or megakaryocytic granules will support adoption of such technologies and decrease the number of discrepancies in diagnoses between digital and glass slides. While our current method requires manual capture and stitching of images, future automation likely can be achieved which will dramatically enhance the efficiency of the process.
1660 Exclusion of primer sequence in the alignment process of the NGS reads could miss the insertion detection of kit gene in GISTWen Shuai1, Richard Wu2. 1University of Miami / Jackson Memorial Hospital, Miami, FL, 2U Health Pathology, Miami, FL
Background: During the alignment process to create the SAM or BAM file, it is controversial how to handle the option of including or excluding the primer sequences. Because there is possibility that the differences between the primer sequences and the reference genomic sequences could cause a false call of positive variants, many bioinformaticians tend to exclude the primer sequence during the analysis of the NGS reads. However, there is the possibility that the insertion mutation could just fall in between the end sequence of primers and beginning sequence of the targets. In that case, we could miss the detection of the insertion mutation. Therefore, we used the two different pipelines to analyze the gist cases. Here, we reported two out of fourty six GIST cases that an important insertion mutation was located at the end of the sequence of primers, which was missed by the pipeline with exclusion of the primer sequence and picked up by the pipeline that included the primer sequences.
Design: Fourty six gist cases was analyzed and summarized with focusing on the location of the mutation.
We used the illumina truseq amplicon cancer panel(TSACP) to sequence solid tumors. The NGS sequences were analyzed by illumina developed pipeline called RTA (real time analyzer). RTA excluded the primer sequence during the alignment process.
Due to the possiblity of the large insertion and deletion mutations, we used the novoalign software to align the NGS reads for GIST cases in addition to our current pipeline.
Results: The insertion mutation p.S501_A502insAY was missed by RTA pipeline. However, it was detected at exon 9 of kit gene using different pipeline that applied novoalign to align the NGS reads, which included the primer sequences.
The detailed analysis revealed that the insertion sequence TGCCTA was just located at the end of the primer sequence and the beginning of the targeted sequence.
Two out of the fourty six gist cases sequenced in nine months carried with p.S501_A502insAY mutation in exon 9 of kit gene.
Conclusions: The detection of inframe insertion or deletion in kit gene is important to predict the effects of targeted therapy for gist cases. Therefore, it is better to have two different pipelines to analyze the NGS data for gist cases. For single pipeline, it is recommended to use the pipeline that includes the primer sequences. We can later identify the location of primer sequence and filter out any variants arised from primer sequence during bioinformatic proces.
1661 Three-Dimensional Morphology of the Prostate by MicroCT
S. Joseph Sirintrapun1, Anuradha Gopalan2, Hikmat Al-Ahmadie2, Ying-Bei Chen2, Samson W Fine2, Satish Tickoo3, Alexei Teplov2, Kazuhiro Tabata2, Victor Reuter2, Yukako Yagi2. 1New York, NY, 2Memorial Sloan Kettering Cancer Center, New York, NY, 3Memorial Sloan Kettering CC, New York, NY
Background: Traditional histologic methods are hindered by glass slide creation through tissue sectioning, staining, and additional scanning. Traditional sectioning microscopy also only provides 2D image representations of 3D structures. MicroCT opens a disruptive imaging opportunity, not only in obviating the need for sectioning and tissue staining, but in rendering 3D images potentially useful for new morphologic insights. Recently microCT has become high performance in image acquisition and volume processing. We have applied microCT in rendering 3D images of prostate whole mounted paraffin embedded slices.
Design: Three prostate whole mounted tissue blocks were scanned using the custom-built Nikon Metrology microCT scanner. The data was reconstructed into 3D volumetric images, and then digitally stained in H&E for visualization. All three tissue blocks had prostatic adenocarcinoma of high Gleason scores of 4+5 (Grade group 5) with 2 of 3 cases showing established extraprostatic extension. Scanning time per block took 7 hours. Images were compared to corresponding images from MRI studies performed in vivo and with microscopy sections.
Results: In all cases prostate anatomy was appreciable on microCT (Figure 1) with areas of tumor distinguishable from benign glands and stroma. The image resolution (Figure 2) was not currently at the level for details for analysis in establishing Gleason score as seen on sectioning microscopy. Extraprostatic extension was readily appreciable on microCT and comparable to that visualized on MRI in vivo. The 3D capability of microCT offered potential advantages over sectioning microscopy in distinguishing the extent of tumor within the tissue block.
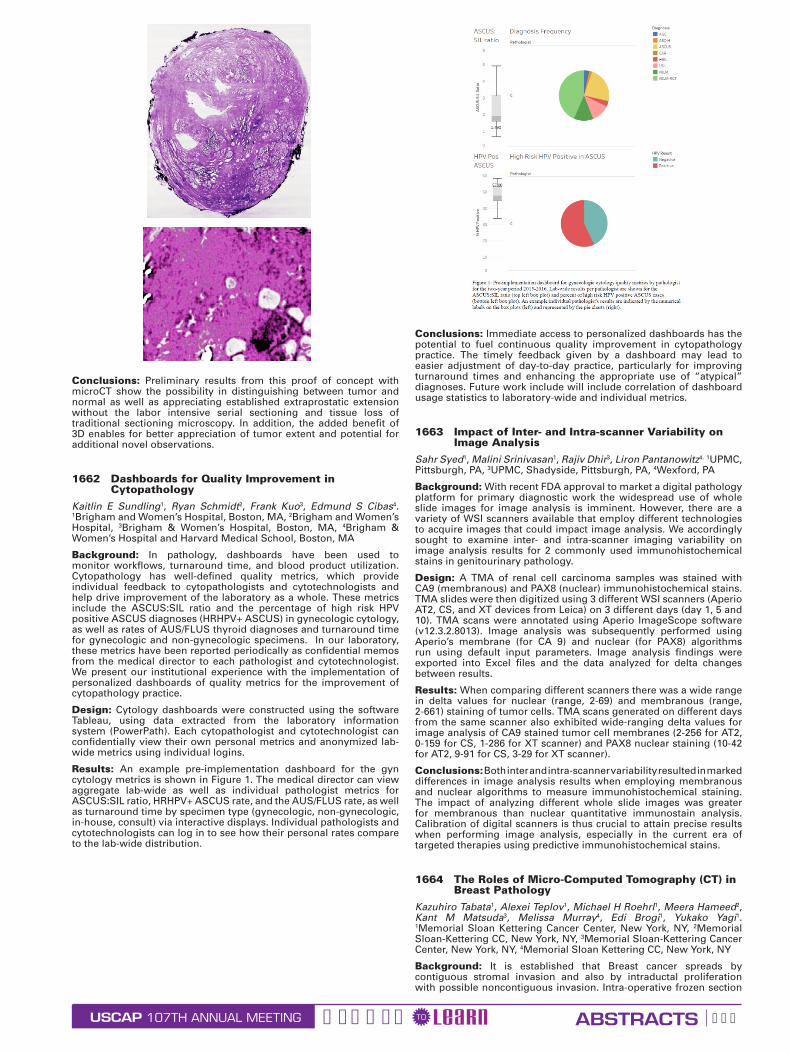
USCAP ABSTRACTSGEARED LEARNTO107TH ANNUAL MEETING 599
Conclusions: Preliminary results from this proof of concept with microCT show the possibility in distinguishing between tumor and normal as well as appreciating established extraprostatic extension without the labor intensive serial sectioning and tissue loss of traditional sectioning microscopy. In addition, the added benefit of 3D enables for better appreciation of tumor extent and potential for additional novel observations.
1662 Dashboards for Quality Improvement in Cytopathology
Kaitlin E Sundling1, Ryan Schmidt2, Frank Kuo3, Edmund S Cibas4. 1Brigham and Women’s Hospital, Boston, MA, 2Brigham and Women’s Hospital, 3Brigham & Women’s Hospital, Boston, MA, 4Brigham & Women’s Hospital and Harvard Medical School, Boston, MA
Background: In pathology, dashboards have been used to monitor workflows, turnaround time, and blood product utilization. Cytopathology has well-defined quality metrics, which provide individual feedback to cytopathologists and cytotechnologists and help drive improvement of the laboratory as a whole. These metrics include the ASCUS:SIL ratio and the percentage of high risk HPV positive ASCUS diagnoses (HRHPV+ ASCUS) in gynecologic cytology, as well as rates of AUS/FLUS thyroid diagnoses and turnaround time for gynecologic and non-gynecologic specimens. In our laboratory, these metrics have been reported periodically as confidential memos from the medical director to each pathologist and cytotechnologist. We present our institutional experience with the implementation of personalized dashboards of quality metrics for the improvement of cytopathology practice.
Design: Cytology dashboards were constructed using the software Tableau, using data extracted from the laboratory information system (PowerPath). Each cytopathologist and cytotechnologist can confidentially view their own personal metrics and anonymized lab-wide metrics using individual logins.
Results: An example pre-implementation dashboard for the gyn cytology metrics is shown in Figure 1. The medical director can view aggregate lab-wide as well as individual pathologist metrics for ASCUS:SIL ratio, HRHPV+ ASCUS rate, and the AUS/FLUS rate, as well as turnaround time by specimen type (gynecologic, non-gynecologic, in-house, consult) via interactive displays. Individual pathologists and cytotechnologists can log in to see how their personal rates compare to the lab-wide distribution.
Conclusions: Immediate access to personalized dashboards has the potential to fuel continuous quality improvement in cytopathology practice. The timely feedback given by a dashboard may lead to easier adjustment of day-to-day practice, particularly for improving turnaround times and enhancing the appropriate use of “atypical” diagnoses. Future work include will include correlation of dashboard usage statistics to laboratory-wide and individual metrics.
1663 Impact of Inter- and Intra-scanner Variability on Image Analysis
Sahr Syed1, Malini Srinivasan1, Rajiv Dhir3, Liron Pantanowitz4. 1UPMC, Pittsburgh, PA, 3UPMC, Shadyside, Pittsburgh, PA, 4Wexford, PA
Background: With recent FDA approval to market a digital pathology platform for primary diagnostic work the widespread use of whole slide images for image analysis is imminent. However, there are a variety of WSI scanners available that employ different technologies to acquire images that could impact image analysis. We accordingly sought to examine inter- and intra-scanner imaging variability on image analysis results for 2 commonly used immunohistochemical stains in genitourinary pathology.
Design: A TMA of renal cell carcinoma samples was stained with CA9 (membranous) and PAX8 (nuclear) immunohistochemical stains. TMA slides were then digitized using 3 different WSI scanners (Aperio AT2, CS, and XT devices from Leica) on 3 different days (day 1, 5 and 10). TMA scans were annotated using Aperio ImageScope software (v12.3.2.8013). Image analysis was subsequently performed using Aperio’s membrane (for CA 9) and nuclear (for PAX8) algorithms run using default input parameters. Image analysis findings were exported into Excel files and the data analyzed for delta changes between results.
Results: When comparing different scanners there was a wide range in delta values for nuclear (range, 2-69) and membranous (range, 2-661) staining of tumor cells. TMA scans generated on different days from the same scanner also exhibited wide-ranging delta values for image analysis of CA9 stained tumor cell membranes (2-256 for AT2, 0-159 for CS, 1-286 for XT scanner) and PAX8 nuclear staining (10-42 for AT2, 9-91 for CS, 3-29 for XT scanner).
Conclusions: Both inter and intra-scanner variability resulted in marked differences in image analysis results when employing membranous and nuclear algorithms to measure immunohistochemical staining. The impact of analyzing different whole slide images was greater for membranous than nuclear quantitative immunostain analysis. Calibration of digital scanners is thus crucial to attain precise results when performing image analysis, especially in the current era of targeted therapies using predictive immunohistochemical stains.
1664 The Roles of Micro-Computed Tomography (CT) in Breast Pathology
Kazuhiro Tabata1, Alexei Teplov1, Michael H Roehrl1, Meera Hameed2, Kant M Matsuda3, Melissa Murray4, Edi Brogi1, Yukako Yagi1. 1Memorial Sloan Kettering Cancer Center, New York, NY, 2Memorial Sloan-Kettering CC, New York, NY, 3Memorial Sloan-Kettering Cancer Center, New York, NY, 4Memorial Sloan Kettering CC, New York, NY
Background: It is established that Breast cancer spreads by contiguous stromal invasion and also by intraductal proliferation with possible noncontiguous invasion. Intra-operative frozen section
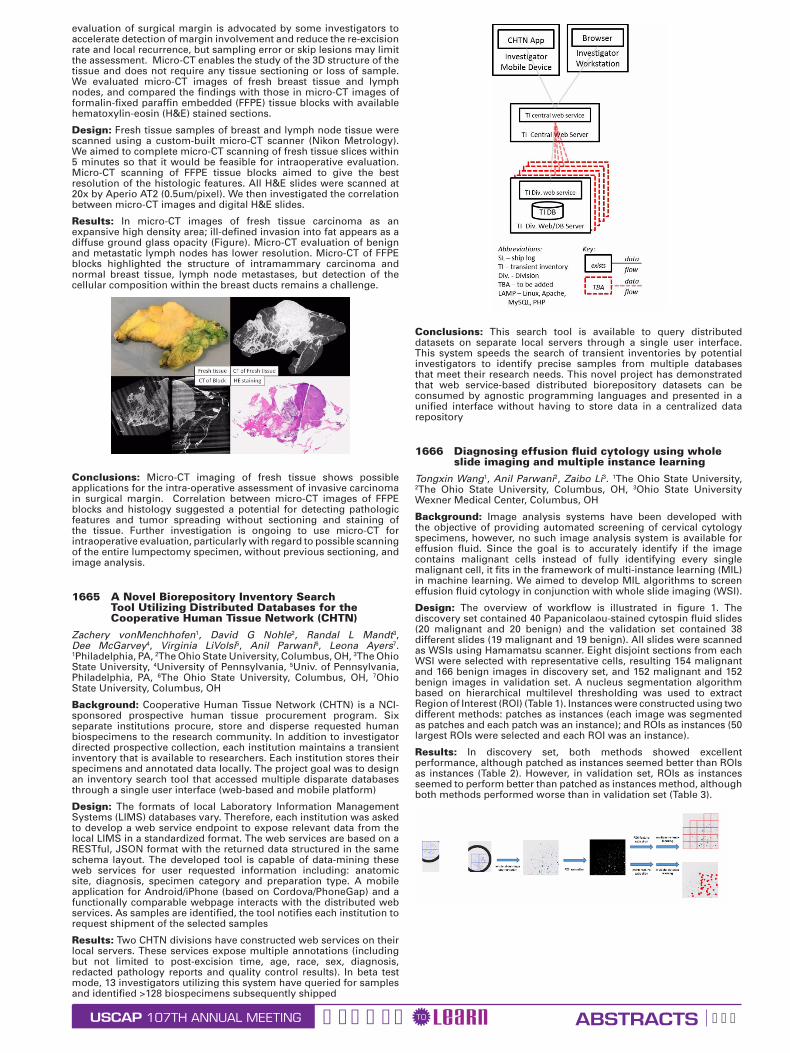
USCAP ABSTRACTSGEARED LEARNTO107TH ANNUAL MEETING 600
evaluation of surgical margin is advocated by some investigators to accelerate detection of margin involvement and reduce the re-excision rate and local recurrence, but sampling error or skip lesions may limit the assessment. Micro-CT enables the study of the 3D structure of the tissue and does not require any tissue sectioning or loss of sample. We evaluated micro-CT images of fresh breast tissue and lymph nodes, and compared the findings with those in micro-CT images of formalin-fixed paraffin embedded (FFPE) tissue blocks with available hematoxylin-eosin (H&E) stained sections.
Design: Fresh tissue samples of breast and lymph node tissue were scanned using a custom-built micro-CT scanner (Nikon Metrology). We aimed to complete micro-CT scanning of fresh tissue slices within 5 minutes so that it would be feasible for intraoperative evaluation. Micro-CT scanning of FFPE tissue blocks aimed to give the best resolution of the histologic features. All H&E slides were scanned at 20x by Aperio AT2 (0.5um/pixel). We then investigated the correlation between micro-CT images and digital H&E slides.
Results: In micro-CT images of fresh tissue carcinoma as an expansive high density area; ill-defined invasion into fat appears as a diffuse ground glass opacity (Figure). Micro-CT evaluation of benign and metastatic lymph nodes has lower resolution. Micro-CT of FFPE blocks highlighted the structure of intramammary carcinoma and normal breast tissue, lymph node metastases, but detection of the cellular composition within the breast ducts remains a challenge.
Conclusions: Micro-CT imaging of fresh tissue shows possible applications for the intra-operative assessment of invasive carcinoma in surgical margin. Correlation between micro-CT images of FFPE blocks and histology suggested a potential for detecting pathologic features and tumor spreading without sectioning and staining of the tissue. Further investigation is ongoing to use micro-CT for intraoperative evaluation, particularly with regard to possible scanning of the entire lumpectomy specimen, without previous sectioning, and image analysis.
1665 A Novel Biorepository Inventory Search Tool Utilizing Distributed Databases for the Cooperative Human Tissue Network (CHTN)
Zachery vonMenchhofen1, David G Nohle2, Randal L Mandt3, Dee McGarvey4, Virginia LiVolsi5, Anil Parwani6, Leona Ayers7. 1Philadelphia, PA, 2The Ohio State University, Columbus, OH, 3The Ohio State University, 4University of Pennsylvania, 5Univ. of Pennsylvania, Philadelphia, PA, 6The Ohio State University, Columbus, OH, 7Ohio State University, Columbus, OH
Background: Cooperative Human Tissue Network (CHTN) is a NCI-sponsored prospective human tissue procurement program. Six separate institutions procure, store and disperse requested human biospecimens to the research community. In addition to investigator directed prospective collection, each institution maintains a transient inventory that is available to researchers. Each institution stores their specimens and annotated data locally. The project goal was to design an inventory search tool that accessed multiple disparate databases through a single user interface (web-based and mobile platform)
Design: The formats of local Laboratory Information Management Systems (LIMS) databases vary. Therefore, each institution was asked to develop a web service endpoint to expose relevant data from the local LIMS in a standardized format. The web services are based on a RESTful, JSON format with the returned data structured in the same schema layout. The developed tool is capable of data-mining these web services for user requested information including: anatomic site, diagnosis, specimen category and preparation type. A mobile application for Android/iPhone (based on Cordova/PhoneGap) and a functionally comparable webpage interacts with the distributed web services. As samples are identified, the tool notifies each institution to request shipment of the selected samples
Results: Two CHTN divisions have constructed web services on their local servers. These services expose multiple annotations (including but not limited to post-excision time, age, race, sex, diagnosis, redacted pathology reports and quality control results). In beta test mode, 13 investigators utilizing this system have queried for samples and identified >128 biospecimens subsequently shipped
Conclusions: This search tool is available to query distributed datasets on separate local servers through a single user interface. This system speeds the search of transient inventories by potential investigators to identify precise samples from multiple databases that meet their research needs. This novel project has demonstrated that web service-based distributed biorepository datasets can be consumed by agnostic programming languages and presented in a unified interface without having to store data in a centralized data repository
1666 Diagnosing effusion fluid cytology using whole slide imaging and multiple instance learning
Tongxin Wang1, Anil Parwani2, Zaibo Li3. 1The Ohio State University, 2The Ohio State University, Columbus, OH, 3Ohio State University Wexner Medical Center, Columbus, OH
Background: Image analysis systems have been developed with the objective of providing automated screening of cervical cytology specimens, however, no such image analysis system is available for effusion fluid. Since the goal is to accurately identify if the image contains malignant cells instead of fully identifying every single malignant cell, it fits in the framework of multi-instance learning (MIL) in machine learning. We aimed to develop MIL algorithms to screen effusion fluid cytology in conjunction with whole slide imaging (WSI).
Design: The overview of workflow is illustrated in figure 1. The discovery set contained 40 Papanicolaou-stained cytospin fluid slides (20 malignant and 20 benign) and the validation set contained 38 different slides (19 malignant and 19 benign). All slides were scanned as WSIs using Hamamatsu scanner. Eight disjoint sections from each WSI were selected with representative cells, resulting 154 malignant and 166 benign images in discovery set, and 152 malignant and 152 benign images in validation set. A nucleus segmentation algorithm based on hierarchical multilevel thresholding was used to extract Region of Interest (ROI) (Table 1). Instances were constructed using two different methods: patches as instances (each image was segmented as patches and each patch was an instance); and ROIs as instances (50 largest ROIs were selected and each ROI was an instance).
Results: In discovery set, both methods showed excellent performance, although patched as instances seemed better than ROIs as instances (Table 2). However, in validation set, ROIs as instances seemed to perform better than patched as instances method, although both methods performed worse than in validation set (Table 3).

USCAP ABSTRACTSGEARED LEARNTO107TH ANNUAL MEETING 601
Conclusions: Our data suggest that MIL can be utilized to accurately screen effusion fluid, although further improvement of our MIL algorithms is warranted.
1667 Pathology Perspective on Gynecologic Malignancy Screening Questions Asked Through an Electronic Consultation Service
Carol Wang1, Clare Liddy2, Shahidul Islam3, Amir Afkham2, Fady Shehata2, Glenn Posner2, Erin Keely2. 1University of Ottawa, Ottawa, ON, 2University of Ottawa, 3Ottawa Hospital /University of Ottawa, Ottawa, ON
Background: The electronic consultation (eConsult) platform has been proposed as a potential solution to prolonged wait times for specialist consultation, a major issue in the Canadian healthcare system. The eConsult service is an asynchronous web-based platform for provider to provider consultation with specialists. Multiple medical and surgical specialties are currently accessible through the eConsult service but there is a paucity of literature on the involvement of surgical pathologists in such platforms with primary care physicians (PCPs). However, PCPs may have questions such as interpretation of pathology reports that may be best directed at pathologists. This study described the utilization of eConsult by PCPs to obtain specialist opinion in gynecologic malignancy screening, with a specific focus on pathology-related inquiries.
Design: This is a cross sectional retrospective review of eConsults submitted to obstetrics/gynecology between September 2011 to December 2016. All questions pertaining to cervical and endometrial cancer screening and their associated pathologies were included. Each question was classified based on a pre-determined taxonomy, which included the indications and interpretation of screening tests as well as patient management. The mandatory PCP exit surveys were analyzed to determine the influence of eConsult on patient care, PCP’s referral patterns, level of PCP satisfaction and its educational value.
Results: 1357 eConsults were submitted to the obstetrics and gynecology service between September 2011 to December 2016 and 329 cases met the inclusion/exclusion criteria. Indications for a screening test based on patient risk factors made up 35.6% of consults pertaining to gynecologic malignancy screening and 16.8% were inquiries about test intervals based on previous results. PCPs directly and indirectly pointed out gaps in current screening guidelines. 38.0% of PCPs reported the eConsult service helped avoid a specialist referral while 47.1% of PCPs received new or additional course of action. Pathology report interpretation accounted for 5% of eConsults and 5.7% of PCPs wished for clarification of incidental findings on pathology. Overall, the eConsult service was highly valued by PCPs.
Conclusions: This study uncovered areas of uncertainty PCPs have towards gynecologic cancer screening and gaps in current clinical guidelines. Furthermore, the role of pathology consultants in an eConsult platform is explored and may be extrapolated into practice.
1668 International Telepathology Consultation: analysis of 428 gynecological cases between KingMed Diagnostics (China) and University of Pittsburgh Medical Center
Tao Wu1, Xiangdong Ding2, Zhikui Zhang2, Yue Wu2, Chengquan Zhao3. 1KingMed Diagnostics, Guangzhou, Guangdong, 2KingMed Diagnostics, 3Magee-Womens Hospital of UPMC, Pittsburgh, PA
Background: Data about telepathology consultation service in facilitating the diagnosis of subspecialities is very limited. KingMed Diagnostics is the largest CAP-certified independent medical laboratory in China, with 35 central branches through the country.
Since 2012, an international telepathology consultation service has been established between KingMed Diagnostics and University of Pittsburgh Medical Center (UPMC).
Design: This is a retrospective study to analyze international telepathology results about gynecological cases from January 2012 to August 2017.
Results: A total of 3407 cases were submitted for telepathology consultation during this study period. Of these cases, 428 gynecological cases were collected from 28 central laboratories of KingMed and most of them were submitted by local community hospitals, including 185 uterine corpus cases, 117 ovarian/tubal cases, 62 cervical cases, 37 vaginal/vulvar cases, 21 pelvic/peritoneal cases and 6 other cases. The average turnaround time (TAT) was 3.6 days (median 3.0 days). 176/428 (41.1%) cases were diagnosed as malignancies, including 36.8% of uterine corpus cases, 40.2% of ovarian/tubal cases, 45.2% of cervical cases, 32.4% of vaginal/vulvar cases, 76.2% of pelvic/peritoneal cases, 83.3% of other cases, respectively. Totally 69.6% of cases have a definite diagnosis, including 176 (95.1%) uterine corpus cases, 108 (92.3%) ovarian/tubal cases, 58 (93.5%) cervical cases, 31 (83.8%) vaginal/vulvar cases, 20 (95.2%) pelvic/peritoneal cases and 6 (83.3%) other cases. 131 (30.6%) cases were sent for consultation without primary diagnosis. Among 297 cases with primary diagnosis or impression, the final diagnoses were identical or similar in 70.4% of cases and significantly modified in 29.6% of cases which might affect the clinical management (See table 1).
Table 1 Compared diagnosis between KingMed Diagnostics and UPMC
Uterine corpus
Ovary/Tube Cervix Vagina/
VulvaPelvic/
Peritoneal Others Total
Identi-cal or
similar
87
(71.3%)
58
(65.2%)
33
(75.0%)
15
(71.4%)
13
(76.5%)
3
(75.0%)
209
(70.4%)
Signif-icant modi-fied
35
(28.7%)
31
(34.8%)
11
(25.0%)
6
(28.6%)
4
(23.5%)
1
(25.0%)
88
(29.6%)
Total 122 89 44 21 17 4 297
Conclusions: Our results indicate that efficient international telepathology consultation can be achieved by digital slide scanning and transferring. Diagnostic service from international top pathologists could benefit many patients in China. Gynecological malignancies are common in community hospitals. The international telepathology consultation would improve patient care and safety through access to pathology expertise. However, the lack of primary diagnosis in around 31% of cases may increase the difficulty of telepathology consultation. The overall experience encourages international practice for second opinion in subspecialities.
1669 Computational Image-Analysis to Distinguish Well-Differentiated Hepatocellular Carcinoma from Hepatocellular Adenoma and Normal Liver Tissue
Rong Xia1, Shea Stephanie2, Yongsheng Pan3, Amir Momeni Boroujeni1, M. A Haseeb3, Raavi Gupta1. 1SUNY Downstate Medical Center, Brooklyn, NY, 2Mounti Sinai Hospital & Icahn School of Medicine at Mount Sinai, 3SUNY Downstate Medical Center
Background: It is challenging to distinguish well-differentiated hepatocellular carcinoma (WD-HCC) from hepatocellular adenoma (HA) solely on morphology. Computational image-analysis is a useful tool to distinguish morphologically challenging diagnosis. Here we have successfully used this approach to distinguish WD-HCC from HA and normal liver tissue (NLT).
Design: Liver specimens of sixty-six cases (WD-HCC 20; NLT 23; HA 23) were retrieved and reviewed. Multiple images (WD-HCC 161; NLT 182; HA 212) were obtained at high power (HPF, 400x, 0.09 μm2) from non-overlapping areas, excluding fibrosis, cholestasis, portal triads, and artifacts. Images were deconvoluted to subtract background colors. After noise reduction and Otsu thresholding, morphologic opening and connected component analysis were applied to enumerate the number of nuclei per image. The classification algorithm was trained using a data set of 345 images (WD-HCC 91; HA 142; NLT 112), and the remaining 210 images (WD-HCC 70; NLT 70; HA 70) were used to validate the algorithm. Data were subjected to Chi-square automatic interaction detection (CHAID) to build a decision tree model.
Results: The nuclear density was higher in WD-HCC as compared to NLT and HA (X±SE: 457.2 ± 6.4; 244.3 ± 3.8; 262.8 ± 4.4, respectively; One-way ANOVA, p<0.001, Figure 1). Using the training data set, CHAID analysis identified WD-HCC when the nuclear density was more than 413.0/HPF, and nonmalignant liver (HA and NLT) when nuclear density was lower than 249.0/HPF. CHAID analysis of the test data set yielded a sensitivity of 88% and a specificity of 97% for the upper limit. The lower limit of the model has an accuracy of 100% in diagnosing the non-malignant liver. The model, however, did not differentiate between HA and NLT.
Conclusions: Computational image-analysis of nuclear density can differentiate WD-HCC from nonmalignant liver with high accuracy. In
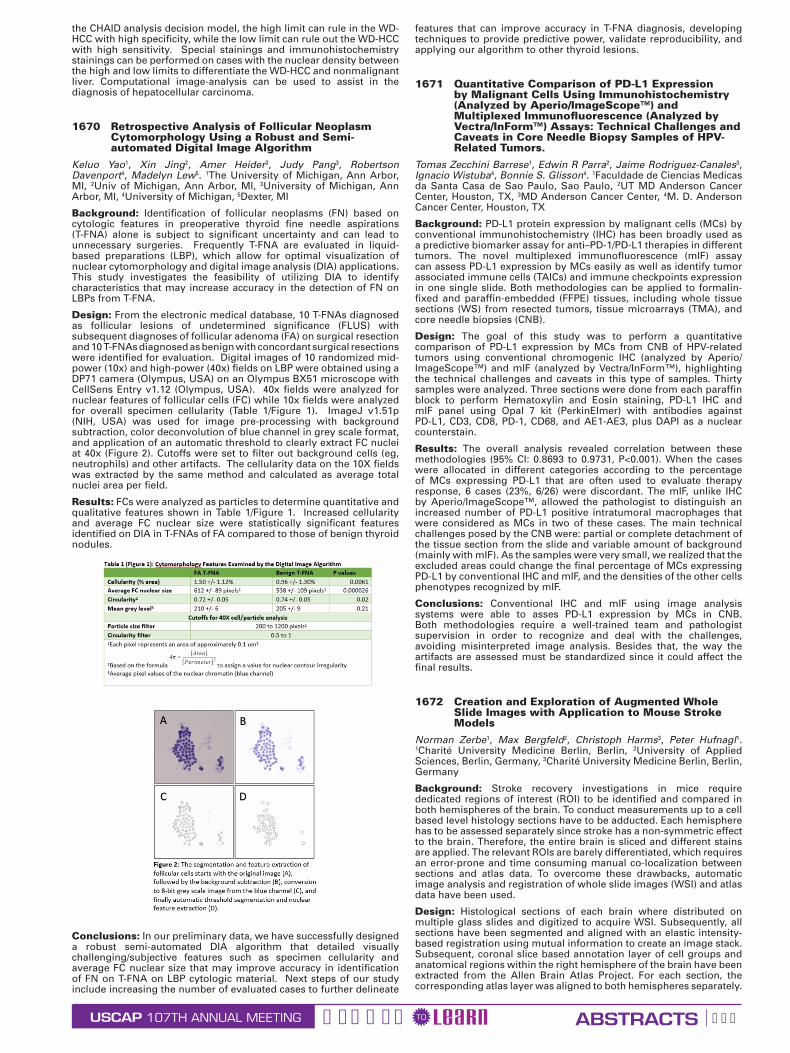
USCAP ABSTRACTSGEARED LEARNTO107TH ANNUAL MEETING 602
the CHAID analysis decision model, the high limit can rule in the WD-HCC with high specificity, while the low limit can rule out the WD-HCC with high sensitivity. Special stainings and immunohistochemistry stainings can be performed on cases with the nuclear density between the high and low limits to differentiate the WD-HCC and nonmalignant liver. Computational image-analysis can be used to assist in the diagnosis of hepatocellular carcinoma.
1670 Retrospective Analysis of Follicular Neoplasm Cytomorphology Using a Robust and Semi-automated Digital Image Algorithm
Keluo Yao1, Xin Jing2, Amer Heider3, Judy Pang3, Robertson Davenport4, Madelyn Lew5. 1The University of Michigan, Ann Arbor, MI, 2Univ of Michigan, Ann Arbor, MI, 3University of Michigan, Ann Arbor, MI, 4University of Michigan, 5Dexter, MI
Background: Identification of follicular neoplasms (FN) based on cytologic features in preoperative thyroid fine needle aspirations (T-FNA) alone is subject to significant uncertainty and can lead to unnecessary surgeries. Frequently T-FNA are evaluated in liquid-based preparations (LBP), which allow for optimal visualization of nuclear cytomorphology and digital image analysis (DIA) applications. This study investigates the feasibility of utilizing DIA to identify characteristics that may increase accuracy in the detection of FN on LBPs from T-FNA.
Design: From the electronic medical database, 10 T-FNAs diagnosed as follicular lesions of undetermined significance (FLUS) with subsequent diagnoses of follicular adenoma (FA) on surgical resection and 10 T-FNAs diagnosed as benign with concordant surgical resections were identified for evaluation. Digital images of 10 randomized mid-power (10x) and high-power (40x) fields on LBP were obtained using a DP71 camera (Olympus, USA) on an Olympus BX51 microscope with CellSens Entry v1.12 (Olympus, USA). 40x fields were analyzed for nuclear features of follicular cells (FC) while 10x fields were analyzed for overall specimen cellularity (Table 1/Figure 1). ImageJ v1.51p (NIH, USA) was used for image pre-processing with background subtraction, color deconvolution of blue channel in grey scale format, and application of an automatic threshold to clearly extract FC nuclei at 40x (Figure 2). Cutoffs were set to filter out background cells (eg, neutrophils) and other artifacts. The cellularity data on the 10X fields was extracted by the same method and calculated as average total nuclei area per field.
Results: FCs were analyzed as particles to determine quantitative and qualitative features shown in Table 1/Figure 1. Increased cellularity and average FC nuclear size were statistically significant features identified on DIA in T-FNAs of FA compared to those of benign thyroid nodules.
Conclusions: In our preliminary data, we have successfully designed a robust semi-automated DIA algorithm that detailed visually challenging/subjective features such as specimen cellularity and average FC nuclear size that may improve accuracy in identification of FN on T-FNA on LBP cytologic material. Next steps of our study include increasing the number of evaluated cases to further delineate
features that can improve accuracy in T-FNA diagnosis, developing techniques to provide predictive power, validate reproducibility, and applying our algorithm to other thyroid lesions.
1671 Quantitative Comparison of PD-L1 Expression by Malignant Cells Using Immunohistochemistry (Analyzed by Aperio/ImageScope™) and Multiplexed Immunofluorescence (Analyzed by Vectra/InForm™) Assays: Technical Challenges and Caveats in Core Needle Biopsy Samples of HPV-Related Tumors.
Tomas Zecchini Barrese1, Edwin R Parra2, Jaime Rodriguez-Canales3, Ignacio Wistuba4, Bonnie S. Glisson4. 1Faculdade de Ciencias Medicas da Santa Casa de Sao Paulo, Sao Paulo, 2UT MD Anderson Cancer Center, Houston, TX, 3MD Anderson Cancer Center, 4M. D. Anderson Cancer Center, Houston, TX
Background: PD-L1 protein expression by malignant cells (MCs) by conventional immunohistochemistry (IHC) has been broadly used as a predictive biomarker assay for anti–PD-1/PD-L1 therapies in different tumors. The novel multiplexed immunofluorescence (mIF) assay can assess PD-L1 expression by MCs easily as well as identify tumor associated immune cells (TAICs) and immune checkpoints expression in one single slide. Both methodologies can be applied to formalin-fixed and paraffin-embedded (FFPE) tissues, including whole tissue sections (WS) from resected tumors, tissue microarrays (TMA), and core needle biopsies (CNB).
Design: The goal of this study was to perform a quantitative comparison of PD-L1 expression by MCs from CNB of HPV-related tumors using conventional chromogenic IHC (analyzed by Aperio/ImageScope™) and mIF (analyzed by Vectra/InForm™), highlighting the technical challenges and caveats in this type of samples. Thirty samples were analyzed. Three sections were done from each paraffin block to perform Hematoxylin and Eosin staining, PD-L1 IHC and mIF panel using Opal 7 kit (PerkinElmer) with antibodies against PD-L1, CD3, CD8, PD-1, CD68, and AE1-AE3, plus DAPI as a nuclear counterstain.
Results: The overall analysis revealed correlation between these methodologies (95% CI: 0.8693 to 0.9731, P<0.001). When the cases were allocated in different categories according to the percentage of MCs expressing PD-L1 that are often used to evaluate therapy response, 6 cases (23%, 6/26) were discordant. The mIF, unlike IHC by Aperio/ImageScope™, allowed the pathologist to distinguish an increased number of PD-L1 positive intratumoral macrophages that were considered as MCs in two of these cases. The main technical challenges posed by the CNB were: partial or complete detachment of the tissue section from the slide and variable amount of background (mainly with mIF). As the samples were very small, we realized that the excluded areas could change the final percentage of MCs expressing PD-L1 by conventional IHC and mIF, and the densities of the other cells phenotypes recognized by mIF.
Conclusions: Conventional IHC and mIF using image analysis systems were able to asses PD-L1 expression by MCs in CNB. Both methodologies require a well-trained team and pathologist supervision in order to recognize and deal with the challenges, avoiding misinterpreted image analysis. Besides that, the way the artifacts are assessed must be standardized since it could affect the final results.
1672 Creation and Exploration of Augmented Whole Slide Images with Application to Mouse Stroke Models
Norman Zerbe1, Max Bergfeld2, Christoph Harms3, Peter Hufnagl1. 1Charité University Medicine Berlin, Berlin, 2University of Applied Sciences, Berlin, Germany, 3Charité University Medicine Berlin, Berlin, Germany
Background: Stroke recovery investigations in mice require dedicated regions of interest (ROI) to be identified and compared in both hemispheres of the brain. To conduct measurements up to a cell based level histology sections have to be adducted. Each hemisphere has to be assessed separately since stroke has a non-symmetric effect to the brain. Therefore, the entire brain is sliced and different stains are applied. The relevant ROIs are barely differentiated, which requires an error-prone and time consuming manual co-localization between sections and atlas data. To overcome these drawbacks, automatic image analysis and registration of whole slide images (WSI) and atlas data have been used.
Design: Histological sections of each brain where distributed on multiple glass slides and digitized to acquire WSI. Subsequently, all sections have been segmented and aligned with an elastic intensity-based registration using mutual information to create an image stack. Subsequent, coronal slice based annotation layer of cell groups and anatomical regions within the right hemisphere of the brain have been extracted from the Allen Brain Atlas Project. For each section, the corresponding atlas layer was aligned to both hemispheres separately.
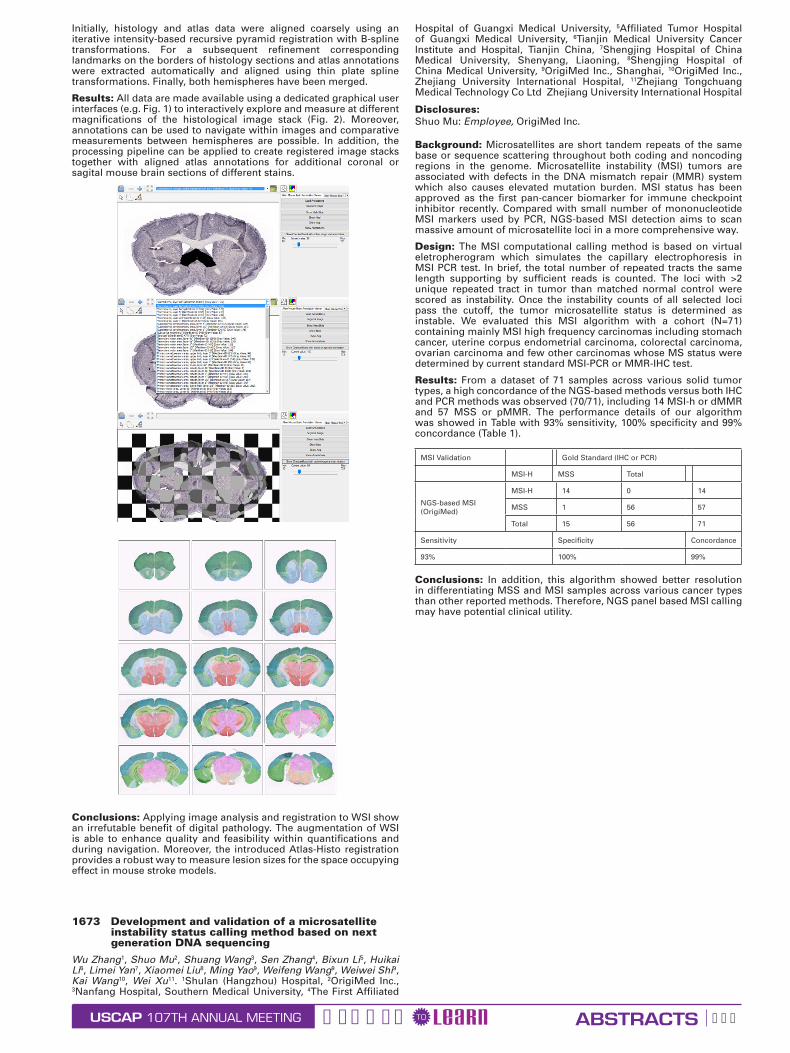
USCAP ABSTRACTSGEARED LEARNTO107TH ANNUAL MEETING 603
Initially, histology and atlas data were aligned coarsely using an iterative intensity-based recursive pyramid registration with B-spline transformations. For a subsequent refinement corresponding landmarks on the borders of histology sections and atlas annotations were extracted automatically and aligned using thin plate spline transformations. Finally, both hemispheres have been merged.
Results: All data are made available using a dedicated graphical user interfaces (e.g. Fig. 1) to interactively explore and measure at different magnifications of the histological image stack (Fig. 2). Moreover, annotations can be used to navigate within images and comparative measurements between hemispheres are possible. In addition, the processing pipeline can be applied to create registered image stacks together with aligned atlas annotations for additional coronal or sagital mouse brain sections of different stains.
Conclusions: Applying image analysis and registration to WSI show an irrefutable benefit of digital pathology. The augmentation of WSI is able to enhance quality and feasibility within quantifications and during navigation. Moreover, the introduced Atlas-Histo registration provides a robust way to measure lesion sizes for the space occupying effect in mouse stroke models.
1673 Development and validation of a microsatellite instability status calling method based on next generation DNA sequencing
Wu Zhang1, Shuo Mu2, Shuang Wang3, Sen Zhang4, Bixun Li5, Huikai Li6, Limei Yan7, Xiaomei Liu8, Ming Yao9, Weifeng Wang9, Weiwei Shi9, Kai Wang10, Wei Xu11. 1Shulan (Hangzhou) Hospital, 2OrigiMed Inc., 3Nanfang Hospital, Southern Medical University, 4The First Affiliated
Hospital of Guangxi Medical University, 5Affiliated Tumor Hospital of Guangxi Medical University, 6Tianjin Medical University Cancer Institute and Hospital, Tianjin China, 7Shengjing Hospital of China Medical University, Shenyang, Liaoning, 8Shengjing Hospital of China Medical University, 9OrigiMed Inc., Shanghai, 10OrigiMed Inc., Zhejiang University International Hospital, 11Zhejiang Tongchuang Medical Technology Co Ltd� Zhejiang University International Hospital
Disclosures: Shuo Mu: Employee, OrigiMed Inc.
Background: Microsatellites are short tandem repeats of the same base or sequence scattering throughout both coding and noncoding regions in the genome. Microsatellite instability (MSI) tumors are associated with defects in the DNA mismatch repair (MMR) system which also causes elevated mutation burden. MSI status has been approved as the first pan-cancer biomarker for immune checkpoint inhibitor recently. Compared with small number of mononucleotide MSI markers used by PCR, NGS-based MSI detection aims to scan massive amount of microsatellite loci in a more comprehensive way.
Design: The MSI computational calling method is based on virtual eletropherogram which simulates the capillary electrophoresis in MSI PCR test. In brief, the total number of repeated tracts the same length supporting by sufficient reads is counted. The loci with >2 unique repeated tract in tumor than matched normal control were scored as instability. Once the instability counts of all selected loci pass the cutoff, the tumor microsatellite status is determined as instable. We evaluated this MSI algorithm with a cohort (N=71) containing mainly MSI high frequency carcinomas including stomach cancer, uterine corpus endometrial carcinoma, colorectal carcinoma, ovarian carcinoma and few other carcinomas whose MS status were determined by current standard MSI-PCR or MMR-IHC test.
Results: From a dataset of 71 samples across various solid tumor types, a high concordance of the NGS-based methods versus both IHC and PCR methods was observed (70/71), including 14 MSI-h or dMMR and 57 MSS or pMMR. The performance details of our algorithm was showed in Table with 93% sensitivity, 100% specificity and 99% concordance (Table 1).
MSI Validation Gold Standard (IHC or PCR)
MSI-H MSS Total
NGS-based MSI (OrigiMed)
MSI-H 14 0 14
MSS 1 56 57
Total 15 56 71
Sensitivity Specificity Concordance
93% 100% 99%
Conclusions: In addition, this algorithm showed better resolution in differentiating MSS and MSI samples across various cancer types than other reported methods. Therefore, NGS panel based MSI calling may have potential clinical utility.

USCAP ABSTRACTSGEARED LEARNTO107TH ANNUAL MEETING 604
FIG. 1635
Table 1. Multivariable analysis showing factors associated with receiving platelet transfusion in patients with Immune Thrombocytopenic Purpura as primary admission diagnosis, 2010-2014
Factors Odds Ratio (95% CI) P value
Age ≥18 years 9.03 (7.40-11.02) <0.001
Male 1.21 (1.11-1.31) <0.001
Rural hospitals* 1.85 (1.52-2.22) <0.05
Small bed-size hospitals 1.23 (1.05-1.45) <0.05
Bleeding episode** 1.78 (1.61-1.96) <0.001
APRDRG Severity (loss of function)
Minor Reference
Moderate 1.41 (1.29-1.55) <0.001
Major 1.77 (1.57-1.99) <0.001
Extreme 2.03 (1.65-2.51) <0.001
* In comparison with urban-teaching hospitals** Includes epistaxis/gastrointestinal/genito-urinary/intracranial hemorrhage
FISHIHC
Total0 1+ 2+ 3+
Negative 79 467 181 1 728 (68.7%)
Equivocal 7 21 13 1 42 (4.0%)
Positive 1 28 103 157 289 (27.3%)
Total 87 (8.2%) 516 (48.7%) 297 (28.1%) 159
(15.0%) 1059 (100%)