Embed Size (px)
Citation preview

- 15 -
2. __________________________________________________________
Political Economy of Government Expenditure: A Case of Power
Subsidy in India
Atsushi Fukumi
1. Introduction
The introduction of New Economic Policy in India has promoted various economic reform
policies such as the reduction of tariffs, easing of capital restrictions, and privatisation, all of
which increased the average annual growth rate from 2003 to 2007 by 8.8%. As an emerging
international market, India’s serious lack of infrastructure, particularly the power sector, had to be
improved. The sector has been beset by frequent power cuts, power shortages, and low
electrification ratio in rural areas. Developing power with a generation capacity of 200,000 MWh,
which is 1.6 times higher than the current capacity, has been targeted for the eleventh 5-year plan
in order for the country to achieve an annual GDP growth rate of 9%. However, there is little room
for optimism that this goal will be achieved since only 76.1% of the target level for power
generation had been accomplished during the tenth 5-year plan (Planning Commission, 2008).
The underdevelopment of the power sector is closely related to the “soft budget” it received
during the era of mixed economy. After independence in 1947, the State Electricity Boards (SEBs),
which are dominantly responsible for power generation, transmission, and distribution in India,
were established. The SEBs have been operating for a long time without regard to commercial
concerns because they could receive ex-post financial transfer from the central and state
governments. Because of mismanagement, most SEBs fell into de facto financial collapse in the
1980s, which made it difficult to invest in the establishment, operation, and maintenance of their
facilities. It is often discussed that politicians and political parties have used the SEBs as a channel
for distributing rent to their support base, hence compromising the SEB’s financial status. A typical
case is the power tariff collected by politicians from agricultural users which is far lower the
accepted cost just to win farmers’ votes. These implicit subsidies1 for farmers, reaching up to 200
billion Rs, are eroding the financial status of SEBs and the state governments.
Such populism in India is often said to have resulted from the breakup and downfall of the
Indian National Congress in 1967 because of the overwhelming force of the majority. According to
Dubash and Rajan (2001), power subsidies increased and the SEBs’ financial status deteriorated
under the unstable political situation in the 1970s because of the escalating populistic behaviour of
politicians who wanted to strengthen their power base.
Based on previous studies, in this paper we empirically investigate the effect of political 1 In general, subsidy is divided into two categories: “explicit subsidy” which is directly provided to the consumer or producer, and “implicit subsidy” which is provided indirectly through price control by the government (Schwartz and Clements, 1999). Power subsidy in India can be categorised under the latter.

Atsushi Fukumi
- 16 -
instability on power subsidies and attempt to understand how to the Indian power sector came to
be in such a serious condition. While the effect of political and social factors on fiscal policies and
provision of public goods have been studied by Besley and Burgess (2002), Pande (2003),
Khemani (2004), Chaudhuri and Dasgupta (2006), and Banergee and Somanathan (2007), none of
these sufficiently dealt with the power sector. Thus, here we focus on power subsidies which are
very relevant to the current serious condition of India’s power infrastructure.
The outline of this paper is as follows. In section 2, we briefly explore the basic issues
concerning the power sector in India. In section 3, we empirically assess the impact of political
instability on power subsidies using panel data from the 14 major Indian states. Section 5
concludes the paper.
2. Power Subsidy and Politics in India
2.1. Issues in the Indian Electricity Sector2
The main players in India’s power sector are the SEBs, which were established under the
Electricity Supply Act enforced in 1948. The SEBs are under the control of state governments and
are highly dependent on grants and loans from the latter. Other players in the power sector are the
National Thermal Power Corporation (NTPC) and the National Hydroelectric Power Corporation
(NHPC) owned by the central government. Despite the reforms after 1991 which allowed a few
private companies entry to the sector, the SEBs continue to dominate, controlling a 60% share of
the power supply.
Although the SEBs have contributed to the industrialization of India, the power sector has
been beset with serious problems.
First is the power shortage in the
1980s that limited or cut power
supply. Figure 1 shows that the gap
in demand and supply of power has
been closing from the late 1990s to
2003, but that it increased in recent
years to 15.2% in 2007. In addition,
the low quality of electricity with
unstable voltage and frequency can
damage electric devices. Since
power cuts and breakdown of
electricity devices can prove fatal
for hospitals and industrial firms,
they must invest in generators and
stabilisers. Power with poor quality
2 This sub-section is mainly based on the Planning Commission (2002) report and on Tongia (2007).
Figure 1: Electricity Demand and Supply (Peak Period)
Source: Ministry of Power, Annual Report 2007-2008

Political Economy of Government Expenditure
- 17 -
can also damage
transmitters and electric
irrigation pumps, which
has adversely affected
farmers in Haryana and
Andra Pradesh (World
Bank, 2001). And some
medium and small
companies suffer be-
cause they cannot afford
such investment.
Moreover,
transmission and
distribution (T&D) and
aggregate technical and
commercial (AT&C) losses are quite serious in India3. Figure 2 shows the ratio of T&D losses in
India, Brazil, Russia, and China. T&D losses in India rose to 26.9% in 2004, which is remarkably
high compared to other countries4. While technical factors caused by inadequate investment on
transmission and distribution facilities naturally can increase the losses, the more vital factors are
the losses from pilferage and nonpayment.
This problem is serious particularly in rural areas and has been exacerbated by (a) insufficient
setting and maintenance of meters, (b) difficulty in figuring out the number and capacity of electric
irrigation pumps used by SEBs as the criterion to set a flat rate tariff, (c) delay of connecting to the
power network through formal procedures5, and (d) the spread of corruption among SEB
employees who allow pilferage and nonpayment in exchange for commissions.
Closely related to all of the abovementioned problems is the serious financial status of the
SEBs. Table 1 shows that they incurred huge commercial losses up to 169.5 billion Rs in 2007, and
60% of such losses were compensated by the state government. Subvention to SEBs accounted for
13% of the gross fiscal deficit of states in 2007 and imposed a heavy burden on state finances.
The SEBs’ finances have been adversely affected not only by power losses but also by the
distribution of power subsidies through an irrational tariff structure. The tariffs for agricultural and
domestic consumers are set far below the actual cost. Table 1 shows that the power subsidy for
agricultural consumers, reaching around 200 billon Rs after 1997, accounts for 70% of the total
subsidy. While agricultural consumers enjoy the preferential tariff, tariffs for industrial and
commercial consumers are set above the cost and the surplus is used as cross-subsidy to 3 T&D losses include losses in transmission and distribution process due to technological factors as well as pilferage. AT&C losses are defined to include non-billing, incorrect billing and inefficiency in collection in addition to T&D losses. 4 According to the World Bank (2007), India’s T&D losses ratio in 2004 was ranked 12th worst in the world. 5 Katiyar (2005) investigates the background of pilferage and reports a household which has been waiting for more than 15 years after formally applying for power network connection.
Figure 2: T&D Losses of BRICs
Source: World Development Indicator

Atsushi Fukumi
- 18 -
compensate deficit. The distorted tariff structure promotes private power generation, which
reduces tariff revenue, setting off a vicious cycle. From Figure 3 which presents the recovery ratio
of cost through tariff over the past 15 years, we can see that only 80% of the actual cost is
recovered by tariff revenues. The irrational tariff structure leads to low recovery of cost, which
adversely affects the SEBs’ financial status.
Most of the measures implemented to improve the situation have been ineffective. Tongia
(2007) summarises the process of power sector reform after the New Economic Policy was
implemented into the following three stages. The first stage in the early 90s was the period of
deregulation, which allowed private companies to enter the power generation business and
promoted the establishment of
the Independent Power
Producers (IPPs). Although
foreign capital could be
attracted, the IPPs generated
only a fraction of the power
required. The second stage
involved the breakup of the
SEBs into generation, trans-
mission, and distribution
companies. Orissa was the first
state to implement this breakup
in 1996 and other states like
Haryana, Andra Pradesh, and
Rajasthan followed to varying
Figure 3: Recovery of Cost through Tariff
Source: Central Electrcity Authority, Annual Report 2005-2006, P.73
Table 1: Financial Status of the SEBs (Rs. Crore)
1992-1993 1997-1998 2002-2003 2007-2008
Power subsidy from SEBs to 15887 27511 27632 28451
Agricultural consumers 12243 21424 19747 19326
Domestic consumers 3261 5798 7714 8778
Inter-state sales 384 290 171 347
Commercial losses (Excluding subventions from State Governments)
7405 13260 19328 16953
Subventions from state governments 3247 8095 11748 9340
Gross fiscal deficit of state governments 35498 48787 90148 71451
Share of subventions in gross fiscal deficit of states 9.1% 16.6% 13.0% 13.1%
Source: Ministry of Finance, Economic Survey (various years); Reserve Bank of India, Handbook of Statistics on Indian Economy 2007 Note: (a) GDP deflator is used to adjust for inflation (Base year: 1999-2001).
(b) Power subsidy is defined as average cost minus average tariff times the number of units sold to a given sector.

Political Economy of Government Expenditure
- 19 -
extents up until the end of the 1990s. Another important reform in this period concerned the
establishment of Electricity Regulatory Commissions (ERCs), which hold responsibility for setting
tariffs in order to rationalise the tariff structure. The third stage, from the late 1990s until the
present, saw the central government start to take the initiative in providing a general environment
for reform. In order to reduce commercial losses, the central government started the Accelerated
Power Development and Reform Program (APDRP) in 2003. The program provides funds to state
governments to improve their power infrastructure (including meter installation) while motivating
state governments with extra financial assistance to implement reform.
The Electricity Act, enforced since June 2003, provides the legal framework for reforming the
power sector, and we are at present awaiting the outcome. However, as Bhattacharyya (2007)
points out, finding major progress is difficult, especially in the rationalisation of the tariff structure
and in the prevention of pilferage. Tongia (2007) holds that the effectiveness of reform depends on
the degree of political commitment, while the effectiveness of the ERCs hinges on the institutions
on which they depend for their authority. Also, we should note that serious opposition from
farmers, the biggest beneficiaries of electricity subsidies, is the major impeding factor in the
reform. Since it is politically difficult to eliminate vested interests, external pressure from
international organisations such as the World Bank may facilitate reform.
2.2. The Determinants of Power Subsidy
Populism in Indian politics has spread with the formation of various political parties after the
breakup of the Congress Party in 1967 and the diminishing of its dominant position. While
political instability increased in states and federal politics, politicians and political parties tended
to engage in political patronage in order to strengthen their electoral power base. Of primary
importance was to win the vote of farmers, and power subsidies have been used as one of the most
effective political tools for this purpose.
According to Dubash and Rajan (2001), the first case of using power subsidy as patronage
can be found in the election manifesto of the Congress Party during the Andra Pradesh state
assembly election in 1977, which committed itself to the adoption of a flat-rate tariff. This was
followed by other states, such as in the case of the free electricity supply initiated by AIADMK in
Tamil Nadu. In addition, the green revolution of the 1960s to the 1970s expanded power subsidies.
Since large quantities of water are needed to attain high rice yields, irrigation facilities were
developed extensively. The main power source of irrigation pumps shifted from diesel to electricity,
which directly linked farmers’ interest with the power tariff. Further, while improved agricultural
productivity enhanced the political power of the middle and rich classes of farmers, the number of
legislative officers with agricultural backgrounds also increased dramatically. After this period, the
management of SEBs became highly politicised and power subsidies became widely used to win
farmers’ votes. Such a situation went in tandem with the increasing instability of politics and the
empowerment of farmers.
Generally speaking, various subsidies might be justified on grounds of (a) their positive
externality, (b) infant industry protection, and (c) poverty and redistribution program (Schwartz

Atsushi Fukumi
- 20 -
and Clements 1999). Power subsidies in India have been distributed as a part of poverty reduction
efforts, however, the biggest beneficiaries of power subsidies are said to have been relatively rich
farmers, not the poor farmers. Howes and Murgai (2003) reported that 80% of the poor in
Karnataka cultivate non-irrigated lands and are unlikely to enjoy free or cheap electricity. Jain
(2006) reported a similar case in Punjab. The World Bank (2001) found that most poor farmers in
Haryana would agree to a rise in power tariff along with improvement in the quality of power.
Therefore, it is doubtful that power subsidies have had a specific effect on poverty reduction.
On the other hand, power subsidies are criticised because of their economic and social losses
(Roy and Tisdell 1998, Srivastava and Rao 2004). Power subsides not only exert negative effects
where the industrial and commercial sectors are charged over-valued tariffs, but also damage the
environment due to wasteful consumption. Above all, a large amount of power subsidies can
crowd out public investment while causing deterioration of state and central government finances.
In other words, we can say that power subsidies not only retard the accumulation of public goods
such as electricity facilities, but also result in a low growth rate. Political instability is a crucial
factor in such a situation.
Regarding the effect of political instability on expenditure policy and growth, Goyal (2003)
indicated that the first reaction of new parties to the acquisition of power is likely to result in the
adoption of an expenditure policy characterised by populism for their support groups. Pai (2002)
also suggested that, in Uttar Pradesh, parties based on caste, religion, and regional groups have not
been able to aggregate public opinion, which in turn has led to political instability, lack of
incentive for development, and low development expenditure. Thus in the same context, regarding
power subsidies focused on here, we can pointed out that they might hamper the accumulation of
public good including power infrastructure, which in turn retard long run economic growth. In
addition, political instability can be a crucial factor bringing about the situation. Based on the
discussions in preceding sections, we assess the impact of political instability on power subsidy in
the next section.
3. Empirical Analysis
3.1. Framework
The data we use here is the panel data from 14 Indian states6 obtained over 10 years from
1992 to 2001. Recent studies investigating the impact of social and political factors on government
expenditure include Besley and Burgess (2002) who assessed the effect of mass media on public
food distribution and calamity relief expenditure in case of facing exogenous shock, and Khemani
(2004) and Chaudhuri and Dasgupta (2006) who analyzed the cycle of state assembly election on
government consumption and public investment. However, these studies did not pay sufficient
6 The states are Andhra Pradesh, Bihar, Gujarat, Haryana, Karnataka, Kerala, Madhya Pradesh, Maharashtra, Orissa, Punjab, Rajasthan, Tamil Nadu, Uttar Pradesh, and West Bengal. The data period starts from 1992 since the economic reform starts in effect and ends in 2001. Also, the Planning Commission stopped publishing its annual report which provided the only source of power subsidy data comparable in a time series.
Political Economy of Government Expenditure
- 21 -
attention to the power sector and thus, we now focus on power subsidy which is closely related to
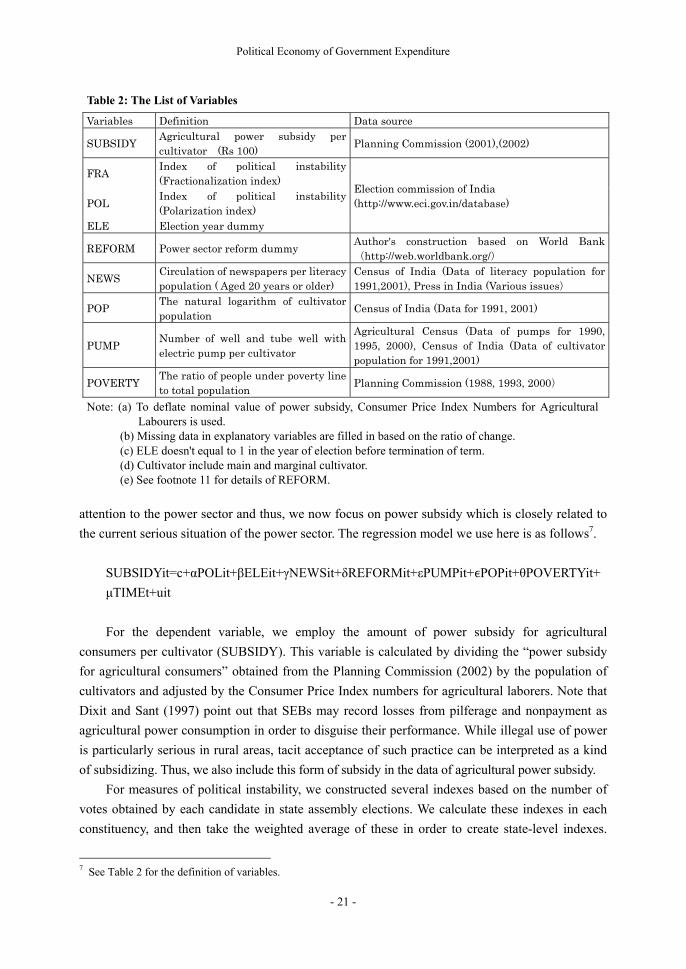
the current serious situation of the power sector. The regression model we use here is as follows7.
SUBSIDYit=c+αPOLit+βELEit+γNEWSit+δREFORMit+εPUMPit+ϵPOPit+θPOVERTYit+
μTIMEt+uit
For the dependent variable, we employ the amount of power subsidy for agricultural
consumers per cultivator (SUBSIDY). This variable is calculated by dividing the “power subsidy
for agricultural consumers” obtained from the Planning Commission (2002) by the population of
cultivators and adjusted by the Consumer Price Index numbers for agricultural laborers. Note that
Dixit and Sant (1997) point out that SEBs may record losses from pilferage and nonpayment as
agricultural power consumption in order to disguise their performance. While illegal use of power
is particularly serious in rural areas, tacit acceptance of such practice can be interpreted as a kind
of subsidizing. Thus, we also include this form of subsidy in the data of agricultural power subsidy.
For measures of political instability, we constructed several indexes based on the number of
votes obtained by each candidate in state assembly elections. We calculate these indexes in each
constituency, and then take the weighted average of these in order to create state-level indexes.
7 See Table 2 for the definition of variables.
Table 2: The List of Variables
Variables Definition Data source
SUBSIDY Agricultural power subsidy per cultivator (Rs 100)
Planning Commission (2001),(2002)
FRA Index of political instability (Fractionalization index)
Election commission of India (http://www.eci.gov.in/database) POL
Index of political instability (Polarization index)
ELE Election year dummy
REFORM Power sector reform dummy Author's construction based on World Bank(http://web.worldbank.org/)
NEWS Circulation of newspapers per literacy population ( Aged 20 years or older)
Census of India (Data of literacy population for 1991,2001), Press in India (Various issues)
POP The natural logarithm of cultivator population
Census of India (Data for 1991, 2001)
PUMP Number of well and tube well with electric pump per cultivator
Agricultural Census (Data of pumps for 1990, 1995, 2000), Census of India (Data of cultivator population for 1991,2001)
POVERTY The ratio of people under poverty line to total population
Planning Commission (1988, 1993, 2000)
Note: (a) To deflate nominal value of power subsidy, Consumer Price Index Numbers for Agricultural Labourers is used.
(b) Missing data in explanatory variables are filled in based on the ratio of change. (c) ELE doesn't equal to 1 in the year of election before termination of term. (d) Cultivator include main and marginal cultivator. (e) See footnote 11 for details of REFORM.

Atsushi Fukumi
- 22 -
The first we apply is the political polarization index (POL), a new proxy of instability proposed in
recent studies (Montalvo and Reynal-Querol, 2005), which assumes that conflict is more severe if
people’s political preference is more polarised. This is calculated by:
where N is the total number of votes in the state assembly election, ni is the number of votes
obtained by a candidate i (i = 1 … M) . The POL index reaches a maximum if the total number
of votes is shared equally by only two candidates in each constituency. The second we apply is the
political fractionalization index (FRA), under the longstanding assumption that the potential for
political conflict grows with more fragmented preference of people. Based on the results of the
state assembly election, this index is calculated by:
This index increases with an increase in the number of candidates who obtained equal votes
in the state assembly election. Faced with the theoretical difficulty of anticipating which index can
capture potential political instability more precisely (Alesina et al., 2003), we decided to use both8.
As other political variables, we employ the election dummy (ELE) which equals 1 in the
election years and 0 in other years. However, in order to consider the reverse causality that subsidy
policy triggers a snap election, we do not treat the year of election before the termination of term
as the election year, following Khemani (2004) and Chaudhuri and Dasgupta (2006). It is expected
that ELE will have a positive effect on the basis of the assumption that populistic fiscal
expenditure can be expanded in election years.
Also, we employ the circulation of newspapers per capita (NEWS) as the explanatory
variable in order to capture the effect of mass media development. Although based on the
discussion of Besley and Burgess (2002) we assume that the development of mass media is
positively related to the government’s responsiveness to civil interests, it is difficult to expect the
sign of this variable in this study since newspaper subscribers include not only farmers who need
agricultural power subsidy but also other citizens who do not. Thus, we judge the effect of NEWS
from the regression results.
We employ the reform dummy (REFORM) in order to capture the impact of power sector
reform. Generally, both unbundling of SEBs and establishment of electricity regulatory
commissions (ERCs) are thought of as the most important features of power sector reform. Our
reform dummy equals 1 only if these two reforms were carried out with loans from the World
Bank, in order to exclude the case of token reform9. REFORM will have negative impact if the
reforms were effective.
8 See Alesina et al. (2003) for more details. 9 The reform dummy equals 1 in Andra Pradesh (1999-), Haryana (1998-), Karnataka(1999-), Orissa (1996-), Rajasthan (2000-), Uttar Pradesh (2000-).
FRA = 1 − niN 2MI=1
POL = 1 − 0.5 − ni N⁄0.5 2 ∙ niNMi=1

Political Economy of Government Expenditure
- 23 -
The number of electronic pumps per cultivator (PUMP) is a variable on the assumption that
power subsidy is requested more in those states where electronic pumps are widely used. Since
power subsidies can contribute to expand the use of electronic pumps and there might exist reverse
causality, we employ the one-year lag value of PUMP. The logarithm of cultivator population
(POP) is a variable on the assumption that the demonstration effect would be stronger with the
number of stake holders in power subsidy. It is expected to have a positive sign. The poverty ratio
(POVERTY) aims to capture the impact of economic development and to have positive sign if
power subsidy has a feature of poverty reduction policy. TIME is the time trend.
3.2. Regression Results
Table 3 demonstrates the regression results. Only the results of the fixed effect model are
presented since the results of the F-test and Hausman test indicate that the fixed effect model is
more appropriate. In regression (1) we assess the impact of all variables without controlling
political instability indexes. With the exception that ELE has no significant effect with the opposite
sign, all the variables have significant effect with the expected sign; that is, NEWS has a positive
and significant effect at the 10% level of significance, REFORM has a negative and significant effect
at 5%, and each of PUMP, POP, POVERTY and TIME has a positive and significant effect at 1%.
In regressions (2) and (3), we assess the impact of the political instability indexes POL and
FRA. Regression (2) shows that POL has a positive and significant effect at the 10% level of
significance, which is consistent with our discussion. In regression (3), FRA has no significant
effect with a negative sign. The results for other variables in both specifications are almost the
same as those in regression (1). In regressions (4) and (5), we exclude ELE which has no
significant effect in regressions (2) and (3) from the explanatory variables. Again, we can see
essentially the same results. These regression results can be summarised as follows.
First, since POL has a positive and significant effect, we propose that political instability in
the sense of polarization in political preference can lead to the expansion of power subsidy for
agricultural consumers. Our result therefore supports our hypothesis regarding the relationship
between political instability and power subsidies. On the other hand, there is no systematic
relationship between FRA and power subsidy, suggesting that polarization, not the
fractionalization of political preference, tends to lead to political patronage.
Second, ELE has no significant effect, while its negative sign is contrary to our expectation.
Since the impact of the election cycle is emphasized by some previous studies (e.g., Khemani
2004), we also assessed the impact of other election dummies,10 but none of these showed
significant effect. This suggests that the election cycle itself has no impact on power subsidy.
However, considering that state assembly elections were implemented at most only two times
during the period, careful analysis will be needed to derive the conclusion about the impact of
election cycle on power subsidy.
10 We also constructed the dummy variables which (a) equals to 1 in years of all elections including snap election, (b) equals to 1 in one previous years and years of all elections.

Atsushi Fukumi
- 24 -
Third, regarding the impact of NEWS, the regression results show a positive impact. Based
on Besley and Burgess (2002), we can say that (a) most voters seem to prefer the expansion of
power subsidy for agricultural consumers, and (b) the development of mass media seems to
promote the responsiveness of state governments to the request of the people.
Fourth, since REFORM has negative and significant effects in all regression results, it is
implied that reforming the power sector with financial assistance from the World Bank has a
certain impact to reducing power subsidy. However, it is possible that power sector reform has
forced the SEBs to report pilferage and nonpayment not as agricultural power consumption but
honestly as commercial loss. This, in turn, decreases the face value of power subsidy for
agricultural consumers per cultivator.
To consider this possibility, we employ the T&D losses as the dependent variable and regress
it to REFORM11. Regression results in Table 4 show that REFORM has a positive and significant
effect on the ratio of T&D losses. Thus, it is difficult to conclude that power sector reform
succeeded in reducing power subsidy since we cannot exclude the possibility that the negative
11 We downloaded the state-wise data of T&D losses from the website of IndiaStat.
Table 3: Determinants of Agricultural Power Subsidy
Dependent variable: SUBSIDY (1) (2) (3) (4) (5) POL 13.206 13.204 (0.088) (0.087) FRA -6.848 -6.879 (0.448) (0.442) ELE -0.059 -0.061 -0.021 (0.913) (0.910) (0.970) NEWS 4.514 4.038 4.256 4.064 4.264 (0.066) (0.099) (0.086) (0.094) (0.083) REFORM -1.546 -1.624 -1.508 -1.625 -1.508 (0.048) (0.036) (0.054) (0.036) (0.053) PUMP 10.519 10.639 10.385 10.633 10.382 (0.000) (0.000) (0.000) (0.000) (0.000) POP 27.977 27.061 27.127 27.102 27.137 (0.000) (0.000) (0.000) (0.000) (0.000) POVERTY 0.617 0.584 0.615 0.586 0.616 (0.000) (0.000) (0.000) (0.000) (0.000) TREND 1.841 1.752 1.835 1.755 1.836 (0.000) (0.000) (0.000) (0.000) (0.000) R-square (Within) 0.626 0.635 0.627 0.635 0.627 F-test 47.73 43.57 45.91 43.94 46.31 P-value (0.000) (0.000) (0.000) (0.000) (0.000) Hausman test 65.5 47.1 58.2 50.8 61.0 P-value (0.000) (0.000) (0.000) (0.000) (0.000) Number of States 14 14 14 14 14 Number of Observation 138 138 138 138 138
Note: P-value is in parenthesis.

Political Economy of Government Expenditure
- 25 -
impact of REFORM in Table 3 might
just reflect the improvement in
financial reporting by the SEBs. We
plan to investigate the impact of
power sector reform more thoroughly
in future work.
Fifth, other explanatory variables
such as PUMP,POP,and POVERTY
have significant effects with the
expected sign. Since the spread of
electronic irrigation pumps and the
increase in cultivator population tend to expand the power subsidy for agricultural consumers, we
can confirm the political influence of farmers. Besides, results showing that agricultural consumers
in high poverty states are more subsidised indicates that power subsidy, apart from its effectiveness,
has the features of a poverty reduction program.
Finally, since TIME has a significant effect with a positive sign in all regressions, we
postulate that agricultural power subsidy tends to increase during the period. In other words, these
results imply that other factors not considered in this study may affect power subsidy, which
requires further analysis of the determinants of power subsidy.
4. Conclusion
This paper analyzed the effect of political instability on power subsidies. Empirical analysis
supports the discussion that instability in Indian politics accelerates the opportunistic behaviour of
politicians, and results in the expansion of power subsidies, which is effective in obtaining
farmers’ votes. It is suggested that India cannot achieve infrastructure development and sustainable
growth unless it succeeds in overcoming populism. On the other hand, we could confirm the
influence of farmers and mass media on power subsidy, while the impacts of election cycle and
power sector reform were not found. Considering the importance of subsidy reduction for future
development in India, the impact of reforming the power sector should be further studied.
References Alesina, Alberto, Arnaud Devleeschauwer, William Easterly, Sergio Kurlat, and Romain Wacziarg,
“Fractionalization,” Journal of Economic Growth, 8, 2:155-94, 2003. Banergee, Abhijit, and Rohini Somanathan, “The Political Economy of Public Goods: Some Evidence
from India,” Journal of Development Economics, 82, 2:287-314, 2007. Barro, Robert. J., “Government Spending in a Simple Model of Endogenous Growth,” Journal of Political
Economy, 98, 5:103-126, 1990. Besley, Timothy, and Robin Burgess, “The Political Economy of Government Responsiveness: Theory and
Evidence from India,” Quarterly Journal of Economics, 117, 4:1415-1451, 2002. Bhattacharyya, Subhes C., “Sustainability of Power Sector Reform in India: What Does Recent Experience
Table 4: Power Sector Reform and T&D Losses
Dependent varialbe:The ratio of T&D lossesREFORM 11.1677 (0.00)R-square (Within) 0.2955F-test 3.79P-value 0Hausman test 15.37P-value 0.0001Number of States 14Number of Observation 139
Note: P-value is in parenthesis.

Atsushi Fukumi
- 26 -
Suggest?” Journal of Cleaner Production, 15, 2:235-246, 2007. Blanchard, Olvier. J., and Stanley Fischer, Lectures on Macroeconomics. Cambridge, MA: MIT Press,
1989. Blomberg, Stephen B., “Growth, Political Instability and the Defence Burden,” Economica, 63, 252:649-672,
1996. Central Electricity Authority, Annual Report 2005-2006. Government of India, 2006. Chaudhuri, Kausik, and Sugato Dasgupta, “The Political Determinants of Fiscal Policies in the States of
India: An Empirical Investigation,” Journal of Development Studies, 42, 4:640-661, 2006. Dixit, Shantanu, and Girish Sant, “How Reliable are Agricultural Power Use Data?” Economic and
Political Weekly, April 12:754-756, 1997. Dubash, Navroz K., and Sudhir. C. Rajan, “Power Politics Process of Power Sector Reform in India,”
Economic and Political Weekly, September 1:3367-3390, 2001. Goyal, Ashima, “Budgetary Processes: A Political Economy Perspective,” in Sebastian Morris, ed., India
Infrastructure Report 2003. Delhi: Oxford University Press, 2003. Howes Stephen, and Rinku Murgai, “Karnataka: Incidence of Agricultural Power Subsidies: An Estimate,”
Economic and Political Weekly, April 19:1533-1535, 2003. Jain, Varinder, “Political Economy of the Electricity Subsidy: Evidence from Punjab,” Economic and
Political Weekly, September 23:4072-4080, 2006. Katiyar, Sudhir. K., “Political Economy of Electricity Theft in Rural Areas: A Case Study from Rajasthan,”
Economic and Political Weekly, February 12:4072-4080, 2005. Khemani, Stuti, “Political Cycles in a Developing Economy: Effect of Elections in the Indian States,”
Journal of Development Economics, 72, 1:125-154, 2004. Ministry of Agriculture, Report on Agricultural Census 1990-1991. Government of India, 1991. Ministry of Agriculture, Report on Agricultural Census 2000-01. Government of India, 2001. Ministry of Finance, Economic Survey. Various issues, Government of India. Ministry of Information and Broadcasting, Press in India: Annual Report of the Registrar of Newspapers
for India. Government of India, Various issues. Ministry of Power, Annual Report 2007-08, Government of India. 2008. Montalvo, Jose G., and Marta Reynal-Querol, “Ethnic Diversity and Economic Development,” Journal of
Development Economics, 76, 2:293-323, 2005. Pai, Sudha, “Electoral Identity Politics in Uttar Pradesh Hung Assembly Again,” Economic and Political
Weekly, April 06:1334-1341, 2002. Pande, Rohini, “Can Mandated Political Representation Increase Policy Influence for Disadvantaged
Minorities? Theory and Evidence from India,” American Economic Review, 93, 4:1132-1151, 2003. Planning Commission, National Human Development Report 2001. Government of India, 2001. Planning Commission, Annual Report on the Working of State Electricity Boards & Electricity Departments.
Government of India, 2002. Planning Commission, Mid-Term Appraisal of the Tenth Five-Year Plan 2002-2007. Government of India,
2008. Reserve Bank of India, Handbook of Statistics on Indian Economy. 2007. Roy, Kartik. C., and Clement Tisdell, “Budget Deficit and Subsidies: Obstacles to Economic Reform in
India,” The South African Journal of Economics, 66, 1:109-129, 1998. Schwartz, Gerd, and Benedict Clements, “Government Subsidies,” Journal of Economic Surveys, 13,
2:119-147, 1999. Srivastava, D. K., and Bhujanga Rao, “Government Subsidies in India Issues and Approach,” in Edgardo
M Favaro, and Ashok K. Lahiri, eds., Fiscal Policies and Sustainable Growth in India. New Delhi: Oxford University Press, 2004.
Tongia, Rahul, “The Political Economy of Indian Power Sector Reforms,” in David G. Victor, and Thomas C. Heller, eds., The Political Economy of Power Sector Reform: The Experience of Five Major Developing Countries. New York: Cambridge University Press, 2007.
World Bank, India: Power Supply to Agriculture. Washington D.C.: World Bank, 2001. World Bank, World Development Indicators on CD-rom. Washington D.C.: World Bank, 2007.