Embed Size (px)
Citation preview
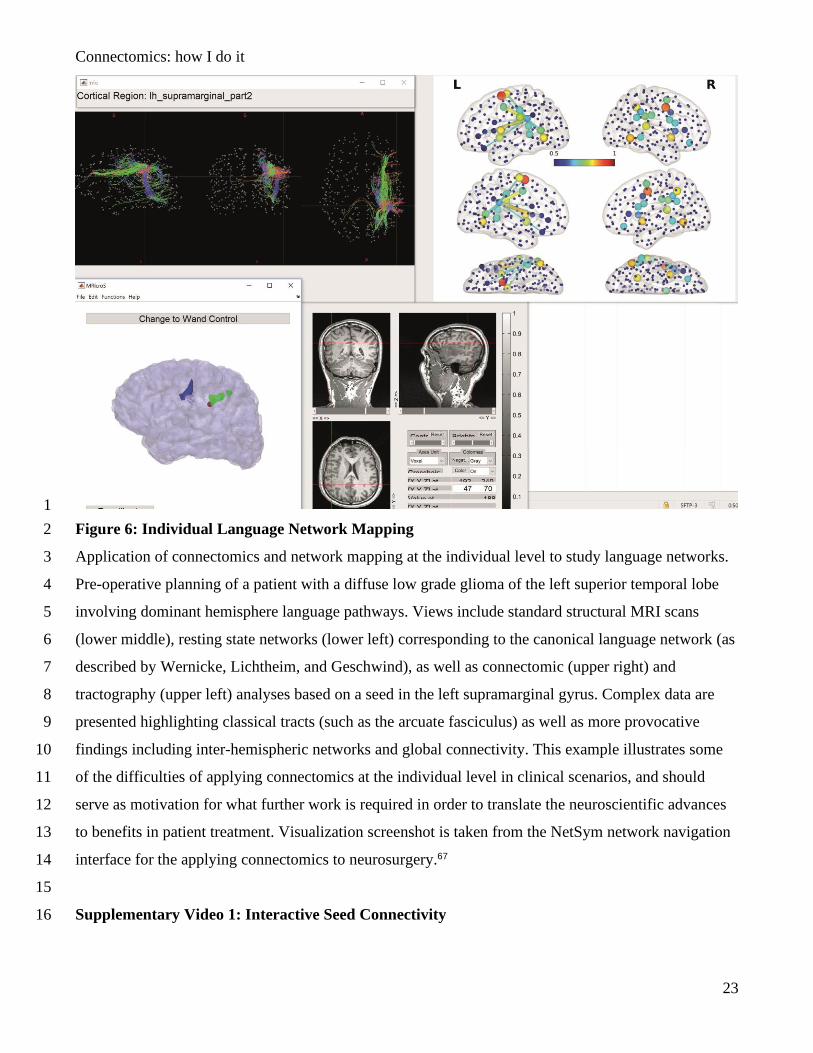
Connectomics: how I do it
1
CONNECTIONS, TRACTS, FRACTALS, AND THE REST: A WORKING GUIDE TO 1
NETWORK AND CONNECTIVITY STUDIES IN NEUROSURGERY 2
3
ABSTRACT 4
5
Brain mapping and connectomics can probe networks that span the entire brain, producing a diverse 6
range of outputs for probing specific clinically relevant questions. Potential for understanding the 7
impact of focal lesions on brain function, cognition, and plasticity abounds, any one of which would 8
likely yield more effective and safer neurosurgical strategies. However, the possibilities of advanced 9
MRI and connectomics are somewhat under utilized in neurosurgery, arising from actual or perceived 10
difficulties in either application or analysis. This review builds on previous work describing the 11
theoretical attractions of connectomics to deliberate on the practical details of doing high quality 12
connectomics studies in neurosurgery. 13
14
Initially, the data and methods involved in deriving connectomic models will be considered, 15
specifically for the purpose of determining the nature of inferences that can be made subsequently. 16
Next, a selection of key analysis methods will be explored using practical examples that illustrate their 17
effective implementation, and the insights that can be gleaned. Principles of study design will be 18
introduced, including analysis tips and means for making efficient use of available resources. Finally, a 19
review of best research practices for neuroimaging studies will be discussed, including principles of 20
open access data sharing, study pre-registration, and methods for improving replicability. Ultimately, 21
we hope the reader will be better placed to appraise the current connectomics studies in neurosurgery as 22
well as empowered to develop their own high-quality studies, both of which are key steps in delivering 23
the true potential of connectomics and advanced neuroimaging analyses in general. 24
25
26
27
28
29
30
31
32
33
Connectomics: how I do it
2
Introduction 1
2
‘There is nothing either good or bad, but thinking makes it so’ 3
Shakespeare, Hamlet, II, ii, 249 4
5
Adoption of new methods and techniques is often polemic, and none more so than when applied within 6
medicine. Neuroimaging analyses can often be particularly contentious due to the frequent 7
development of new methods, perceived complexity of analyses, and the non-trivial demand to 8
consolidate findings with ground truth data. However, this review argues that the fundamental 9
relationship between neurosurgery and neuroanatomy demands a critical appreciation of contemporary 10
brain mapping strategies to properly apply them in a nuanced manner to specific clinical scenarios. 11
Through a series of practical illustrations this review will demonstrate how a judicious application of 12
new brain mapping techniques – specifically connectomics and network analysis – together with 13
careful study design can enhance our understanding of neuroanatomy to answer clinically meaningful 14
questions. 15
16
Applications of an accurate map of functional neuroanatomy to neurosurgery are myriad: neuro-17
oncology, epilepsy, deep brain stimulation, and understanding symptoms relating to focal lesions from 18
a variety of causes (e.g. trauma, vascular) are but a few. Historically, neurosurgery has made many 19
revealing contributions to our understanding of functional neuroanatomy1,2 based on its unique ability 20
to contribute to the characterization of lesions, how they induce plasticity, and post-surgical changes. 21
Furthermore, there are specific complementary mapping techniques that can only be practically applied 22
in neurosurgery (in humans at least), such as electrocorticography and awake brain stimulation.3,4 23
Building on these foundations and linking direct measures of brain activity with neuroimaging and 24
connectomics are two key steps to maximizing the scientific potential of experimental studies involving 25
neurosurgical patients for understanding of brain function. 26
27
Modern approaches to understanding functional neuroanatomy have focused on the paradigms of 28
activity at rest and neuronal connectivity (table 1). Traditional brain mapping focused on localization of 29
task-based activations, but changing focus to the baseline activity (previously considered ‘noise’) 30
opened a previously unrealized opportunity for understanding brain function5 The emergent view is 31
that brain function is already well organized at rest – with much of the task-based functional 32
architecture already present6 – while also encompassing ‘task-negative’ networks that deactivate during 33
Connectomics: how I do it
3
directed mental task.7 Synonymous with this newfound understanding of resting brain function has 1
been the emergence of resting-state functional MRI (rs-fMRI), although other methods are available to 2
study the brain at rest. Connectomics is a related discipline that developed in parallel which seeks to 3
explain brain function in terms of connectivity and distributed processing, drawing on specific aspects 4
of network analysis and graph theory (throughout this review connectomics and network analysis will, 5
therefore, be used synonymously).8 Confidence in these data has been bolstered by experimental 6
replicability, inter-modality concordance, and a robust basis in physical and neurobiological principles. 7
8
Designed for neurosurgeons who wish to take these ideas forward and design their own connectomics 9
studies, this review uses a novel problem-based approach to demystify connectomic analyses. In doing 10
so principles of data acquisition, study design, and research practice will be covered. For those who 11
wish to understand more fundamental aspects of connectomics and network theory in general multiple 12
primers are available both in general and specific to neurosurgery.8–10 Many of the examples and 13
learning points covered are based on our own practical experiences of running connectomics studies in 14
neuro-oncology and functional neurosurgery.11 Ultimately we hope that by presenting these 15
experiences we will aid the development of high quality connectomics research studies that will not 16
only benefit patients, but also provide neuroscientific insights into the many fascinating observations 17
that can be made in everyday neurosurgical practice. 18
19
1. What signal(s) does the connectome comprise? 20
21
Connectomes can be made using a wide variety of neuroimaging and neurophysiological methods 22
(figure 1). Once the data is acquired, the actual connectomics methods (also known as network 23
analysis) are broadly conserved between modalities, and indeed comparisons between imaging 24
acquisitions are a fertile field of research.12–14 However, in order to make useful inferences regarding 25
the constructed networks, it is important to appreciate what the raw data means, and how it is affected 26
by prior processing. 27
28
1a. White Matter & Structural Connectomes 29
30
Structural connectivity is intended to represent a direct physical connection between regions such as an 31
axonal fiber or tract. Such models are typically based on tractography algorithms using diffusion-32

Connectomics: how I do it
4
weighted MRI data,15,16 but can also be based on structural covariance networks using variation in 1
cortical morphological features at the group level.17 Important considerations to remember are: what is 2
being measured (each tract is composed of axon, myelin, and connective tissue), how it is being 3
measured (various models of the above structure inferred by loss of signal from water movement 4
determined by time-delayed resonance pulses) and, again, the volume of connections measured in each 5
voxel (approximately 400m and 4km of dendrites and axons per cubic millimeter, respectively). Issues 6
with tractography can arise in estimating complex tract geometry (e.g. crossing, branching, or bending 7
patterns), determining the site of termination in the grey matter, and modeling fibers over long ranges. 8
These issues have resulted in myriad approaches to analysis without one single gold standard.5,18 While 9
there is a high degree of subjective validation in terms of tract plausibility and correspondence with 10
anatomical tract-tracing methods, quantitative validation has revealed a more concerning picture 11
regarding false positives and replicability.19 In terms of connectomics, however, the reproducibility, 12
sensitivity, and correspondence for tract-based models are high, confirming an important role for their 13
use in network analyses20 14
15
1b. Connectivity & Functional Connectomes 16
17
Analysis of rs-fMRI is based on low-frequency fluctuations in BOLD contrast that are believed to 18
represent physiologically meaningful information and which are closely related to the underlying 19
neural activity.21 Overall, the emergent hypothesis is one of connectivity through coherence: that is, 20
synchronized activity reflects a connection between regions.22 Whether this connection reflects a direct 21
axonal link, shared inputs, or some other modulation of activity as part of a larger network is not 22
implicit in the model and is the subject of ongoing research. Important considerations are the temporal 23
resolution (in the order of seconds), spatial resolution (a single 1mm isotropic voxel will contain the 24
signal of 105 neurons), and the indirect relationship between BOLD contrast and neuronal activity. 25
Finally, functional connectivity is one of many approaches to map brain activity, but perfect 26
concordance between methods (e.g. rs-fMRI and cortical stimulation) is not to be expected and does 27
not necessarily reflect methodological failure; rather, each technique has its own principles that need to 28
be considered for the chosen study design and inference of interest. 29
30
1c. Structural and Functional Network Relations 31
32
Connectomics: how I do it
5
A dichotomous definition of connectomes, as based on either structural or functional connections, 1
inevitably leads to questions pertaining to their relationship in vivo. Early studies13 formed the 2
hypothesis that structure constrains function, with structural connectomes containing the wiring 3
backbone that functional connectomes employ. More recent studies have suggested that this 4
relationship is more complex.23,24 Related to this is the issue of information transfer and how networks 5
choose a particular route for communication.25 Overall, the emerging viewpoint is that while structural 6
connectomes provide the available routes for neurons to exchange data, functional connectomes also 7
reflect additional features such as indirect connections, shared inputs, or synaptic changes.26 Therefore, 8
it is clear that both approaches are required, as is understanding of their limitations, complementarity, 9
and synergism. 10
11
1d. Considerations in Networks Construction 12
13
Connectome analysis itself, regardless of whether based on structural or functional data, also contains 14
methodological characteristics that influence subsequent inferences. Effective connectivity defines 15
causal patterns of neuronal activations or repeating patterns of neural organization (motifs) but neither 16
of the aforementioned MRI techniques allow this analysis approach.27 Network density has historically 17
been believed to be sparse but contemporary tract-tracing studies in mice suggest a more densely 18
connected network.28 Typically functional connectivity networks have connections for every pair of 19
regions (often known as fully connected, and subsequently thresholded to reduce this density) while 20
tractography based structural networks are relatively sparse (most pairs of regions do not have a 21
connection between them). Finally, there may be multiple models (or layers) of connectivity within a 22
single brain29 that vary across time and are determined by other factors such as genetics, development, 23
environment, and disease. 24
25
In summary, we should consider connectomics as a model to allow new insights into meaningful 26
clinical questions, but with its own unique set of challenges that need to be addressed during this 27
process. Some considerations relate to that underlying data, while others are distinct from the specific 28
data acquisition used and relate to the network analysis itself. 29
30
2. How to process connectomics data? 31
32
Connectomics: how I do it
6
Neuroimaging data requires processing prior to it being suitable for connectomics (figure 2). In brief, 1
these steps aim to reduce and quantify artifacts thereby increasing the signal to noise ratio. There is no 2
universally agreed pipeline therefore the following guidelines are based on the principle of minimal 3
pre-processing, in keeping with other recent datasets.30 With this review focusing on the principles 4
underlying study design, the actual acquisition of sequences will not be covered in lieu of the many 5
excellent resources available to interested readers.3131 6
7
For rs-fMRI the main aim is to reduce or quantify motion-related and other artifacts while focusing on 8
the underlying low-frequency fluctuations of BOLD contrast in the gray matter. In addition, some form 9
of de-noising is required to remove artifacts. Note that de-noising and motion correction are complex 10
fields with an extensive existing literature.32 Decisions during sequence acquisition include the 11
repetition time (TR) and sequence duration (which in turn will determine the number of volumes 12
available), the resolution and field of view (which impact on TR), and whether any de-noising 13
strategies are required to be built in at this stage. 14
15
Diffusion imaging also aims to reduce errors due to movement but in addition those due to current-16
induced distortions. After this initial processing one can either analyze the underlying voxel-based 17
diffusion data (e.g. FA or MD maps) or perform tractography. This latter step involves creating a 18
model of the underlying fiber direction(s) in each voxel then propagating this to generate a streamline, 19
ideally from seed to gray matter termination. Similar to rs-fMRI there is a vast and contentious 20
literature on means and validity of applying any specific model.19 Sequences available for performing 21
tractography are growing in addition to the historical diffusion tensor imaging and now focus on 22
improved resolution of fiber orientations33,34 or tissue parameterization.35 23
24
3. Approaches to Network Analysis 25
26
Many different techniques or approaches can be used for connectivity analyses. The following 27
examples illustrate how distinct network analysis approaches can be used to provide insight into 28
clinically meaningful neurosurgical questions. Therefore, the following section is not intended to be 29
exhaustive nor prescriptive in the analyses that can or cannot be performed, and interested readers are 30
directed to other comprehensive papers focused specifically in this area36,37. 31
32
3a. Peri-tumoral region & local functional capacity 33

Connectomics: how I do it
7
1
An appropriate start to analyzing fMRI data acquired at rest is with voxel-based (point estimate) 2
methods that characterize the underlying BOLD time-series (figure 3) creating a variety of maps (table 3
2).38–41 Such methods directly measure the properties of the low frequency (around 0.5Hz) fluctuations 4
in the BOLD signal believed to contain physiologically meaningful information.21 These maps lend 5
themselves to understanding the spatial distribution of any subsequently observed network changes, 6
and are often related to fundamental components of the underlying neural processes. 7
8
Fractals are one such feature reflecting the complexity of the acquired signal; increased complexity is 9
believed to convey a physiological advantage in information processing capacity42–46(as an analogy, 10
consider bandwidth and internet speed). In patients with glioblastoma, a penumbra of reduced cortical 11
complexity was found adjacent to the lesion that with increasing distance increased above baseline 12
before returning to baseline. These findings disprove a purely localizationist approach to understanding 13
the functional effects of focal lesions, and suggest that subsequent analyses should consider global 14
effects in their approach. 15
16
In summary, voxel-based measures of BOLD signals offer an insight into the complexity that, as we 17
shall explore later, complements the spatially diverse approaches of functional networks at rest and the 18
mathematical properties of graph theory connectomics. Determining what these measures probe in 19
individual patients requires cross-referencing with neurocognitive data, but it may reflect the 20
underlying neurophysiological function rather than a detectable phenotypic change. Overall, voxel-21
based measures are often an appropriate place to start an analysis and can be used to help understand 22
the local basis of more global changes. Furthermore, they are particularly attractive for testing selected 23
topological hypotheses related to distance or asymmetries. 24
25
3b. Higher Cognitive Function Mapping & Resting-State Networks 26
27
Resting-state networks (RSNs) were one of the early findings that led to appreciation of the 28
significance represented by brain activity at rest (figure 4 and supplementary video 1).5,47 Template 29
resting-state networks derived from groups of healthy participants have been identified which 30
correspond to task performance,6 healthy development,48 and disease.49 These networks cover a wide 31
constellation of both primary cortex functions (visual, sensorimotor, auditory) as well as higher 32
Connectomics: how I do it
8
cognitive function networks such as attention, salience, executive function, accessory visual areas and 1
potentially language (supplementary video 1). It is this ready access to multiple readily defined 2
network topologies what makes resting-state network analysis so attractive to neurosurgery, for 3
example in investigating the functional effects of surgery, increasing our understanding of disease 4
pathophysiology, and developing novel biomarkers of treatment response. 5
6
One use of resting-state networks can be in developing a more holistic view of brain function and how 7
function can be affected by neurosurgery. In an early exploratory analysis of a homogeneous cohort of 8
patients with right parietal glioblastoma, numerous qualitative changes have been described in multiple 9
higher cognitive function networks but particularly in the default mode network, a region believed to be 10
involved in automated information processing and cognitive flexibility.50 This insight allows one to go 11
beyond understanding the typical focal deficits that might be expected for lesions in this location (for 12
example those related to apraxia, hemianopia and hemisensory changes), and develop novel 13
neuropsychology paradigms for testing hypotheses related to the higher cognitive function networks 14
that may be involved (for example with novel intra-operative tasks during awake brain stimulation or 15
focused post-operative rehabilitation). 16
17
Resting-state networks can also be used as an objective biomarker of treatment response and for 18
studying the effects of neurosurgical intervention on higher cognitive function. In a landmark paper 19
investigating the role of nucleus accumbens deep brain stimulation for obsessive compulsive disorder, 20
connectivity between the nucleus accumbens and prefrontal cortex based on resting-state fMRI 21
demonstrated a linear correlation with treatment response.51 Thus, the authors were able to demonstrate 22
non-local effects of deep brain stimulation, alteration of disease pathophysiology, and suggest a novel 23
biomarker of treatment effectiveness. 24
25
In summary, resting-state networks demonstrate how one can move beyond localization and gain a 26
more holistic insight into patient’s higher cognitive function using a relatively straightforward analysis. 27
Clinical translation opportunities are myriad and include tailored rehabilitation, detailed pre-operative 28
counseling and objective biomarkers of treatment response (for example titrating parameters of DBS 29
during follow-up). Ongoing research into understanding the underlying biological mechanisms 30
involved in RSN dynamics developing methods for statistical comparisons at the individual subject 31
level52 and optimizing acquisition and analysis strategies to maximize intra and inter-subject 32
reliability53 is only likely to increase the applicability of these analysis methods. 33

Connectomics: how I do it
9
1
3c. Distributed Effects of Empirical & in silico Lesions with Connectomics 2
3
The connectome is a term coined over a decade ago that encapsulated the search for the ‘wiring 4
diagram’ of the brain (Figure 5).54,55 Viewing the brain in this manner considers the brain to be a small 5
world56,57 – whereby segregated local communities are married together and complemented by long 6
distance links and short cuts – forming a complex network topology (along with other key 7
organizational principles such as scale-free degree distribution, hubs, community architecture, rich 8
clubs, and weak links). Connectome analysis is attractive to neurosurgeons for this holistic model of 9
brain connectivity, its novel mathematical vocabulary for describing brain function, and the manner in 10
which it lends itself to intuitive modeling strategies, for example, the effects of focal lesions and 11
plasticity. 12
13
Phineas Gage is a landmark example for illustrating the effects of focal frontal lobe lesions that is 14
particularly applicable to neurosurgery. In an elegant and multi-faceted re-appraisal of the case, the 15
effects of the sustained focal lesion were modeled using a computational simulation of the original 16
penetrating injury, accurate mapping of this injury onto a standard template brain, then using this lesion 17
as an in silico structural lesion onto a control connectome generated from healthy individuals to 18
simulate its potential functional effects.58 This allows one to see that what was originally believed to be 19
a focal lesion with effects localized to the non-dominant frontal lobe, was actually a diffuse injury 20
involving long-range inter- and intra-hemispheric connections. Opportunities for further work abound 21
including how to model the effects of recovery or plasticity, determining the secondary insults such as 22
infection that were believed to have occurred, and defining how the network topology related to seizure 23
generation (which eventually led to his demise). 24
25
Developing this concept of non-local effects of focal lesions, an empirical dataset of patients with 26
glioblastoma with connectomes generated from their own resting-state functional MRI data was 27
studied.59 Here, virtual or in silico lesioning was used to develop ‘connectomic signatures’ predicted to 28
be at risk from surgery, thus highlighting individual phenotypes and connectivity beyond that 29
encompassed by the standard structural imaging. An additional benefit of this study was the 30
confirmation that individual connectomes could be created using a variety of both simple and more 31
sophisticated methodologies in patients with empirical lesions, requiring only minor adjustment to 32
pipelines used in otherwise healthy individuals (figure 5). 33
Connectomics: how I do it
10
1
Understanding complex non-linear dynamics of lesions was performed using a ‘Virtual Brain’ 2
simulator based on empirical lesions. In this study, a cohort of patients with gliomas and meningiomas 3
underwent DTI & rs-fMRI, but additionally, a computational model of neural dynamics was used in 4
combination with the underlying empirical tractography data to create individualized virtual brains that 5
mirrored the empirical rs-fMRI data.60 Distinct individual signatures were identified that described 6
whether brain regions are directly affected by a tumor or not. These results suggest that personalized 7
virtual brain models contribute additional information into our understanding of the effects of focal 8
lesions, and have the potential to be used for individualized brain mapping. 9
10
Expanding upon this understanding of the static effects of focal lesions, a longitudinal study was 11
performed to characterize lesion-related plasticity and reorganization after surgery. Here a cohort of 6 12
participants with a transient supplementary motor area syndrome following awake brain surgery for 13
diffuse low grade glioma was studied longitudinally at baseline, post-operatively, and 3 months follow-14
up.61 This highlighted inter-hemispheric dynamic changes relating to connectivity between the 15
contralateral supplementary motor area and ipsilateral sensory-motor regions that mirrored clinical 16
recovery. Whether these promising results can be used to create novel non-invasive biomarker of lesion 17
related plasticity remains to be seen, and will naturally require participants with a less than complete 18
recovery to be included too. 19
20
Connectomics has established itself at the forefront in the modern brain mapping era and is 21
conceptually appealing while offering a novel global mathematical approach to functional 22
neuroanatomy. Studies have already shown the promise of connectomics for understanding non-local 23
effects of lesions, studying non-linear dynamics of empirical lesions, and in developing biomarkers of 24
plasticity to predict post-operative outcomes. Terms such as cognitive eloquence, hubs, and weak links 25
are quickly establishing themselves in the modern lexicon of brain mapping (table 1), but whether they 26
define themselves as markers used in neurosurgery will depend on whether the appropriately designed 27
studies can prove their worth at the individual level (figure 6). 28
29
4. Statistical & Methodological Considerations in Designing Connectomics Studies 30
31
First and foremost, one must have a clear and meaningful research question with objective aims for the 32
study. Dependent on this will be the study design, analysis strategy, and indeed whether it is even 33
Connectomics: how I do it
11
tractable with currently available methods. For certain questions pursuing a group-based comparison 1
may be most appropriate, therefore consideration of what comprises a relevant control population is 2
paramount. However, for other questions individual predications may be more relevant, therefore a 3
challenge for this design is requiring sufficient density of data, for example through multimodal 4
sampling and longitudinal study designs. Connectomics research from its inception has been multi-5
disciplinary, involving the fields of mathematics, computer science, engineering, neuroimaging, 6
neuropsychology, and social science to name a few. Taking time to engage and involve experts from 7
such diverse fields early on will not only lead to unique opportunities within the study but will also 8
leverage this key advantage of the field. 9
10
There are also important ‘traps’ that one should be careful not to fall into when designing studies. 11
Exploratory studies are fundamentally different from what are often termed in the vernacular ‘fishing’ 12
strategies. Therefore, one must be clear from the start whether this is a hypothesis generating study, or 13
whether a clear hypothesis is being tested a priori. One must also avoid circular analysis strategies 14
whereby the same data is used to define and test models of function counteracted.62 Finally, robust 15
consideration should be paid to the sample size early on to prevent studies that are either under 16
powered from the outset, or over ambitious and subsequently transpire to capture insufficient data. 17
18
Finally, one must consider the necessary financial, logistical, and technical resources, and addressing 19
any discord of these are not available. Evidently one needs to invest properly in high quality data as 20
this cannot be compensated for subsequently, for example by sophisticated analyses (including 21
machine learning techniques). One way to manage this would be to foster collaborations between 22
groups with complementary skillsets or shared computational resources. Multinational initiatives to 23
foster collaborations already exist in neurosurgery, for example the successful global neurotrauma 24
program, and there may be a role for similar resources to support neuroimaging and connectomics 25
research in neurosurgery. Another approach is to use freely available datasets to complement clinical 26
data, such as the Human Connectome Project or OpenfMRI repository. While these issues may not 27
initially appear to be a priority, post-hoc compromise due to inaccurate appreciation of available or 28
required resources can usurp a hitherto robust study design, leading to underpower studies without 29
reproducible findings. 30
31
Discussion 32
33

Connectomics: how I do it
12
Application of advanced neuroimaging and connectivity analyses to neurosurgery has much to offer in 1
terms of providing insight to fundamental neuroscience, biomarkers of disease, and understanding 2
cognitive outcomes. It is hoped that this review acts as a primer for developing high quality individual 3
network studies. For further development of these ideas and more detailed discussion of imaging and 4
network processing methods a diverse and detailed literature is available.10,31,36,37,63 5
6
When reflecting on principles of study design it is also worth considering other desirable features of 7
research practice in general that can be implementing. Open access and data sharing are not just 8
important for validity of research, but also allow learning about analysis strategies and development of 9
new analysis tools.64,65 Nevertheless, while data sharing is common within neuroimaging, it is still 10
something of a rarity in neurosurgery. Finally, research should be affordable, not just to allow value for 11
money for the funding organizations and charities, but also to allow use of the research output and 12
establishment of the research itself in lower income countries. 13
14
One notable issue for neuroimaging and cognitive research in general refers to generalizability and 15
replicability of findings66. The aforementioned data sharing and open access will help in this regard as 16
independent groups can perform their own analyses on the same data which may either enhance the 17
legitimacy of the findings if consistent, or caution against errors or over-interpretation otherwise. 18
Pre-registration is another helpful method that is currently underutilized. All these approaches should 19
be seen as positives and necessary hurdles to overcome for generating robust scientific findings that 20
minimize the number of false trails one is sent down, and facilitate understanding the neuroscientific 21
basis of the data more efficiently. 22
23
Conclusions 24
25
‘There is nothing either good or bad, but thinking makes it so’ 26
Shakespeare, Hamlet, II, ii, 249 27
28
Whereas Shakespeare used the above quotation to highlight Hamlet’s toying with his old friends 29
Rosencrantz and Guildenstern, here it is used in a contemporary and more philosophical context, 30
suggesting that fundamentally there is no good or bad analysis technique, but rather it is dependent on 31
the manner in which the study is designed. In this case, the thinking (or art) is in choosing an 32
interesting study question and designing the experiment in such a manner to appropriately answer it, 33

Connectomics: how I do it
13
rather than in the use (or not) of any given technology. Connectomics, like any other research field, 1
requires due care and thought at the study design phase to harness its power, and is not a panacea that 2
will produce relevant results regardless of the study design. We hope the reader will now be better 3
placed to understand the potential attractions and benefits of advanced neuroimaging and connectomic 4
analyses, but also be in a position to translate this knowledge into effective research studies. Carefully 5
designed and analyzed studies are not only necessary but a priority for the field to grow and improve 6
the treatments we offer our patients. 7
8
ACKNOWLEDGEMENTS 9
Nil to declare. 10
11
REFERENCES 12
13
1. Greenblatt SH, Dagi TF, Epstein MH. A History of Neurosurgery: In Its Scientific and Professional 14
Contexts. AANS, 1997. 15
2. Penfield W, Rasmussen T. The Cerebral Cortex of Man. New York. Macmillan, 1950. 16
3. Borchers S, Himmelbach M, Logothetis N, Karnath H-O. Direct electrical stimulation of human 17
cortex - the gold standard for mapping brain functions? Nat Rev Neurosci. 2011;13(1):63-70. 18
doi:10.1038/nrn3140 19
4. Winkler PA. Extraoperative Electrical Mapping. In: Duffau H, eds. Brain Mapping, From Neural 20
Basis of Cognition to Surgical Applications. Vienna, Springer; 2011:91-100. doi:10.1007/978-3-7091-21
0723-2_7 22
5. Raichle ME. Two views of brain function. Trends Cogn Sci. 2010;14(4):180-190. 23
doi:10.1016/j.tics.2010.01.008 24
6. Smith SM, Fox PT, Miller KL, et al. Correspondence of the brain’s functional architecture during 25
activation and rest. Proc Natla Acad Sci USA. 2009;106(31):13040-13045. 26
doi:10.1073/pnas.0905267106 27
7. Zhang D, Raichle ME. Disease and the brain’s dark energy. Nat Rev Neurol. 2010;6(1):15-28. 28
doi:10.1038/nrneurol.2009.198 29
8. Bullmore E, Sporns O. Complex brain networks: graph theoretical analysis of structural and 30
functional systems. Nat Rev Neurosci. 2009;10(3):186-198. doi:10.1038/nrn2575 31
9. Hart MG, Ypma RJF, Romero-Garcia R, Price SJ, Suckling J. Graph theory analysis of complex 32
brain networks: new concepts in brain mapping applied to neurosurgery. J Neurosurg. 33
2016;124(6):1665-1678. doi:10.3171/2015.4.jns142683 34

Connectomics: how I do it
14
10. Zalesky A, Breakspear M. The connectomics of brain disorders. Nat Rev Neurosci. 2015;16(3):159-1
172. doi:10.1038/nrn3901 2
11. Hart MG. Connectomics and Electrical Stimulation for Augmenting Resection (CAESAR). 3
http://www.mrmikehart.com/caesar.html. Accessed 12 March 2020. 4
12. Cabral J, Hugues E, Kringelbach ML, Deco G. Modeling the outcome of structural disconnection 5
on resting-state functional connectivity. NeuroImage. 2012;62(3):1342-1353. 6
doi:10.1016/j.neuroimage.2012.06.007 7
13. Honey CJ, Thivierge J-P, Sporns O. Can structure predict function in the human brain? 8
NeuroImage. 2010;52(3):766-776. doi:10.1016/j.neuroimage.2010.01.071 9
14. Sporns O, Tononi G, Edelman GM. Theoretical neuroanatomy and the connectivity of the cerebral 10
cortex. Behav Brain Res. 2002;135(1-2):69-74. doi:10.1016/s0166-4328(02)00157-2 11
15. Hagmann P, Cammoun L, Gigandet X, et al. Mapping the Structural Core of Human Cerebral 12
Cortex. Friston KJ, ed. PLoS biology. 2008;6(7):e159. doi:10.1371/journal.pbio.0060159 13
16. Hagmann P, Kurant M, Gigandet X, et al. Mapping Human Whole-Brain Structural Networks with 14
Diffusion MRI. Sporns O, ed. PLoS ONE. 2007;2(7):e597. doi:10.1371/journal.pone.0000597 15
17. Alexander-Bloch A, Giedd JN, Bullmore E. Imaging structural co-variance between human brain 16
regions. Nat Rev Neurosci. 2013;14(5):322-336. doi:10.1038/nrn3465 17
18. Bihan DL. Looking into the functional architecture of the brain with diffusion MRI. Nat Rev 18
Neurosci. 2003;4(6):469-480. doi:10.1038/nrn1119 19
19. Maier-Hein KH, Neher PF, Houde J-C, et al. The challenge of mapping the human connectome 20
based on diffusion tractography. Nature Commun. 2017;8(1):1349. doi:10.1038/s41467-017-01285-x 21
20. Sotiropoulos SN, Zalesky A. Building connectomes using diffusion MRI: why, how and but. NMR 22
in biomedicine. June 2017. doi:10.1002/nbm.3752 23
21. Logothetis NK, Wandell BA. Interpreting the BOLD Signal. Annu Rev Physiol.. 2004;66(1):735-24
769. doi:10.1146/annurev.physiol.66.082602.092845 25
22. Fries P. Rhythms for Cognition: Communication through Coherence. Neuron. 2015;88(1):220-235. 26
doi:10.1016/j.neuron.2015.09.034 27
23. Betzel RF, Medaglia JD, Papadopoulos L, et al. The modular organization of human anatomical 28
brain networks: Accounting for the cost of wiring. Network Neuroscience. 2017;1(1):42-68. 29
doi:10.1162/netn_a_00002 30
24. Mišić B, Betzel RF, Reus MA de, et al. Network-Level Structure-Function Relationships in Human 31
Neocortex. Cerebral cortex. 2016;26(7):3285-3296. doi:10.1093/cercor/bhw089 32
Connectomics: how I do it
15
25. Avena-Koenigsberger A, Mišić B, Hawkins RXD, et al. Path ensembles and a tradeoff between 1
communication efficiency and resilience in the human connectome. Brain Struct Funct. June 2016:1-2
16. doi:10.1007/s00429-016-1238-5 3
26. Petersen SE, Sporns O. Brain Networks and Cognitive Architectures. Neuron. 2015;88(1):207-219. 4
doi:10.1016/j.neuron.2015.09.027 5
27. Rubinov M, Sporns O. Complex network measures of brain connectivity: Uses and interpretations. 6
NeuroImage. 2010;52(3):1059-1069. doi:10.1016/j.neuroimage.2009.10.003 7
28. Rubinov M, Ypma RJF, Watson C, Bullmore ET. Wiring cost and topological participation of the 8
mouse brain connectome. Proc Natl Acad Sci USA. 2015;112(32):10032-10037. 9
doi:10.1073/pnas.1420315112 10
29. Deco G, Boly M. Rethinking segregation and integration: contributions of whole-brain modelling. 11
Nat Rev Neurosci. 2015;16(7):430-439. doi:10.1038/nrn3963 12
30. Glasser MF, Sotiropoulos SN, Wilson JA, et al. The minimal preprocessing pipelines for the 13
Human Connectome Project. NeuroImage. 2013;80(C):105-124. 14
doi:10.1016/j.neuroimage.2013.04.127 15
31. Craddock RC, Jbabdi S, Yan C-G, et al. Imaging human connectomes at the macroscale. Nat 16
Methods. 2013;10(6):524-539. doi:10.1038/nmeth.2482 17
32. Power JD, Schlaggar BL, Petersen SE. Recent progress and outstanding issues in motion correction 18
in resting state fMRI. NeuroImage. 2015;105:536-551. doi:10.1016/j.neuroimage.2014.10.044 19
33. Jensen JH, Helpern JA, Ramani A, Lu H, Kaczynski K. Diffusional kurtosis imaging: The 20
quantification of non‐gaussian water diffusion by means of magnetic resonance imaging. Magn Reson 21
Med. 2005;53(6):1432-1440. doi:10.1002/mrm.20508 22
34. Wedeen VJ, Hagmann P, Tseng W-YI, Reese TG, Weisskoff RM. Mapping complex tissue 23
architecture with diffusion spectrum magnetic resonance imaging. Magn Reson Med. 2005;54(6):1377-24
1386. doi:10.1002/mrm.20642 25
35. Zhang H, Schneider T, Wheeler-Kingshott CA, Alexander DC. NODDI: practical in vivo neurite 26
orientation dispersion and density imaging of the human brain. NeuroImage. 2012;61(4):1000-1016. 27
doi:10.1016/j.neuroimage.2012.03.072 28
36. Margulies DS, Böttger J, Long X, et al. Resting developments: a review of fMRI post-processing 29
methodologies for spontaneous brain activity. Magma (New York, NY). 2010;23(5-6):289-307. 30
doi:10.1007/s10334-010-0228-5 31
37. Smith SM, Vidaurre D, Beckmann CF, et al. Functional connectomics from resting-state fMRI. 32
Trends Cogn Sci. 2013;17(12):666-682. doi:10.1016/j.tics.2013.09.016 33

Connectomics: how I do it
16
38. Gracia-Tabuenca Z, Moreno MB, Barrios FA, Alcauter S. Hemispheric asymmetry and homotopy 1
of resting state functional connectivity correlate with visuospatial abilities in school-age children. 2
NeuroImage. 2018;174:441-448. doi:10.1016/j.neuroimage.2018.03.051 3
39. Taylor PA, Saad ZS. FATCAT: (An Efficient) Functional And Tractographic Connectivity 4
Analysis Toolbox. Brain connectivity. 2013;3(5):523-535. doi:10.1089/brain.2013.0154 5
40. Zang Y, Jiang T, Lu Y, He Y, Tian L. Regional homogeneity approach to fMRI data analysis. 6
NeuroImage. 2004;22(1):394-400. doi:10.1016/j.neuroimage.2003.12.030 7
41. Zou Q-H, Zhu C-Z, Yang Y, et al. An improved approach to detection of amplitude of low-8
frequency fluctuation (ALFF) for resting-state fMRI: fractional ALFF. J Neurosci Methods. 9
2008;172(1):137-141. doi:10.1016/j.jneumeth.2008.04.012 10
42. Goldberger AL, Amaral LAN, Hausdorff JM, Ivanov PC, Peng C-K, Stanley HE. Fractal dynamics 11
in physiology: alterations with disease and aging. Proc Natl Acad Sci USA. 2002;99 Suppl 12
1(Supplement 1):2466-2472. doi:10.1073/pnas.012579499 13
43. Ivanov PC, Amaral LAN, Goldberger AL, et al. From 1/f noise to multifractal cascades in heartbeat 14
dynamics. Chaos (Woodbury, NY). 2001;11(3):641-652. doi:10.1063/1.1395631 15
44. Maxim V, Şendur L, Fadili J, et al. Fractional Gaussian noise, functional MRI and Alzheimer’s 16
disease. NeuroImage. 2005;25(1):141-158. doi:10.1016/j.neuroimage.2004.10.044 17
45. Suckling J, Wink A-M, Bernard FA, Barnes A, Bullmore E. Endogenous multifractal brain 18
dynamics are modulated by age, cholinergic blockade and cognitive performance. J Neurosci Methods 19
2008;174(2):292-300. doi:10.1016/j.jneumeth.2008.06.037 20
46. Wink A-M, Bullmore E, Barnes A, Bernard F, Suckling J. Monofractal and multifractal dynamics 21
of low frequency endogenous brain oscillations in functional MRI. Human Brain Mapping. 22
2008;29(7):791-801. doi:10.1002/hbm.20593 23
47. Biswal B, Yetkin FZ, Haughton VM, Hyde JS. Functional connectivity in the motor cortex of 24
resting human brain using echo-planar MRI. Magn Reson Med. 1995;34(4):537-541. 25
48. Ernst M, Torrisi S, Balderston N, Grillon C, Hale EA. fMRI functional connectivity applied to 26
adolescent neurodevelopment. Annu Rev Clin Psychol. 2015;11:361-377. doi:10.1146/annurev-clinpsy-27
032814-112753 28
49. Heuvel MP van den, Pol HEH. Exploring the brain network: A review on resting-state fMRI 29
functional connectivity. Euro psychopharmacol. 2010;20(8):519-534. 30
doi:10.1016/j.euroneuro.2010.03.008 31
50. Vatansever D, Menon DK, Stamatakis EA. Default mode contributions to automated information 32
processing. Proc Natl Acad Sci USA. 2017;114(48):12821-12826. doi:10.1073/pnas.1710521114 33
51. Figee M, Luigjes J, Smolders R, et al. Deep brain stimulation restores frontostriatal network 34
activity in obsessive-compulsive disorder. Nature Neurosci. 2013;16(4):386-387. doi:10.1038/nn.3344 35

Connectomics: how I do it
17
52. Kundu P, Brenowitz ND, Voon V, et al. Integrated strategy for improving functional connectivity 1
mapping using multiecho fMRI. Proc Natl Acad Sci USA. 2013;110(40):16187-16192. 2
doi:10.1073/pnas.1301725110 3
53. Laumann TO, Gordon EM, Adeyemo B, et al. Functional System and Areal Organization of a 4
Highly Sampled Individual Human Brain. Neuron. 2015;87(3):657-670. 5
doi:10.1016/j.neuron.2015.06.037 6
54. Hagmann P. From diffusion MRI to brain connectomics [PhD Thesis]. Ecole Polytechnique 7
Fédérale de Lausanne (EPFL). 8
55. Sporns O, Tononi G, Kötter R. The Human Connectome: A Structural Description of the Human 9
Brain. PLoS Computational Biology. 2005;1(4):e42. doi:10.1371/journal.pcbi.0010042 10
56. Bassett DS, Bullmore ET. Small-World Brain Networks Revisited. The Neuroscientist : a review 11
journal bringing neurobiology, neurology and psychiatry. 2016;23(5):499-516. 12
doi:10.1177/1073858416667720 13
57. Watts DJ, Strogatz SH. Collective dynamics of ’small-world’networks. Nature. 1998. 14
doi:10.1038/30918 15
58. Horn JDV, Irimia A, Torgerson CM, Chambers MC, Kikinis R, Toga AW. Mapping Connectivity 16
Damage in the Case of Phineas Gage. Sporns O, ed. PLoS ONE. 2012;7(5):e37454. 17
doi:10.1371/journal.pone.0037454 18
59. Hart MG, Price SJ, Suckling J. Connectome analysis for pre-operative brain mapping in 19
neurosurgery. Br J Neurosurg. 2016;30(5):506-517. doi:10.1080/02688697.2016.1208809 20
60. Aerts H, Schirner M, Jeurissen B, et al. Modeling Brain Dynamics in Brain Tumor Patients Using 21
the Virtual Brain. eNeuro. 2018;5(3):ENEURO.0083-18.2018. doi:10.1523/eneuro.0083-18.2018 22
61. Vassal M, Charroud C, Deverdun J, et al. Recovery of functional connectivity of the sensorimotor 23
network after surgery for diffuse low-grade gliomas involving the supplementary motor area. J 24
Neurosurg. June 2016:1-10. doi:10.3171/2016.4.jns152484 25
62. Kriegeskorte N, Simmons WK, Bellgowan PSF, Baker CI. Circular analysis in systems 26
neuroscience: the dangers of double dipping. Nature Neurosci. 2009;12(5):535-540. 27
doi:10.1038/nn.2303 28
63. Castellanos FX, Martino AD, Craddock RC, Mehta AD, Milham MP. Clinical applications of the 29
functional connectome. NeuroImage. 2013;80:527-540. doi:10.1016/j.neuroimage.2013.04.083 30
64. Nichols TE, Das S, Eickhoff SB, et al. Best practices in data analysis and sharing in neuroimaging 31
using MRI. Nat Neurosci. 2017;20(3):299-303. doi:10.1038/nn.4500 32
65. Poldrack RA, Gorgolewski KJ. Making big data open: data sharing in neuroimaging. Nat Neurosci. 33
2014;17(11):1510-1517. doi:10.1038/nn.3818 34
Connectomics: how I do it
18
66. Buck S. Solving reproducibility. Science. 2015;348(6242):1403-1403. doi:10.1126/science.aac8041 1
67. Romero-Garcia R, Erez Y, Oliver G, et al. Practical Application of Networks in Neurosurgery: 2
Combined 3-Dimensional Printing, Neuronavigation, and Preoperative Surgical Planning. World 3
Neurosurg. 2020. doi:10.1016/j.wneu.2020.01.085 4
5
FIGURE LEGENDS 6
7
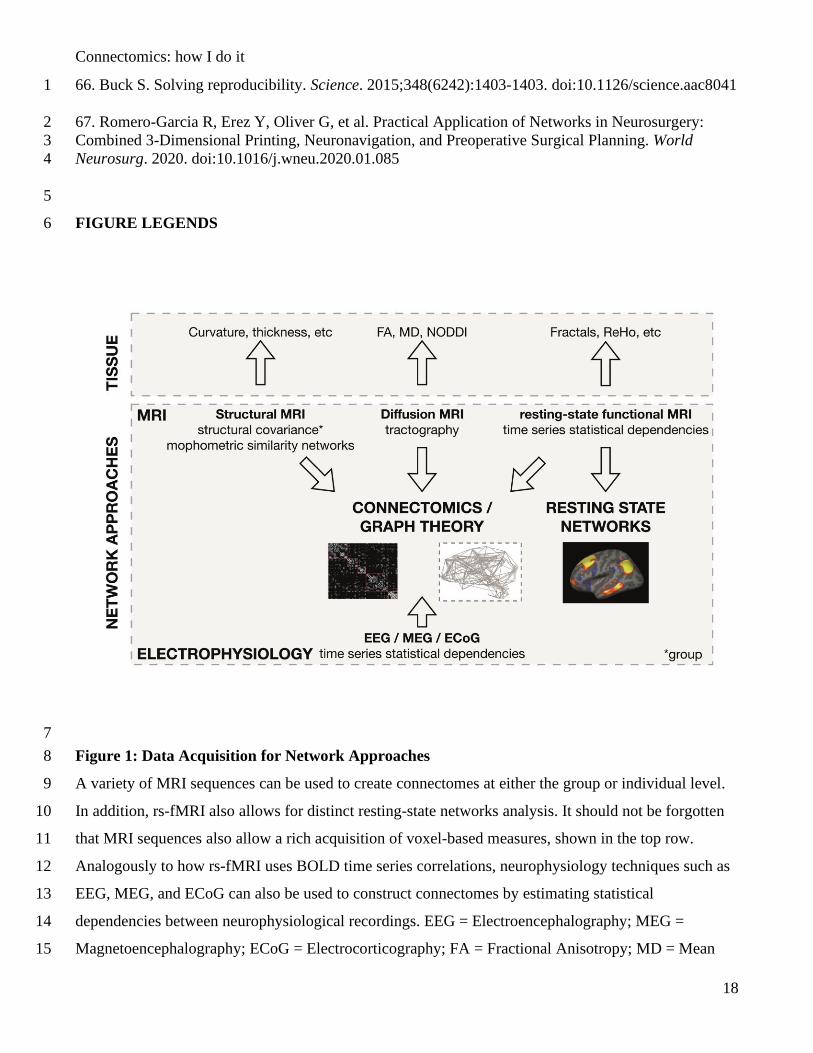
Figure 1: Data Acquisition for Network Approaches 8
A variety of MRI sequences can be used to create connectomes at either the group or individual level. 9
In addition, rs-fMRI also allows for distinct resting-state networks analysis. It should not be forgotten 10
that MRI sequences also allow a rich acquisition of voxel-based measures, shown in the top row. 11
Analogously to how rs-fMRI uses BOLD time series correlations, neurophysiology techniques such as 12
EEG, MEG, and ECoG can also be used to construct connectomes by estimating statistical 13
dependencies between neurophysiological recordings. EEG = Electroencephalography; MEG = 14
Magnetoencephalography; ECoG = Electrocorticography; FA = Fractional Anisotropy; MD = Mean 15

Connectomics: how I do it
19
Diffusivity; NODDI = Neurite Orientation Dispersion and Density Imaging; ReHo = regional 1
homogeneity. 2
3
4
5
Figure 2: Neuroimaging Data Processing 6
A neuroimaging processing pipeline matrix. Top row (left to right): rs-fMRI, MPRAGE, diffusion 7
imaging data for tractography are acquired in their raw format. Middle row (left to right): above data 8
has been processed in preparation for analysis and modeling. Structural imaging potential steps are: 9
lesion segmentation; intensity normalization; and brain extraction. Optionally further segmentation 10
(e.g. into grey and white matter) and cortical surface reconstruction can be performed. For rs-fMRI 11
options include: rigid-body motion correction; bandpass filtering; B0 correction; brain extraction; and 12
smoothing. For diffusion imaging options include: re-orientation; brain extraction; and eddy current 13
correction. Finally, registrations can be performed from either functional or diffusion space to 14
structural (MPRAGE) space using linear algorithms and from structural to standard space using non-15
Connectomics: how I do it
20
linear registration. Once a standard space mapping has been performed one can use parcellation 1
templates to perform connectomics or analyze group lesion effects (for example voxel-based lesion-2
symptom mapping or resection-probability maps). Note that analysis of rs-fMRI and diffusion data is 3
often performed in the subject’s native space using an inverse mapping of the template from standard 4
space. BBR = boundary-based registration. SyN = symmetric diffeomorphic registration with 5
Advanced Normalization Tools (ANTs). 6
7
8
9
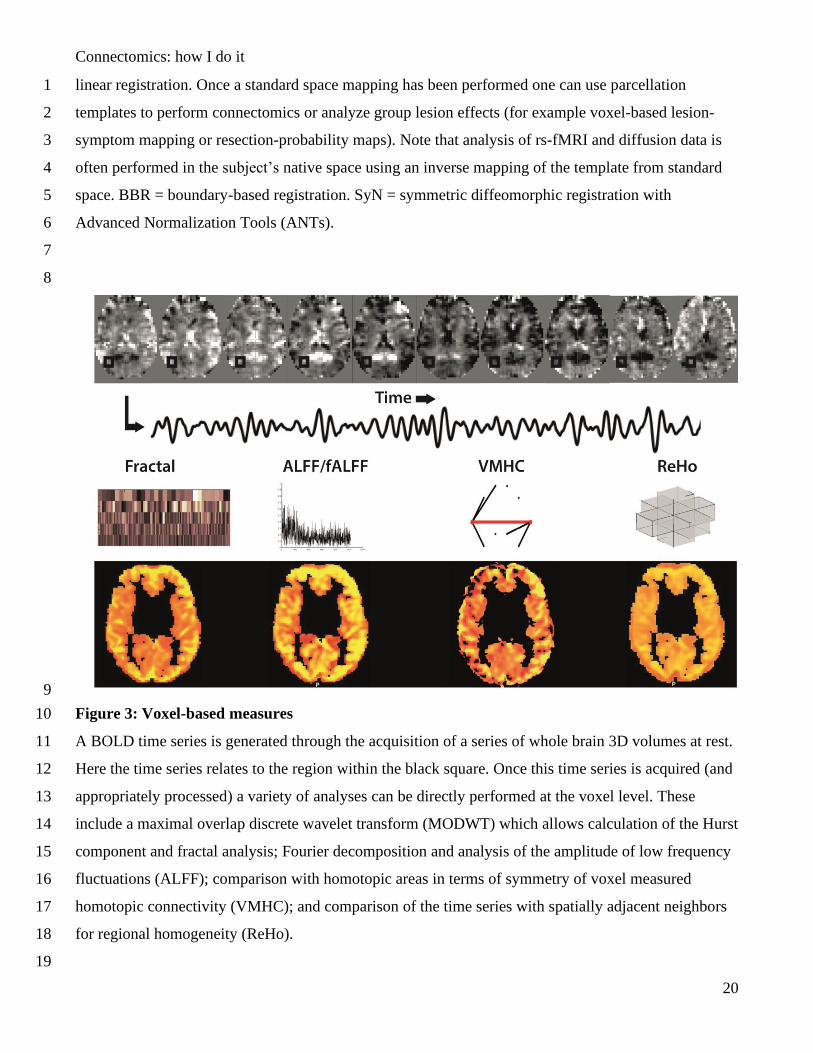
Figure 3: Voxel-based measures 10
A BOLD time series is generated through the acquisition of a series of whole brain 3D volumes at rest. 11
Here the time series relates to the region within the black square. Once this time series is acquired (and 12
appropriately processed) a variety of analyses can be directly performed at the voxel level. These 13
include a maximal overlap discrete wavelet transform (MODWT) which allows calculation of the Hurst 14
component and fractal analysis; Fourier decomposition and analysis of the amplitude of low frequency 15
fluctuations (ALFF); comparison with homotopic areas in terms of symmetry of voxel measured 16
homotopic connectivity (VMHC); and comparison of the time series with spatially adjacent neighbors 17
for regional homogeneity (ReHo). 18
19

Connectomics: how I do it
21
1
2
3
Figure 4: Resting-state network analysis 4
Resting-state networks (RSN) can be identified using two main approaches. Seed connectivity analysis 5
(SCA) sets a region of interest (seed), isolates its representative time series, and then performs a mass 6
univariate analysis of all other voxel’s time series to create a whole brain map. Independent component 7
analysis (ICA) looks at the whole brain signal and decomposes this into independent components that 8
represent the underlying sources (as an analogy, consider the colloquial ‘cocktail party’ problem, 9
whereby one filters out the background noise and multiple other conversations from the specific 10
conversation of interest). Note only a selection of RSN’s are shown for clarity but multiple RSN’s are 11
generated. Both these techniques create whole brain maps that are often subsequently thresholded for 12
viewing as either a volume or surface. Note the concordance between both techniques and sensitivity to 13
a variety of spatially distinct or overlapping RSN’s. 14
Connectomics: how I do it
22
1
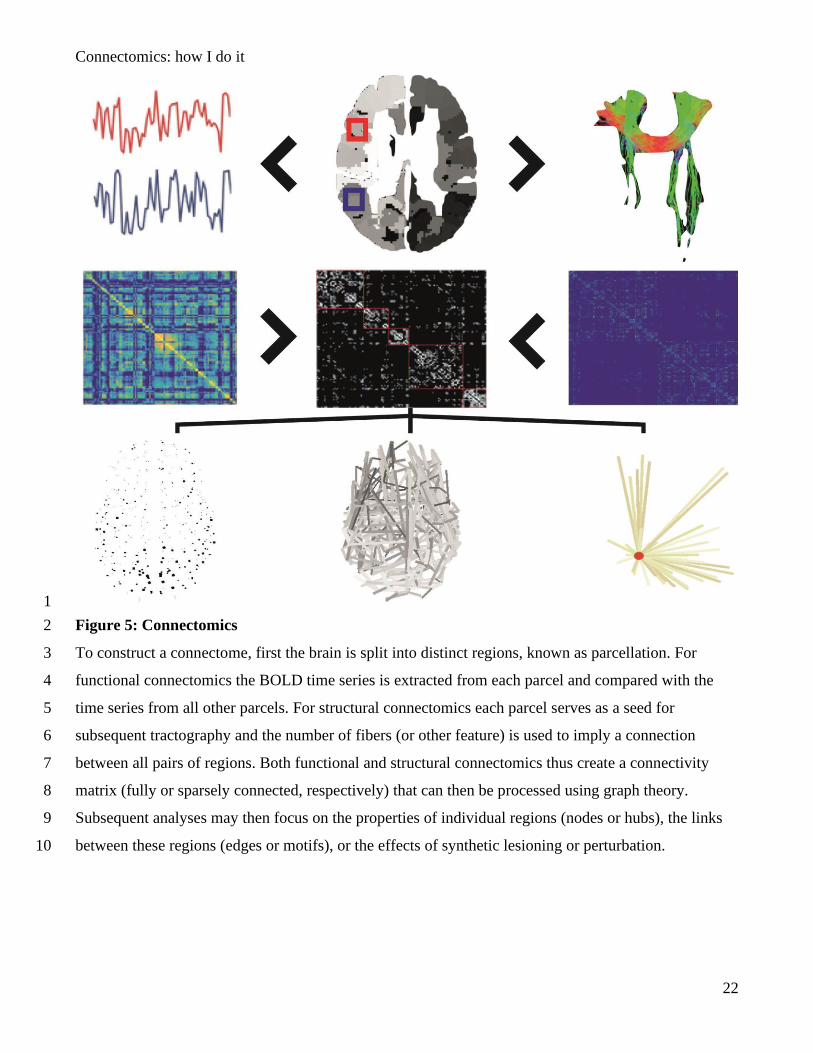
Figure 5: Connectomics 2
To construct a connectome, first the brain is split into distinct regions, known as parcellation. For 3
functional connectomics the BOLD time series is extracted from each parcel and compared with the 4
time series from all other parcels. For structural connectomics each parcel serves as a seed for 5
subsequent tractography and the number of fibers (or other feature) is used to imply a connection 6
between all pairs of regions. Both functional and structural connectomics thus create a connectivity 7
matrix (fully or sparsely connected, respectively) that can then be processed using graph theory. 8
Subsequent analyses may then focus on the properties of individual regions (nodes or hubs), the links 9
between these regions (edges or motifs), or the effects of synthetic lesioning or perturbation. 10
Connectomics: how I do it
23
1
Figure 6: Individual Language Network Mapping 2
Application of connectomics and network mapping at the individual level to study language networks. 3
Pre-operative planning of a patient with a diffuse low grade glioma of the left superior temporal lobe 4
involving dominant hemisphere language pathways. Views include standard structural MRI scans 5
(lower middle), resting state networks (lower left) corresponding to the canonical language network (as 6
described by Wernicke, Lichtheim, and Geschwind), as well as connectomic (upper right) and 7
tractography (upper left) analyses based on a seed in the left supramarginal gyrus. Complex data are 8
presented highlighting classical tracts (such as the arcuate fasciculus) as well as more provocative 9
findings including inter-hemispheric networks and global connectivity. This example illustrates some 10
of the difficulties of applying connectomics at the individual level in clinical scenarios, and should 11
serve as motivation for what further work is required in order to translate the neuroscientific advances 12
to benefits in patient treatment. Visualization screenshot is taken from the NetSym network navigation 13
interface for the applying connectomics to neurosurgery.67 14
15
Supplementary Video 1: Interactive Seed Connectivity 16

Connectomics: how I do it
24
Demonstration of seed connectivity analysis using InstaCorr by AFNI. Here the cursor is moved over 1
the cortex on the structural (T1) axial MRI scan image on the left of the screen. On the right of the 2
screen is the corresponding reconstruction of the pial surface. The red heat map on both images is the 3
thresholded resting state connectivity network corresponding to the cursor location (that is, the most 4
synchronised voxels of the resting state functional MRI scan with the cursor location). 5
6