Embed Size (px)
Citation preview

Assessing Invasive Animals in Australia 2008 9
2 Monitoring and reporting
During 2007, work began on developing the National Natural Resource Management Monitoring, Evaluation, Reporting and Program Improvement (MERI) Framework to replace these two documents. It includes a framework strategy for evaluation of the Australian Government’s NRM programs and is also intended to be useful for NRM programs funded through other sources.
Effective arrangements for monitoring, evaluation, reporting and program improvement are required to measure the level of impact, appropriateness, efficiency, effectiveness and legacy of investment initiatives. The MERI approach is based on continuous tracking and provides information to help steer the policy, program or project in the desired direction. The MERI Framework views continual learning and adapting in response to progressive monitoring and evaluation as a primary function of evaluation. The MERI cycle for planning, design and implementation of NRM policies, programs and projects is illustrated in Figure 2.1.
The current Assessment has been performed under the National M&E Framework and complements the MERI Framework.
National Natural Resource Management Monitoring and Evaluation Framework
The National M&E Framework was developed by the Australian and state and territory governments, and endorsed by the NRMMC in 2002–03. It assesses both the:
n health of Australia’s land, water, vegetation and biological resources
n performance of programs, strategies and policies that provide national approaches to the conservation, sustainable use and management of these resources.
This chapter introduces the role of current frameworks for monitoring and reporting on natural resource management (NRM) priorities. This Assessment reports on two priority matters regarding invasive animals that shall form the basis of reporting under national monitoring and reporting frameworks. The following sections describe the methods that were developed and implemented for this Assessment to report on invasive animals in Australia.
Frameworks for monitoring, evaluation and reporting
The national, state and territory governments, along with community groups, industry and land managers have invested and continue to invest resources to address NRM issues across Australia. The most significant initiatives include the previous Natural Heritage Trust, the National Action Plan for Salinity and Water Quality, and the National Landcare Program. These programs are intended to support actions to achieve NRM outcomes. Lessons learnt from these initiatives include the need for program improvement, a focus on intermediate outcomes and the need for performance reports.
The Natural Resource Management Ministerial Council (NRMMC), which includes representatives of the Australian Government and all state and territory governments, was established to develop a coordinated approach to issues affecting NRM in Australia. In 2003, the NRMMC endorsed two national documents to assist with setting targets, monitoring, evaluation and reporting on NRM. They are the:
n National Framework for Natural Resource Management Standards and Targets (not described herein)
n National Natural Resource Management Monitoring and Evaluation Framework (National M&E Framework).

10 Assessing invasive animals in Australia 2008
Monitoring and evaluation activities need to focus on identifying the state of and trend in condition of natural resources and to assess the impact, appropriateness, effectiveness, and efficiency of investments. Assessment of information collated under the National M&E Framework will assist managers and the NRMMC to identify areas of concern and to better target the use of resources. Figure 2.2 presents a diagrammatic representation of the National M&E Framework.
The NRMMC agreed to a series of specific NRM topics (referred to as matters for target) for which regional targets are set under the National M&E Framework. For each matter for target identified, an overall resource condition indicator called an indicator heading has been developed.
The Invasive Species topic has two themes: Vertebrate Pests and Weeds. For Vertebrate Pests, the NRMMC set the following matter for target and indicator heading:
Matter for target Ecologically significant invasive species
Indicator heading Extent and impact of selected ecologically significant invasive vertebrate species.
The National Land & Water Resources Audit (‘the Audit’) is responsible for ongoing development of
these indicators, as well as supporting the national collection and collation of data, and reporting against each indicator.
Such reporting will help to answer questions such as:
n What is the nature and extent of the issue?
n Is the existing or proposed intervention appropriate for the size of the issue?
n What types of intervention work best, are the most cost effective, and have the best transferability across regions?
n What is the impact of the policy or program investment — in the intermediate and long term?
Information needed on invasive animals
The development and adoption of consistent data attributes (such as occurrence, distribution, abundance and trend) for surveying and reporting invasive animal populations are important for developing standards and guidelines to manage information on invasive animals. Invasive animals are rarely confined by administrative or jurisdictional boundaries and are often highly mobile — giving them the capacity to respond to fluctuations in local conditions and the ability to spread into areas that
Figure 2.1 The monitoring, evaluation, reporting and program improvement cycle for natural resource management
NRM PROGRAM/PROJECT/POLICY
PRIORITISATION PROGRAM LOGIC
IMPLEMENTATIONEVALUATION &PROGRAM
IMPROVEMENT
PERFORMANCE
Decide what needs tobe done; ie investment
priorities
Develop a programstrategy/work plan
including M&E strategy
Implement program/project strategy and
M&E strategy
Gather results of M&E together
Reflect on results of work
Communicate results tostakeholders and investors
Resourcemonitoring
Start here
M&E = monitoring and evaluation; NRM = natural resource management

2 Monitoring and reporting 11
are environmentally suitable. Uniform monitoring and reporting of invasive animals across Australia and consistent reporting processes will make it easier for stakeholders to assess the effectiveness of various management strategies and national investment programs.
On an Australia-wide basis, the fundamental questions for which consistent information is required to manage invasive animal species, develop policy and guide future investment activities are:
n What areas are affected and potentially affected by invasive animals?
n What are the impacts and potential impacts of invasive animals?
While it was beyond the scope of this Assessment, additional information is required on the following issues to improve the management of invasive animals in Australia:
n What management is being implemented and where is investment being allocated?
n What strategies are required to mitigate the impacts of invasive animals?
The effectiveness of management strategies and control activities can be measured in a number of ways. Information on the distribution, abundance and impacts of invasive animals is needed to identify
where management and resources are required to implement strategies effectively.
Indicators and information requirements
To manage invasive animals and their impacts effectively requires identifying information and products that are most useful in addressing management priorities. Monitoring, evaluating and reporting can provide meaningful information to target invasive animal management problems. In particular, national data on invasive animals are required to prioritise investment, measure the effectiveness of national funding programs, evaluate the effectiveness of management programs, and report the status of invasive animals against other natural resource themes.
Figure 2.2 Diagrammatic representation of the National Natural Resource Management Monitoring and Evaluation Framework
Natural resource condition Program, strategy and policy performance
Monitoring
Evaluation
• Natural resource condition monitoring at local, regional, state/territory and national levels
• Evaluating progress towards improved natural resource condition at the national level
• Monitoring of resource condition against Standards and Targets Framework• Management action monitoring
• Performance evaluation of programs and strategies
Evaluation modelsand assumptions
Important wetlands like the Macquarie Marshes in NSW are damaged by feral pigs each year (photo by David Croft)
12 Assessing invasive animals in Australia 2008
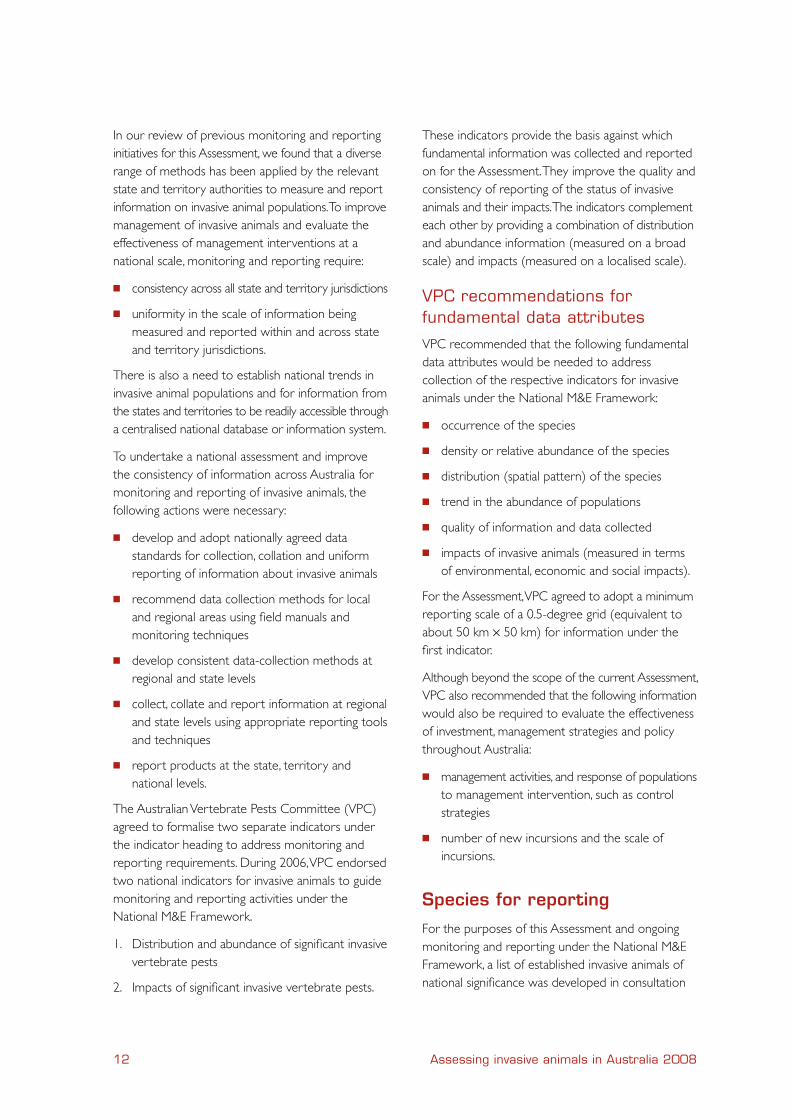
In our review of previous monitoring and reporting initiatives for this Assessment, we found that a diverse range of methods has been applied by the relevant state and territory authorities to measure and report information on invasive animal populations. To improve management of invasive animals and evaluate the effectiveness of management interventions at a national scale, monitoring and reporting require:
n consistency across all state and territory jurisdictions
n uniformity in the scale of information being measured and reported within and across state and territory jurisdictions.
There is also a need to establish national trends in invasive animal populations and for information from the states and territories to be readily accessible through a centralised national database or information system.
To undertake a national assessment and improve the consistency of information across Australia for monitoring and reporting of invasive animals, the following actions were necessary:
n develop and adopt nationally agreed data standards for collection, collation and uniform reporting of information about invasive animals
n recommend data collection methods for local and regional areas using field manuals and monitoring techniques
n develop consistent data-collection methods at regional and state levels
n collect, collate and report information at regional and state levels using appropriate reporting tools and techniques
n report products at the state, territory and national levels.
The Australian Vertebrate Pests Committee (VPC) agreed to formalise two separate indicators under the indicator heading to address monitoring and reporting requirements. During 2006, VPC endorsed two national indicators for invasive animals to guide monitoring and reporting activities under the National M&E Framework.
1. Distribution and abundance of significant invasive vertebrate pests
2. Impacts of significant invasive vertebrate pests.
These indicators provide the basis against which fundamental information was collected and reported on for the Assessment. They improve the quality and consistency of reporting of the status of invasive animals and their impacts. The indicators complement each other by providing a combination of distribution and abundance information (measured on a broad scale) and impacts (measured on a localised scale).
VPC recommendations for fundamental data attributes
VPC recommended that the following fundamental data attributes would be needed to address collection of the respective indicators for invasive animals under the National M&E Framework:
n occurrence of the species
n density or relative abundance of the species
n distribution (spatial pattern) of the species
n trend in the abundance of populations
n quality of information and data collected
n impacts of invasive animals (measured in terms of environmental, economic and social impacts).
For the Assessment, VPC agreed to adopt a minimum reporting scale of a 0.5-degree grid (equivalent to about 50 km × 50 km) for information under the first indicator.
Although beyond the scope of the current Assessment, VPC also recommended that the following information would also be required to evaluate the effectiveness of investment, management strategies and policy throughout Australia:
n management activities, and response of populations to management intervention, such as control strategies
n number of new incursions and the scale of incursions.
Species for reporting
For the purposes of this Assessment and ongoing monitoring and reporting under the National M&E Framework, a list of established invasive animals of national significance was developed in consultation

2 Monitoring and reporting 13
with VPC (Table 2.1). The species list intends to reflect national, state and territory priorities for pest species management and will require ongoing or periodic review by VPC. The species list formed the basis for collection, collation and reporting under the national indicators for invasive animals.
It should be noted that species of significance vary by region and jurisdiction, and that the national priority species list reflects the priorities identified by VPC and the respective state and territory jurisdictions.
Table 2.1 Nationally significant invasive animals nominated by the Australian Vertebrate Pests Committee
Species
Feral pigs Sus scrofa
Feral goats Capra hircus
Rabbits Oryctolagus cuniculus
Foxes Vulpes vulpes
Common carp Cyprinus carpio
Cane toads Bufo marinus
Common starlings Sturnus vulgaris
Feral cats Felis catus
Wild dogs and dingoes
Canis lupus familiaris; Canis lupus dingo and hybrids
Feral deer species
Fallow Dama dama
Red Cervus elaphus
Sambar Cervus unicolour
Rusa Cervus timorensis
Hog Axis porcinus
Chital Axis axis
Monitoring protocols
Monitoring and reporting information to address the two national indicators for invasive animals under the National M&E Framework require agreed monitoring protocols. These provide a guide for collecting, collating and reporting information, and for promoting consistency and comparability.
A range of field-based techniques is available for monitoring invasive animals at the local and regional levels, including spotlighting, sight counts, and sand-pad monitoring. Monitoring Techniques for Vertebrate Pests presents the main techniques for monitoring invasive animals in Australia (Mitchell and Balogh 2007). Some are more suited to regional application than others, eg aerial surveys versus den counts. However, to apply these techniques for all invasive species at a state, territory or national scale is not practical or cost-effective. Hence, a combination of recommended local-scale field monitoring techniques and regional-, territory- and state-level approaches is required to achieve the best level of monitoring in a cost-effective way. By combining a variety of these monitoring approaches, these local- and regional-scale datasets can be used to develop state, territory and national information.
This Assessment developed two monitoring protocols to address the two indicators for invasive animals.
Indicator 1. Monitoring protocol for the distribution and abundance of significant invasive vertebrate pests.
Indicator 2. Monitoring protocol for the impacts of significant invasive vertebrate pests.
Distribution and abundance — Indicator 1
To develop the Monitoring protocol for the distribution and abundance of significant invasive vertebrate pests, we identified the following key issues for information collection, collation and reporting for invasive animals:
n There were no formally agreed consistent attributes for invasive animal monitoring.
n High-quality and meaningful data need to be collected at the local level to maintain accuracy in regional and state datasets.
n The methods described in Monitoring Techniques for Vertebrate Pests (Mitchell and Balogh 2007) can be used to collect data on invasive animal populations in a consistent way.

14 Assessing invasive animals in Australia 2008
Therefore, to develop an appropriate indicator protocol, it was agreed that:
n Core data attributes are required for monitoring and reporting.
n Existing state and territory monitoring should be considered for the Assessment.
n Existing broad-scale monitoring should be used to provide distribution and abundance information.
n The recommended reporting scale should be reviewed after completion of the Assessment for its use in future assessments.
n Cross-theme information, such as soil type and vegetation data, should be used wherever relevant.
For the Assessment, we decided that the primary data for Indicator 1 should include the following five data attributes.
Occurrence The presence status of a species within an area (ie present or absent)
Distribution A measure of spatial pattern throughout an area (ie localised or widespread)
Abundance A measure (in numbers or relative value) of density within a defined area (ie occasional, common or abundant)
Trend A measure of change in animal abundance over time for the area in question (ie increasing, stable, decreasing or unknown)
Data quality A measure of data quality associated with most of the information used to determine overall classification (ie low, medium or high).
VPC subsequently endorsed the Monitoring protocol for the distribution and abundance of significant invasive vertebrate pests, and an overview of the indicator protocol is presented in Appendix 1.
Impacts — Indicator 2
To develop the Monitoring protocol for the impacts of significant invasive vertebrate pests, we identified the following key issues for information collection, collation and reporting for invasive animals:
n There were no formally agreed monitoring framework or agreed methods for measuring and reporting the impacts of all invasive animals.
n Meaningful information on the impacts of invasive animals is required, but the techniques available are most suitable for collection of detailed impact information at the local level.
Therefore, to develop an appropriate indicator protocol, it was agreed that:
n Core data attributes for monitoring impacts should be identified.
n Existing local-scale monitoring programs can be used to report impacts.
n Case studies should be used to report key findings from monitoring programs.
n Effective tools need to be developed to monitor the impacts of invasive animals.
Spotlighting can be used to monitor fox numbers (photo by NSW Department of Primary Industries)
Aerial surveys are one method used for monitoring feral goat populations (photo by NSW Department of Primary Industries)

2 Monitoring and reporting 15
It was agreed that reporting of invasive animal impacts should use a series of case studies from established regional programs because impact reporting across large areas is often impractical. It was agreed that case studies should encompass local, regional, state, territory and national datasets where available. Many data attributes for impact reporting were nominated, and it was agreed that it should address a number of species and the various impact types associated with each species (see the guidelines for reporting invasive animal impacts in Appendix 2).
For this Assessment, VPC endorsed the Monitoring protocol for the impacts of significant invasive vertebrate pests, and an overview of the indicator protocol is presented in Appendix 2. It should be noted that VPC recommended further development of this indicator protocol for monitoring invasive animal impacts. Further research is required to develop techniques for impact monitoring across jurisdictions, and a framework is needed for reporting information at the state, territory and national scales.
Data collection and collation
This Assessment implemented the two agreed indicator protocols for monitoring and reporting information on invasive animals and their impacts. This section briefly describes the process followed to gather the required information.
Data sources
A range of information was gathered from the respective state and territory government agencies and relevant non-government organisations. Existing state-wide distribution and abundance survey data and impact information were sourced from the states and territories. Where feasible, state- and territory-wide information was either updated or collected to facilitate accurate reporting.
Data on occurrence, distribution and abundance
Following the methods defined by the recommended Monitoring protocol for the distribution and abundance of significant invasive vertebrate pests (see Appendix 1), we developed various datasets that had been collated from relevant sources. These collated datasets enabled us to report on the distribution and abundance of invasive animals throughout Australia in a consistent way.
Distribution and abundance information was compiled from various datasets (eg fauna atlas records), transect surveys (eg aerial survey and spotlight-count data), land manager surveys (eg questionnaires) and field-sampling programs across regional areas wherever available. These datasets were consolidated into a consistent value for occurrence, distribution, and abundance using a standardised approach to present the maps in this Assessment.
Where localised, regional and state datasets were available from relevant state sources, they were collated into a centralised database for this Assessment. Detailed datasets and information were obtained from:
n field-based ground and aerial surveys using rigorous scientific-sampling techniques
n control records and management-activity information
n various registers and wildlife atlas-style databases
n historical records, verified as current
n expert opinion and reviews from specialists in wildlife and pest management fields
n questionnaire surveys and reporting
n anecdotal reports and subjective accounts.
To present the data from the various sources at a national scale, the occurrence, distribution and abundance data were processed through five phases (see Table 2.2 for a summary of these phases and Figure 2.3 for a schematic representation of the data collection and collation process). These phases involved collecting and compiling local-scale data at state, territory and national levels into a consistent format (see Figure 2.3) based on indicator protocols (see
Monitoring of pest impacts is also particularly important for determining when and where to undertake control (photo by Jonathan Lee)

16 Assessing invasive animals in Australia 2008
Appendixes 1 and 2). This Assessment also adopted a step-wise process to collate existing information on species extent, based on occurrence, distribution and abundance data (Figure 2.4).
Table 2.2 Phases of data compilation and reporting for occurrence, distribution and abundance data
Phases
Phase 1 Occurrence
n collection of species occurrence data from all available databases for the period 2000–2006
n preparation of state, territory and national occurrence maps
Phase 2 Abundance, distribution, data quality, and trend
n collection of species distribution data from all available databases for the period 2000–2006
n interview-style consultation with relevant stakeholdersa to gather institutional knowledge on abundance, distribution, data quality and trend
Phase 3 Draft state and territory mapping products
n review of draft state and territory maps by experts from relevant agencies
Phase 4 Draft national mapping products
n review of draft national maps by experts from relevant agencies to ensure compara-bility across jurisdictions
Phase 5 Final national mapping products
n development of a series of national products
n endorsement of the products by VPC
VPC = Australian Vertebrate Pests Committee a Consultation with natural resource management regional
groups, state government agencies and relevant authorities
We developed a geographic information system (GIS) data-capture routine to provide a step-wise approach for entering all available spatial data and to assign to it an appropriate distribution and abundance classification. The data-capture routine was designed for reporting on the five data attributes:
n occurrence (present, absent or unknown)
n distribution (localised or widespread)
n abundance (occasional, common or abundant)
n trend (increasing, decreasing, stable or unknown)
n data quality (high, medium, low or no data).
To address these five attributes, data were compiled from existing information sources wherever available. Existing state-wide datasets were available for New South Wales (NSW), Queensland (Qld) and Western Australia (WA) at the commencement of this Assessment. They were accessed and, where appropriate, updated during the course of the assessment (see Woolnough et al 2005, West and Saunders 2007). Partial datasets for South Australia (SA), Victoria (Vic) and the Australian Capital Territory (ACT) were also available but required updating. To report on the five attributes, datasets for Tasmania (Tas) and the Northern Territory (NT) were developed for this Assessment from existing databases.
Data were collated to varying scales ranging from 1:25 000 to a 1:50 000 scale. Fine-resolution datasets were collated in Vic, Tas, NSW, Qld and WA, and aggregated to the national 0.5-degree grid cell. Subsequently, information was aggregated and scaled up to the recommended national-reporting scale of 0.5 degrees (equivalent to 1:100 000) (see the section on data aggregation below).
500 0 500250km
National reporting1:100 000 map sheet(approx 50 km x 50 km)
State reporting1:50 000 map sheet
Regional reportingscale 1:25 000 or finer
Point data Polygon data 1:25K mapsheet
1:100K
1:50K
1:25K
Figure 2.3 Data compilation process of local and regional data to produce state, territory and national datasets

2 Monitoring and reporting 17
Table 2.3 shows the approximate resolution of the original data available in each state and territory. The finest resolution of available data in this table was ‘property-scale’ (for WA) and ‘5-km grid’ (for NSW and the ACT). Appendix 3 presents a summary of the pest species data and information accessed to develop the respective state, territory and national distribution and abundance datasets.
Because the quality and accuracy of the various datasets varied, a data-quality value was assigned to each respective dataset. Expert groups were formed in each state and territory to review each dataset. Cross-border discrepancies were reviewed in each jurisdiction, particularly where precise estimates were lacking.
Data collection, collation and reporting from all states and territories were undertaken between June 2006 and April 2007.
Potential distribution predictive models
This Assessment used climate-matching (using ‘CLIMATE’ software) models based on the climatic conditions of a species’ overseas range to predict its potential Australian distribution. The use of climate models to predict the potential distribution of an introduced animal species based on its current worldwide distribution is well established — although not without limitations. The use of habitat-suitability matching is still under development but may improve
Figure 2.4 Step-wise data collection and collation process for occurrence, distribution and abundance data
Extent
Assessed
Present
Abundance
Occasional
Common
Abundant
Not assessed
Absent
DistributionLocalised
Widespread
Table 2.3 Approximate resolution of original state- and territory-based data collated to develop national datasets for the distribution and abundance of invasive animals
Jurisdiction NSW Qld ACT Vic NT WA SA Tas
Original data resolution
5-km grid a 17-km grid b 5-km grid a 1:25 000 1:100 000 Property scale and
10-km grid c
1:100 000 1:25 000
NSW = New South Wales; Qld = Queensland; ACT = Australian Capital Territory; Vic = Victoria; NT = Northern Territory; WA = Western Australia; SA = South Australia; Tas = Tasmania; km = kilometre a See West and Saunders (2007)b See Annual Pest Distribution Survey, Biosecurity Queensland1 c See Woolnough et al (2005)
It is important to recognise that, although the original method of data collection at the state and territory level may vary for some data available for this Assessment, a standardised method was initiated to derive consistent datasets for all species. In some cases, such as feral deer, a number of species are known to occur in the wild in Australia; however, because their management and control remains largely comparable between species, there was no need to treat them separately for this Assessment. The extent of all deer species allows decision makers to address their problems as a whole, and future assessments will identify whether treatment at individual species level is required.
1 http://www.nrw.qld.gov.au/pests/maps/pest_distribution/annual_pest_dist_maps.html (Accessed 10 October 2007)

18 Assessing invasive animals in Australia 2008
predictions of a species’ potential range when combined with climate matching. Regardless, given the inherent limitations of both approaches, the generalist and adaptable nature of many pest species and interactions with other species, such maps should be used only as a broad indicator of potential distribution rather than an accurate prediction of ultimate range.
This Assessment uses climate matching to predict the potential distribution of those species that are thought to have the potential to spread beyond their current range in Australia. Species that have already spread to their climatic limits in Australia (namely rabbits, foxes, wild dogs and feral cats) are not presented in this Assessment. Predictive maps using climate matching are provided for feral pigs, feral goats, common carp, cane toads and common starlings. Predictive maps incorporating suitable-habitat information are also presented for all species except common carp. For feral goats, it was not possible to divide habitats by preference, so all habitats known to be used by the species were considered simultaneously.
CLIMATE software
The CLIMATE software package matches the climates (temperature and rainfall data) of selected regions around the world where a species is present, to the climate of other selected regions. The potential range of a species within the analysis site is produced as a series of maps. The desktop version of CLIMATE employed in this Assessment uses the statistical program ‘R’. A Euclidean calculation was used to determine the closest matches between the input overseas data and the target site. The maps presented here use match classes that summarise the output as high, medium and low.
Land use
Land use data, captured at the catchment scale, were provided by the Bureau of Rural Sciences according to the Australian Land Use and Management (ALUM) Classification5 (see also BRS 2006). The ALUM classification is a system for ordering land use information into categories such as cropping and nature reserves. The system provides a nationally consistent
5 http://adl.brs.gov.au/mapserv/landuse/alum_classification.html (Accessed 15 May 2008)
way to collect and present land use information for a wide range of users across Australia. The ALUM classification was completed in 2005 and is the Australian Spatial Data Infrastructure standard for land use datasets.
The classification has six primary levels of land use that are distinguished in order of generally increasing levels of intervention or potential impact on the natural landscape:
n Class 1 — Conservation and Natural Environments
n Class 2 — Production from Relatively Natural Environments
n Class 3 — Production from Dryland Agriculture and Plantations
n Class 4 — Production from Irrigated Agriculture and Plantations
n Class 5 — Intensive Uses
n Class 6 — Water.
Limitations of habitat matching using land use data
There are a number of limitations associated with using habitat matching as a predictor of suitable areas for pest species. These limitations are:
n Broad definitions for land use categories — broad categories in land use and variation within classes may lead to anomalous results (eg ‘grasslands’ may comprise alpine grasslands, as well as tall tropical grasses in northern Australia).
n Scale of data for analysis — the large reporting units used in this analysis would result in large within-cell variation in results.
n Species-specific requirements and temporal and spatial issues — this analysis does not consider specific requirements for species, such as feral pigs requiring access to perennial water.
n Matrix of habitats — most species require a number of suitable habitats in close proximity, and this method does not consider that species require multiple habitats or continuity of habitats to survive.
n Human activities and other factors — in addition to habitat and climate conditions, a wide range of factors limit a species’ ability to survive and/or

Assessing invasive animals in Australia 2008 19
spread, such as rivers, human activity, previous history and stochastic events such as fire.
n Catchment-scale land use data have been captured by jurisdictional agencies and as a result are a patchwork of different years.
Data on impacts
Following the methods defined by the recommended Monitoring protocol for the impacts of significant invasive vertebrate pests (see Appendix 2), we developed information from a number of different sources.
Invasive animals cause a diverse range of impacts, so measuring and reporting these across large areas can be particularly difficult. The impacts of invasive animals can also vary significantly between environments and jurisdictions; eg feral pigs can cause significant damage to crops in some areas and few problems in other areas. A further problem is that the impacts of invasive animals are not always easily discerned from the impacts of other land management activities such as land clearing, agriculture and the effects of climate change. As a result, measuring and reporting the impacts of invasive animals are usually conducted on a local scale or in unison with control programs and regional monitoring activities.
The VPC recommended the use of existing programs and monitoring activities wherever possible because of the lack of broad-scale impact monitoring and the lack of suitable techniques to monitor and report the impacts of invasive animals across all jurisdictions simultaneously.
Information on the impacts of invasive animal species was compiled from existing management programs and monitoring activities. A series of
impact case studies was prepared to report the findings of each program, and a template for reporting impacts information was used to promote interpretability and consistency between programs. It should be noted that impact case studies were not available for all pest species of this Assessment.
The impact case studies reported information on five key program attributes:
n Project summary (pest species, program variables measured)
n Monitoring methods (techniques, analysis, methodology)
n Impact type (impact description)
n Current findings and results (quantified results)
n Key outcomes (implications of results).
The impact case studies provide a snapshot of information on the impacts of a small number of invasive animals in Australia. Each case study presents the current findings from each management and monitoring program, although the findings are not necessarily representative of the level of impacts throughout Australia.
In addition to information obtained from the impact case studies, a large volume of information is available on the impacts of invasive animals from important research throughout Australia that has been compiled over many years.6
VPC recommended impact case studies for this Assessment and noted the need for further development of impact monitoring and reporting mechanisms and development of an impact-monitoring framework to include case studies and other impact information throughout Australia to assess the effectiveness of investments and major funding initiatives. A commitment to monitoring and reporting by state and territory government agencies and NRM regional groups will make trend
6 For more information on the impacts of invasive animals, see:
http://www.environment.gov.au/biodiversity/invasive/ferals (Accessed 15 May 2008)
http://www.daff.gov.au/brs/land/feral-animals (Accessed 15 May 2008)
http://www.feral.org.au (Accessed 15 May 2008)
http://www.invasiveanimals.com (Accessed 15 May 2008)
Rabbits (Oryctolagus cuniculus) excavate large warrens for shelter and breeding, and are a major problem in agricultural landscapes (photo by NSW Department of Primary Industries)
20 Assessing invasive animals in Australia 2008
information more readily available for subsequent assessments. Ongoing monitoring and reporting activities will raise the level and availability of high-quality information for decision makers. Future assessments will enhance information availability.
Data aggregation and analysis
A series of data-aggregation rules was developed by the Cooperative Research Centre for Spatial Information and the Audit. Data-aggregation rules were prepared to aggregate the spatial data collated from all states and territories. The rules were developed to aggregate attribute data from 1:25 000 and 1:50 000 scales to 1:100 000. Based on the guidelines, a series of customised GIS routines was prepared to facilitate the aggregation. All data were aggregated to the national reporting scale of 0.5 degrees (equivalent to 1:100 000). A summary of the aggregation rules is contained in Appendix 4.
Data verification, integrity and implications
The datasets for nationally significant invasive animals used in this Assessment have been compiled from a large number of state and territory datasets that vary in their quality and reliability. Many forms of data and information have been used to generate consistent national datasets, including dedicated regional and state-wide assessments, intensive field-sampling activities, aerial surveys, baiting records, scientific surveys, anecdotal reports, perception-based reports and institutional knowledge, trapping data, and atlas records. As noted above, some data have been prepared from anecdotal reports. This variation in data quality has a number of implications for the interpretation of the national products. These issues need to be considered when interpreting the results.
Although the expert review panels in each state and territory verified the state-wide datasets by examining the data, and a number of datasets were derived from field-based techniques and aerial surveys, there are four additional data-integrity issues that need to be considered when interpreting state, territory and national data and products. These are:
n Some data require further verification or cross-validation.
n Data vary in currency and were collected at the regional and state level between 2000 and 2006–07.
n Large areas contain qualitative information (eg institutional knowledge) that has not been derived from quantitative surveys.
n Where quantitative information is available (reported as ‘data with expert opinion’), our national products can be applied with more certainty and confidence.
Every effort has been taken to collect, collate and compile all available information on invasive animals in each jurisdiction for national reporting. However, since the completion of data compilation, the project team has been notified of a few populations of pests that were inadvertently overlooked at the time of data compilation, such as feral deer known to occur on Cobourg Peninsula, NT.
The footprints and signs of animals can be used to monitor activity (photo by NSW Department of Primary Industries)