Embed Size (px)
Citation preview


2 ALASKA ECONOMIC TRENDSJANUARY 2018
JANUARY 2018Volume 38 Number 1
ISSN 0160-3345
Alaska Economic Trends is a monthly publica on meant to objec vely inform the public about a variety of economic issues in the state. Trends is funded by the Employment and Training Services Division of the Alaska Department of Labor and Workforce Development and is published by the department’s Research and Analysis Sec on. Material in this publica on is public informa on, and with appropriate credit may be reproduced without permission.
Sam DapcevichCover Ar st
Sara WhitneyEditor
To sign up for a free electronic subscrip on, read past issues online, or purchase a print subscrip on, visit labor.alaska.gov/trends. Contact the editor at(907) 465-6561 or [email protected].
Dan RobinsonChief, Research and Analysis
Bill WalkerGovernor
Heidi DrygasCommissioner
ON THE COVER: Looking down Gas neau Channel in Juneau, photo by Sam Dapcevich
ALASKA DEPARTMENTof LABOR
and WORKFORCEDEVELOPMENT
Correc onExhibit 4 on page 5 of the December 2017 issue, labor force par cipa on, has been replaced to refl ect people 16 and older. The original calcula on included all ages. The correct rate for Alaska for 2016 is 63.15%.
EMPLOYMENT FORECASTfor 2018
Anchorage PAGE 8
By NEAL FRIED
Southeast PAGE 15
By KARINNE WIEBOLD
Statewide PAGE 4
By KARINNE WIEBOLD
Fairbanks PAGE 12By NEAL FRIED and
ALYSSA RODRIGUES
3ALASKA ECONOMIC TRENDS JANUARY 2018
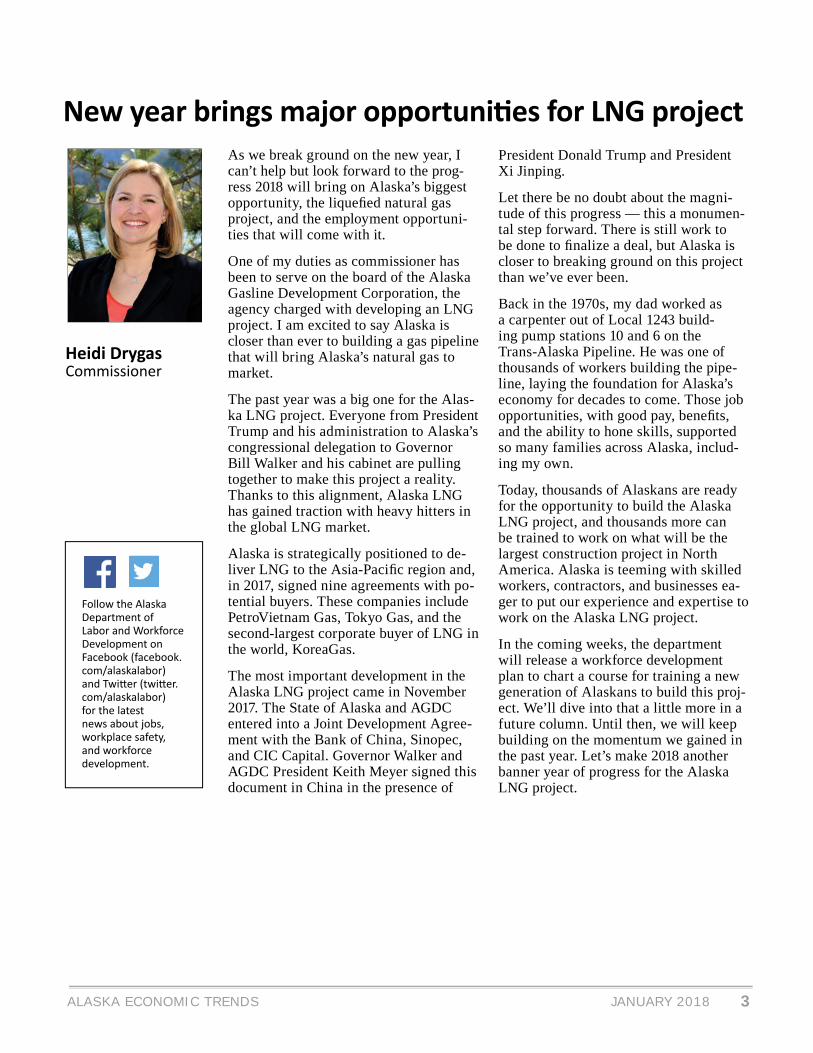
Heidi DrygasCommissioner
Follow the Alaska Department of Labor and Workforce Development on Facebook (facebook.com/alaskalabor) and Twi er (twi er.com/alaskalabor) for the latest news about jobs, workplace safety, and workforce development.
New year brings major opportuni es for LNG projectAs we break ground on the new year, I can’t help but look forward to the prog-ress 2018 will bring on Alaska’s biggest opportunity, the liquefi ed natural gas project, and the employment opportuni-ties that will come with it.
One of my duties as commissioner has been to serve on the board of the Alaska Gasline Development Corporation, the agency charged with developing an LNG project. I am excited to say Alaska is closer than ever to building a gas pipeline that will bring Alaska’s natural gas to market.
The past year was a big one for the Alas-ka LNG project. Everyone from President Trump and his administration to Alaska’s congressional delegation to Governor Bill Walker and his cabinet are pulling together to make this project a reality. Thanks to this alignment, Alaska LNG has gained traction with heavy hitters in the global LNG market.
Alaska is strategically positioned to de-liver LNG to the Asia-Pacifi c region and, in 2017, signed nine agreements with po-tential buyers. These companies include PetroVietnam Gas, Tokyo Gas, and the second-largest corporate buyer of LNG in the world, KoreaGas.
The most important development in the Alaska LNG project came in November 2017. The State of Alaska and AGDC entered into a Joint Development Agree-ment with the Bank of China, Sinopec, and CIC Capital. Governor Walker and AGDC President Keith Meyer signed this document in China in the presence of
President Donald Trump and President Xi Jinping.
Let there be no doubt about the magni-tude of this progress — this a monumen-tal step forward. There is still work to be done to fi nalize a deal, but Alaska is closer to breaking ground on this project than we’ve ever been.
Back in the 1970s, my dad worked as a carpenter out of Local 1243 build-ing pump stations 10 and 6 on the Trans-Alaska Pipeline. He was one of thousands of workers building the pipe-line, laying the foundation for Alaska’s economy for decades to come. Those job opportunities, with good pay, benefi ts, and the ability to hone skills, supported so many families across Alaska, includ-ing my own.
Today, thousands of Alaskans are ready for the opportunity to build the Alaska LNG project, and thousands more can be trained to work on what will be the largest construction project in North America. Alaska is teeming with skilled workers, contractors, and businesses ea-ger to put our experience and expertise to work on the Alaska LNG project.
In the coming weeks, the department will release a workforce development plan to chart a course for training a new generation of Alaskans to build this proj-ect. We’ll dive into that a little more in a future column. Until then, we will keep building on the momentum we gained in the past year. Let’s make 2018 another banner year of progress for the Alaska LNG project.

4 ALASKA ECONOMIC TRENDSJANUARY 2018
Third year of job losses expected to be compara vely modest
EmploymentEmploymentForecastForecast for for 2018 2018
1 P , 2008 2018Tapering Job Losses for Alaska
*Preliminary **ForecastSource: Alaska Department of Labor and Workforce Development, Research and Analysis Sec on
By KARINNE WIEBOLD
1.4%
-0.3%
1.2%
1.6% 1.5%
0.4% 0.4%0.2%
-1.9%
-1.1%
-0.5%
2008 2009 2010 2011 2012 2013 2014 2015 2016 2017* 2018**
Alaska is expected to lose jobs again in 2018, al-though the losses appear
to be tapering. Total employ-ment is forecasted to decline by 0.5 percent in 2018 (-1,800 jobs) a er falling 1.1 percent in 2017 and 1.9 percent in 2016. (See ex-hibits 1 through 3.)
Losses were deepest in 2016 when the state’s economy shed 6,300 jobs, primarily in oil and gas and in state govern-ment. Then in 2017, Alaska lost an es mated 3,600 jobs. If it hadn’t been for strong health care growth, the overall job loss would have been deeper.
If employment follows the forecasted pat-tern this year, that would put Alaska’s to-tal loss from 2015 through 2018 at 11,700 jobs (-3.5 percent).
How job lossesare panning outOne reason statewide losses are slowing is that oil
and gas, state government, pro-fessional and business services, and construc on have already taken signifi cant hits over the last couple of years and their job counts are stabilizing at lower levels. However, the impact from those losses will reverberate into
stores, bars and restaurants, and a variety of other employers that depend on consumer, business, and state government spending.

5ALASKA ECONOMIC TRENDS JANUARY 2018
2 W , 2016 2018Statewide Job Forecast by Industry
2016MonthlyAverage
2017Monthly
Average1Chg 2016
to 2017
PercentChg 2016
to 2017
2018
MonthlyAverage
Chg 2017
to 2018
PercentChg 2017
to 2018Total Nonfarm Employment2 332,600 329,000 -3,600 -1.1% 327,200 -1,800 -0.5%Total Private Sector 251,300 248,300 -3,000 -1.2% 247,100 -1,200 -0.5%Natural Resources and Mining 14,500 13,000 -1,500 -10.3% 12,500 -500 -3.8% Oil and Gas 11,300 9,800 -1,500 -13.3% 9,300 -500 -5.1%Construction 16,200 15,000 -1,200 -7.4% 14,500 -500 -3.3%Manufacturing 13,600 13,400 -200 -1.5% 13,600 200 1.5%Trade, Transportation, and Utilities 65,400 64,800 -600 -0.9% 64,500 -300 -0.5% Retail Trade 37,100 36,600 -500 -1.3% 36,400 -200 -0.5% Wholesale Trade 6,400 6,300 -100 -1.6% 6,300 0 0% Transportation, Warehousing, and Utilities 21,900 21,900 0 0% 21,800 -100 -0.5%Information 6,300 6,000 -300 -4.8% 5,900 -100 -1.7%Financial Activities 12,100 12,100 0 0% 12,100 0 0%Professional and Business Services 28,400 27,800 -600 -2.1% 27,400 -400 -1.4%Educational3 and Health Services 48,600 50,000 1,400 2.9% 50,600 600 1.2% Health Care 35,600 37,400 1,800 5.1% 38,100 700 1.9%Leisure and Hospitality 35,200 35,200 0 0% 35,100 -100 -0.3%Other Services 11,000 11,000 0 0% 10,900 -100 -0.9%Total Government 81,300 80,700 -600 -0.7% 80,100 -600 -0.7% Federal4 15,200 15,100 -100 -0.7% 15,100 0 0% State5 24,600 23,800 -800 -3.3% 23,300 -500 -2.1% Local6 41,500 41,800 300 0.7% 41,700 -100 -0.2%
1Preliminary and adjusted es mates2Excludes self-employed workers, fi shermen, domes c workers, and unpaid family workers3Private educa on only4Excludes uniformed military5Includes the University of Alaska6Includes public schools and tribal government
Source: Alaska Department of Labor and Workforce Development, Research and Analysis Sec on
The recession’s fi rst wave:State government and oilWhen oil prices plummeted in late 2014, state government was the fi rst to feel the pinch as falling tax revenue from the oil and gas industry decimat-ed state revenues. State government began to cut jobs in early 2015 as pressure mounted to reduce expenses, including its payroll and capital projects.
The oil and gas industry was able to maintain record high employment levels through most of 2015, but the losses that came in 2016 were swi and deep. (See exhibits 4 and 5.)
Oil and gas lost a whopping 2,900 jobs in 2016, fol-lowed by state government at 1,200 jobs, profes-sional and business services (such as engineering, geological, and architectural fi rms) at 1,600, and
construc on at 1,400.
Alaska’s oil and gas industry is expected to lose an addi onal 500 jobs in 2018. Although the industry is s ll losing jobs, the pace is nowhere near what it was in 2016. This forecasted
loss, represen ng 5.1 percent of the industry’s over-all employment, would be a third of what it lost in 2017. While mul ple future projects have been an-nounced, they are longer-term and the employment boost in 2018 from any resul ng hires would be mi-nor.
State government is likely to lose another 500 jobs in 2018, or 2.1 percent. Like oil and gas, state gov-ernment declines hit early and hard, with losses of 700 jobs in 2015, 1,200 in 2016, and 800 in 2017. Although there were a handful of layoff s, the bulk of state government job losses were through a ri on.
Losses are slowing, but recovery willdepend on a long-term budget solu on.

6 ALASKA ECONOMIC TRENDSJANUARY 2018
4 A , 2004 2017Oil Prices and Industry Jobs
Note: Average West Coast spot price per barrel of Alaska North Slope crude oilSource: Alaska Department of Labor and Workforce Development, Research and Analysis Sec on
$0
$20
$40
$60
$80
$100
$120
$140
$160
0
2,000
4,000
6,000
8,000
10,000
12,000
14,000
16,000Oi l industry employment
Price per barrel
Employment Oil price
2004 2005 2006 2007 2008 2009 2010 2011 2012 2013 2014 2015 2016 2017
Many workers who re red or otherwise le haven’t been replaced.
Con nued calls for reducing state government costs and the state’s larget budget defi cit will con nue to put downward pressure on job counts.
The second wave: Construc onand professional servicesThe second wave of job losses came from industries that depend heavily on the fi rst two giants. When
the oil and gas industry cut projects, construc on employment began to fall. Similarly, when the state capital budget dropped, the construc on industry absorbed much of the blow. Projects that were al-ready funded con nued, but the last couple of capi-tal budgets have been bare bones, which has meant less construc on work.
Construc on losses are forecasted to con nue in 2018, at 500 fewer jobs. While losses are tapering, that’s partly because the bulk of the losses have already happened. The construc on industry sus-tained a small decline in 2015 (-200) but was hit
with big losses in both 2016 (-1,400) and 2017 (-1,200). The state’s capital budget is down again in fi scal year 2018, and oil and gas-funded construc on projects are unlikely to increase this year.
Professional and business services, which is closely ed to construc on and to oil and gas, also suff ered from the lack of projects and is forecasted to lose 400 jobs this year (-1.4 percent) due to con nuing low demand for engineering, design, and accoun ng services. The job losses in 2018 will be milder than in pre-vious years, however.
While this industry’s employment began to fall in late 2015, the deepest plunge came in 2016 when it lost 1,600 jobs. In
3 P , 1970 2018 Alaska’s Employment Growth History
-10%
-5%
0
5%
10%
15%
20%
25%
30%
1970 1974 1978 1982 1986 1990 1994 1998 2002 2006 2010 2014 2018**
Oil bustState
recessionrecession
Note: 2017 is preliminary. **ForecastSource: Alaska Department of Labor and Workforce Development, Research and Analysis Sec on

7ALASKA ECONOMIC TRENDS JANUARY 2018
2017, ongoing downward pressure on projects fund-ed by oil and state government reduced demand for services again, leading to a smaller loss of 600 jobs.
The third wave: Industriesthat rely on people’s spendingSubstan al upstream losses eventually reached the industries that depend on local demand and expend-able income. Job loss in a local or state economy means less spending, which aff ects employers such as shopping centers, theaters, nonprofi ts that de-pend on dona ons, and bars and restaurants.
Retail trade, which lost 500 jobs in 2017 and 200 in 2016, is expected to lose another 200 jobs in 2018 as consumers spend more cau ously. Increased visi-tor spending over the last couple of years has off set some of that reduced local consump on. Areas such as Southeast are par cularly sensi ve to visitor traf-fi c and would have sustained deeper retail losses without strong tourism seasons.
The same factors that hurt retail have also weakened wholesale trade. The wholesale sector doesn’t re-quire as much labor as retail, though, and a er two years of small losses, it is forecasted to hold steady in 2018.
The informa on sector is forecasted to lose 100 jobs in 2018, fewer than in 2017 when it shed 300. This sector includes newspapers, movie theaters, radio and television broadcas ng, and cable and Internet
providers. In addi on to the recession dampening spending, this sector is feeling the squeeze of tech-nology-driven changes to how they provide services. Online streaming is cu ng into demand for cable television, newspapers are available online, and with online content frequently free, some companies face declining subscrip on and ad revenue.
The leisure and hospitality sector encompasses ac-
5 P , 2012 2018Jobs in Recession’s Most-Aff ected Private Industries
*Preliminary **ForecastSource: Alaska Department of Labor and Workforce Development, Research and Analysis Sec on
4.0% 3.1%5.2%
0.7%
-20.4%
-13.3%
-5.1%
4.9%
0.6%3.5%
-1.1%
-8.0% -7.4%
-3.3%
3.8%1.3%
-1.0%
0%
-5.3%
-2.1% -1.4%
2012 2013 2014 2015 2016 2017* 2018**
Oil and GasConstruc onProfessional and Business Services
-2
Con nued on page 22
About the dataJob numbers and growth rates for 2017 are not yet available on our Web site because when we created these forecasts, employment estimates were only avail-able for the fi rst eleven months of 2017.
Additionally, the statewide, Anchorage/Mat-Su, and Fairbanks job numbers on our site for 2017 are from the federal-state cooperative program Current Employment Statistics. CES numbers have been especially volatile in recent years, and they are eventually replaced with more comprehensive and reliable data that nearly all employers are required to submit under state unem-ployment insurance laws.
To give users better statewide job numbers in the in-terim, we have been producing estimates based on projections of those employer-provided job numbers (from the Quarterly Census of Employment and Wages program). We use those alternative job estimates in our monthly economic press release and direct our Web traffi c to those releases, although we also continue to provide the CES numbers online.

8 ALASKA ECONOMIC TRENDSJANUARY 2018
1 P , 2008 2018Anchorage Job Losses to Slow Down
*Preliminary **ForecastSource: Alaska Department of Labor and Workforce Development, Research and Analysis Sec on
1.3%
-0.5%
0.1%
1.8%
2.2%
0.1%
-0.3%
0.5%
-1.7%-1.4%
-0.7%
2008 2009 2010 2011 2012 2013 2015 2016 2017* 2018**2014
By NEAL FRIED
Anchorage lost about 5,000 jobs over the past two years, or 3.0 percent,
which pushed its total employ-ment down to 2011 levels. While more loss is in the forecast for 2018, it will likely be modest and the city could quit shedding jobs by the end of the year.
Growth in tourism, health care, and mining explora on plus minor or no addi onal job loss in the oil industry would be welcome news — but it will be a long road for An-chorage to regain its pre-recession employment levels. (See exhibits 1 and 2.)
Uncertainty is part of any forecast, and few things are as uncertain as oil prices. Over the next year, prices are predicted to remain low: in the $55 to $65 per barrel range.
The other ques on mark that weighs heavily on the Anchorage economy is Alaska’s persistent mul -billion dollar state government shor all. Un l this structural problem has a perma-nent solu on, it will con nue to cast a shadow.
Posi ve hints for oilAnchorage is state headquarters for the oil and construc on indus-tries, and Anchorage workers are by far the largest share of oil industry workers on the North Slope.
Employment at Prudhoe Bay peaked at 13,845 in March 2015, but by September 2017 it had fallen by 4,600 and hit a 10-year low.
A er two years of big job losses, several mi ga ng factors suggest oil and gas jobs based in Anchorage
will level out in 2018. Na onally, oil industry em-ployment began to recover in late 2016. Another fa-vorable development is oil prices, which have inched up past the $60 dollar mark, which will help stabilize the industry. More explora on and maintenance are on the horizon for the North Slope this year, and oil produc on has increased for two years in a row and is forecasted to increase again in 2018. The recent
discoveries by Caelus Energy Alaska and Armstrong Oil and Gas Company are also possible game changers, each with the longer-term poten al to add hundreds of thousands of barrels daily to exis ng produc on.
Construc on loses steamThe construc on industry in Anchorage lost 400 jobs in 2017 and is forecasted to lose 300 more in 2018. The state’s capital budget peaked at $3.7 billion in 2013 and most of those legacy dollars have worked their way through the system. (See Exhibit 3.) Con-struc on projects for schools, the university, and state government will be sparse.
Commercial building also appears scarce. No new
Anchorage job losses to taper further in 2018

9ALASKA ECONOMIC TRENDS JANUARY 2018
2 W , 2016 2018Anchorage Job Forecast by Industry
2016MonthlyAverage
2017Monthly
Average1Chg 2016
to 2017
PercentChg 2016
to 2017
2018
MonthlyAverage
Chg 2017
to 2018
PercentChg 2017
to 2018Total Nonfarm Employment2 155,000 152,800 -2,200 -1.4% 151,800 -1,000 -0.7%Natural Resources and Mining 3,000 2,700 -300 -10.0% 2,700 0 0% Oil and Gas 2,900 2,600 -300 -10.3% 2,600 0 0%Construction 7,500 7,100 -400 -5.3% 6,800 -300 -4.4%Manufacturing 2,000 2,000 0 0% 2,000 0 0%Wholesale Trade 4,800 4,700 -100 -2.1% 4,700 0 0%Retail Trade 17,900 17,600 -300 -1.7% 17,300 -300 -1.7%Transportation, Warehousing, and Utilities 11,000 11,000 0 0% 11,000 0 0%Information 4,000 3,700 -300 -7.5% 3,700 0 0%Financial Activities 7,500 7,400 -100 -1.3% 7,400 0 0%Professional and Business Services 18,900 18,300 -600 -3.2% 18,000 -300 -1.7%Educational3 and Health Services 26,200 26,600 400 1.5% 27,100 500 1.8% Health Care 20,000 20,800 800 4.0% 21,400 600 2.8%Leisure and Hospitality 17,400 17,300 -100 -0.6% 17,100 -200 -1.2%Other Services 5,700 5,700 0 0% 5,700 0 0%Government 29,100 28,700 -400 -1.4% 28,300 -400 -1.4% Federal4 8,600 8,500 -100 -1.2% 8,300 -200 -2.4% State5 10,200 10,000 -200 -2.0% 9,900 -100 -1.0% Local6 10,300 10,200 -100 -1.0% 10,100 -100 -1.0%
1Preliminary and adjusted es mates2Excludes self-employed workers, fi shermen, domes c workers, and unpaid family workers3Private educa on only4Excludes uniformed military5Includes the University of Alaska6Includes public schools and tribal government
Source: Alaska Department of Labor and Workforce Development, Research and Analysis Sec on
large offi ce or retail buildings are planned for this year and vacancy rates are climbing. A likely excep- on is hotel construc on. One project broke ground
in 2017 and preliminary groundwork is complete for two others, with construc on likely this year.
The outlook for residen al housing is more posi ve, with 453 new units permi ed during the fi rst 11 months of 2017 (mostly mul -family), compared to just 331 for the same period the year before. More growth is likely in 2018, although permi ng will s ll be low by historical standards.
The outlook is also posi ve for highway and airport related construc on, which are largely federally funded. Local contractors will eventually benefi t from the half-billion dollars in con-struc on ed to the upcoming arrival of two F-35s at Eielson Air Force Base near Fairbanks.
Professional service losses slowThe past two years have been a nightmare for pro-fessional and business services in Anchorage, which lost 2,000 jobs — the biggest hit among industries over the last two years.
Anchorage is state headquarters for pro-fessional and business services, which took a secondary blow from the oil and construc on losses and the near-evapora- on of mining explora on. The hardest-hit
category was architectural, engineering, environmental, and other consul ng ser-vices, which represents nearly half of the sector.
Losses are forecasted to slow in 2018 as commod-ity prices rebound, mining picks up, and oil ac vity stabilizes. Less construc on will be the industry’s weakest link in 2018. Like the economy as a whole, the part of the industry ed to legal, accoun ng,
While Anchorage could stop losing jobs by year’s end, regaining them will be a long road.

10 ALASKA ECONOMIC TRENDSJANUARY 2018
3 S , 2009 2018
Dwindling Capital Budgets
Source: Alaska Division of Legisla ve Finance
$2.9 bil
$2.1 bil $2.1 bil
$2.9 bil
$3.7 bil
$2.1 bil $2.2 bil
$1.5 bil $1.6 bil$1.4 bil
2009 2010 2011 2012 2013 2014 2015 2016 2017 2018
75% of 2013 capital
17% of 2018 capital
computer, and other professional services will likely remain stable.
Strong U.S. economy boosts tourism Demand in Anchorage’s leisure and hospitality sec-tor — which includes accommoda ons, food servic-es, arts, entertainment, and recrea on — depends on both local consump on and, to a lesser degree, tourism.
Weaker local demand led to slight job loss in 2017, made up of minor gains in accommoda ons and small losses in food services. The forecast for 2018 is similar, with local demand remaining weak and stronger visitor demand giving the industry a boost.
Employment in food services and drinking places, which represents two-thirds of the industry, is fore-casted to con nue to lose ground in 2018 and drive overall loss. A down market doesn’t mean no new establishments will open, though, as restaurants and bars are always coming and going. A new Starbucks, a Dave and Busters, and a third Fire Island Bakery will open in 2018, with addi onal newcomers likely.
The outlook for the visitor side of the industry is mostly posi ve. The state recession has taken its toll on corporate, government, and group travel, but the slice ed to tourism has been strong and is expected to be even be er this year.
Bed taxes collected for the fi rst three quarters of 2017 were up 3 percent, and this is a conserva ve number because Airbnb didn’t begin paying bed taxes in Anchorage un l August. And as men oned above, at least one new hotel will open this year and construc on will begin on at least two others.
Finally, the na onal economy is strong and growing, which will generate more conven on and visitor traf-fi c. The industry projects an increase in cruise ship passengers in Southcentral and an increase in all visi-tor traffi c in 2018.
Finance sector remarkably stableA big driver in the fi nancial sector is real estate and all the businesses connected to it, including mort-gage and tle companies, banks and credit unions, and insurance and property management.
Alaskans have paid close a en on to banking and
housing in the current recession because of the devasta on these sustained in the 1980s recession. Many economic observers expected real estate to crash again, but that hasn’t happened.
Home sales were down just slightly through Sep-tember 2017 to 2,839, compared to 2,905 in the fi rst nine months of 2016. Prices were largely un-changed and inventory declined somewhat. Foreclo-sures haven’t increased, either.
Anchorage rental vacancies increased from 3.8 percent in 2016 to 5.1 percent in 2017, a trend that’s expected to con nue as the city adds modest amounts of new housing while its popula on level changes li le.
Low interest rates remain a big plus for most of this industry — something to watch as they inch up.
Health care keeps growingFor decades, health care has usually generated the largest number of new jobs in Anchorage, including in 2017. Some of the 800 jobs the industry added last year were due to Medicaid expansion. Without that boost in 2018, health care is forecasted to grow, but more modestly.
The larger educa onal and health services cat-egory will grow more slowly than health care alone because it includes private social assistance, whose employment fell 11 percent in 2017. Social assis-tance represents many of Anchorage’s nonprofi t

11ALASKA ECONOMIC TRENDS JANUARY 2018
social service providers. Due to ght state funding and fewer dona ons, its 2018 outlook is so .
The perfect storm for retailAnchorage retail employment didn’t grow much over the past decade, and retail lost 600 jobs over the last two years. Given the nega ve environment, it’s sur-prising losses weren’t larger.
Retail has declined during the current recession due to less money fl owing through the economy and lower consumer confi dence. Retail is also fi gh ng an epic ba le with the Amazons of the world, both in Anchorage and na onwide. It’s impossible to know which of these downward forces plays the biggest role in local retail losses, but it’s certain that both will carry into 2018.
Marijuana dispensaries have been a minor boost for retail. By fall 2017, 14 new marijuana retailers had opened in Anchorage, with more planned in 2018.
No big changes for governmentAnchorage’s federal employment levels are forecast-ed to erode again in 2018. The Trump administra on has announced signifi cant cuts to a number of civil-ian agencies, including the Department of Interior, the state’s second largest federal employer. Planned
increases for the Veterans Administra on will off set some of those losses. Civilian employment in the military (which represents just shy of a third of civil-ian federal employment) is expected to hold steady, and so is the uniformed military.
State government employment began to drop in 2015. State government includes the University of Alaska Anchorage, and nearly a quarter of state gov-ernment employment in Anchorage is ed to UAA. By 2017, state government had lost 800 jobs, or 7 per-cent. For 2018, modest losses are forecasted across all of Anchorage’s state government.
Local government, which includes tribal government and public schools, added jobs early in 2017 and then lost some to end the year nearly even. The An-chorage School District represents nearly 72 percent of local government and the rest is the Municipality of Anchorage.
Local government employment is forecasted to de-crease slightly in 2018. Much of the municipality’s 2017 increase came from the large recruitment of new police offi cers early in the year, which is now complete. School district employment is forecasted to remain stable or dip slightly with this year’s small enrollment decline.
Neal Fried is an economist in Anchorage. Reach him at (907) 269-4861 or [email protected].

12 ALASKA ECONOMIC TRENDSJANUARY 2018
1 P , 2008 2018Modest Growth in Fairbanks Jobs
*Preliminary **ForecastSource: Alaska Department of Labor and Workforce Development, Research and Analysis Sec on
By NEAL FRIEDand ALYSSA RODRIGUES
Fairbanks to gain jobs through construction
0.5%
-0.8%
2.1%
0.5%
1.3%
-1.8%
-1.0%
0%
-1.6%
-0.9%
0.8%
2008 2009 2010 2011 2012 2013 2014 2015 2016 2017* 2018**
The Fairbanks North Star Borough has lost jobs nearly every year since total employment peaked in
2012. Job counts in 2017 were the lowest they’ve been since 2005.
Fairbanks’ eco-nomic picture is expected to improve in 2018, though, with a big jump in mili-tary construc on boos ng the overall forecast to 0.8 percent job growth. (See exhibits 1 and 2.)
Construc on lossesturn to major gainsFairbanks’ construc on industry con- nued to lose ground in 2017 with
diminished state capital budgets and a lack of commercial or residen al building. Job losses in the oil and gas industry on the North Slope also hit local contractors. Road construc on was a small source of growth last year and so was military construc on, but neither were enough to overcome other construc on losses.
These losses are expected to end in 2018 as large construc on projects related to the new F-35s planned for Eielson Air Force Base gain momentum over the next three to four years. Construc on em-ployment is forecasted to grow by a whopping 7.7 percent this year.
Prepara on for the 2020-2021 arrival of the two squadrons of F-35s is the biggest known posi ve economic development for Fairbanks and Alaska overall in 2018. Preparing for the planes’ arrival will require more than $500 million, almost en rely for
construc on. Some of that work began in 2017 a er the award of more than $100 million in projects, and the balance will be awarded in 2018 and 2019
with the biggest push coming this summer.
The Fairbanks area will need to ac-commodate about 2,800 more people over the next few years as a result, so construc on of new housing is also on the horizon.
Military a big infl uence
The Fairbanks North Star Borough has the highest concentra on of ac ve duty military personnel in the state. More than 8 percent of borough residents are ac ve duty and another 10 percent are military dependents.
The employment numbers in this forecast don’t in-clude ac ve duty military jobs, but for perspec ve, the borough had 8,421 uniformed military person-nel in 2016.
Fairbanks’ military presence declined from 2012 un-
Military-related construc on will put Fairbanks em-ployment growth back in the black.

13ALASKA ECONOMIC TRENDS JANUARY 2018
2 W , 2016 2018Fairbanks Job Forecast by Industry
2016MonthlyAverage
2017Monthly
Average1Chg 2016
to 2017
PercentChg 2016
to 2017
2018
MonthlyAverage
Chg 2017
to 2018
PercentChg 2017
to 2018Total Nonfarm Wage and Salary2 37,750 37,400 -350 -0.9% 37,700 300 0.8%Goods-Producing3 4,300 3,900 -400 -9.3% 4,200 300 7.7%Service-Providing4 33,450 33,500 50 0.1% 33,500 0 0%Construction 2,900 2,600 -300 -10.3% 2,800 200 7.7%Trade, Transportation, and Utilities 7,800 7,800 0 0% 7,800 0 0% Retail Trade 4,800 4,800 0 0% 4,800 0 0% Transportation, Warehousing, and Utilities 2,400 2,400 0 0% 2,400 0 0%Information 500 400 -100 -20.0% 400 0 0%Financial Activities 1,350 1,300 -50 -3.7% 1,300 0 0%Professional and Business Services 2,200 2,400 200 9.1% 2,500 100 4.2%Educational5 and Health Services 5,400 5,500 100 1.9% 5,500 0 0% Health Care 4,000 4,100 100 2.5% 4,100 0 0% Social Services 1,200 1,200 0 0% 1,150 -50 -4.2%Leisure and Hospitality 4,300 4,400 100 2.3% 4,400 0 0%Other Services 1,000 1,000 0 0% 1,000 0 0%Government 10,900 10,700 -200 -1.8% 10,600 -100 -0.9% Federal6 3,000 3,000 0 0% 3,000 0 0% State7 4,900 4,700 -200 -4.1% 4,600 -100 -2.1% Local8 3,000 3,000 0 0% 3,000 0 0%
1Preliminary and adjusted es mates2Excludes self-employed workers, fi shermen, domes c workers, and unpaid family workers3Includes natural resources and mining, construc on, and manufacturing4Includes all others not listed as goods-producing5Private educa on only6Excludes uniformed military7Includes the University of Alaska8Includes public school systems and tribal government
Source: Alaska Department of Labor and Workforce Development, Research and Analysis Sec on
l 2017, when it grew slightly. The military popula- on will increase drama cally with the arrival of the
F-35s, although not this year. An addi onal 2,765 service members, civilian workers, and their fami-lies will arrive in late 2019 and 2020.
Professional business servicesbucks the statewide trendUnlike the rest of the state, Fairbanks’ professional and business services sector — which consists of management and administra ve companies and those in scien fi c tes ng, architecture, and engi-neering — escaped the eff ects of the oil and con-struc on declines.
Although professional and business services lost ground in earlier years, it grew in the last two and is forecasted to grow again this year. The diver-gence is likely due in part to an cipa on of the ma-
jor ramp-up in construc on.
Health care to take a ‘breather’Health care has been a dynamic industry in Fair-banks for the last decade. The industry added jobs in most years, including 2017, although the gain last year slowed to 100 jobs.
In the long term, aging of the state’s popula on will con nue to drive growth, although at a moderate pace. The forecast for 2018 is fl at, refl ec ng a one-year “breather” for expansion as major players plan for the future and make decisions about hospital ownership.
Retail to hold steady again this yearA er losing a small number of jobs in 2016, Fair-banks’ retail industry stabilized in 2017 and is set

14 ALASKA ECONOMIC TRENDSJANUARY 2018
3 F , 2010 2016Military Popula on
Note: Ac ve duty plus dependentsSource: Alaska Department of Labor and Workforce Develop-ment, Research and Analysis Sec on
19,90018,224
22,29619,995 19,521
18,314 18,354
2010 2011 2012 2013 2014 2015 2016
to repeat that performance this year. Although the overall economy isn’t likely to shrink and ac vity will increase on local military bases, no known siz-able retailers will open in the borough in 2018, pro-ducing a fl at job forecast.
Stability for the fi nancial sector The fi nancial ac vi es sector, which includes banks, credit unions, insurance agencies, and real estate ren ng and leasing companies, lost 50 jobs in 2017 and is expected to stabilize in 2018.
Real estate sales have increased, defying expec-ta ons — 967 homes sold during the fi rst nine months of 2017 compared to 911 in the same peri-od of 2016. Total value climbed by $25 million and the average home sales price also increased.
Sales inventory increased somewhat in 2017 and so did vacancies, but bank loan and deposits showed li le change and interest rates remain low. The an- cipa on of more military homebuyers will likely
push home prices up in 2018 as well.
Strong tourism seasonto boost leisure and hospitalityThe leisure and hospitality sector makes up about 12 percent of Fairbanks’ employment. Residents and visitors alike patronize restaurants, bars, and movie theaters, and this industry has hummed along since 2009. Over half its employment is ed to ea ng and drinking and the next-largest share is in accommoda ons, which shows locals and tour-ists are both heavy infl uences.
Bed taxes collected during the fi rst eight months of 2017 were down 2 percent from the same period in 2016, but airplane passengers increased. With more an cipated visitors and military-related job growth in 2018, this industry is forecasted to hold steady in 2018.
University con nues to lose groundSome of the borough’s largest employment losses in 2017 were from the University of Alaska Fair-banks. UAF has lost more than 500 jobs since its peak employment in 2013 and will con nue to cut jobs in 2018 as the state budget gap remains an issue. UAF also faces rising fi xed opera ng costs, including u li es, fuel, health care benefi ts, and necessary building maintenance.
Local government in Fairbanks includes public schools, police and fi re departments, and execu ve and legisla ve offi ces. Seventy percent of employ-ment is in public schools, so stable or growing en-rollment will keep local government stable in 2018.
The borough had about 3,000 federal civilian jobs in 2017, unchanged from 2016 and forecasted to hold steady again in 2018. This fl at forecast factors in a mix of possible budget cuts on the civilian fed-eral side and increases on the civilian military side.
Neal Fried is an economist in Anchorage. Reach him at (907) 269-4861 or [email protected]. Alyssa Rodrigues is a former Labor economist in Anchorage.

15ALASKA ECONOMIC TRENDS JANUARY 2018
By KARINNE WIEBOLD 1 P , 2008 2018Slightly Smaller Loss For Southeast
*Preliminary **ForecastSource: Alaska Department of Labor and Workforce Development, Research and Analy-sis Sec on
-0.3%
-2.0%
0.3%
1.1%
1.9%
-0.3%-0.4%
-0.1%
-1.8%
-0.7%-0.6%
2008 2009 2010 2011 2012 2013 2014 2015 2016 2017* 2018**
Southeast loss forecasted at 0.6 percent
Southeast Alaska’s employ-ment is forecasted to decline slightly less in 2018 than it did
in 2017. This year’s forecasted loss is 200 jobs, or 0.6 percent, which is on par with the statewide outlook for 2018. Southeast lost 250 jobs in 2017.
The region underperformed the state as a whole over most of the last decade. Southeast lost a greater share of its jobs in 2009 — the only year Alaska lost jobs during the na onal recession — and regained fewer in the years that followed. (See Exhibit 1.)
Southeast began to lose jobs with the rest of the state in 2015, when oil revenue’s quick decline spurred state govern-ment job loss and steep cuts to the capital bud-get caused construc on losses shortly therea er. Other sectors of the region’s economy, such as retail, are now feeling the eff ects of the early job losses. (See Exhibit 2.)
Weakness in state government af-fects Southeast more than the rest of the state, but the region has almost none of the oil and gas employment that has been Alaska’s biggest source of loss. Southeast also has more of a buff er through tourism than other regions, which will further temper its losses.
Net migra on, older popula ondrive popula on losses Like the state as a whole, more people le Southeast than moved in between 2015 and 2016. This marked
the fourth year of net migra on losses for both, but while the state s ll gained overall popula on through natural increase (births minus deaths), that wasn’t large enough in Southeast to off set net migra on losses. Southeast lost total popula on in both 2015 and 2016 — the only years of overall loss since 2007, when the region’s net migra on bo omed out at -1,697.
Southeast lost more than 800 people to net migra on in 2016, and while natural increase off set some of that loss, these components of change aff ect diff erent
parts of the popula on. Net migra on losses mean fewer workers and less local spending because households that move tend to have at least one working-age adult, while births and deaths are con-centrated at age extremes.
Net migra on losses are likely to con n-ue statewide with the current recession,
par cularly because the Lower 48’s economy is rela- vely healthy and the U.S. unemployment rate is at its
lowest level since late 2000.
The region is also older than the state overall. South-east’s largest age group is between 55 and 59, and the next-largest age groups are those that bracket it:
Tourism is big in Southeast, and it has provided a buff er against deeper job losses.

16 ALASKA ECONOMIC TRENDSJANUARY 2018
2 W , 2016 2018Southeast Job Forecast by Industry
2016MonthlyAverage
2017Monthly
Average1Chg 2016
to 2017
PercentChg 2016
to 2017
2018
MonthlyAverage
Chg 2017
to 2018
PercentChg 2017
to 2018Total Nonfarm Employment2 36,350 36,100 -250 -0.7% 35,900 -200 -0.6%Total Private Sector 23,850 23,700 -150 -0.6% 23,600 -100 -0.4%Natural Resources and Mining 950 950 0 0% 950 0 0%Construction 1,450 1,400 -50 -3.4% 1,350 -50 -3.6%Manufacturing 1,950 2,000 50 2.6% 1,950 -50 -2.5%Trade, Transportation, and Utilities 7,150 7,050 -100 -1.4% 7,000 -50 -0.7%Information 550 500 -50 -9.1% 500 0 0%Financial Activities 1,050 1,000 -50 -4.8% 1,000 0 0%Professional and Business Services 1,650 1,650 0 0% 1,650 0 0%Educational3 and Health Services 3,850 4,000 150 3.9% 4,050 50 1.3%Leisure and Hospitality 4,200 4,100 -100 -2.4% 4,100 0 0%Other Services 1,050 1,050 0 0% 1,050 0 0%Total Government 12,500 12,400 -100 -0.8% 12,300 -100 -0.8% Federal4 1,450 1,450 0 0% 1,450 0 0% State5 4,950 4,800 -150 -3.0% 4,700 -100 -2.1% Local6 6,100 6,150 50 0.8% 6,150 0 0%
1Preliminary and adjusted es mates2Excludes self-employed workers, fi shermen, domes c workers, and unpaid family workers3Private educa on only4Excludes uniformed military5Includes the University of Alaska6Includes public schools and tribal government
Source: Alaska Department of Labor and Workforce Development, Research and Analysis Sec on
50 to 54 and 60 to 64. Many baby boomers arrived when Alaska was awash in oil money during the late 1970s and early 1980s, and they will con nue to age out of the workforce in the near future.
Most job loss will be in government Southeast lost more than 700 state government jobs between 2014 and 2017 and is forecasted to lose an-other 100 jobs in 2018. (See Exhibit 3.)
Cuts will likely slow in 2018 because savings opportu-ni es will be harder to fi nd a er three years of cuts. While layoff s remain possible, most state government losses will con nue to come from a ri on in 2018. Baby boomers are s ll reaching re rement age, and many of their posi ons will be eliminated or le va-cant.
Federal government employment has been fl at for the past few years, and that trend is forecasted to con nue in 2018.
Local government in Southeast, which includes tribal government, added 50 jobs in 2017 despite steep declines in state funding, and its employment is fore-
casted to remain at that level in 2018.
Fish harvest lower than last yearCommercial fi shing is a signifi cant part of Southeast’s economy, but seafood harves ng jobs aren’t part of this forecast because harvesters are considered self-employed. S ll, harvests drive seafood processing employment, which is the bulk of the area’s manufac-turing industry.
Pink salmon make up most of Southeast’s commercial salmon harvest. Last year’s run came in lower than expected but s ll higher than the year before, and manufacturing added 50 jobs in 2017.
According to the Alaska Department of Fish and Game, even years tend to have smaller runs, and the 2018 pink forecast is about two-thirds of 2017’s catch. As a result, manufacturing is expected to lose 50 jobs in 2018.
Construc on to con nue declineThe next state capital budget will go into eff ect July 1, and while that budget won’t be fi nal for a while,

17ALASKA ECONOMIC TRENDS JANUARY 2018
another low year is all but certain. The Southeast con-struc on industry hasn’t yet sustained the full impact of the budget cuts because past funding from larger budgets has carried over, but that pool is diminishing.
Although legacy projects are wrapping up, a hand-ful of projects funded by the 2018 capital budget will boost job counts, including $4 million in improve-ments to the Alaska Permanent Fund headquarters in Juneau, $2.5 million for Hoonah cruise ship docks, and $2 million for Ketchikan’s cruise ship berths.
Federal transporta on funding will remain strong, with three years remaining of the generous Fixing America’s Surface Transporta on Act. Federal funding won’t be enough to counter minimal state funding, though, so the industry is forecasted to lose 50 jobs in 2018.
Tourism will boost some industriesThough decreased economic ac vity puts a dent in locals’ spending in Southeast, summer tourism will remain strong as long as U.S. and interna onal econo-mies are growing.
Southeast had more than a million cruise ship visi-tors in 2017, and 2018 is an cipated to be even bet-ter. Tourism is bigger in Southeast than the state as a whole, and it will shield restaurants and stores from the drop in business an cipated elsewhere.
Employment in the trade, transporta on, and u li es sector, which depends on tourism as well as local con-sump on, declined by 100 in 2017 and is forecasted
to decrease by another 50 this year. While a strong tourism season will boost retail and transporta on employers, declining local incomes will reduce de-mand during the rest of the year and off set visitor-related gains.
Leisure and hospitality, which is heavily tourism-based in Southeast, is forecasted to hold steady in 2018 a er losing 100 jobs last year. While restaurants and bars will perform worse in the off -season due to less local spending, visitor spending on everything from tours to hotels will probably be enough to keep the industry stable.
Other private industriesThe educa on and health services sector includes private health care and social assistance as well as private educa on, although Southeast has li le of the la er.
Private health care in Southeast has historically un-derperformed the state as a whole, partly due to the region’s recent economic woes, but it grew in 2017 and is likely to grow again in 2018. Growth is also likely in the long term, mostly to serve the region’s aging popula on.
Southeast mining employment is forecasted to hold steady through exis ng mines and contractors. Explo-ra on employment is minimal, and no poten al sites are expected to open in the near future.
Karinne Wiebold is an economist in Juneau. Reach her at (907) 465-6039 or [email protected].
3 S , 2008 2018Breakdown of Government Job Losses
Source: Alaska Department of Labor and Workforce Development, Research and Analysis Sec on
-500
-400
-300
-200
-100
0
100
200
300
2008 2009 2010 2011 2012 2013 2014 2015 2016 2017 2018
State Local Federal Total

18 ALASKA ECONOMIC TRENDSJANUARY 2018
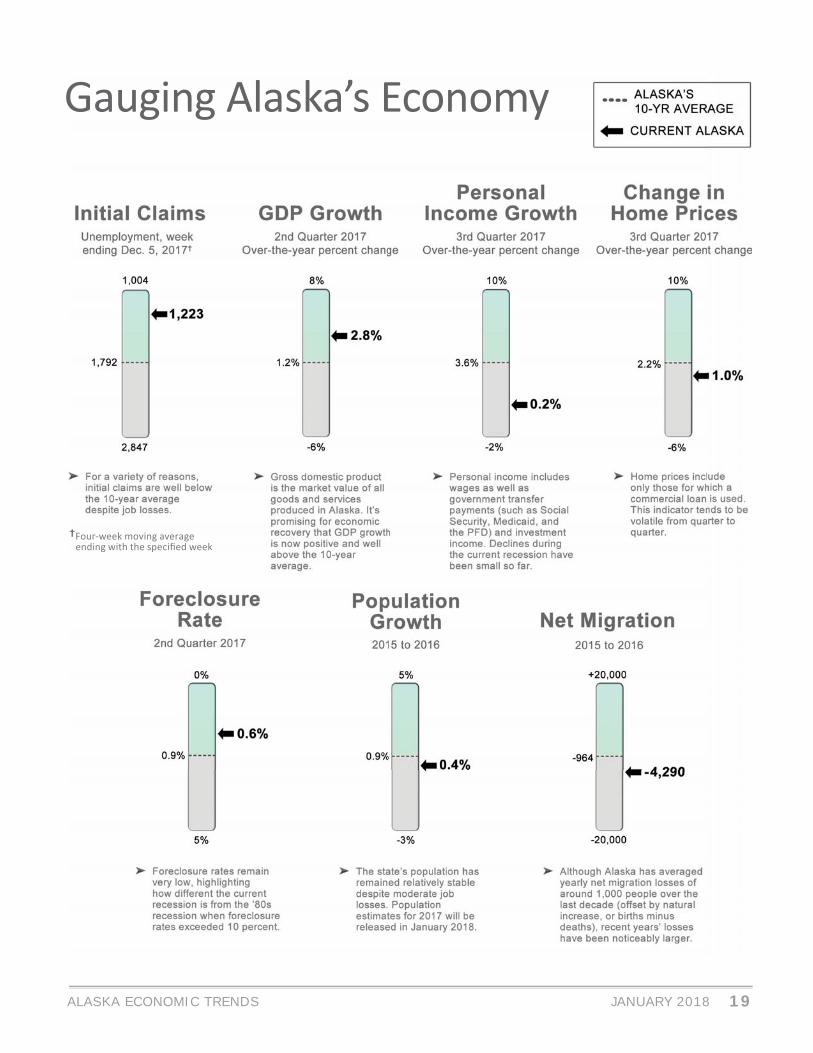
Gauging Alaska’s Economy
19ALASKA ECONOMIC TRENDS JANUARY 2018
Four-week moving average ending with the specifi ed week
Gauging Alaska’s Economy

20 ALASKA ECONOMIC TRENDSJANUARY 2018
Seasonally adjusted
Prelim. Revised11/17 10/17 11/16
Interior Region 7.3 6.6 6.5 Denali Borough 20.2 10.3 18.8 Fairbanks N Star Borough 6.3 5.9 5.6 Southeast Fairbanks Census Area
11.0 9.5 9.5
Yukon-Koyukuk Census Area
17.5 15.8 15.8
Northern Region 11.1 11.1 10.6 Nome Census Area 11.9 11.1 11.7 North Slope Borough 6.9 7.5 6.5 Northwest Arc c Borough 15.5 15.7 15.2
Anchorage/Mat-Su Region 6.3 6.1 5.7 Anchorage, Municipality 5.8 5.6 5.1 Mat-Su Borough 8.4 7.8 7.7
Prelim. Revised11/17 10/17 11/16
Southeast Region 6.9 6.2 6.2 Haines Borough 12.7 9.3 10.2 Hoonah-Angoon Census Area
16.6 12.5 14.1
Juneau, City and Borough 4.9 4.7 4.4 Ketchikan Gateway Borough
7.0 6.2 6.3
Petersburg Borough 9.1 8.0 8.6 Prince of Wales-Hyder Census Area
11.7 10.8 10.7
Sitka, City and Borough 4.7 4.8 4.1 Skagway, Municipality 20.5 14.5 17.3 Wrangell, City and Borough 8.6 7.3 7.8 Yakutat, City and Borough 11.4 10.0 9.1
Prelim. Revised11/17 10/17 9/16
United States 4.1 4.1 4.6Alaska 7.2 7.2 6.6
Prelim. Revised11/17 10/17 11/16
Southwest Region 11.5 10.5 10.5 Aleu ans East Borough 4.3 2.6 4.3 Aleu ans West Census Area
4.4 4.6 4.4
Bethel Census Area 13.0 12.8 12.1 Bristol Bay Borough 11.5 11.1 12.7 Dillingham Census Area 10.4 10.1 9.8 Kusilvak Census Area 19.5 19.3 16.6 Lake and Peninsula Borough
15.1 12.9 12.6
Gulf Coast Region 8.2 7.4 7.6 Kenai Peninsula Borough 8.7 7.9 8.1 Kodiak Island Borough 4.8 4.8 4.9 Valdez-Cordova Census Area
9.5 8.2 9.1
Prelim. Revised11/17 10/17 11/16
United States 3.9 3.9 4.4Alaska 7.1 6.7 6.4
Regional, not seasonally adjusted
Not seasonally adjustedUnemployment Rates
Northern Region
Anchorage/Mat-SuRegion
Bristol Bay
InteriorRegion
Kodiak Island
KenaiPeninsula
Matanuska-Susitna
Anchorage
Valdez-Cordova
SoutheastFairbanksDenali
FairbanksYukon-Koyukuk
North Slope
NorthwestArctic
Nome
Kusilvak
Bethel
Dillingham
AleutiansEast
AleutiansWest
Lake &Peninsula
SouthwestRegion Gulf Coast
Region
Yakutat
Sitka
Hoonah-
Prince of Wales-Hyder
Haines Skagway
Juneau
Ketchikan
Petersburg
Wrangell
SoutheastRegion
-4.1%
-0.3%0%
0%
-0.7%
-1.0%Anchorage/
Mat-Su
-0.9%Statewide
Percent change in jobsNovember 2016to November 2017
Employment by Region
21ALASKA ECONOMIC TRENDS JANUARY 2018
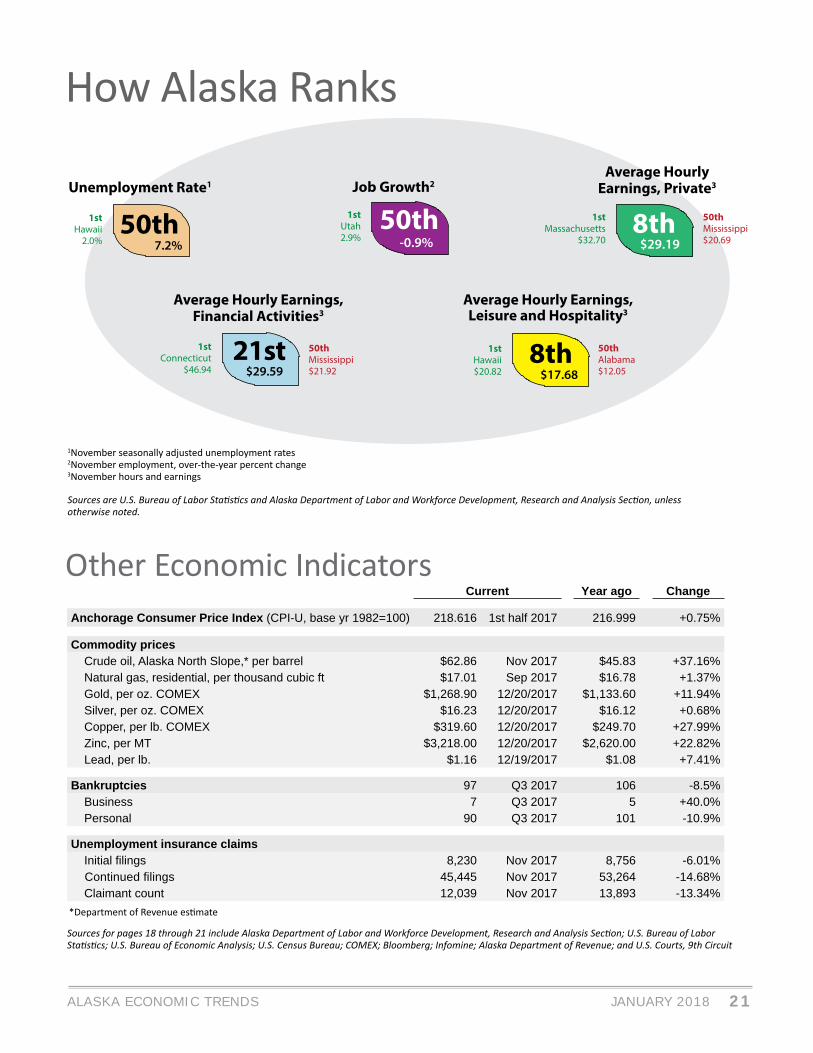
1November seasonally adjusted unemployment rates2November employment, over-the-year percent change3November hours and earnings
Sources are U.S. Bureau of Labor Sta s cs and Alaska Department of Labor and Workforce Development, Research and Analysis Sec on, unlessotherwise noted.
Current Year ago Change
Anchorage Consumer Price Index (CPI-U, base yr 1982=100) 218.616 1st half 2017 216.999 +0.75%
Commodity prices Crude oil, Alaska North Slope,* per barrel $62.86 Nov 2017 $45.83 +37.16% Natural gas, residential, per thousand cubic ft $17.01 Sep 2017 $16.78 +1.37% Gold, per oz. COMEX $1,268.90 12/20/2017 $1,133.60 +11.94% Silver, per oz. COMEX $16.23 12/20/2017 $16.12 +0.68% Copper, per lb. COMEX $319.60 12/20/2017 $249.70 +27.99% Zinc, per MT $3,218.00 12/20/2017 $2,620.00 +22.82% Lead, per lb. $1.16 12/19/2017 $1.08 +7.41%
Bankruptcies 97 Q3 2017 106 -8.5% Business 7 Q3 2017 5 +40.0% Personal 90 Q3 2017 101 -10.9%
Unemployment insurance claims Initial fi lings 8,230 Nov 2017 8,756 -6.01% Continued fi lings 45,445 Nov 2017 53,264 -14.68% Claimant count 12,039 Nov 2017 13,893 -13.34%
Other Economic Indicators
*Department of Revenue es mate
Sources for pages 18 through 21 include Alaska Department of Labor and Workforce Development, Research and Analysis Sec on; U.S. Bureau of Labor Sta s cs; U.S. Bureau of Economic Analysis; U.S. Census Bureau; COMEX; Bloomberg; Infomine; Alaska Department of Revenue; and U.S. Courts, 9th Circuit
How Alaska Ranks
50th1stHawaii
2.0%
Unemployment Rate1
7.2%8th$29.19
50thJob Growth2
-0.9%
1stUtah2.9%
Average HourlyEarnings, Private3
21st1stConnecticut
$46.94
Average Hourly Earnings,Financial Activities3
$29.59
1stMassachusetts
$32.70
8th1stHawaii$20.82
Average Hourly Earnings,Leisure and Hospitality3
$17.68
50thAlabama$12.05
50thMississippi$21.92
50thMississippi$20.69

22 ALASKA ECONOMIC TRENDSJANUARY 2018
STATEWIDEContinued from page 7
commoda on and food services as well as arts, entertainment, and recrea on. Demand for these services comes from both locals and visitors. Visitor spending has mostly buoyed this sector, and it grew slightly in 2016 and then held steady in 2017. A mi-nor loss of 100 jobs is forecasted for this year.
The unaff ected industriesSome industries have remained rela vely unscathed by the state recession so far.
Manufacturing employment in Alaska is about 70 per-cent seafood processing, with the balance in brewer-ies, bakeries, and manufacturers of wood products, boats, printers, cement makers, and petroleum and coal products. While some of these rely on local de-mand, outside forces such as commodity prices and na onal or interna onal demand are larger industry drivers. Seafood processing depends on the size of yearly catches and seafood prices, and almost all of the fi nal products are exported.
Health care growth has been robust for the last three decades and stronger than expected in recent years due to the increased health care needs of the state’s aging popula on, Medicaid expansion, and broader health insurance coverage. Health care employment increased by 2,900 from 2015 through 2017 and the industry is forecasted to add an addi onal 700 jobs in 2018.
With increased coverage comes increased demand for and access to medical services. Medicaid and the Children’s Health Insurance Program, or CHIP, have expanded coverage by 60 percent under the Aff ordable Care Act, providing insurance for an ad-di onal 73,600 Alaskans, according to the Henry J.
Kaiser Family Founda on.
The fi nancial sector, which was decimated during the 1980s recession, has remained stable during the cur-rent contrac on. In the 1980s, an overheated housing market and the resul ng foreclosures hit the fi nancial sector hard — but foreclosures have remained at historic lows. Employment has been stable for three years and is expected to con nue that trend in 2018.
Local government employment, which includes tribal government and public schools, has grown by small amounts throughout the recession. Its funding comes from a variety of sources including property taxes, sales taxes, and state and federal appropria ons. Al-though local government grew by 300 jobs in 2017, state fi nancial constraints will likely lead to the loss of about 100 jobs in 2018.
Federal government, the smallest piece of Alaska’s government sector, shed 100 jobs in 2017 a er gain-ing 300 the year before. Federal employment is forecasted to remain fl at in 2018, as no indicators of change are on the horizon and the next federal bud-get is uncertain.
The big challenge this yearWhile job losses will almost certainly con nue in 2018, some industries that have been losing jobs ap-pear set to resume adding them later in the year.
Alaska has been able to absorb some of the ini al blow of low oil prices by spending from its savings, but that’s a short-term solu on. A longer-term fi x that will balance the state’s spending with revenues is s ll pending, and that creates uncertainty and hin-ders growth.
Karinne Wiebold is an economist in Juneau. Reach her at (907) 465-6039 or [email protected].

23ALASKA ECONOMIC TRENDS JANUARY 2018
EMPLOYERSLet excellent employees!
TO OBTAIN MORE INFORMATION:
Business Employment Services Team (BEST)
EMPLOYMENT FIRST JOB FAIR
10 a.m.-2 p.m.
REGISTER ONLINE:
eventbrite.com
Alaska is an Employment First


